carbon trust – homeworking report
TRANSCRIPT

Homeworking reportAn assessment of the impact of teleworking on carbon savings and the longer-term effects on infrastructure services
June 2021

2
Homeworking report
Luca Acerini Senior Analyst
Sophie Bordat Senior Analyst
Liam Fitzpatrick Analyst
Tom Jennings Director
Andie Stephens Associate Director
Established in 2001, the Carbon Trust works with businesses, governments and institutions around the world, helping them contribute to, and benefit from, a more sustainable future through carbon reduction, resource efficiency strategies, and commercialising low carbon businesses, systems and technologies.
The Carbon Trust:
• works with corporates and governments, helping them to align their strategies with climate science and meet the goals of the Paris Agreement;
• provides expert advice and assurance, giving investors and financial institutions the confidence that green finance will have genuinely green outcomes; and
• supports the development of low carbon technologies and solutions, building the foundations for the energy system of the future.
Headquartered in London, the Carbon Trust has a global team of over 200 staff, representing over 30 nationalities, based across five continents.
About the Carbon Trust
The Carbon Trust wrote this report based on an impartial analysis of primary and secondary sources, including expert interviews.
The Carbon Trust would like to thank everyone that has contributed their time and expertise during the preparation and completion of this report. Special thanks to: Inger Paus, Managing Director of Vodafone Institute for Society and Communications and Chairwoman of the Board of Management of Vodafone Foundation Germany and Ina Krings, Senior Expert Communications & Campaigns at Vodafone Institute for Society and Communications, for their content contributions and report review.
This report was sponsored by Vodafone Institute. For the avoidance of doubt, this report expresses independent views of the authors.
AcknowledgmentsThe Carbon Trust team:
The Vodafone Institute is the European think-tank of the Vodafone Group. The Vodafone Institute analyses the potential of digital technologies and their responsible use for innovation, growth and sustainable social change. Through research and events, Vodafone Institute provides thought leadership and offer a platform for dialogue between businesses, academia and politics. We are committed to enable better access to technology for all parts of society, developing and supporting projects to strengthen diversity in the digital economy. The wide-ranging expertise of the Advisory Board members reflects the Institute’s intention to act as a cross–sectoral platform.
About Vodafone Institute for Society and Communications

Homeworking report
3
ContentsExecutive summary 41. Introduction 9
1.1. COVID-19: an unprecedented shift in our working culture 101.2. Scope and overview of this study 11
2. Methodology 14
2.1. Overview 142.2. Summary of calculations 142.3. Teleworking scenarios 15
3. Results: on average teleworking leads to carbon emissions savings at an individual level 19
3.1. Results show that pre/during/post-COVID an average teleworker working from home saves carbon 193.2. Regional variability in individual teleworker savings 223.3. Teleworkers homeworking in countries with inefficient offices benefit from greater carbon savings 24
4. Assessingthecarbonimpactofateleworkerbeyondtheaverageprofileiscomplicated 28
4.1. Homeworking does not always result in individual teleworker savings 284.2. An optimum carbon emissions analysis needs to look at each country’s energy system 334.3. Understanding how often teleworkers will come into the office or work from home is crucial to avoid
increased emissions 344.4. Conclusion of quantitative analysis 38
5. Recommendations 39
5.1. Digital infrastructure and broadband internet access are prerequisites for homeworking 405.2. Spatial analysis and urban planning 425.3. Smarter systems to optimise our infrastructure 445.4. Conclusion of our recommendations 47
Appendices 48
Appendix 1: Methodology approach: overview of calculations 48Appendix 2: Changes in homeworking patterns during and post COVID 62Appendix 3: Supplementary charts and tables 68
Endnotes 77

4
Homeworking report
The Vodafone Institute commissioned the Carbon Trust to provide an assessment of the current state of affairs related to the impact of teleworking on climate change across six European countries: United Kingdom (UK), Germany, Spain, Sweden, Italy and the Czech Republic. This study assessed the carbon savings potential that an average teleworker could reach if working from home for a year-long period compared to going into the office.
This assessment focused on home working and the comparison with office-based working, (the scope did not include other business related travel). The study also includes an overview of broader implications teleworking could have on infrastructure use and further considerations needed for decision-makers to better plan cities, telecommunications and other infrastructure services for future teleworking with minimal carbon impact.
Executive summary
• Homeworking saves carbon emissions on average over the year in all six countries analysed.
• Germany has possibly the greatest potential to enable annual carbon savings in the future – saving 12MtCO2e per year – the equivalent of over 80 million one-way flights from London to Berlin; Italian teleworkers can save the most on an individual basis, the equivalent of over seven such flights per teleworker.
• Perhaps surprisingly it is saved office emissions that represent the largest contributor, with avoided commuting secondary, particularly where office buildings are inefficient.
• However, in winter teleworking doesn’t always save carbon, for instance in the case of the average urban German teleworker who commutes by train during the winter, who will have much lower carbon emissions by working in the office than by working from home.
• Planning for a carbon optimum is complex; in a worst-case scenario a hybrid working future could offset the benefits of cities’ efficiencies.
• We outline five opportunities for decision-makers to take a comprehensive approach in the way they plan for teleworking and ensure they understand the carbon impact of a hybrid working model.
Keyfindings

5
Homeworking report
Our analysis shows that homeworking saves carbon emissions on average over the year in all six countries analysed. Germany has possibly the greatest potential to enable annual carbon savings in the future at 12MtCO2e/year (Figure1), assuming that all workers with teleworkable jobs adopt teleworking practices, given the large working population and relatively large proportion of that population whose jobs are deemed to be teleworkable (39%).
The study considered working patterns for four COVID related scenarios: pre-, during, post (2021) and post (2022+). Carbon savings are particularly correlated to the average frequency of homeworking amongst teleworkers. We see that when strict lockdown restrictions were imposed in 2020 carbon saving per average teleworker was highest compared to pre and post COVID scenarios given that lockdown measures resulted in fewer days in the office (Figure 2).
Figure 1 Total carbon savings potential in a future post-COVID scenario (MtCO2e/year)
0
2
4
6
8
MtC
O2e
/yea
r
10
12
14
UK Germany Spain Sweden Italy Czech Republic
4.1
12.2
3.90.25
8.7
0.15
Total potential carbon saving (MtCO2e/year)

6
Homeworking report
The impact areas considered in the study were: the avoided commuting emissions, the avoided office-related emissions, and the additional domestic energy consumption when working from home. There are other less significant emissions that are broadly similar whether working from home or in the office, including the emissions related to data transfer over the internet.
(Note, that during the pandemic although data traffic over the internet increased, telecommunications operators reported only very small increases in energy consumption1).
Figure 2 Pre, during and post COVID carbon savings per teleworker by country
Total carbon saving per teleworker: Pre-COVID
Total carbon saving per teleworker: Post-COVID (2021)
Total carbon saving per teleworker: During-COVID
Total carbon saving per teleworker: Post-COVID (2022+)
0
200
400
600
800
1,000
1,200
1,400
1,600
1,800
2,000
kgCO
2e/t
elew
orke
r/ye
ar
UK
272
889
429
273
Germany
663801
1,144
700
Spain
563
890
689599
Sweden
124243
175117
Italy
876
1,215
1,861
1,055
Czech Republic
75
270
117 84

7
Homeworking report
Figure 3 Average teleworker carbon impact areas by country during COVID
During-COVID avoided commuting emissions
During-COVID additional domestic energy-related emissions
During-COVID avoided office-related emissions
kgCO
2e/t
elew
orke
r/ye
ar
UK Germany Spain Sweden Italy Czech Republic
0
-500
-1,000
-1,500
-2,000
-2,500
500
1,000
1,500
-282-474
-220 -215 -263
-1,153-1,320
-1,988
-784-867-813
-294
545
988
270451 342
776
Across all countries we found that office emissions represent the largest contributor to the emissions savings (see Figure 3).
Office-related savings are particularly greater in countries where buildings are inefficient. For example, we found that in Italy the carbon savings potential is greater than in Sweden. Italy’s office building stock is less energy efficient and the country’s heating system heavily relies on high-emitting sources of energy such as gas. On the contrary, Sweden’s savings potential is much less significant given the more efficient building stock, a less carbon-intensive grid and the presence of district heating.
However, to get a comprehensive view on the carbon impact of teleworking future studies need to understand the impact of changing behaviours, seasonality and marginal demand for infrastructure on carbon emissions.
For instance, in the case of Germany our analysis shows that in winter the average German teleworker that commutes to work by train can save greater emissions than working from home.
Planning for a carbon optimum can be difficult in a world where there is no determined pattern in people’s commute, energy use and demand at homes vs. office buildings. In a worst-case scenario a hybrid working future could offset the benefits of cities’ efficiencies and create a world where buildings and homes are used inefficiently with a transport system that is unable to respond to changing demand and potentially more cars on roads.

8
Homeworking report
There is an opportunity for decision-makers to take a comprehensive approach in the way they plan for teleworking and ensure they understand the carbon impact of a hybrid working model:
Telecommunications: European countries need to address the broadband internet access gap (particularly in rural areas) and accelerate the rollout of the technology given the switch to an economy highly dependent on digital and internet services. At a regional and national level countries can incentivise and enable innovation to ramp-up digital and broadband internet access as well as implement investment friendly framework conditions that can facilitate this development. This could include greater public subsidy programmes to target and support the most isolated areas in terms of broadband internet access, namely in rural environments. For example, the €750 billion EU Recovery and Resilience Funds will enable European governments to address the rural digital divide and barriers to rural infrastructure investment, with at least 20% of the funding specifically allocated to digital. Additionally, policy reform could help increase the provision of internet access, in particular through investment friendly spectrum auction design and licence terms, the removal of network deployment barriers and by providing guidance on network sharing arrangements.
Electricity supply: Better understanding of electricity demand is needed but also how movements from urban to rural environments might impact demand and power generation sites. With more people working from home there is a greater case for home solar panels and storage. Further, energy suppliers need to think about how to incentivise demand side responses when people are at home all day.
Cities: The pandemic has offered an opportunity to re-think how urban dwellers engage with their cities and implement planning frameworks such as the 15-minute city that incentivise greener and healthier lifestyles. In future development plans, spatial analysis could account for teleworking trends and how it may further impact emissions (e.g. where satellite cities or rural areas increase co-working spaces or regional hubs).
Transport: Due to COVID-19, commuting patterns have completely changed. Planners need to better understand what these will look like. Local authorities can incentivise city retailers and teleworkers to use e-mobility for deliveries or short trips within their municipality to reduce congestion, pollution and transport emissions
Buildings: Increasing homes and buildings efficiency needs to be a
priority to alleviate additional strain on countries’ energy systems and also reduce the carbon impact of existing housing stocks that are poorly insulated and relying on fossil fuel sources of energy. Local and national governments should further support financing schemes to implement housing retrofit measures. EU member states can allocate funds and packages available by the EU Green Deal for renovation of buildings as well as offering repayment or loan schemes for energy renovation for both private and public investors. Companies should adopt measures and smart technologies that can help rationalise offices depending on the number of people and where they are located in the offices.

9
Homeworking report
9
Homeworking report
1. Introduction

10
Homeworking report
1.1. COVID-19: an unprecedented shift in our working culture
In response to the COVID-19 pandemic, many organisations globally have transitioned to working at home wherever possible. This is the first and the largest teleworking ‘experiment’ in history which has accelerated trends towards flexible remote work and digitalisation2. People have discovered that they no longer need to be in an office and can get most things done remotely. They do not need to commute to work and instead have adopted more flexible working hours, splitting life and work activities to accommodate home-schooling, curfew restrictions and other activities.
The rapidity of these changes has affected organisational culture with an unprecedented uptake of collaborative technologies (videoconferencing, screen-sharing, digital shared file storage, digital whiteboards etc.) that are freely available and sophisticated.
Organisations have had to adapt to giving up face-to-face interactions and heavily rely on households’ access to reliable broadband.
At a household and individual level this has also shifted the way people depend on broader infrastructure including connectivity to cities and offices or how they use their domestic facilities and appliances that resulted in, for those at home, an increase in domestic electricity bills3. The pandemic has also given the opportunity to re-think what quality of life means, and for some to relocate to places with less urban density and greater access to green spaces.
What is a teleworker?
A teleworkable job is defined as a job that is technically possible to conduct remotely/from home utilising teleworking, regardless of whether it currently is or not4.
A teleworker, in this report, is defined as somebody who regularly does some work from home as part of their working pattern. Essentially meaning that a non-teleworker is somebody who never works from home. The aim of this analysis is to best represent an average teleworker, in particular a typical office teleworker. This average includes teleworkers that regularly work from home at any frequency, including if someone works from home only once a month or 5 days a week.
11
Homeworking report
1.2. Scope and overview of this study
This new pattern of working has had a significant short-term impact on emissions, and the way cities and infrastructure are used, which are likely to remain long term trends as companies adopt flexible and hybrid working models. This report aims to assess the current state of affairs of teleworking’s impact on climate change. The analysis was designed to help decision makers inform future teleworking and in-person working plans in a way that they optimise their working models in general and adopt a sustainable working culture with a minimal carbon footprint.
The analysis assesses the carbon footprint and potential savings of an average teleworker and compares results in a pre/during/post COVID scenario based on the average frequency of homeworking for each of the scenarios. A qualitative analysis complements these results to provide a broader understanding on further research and implications to consider what would give a more granular view on the carbon impact of teleworking and potential challenges that our infrastructure systems could face.
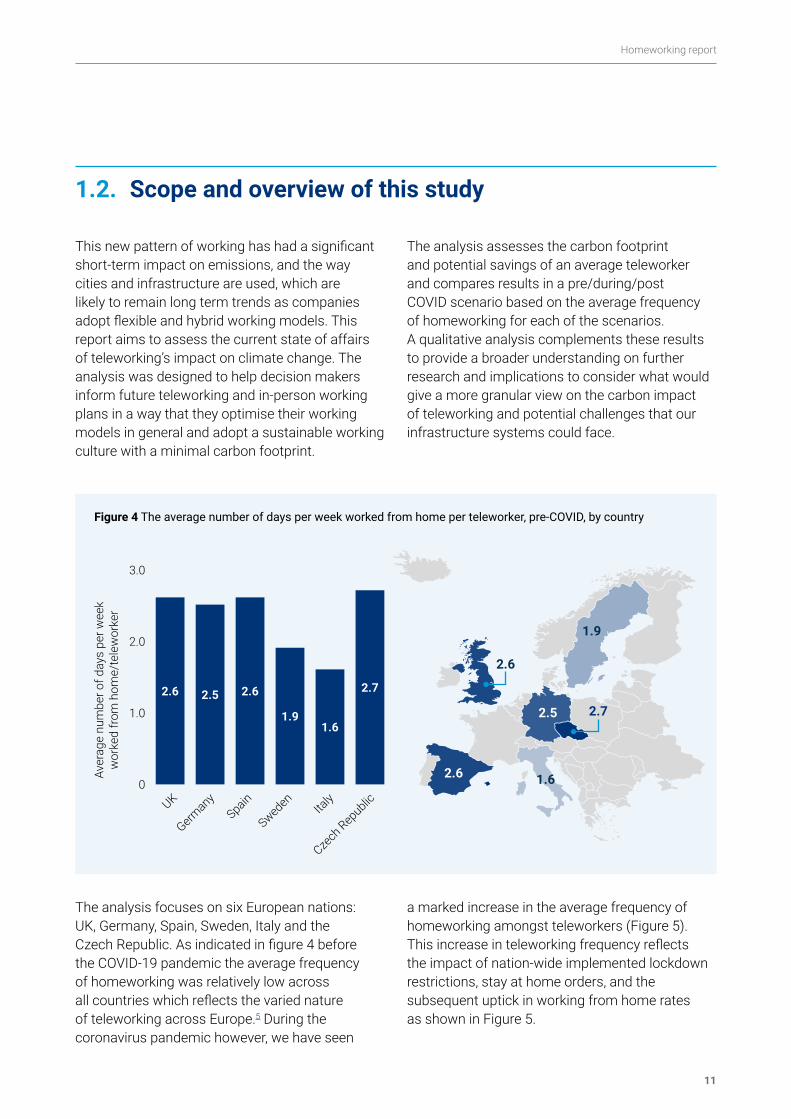
The analysis focuses on six European nations: UK, Germany, Spain, Sweden, Italy and the Czech Republic. As indicated in figure 4 before the COVID-19 pandemic the average frequency of homeworking was relatively low across all countries which reflects the varied nature of teleworking across Europe.5 During the coronavirus pandemic however, we have seen
a marked increase in the average frequency of homeworking amongst teleworkers (Figure 5). This increase in teleworking frequency reflects the impact of nation-wide implemented lockdown restrictions, stay at home orders, and the subsequent uptick in working from home rates as shown in Figure 5.
0
1.0
2.0
3.0
Aver
age
num
ber o
f day
s pe
r wee
k
wor
ked
from
hom
e/te
lew
orke
r
GermanyUK
Spain
SwedenIta
ly
Czech
Republic
2.6 2.6
1.91.6
2.72.52.5 2.7
2.6
1.9
1.62.6
Figure 4 The average number of days per week worked from home per teleworker, pre-COVID, by country

12
Homeworking report
While all six countries analysed have seen an increase in the homeworking frequency of teleworkers, there is again significant regional variability in this increase from before to during the pandemic (Figure 5). The UK has shown the greatest increase in days per week worked from home by teleworkers by 1.6 days per week, to 4.2 days per week overall during the COVID-19 pandemic lockdown 6,7. Germany, meanwhile, whilst previously having one of the highest homeworking frequencies, saw the smallest increase during the lockdown restrictions, of just 0.9 days, to 3.5 days per week during COVID8,9. The during COVID trend of homeworking frequency shows a different regional pattern compared to before the pandemic. This analysis also looked at the potential future frequency of homeworking amongst teleworkers in both a short term (post-COVID 2021) and longer term (post-COVID 2022+) scenario. It must be noted that the results of these scenarios, especially the frequency of homeworking, are based on potential future trends from research literature and studies, and are inherently highly uncertain. They represent only one potential future scenario that may or may not play out in the coming years.
Figure 6 summarises the change in teleworking frequency for countries across the four COVID scenarios, reflecting the predicted change in teleworking patterns from pre-COVID to a post-COVID world in 2021 and in the longer term (2022+). In this time period it is projected that European societies will move out of lockdown restrictions in mid/late 2021. This follows the assumption that teleworkers will begin to return to the office on an increased basis as restrictions are relaxed.
However, the post-COVID scenarios reflect that the COVID-19 pandemic has had a more profound and lasting impact on teleworking behaviour, for both those who teleworked before the pandemic or those newly accustomed to it. This is shown by the frequency of teleworking for 2021 and 2022+ dropping to lower than during-COVID levels but remaining significantly higher than pre-COVID levels. This is reflective of the fact that more workers and jobs have adapted to teleworking conditions, and that it will remain a significant part of people’s working lives in the future, as projected by various studies10,11. The detail of teleworking patterns of this analysis can be found in appendix 2.
Aver
age
num
ber o
f day
s pe
r wee
k
wor
ked
from
hom
e/te
lew
orke
r
GermanyUK
Spain
SwedenIta
ly
Czech
Republic
4.23.6 3.4
2.7
4.03.5 3.5 4.0
4.2
3.4
2.73.60
1.0
1.0
1.5
2.0
2.5
3.0
3.5
4.0
4.5
Figure 5 Average number of days per week worked from home by teleworkers during COVID

13
Homeworking report
Figure 6 Average number of days per week worked from home by teleworkers across all COVID scenarios
Average number of days per week worked from home by teleworkers pre-COVID
Average number of days per week worked from home by teleworkers post-COVID (2021)
Average number of days per week worked from home by teleworkers during-COVID
Average number of days per week worked from home by teleworkers post-COVID (2022+)
0
0.5
1
1.5
2
2.5
3
3.5
4
4.5
Aver
age
num
ber o
f day
s pe
r wee
k w
orke
d fro
m h
ome/
tele
wor
ker
UK Germany Spain Sweden Italy Czech Republic
2.6
4.2
3.4
3.0
2.5
3.5
3.0
2.6
3.6
3.12.8
1.9
3.4
2.62.4
1.6
2.7
2.11.9
2.7
4.0
3.33.0
2.7

14
Homeworking report
2. Methodology
2.1. Overview
2.2. Summary of calculations
The following section summarises the methodological approach taken in this analysis, to assess the potential carbon savings impact of teleworking, and how the Coronavirus pandemic has impacted teleworking frequency and carbon savings potential.
The countries in the scope of this analysis included: UK, Germany, Spain, Sweden, Italy and Czech Republic.
This analysis conducted by the Carbon Trust calculated the average annual carbon saving per teleworker by country. The scope of the sources of carbon emissions accounted for from an average teleworker included three key areas:
• Average avoided commuting emissions from teleworking
• Average avoided office-related emissions from teleworking
• Average domestic-related emissions from teleworking
A summary of the key assumptions for the emissions calculation is shown in section 2.3. For further details of the assumptions, sources used and the calculations, see Appendix 1.
The primary focus of this study was to analyse, in-depth, the three components (mentioned above) that exhibit the largest emissions impact on individual workers. In line with this, certain aspects of commuting, domestic and office emissions have not been included within the scope of the analysis. This list includes:
• Internet related activities of working (such as videoconferencing, videocalls, email etc.)
• Small domestic appliances for heating or cooling (such as desk fans or portable electric heaters) as well as
• Larger domestic appliances such as dishwashers and cooking appliances
The report acknowledges that these components are a feature of teleworking but it does not account for their energy use, as the additional emissions impact of each is negligible and similar whether being at home or in an office. This assumption corroborates with other previous studies of homeworking.12,13 For further details of these specific assumptions, see Appendix 2.
The emissions associated with data transmission over the internet is comparatively small. Using figures for per capita data consumption for different countries14, an energy intensity value for fixed broadband data transmission15, and country specific electricity grid emission factors16, gives a total annual emission figure per person of between 1 and 2 kgCO2e for the

15
Homeworking report
2.3. Teleworking scenarios
The average annual teleworker potential carbon savings were assessed across four COVID scenarios, each with a different average frequency of days worked from home per week. The four scenarios, and how the average teleworking frequencies were calculated, are outlined as follows (see Appendix 2 for details of sources used for each scenario frequency calculation):
• Pre-COVID: this scenario represents the typical frequency of teleworking in each of the six countries prior to March 2020, i.e. before the impact of COVID lockdown restrictions were felt. The average number of days worked from home per teleworker by country for this scenario was assessed based on a combination of national statistics data, research, studies and media articles.
• During COVID: this scenario represents the average frequency of teleworking during the coronavirus pandemic from March 2020 to March 2021, whilst lockdown restrictions were enacted across European nations. The average number of days worked from home per teleworker by country for this scenario was assessed based on a combination of national statistics data, research, studies and media articles.
• Post-COVID (2021): this scenario represents the short-term projected frequency of teleworking in an immediate post-COVID world, as European nations begin to emerge from lockdown restrictions. The average frequency of homeworking by teleworkers was assumed to be an average between pre and during COVID scenario levels of teleworking. This assumption made by Carbon Trust is based on published reports of teleworking behaviour trends17, and aims to reflect a potential short-term future teleworking scenario.
• Post-COVID (2022+): this scenario represents a potential frequency of teleworking in the longer-term post-COVID world. In this scenario, the frequency of homeworking by teleworkers was projected to increase compared to pre-COVID levels. This reflects assumptions that after an initial reduction in teleworking frequency after lockdown restrictions are lifted in the short-term, in the long-term the frequency of teleworking will remain at a rate above pre-COVID levels, as more workers and businesses adapt to teleworking as an accepted working pattern, as suggested by survey data from published reports18. This scenario is based on assumptions of future behaviour, and is inherently highly uncertain.
countries considered in this report (except for Sweden, which because of its very low grid emission factor results in a figure of 0.1 kgCO2e per year for internet data usage). These are for the emissions of the network transmission and do not include the emissions associated with the home router used to connect to the internet. The home router is typically on 24 hours a day, and uses about 10 W, which results in an annual emissions value between 20 and 40 kgCO2e for the countries considered in this report (except for Sweden where the value is about 1 kgCO2e).
It should be noted that the energy used for the internet network transmission and for the home router remains fairly constant irrespective of the amount of data being transmitted, and so is a fixed emissions “cost” whether one is working from home or from the office.
For comparison, a daily commute by car of 10km (round trip) is about 2 kgCO2e – that is more than the annual emissions associated with the internet data transmission for an average person.

16
Homeworking report
Parameters and assumptions Key sources
Frequency of teleworking days per week, by COVID scenario National employment statistics
Average commute distance (km) by workers National transport statistics, EU datasets e.g. gov.uk, EuroStat
Mix of transport modes used by workers National transport statistics, EU data sets e.g. EuroStat
Emissions factors by mode of transport BEIS, DEFRA (2020)
Table 1 Commuting emissions calculation
2.3.1. Commuting calculation approach
The average annual avoided commuting carbon emissions per teleworker were calculated for each country under each scenario. These average annual savings represent the average carbon emissions per teleworker that would have been emitted over a year-long period if the average teleworker had commuted to work, rather than worked from home.
For this calculation, key assumptions were used, to capture a representative average of commuting patterns and distances travelled by office workers for each country. A summary of the key parameters and assumptions is shown in table 1. For further details of the assumptions, sources used and the calculations, see Appendix 1.

17
Homeworking report
2.3.2. Domestic energy calculation approach
The additional domestic energy consumption accounted for in this analysis encompasses three core aspects:
1. Energy use from home-office equipment such as laptops, lighting and screens,
2. Heating energy consumption,
3. Cooling energy consumption
For this analysis, and the sake of simplicity, it was assumed that on any given day a teleworker was working from home, they were working from home alone, i.e. they did not share energy consumption with others.
The average annual additional emissions per teleworker were calculated, reflecting key parameters and assumptions of each country’s housing stock and energy consumption. A summary of the key parameters is shown in table 2. For further details of the assumptions, sources used and the calculations, see Appendix 1.
Table 2 Domestic emissions calculation
Parameters and assumptions Key sources
Frequency of teleworking days per week, by COVID scenario National employment statistics
Average home size (m2), by country National housing statistics, EU data sets e.g. destatis, EuroStat
Energy consumption from homes, by emission source National energy statistics, EU data sets e.g. EuroStat
Electricity grid emission factors, by source BEIS, DEFRA (2020), IEA (2020)

18
Homeworking report
2.3.3. Officeenergycalculationapproach
These average annual savings represent the average carbon emissions per teleworker that would have been emitted over a year-long period if the average teleworker had worked in the office, rather than worked from home. The avoided office-related energy consumption and associated carbon emissions savings were calculated by analysing average national buildings and office energy consumption data, statistics and literature.
Additionally, the analysis accounted for the space utilisation of office workers, in order to allocate the additional avoided office-related energy consumption on a per office worker/teleworker basis. A summary of the key parameters is shown in table 3. For further details of the assumptions, sources used and the calculations, see Appendix 1.
Table 3 Office emissions calculation
Parameters and assumptions Key sources
Frequency of teleworking days per week, by COVID scenario National employment statistics
Average office workstation size (m2) National statistics, EU data sets e.g. EuroStat
Energy consumption from offices, by emission source National energy statistics, EU data sets e.g. EuroStat
Rate of desk utilisation (%)19 The Workspace Consultants (2020), Trading Economics (2020)
Electricity grid emission factors, by source BEIS, DEFRA (2020), IEA (2020)

19
Homeworking report
3.1. Results show that pre/during/post-COVID an average teleworker working from home saves carbon
Regardless of where teleworkers work, there is a balancing of three core emissions components at the individual level that define a teleworker’s emissions profile.
These are the avoidance of commuting and office-related emissions by working from home, counteracted by the rebound effect of additional domestic energy consumption when working from home.
3. Results: on average teleworking leads to carbon emissions savings at an individual level
Figure 7 Pre-COVID emissions components and total carbon savings per country
kgCO
2e/t
elew
orke
r/yr
-174
-435
336
-598
-729
727
-213
-546
196
-265
-111
252
-127
-951
203
-174
-414
513
0200400600800
1,000
-200-400-600-800
-1,200-1,000
0
100
200
300
400
500
600
700
800
900
1,000
kgCO
2e/t
elew
orke
r/yr
272
663563
124
876
75
Total carbon saving per teleworker: Pre-COVID
Pre-COVID avoided commuting emissionsPre-COVID additional domestic energy-related emissionsPre-COVID avoided office-related emissions
Germany
Germany
SpainSpain
Sweden
SwedenIta
lyIta
ly
Czech
Republic
Czech
RepublicUK UK

20
Homeworking report
The results of this analysis indicate that, on an individual level, teleworking can enable potential annual carbon savings, based on the average frequencies of homeworking amongst teleworkers. These potential carbon savings have been achieved before and during the coronavirus pandemic, and are also set to be enabled by individual teleworkers in future scenarios.
Figure 7 illustrates how, in a pre-COVID scenario, an average teleworker in all six countries can enable potential carbon savings. This graph demonstrates the avoided commuting (dark blue bars) and avoided office (light blue bars) related emissions by a teleworker working from home at the average annual frequency for each country, before the coronavirus pandemic. These avoided emissions are represented as negative emissions. The green bars represent the positive rebound effect emissions resulting from home energy use when working from home, including heating, cooling and home office equipment throughout the year. These positive rebound emissions work to offset somewhat the avoided emissions of commuting and office energy.
However, on balance, the avoided emissions are enough that an average teleworker in each country can enable a net saving in carbon emissions by working from home.
In all countries, the potential annual carbon savings from avoided commuting and avoided office emissions overall outweigh the individual’s annual additional domestic emissions, resulting in a net annual carbon saving. The total average annual carbon savings per teleworker, by scenario, by country (kgCO2e/teleworker/year), and the average number of days per week worked from home by a teleworker are outlined in Appendix 3.
As countries locked down during the COVID pandemic, and the frequency of teleworkers working from home increased, this resulted in an increase in the potential annual carbon savings of individual teleworkers. Figure 8 illustrates this marked increase in the average annual carbon savings of teleworkers, across all countries, when shifting from pre-COVID to during COVID lockdown measures.
Figure8 Total carbon savings per teleworker pre vs. during COVID
Total carbon savings per teleworker: pre-COVID
Total carbon savings per teleworker: during-COVID
0
200
400
600
800
1,000
1,200
1,400
1,600
1,800
2,000
kgCO
2e/t
elew
orke
r/yr
UK
272
889
Germany
663
1,144
Spain
563890
Sweden
124243
Italy
876
1,861
Czech Republic
27075

21
Homeworking report
Relatively, the UK and Czech Republic saw the greatest increase in average carbon savings (>200%), whilst the biggest actual increase in carbon savings was seen in Italy (985 kgCO2e/teleworker/year). Spain and Germany saw relatively low proportional increases in teleworker carbon savings, although both actual increases are relatively substantial.
Sweden saw the lowest actual increase (120 kgCO2e/teleworker/year), this is due to the fact that a Swedish teleworker’s carbon impact is relatively low in general, compared to the other countries assessed.
Under the future post-COVID scenarios, teleworking patterns in 2021, 2022 and beyond projected that the average frequency of homeworking is set to fall again from during COVID levels. Consequently, the average teleworker annual carbon saving markedly decreases in post-COVID 2021 & 2022+ scenarios, across all countries, reflecting this modelled future projection.
Figure 9 illustrates this trend in total carbon savings per teleworker in the Post-COVID scenarios.
Figure 9 Total carbon savings per teleworker during vs. post-COVID
0
200
400
600
800
1,000
1,200
1,400
1,600
1,800
2,000
UK Germany Spain Sweden Italy Czech Republic
Total carbon savings per teleworker: during-COVID
Total carbon savings per teleworker: post-COVID (2021)
Total carbon savings per teleworker: post-COVID (2022+)
kgCO
2e/t
elew
orke
r/yr
889
429
273
1,144
801700
890
689599
243175 117
1,861
1,215
1,055
270
117 84

22
Homeworking report
Figure 10 Total carbon savings per teleworker by country across all scenarios
3.2. Regional variability in individual teleworker savings
The results of this analysis demonstrate significant variability in individual potential carbon savings between European countries. This regional variability is present across all four modelled scenarios.
Figure 10 illustrates the potential annual carbon savings per teleworker by country across all scenarios.
There is an increase in carbon savings as teleworking increased between pre-COVID and during-COVID scenarios, however, there is substantial variability of carbon savings between these countries. Notably, across all scenarios, Italy demonstrates a significantly higher average annual savings per teleworker compared to other countries.
While Sweden and the Czech Republic demonstrate the lowest levels of average annual carbon savings. We compare Italy and Sweden’s carbon savings potential per scenario below.
kgCO
2e/t
elew
orke
r/yr
Total carbon savings per teleworker: pre-COVID
Total carbon savings per teleworker: post-COVID (2021)
Total carbon savings per teleworker: during-COVID
Total carbon savings per teleworker: post-COVID (2022+)
UK Germany Spain Sweden Italy Czech Republic0
200
400
600
800
1,000
1,200
1,400
1,600
1,800
2,000
272
889
429
273
663
1,144
801700
563
890
689599
124
243175
117
876
1,215
1,861
1,055
75
270
117 84

23
Homeworking reportHomeworking report
23
Italy’s carbon savings potential for during-COVID scenario is nearly 8-fold greater than Sweden’s potential savings. This reflects the variation in energy consumption between the two countries
• Italy’s large carbon savings are predominantly driven by the much greater energy intensities of offices in Italy compared to other countries. Thus, by working from home, Italian teleworkers avoid a significant amount of office energy related emissions.
Conversely, teleworkers in Sweden experience the lowest amount of carbon savings by working from home. This is driven by a combination of factors including:
• Relatively low electricity grid intensity, compared to other EU countries
• Adoption of lower carbon sources for home heating systems, mainly district heating, electric heating and biomass and negligible use of oil and gas (compared to other EU countries)
• Generally lower frequencies of working from home amongst teleworkers across all 4 scenarios
Figure 11 Italy and Sweden carbon savings per teleworker across all COVID scenarios
Country analysis: Italy vs Sweden
0
500
1,000
1,500
2,000
kgCO
2e/t
elew
orke
r/yr
ItalySweden
876
1,861
1,2151,055
117175243124
Total carbon savings per teleworker: pre-COVID
Total carbon savings per teleworker: during-COVID
Total carbon savings per teleworker: post-COVID (2021)
Total carbon savings per teleworker: post-COVID (2022+)
24
Homeworking report
3.3. Teleworkershomeworkingincountrieswithinefficientofficesbenefitfromgreatercarbonsavings
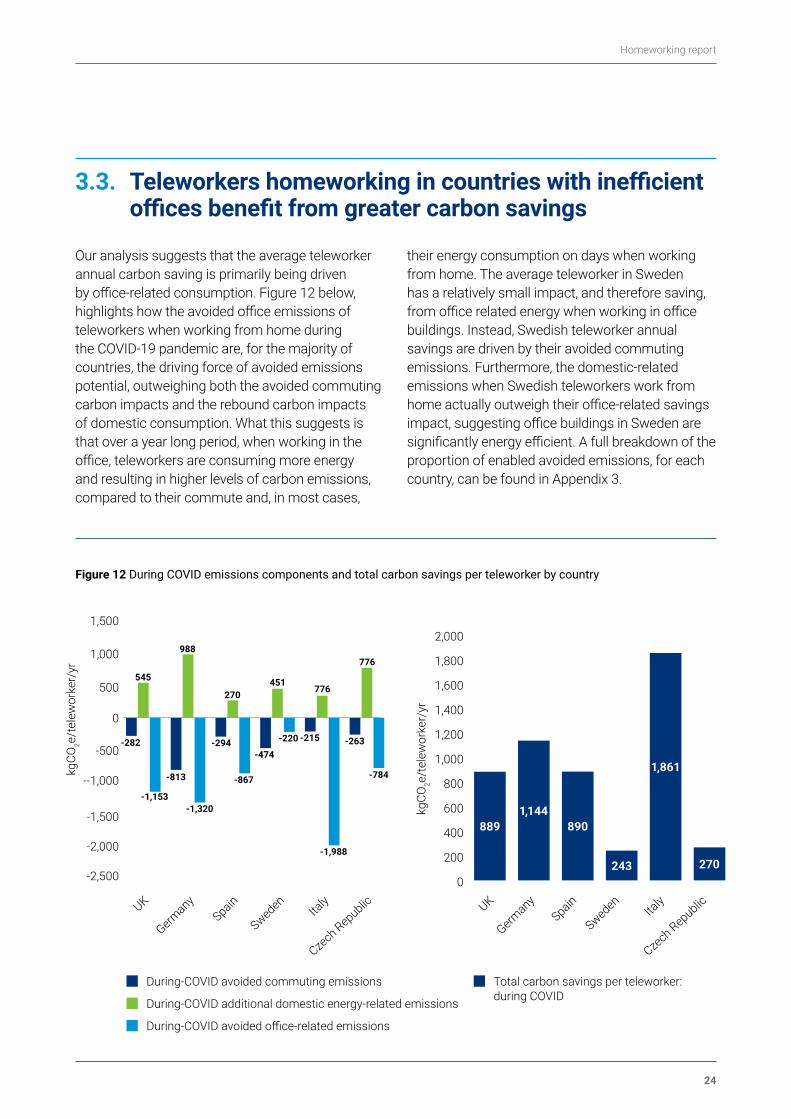
Our analysis suggests that the average teleworker annual carbon saving is primarily being driven by office-related consumption. Figure 12 below, highlights how the avoided office emissions of teleworkers when working from home during the COVID-19 pandemic are, for the majority of countries, the driving force of avoided emissions potential, outweighing both the avoided commuting carbon impacts and the rebound carbon impacts of domestic consumption. What this suggests is that over a year long period, when working in the office, teleworkers are consuming more energy and resulting in higher levels of carbon emissions, compared to their commute and, in most cases,
their energy consumption on days when working from home. The average teleworker in Sweden has a relatively small impact, and therefore saving, from office related energy when working in office buildings. Instead, Swedish teleworker annual savings are driven by their avoided commuting emissions. Furthermore, the domestic-related emissions when Swedish teleworkers work from home actually outweigh their office-related savings impact, suggesting office buildings in Sweden are significantly energy efficient. A full breakdown of the proportion of enabled avoided emissions, for each country, can be found in Appendix 3.
Figure 12 During COVID emissions components and total carbon savings per teleworker by country
kgCO
2e/t
elew
orke
r/yr
-282
-1,153
545
-813
-1,320
988
-294
-867
270
-474
-220
451
-215
-1,988
776
-263
-784
776
UK UK
Germany
Germany
SpainSpain
Sweden
SwedenIta
lyIta
ly
Czech Republic
Czech Republic
kgCO
2e/t
elew
orke
r/yr
8891,144
890
243
1,861
270
Total carbon savings per teleworker: during COVID
During-COVID avoided commuting emissions
During-COVID additional domestic energy-related emissions
During-COVID avoided office-related emissions
0
500
1,000
-500
--1,000
-1,500
-2,000
-2,500
1,500
200
400
600
800
1,000
1,200
1,400
1,600
1,800
2,000
0

25
Homeworking report
Figure 13 Average annual office energy consumption (kWh/m2) per country
While avoided office-related emissions are typically driving teleworker annual savings, there is again significant regional variability between countries. This regional variability is reflective of differences in average buildings energy performance between countries, as well as variability between commuting patterns. As demonstrated in Figure 12, Italy not only has the highest average annual avoided office emissions per teleworker, but also the highest proportion of office avoided carbon emissions compared to commuting.
In order to understand the impact and variability of office-related avoided teleworker emissions, it is necessary to dig down into the average energy consumption of office buildings.
Figure 13 illustrates the average kWh/m2 in office buildings by country, used in this analysis. From this data it is evident how considerably more energy intensive office space per m2 is in Italy compared to other countries, driven by a considerably higher gas consumption value. Comparatively, gas consumption in other European countries is almost half that of Italy’s, while Sweden has an exceptionally low gas consumption rate, utilising district heating instead. Electricity grid intensity also has a significant role to play in determining the degree of office-related (and domestic-related) emissions of individual teleworkers.
Gas Electricity District heating
kWh/
m2
250
300
350
200
150
100
50
0UK Germany Spain Sweden Italy Czech Republic
88
157
104
135
37
174
6
129
95
314298
105 97

26
Homeworking report
As figure 14 below illustrates, Sweden has a much lower grid intensity emission factor compared to other countries (~ 1/30th the size of Germany’s emission factor) where Germany, Italy and the Czech Republic are among the highest (see Appendix 1 for table of grid emission factors, by country). Consequently, this results in Swedish teleworkers producing much lower carbon emissions when consuming electricity than, for example, Italian teleworkers, whether at home or in the office.
This means while Swedish teleworkers benefit from having a lower emissions impact when consuming electricity, it also results in them effectively being penalised in terms of savings, as they avoid much less emissions when working from home. Combining this impact of grid intensity, with differences in building efficiency between countries, results in the significant geographic variability in average teleworker savings and emissions impacts when working from home.
Figure 14 Grid intensity by country (kgCO2e/kWh)
kgCO
2e/k
Wh
UK Germany Spain Sweden Italy Czech Republic
0.0
0.1
0.2
0.3
0.4
0.5
0.6

27
Homeworking report
27
To understand the potential carbon savings from increased teleworking, we analysed a future scenario, where everyone who can work from home does so at the number of days per week used in the Post-COVID (2022+) scenario (i.e. roughly between two and three days per week, depending on the country – see Figure 6).
The results in Figure 16 show that Germany has the greatest potential for carbon savings in this scenario at 12 MtCO2e/year, reflecting the large working population and relatively large proportion of teleworkable jobs (39%) in Germany. The Czech Republic, on the other hand, is likely to result in the smallest potential carbon savings (0.15 MtCO2e/year), having a much smaller total population and the lowest number of teleworkable jobs in the working population (32% of all workers).
Potential Savings Contextualised
The potential savings for UK and Spain are each about 4 MtCO2e/year, this is equivalent to approximately 28 million one-way passenger flights from London to Berlin20. Italy’s potential savings are just over double that at 8.7 MtCO2e, equivalent to 60 million London to Berlin flights, and Germany’s potential savings at 12 MtCO2e are equivalent to 83 million flights.
While at the individual level, the average German teleworker in the Post-COVID (2022+) scenario will save 700 kgCO2e per year from working from home 2.7 days per week, which is equivalent to 5 one-way London to Berlin flights. For the other countries in the Post-COVID (2022+) scenario the equivalent number of flights ranges from just below 1 for Sweden to just over 7 for Italy.
Potential future savings by country
Homeworking report
Figure 15 Total number of teleworkable jobs by country Figure 16 Total potential carbon saving (MtCO2e/year)
0
2
4
6
8
MtC
O2e
/yea
r 10
12
14
UK Germany Spain Sweden Italy Czech Republic
Total potential carbon saving (MtCO2e/year)
4.1
12.2
3.9
8.7
0.150.2502468
101214161820
Num
ber o
f tel
ewor
kabl
e jo
bs
(mill
ions
)
UK Germany Spain Sweden Italy Czech Republic
15.1617.47
6.52 2.138.23
1.72
Potential number of teleworker jobs (millions)
This analysis used the latest available data on working population and working patterns to estimate the number of teleworkable jobs by country (see Appendix 3 for sources and assumptions). This is likely to be an underestimate, as, in the future, the proportion of jobs that are teleworkable will probably increase. To estimate the total potential carbon savings the number of teleworkable jobs was multiplied by the average carbon saving per teleworker per year for the post-COVID 2022+ scenario

28
Homeworking report
4. Assessing the carbon impact of a teleworker beyondtheaverageprofileis complicated
4.1. Homeworking does not always result in individual teleworker savings
Our analysis has shown that on average across all six European countries teleworking can enable carbon savings when we look at an average year-long period for all scenarios (pre, during, post-COVID). However, analysing a national average may not reflect the variations in seasonality, individual behaviours or teleworking patterns that also impact emissions at a given period or context. For instance, in countries with colder climates we know that in winter there is a greater consumption of heating as opposed to summer which can result in increased emissions in winter vs. summer. To get a granular understanding of the carbon impact of future teleworking adoption it is important to consider influencing factors that may increase or decrease emissions. This could help inform plans to incentivise teleworkers to stay at home or come into the office at a given time or context when lowest carbon emissions impact can be achieved.
To illustrate this our analysis assessed the variability in daily teleworker savings when working from home compared to working in the office, across different case study scenarios. For each case study, specific parameters and assumptions were chosen to reflect the different circumstances and behaviours of teleworkers, across two countries, Spain and Germany, and how that can significantly impact their overall emissions footprint. The three parameters assessed are as follows:
• Seasonality (winter vs summer)
• Mode of transport (car vs train)
• Regional location (rural vs urban)
Our case studies show that teleworker carbon savings are more complex than simply the average annual potential savings, and that individual savings at a granular level are in fact sensitive to several factors.

29
Homeworking report
Figure 17 Germany average teleworker emissions winter vs. summer, car vs. train
4.1.1. Seasonality and mode of transport impact on an average teleworker’s emissions
We found that, in winter, the average German teleworker who commutes by train can reduce their carbon impact by working in the office, whereas in summer they will reduce their impact by working at home whether they commute by train or car as indicated in Figure 17. This is driven by the high domestic energy consumption at home
during the winter, when heating consumption, which is typically dominated by fuel oil and gas, is at its highest. Conversely, in summer the German teleworker who works from home will reduce their carbon impact, regardless of the mode of transport that they would have used. As a result, the teleworker that normally commutes by car can save 6.44kgCO2e/day and the teleworker that normally commutes by train can save 3.72kgCO2e/day, when working from home.
0
2.00
4.00
6.00
8.00
10.00
12.00
14.00
Scenario 1: German teleworker, commuting by car during the winter
Scenario 2: German teleworker, commuting by
car during the summer
Scenario 3: German teleworker, commuting
by train during the winter
Scenario 4: German teleworker, commuting by train during the summer
Working from home
Working from office
Working from home
Working from office
Working from home
Working from office
Working from home
Working from office
kgCO
2e/d
ay
12.71
4.47
12.71
4.473.62
1.49
5.97
1.49
3.62
7.29
5.97
7.29
Commuting emissions Domestic emissions Office emissions
Scenario 1: German teleworker, commuting by car during the winter
Scenario 2: German teleworker, commuting by
car during the summer
Scenario 3: German teleworker, commuting
by train during the winter
Scenario 4: German teleworker, commuting by train during the summer
Working from home Working from home Working from home Working from home
kgCO
2e/d
ay 6.44
-5.24
0.650.550
-2.00
-4.00
-6.00
2.00
4.00
6.00
8.00
Teleworker saving

30
Homeworking report
In Spain, however, the average teleworker that works from home can save up to 4.38kgCO2e/day by working from home regardless of their commuting mode of transport, given domestic related emissions do not outweigh the avoided commuting and office emissions. Figure 18 also shows that in summer the Spanish teleworker can reduce their carbon emissions by going into the office regardless of their mode of transport as they can save up to 2.29 kgCO2e/day by working in the office.
This is driven by the fact that in the summer months in Spain the average teleworker consumes a significant amount of energy for domestic cooling at home, which results in higher daily emissions compared to average office and commuting emissions. By commuting by train in the summer, which is a less carbon intensive mode of transport, teleworkers can actually save emissions on a daily basis by not working from home.
Figure18Spain average teleworker emissions winter vs. summer, car vs. train
0
2.00
3.00
4.00
5.00
6.00
7.00
8.00
Scenario 5: Spanish teleworker, commuting by car during the winter
Scenario 6: Spanish teleworker, commuting by
car during the summer
Scenario 7: Spanish teleworker, commuting by
train during the winter
Scenario 8: Spanish teleworker, commuting by train during the summer
Working from home
Working from office
Working from home
Working from office
Working from home
Working from office
Working from home
Working from office
2.29
5.78
2.29
5.78
2.91
0.58
3.83
0.58
2.91
2.84
3.83
2.84
Commuting emissions Domestic emissions Office emissions
1.00
Scenario 5: Spanish teleworker, commuting by car during the winter
Scenario 6: Spanish teleworker, commuting by
car during the summer
Scenario 7: Spanish teleworker, commuting by
train during the winter
Scenario 8: Spanish teleworker, commuting by train during the summer
Working from home Working from home Working from home Working from home
kgCO
2e/d
ay
2.12
-0.03
4.38
0-1.00-2.00-3.00
1.002.003.004.00
Teleworker saving
-2.29
5.00
kgCO
2e/d
ay

31
Homeworking report
Scenario 1: German rural teleworker, commuting by car during the winter
Scenario 2: German rural teleworker, commuting by
car during the summer
Scenario 3: German urban teleworker, commuting by
train during the winter
Scenario 4: German urban teleworker, commuting by train during the summer
Working from home
Working from office
Working from home
Working from office
Working from home
Working from office
Working from home
Working from office
kgCO
2e/d
ay
12.71
4.47
12.71
4.47 3.62
0.88
5.97
0.88
3.62
8.62
5.97
8.62
Commuting emissions Domestic emissions Office emissions
2.00
0
4.00
6.00
8.00
10.00
12.00
14.00
16.00
4.1.2. Seasonality and location (urban vs. rural) impact on an average teleworker’s emissions
As explained above, many factors can influence the scale of emissions at a given time, whether people live in rural or urban environments which results in longer commuting distances will also have a major impact. For Spain and Germany
we compared how results change if people live in urban areas typically commuting ~20km to work and if they live in rural areas with a longer commute distance of ~40km on average. In both contexts, we assumed that the average teleworker living in a rural area would commute to work by car when going into the office whilst the average urban teleworker would commute by train.
In Germany we found that a typical German teleworker commuting from a rural setting can enable an average daily carbon saving by working from home in both the winter (1.89 kgCO2e/day) and in the summer (7.78 kgCO2e/day). A typical urban-based German teleworker, who instead commutes by train over a generally shorter distance than rural workers, can also just enable savings when working from home during the summer (0.04 kgCO2e/day).
However, during the winter, a typical urban German teleworker working from home results in negative daily carbon savings (-5.85 kgCO2e/day). This is due to the fact that, as illustrated in Figure 19, the domestic emissions from working from home during winter outweigh the urban teleworker’s train commute and office-related emissions.
Figure 19 Germany average teleworker emissions winter vs. summer, rural vs. urban
Scenario 1: German rural teleworker, commuting by
car during the winter
Scenario 2: German rural teleworker, commuting by
car during the summer
Scenario 3: German urban teleworker, commuting by
train during the winter
Scenario 4: German urban teleworker, commuting by train during the summer
Working from home Working from home Working from home Working from home
kgCO
2e/d
ay
0.04
Teleworker saving
0-2.00-4.00-6.00
2.004.006.00
7.78
-5.85
1.89
8.00

32
Homeworking report
In comparison, a typical Spanish rural teleworker can also achieve daily carbon savings by working from home in both the summer (5.75 kgCO2e/day) and winter (10.17 kgCO2e/day) when they would typically commute longer distances by car. An urban Spanish teleworker who would typically commute shorter distances by train during the winter also enables daily carbon savings (2.43 kgCO2e/day), however during
the summer an urban Spanish teleworker has a lower carbon impact when going into the office, as the domestic energy consumption emissions from cooling and office equipment in the summer outweigh the emissions of commuting by train and office-related emissions, resulting in negative daily savings when working from home (-1.99 kgCO2e/day).
Figure 20 Spain average teleworker emissions winter vs. summer, rural vs. urban
0
Scenario 5: Spanish rural teleworker, commuting by car during the winter
Scenario 6: Spanish rural teleworker, commuting by
car during the summer
Scenario 7: Spanish urban teleworker, commuting by
train during the winter
Scenario 8: Spanish urban teleworker, commuting by train during the summer
Working from home
Working from office
Working from home
Working from office
Working from home
Working from office
Working from home
Working from office
kgCO
2e/d
ay
2.29
5.78
2.29
5.78 2.91
0.88
3.83
0.88
2.91
8.62
3.83
8.62
Commuting emissions Domestic emissions Office emissions
Scenario 5: Spanish rural teleworker, commuting by car during the winter
Scenario 6: Spanish rural teleworker, commuting by
car during the summer
Scenario 7: Spanish urban teleworker, commuting by
train during the winter
Scenario 8: Spanish urban teleworker, commuting by train during the summer
Working from home Working from home Working from home Working from home
kgCO
2e/d
ay
2.435.75
10.17
2.000
-2.00-4.00
4.006.008.00
10.00
Teleworker saving
-1.99
12.00
2.00
4.00
6.00
8.00
10.00
12.00
14.00

33
Homeworking report
4.2. An optimum carbon emissions analysis needs to look at each country’s energy system
As COVID-19 restrictions lift and companies transition towards re-opening offices there is an expectation that a hybrid-working model will be in place, providing flexibility for teleworkers to decide whether to come into offices or work from home as they wish.21 This flexibility is an opportunity for teleworkers to plan their work-life balance in a way that it would contribute to maintaining quality of life, productivity and social interactions.22 However, from a carbon perspective, flexible working could mean less predictable patterns in terms of individual habits, workforce coming into the office or not, from varied locations at a given time during the year that could induce greater or less emissions if not anticipated.
These variations have a particular influence on the electricity demand that would result in less predictable patterns, which utilities need to grapple with. Factors such as location or people’s movements (from urban to rural) may increase demand for more carbon-intensive sourced power instead of low-carbon sources of energy. Our results have shown that countries with higher grid intensity (i.e. Czech Republic and Germany) result, on average, in higher teleworking emissions whilst
countries with low grid intensity like in Sweden have a smaller footprint. However, as demand changes, the generation to supply electricity also varies to respond to this demand; to better understand the carbon impact of teleworkers in different scenarios it is important to look at the marginal grid intensity and demand.
Lockdowns have shown that peak demand patterns completely shifted with a slower uptake of electricity demand in the morning and spikes happening when COVID-related announcements or other TV programmes are broadcasted23. Countries, like the UK, have also experienced their electricity system recording ‘greenest days’ as renewables were able to generate up to 60% of all electricity on a given day. It is important to get a more granular view of those nuances at a local level to analyse the carbon impact a teleworker has based on their location, the marginal grid intensity for a given period and seasonality. For instance, if a teleworker is in a home close to clean electricity generation during an abundant season, it might be worth incentivizing homeworking for that teleworker.

34
Homeworking report
4.3. Understanding how often teleworkers will come intotheofficeorworkfromhomeiscrucialtoavoidincreased emissions
In a hybrid working world there is a risk that households are split between teleworkers working from home and the other half in the office. In a worst-case scenario this split could result in consuming more energy and emitting more emissions as both homes and offices are fully operating to enable teleworkers and office-workers to do their jobs. Further analysis must assess what this split could look like and how it could result in increased emissions.
For example, in winter, as domestic energy consumption raises to respond to the heating demand in colder climates such as in Germany or the UK, the carbon impact of teleworkers might end up being much higher particularly where the building stock is predominantly inefficient. This could exacerbate the negative impact from inefficient homes that consume a lot of energy and office buildings only partly utilised that would heat half empty offices. This would greatly vary on a country by country basis, particularly depending on the energy efficiency performance of homes and buildings stock as well as how companies rationalise their offices.
Office rationalisation reduces the total square meter floor space a company may occupy in a building, effectively resulting in more employees per meter squared of occupied floor space. This is achievable, as more employees and businesses adopt teleworking as part of their working pattern, and less office space is required less of the time. By rationalising office space, the energy efficiency of buildings per employee can become significantly more efficient. Taking these considerations into account would provide a more nuanced view of the carbon story of each teleworker but also give more insights on the need to address and retrofit inefficient buildings and homes. This is particularly the case for countries like the UK where two-thirds of the homes in the country have very low Energy Performance Certificate (EPC) rating varying between D and G compared to the European average of B-C.

35
Homeworking report
35
Homeworking report
This sensitivity analysis has been created to reflect a potential scenario where office rationalisation occurs, and subsequently desk utilisation rates (the proportion of desks in use by employees in an office on a given day) are increased, increasing the efficiency of an employee’s building related consumption. This sensitivity analysis assumes that the desk utilisation rate of the average employee’s office building is increased to 90%, across all countries. (See Appendix 3)
The scenario reflects the average post COVID (2022+) scenario frequency of teleworking, reflecting the longer-term pattern of teleworking. The results of this sensitivity scenario analysis are presented below, and reflect the following new assumptions:
• Average desk utilisation rate = 90%
• Average commuting and average domestic energy consumption as per standard analysis.
As figure 21 indicates, the impact of increasing desk utilisation to 90% in a future post-COVID scenario compared to the European peak average (68%) has the effect of lowering the avoided office-related emissions, and thus lowering the total average annual savings per teleworker. The increase in desk utilisation rate has the effect of making offices much more energy efficient per worker, and thus has a lesser impact when teleworkers work in the office. Potential future carbon savings have decreased across all countries, and by as much as >100% in the Czech Republic. The impact on Czech Republic average annual savings has been such that, on average, it results in a higher carbon impact to work from home at post-COVID frequencies than it does to work from the office, due to the fact that Czech domestic energy consumption-related emissions are so much higher, i.e. less efficient homes.
Sensitivityanalysis:Officerationalisation
Figure 21 Post COVID (2022+) kgCO2e/teleworker/year saving: 68% vs. 90% desk utilisation rate
Post-COVID (2022+) 90% desk utilisationPost-COVID (2022+) 68% desk utilisation
kgCO
2e/t
elew
orke
r/yr
0
-200
200
400
600
800
1,000
1,200
UK Germany Spain Sweden Italy Czech Republic
14983 117
-28
84273496
700
457599
775
1,055

36
Homeworking report
36
Homeworking report
What this desk utilisation rate sensitivity scenario analysis illustrates is that potential future office rationalisation, resulting from COVID-related future impacts on the way companies operate, can have a critical impact on future carbon savings of the average teleworker. Office rationalisation will result in more efficient buildings, but will also inevitably lead to lesser average annual carbon savings of teleworkers, and in some cases, if teleworking frequencies are high enough and domestic related emissions are inefficient enough, may result in negative carbon impacts from teleworking.
It must however be considered, that while buildings and office related consumption will become more energy efficient and rationalisation occurs over time, domestic related consumption will also likely become more efficient as the fuel mix and grid intensity factors change and decarbonise. Thus, it is unlikely that teleworking would lead to net negative carbon savings, as long as teleworkers home emissions do not remain stagnant in the future.
Further research & analysis – number of teleworkers per household increasing
The average individual carbon saving is highly sensitive to key factors varied: desk utilisation rate, commute distance, people per household. There is scope for further sensitivity analyses to evaluate the potential impact of these factors on carbon savings per teleworker, by altering the assumption of each to reflect a future scenario.
For example, the model could be adapted to reflect a potential scenario where the number of teleworkers per household increases, as teleworking becomes more widely adopted in the long-term. This would, subsequently, result in domestic energy being allocated across more people per household, increasing the domestic energy efficiency of each teleworker’s related consumption.
• One person per household - 100% domestic energy allocated to one person
• Two people per household - 50% domestic energy allocated to one person

37
Homeworking report
37
An analysis was performed to estimate the emissions savings by Vodafone employees working from home during COVID. This analysis used data provided by Vodafone for a major office in each of the five countries. The data included: the average energy intensity (in kWh/m2) pre-COVID for each office; the total number of employees normally working from each office; and the percentage of employees from each office that worked from home during COVID. The estimation followed the same methodology as for the rest of the study, namely using national data
on commuting patterns, home energy usage, and frequency of days worked from home. The total emissions saved over a year by Vodafone employees from each office working from home were calculated, considering the avoided commuting emissions, the avoided office-related emissions and the additional domestic energy-related emissions. The results are presented in the table below, which shows the total emissions savings (in tCO2e) for all the teleworkers in each office during COVID, together with the total number of employees usually based at each office.
TeleworkeremissionssavingsfromVodafoneoffices
Carbon savings during COVID from Vodafone employees teleworking:Total savings by Vodafone offices in tonnes CO2e per office
tCO2e/year
Office Vodafone Newbury
Vodafone Dusseldorf
Vodafone Madrid
Vodafone Milan
Vodafone Prague
Office-related emissions avoided by teleworkers -2,622 -3,449 -855 -1,243 -856
Commuting emissions avoided by teleworkers -1,387 -3,592 -621 -391 -309
Additional domestic energy-related emissions by teleworkers working at home 2,685 4,366 571 621 911
Total emissions saving during COVID -1,325 -2,674 -904 -1,012 -253
Number of employees per office 5,025 4,650 2,486 1,877 1,381
Notes: The Vodafone Madrid data reflects the number of employees in the Madrid office, but uses average energy data from all the Vodafone Spain offices.

38
Homeworking report
4.4. Conclusion of quantitative analysis
Our quantitative analysis shows that on average at an individual level a teleworker saves carbon across all pre-, during-, and post- COVID-19 scenarios, with particularly greater savings during COVID-19 as restrictions imposed a higher number of days working from home across all countries analysed.
From an individual perspective, the biggest contributor to saving carbon is office building emissions. This is particularly higher in countries where grid intensity is higher and office buildings are particularly inefficient. For instance, in Italy the office carbon savings potential is higher than in Sweden, as Italy’s building stock is significantly more inefficient than in Sweden.
However, when looking at more granular patterns such as changes in seasonality, mode of transport and individual behaviours, carbon savings per teleworker working from home
change based on the country and can be much lower in winter vs. summer in colder climates.
Further understanding of marginal grid demand and building utilisation can help provide a more granular view on how teleworkers emissions might increase or decrease depending on changes in demand. To add a more nuanced and comprehensive view on the longer-term impact of teleworking the following recommendations section summarises qualitatively broader considerations for cities, infrastructure suppliers and businesses.

39
Homeworking reportHomeworking report
39
5. Recommendations

40
Homeworking report
5.1. Digital infrastructure and broadband internet access are prerequisites for homeworking
How the geography of work evolves will depend on multiple factors. City governments could tilt the balance with tax incentives for businesses and workers, and future investments in urban infrastructure and spaces could enhance the attractiveness of different locations. After the pandemic, individuals may reweigh their choices towards cost of living and location versus easy access to major travel, cultural, innovation, and recreational hubs. In fact, major cities across Europe and the U.S. have already experienced a population exodus towards satellite cities or rural areas which has impacted the housing market.24,25,26 Telecommunications and other infrastructure services such as buildings for
co-working space or ‘hubs’ and transport have an important role to attract people but also respond adequately to a changing living and working pattern centred around hybrid teleworking models.
It is important for decision-makers at national, local and company level to address these changes while minimising carbon emissions, particularly to ensure that these are aligned with net-zero emissions targets. Our recommendations are written to help governments (at local, regional and national level) and businesses (employers and infrastructure providers) adopt incentives to enable a sustainable teleworking environment.
Teleworking depends on strong and reliable broadband to enable people to do their jobs, feel connected and sustain economic activities in a virtual future. Yet, the infrastructure is lacking everywhere including in more advanced economies and particularly in rural areas where teleworkers from cities might be migrating to. Globally, about 72% of households in urban areas have access to the Internet at home, almost twice as much as in rural areas 38%27. In Europe internet access is much higher, however there are significant differences between member states and also between rural and urban areas. The Netherlands, Iceland, and Norway have the highest proportion of households with internet access at 98%. While the lowest rate of internet access among the EU-27 Member States was in Bulgaria at 75%, and across all households in the EU-27 the figure was 90%. The figures for all of EU-27 between urban and rural were: 92% in cities; 89% in towns and suburbs; and 86% in rural areas28. Digital infrastructure in general and broadband internet access in particular are key prerequisites for working from home. Rural areas are often disadvantaged regarding broadband internet
access and this needs to be addressed to avoid greater economic and social isolation for communities that could suffer from greater marginalisation.
European countries need to address the broadband internet access gap and accelerate the rollout of the technology given the switch to an economy highly dependent on digital and internet services. At a regional and national level countries can incentivise and enable innovation to ramp-up digital and broadband internet access as well as implement investment friendly framework conditions that can facilitate this development. This could include greater public subsidy programmes to target and support the most isolated areas in terms of broadband internet access, namely in rural environments. For example, using COVID-19 Recovery and Resilience Facility support mechanisms to roll-out these interventions. The €750 billion EU Recovery and Resilience Funds will enable European governments to address the rural digital divide and address rural infrastructure investment barriers, with at least 20% of the funding specifically allocated to digital.

41
Homeworking report
As required under the Recovery and Resilience Facility, investment must be paired with reforms that can maximise the benefits of that investment and remove barriers to rollout of networks to deliver reliable, secure and high-quality connectivity to European citizens. As set out In European Commission guidance these reforms include ensuring pro-investment mobile spectrum licensing procedures, in particular by extending spectrum licenses by at least 20 years, reducing costs and barriers to network deployment, facilitating access to physical infrastructure and providing clear guidance for voluntary infrastructure sharing agreements which can drive efficiencies and energy savings.
At a local level, municipalities have a key role to play to enable an accelerated implementation given their control over commissioning and approving local infrastructure project work. For instance, they can leverage their existing processes and networks to support underground work needed to install broadband infrastructure.
Access to the internet is crucial for future teleworkers and even more so for those who can no longer rely on in-person jobs and need to get upskilled to be employable in a teleworking reality.29 Studies have shown that more educated, higher-earning employees are far more likely to work from home as they are able to continue to get paid, develop their skills and advance their careers; at the same time those unable to work from home because of the nature of their jobs or because they lack suitable space and internet connections are being left behind.30
Governments and businesses need to address these economic and educational inequalities that exist between different regions (urban vs. rural), by offering greater access to internet, economic and upskilling opportunities in areas outside of major cities.
Digital connectivity can promote rural communities by improving government services such as health and education, but also allow business to develop in rural communities and improve the quality of life of those using digital connectivity from private domestic use cases such as entertainment. Furthermore, SMEs account for 75% of employment in rural areas. In their national COVID-19 recovery plans, Governments could support SMEs by offering grants or vouchers for digital investment, so that SMEs have the capacity to find solutions based on their own needs. And they could include additional support measures such as online resources, training and incentives to encourage take-up of digital products and services. People and businesses would then be more empowered with the right digital skills and solutions to thrive. Digital connectivity intervention can support government agendas to reduce geographic inequalities and bring wider societal benefits from more balanced geographic economic growth by closing the digital divide as economies can make more efficient use of the capital stock such as land and infrastructure.

42
Homeworking report
5.2. Spatial analysis and urban planning
5.2.1. Spatial options of future developments to include carbon analysis
Embedding carbon analysis in future local development plans is crucial to get a granular view on different development scenarios impact. This can particularly help to better understand how densely urbanised or rural areas will be and how that might change infrastructure services and teleworkers patterns, and their impact on climate.
In the UK, local councils such as Greater Cambridge are already exploring spatial analysis for the development of new homes and the associated emissions to different development scenarios. These are used to inform decisions as to how to minimise the climate impact of the required new growth in homes and promote policies that can address the carbon emissions associated to the new growth.
The analysis looks at sources of emissions due to new development coming from building construction materials and processes, building heating and electricity usage and occupant and visitor transport. It explores several spatial categories that reflect different potential growths depending on size, density, required additional infrastructure and transport patterns that happens within a local area. For example, Greater Cambridge found that in the eight scenarios they tested, annual CO2 emissions from the local area would uplift by between 0.4% and 12% depending on the spatial option31. They found that the densification option has the lowest emissions whilst the villages option has the highest carbon emissions.32 Looking forward, future local plans might need to model how teleworking patterns and commuting impact growth in emissions at a local level.
This would include anticipating greater demand for regional hubs or co-working spaces, that companies are planning to use as a replacement of centralised offices, and how that might impact mobility and settlement growth. As a response to this, there is an opportunity for both municipalities and office real estate to invest in regional co-working and shared office hub projects.
5.2.2. New urban planning approaches for healthier cities
In addition to better understand the carbon impact of future developments, urban areas are now in a position to consider how people engage with their cities when the majority spend most of their time at home. The pandemic has given new opportunities to re-think how urban environments should provide a greater quality of life with access to essential needs, recreational needs, work and infrastructure that can facilitate a hybrid working lifestyle.
Carlos Moreno’s concept of a 15-minute city promotes a framework for urban planners to plan their cities upon four core characteristics: Proximity, Diversity, Density, Ubiquity. This concept represents a major departure from the past, responding to climate change and COVID-19 at the same time. The idea is for cities to ensure that in a 15-minute walk or cycle a person can access everything they need to live. Land uses must be mixed to provide a wide variety of urban amenities nearby and there must be enough people to support a diversity of businesses in a compact land area that is affordable.
Paris has taken forward this concept with an all-encompassing approach to bring a greener take on the 15-minute city as well as including workplaces, cultural activities and social connections.

43
Homeworking report
This has involved banning high-polluting vehicles, restricting the quays of the river to pedestrians and cyclists, creating mini green spaces in the city. With Paris leading the way, other cities around the world have been enticed by this mode for resilient and vibrant communities. Madrid, Milan, Ottawa and Seattle are among those to have declared plans to copy its approach but also Melbourne has adopted a long-term strategic plan for 20-minute neighbourhoods.
5.2.3. Retail, food and services business and city planning
COVID-19 has caused us to leapfrog to make rapid delivery a permanent behaviour change. This has disrupted the way planners and businesses can anticipate road traffic and accommodate their shops to delivery pickups. Many retailers that depended on commuters or workers as clientele have struggled to survive without their regular customers and have had to review their business models, adapting them to client proximity. For resilient businesses this has resulted in having to adjust to changing consumer expectations,
forced to increase retail business models with more distribution centres, altering operations to ship from stores, dealing with higher product returns, and expanding logistics in addition to upgrading infrastructure and technology to fulfil online orders.
Local and national government need to support smaller businesses transition towards more digital services. This could be through financial mechanisms in post-COVID-19 recovery packages. As cities have their unique geographies, economies and challenges, decisions in terms of type of support and financial mechanism need to be devolved at a local level.
Working from home has increased the trend of online shopping from food to books and sports appliances, which is likely to remain as people will keep working from home. Municipalities will increasingly face more traffic due to delivery demand. Therefore, they have a role to play in imposing regulation and enabling public incentives for e-mobility to replace polluting and highly emitting delivery vans. This could include trialling pilots for e-bike or e-lorry delivery.

44
Homeworking report
5.3. Smarter systems to optimise our infrastructure
5.3.1. Efficientbuildingswithsmarttechnologies and decarbonised heat
On the basis that countries will follow grid and heating decarbonisation pathways the footprint of buildings and homes will decrease. However, decarbonising heat needs to go in hand with efficient homes to avoid any heat loss or leaking through retrofitting efforts. As people spend more time working from home and the demand for heating increases, power utilities will have to provide electricity for a growing demand to power our homes, transport and heat. Increasing homes and buildings efficiency needs to be a priority to alleviate additional strain on countries’ energy systems and also reduce the carbon impact of existing housing stock that is poorly insulated and relies on fossil fuel sources of energy.
It is estimated that renovating existing buildings in Europe could reduce the energy that buildings use by more than 50 percent33. This should involve retrofitting homes with better insulation to avoid heat loss, condensation or damp, providing access to healthier and less energy consuming homes. Local and national governments should further support financing schemes to implement housing retrofit measures.
EU member states can allocate funds and packages available by the EU Green Deal for renovation of buildings as well as offering repayment or loan schemes for energy renovation for both private and public investors. For instance, Germany has put in place subsidies for municipalities, companies and households to incentivise building and homes renovation to improve energy performance of these assets34.
Leveraging smarter systems to heat our homes and offices can reduce buildings emissions impact. As companies think about rationalising their offices they can incentivise smarter ways of powering and heating their offices. For instance, shutting off sections of the office whilst heating and lighting only parts where workers are doing their jobs. However, the rationalisation of offices in a flexible hybrid working world could be challenging and require new approaches to building management and operations able to respond to changing patterns in terms of how many people go to the offices and at what time of the day. For instance, using smart buildings, occupation sensors and zoning of office buildings would help optimise office rationalisation with minimised energy use adapted to daily demand for using office facilities.

45
Homeworking report
In homes there is also an opportunity to think about how to better heat homes and use existing smart technologies to control room temperatures. For example, incentivising teleworkers to only heat rooms where they spend most of their time working as opposed to their entire accommodation. Approaches need to be tailored to the type of technology in use. In a future scenario where heat pumps are used as the primary source of heating in domestic settings, maintaining a more consistent temperature throughout the building is generally recommended to optimise heat pump efficiency. However, if only one person is at home using one room it could reduce energy consumption by having the heat pump maintaining a base load of heating throughout the building with a supplementary technology providing top up heating in the occupied room (such as an infra-red radiant panel, direct electric heater, small air to air reversible heat pump or Mechanical Ventilation with Heat Recovery unit) to heat the individual’s working space and reduce the energy consumption of a whole-house being heated.
5.3.2. Power grid adapted to people’s movement, demand and behaviours
Utilities should anticipate how people migrating from urban environments to rural areas could impact the grid. Transporting electricity across a country can result in significant losses for the utility and therefore it should think about where to base generation points to ensure efficiencies. If people move to areas close to generation points, then there will be less reliance on electricity imports from generation points located far away which reduces the risk of electricity losses. There are also more opportunities for decentralised systems, with people spending more time at home there is a greater business case for installing solar panels and storage which in hand will help utilities manage their grids with greater flexibility. ICT technology and innovation will play a key role to help manage this flexibility with greater efficiency.
For instance, sensing and monitoring technologies for power flows, transmitting data across the grid but also the use of smart meters with in-home display to inform energy usage. Coordination, control and automation systems are needed to aggregate and process various data and create a highly interactive and responsive electricity grid that can maintain a demand-supply balance on a second-by-second basis.
During the pandemic, as people have been spending more time at home, domestic energy use has increased and their energy bills as well35. There is an opportunity to leverage that engagement to incentivise teleworkers to switch to greener electricity providers, invest in renewables at home or switch to time of use tariffs. However, there may also be unforeseen challenges to engaging consumers with Demand Side Response (DSR) due to change in habits. DSR incentivises end users to turn on their appliances at times when the demand for electricity is the lowest to reduce the strain on the grid and promote the use of appliances when renewables are producing electricity. When people worked from the office, smart appliances at home were able to turn on at moments of the day when electricity was the cheapest or/and green. With people working from home DSR might be perceived as inconvenient. For instance, as people are in their houses taking conference calls in their kitchen, they might be less likely to let their washing machine automatically turn on and off. There could be a tension between people willing to engage with their energy consumption and wanting to have a greener consumption with the perceived inconvenience of accommodating DSR incentives whilst being at home.
5.3.3. Low-carbon transport able to respond to changing commuting and mobility patterns
Teleworkers are able to save significant amounts of carbon by avoiding their daily commute into the office, particularly when they commute by car. However, different geographical contexts where differences in patterns and modes of commuting exist have important implications for the potential energy savings of teleworking.

46
Homeworking report
Since the beginning of the pandemic we’ve seen more teleworkers moving away from major cities to live in secondary cities or rural areas. With flexible hybrid working, teleworkers are likely to be incentivised to commute at times and days that suit them best. This may shift peak hour patterns that were commonly seen in the mornings and evenings to a flatter demand throughout the day that public transport services need to provide for in a decarbonised manner.
Whilst teleworkers are commuting less, in some instances particularly in more isolated or rural environments teleworkers are more likely to conduct several trips by car during the day. People commuting to work used to conduct several activities in one trip such as running errands or dropping children at school. These shifts in behaviours will also provide a different view on teleworker’s emissions36.
As people are moving away from large and dense cities towards rural and ‘satellite cities’ further research is required to understand how day trips and modes of transport to run several activities during a workday compare to when they were conducted in one work trip, and what it means in terms of carbon emissions. Local, regional and national governments should continue to analyse mobility patterns not only during pandemic-related lockdowns but also after to better understand how mobility infrastructure (public and private transport) demand is evolving and can best be addressed. This would help better plan cities and follow approaches similar to the 15-minute concept that would include reliable and low-carbon connectivity for those who are further away.
Furthermore, employers have a role to play to incentivise low-carbon movements. Particularly for those that have moved or are planning to move away from main offices and city centres but also for those that have to travel for their work (i.e. as they need to do several visits and movements to deliver their jobs). This could translate into implementing e-mobility or hybrid company car policies at a corporate level. For example, Vodafone Germany has included green fleet as an area of focus in their sustainability goals. Since the beginning of 2020, Vodafone Germany’s management switched to hybrid or electric vehicles as a first step to meet their 100% electric fleet target by 204037. Following this target the company has successfully expanded charging infrastructure with more than 40 charging points at the Vodafone Campus in Dusseldorf alone. In addition to this, more than 1,500 employees use Vodafone’s bicycle leasing service and have, in total, covered more than 10 million km on their bikes.

47
Homeworking report
Teleworking offers a great opportunity for potential carbon savings but also adds challenges to our cities, local economies and infrastructure suppliers in different contexts. As governments, cities and businesses are setting their net-zero targets, teleworking incentives could be designed to accelerate decarbonisation in transport, homes and power without leaving anyone behind. The pre-requisite to this is for governments to address the digital and broadband internet infrastructure gap to sustain a teleworking economy and ensure that it does not leave out working groups with less teleworking skills or located in rural areas with less internet access38.
Our report shows that decision-makers need to look beyond the individual average teleworking carbon saving opportunity to include more complex considerations. For instance, businesses and local authorities have opportunities to incentivise e-mobility particularly when it comes to delivery services in a world with increased demand for online shopping. National and local governments can drive home retrofitting incentives to the top of their agenda to address poorly insulated and inefficient housing stock, particularly where teleworkers spend the majority of their time at home.
Power utilities can re-consider power generation plans based on changes in people’s living location. With more people at home there is a greater opportunity for people to install solar panels or low-carbon heating technologies.
Smart technologies can monitor temperature and other building features to better optimise space use based on actual usage in offices or at home and are critical to enable teleworking with low carbon impact. Governments can use their national Recovery and Resilience Facility plans as well as Green Deal mechanisms in order to support measures such as home improvements, technology innovation or transport decarbonisation that are critical for a low-carbon impact teleworking future.
The prospects for a new world of work, that not only keeps employees happy, fosters cohesion between rural areas and cities, and helps to manage climate change, have rarely been more promising. Governments and businesses in Europe now have the opportunity to shape the future by making long-lasting decisions to create a low carbon environment that supports flexible working and benefits society as a whole.
5.4. Conclusion of our recommendations

48
Homeworking report
48
AppendicesAppendix 1: Methodology approach: overview
of calculations
Average annual carbon saving per teleworker
The average annual teleworker carbon saving was calculated using these three emissions components, accounting for the avoided commuting and office-related emissions, offset by the rebound domestic-related emissions resulting from teleworking. This core calculation can be summarised as follows;
Average annual carbon saving per teleworker = (Average annual avoided commuting emissions per teleworker + Average annual avoided office emissions per teleworker) – Average annual domestic emissions per teleworker
In order to calculate the average annual emissions impact from commuting, office and domestic-related energy consumption, an average daily impact was multiplied by the average number of days per year that a teleworker works from home. The average number of days per year worked from home was calculated from an average teleworking frequency per week, by country, multiplied by the number of working weeks, by country.
Commuting
The average annual avoided commuting carbon emissions per teleworker were calculated for each country under each scenario. These average annual savings represent the average carbon emissions per teleworker that would have been emitted over a year-long period if the average teleworker had commuted to work, rather than worked from home. To calculate this, the average daily commuting patterns of teleworkers by country was ascertained. This is illustrated by Figure 22 below. Average commuting data on daily distance (km) commuted by different modes of transport, including car, train, bus, subway and walking etc, was collected from various sources, including national statistics datasets, media articles and academic literature (see Table 4 and Table 6).
Average number of days per year worked from home by scenario, by country =
Average number of days per week worked from home per teleworkerby scenario, by country × Number of work weeksby country

49
Homeworking report
49
The scope of this calculation captures the commuting distance and associated emissions per teleworker, when working from home. However, it does not account for any other travel outside of commuting, that in reality would occur and thus could lead to an underestimation of travel distances. For example, some teleworkers may use their car for others activities during the working day when working from home such as shopping, errands, driving children to/from school, errands etc.
The calculation of the average avoided commuting emissions per teleworker per year was calculated for each of the four COVID scenarios, for each country. This used the latest 2020 transport emission factors from BEIS, per mode of transport, (see Table 5). Additionally, data and assumptions were used to allocate car commuting distance by different fuel types (petrol, diesel, electric and other) of car, to account for the difference in car fuel consumption between countries.
The calculation is summarised as follows:
Figure 22 Average daily commuting distance (km) per worker by country
km/d
ay
UK Germany Spain Sweden Italy Czech Republic
Average distance commuted (km) per worker per dayby mode of transport × kgCO2e.km emission factorby mode of transport × Number of days per year worked from home per teleworkerby COVID scenario
0
5
10
15
20
25
35
30
9
34
13
20
129

50
Homeworking report
50
Commuting assumptions
Table 4 Commuting data sources by country
Table 5 Emissions factors by mode of transport
Table 6 Average daily commuting distance, by mode of transport
UK Gernamy Spain Sweden Italy Czech Rep.
Average commute distance (km)
gov.uk thelocal.de idae.es trafa.se nationmaster.com nationmaster.com
Split by mode of transport gov.uk destatis.de idae.es
gov.uk39 trafa.se censimentopopolazione.istat.it researchgate.net
Split of car commuting by fuel type
NTS 2018 EuroStat
Mode of transport
Car (petrol)
Car (diesel)
Car (electric)
Car (other) Walk Bicycle Bus Rail Subway Tram Other
Emission factor (kgCO2e/km)
0.22 0.21 0.07 0.22 – – 0.15 0.04 0.03 0.03 0.22
Source BEIS DEFRA (2020)
Country Walk Bicycle Car (petrol)
Car (diesel)
Car (electric)
Car (other) Motorcycle Bus Rail Subway Other Total
UK 0.11 0.12 3.47 1.93 0.06 0.56 0.06 0.44 1.66 0.46 0.13 8.98
Germany 2.77 3.04 15.08 7.36 0.04 0.40 0.27 1.45 1.59 1.62 0.14 33.77
Spain 2.21 0.30 3.37 4.34 0.01 0.01 0.35 1.32 0.34 0.66 0.24 13.16
Sweden 0.30 0.60 5.76 3.40 0.03 0.44 - 2.57 3.74 0.48 3.01 20.33
Italy 1.87 0.40 3.39 3.21 0.00 0.62 0.42 1.37 0.56 - 0.04 11.88
Czech Republic - 0.13 2.42 1.52 0.00 0.01 0.01 1.84 0.68 0.86 1.54 9.00

51
Homeworking report
51
Figure 23 Average commuting distance by workers, by mode of transport
Domestic energy
When an individual teleworker works from home, they will consume additional energy during the working day when they would otherwise have been in the office, on top of their regular domestic energy consumption that would occur before and after working hours. This additional domestic energy consumption is a well-documented rebound effect resulting from teleworking.40,41
The additional domestic energy consumption accounted for in this analysis encompasses three core aspects:
1. Energy use from home-office equipment such as laptops, lighting and screens,
2. Heating energy consumption,
3. Cooling energy consumption
For this analysis, and the sake of simplicity, it was assumed that on any given day a teleworker was working from home, they were working from home alone, i.e. they did not share energy consumption with others. In reality, particularly during the height of COVID restrictions, teleworkers are in fact likely to share domestic energy consumption on occasion, where either another teleworking member of the household is also working from home, or non-working members or school-aged children are present in the home during the day. This point is an issue of allocation of domestic energy consumption, and for the purpose of keeping this analysis simple, we have assumed that 100% of additional domestic energy consumption is allocated to the single individual teleworker working from home.
0UK Germany Spain Sweden Italy Czech
Republic
5
10
15
20
25
30
35
40
km/d
ay
Walk Bicycle Car (petrol) Car (diesel) Car (other)Car (electric)Motorcycle Bus Rail Subway Other

52
Homeworking report
52
Homeofficeenergy
The additional daily energy consumption resulting from the use of home office equipment by an average teleworker working from home was calculated using the same methodology for all six countries in this analysis. An average teleworker was assumed to consume additional energy when working from home from the following office equipment and domestic appliances:
• Laptop/desktop computer
• Computer monitor screen
• Printer
• Office light
• Kettle
The additional energy consumption per day per teleworker was then calculated for each appliance using the power data and assumptions in Table 7. It is assumed that while working from home, the working day when additional consumption occurs is 8 hours, based on a typical working day from 9:00 to 17:00.
With the additional daily energy consumption from home office equipment per teleworker derived, this figure was then multiplied by a country-specific electricity grid emission factor (see Table 8) to calculate the average additional emissions per day per teleworker when working from home. Finally, this was then multiplied by the number of days per year (by scenario, by country) that a teleworker works from home, to arrive at the final annual additional emissions from home office equipment per teleworker per year under each scenario for each country. This calculation is summarised as follows:
0.873 additional kWh/day × Electricity grid emission factor kgCO2e/kWhby country
× Days per year worked from homeby scenario, by country

53
Homeworking report
53
Homeofficeenergyandpowerassumptions
Emissions of telecommunications in the homeofficesetup:
This study acknowledges that as part of homeworking, teleworkers would perform online work-related activities such as teleconferencing and video calling. However, the additional emissions associated to these activities are not included in the home energy calculations for several reasons:
• Studies have shown that the energy intensity of internet use is not proportional to CPU/data consumption and that the additional carbon footprint of internet activities is negligible.42, 43
• This trend was apparent during the COVID-19 pandemic, when it was shown that increases in global data traffic volumes by 50%, did not result in any significant change to energy consumption during this period.44 This implicates that the energy intensity of internet use per user would not be significant.
• Additionally, it is unclear whether there would be any significant increase in the data usage per teleworker, compared to that of an office worker (as the telecommunications activity and behaviour would be the same)
Emissions of domestic appliances:
• Potential additional electricity consumption from small appliance heating or cooling, such as desk fans or portable electric heaters are not accounted for, as they were deemed to be used by too small a proportion of the population, and have a high degree of variability in use and consumption, to include in this analysis. This assumption is consistent with previous calculations of home energy consumption45.
• Dishwashers and cooking appliances are also not included due to their negligible impact, when accounting for the frequency of use during the working day.46, 47
Notably, the additional energy consumption from teleworker work activities such as video calls, emails and more generally, the increased home internet usage are not accounted for in this study, as they have a minimal impact on emissions of teleworkers compared to office workers.

54
Homeworking report
54
Table 7 Power data and assumptions for home office appliances
Table8 Electricity grid emission factors
Appliance Power Draw (W)
Additional operational time per
day (hours)Assumption & source
Additional energy use (kWh/day)
Laptop/desktop
38.6 W 8 hours Power draw based on weighted average of laptop (22 W) and desktop (85 W) Urban et al. (2017)Weighted by proportion of devices shipped globally (laptops =74%, desktops = 26%). https://www.statista.com/statistics/272595/global-shipments-forecast-for-tablets-laptops-and-desktop-pcs/
0.31
Computer monitor screen
30.0 W 8 hours Assume an average teleworker uses a peripheral screen for working Urban et al. (2017) https://www.researchgate.net/publication/335911295
0.24
Printer 0.5 W 7.9 hours standby0.1 hours printing
Assume an average teleworker prints twice a day, each print takes 2 minutes. Assume printer is on for 8 hours per day, when not printing it is on standby. Standby power draw 2 W, printing power draw 250 W, https://support.hp.com/gb-en/document/c00312638#AbT6
0.03
Office light 15.0 W 8 hours Assume office light on when working from home. https://onlinelibrary.wiley.com/doi/full/10.1111/j.1530-9290.2010.00280.x
0.03
Kettle 0.1 kWh per 3 min boil
6 mins Assume boil a kettle when working from home twice a day
0.20
Total home office setup
0.90
Country Emission factor (kgCO2e/kWh) Source
UK 0.23314 BEIS DEFRA (2020)
Germany 0.4184 IEA (2020)
Spain 0.2825 IEA (2020)
Sweden 0.0144 IEA (2020)
Italy 0.325 IEA (2020)
Czech Republic 0.5186 IEA (2020)

55
Homeworking report
55
Table 9 Emission factors for domestic energy calculation, by source
Emissions Source Unit Emission Factor Source
Natural gas kWh 0.20778
BEIS DEFRA (2020)
District Heating kWh 0.19856
Oil kWh 0.3156
Biomass kWh 0.0342025
Coal kWh 0.39619
Heating energy assumptions
The additional energy consumption resulting from domestic heating by an average teleworker when working from home has been calculated for all six countries in this analysis. Additional domestic heating occurs during heating season days when teleworkers are working from home, where heating energy consumption occurs that would have otherwise not have happened, if teleworkers had been in the office. To account for domestic heating energy consumption, the Carbon Trust analysed average national data across each country in order to reflect an accurate representation of domestic heating consumption in terms of specific heating fuel sources and heating season duration. This analysis also accounted for the average house and room sizes of teleworkers in each country, and the proportion of homes that have the ability through use of thermostats to heat only a single room when working from home as opposed to a whole house.
Accounting for these factors, this analysis has been able to estimate additional domestic heating energy consumption per teleworker specific to each country, reflecting the behaviours and domestic characteristics of each nation. Using this data and assumptions, the average domestic heating consumption per teleworker per day was calculated for each country. The data and assumptions used to calculate the additional heating consumption per average teleworker are summarised in Table 10.
The final calculation of the average annual additional domestic heating emissions per teleworker, by scenario, by country, was then made, using the relevant domestic heating fuel emission factors (see Table 9), multiplied by the additional domestic heating energy per teleworker, and multiplied by the number of days worked from home per teleworker per year (by scenario). The calculation can be summarised as follows:
((kWh.home.dayby emissions source × kgCO2e.kWhby emissions source) × (1-% households with ability to heat single rooms)) + ((kWh.room.dayby emissions source × kgCO2e.kWhby emissions source)) × (% households with ability to heat single rooms))

56
Homeworking report
56
Table 10 Domestic heating energy sources and assumptions
UK Germany Spain Sweden Italy Czech Republic
Heating emissions sources
Gas GasOilDistrict Heating
GasOilBiomass
Electric heatingDistrict heatingBiomass
GasOilBiomass
Gas CoalHeat Biomass
kWh/home/year consumption
Gas: 8,000 kWh(OFGEM Typical Domestic Consumption Values)
Gas: 9,080 kWh (sat1.de)Oil: 25,008 kWh (bmwi.de)District Heating: 9,166 kWh (bmwi.de)
Gas: 1,163 kWhOil: 1,101 kWhBiomass: 1,748 kWh(0.345 ToE)(Odysee-mure.eu)
Electric heating: 3,810 kWhDistrict heating: 6,514 kWhBiomass: 2,341 kWh(energimyndigheten.se)
Gas: 7,629 kWhOil: 404.6 kWhBiomass: 2,931 kWh(EuroStat)
Gas: 2,905 kWh Coal: 2,108 kWh Heat: 1,581 kWh Biomass: 4,463 kWh (EU Buildings datamapper)
Consumption assumptions
77% of domestic gas consumption is used for heating
(UK Gov)
Proportion of homes heated, by emission source:
Gas: 52.1%, Oil: 23.5%, District Heating 24.4%
(destatis.de)
Proportion of homes heated, by emission source:
Gas: 29%Oil: 27%Biomass: 44%
(Statista)
Proportion of homes heated, by emission source:
Electric heating: 27%District heating: 58%Biomass: 16%
(energimyndigheten.se)
Proportion of homes heated, by emission source:
Gas: 62%Oil: 8%Biomass: 30%
(EuroStat)
Proportion of homes heated, by emission source:
Gas: 26%Coal: 19%Heat: 14%Biomass: 40%
(EuroStat)
Heating season days per year
183(UK Gov)
183(Mietrecht.com)
195(contadorscalsilla.com)
18348
(en.climate-data.org)148(thelocal.it)
183(climatechange post.com)
Typical hours of heating per day
8 hours discovery.ucl.ac.uk
Average hours heating per year
1,464=183 x 8
1,464=183 x 8
1,560=195 x 8
1,464=183 x 8
1,185=148 x 8
1,464=183 x 8
Additional hours of heating per day
4 hours (assuming timings 09:00-11:00 & 15:00 to 17:00 during working day)
% households with ability to control heating in single rooms
30%(UK Gov)
30%(UK Gov)
49%(ine.es)
30%(UK Gov)
30%(UK Gov)
30%(UK Gov)
Average size of house (m2)
89.8(ONS)
91.9(destatis)
94.2(ine.es)
91.5(scb.se)
94.2(odyssee-mure.eu)
73.0(vdb.czso.cz)
Average size of room (m2)
14.9(LABC)
12.0(Fertighaus.de)
19.36(ine.es)
27.65(scb.se)
22.50(odyssee-mure.eu)
22.74(vdb.czso.cz)

57
Homeworking report
57
Table 11 Domestic cooling energy sources and assumptions
Assumptions UK Germany Spain Sweden Italy Czech Republic
Percentage of homes with air conditioning
0.72%49 0.22%50
(green-cooling-initiative.org)
35.5%(https://www.ine.
es/)
0.81%51
(green-cooling-initiative.org)
29.4%(istat.it)
0.51%52
(green-cooling-initiative.org)
Average AC kWh/hr2.45
Average based on central and wall mounted AC(https://blog.arcadia.com/much-electricity-air-conditioner-uses)
Cooling days per year183
(Assumption: cooling season Europe is April-September (climatechangepost.com)
Proportion of days per year in cooling season 183/365 = 50%
Additional hours of cooling per day when working from home
4 hours
Cooling energy assumptions
The additional energy consumption resulting from the use of domestic cooling by an average teleworker working from home was calculated for each country. In northern European countries such as UK, Germany, Sweden and Czech Republic, the use of domestic cooling is relatively uncommon in households. In the absence of accurate data for these countries, UK data from Mintel Report, 2008 is used as proxy. The percentage of households with AC in each country is extrapolated out to 2020, based on
the projected increase in AC demands in each country, using unitary AC figures and per capita estimates from the Green Cooling initiative. The assumptions used to calculate the additional cooling energy consumption per teleworker per year, for each scenario is outlined in Table 11.
The additional cooling energy consumption per year per teleworker was then calculated for each COVID scenario for Italy and Spain, the calculation is summarised as follows:
(Average AC kW/hr ×4 hours per day) × (Number of days worked from homeby scenario, by country × 50% cooling season days per year)

58
Homeworking report
58
Officeenergy
The average annual avoided office-related carbon emissions per teleworker were calculated for each country under each scenario. These average annual savings represent the average carbon emissions per teleworker that would have been emitted over a year-long period if the average teleworker had worked in the office, rather than worked from home. The avoided office-related energy consumption and associated carbon emissions savings were calculated by analysing average national buildings and office energy consumption data, statistics and literature.
To allocate the additional avoided office-related energy consumption on a per office worker/teleworker basis, the analysis needed to account for three core aspects:
1. Energy use from offices, by emission source
2. Average office workstation size (m2)
3. Rate of desk utilisation (%)53
These data and assumptions were then used to calculate the average additional avoided office energy consumption (by emissions source) on the basis of kgCO2e avoided/teleworker/day. The energy consumption of offices and average workstation sizes was used to allocate energy on a kWh/workstation/day basis. This was then analysed against the average desk utilisation rate. The rate of desk utilisation changed according to the COVID scenario, to reflect the changing working patterns experienced during the pandemic. Desk utilisation helped to capture the emissions per occupied workstation year (kgCO2e/occupied workstation/day). Desk utilisation rate reflects the average time that a desk is occupied by an office worker. This enabled emissions to be calculated for office workers, accounting for the period where the desk is in use. Finally, this value was then multiplied by the number of days per year (by scenario, by country) that a teleworker works from home, to arrive at the final annual additional office energy avoided per teleworker. This calculation is summarised as follows:
The avoided office energy consumption per day per teleworker was calculated for each country using the following office energy, workstation size and desk utilisation assumptions in Table 12.
Avoided office emissions per teleworker kgCO2e⁄year =Average office emissions per workstation per day
(average desk utilisation rate (%)
average number of days worked from home by a teleworker per year
×

59
Homeworking report
59
Table 12 Assumptions to calculate avoided office energy consumption per day per teleworker
Assumptions UK Germany Spain Sweden Italy Czech Rep.
Emissions sources considered
GasElectricity
(Better Buildings Partnership)
GasElectricity
(EU buildings data mapper)
GasElectricity
(Gangolells et al., 2019)
GasElectricity
District heating(Swedish energy
agency)
GasElectricity
(EU buildings data mapper)
GasElectricity
(EU buildings data mapper)
Workstation size (m2)
10.43(bco.org.uk)
13.60(deskmag.com/
de) (haufe.de) (dw.com)
12.50(elconfidencial.
com)
9.00(lokalguiden.se)
(av.se)
12.50(elconfidencial.
com)
10.00(conbiz.eu)
Desk utilisation rate (%): Pre-COVID54
68(theworkspaceconsultants.com)
Desk utilisation rate (%): During-COVID55
42(theworkspaceco nsultants.com)(https://trading
economics.com/)
56(theworkspacec onsultants.com)(https://trading
economics.com/)
59(theworkspacec onsultants.com)(https://trading
economics.com/)
61(theworkspacec onsultants.com)(https://trading
economics.com/)
55(theworkspacec onsultants.com)(https://trading
economics.com/)
54(theworkspacec onsultants.com)(https://trading
economics.com/)
Desk utilisation rate (%): Post-COVID 202156
60(theworkspaceco nsultants.com)(https://trading
economics.com/)
67(theworkspacec onsultants.com)(https://trading
economics.com/)
66(theworkspacec onsultants.com)(https://trading
economics.com/)
67(theworkspacec onsultants.com)(https://trading
economics.com/)
66(theworkspacec onsultants.com)(https://trading
economics.com/)
65(theworkspacec onsultants.com)(https://trading
economics.com/)
Desk utilisation rate (%): Post-COVID 2022+57
68(theworkspaceconsultants.com)
Officeassumptions&sources

60
Homeworking report
60
Case study analysis
This analysis assessed the variability in daily teleworker savings when working from home compared to working in the office, across different case study scenarios. For each case study, specific parameters and assumptions were chosen to reflect the different circumstances and behaviours of teleworkers, across two countries, Spain and Germany, and how that can significantly impact their overall emissions footprint. The three parameters assessed were as follows:
• Seasonality (Winter vs Summer)
• Mode of transport (car vs train)
• Regional location (rural vs urban)
For each case study, the teleworker emissions methodology is consistent with the assumptions used for previous calculations such as average teleworking frequency and population data. However, specific assumptions for each parameter were chosen, to reflect a modified circumstance of teleworkers. These are defined in each case study (see below). The key parameters and assumption used for each case study are outlined below in Table 13 and Table 14.
Case study 1 – Seasonality and mode of transport
For case study 1, four scenarios were evaluated to reflect the different seasonal and commuting environments of teleworkers across the two countries. In particular, the average commute distance for each country remained constant, while the hours of heating and cooling was changed to reflect seasonality. Additionally, the mode of transport varied to reflect the differing impact of commuting emissions.
Case study 2 – Rural vs. Urban
For case study 2, four scenarios were evaluated to reflect the regional variation in commuting patterns of teleworkers across the two countries. Specifically, it was assumed that rural workers commute a substantially greater distance, often by car, compared to urban teleworkers who would commute a shorter distance and often by public transport e.g. train. This is to reflect regional difference of teleworkers, while, the hours of heating and cooling were changed to reflect seasonality. Notably, this case study does not reflect the difference in fuel mix for each country and how this may impact the transport emission factors (kgCO2e/km) by mode of transport, for commuting teleworkers.
Case study 1 parameters
Table 13 Parameters and assumptions used for case study 1
Country Germany Spain
ScenarioCar in Winter
Car in Summer
Train in Winter
Train in Summer
Car in Winter
Car in Summer
Train in Winter
Train in Summer
Hours of heating (hr) 8 0 8 0 8 0 8 0
Hours of cooling (hr) 0 4 0 4 0 8 0 8
Mode of transport emission factor (kgCO2e/km)
0.22 0.04 0.22 0.04

61
Homeworking report
61
Case study 2 parameters
Table 14 Parameters and assumptions used for case study 2
Country Germany Spain
ScenarioRural
worker in Winter
Rural worker in Summer
Urban worker in
Winter
Urban worker in Summer
Rural worker in
Winter
Rural worker in Summer
Urban worker in
Winter
Urban worker in Summer
Hours of heating (hr) 8 0 8 0 8 0 8 0
Hours of cooling (hr) 0 4 0 4 0 8 0 8
Average commuting distance (km) 40 20 40 20
Mode of transport emission factor (kgCO2e/km)
0.22 0.04 0.22 0.04

62
Homeworking report
62
Appendix 2: Changes in homeworking patterns during and post COVID
The results of the Carbon Trust’s analysis of publicly available data sources and national statistics provide an indication of the levels, in terms of frequency, of teleworking across the six European nations: UK, Germany, Spain, Sweden, Italy and the Czech Republic. The frequency of teleworking is represented by the average
number of days per week that a teleworker works from home. Results of average teleworking frequency are presented for each of the four COVID scenarios. Table 15 shows the key data sources used for calculations of teleworking frequency per week per country, by each scenario.
* Carbon Trust estimated that the future frequency of homeworking will be somewhere in between pre- and during- COVID levels (an average of pre-COVID & during-COVID frequencies), sense-checked against McKinsey (2021).
†Carbon Trust estimated that the frequency of days WFH per week will decrease by 11% compared to post-COVID 2021 frequency, using Upwork (2020) proportional change in teleworking as a proxy for teleworking frequency.
Table 15 Teleworking frequency sources per country, by scenario
Scenario UK Germany Spain Sweden Italy Czech Rep.
Pre-COVID
Felstead, A., & Reuschke, D.,
2020(link)
UK Data service, 2020(link)
deloitte.com/de EuroStat EuroStat statista.com EuroStat
During COVID
Felstead, A., & Reuschke, D.
(2020)(link)
bitkom.org aimc.es scb.seblog.
osservatori.net/it
zivotbehem pandemie.cz
Post-COVID (2021) McKinsey (2021)*
Post-COVID (2022+) Upwork (2020)†

63
Homeworking report
63
Before the coronavirus pandemic the average frequency of homeworking amongst teleworkers across all six countries is shown in Figure 24. The average frequency of homeworking amongst teleworkers was highest in the Czech Republic (2.7 days), with a similar average frequency in the UK (2.6 days), Germany (2.5 days), and Spain (2.6 days), also just below the three days a week mark. Both Sweden (1.9 days) and Italy (1.6 days) returned the lowest average number of days per week worked from home by teleworkers before the COVID pandemic, under two days per week.
0
1.0
2.0
3.0
Aver
age
num
ber o
f day
s pe
r wee
k
wor
ked
from
hom
e/te
lew
orke
r
GermanyUK
Spain
SwedenIta
ly
Czech
Republic
2.6 2.6
1.91.6
2.72.52.5 2.7
2.6
1.9
1.62.6
Figure 24 The average number of days worked from home by teleworker, pre-COVID, by country

64
Homeworking report
64
Figure 25 illustrates the regional variability in teleworking during the COVID pandemic. This shows the significant increase in teleworking compared to the pre-COVID scenario for all
countries, although with different increases per country. This reflects the varied nature of teleworking across Europe during the pandemic.58
The response of teleworking patterns to COVID varies by country
While all six countries analysed have seen an increase in the homeworking frequency of teleworkers, there is again significant regional variability in this increase from before to during the pandemic (Figure 25).
The UK has shown the greatest increase in days per week worked from home by teleworkers by 1.6 days per week, to 4.2 days per week overall during the COVID-19 pandemic lockdown. Germany meanwhile, whilst previously having one of the highest homeworking frequencies, saw the smallest increase during the lockdown restrictions,
of just 0.9 days, to 3.5 days per week during COVID. The during COVID trend of homeworking frequency results show a different regional pattern compared to before the pandemic.
Finally, this analysis also looked at the potential future frequency of homeworking amongst teleworkers in both a short term (post-COVID 2021) and longer term (post-COVID 2022+) scenario. It must be noted that the results of these scenarios, especially the frequency of homeworking, are based on potential future trends from research literature and studies, and are inherently highly uncertain. They represent only one potential future scenario that may or may not play out in the coming years.
Aver
age
num
ber o
f day
s pe
r wee
k
wor
ked
from
hom
e/te
lew
orke
r
GermanyUK
Spain
SwedenIta
ly
Czech
Republic
4.23.6 3.4
2.7
4.03.5 3.5 4.0
4.2
3.4
2.73.60
1.0
1.0
1.5
2.0
2.5
3.0
3.5
4.0
4.5
Figure 25 Average number of days per week worked from home by teleworkers During COVID

65
Homeworking report
65
Figure 26 shows the change in teleworking frequency for countries in post-COVID scenarios of 2021 and 2022+.
At the time of writing it was projected that EU societies would move out of lockdown restrictions in mid/late 2021.
Figure 26 indicates that all countries will experience a reduction in homeworking frequency by teleworkers compared to the during-COVID scenario. Notably, The UK and Czech Republic continue to have highest frequencies of homeworking by teleworkers, at 3.4 and 3.3 days per week on average, while Sweden and Italy have the lowest weekly frequencies, but have seen an increase on pre-COVID levels nonetheless.
This trend follows the assumption that teleworkers will begin to return to the office on an increased basis as restrictions are relaxed. However, this scenario reflects that the COVID-19 pandemic has had a more profound and lasting impact on teleworking behaviour, for both those who teleworked before the pandemic or those newly accustomed to it. This is shown by the frequency of teleworking for 2021 and 2022+ dropping lower than during-COVID levels but remaining significantly higher than pre-COVID levels. This is
reflective of the fact that more workers and jobs have adapted to teleworking conditions, and that it will remain a significant part of people’s working lives in the future, as projected by various studies.59, 60
In the longer-term post-COVID (2022+) scenario, once all restrictions have been lifted, the modelled scenario suggests that homeworking frequencies of teleworkers will continue to decrease from during-COVID and post-COVID 2021 levels, however, still remaining above pre-COVID levels. This scenario reflects the assumption that while homeworking decreases as more teleworkers revert back to spending more of their average working week in the office, the heightened homeworking legacy of the COVID pandemic has continued to leave a lasting impact on teleworker patterns and has become a more embedded and accepted way of working.
Figure 26 Average number of days per week worked from home by teleworkers Post-COVID (2021 & 2022+)
Aver
age
num
ber o
f day
s pe
r wee
k w
orke
d fro
m h
ome/
tele
wor
ker
0.5
0
1.0
1.5
2.0
2.5
3.0
3.5
UK Germany Spain Sweden Italy Czech Republic
4.0
3.43.0 3.0
2.73.1
2.8 2.6 2.42.1 1.9
3.33.0
Average number of days per week worked from home by teleworkers Post-COVID (2021)
Average number of days per week worked from home by teleworkers Post-COVID (2022+)

66
Homeworking report
66
Figure 27 illustrates the development of the average weekly frequency of homeworking by teleworkers for each country across the four scenarios. From these modelled scenario results, it is evident that based on our current understanding of homeworking patterns, all countries across this analysis have followed a similar pattern of homeworking frequency. Average teleworking frequencies have moved from a relatively low pre-COVID level to a peak during COVID, followed by a reduction in homeworking frequency in the short-term post-COVID scenario, continuing to decrease in the longer-term scenario, but remaining higher than pre-COVID levels.
Change in total teleworking population during the COVID-19 pandemic
This analysis has also assessed the changing structure of the working populations of each country, and the impact of COVID on the teleworking population (Figure 28). Before the COVID pandemic and lockdown restrictions were in place, teleworkers represented a minority of workers in the working population, outweighed by non-teleworkers. However, this proportion varied substantially between countries. The UK and Germany had the lowest proportions of teleworkers in their working populations, pre-COVID, while Sweden had the highest proportion of teleworkers prior to the COVID pandemic.
Figure 27 Average number of days per week worked from home by teleworkers across all COVID scenarios
Average number of days per week worked from home by teleworkers Pre-COVID
Average number of days per week worked from home by teleworkers Post-COVID (2021)
Average number of days per week worked from home by teleworkers During-COVID
Average number of days per week worked from home by teleworkers Post-COVID (2022+)
0
0.5
1
1.5
2
2.5
3
3.5
4
4.5
Aver
age
num
ber o
f day
s pe
r wee
k w
orke
d fro
m h
ome/
tele
wor
ker
UK Germany Spain Sweden Italy Czech Republic
2.6
4.2
3.4
3.0
2.5
3.5
3.0
2.6
3.6
3.12.8
1.9
3.4
2.62.4
1.6
2.7
2.11.9
2.7
4.0
3.33.0
2.7

67
Homeworking report
67
Figure28 Teleworkers as a proportion of working population, pre vs. during COVID
The COVID pandemic has had a clear impact on the proportion of teleworkers in the working population across these European countries. All countries except Sweden, have seen a significant increase in the proportion of teleworkers in the working population during COVID. This shift in teleworking populations is an expected result of national lockdown restrictions across European countries, that forced and encouraged more workers to adopt teleworking during the pandemic.61, 62 Against the trend of the other countries, Sweden shows a very small reduction in the proportion of teleworkers, which is likely reflective of both the impact of COVID on its national job market, as well as the Swedish government adopting less restrictive lockdown measures and rules around working patterns during the pandemic, compared to other European countries.63
Projecting the future teleworking population, on the other side of the pandemic, is highly uncertain, therefore this analysis has not attempted to project the future scenarios in detail for each country. However, what the results of this analysis and studies on the future of homeworking tells us is that the population of teleworkers is likely to grow significantly in the long-term, building upon the growth of teleworking populations during COVID-19.64, 65, 66 Some estimates suggest that by 2022, 34% of the working population may be permanent remote workers, with an additional proportion of workers being teleworkers who telework intermittently.67 With such an increase in the future, this would result in a much more significant proportion of the working population being classed as general teleworkers than pre or during COVID levels.
Prop
ortio
n of
tele
wor
kers
in w
orki
ng p
opul
atio
n (%
)
0%
10%
20%
30%
40%
50%
60%
UK Germany Spain Sweden Italy Czech Republic
Pre COVID During COVID
14% 12%
29%
52%
37% 37%
25%
53%
30%
45%47%41%

68
Homeworking report
68
Appendix 3: Supplementary charts and tables
Table 16 Total average annual carbon savings per teleworker, by scenario, by country (kgCO2e/teleworker/year), and the average number of days per week worked from home by a teleworker
Scenario UK Germany Spain Sweden Italy Czech Rep.
Total carbon saving per teleworker: Pre-COVID (kgCO2e/teleworker/year)
272 663 563 124 876 75
Average days per week worked from home Pre-COVID 2.6 2.5 2.6 1.9 1.6 2.7
Total carbon saving per teleworker: During-COVID (kgCO2e/teleworker/year)
889 1,144 890 243 1,861 270
Average days per week worked from home during COVID 4.2 3.5 3.6 3.4 2.7 4.0
Total carbon saving per teleworker: Post-COVID (2021) (kgCO2e/teleworker/year)
429 801 689 175 1,215 117
Average days per week worked from home Post-COVID (2021) 3.4 3.0 3.1 2.6 2.1 3.3
Total carbon saving per teleworker: Post-COVID (2022+) (kgCO2e/teleworker/year)
273 700 599 117 1,055 84
Average days per week worked from home Post-COVID (2022+) 3.0 2.7 2.8 2.4 1.9 3.0
Total teleworker carbon savings

69
Homeworking report
69
Table 17 Average potential carbon impacts (kgCO2e) per teleworker from commuting, office and domestic-related emis-sions, and the average potential carbon savings per teleworker, by country, by scenario
Scenario Measure UK Germany Spain Sweden Italy Czech Rep.
Pre- COVID
Commuting emissions 162 579 193 434 271 154
Avoided commuting emissions -174 -598 -213 -265 -127 -174
Additional domestic energy-related emissions 336 727 196 252 203 513
Avoided office-related emissions -435 -792 -546 -111 -951 -414
Total carbon saving per teleworker: Pre-COVID 272 663 563 124 876 75
During-COVID
Commuting emissions 54 364 113 219 183 65
Avoided commuting emissions -282 -813 -294 -474 -215 -263
Additional domestic energy-related emissions 545 988 270 451 342 776
Avoided office-related emissions -1,153 -1,320 -867 -220 -1,988 -784
Total carbon saving per teleworker: During-COVID 889 1,144 890 243 1,861 270
Post-COVID (2021)
Commuting emissions 108 471 153 330 227 110
Avoided commuting emissions -228 -706 -253 -369 -171 -218
Additional domestic energy-related emissions 441 858 233 351 273 645
Avoided office-related emissions -642 -953 -668 -157 -1,317 -544
Total carbon saving per teleworker: Post-COVID (2021) 429 801 689 175 1,215 117
Post-COVID (2022+)
Commuting emissions 132 545 180 369 245 132
Avoided commuting emissions -204 -632 -227 -331 -153 -195
Additional domestic energy-related emissions 441 768 209 351 244 577
Avoided office-related emissions -510 -837 -581 -138 -1,145 -466
Total carbon saving per teleworker: Post-COVID (2022+) 273 700 599 117 1,055 84
Teleworker carbon savings by component

70
Homeworking report
kgCO
2e/t
elew
orke
r/yr
-204
-510
441
-632-837
768
-227
-581
209
-331
-138
351
-153
-1,145
244
-195
-466
577
0
Post-COVID (2022+) avoided commuting emissions
Post-COVID (2022+) additional domestic energy-related emissions
Post-COVID (2022+) avoided office-related emissions
Germany
Spain
SwedenIta
ly
Czech
RepublicUK
70
Figure 29 Balancing of commuting, office and domestic emissions, by teleworker, by year
During-COVID avoided commuting emissions
During-COVID additional domestic energy-related emissions
During-COVID avoided office-related emissions
kgCO
2e/t
elew
orke
r/yr
-174
-435
336
-598
-729
727
-213
-546
196
-265
-111
252
-127
-951
203
-174
-414
513
0
200
400
600
800
1,000
-200
-400
-600
-800
-1,200
-1,000
Pre-COVID avoided commuting emissions
Pre-COVID additional domestic energy-related emissions
Pre-COVID avoided office-related emissions
Germany
Spain
SwedenIta
ly
Czech
RepublicUK
kgCO
2e/t
elew
orke
r/yr
-282
-1,153
545
-813
-1,320
988
-294
-867
270
-474-220
451
-215
-1,988
342
-263
-784
776
0
500
1,000
-500
--1,000
-1,500
-2,000
-2,500
1,500
Germany
Spain
SwedenIta
ly
Czech
RepublicUK
kgCO
2e/t
elew
orke
r/yr
-228
-642
441
-706
-953
858
-253
-668
233
-369
-157
351
-171
-1,317
273
-218
-544
645
0
-1,500
Post-COVID (2021) avoided commuting emissions
Post-COVID (2021) additional domestic energy-related emissions
Post-COVID (2021) avoided office-related emissions
Germany
Spain
SwedenIta
ly
Czech
RepublicUK
-1,000
-500
500
1,000 1,000
-500
-1,000
-1,500
500
0

71
Homeworking report
71
Figure 30 Office emissions savings per teleworker by country and scenario
Table18 Proportion of commuting and office enabled avoided emissions, per country, per scenario
% of enabled avoided emissions /teleworker/year UK Germany Spain Sweden Italy Czech Rep.
Pre-COVIDOffice 71% 57% 72% 29% 88% 70%
Commuting 29% 43% 28% 71% 12% 30%
During COVIDOffice 80% 62% 75% 32% 90% 75%
Commuting 20% 38% 25% 68% 10% 25%
Post-COVID (2021)
Office 74% 57% 73% 30% 88% 71%
Commuting 26% 43% 27% 70% 12% 29%
Post-COVID (2022+)
Office 71% 57% 72% 29% 88% 70%
Commuting 29% 43% 28% 71% 12% 30%
Enabled avoided emissions of teleworkers
kgCO
2e/t
elew
orke
r/ye
ar
-1,500
-2,000
-1,000
-500
0UK Germany Spain Sweden Italy Czech Republic
-2,500
-435
-642-510
-792
-953-837
-546
-867
-668-581
-111-220
-157-138
-951
-1,988
-1,317
-1,145
-414
-784
-544-466
-1,320
-1,153
Pre-COVID During COVID Post-COVID (2021) Post-COVID (2022)

72
Homeworking report
Case study 1: German & Spanish average teleworkers daily emissions scenario analysis – Car vs. Train, Winter vs. Summer
Table 19 Key assumptions and calculated emissions savings for a German teleworker in case study 1, across four scenarios
Table 20 Key assumptions and calculated emissions savings for a Spanish teleworker in case study 1, across four scenarios
Scenario 1: German teleworker, commuting by car during the winter
Scenario 2: German teleworker, commuting by car during the summer
Scenario 3: German teleworker, commuting by train
during the winter
Scenario 4: German teleworker, commuting by train during the summer
Working from home
Working from office
Working from home
Working from office
Working from home
Working from office
Working from home
Working from office
Commuting emissions – 7.29 – 7.29 – 1.49 – 1.49
Domestic emissions 12.71 – 4.47 – 12.71 – 4.47 –
Office emissions – 5.97 – 3.62 – 5.97 – 3.62
Total emissions (kgCO2e/day) 12.71 13.26 4.47 10.90 12.71 7.47 4.47 5.11
Teleworker Saving (kgCO2e/day) 0.55 6.44 -5.24 0.65
Scenario 5: Spain teleworker, commuting by car during the winter
Scenario 6: Spain teleworker, commuting by car during the summer
Scenario 7: Spain teleworker,
commuting by train during the winter
Scenario8: Spain teleworker,
commuting by train during the summer
Working from home
Working from office
Working from home
Working from office
Working from home
Working from office
Working from home
Working from office
Commuting emissions – 2.84 – 2.84 – 0.58 – 0.58
Domestic emissions 2.29 – 5.78 – 2.29 – 5.78 –
Office emissions – 3.83 – 2.91 – 3.83 – 2.91
Total emissions (kgCO2e/day) 2.29 6.67 5.78 5.75 2.29 4.41 5.78 3.49
Teleworker Saving (kgCO2e/day) 4.38 -0.03 2.12 -2.29

73
Homeworking report
Case study 2: German & Spanish typical teleworkers daily emissions scenario analysis. Rural vs Urban, Winter vs. Summer
Table 21 Key assumptions and calculated emissions savings for a German teleworker in case study 2, across the four scenarios
Table 22 Key assumptions and calculated emissions savings for a Spanish teleworker in case study 2, across the four scenarios
Scenario 1: German rural teleworker,
commuting by car during the winter
Scenario 2: German rural teleworker,
commuting by car during the summer
Scenario 3: German urban teleworker,
commuting by train during the winter
Scenario 4: German urban teleworker,
commuting by train during the summer
Working from home
Working from office
Working from home
Working from office
Working from home
Working from office
Working from home
Working from office
Commuting emissions – 8.62 – 8.62 – 0.88 – 1.49
Domestic emissions 12.71 – 4.47 – 12.71 – 4.47 –
Office emissions – 5.97 – 3.62 – 5.97 – 3.62
Total emissions (kgCO2e/day) 12.71 14.60 4.47 12.24 12.71 6.86 4.47 4.50
Teleworker Saving (kgCO2e/day) 1.89 7.78 -5.85 0.04
Scenario 5: Spain rural teleworker,
commuting by car during the winter
Scenario 6: Spain rural teleworker,
commuting by car during the summer
Scenario 7: Spain urban teleworker,
commuting by train during the winter
Scenario8:Spainurban teleworker,
commuting by train during the summer
Working from home
Working from office
Working from home
Working from office
Working from home
Working from office
Working from home
Working from office
Commuting emissions – 8.62 – 8.62 – 0.88 – 0.88
Domestic emissions 2.29 – 5.78 – 2.29 – 5.78 –
Office emissions – 3.83 – 2.91 – 3.83 – 2.91
Total emissions (kgCO2e/day) 2.29 12.45 5.78 11.53 2.29 4.71 5.78 3.80
Teleworker Saving (kgCO2e/day) 10.17 5.75 2.43 -1.99

74
Homeworking report
Table 23 Desk utilisation rate in post COVID (2022+) scenario at the current projected trajectory, compared to the sensi-tivity analysis scenario outlined above
Table 24 Total carbon saving per teleworker per year, by country in a post COVID (2022+) scenario with increased office rationalisation
UK Germany Spain Sweden Italy Czech Rep.
Post-COVID (2022+) – Current future trajectory 68% (European average peak desk utilisation rates)
Post-COVID (2022+) – Sensitivity scenario 90% (Sensitivity scenario if office rationalisation occurs)
UK Germany Spain Sweden Italy Czech Rep.
Post-COVID (2022+)
Desk utilisation 90% carbon saving (kgCO2e/teleworker/year)
149 496 457 83 775 -28
Post-COVID (2022+)
Desk utilisation typical average carbon saving(kgCO2e/teleworker/year)
273 700 599 117 1,055 84
Post-COVID (2022+) Variance -46% -29% -24% -29% -27% -134%
Sensitivity analysis

75
Homeworking report
Table 25 Assumptions and sources used to calculate the number of potential teleworkable jobs and the average frequen-cy of homeworking when teleworking, by country.
UK Germany Spain Sweden Italy Czech Rep.
Total number of working employees during COVID-19
32,534,523ons.gov.uk(Table A02)
44,792,000destatis.de
19,176,900ine.es
5,061,700statistikdatabasen.scb.se
22,863,000dati.istat.it
5,383,600vdb.czso.cz
Proportion of Teleworkable jobs (%)
47%68
39%EuroFound,
2020b(LFS,
COVID-19 working group)
34%EuroFound,
2020b(LFS,
COVID-19 working group)
42%EuroFound,
2020b(LFS,
COVID-19 working group)
36%EuroFound,
2020b(LFS,
COVID-19 working group)
32%EuroFound,
2020b(LFS,
COVID-19 working group)
Total number of potential teleworkable jobs
15,161,088 17,468,880 6,520,146 2,125,914 8,230,680 1,722,752
Teleworking Frequency (No. days per week WFH) Post COVID (2022+)
3.0 2.7 2.8 2.4 1.9 3.0
Average carbon saving per year per teleworker (kgCO2e/year) Post COVID (2022+)
273 700 599 117 1,055 84
Teleworking populations, teleworkable jobs and future carbon savings
Figure 31 Proportion of teleworkable jobs per country
0%
5%
10%
15%
25%
30%
35%
40%
45%
50%
20%
UK Germany Spain Sweden Italy Czech Republic
Prop
ortio
n of
tele
wor
kabl
e jo
bs (%
)

76
Homeworking report
Table 26 Assumptions and sources used to calculate the reduction in office emissions, by Vodafone office.
Vodafone Office Newbury Dusseldorf Madrid Milan Prague
Office energy consumption (kWh/m2) 268 264 165* 402 312
Number of employees 5,025 4,650 2,486** 1,877 1,381
Vodafoneofficedata
* Average energy consumption across all Vodafone Spain offices, not specified for the Madrid office
** Madrid office data
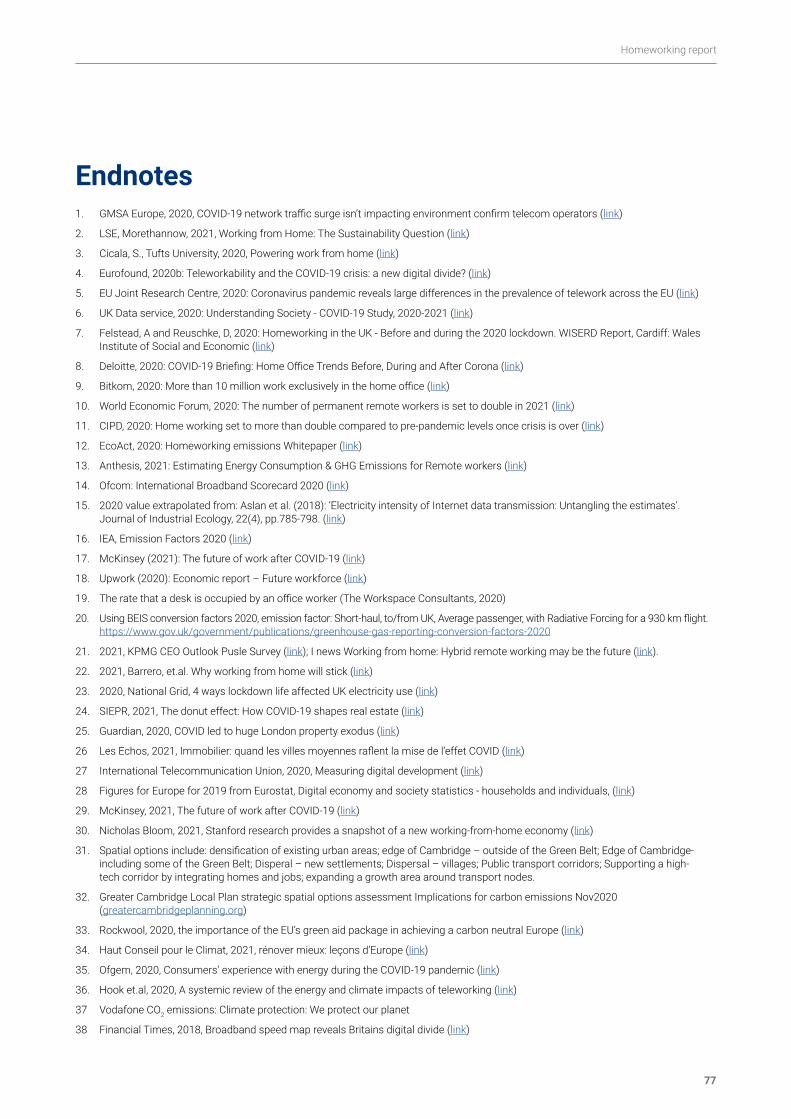
77
Homeworking report
1. GMSA Europe, 2020, COVID-19 network traffic surge isn’t impacting environment confirm telecom operators (link)
2. LSE, Morethannow, 2021, Working from Home: The Sustainability Question (link)
3. Cicala, S., Tufts University, 2020, Powering work from home (link)
4. Eurofound, 2020b: Teleworkability and the COVID-19 crisis: a new digital divide? (link)
5. EU Joint Research Centre, 2020: Coronavirus pandemic reveals large differences in the prevalence of telework across the EU (link)
6. UK Data service, 2020: Understanding Society - COVID-19 Study, 2020-2021 (link)
7. Felstead, A and Reuschke, D, 2020: Homeworking in the UK - Before and during the 2020 lockdown. WISERD Report, Cardiff: Wales Institute of Social and Economic (link)
8. Deloitte, 2020: COVID-19 Briefing: Home Office Trends Before, During and After Corona (link)
9. Bitkom, 2020: More than 10 million work exclusively in the home office (link)
10. World Economic Forum, 2020: The number of permanent remote workers is set to double in 2021 (link)
11. CIPD, 2020: Home working set to more than double compared to pre-pandemic levels once crisis is over (link)
12. EcoAct, 2020: Homeworking emissions Whitepaper (link)
13. Anthesis, 2021: Estimating Energy Consumption & GHG Emissions for Remote workers (link)
14. Ofcom: International Broadband Scorecard 2020 (link)
15. 2020 value extrapolated from: Aslan et al. (2018): ‘Electricity intensity of Internet data transmission: Untangling the estimates’. Journal of Industrial Ecology, 22(4), pp.785-798. (link)
16. IEA, Emission Factors 2020 (link)
17. McKinsey (2021): The future of work after COVID-19 (link)
18. Upwork (2020): Economic report – Future workforce (link)
19. The rate that a desk is occupied by an office worker (The Workspace Consultants, 2020)
20. Using BEIS conversion factors 2020, emission factor: Short-haul, to/from UK, Average passenger, with Radiative Forcing for a 930 km flight. https://www.gov.uk/government/publications/greenhouse-gas-reporting-conversion-factors-2020
21. 2021, KPMG CEO Outlook Pusle Survey (link); I news Working from home: Hybrid remote working may be the future (link).
22. 2021, Barrero, et.al. Why working from home will stick (link)
23. 2020, National Grid, 4 ways lockdown life affected UK electricity use (link)
24. SIEPR, 2021, The donut effect: How COVID-19 shapes real estate (link)
25. Guardian, 2020, COVID led to huge London property exodus (link)
26 Les Echos, 2021, Immobilier: quand les villes moyennes raflent la mise de l’effet COVID (link)
27 International Telecommunication Union, 2020, Measuring digital development (link)
28 Figures for Europe for 2019 from Eurostat, Digital economy and society statistics - households and individuals, (link)
29. McKinsey, 2021, The future of work after COVID-19 (link)
30. Nicholas Bloom, 2021, Stanford research provides a snapshot of a new working-from-home economy (link)
31. Spatial options include: densification of existing urban areas; edge of Cambridge – outside of the Green Belt; Edge of Cambridge- including some of the Green Belt; Disperal – new settlements; Dispersal – villages; Public transport corridors; Supporting a high-tech corridor by integrating homes and jobs; expanding a growth area around transport nodes.
32. Greater Cambridge Local Plan strategic spatial options assessment Implications for carbon emissions Nov2020 (greatercambridgeplanning.org)
33. Rockwool, 2020, the importance of the EU’s green aid package in achieving a carbon neutral Europe (link)
34. Haut Conseil pour le Climat, 2021, rénover mieux: leçons d’Europe (link)
35. Ofgem, 2020, Consumers’ experience with energy during the COVID-19 pandemic (link)
36. Hook et.al, 2020, A systemic review of the energy and climate impacts of teleworking (link)
37 Vodafone CO2 emissions: Climate protection: We protect our planet
38 Financial Times, 2018, Broadband speed map reveals Britains digital divide (link)
Endnotes

78
Homeworking report
39. Used UK data of registered motorbikes as a proxy for Spain
40. Ecoact, 2020: Homeworking emissions whitepaper (link)
41. Mission Innovation, 2020: Module 2, The Avoided Emissions Framework (link)
42. Malmodin, J., 2020a: The ICT sector’s carbon footprint. Presentation at the techUK conference in London Tech Week on ‘Decarbonising Data’ (link) (Accessed May 2021)
43. Malmodin, J., 2020b: The power consumption of mobile and fixed network data services – The case of streaming video and downloading large files. Electricity Goes Green, Berlin (link)
44. GSMA, 2020: COVID-19 Network Traffic Surge Isn’t Impacting Environment Confirm Telecom Operators (link)
45. Ecoact, 2020: Homeworking emissions whitepaper (link)
46. Ibid
47. Anthesis, 2021: Estimating energy consumption & GHG emissions for remote workers (link)
48. based on the average annual temperature between northern and southern regions
49. Mintel Report, 2014: Air Conditioning (Industrial Report), UK (link). UK estimate extrapolated to 2020 figure
50. Calculated using an extrapolation of UK’s figure from 11, accounting for Germany’s increased AC demand per capita from green-cooling-initiative.org
51. Calculated using an extrapolation of UK’s figure from 11, accounting for Sweden’s increased AC demand per capita from green-cooling-initiative.org
52. Calculated using an extrapolation of UK’s figure from 11, accounting for Czech Republic’s increased AC demand per capita from green-cooling-initiative.org
53. The rate that a desk is occupied by an office worker (The Workspace Consultants, 2020 – link)
54. Average peak desk utilisation rate in European offices
55. Projected desk utilisation reflected by the percentage change in overall capacity utilisation for each country, during COVID-19
56. Projected desk utilisation reflected by the percentage change in overall capacity utilisation for each country, by 2021
57. Assumed that peak desk utilisation rate in long-term, returns to pre-COVID levels in European offices
58. EU Joint Research Centre, 2020: Coronavirus pandemic reveals large differences in the prevalence of telework across the EU (link)
59. World Economic Forum, 2020: The number of permanent remote workers is set to double in 2021 (link) (Accessed May 2021)
60. CIPD, 2020: Home working set to more than double compared to pre-pandemic levels once crisis is over (link)
61. EuroFound, 2020a: Living, working and COVID-19 (link)
62. EuroFound, 2020b: Teleworkability and the COVID-19 crisis - a new digital divide? (link)
63. Reuters, 2020: Swedish epidemiology boss says questioned COVID-19 strategy seems to be working (link) (Accessed May 2021)
64. CIPD, 2020: Home working set to more than double compared to pre-pandemic levels once crisis is over (link)
65. Capgemini, 2020: The future of work – From remote to hybrid (link)
66. McKinsey, 2021: The future of work after COVID-19 (link)
67. World Economic Forum, 2020: The number of permanent remote workers is set to double in 2021 (link) (Accessed May 2021)
68. For the UK, the proportion of teleworkability was calculated using during COVID employment figures of teleworkers, assumed to represent the maximum amount of those who can work from home

79
Homeworking report
Whilst reasonable steps have been taken to ensure that the information contained within this publication is correct, the authors, the Carbon Trust, its agents, contractors and subcontractors give no warranty and make no representation as to its accuracy and accept no liability for any errors or omissions. All trademarks, service marks and logos in this publication, and copyright in it, are the property of the Carbon Trust (or its licensors). Nothing in this publication shall be construed as granting any licence or right to use or reproduce any of the trademarks, services marks, logos, copyright or any proprietary information in any way without the Carbon Trust’s prior written permission.
The Carbon Trust enforces infringements of its intellectual property rights to the full extent permitted by law. The Carbon Trust is a company limited by guarantee and registered in England and Wales under company number 4190230 with its registered office at 4th Floor Dorset House, Stamford Street, London SE1 9NT.
© The Carbon Trust 2021. All rights reserved.
