cardiac imaging in valvular heart disease
TRANSCRIPT

Cardiac imaging in valvular heart disease
1W S CHOO, MBBS, MRCP and 2R P STEEDS, MD, FRCP
1Penang Medical College, Georgetown, Malaysia, and 2Department of Cardiology, Queen Elizabeth Hospital, Edgbaston,
Birmingham, UK
ABSTRACT. The aim of this article is to provide a perspective on the relative importanceand contribution of different imaging modalities in patients with valvular heartdisease. Valvular heart disease is increasing in prevalence across Europe, at a time whenthe clinical ability of physicians to diagnose and assess severity is declining. Increasingreliance is placed on echocardiography, which is the mainstay of cardiac imaging invalvular heart disease. This article outlines the techniques used in this context and theirlimitations, identifying areas in which dynamic imaging with cardiovascular magneticresonance and multislice CT are expanding.
Received 6 May 2010Revised 16 January 2011Accepted 19 January 2011
DOI: 10.1259/bjr/54030257
’ 2011 The British Institute of
Radiology
Valvular heart disease (VHD) is common and in-creases with age. In the past, VHD was typically causedby rheumatic heart disease, which remains a significantpublic health burden in developing countries. In indus-trialised nations, however, rheumatic disease has fallensubstantially and VHD is now mainly degenerative inorigin [1]. As a result of the link between degenerativeVHD, older age and increasing life expectancy, there is aprogressive increase in the prevalence of valve diseaseacross Europe and the USA [2]. In the USA, the nationalprevalence of VHD is 2.5% after adjustment for age andsex, but using moderate or severe mitral regurgitation asan example, the numbers affected are expected to doubleby 2030 [3]. Currently, aortic stenosis (AS; 33.9%) is themost common form of VHD in Europe, followed bymitral regurgitation (MR; 24.8%), aortic regurgitation(AR; 10.4%) and mitral stenosis (MS; 9.5%). Native right-sided valve disease is much less common (1.2%). Asignificant proportion of the patients (28.1%) seen at anyone time in hospital medical or surgical departments, orin medical outpatient clinics, will have had a percuta-neous balloon commissurotomy, valve repair or valvereplacement [1].
The detection of VHD in either hospital or communityseries is not a benign imaging observation but hasprofound consequences for those affected, with in-creased mortality and morbidity despite the availabilityof corrective surgical and percutaneous interventions. TheEuro Heart Survey found that many patients present latewith severe VHD; it also emphasised the importance ofearly detection as the key to improving prognosis, aspatients are often denied intervention despite guideline-based indications because of advancing age [1]. The lowerdetection rate of VHD in the community compared withthat in population studies suggests that a considerableproportion of patients with significant VHD are notdiagnosed and do not present to medical services [2].Many of the clinical signs of VHD taught in medical
schools relate to findings described many years ago inyoung patients presenting with rheumatic heart disease;these are no longer relevant to the older patientspresenting with degenerative VHD today. Clinical exam-ination is not a reliable guide to diagnosis or severity [4, 5].This gap in the clinical diagnosis of VHD and the latepresentation of many with severe disease emphasises theimportance of quantitative, high-quality cardiac imaging.At present, echocardiography is the only method withsufficient availability to estimate the frequency andseverity of VHD in the large populations who requireassessment. Echocardiography continues to be the main-stay for diagnosis, assessment of severity and estimationof prognosis in VHD, despite advances in other modalitiesincluding cardiovascular magnetic resonance (CMR) andelectrocardiogram (ECG)-gated multislice CT.
This review article discusses the role of currentlyavailable imaging modalities in the assessment of VHD.Each valve lesion is addressed in a separate sectionaccording to the prevalence of disease, with an addi-tional section on prosthetic valves. Congenital valvelesions will not be discussed in this article, as anotherarticle in this issue covers this topic.
Aortic stenosis
AS is the most common indication for valve replace-ment in Europe and North America, and it is becomingincreasingly prevalent as the population ages. Degene-rative thickening of the aortic valve (AV) is present in25% of people over the age of 65 years, and 3% of peopleover the age of 75 years have severe AS [1, 6–8]. Thesecond most common cause of AS is a congenitalbicuspid valve, which occurs with an overall prevalenceof 0.5–1.0%. Rheumatic AS has become much lesscommon in industrialised nations, although it remainsthe most common cause of valvular heart disease world-wide. Severe AS remains asymptomatic for many yearsand the risk of death in the absence of symptoms is lessthan 1% per year. Once symptoms appear, however,mortality rises sharply, with 10% dying in the first 6months [9]. Clinical examination is unreliable in the
Address correspondence to: Dr Richard Steeds, Department ofCardiology, Queen Elizabeth Hospital, First Floor, Nuffield House,Edgbaston, Birmingham B15 2TH, UK. E-mail: [email protected]
The British Journal of Radiology, 84 (2011), S245–S257
The British Journal of Radiology, Special Issue 2011 S245
diagnosis and assessment of severity, and transthoracicechocardiography (TTE) is the mainstay of diagnosis [4].
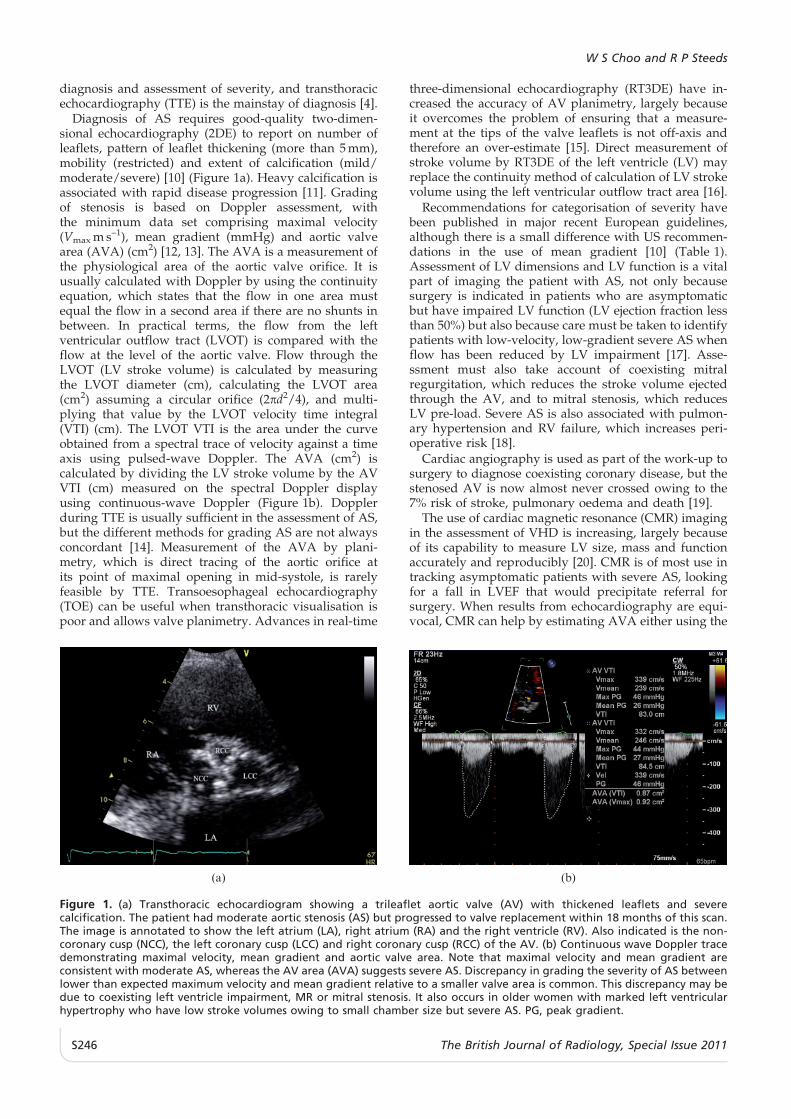
Diagnosis of AS requires good-quality two-dimen-sional echocardiography (2DE) to report on number ofleaflets, pattern of leaflet thickening (more than 5 mm),mobility (restricted) and extent of calcification (mild/moderate/severe) [10] (Figure 1a). Heavy calcification isassociated with rapid disease progression [11]. Gradingof stenosis is based on Doppler assessment, withthe minimum data set comprising maximal velocity(Vmax m s–1), mean gradient (mmHg) and aortic valvearea (AVA) (cm2) [12, 13]. The AVA is a measurement ofthe physiological area of the aortic valve orifice. It isusually calculated with Doppler by using the continuityequation, which states that the flow in one area mustequal the flow in a second area if there are no shunts inbetween. In practical terms, the flow from the leftventricular outflow tract (LVOT) is compared with theflow at the level of the aortic valve. Flow through theLVOT (LV stroke volume) is calculated by measuringthe LVOT diameter (cm), calculating the LVOT area(cm2) assuming a circular orifice (2pd2/4), and multi-plying that value by the LVOT velocity time integral(VTI) (cm). The LVOT VTI is the area under the curveobtained from a spectral trace of velocity against a timeaxis using pulsed-wave Doppler. The AVA (cm2) iscalculated by dividing the LV stroke volume by the AVVTI (cm) measured on the spectral Doppler displayusing continuous-wave Doppler (Figure 1b). Dopplerduring TTE is usually sufficient in the assessment of AS,but the different methods for grading AS are not alwaysconcordant [14]. Measurement of the AVA by plani-metry, which is direct tracing of the aortic orifice atits point of maximal opening in mid-systole, is rarelyfeasible by TTE. Transoesophageal echocardiography(TOE) can be useful when transthoracic visualisation ispoor and allows valve planimetry. Advances in real-time
three-dimensional echocardiography (RT3DE) have in-creased the accuracy of AV planimetry, largely becauseit overcomes the problem of ensuring that a measure-ment at the tips of the valve leaflets is not off-axis andtherefore an over-estimate [15]. Direct measurement ofstroke volume by RT3DE of the left ventricle (LV) mayreplace the continuity method of calculation of LV strokevolume using the left ventricular outflow tract area [16].
Recommendations for categorisation of severity havebeen published in major recent European guidelines,although there is a small difference with US recommen-dations in the use of mean gradient [10] (Table 1).Assessment of LV dimensions and LV function is a vitalpart of imaging the patient with AS, not only becausesurgery is indicated in patients who are asymptomaticbut have impaired LV function (LV ejection fraction lessthan 50%) but also because care must be taken to identifypatients with low-velocity, low-gradient severe AS whenflow has been reduced by LV impairment [17]. Asse-ssment must also take account of coexisting mitralregurgitation, which reduces the stroke volume ejectedthrough the AV, and to mitral stenosis, which reducesLV pre-load. Severe AS is also associated with pulmon-ary hypertension and RV failure, which increases peri-operative risk [18].
Cardiac angiography is used as part of the work-up tosurgery to diagnose coexisting coronary disease, but thestenosed AV is now almost never crossed owing to the7% risk of stroke, pulmonary oedema and death [19].
The use of cardiac magnetic resonance (CMR) imagingin the assessment of VHD is increasing, largely becauseof its capability to measure LV size, mass and functionaccurately and reproducibly [20]. CMR is of most use intracking asymptomatic patients with severe AS, lookingfor a fall in LVEF that would precipitate referral forsurgery. When results from echocardiography are equi-vocal, CMR can help by estimating AVA either using the
(a) (b)
Figure 1. (a) Transthoracic echocardiogram showing a trileaflet aortic valve (AV) with thickened leaflets and severecalcification. The patient had moderate aortic stenosis (AS) but progressed to valve replacement within 18 months of this scan.The image is annotated to show the left atrium (LA), right atrium (RA) and the right ventricle (RV). Also indicated is the non-coronary cusp (NCC), the left coronary cusp (LCC) and right coronary cusp (RCC) of the AV. (b) Continuous wave Doppler tracedemonstrating maximal velocity, mean gradient and aortic valve area. Note that maximal velocity and mean gradient areconsistent with moderate AS, whereas the AV area (AVA) suggests severe AS. Discrepancy in grading the severity of AS betweenlower than expected maximum velocity and mean gradient relative to a smaller valve area is common. This discrepancy may bedue to coexisting left ventricle impairment, MR or mitral stenosis. It also occurs in older women with marked left ventricularhypertrophy who have low stroke volumes owing to small chamber size but severe AS. PG, peak gradient.
W S Choo and R P Steeds
S246 The British Journal of Radiology, Special Issue 2011
continuity equation [21] or more directly from the flowvolume and VTI sampled from a single acquisition atthe valve level [22]. Phase contrast velocity-encodedmeasurement of velocity and VTI tends to underesti-mate the severity of AS by about 10% compared with
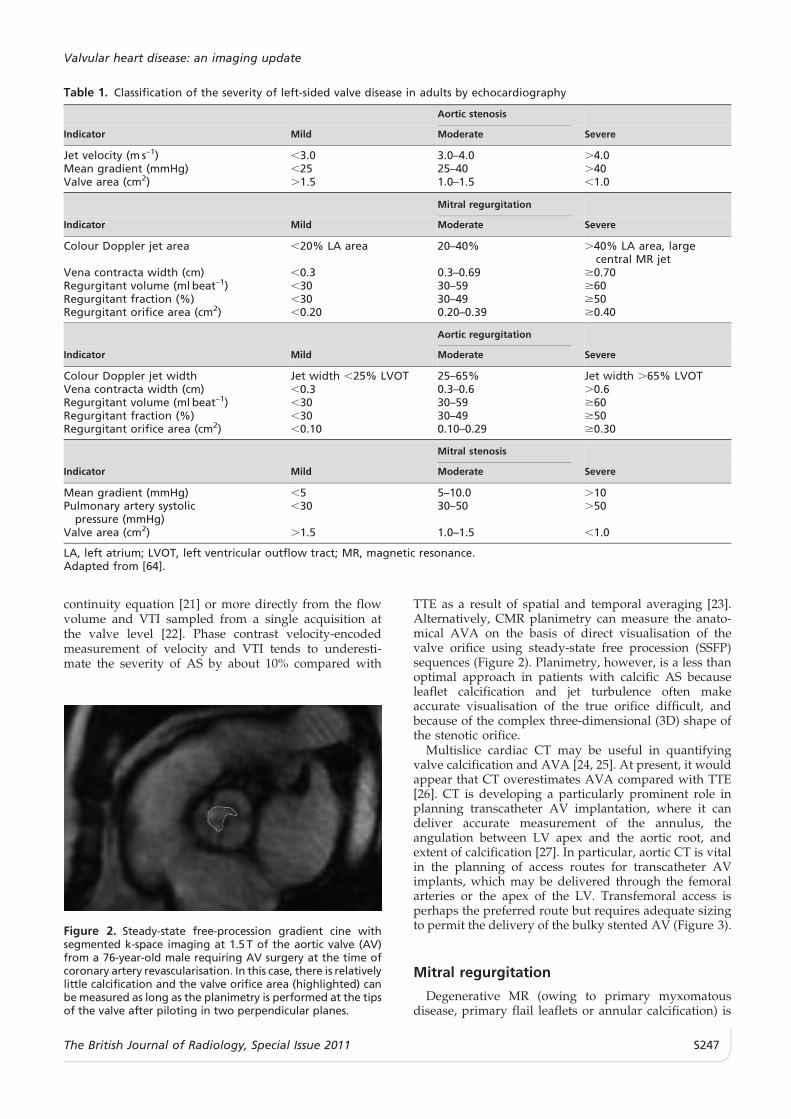
TTE as a result of spatial and temporal averaging [23].Alternatively, CMR planimetry can measure the anato-mical AVA on the basis of direct visualisation of thevalve orifice using steady-state free procession (SSFP)sequences (Figure 2). Planimetry, however, is a less thanoptimal approach in patients with calcific AS becauseleaflet calcification and jet turbulence often makeaccurate visualisation of the true orifice difficult, andbecause of the complex three-dimensional (3D) shape ofthe stenotic orifice.
Multislice cardiac CT may be useful in quantifyingvalve calcification and AVA [24, 25]. At present, it wouldappear that CT overestimates AVA compared with TTE[26]. CT is developing a particularly prominent role inplanning transcatheter AV implantation, where it candeliver accurate measurement of the annulus, theangulation between LV apex and the aortic root, andextent of calcification [27]. In particular, aortic CT is vitalin the planning of access routes for transcatheter AVimplants, which may be delivered through the femoralarteries or the apex of the LV. Transfemoral access isperhaps the preferred route but requires adequate sizingto permit the delivery of the bulky stented AV (Figure 3).
Mitral regurgitation
Degenerative MR (owing to primary myxomatousdisease, primary flail leaflets or annular calcification) is
Table 1. Classification of the severity of left-sided valve disease in adults by echocardiography
Aortic stenosis
Indicator Mild Moderate Severe
Jet velocity (m s–1) ,3.0 3.0–4.0 .4.0Mean gradient (mmHg) ,25 25–40 .40Valve area (cm2) .1.5 1.0–1.5 ,1.0
Mitral regurgitation
Indicator Mild Moderate Severe
Colour Doppler jet area ,20% LA area 20–40% .40% LA area, largecentral MR jet
Vena contracta width (cm) ,0.3 0.3–0.69 $0.70Regurgitant volume (ml beat–1) ,30 30–59 $60Regurgitant fraction (%) ,30 30–49 $50Regurgitant orifice area (cm2) ,0.20 0.20–0.39 $0.40
Aortic regurgitation
Indicator Mild Moderate Severe
Colour Doppler jet width Jet width ,25% LVOT 25–65% Jet width .65% LVOTVena contracta width (cm) ,0.3 0.3–0.6 .0.6Regurgitant volume (ml beat–1) ,30 30–59 $60Regurgitant fraction (%) ,30 30–49 $50Regurgitant orifice area (cm2) ,0.10 0.10–0.29 $0.30
Mitral stenosis
Indicator Mild Moderate Severe
Mean gradient (mmHg) ,5 5–10.0 .10Pulmonary artery systolic
pressure (mmHg),30 30–50 .50
Valve area (cm2) .1.5 1.0–1.5 ,1.0
LA, left atrium; LVOT, left ventricular outflow tract; MR, magnetic resonance.Adapted from [64].
Figure 2. Steady-state free-procession gradient cine withsegmented k-space imaging at 1.5 T of the aortic valve (AV)from a 76-year-old male requiring AV surgery at the time ofcoronary artery revascularisation. In this case, there is relativelylittle calcification and the valve orifice area (highlighted) canbe measured as long as the planimetry is performed at the tipsof the valve after piloting in two perpendicular planes.
Valvular heart disease: an imaging update
The British Journal of Radiology, Special Issue 2011 S247

the most common aetiology in Europe, but ischaemicand functional MR are increasing in frequency [1]. Amajor aim of imaging in MR is the detection of valvedegeneration that is amenable to repair rather thanprosthetic mitral valve replacement (MVR). Repair hasgained popularity as confidence in the technique hasincreased and because of an accumulation of data show-ing the durability and lower mortality and morbidityrates of repairs compared with replacements [28, 29].Currently, almost 50% of patients in registries in Europeand the USA, and up to 90% in experienced centres,undergo repair [1]. Degenerative MR is usually related tomitral valve (MV) prolapse (excessive systolic motion ofthe leaflets more than 2 mm behind the plane of theannulus) and is the most reparable form.
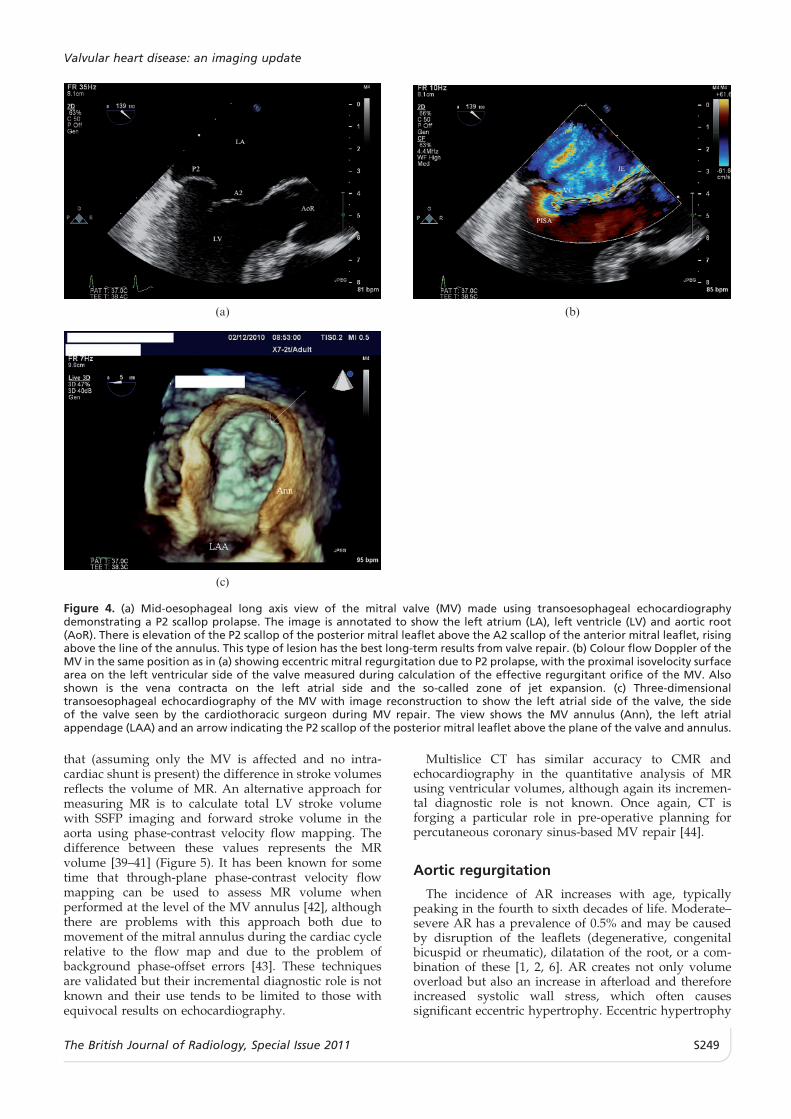
TTE and TOE are the main methods for assessment ofMR. The aims of imaging are to define the cause of MR(ischaemic or non-ischaemic), its mechanism (using theCarpentier classification), the degree of calcification andthe localisation of lesion (using either the Carpentier orDuran nomenclature for scallops) [30]. TOE providesbetter imaging quality than TTE but provides incre-mental clinically meaningful information only whenTTE is suboptimal or when complex, calcified or endo-carditic lesions are suspected [31] (Figure 4a). Semi-quantitative visual assessment of the severity of the MRjet using colour flow Doppler is no longer used becauseof major limitations. Current methods focus on quan-titative measurement of the vena contracta (VC (mm))and flow convergence analysis, which calculates prox-imal isovelocity surface area (PISA) by using colour flow
Doppler to measure the effective regurgitant orificearea (EROA (mm2)) [32, 33]. The vena contracta is thenarrowest portion of a regurgitant jet downstream ofthe regurgitant orifice. It is slightly smaller than theanatomical regurgitant orifice because of bound-ary effects and reflects a physiological orifice area.Accurate measurement requires visualisation of all threecomponents that are present in all regurgitant jets: thearea of proximal flow convergence (on the LV side of theMV in MR), the vena contracta (on the atrial side ofthe MV) and the area of jet expansion. Flow convergenceanalysis measuring PISA is a quantitative method that isbased on the principle of conservation of mass. As bloodflow converges towards a regurgitant orifice, it formsconcentric isovelocity shells that are approximately he-mispheric and are of decreasing surface area andincreasing velocity. The flow in each of these hemi-spheres is the same as that crossing the orifice. Colourflow Doppler is used to image one of these hemispheresby setting a specific Nyquist limit or aliasing velocity. Bysetting the aliasing velocity to obtain a hemisphere, theflow rate (Q) through the regurgitant orifice is calculatedas the product of the surface area of the hemisphere(2pr2) and the aliasing velocity (Va) (Q52pr26Va). Thisflow rate across the PISA is equal to the flow rate at theregurgitant orifice. Assuming that the maximal PISAoccurs at the peak regurgitant orifice, the maximal EROAis obtained by dividing the flow rate by the peak velocityof the regurgitant jet obtained by colour wave Doppler(EROA5Q/peak orifice velocity). The regurgitant volumeis estimated as follows: regurgitant volume (ml)5EROA(cm2)/VTI (cm) of the regurgitant jet VTI (Figure 4b;Table 1). Measurement of left atrial (LA) size, LV dimen-sions and LVEF is important. Once LVEF falls below 60%or the end-systolic diameter is greater than 40–45 mm,patients are considered to have overt LV dysfunction,which is a clear indication for MV surgery. Increased LAvolume (above 40 ml m–2) reflects volume overload and isassociated with a worse outcome [34].
Parallel to the advancement of valve reconstructionsurgery, 3D TTE produces reliable data for the compre-hensive assessment of MR, with accuracy similar tothat provided by 2D TOE [35]. Spatial localisation ofpathological structures, including the commissural zonesand the subvalvular apparatus, is improved by recon-structive 3D echocardiography, either by 3D TTE or by3D TOE [36–38]. In fact, evaluation of MR is one of thefirst clinically established indications for 3DE (Figure 4c).
Left ventriculography and right-heart cardiac catheterisa-tion are rarely needed in the assessment of MR [3]. Coronaryangiography is done routinely in patients aged over 45 years.
CMR SSFP sequences provide information on theanatomy of the MV, although gradient echo cine pulsesequences are more sensitive for the localisation andsizing of regurgitant jets. Semi-quantitative assessmentsof MR jets by visual sizing or depth of penetration of MRinto the LA have the same limitations as colour flowDoppler and should be avoided. Assessment of severityrequires the calculation of regurgitant volume (RVol)by calculating the differences between RV and LVvolumes, either by cine assessment of ventricularvolumes or by velocity mapping and flow quantificationin the pulmonary artery and aorta. In the absence ofcardiac disease, RV and LV stroke volumes are equal, so
Figure 3. Volume-rendered peripheral CT required prior totranscatheter aortic valve implantation via the transfemoralroute, which is recognised to have a lower complication ratethan the transapical approach. The transfemoral routerequires a 22- or 24-French sheath and an appropriateminimum luminal diameter of the femoral and iliac vessels(8 mm for the 26-mm Edwards SAPIEN valve and 7.5 mm forthe 23-mm Edwards SAPIEN valve). These diameters are likelyto fall with the advent of smaller delivery catheters.
W S Choo and R P Steeds
S248 The British Journal of Radiology, Special Issue 2011
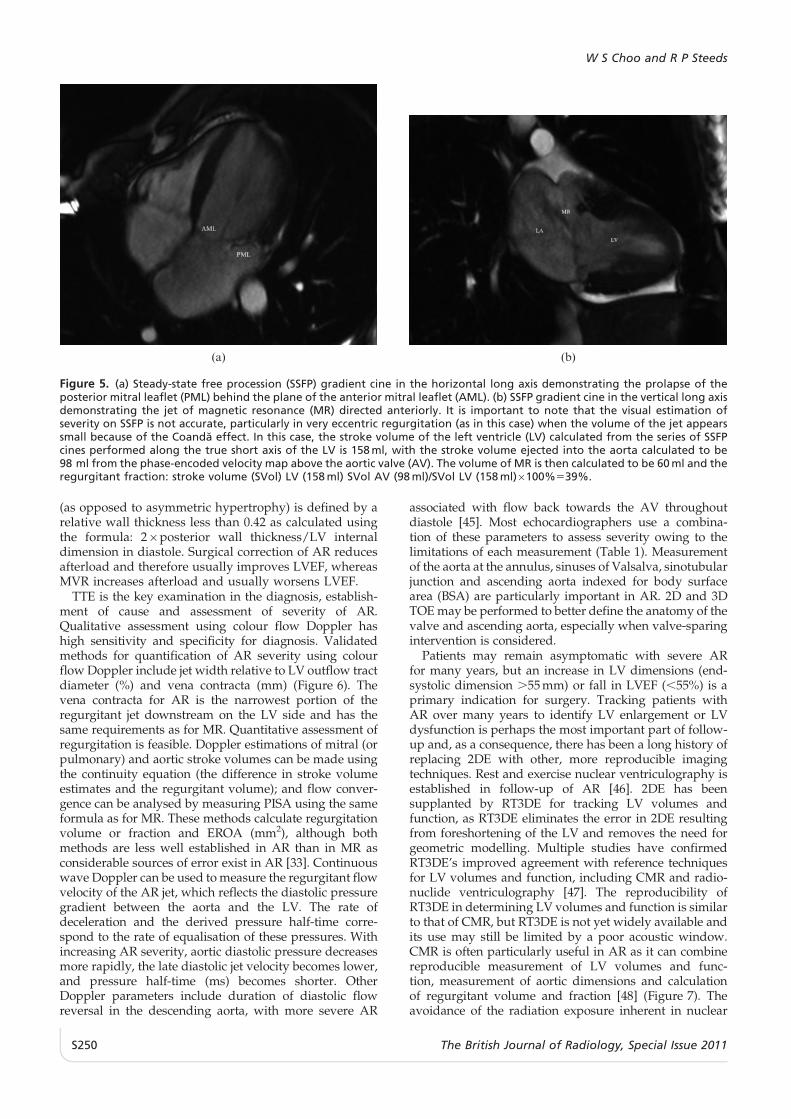
that (assuming only the MV is affected and no intra-cardiac shunt is present) the difference in stroke volumesreflects the volume of MR. An alternative approach formeasuring MR is to calculate total LV stroke volumewith SSFP imaging and forward stroke volume in theaorta using phase-contrast velocity flow mapping. Thedifference between these values represents the MRvolume [39–41] (Figure 5). It has been known for sometime that through-plane phase-contrast velocity flowmapping can be used to assess MR volume whenperformed at the level of the MV annulus [42], althoughthere are problems with this approach both due tomovement of the mitral annulus during the cardiac cyclerelative to the flow map and due to the problem ofbackground phase-offset errors [43]. These techniquesare validated but their incremental diagnostic role is notknown and their use tends to be limited to those withequivocal results on echocardiography.
Multislice CT has similar accuracy to CMR andechocardiography in the quantitative analysis of MRusing ventricular volumes, although again its incremen-tal diagnostic role is not known. Once again, CT isforging a particular role in pre-operative planning forpercutaneous coronary sinus-based MV repair [44].
Aortic regurgitation
The incidence of AR increases with age, typicallypeaking in the fourth to sixth decades of life. Moderate–severe AR has a prevalence of 0.5% and may be causedby disruption of the leaflets (degenerative, congenitalbicuspid or rheumatic), dilatation of the root, or a com-bination of these [1, 2, 6]. AR creates not only volumeoverload but also an increase in afterload and thereforeincreased systolic wall stress, which often causessignificant eccentric hypertrophy. Eccentric hypertrophy
(a) (b)
(c)
Figure 4. (a) Mid-oesophageal long axis view of the mitral valve (MV) made using transoesophageal echocardiographydemonstrating a P2 scallop prolapse. The image is annotated to show the left atrium (LA), left ventricle (LV) and aortic root(AoR). There is elevation of the P2 scallop of the posterior mitral leaflet above the A2 scallop of the anterior mitral leaflet, risingabove the line of the annulus. This type of lesion has the best long-term results from valve repair. (b) Colour flow Doppler of theMV in the same position as in (a) showing eccentric mitral regurgitation due to P2 prolapse, with the proximal isovelocity surfacearea on the left ventricular side of the valve measured during calculation of the effective regurgitant orifice of the MV. Alsoshown is the vena contracta on the left atrial side and the so-called zone of jet expansion. (c) Three-dimensionaltransoesophageal echocardiography of the MV with image reconstruction to show the left atrial side of the valve, the sideof the valve seen by the cardiothoracic surgeon during MV repair. The view shows the MV annulus (Ann), the left atrialappendage (LAA) and an arrow indicating the P2 scallop of the posterior mitral leaflet above the plane of the valve and annulus.
Valvular heart disease: an imaging update
The British Journal of Radiology, Special Issue 2011 S249
(as opposed to asymmetric hypertrophy) is defined by arelative wall thickness less than 0.42 as calculated usingthe formula: 26posterior wall thickness/LV internaldimension in diastole. Surgical correction of AR reducesafterload and therefore usually improves LVEF, whereasMVR increases afterload and usually worsens LVEF.
TTE is the key examination in the diagnosis, establish-ment of cause and assessment of severity of AR.Qualitative assessment using colour flow Doppler hashigh sensitivity and specificity for diagnosis. Validatedmethods for quantification of AR severity using colourflow Doppler include jet width relative to LV outflow tractdiameter (%) and vena contracta (mm) (Figure 6). Thevena contracta for AR is the narrowest portion of theregurgitant jet downstream on the LV side and has thesame requirements as for MR. Quantitative assessment ofregurgitation is feasible. Doppler estimations of mitral (orpulmonary) and aortic stroke volumes can be made usingthe continuity equation (the difference in stroke volumeestimates and the regurgitant volume); and flow conver-gence can be analysed by measuring PISA using the sameformula as for MR. These methods calculate regurgitationvolume or fraction and EROA (mm2), although bothmethods are less well established in AR than in MR asconsiderable sources of error exist in AR [33]. Continuouswave Doppler can be used to measure the regurgitant flowvelocity of the AR jet, which reflects the diastolic pressuregradient between the aorta and the LV. The rate ofdeceleration and the derived pressure half-time corre-spond to the rate of equalisation of these pressures. Withincreasing AR severity, aortic diastolic pressure decreasesmore rapidly, the late diastolic jet velocity becomes lower,and pressure half-time (ms) becomes shorter. OtherDoppler parameters include duration of diastolic flowreversal in the descending aorta, with more severe AR
associated with flow back towards the AV throughoutdiastole [45]. Most echocardiographers use a combina-tion of these parameters to assess severity owing to thelimitations of each measurement (Table 1). Measurementof the aorta at the annulus, sinuses of Valsalva, sinotubularjunction and ascending aorta indexed for body surfacearea (BSA) are particularly important in AR. 2D and 3DTOE may be performed to better define the anatomy of thevalve and ascending aorta, especially when valve-sparingintervention is considered.
Patients may remain asymptomatic with severe ARfor many years, but an increase in LV dimensions (end-systolic dimension .55 mm) or fall in LVEF (,55%) is aprimary indication for surgery. Tracking patients withAR over many years to identify LV enlargement or LVdysfunction is perhaps the most important part of follow-up and, as a consequence, there has been a long history ofreplacing 2DE with other, more reproducible imagingtechniques. Rest and exercise nuclear ventriculography isestablished in follow-up of AR [46]. 2DE has beensupplanted by RT3DE for tracking LV volumes andfunction, as RT3DE eliminates the error in 2DE resultingfrom foreshortening of the LV and removes the need forgeometric modelling. Multiple studies have confirmedRT3DE’s improved agreement with reference techniquesfor LV volumes and function, including CMR and radio-nuclide ventriculography [47]. The reproducibility ofRT3DE in determining LV volumes and function is similarto that of CMR, but RT3DE is not yet widely available andits use may still be limited by a poor acoustic window.CMR is often particularly useful in AR as it can combinereproducible measurement of LV volumes and func-tion, measurement of aortic dimensions and calculationof regurgitant volume and fraction [48] (Figure 7). Theavoidance of the radiation exposure inherent in nuclear
(a) (b)
Figure 5. (a) Steady-state free procession (SSFP) gradient cine in the horizontal long axis demonstrating the prolapse of theposterior mitral leaflet (PML) behind the plane of the anterior mitral leaflet (AML). (b) SSFP gradient cine in the vertical long axisdemonstrating the jet of magnetic resonance (MR) directed anteriorly. It is important to note that the visual estimation ofseverity on SSFP is not accurate, particularly in very eccentric regurgitation (as in this case) when the volume of the jet appearssmall because of the Coanda effect. In this case, the stroke volume of the left ventricle (LV) calculated from the series of SSFPcines performed along the true short axis of the LV is 158 ml, with the stroke volume ejected into the aorta calculated to be98 ml from the phase-encoded velocity map above the aortic valve (AV). The volume of MR is then calculated to be 60 ml and theregurgitant fraction: stroke volume (SVol) LV (158 ml) SVol AV (98 ml)/SVol LV (158 ml)6100%539%.
W S Choo and R P Steeds
S250 The British Journal of Radiology, Special Issue 2011

ventriculography and CT makes CMR even moreattractive in patients with AR, who often require longerfollow-up than those with other forms of VHD.
Mitral stenosis
The prevalence of MS has decreased greatly indeveloped countries because the main aetiology isrheumatic (85%) and other causes are rare [1]. The mainmechanism of rheumatic MS is commissural fusion, withother anatomical lesions being leaflet thickening, chordalshortening and fusion, and finally superimposed calci-fication [49]. The main lesion of degenerative MS isannular calcification, which has few or no haemody-namic consequences when isolated.
TTE is the key diagnostic tool in MS. First, MVplanimetry is performed by direct tracing of the valveorifice in mid-diastole from the parasternal short axis
view; this is the reference method for assessment ofseverity [MVA (cm2)]. Severity of MS is also quantifiedby continuous wave Doppler of the diastolic pressuregradient using the Bernoulli equation to calculate meangradient (mmHg) and pressure half-time, defined as thetime interval (ms) between the maximum mitral gradientin early diastole and the time point when the gradientis half the maximum initial value (Table 1). Maximalvelocity or gradient is ignored in the assessment of MS asit is governed by LA compliance and LV compliance.Second, morphological evaluation of the MV is impor-tant because of its implications for choice of interven-tion. The aim is to identify MS that is amenable topercutaneous balloon commissurotomy, and a variety ofscoring systems are available that can be used to assesssuitability and outcome [50] (Table 2).
TOE can be helpful if TTE provides suboptimalinformation on valve morphology and degree of coexistingMR. The main advantage of TOE is its much highersensitivity in detecting LA thrombus, particularly in the LAappendage, which cannot be visualised routinely in adultson TTE. RT3DE provides genuine advantages in theassessment of MS by planimetry, optimising the positioningof the measurement plane and, therefore, improvingreproducibility [51, 52] (Figure 8).
Cardiac catheterisation is restricted to cases of MS inwhich the results from echocardiography are equivocal.Right-heart catheterisation is useful in the presence ofpulmonary hypertension, specifically to assess pulmon-ary vascular resistance.
CMR can be used to perform planimetry of the mitralorifice and pressure half-time assessment, although ittends to overestimate MVA when compared with TTEand cardiac catheterisation [53]. The reproducibility ofCMR planimetry is acceptable [53], although use of CMRis hampered by the common association of MS with atrialfibrillation and with signal void caused by calcification.CT reliably detects MV calcification [54], and may haveaccuracy similar to that of echocardiography in assessingseverity, although the case series analysed to date aresmall [55].
Right-sided valvular heart disease
Native right-sided valvular heart disease occurs onlyinfrequently, with a prevalence of 1.2% [1]. TTE is the first-line cardiac imaging modality for right-sided VHD,specifically for structural assessment of valve leaflets(Figure 9). Pathological tricuspid regurgitation (TR) isusually functional owing to annular dilatation, which mayarise because of LV failure, RV pressure and/or volumeoverload, or chamber dilatation. The tricuspid valve (TV)annulus is very dynamic and changes markedly withdifferent loading conditions; even during the normalcardiac cycle, there is a 30% reduction in annular area inatrial systole [56]. This means that the degree of TR is veryvariable and heavily dependent on intravascular volumestatus, RV loading and RV function. Semi-quantitativeevaluation of TR severity by TTE is based on the venacontracta width, dilatation of the inferior vena cava andreduction or reversal of systolic blood flow in the hepaticveins [33, 57]. CMR may be used to calculate TR RVolsand fraction in the same way as for MR, but, more so than
Figure 6. Transoesophageal echocardiogram taken in the mid-oesophageal three-chamber view showing the aortic root (AoR),left ventricle (LV) and left atrium (LA). The vena contracta of theaortic regurgitant jet is the narrowest portion of the jet on theventricular side of the valve. This reflects the physiologicalregurgitant orifice and is a sensitive marker of severity.
Figure 7. Steady-state free procession gradient cine imagingof the aortic valve in the perpendicular long axis view of theleft ventricular outflow tract, showing the left ventricle (LV),aortic valve, aortic regurgitant (AR) jet and aortic root (AoR).In this case, the regurgitant fraction calculated from LVand right ventricle volumes, and by phase-encoded velocitymapping, was 48% (consistent with moderate AR).
Valvular heart disease: an imaging update
The British Journal of Radiology, Special Issue 2011 S251
in any other VHD, serial imaging of TR must take intoaccount the clinical status of the patient. CMR is thereference method for assessment of RV volumes andfunction, although the technique remains challenging [58](Figure 10). ECG-gated CT provides similar volumetricassessment, albeit at a lower temporal resolution than thatprovided by CMR.
By contrast, tricuspid stenosis (TS) is almost exclu-sively of rheumatic origin, occurring only rarely inisolation without left-sided valve lesions. As TS is alsousually accompanied by TR, the transvalvular gradient isclinically more relevant for the assessment of severityand for decision-making than the actual stenotic valvearea. Moreover, planimetry of the valve area is extremelydifficult and even 3DE methods are not widely validated.Current methods for quantification include maximalvelocity (.2 m s–1), pressure half-time (.190 ms) andmean gradient (.5 mmHg) [12]. There is variation in TVflow with inspiration, so it is common for measurementsto be taken at end-expiration. CMR phase-mapping isaffected by annular plane displacement and is much lessaccurate in narrow, eccentric jets.
The pulmonary valve is the valve least likely to beaffected by acquired heart disease. Indeed, almost allcases of pulmonary valve disease are congenital in origin.
Prosthetic heart valves
Patients who have undergone previous valve surgeryrepresent an important proportion of patients with VHD,the large majority (82%) having undergone valvereplacement [1]. History and clinical examination canalert physicians to significant prosthetic valve (PV)dysfunction, but cardiac imaging is required to con-firm or refute this possibility. Echocardiography is themethod of choice, but imaging by any modality is moretechnically demanding than that in native valve assess-ment. First, almost all replacement valves are obstructivecompared with native valves, with the degree ofobstruction varying according to their size and design.The problem in imaging is then to separate the expected‘‘normal’’ haemodynamics of a PV from mild patholo-gical obstruction and from patient–prosthesis mismatch
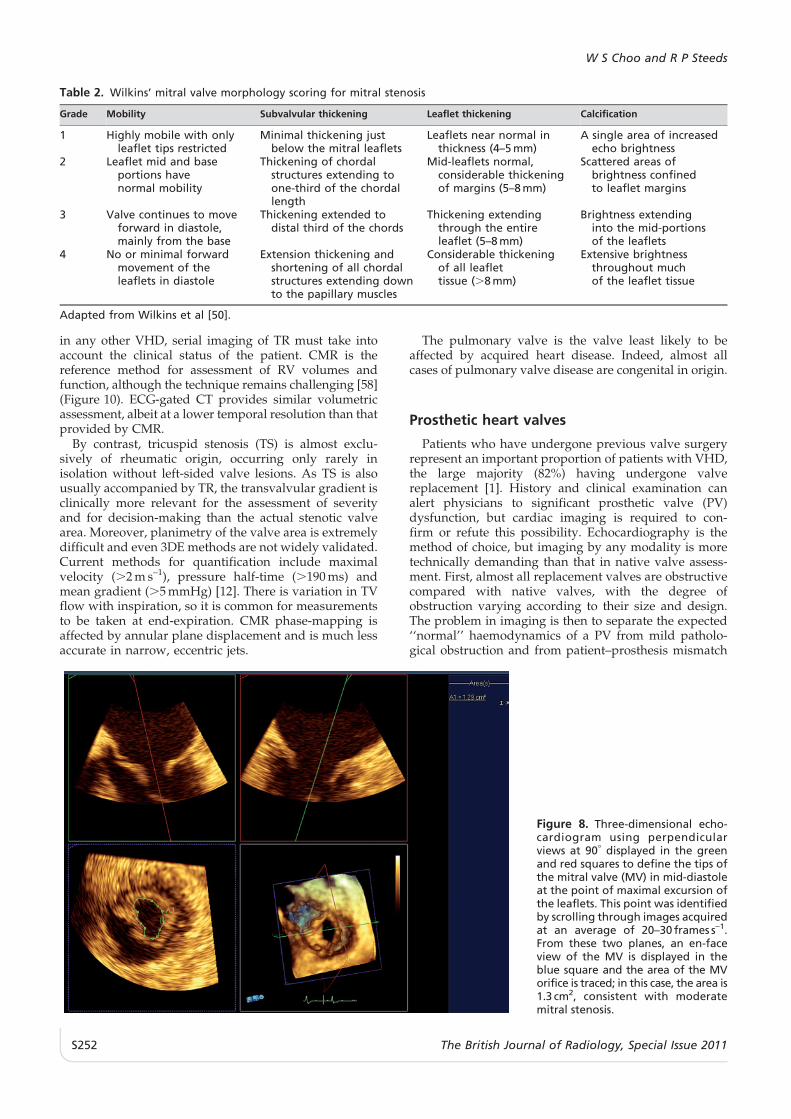
Figure 8. Three-dimensional echo-cardiogram using perpendicularviews at 90u displayed in the greenand red squares to define the tips ofthe mitral valve (MV) in mid-diastoleat the point of maximal excursion ofthe leaflets. This point was identifiedby scrolling through images acquiredat an average of 20–30 frames s–1.From these two planes, an en-faceview of the MV is displayed in theblue square and the area of the MVorifice is traced; in this case, the area is1.3 cm2, consistent with moderatemitral stenosis.
Table 2. Wilkins’ mitral valve morphology scoring for mitral stenosis
Grade Mobility Subvalvular thickening Leaflet thickening Calcification
1 Highly mobile with onlyleaflet tips restricted
Minimal thickening justbelow the mitral leaflets
Leaflets near normal inthickness (4–5 mm)
A single area of increasedecho brightness
2 Leaflet mid and baseportions havenormal mobility
Thickening of chordalstructures extending toone-third of the chordallength
Mid-leaflets normal,considerable thickeningof margins (5–8 mm)
Scattered areas ofbrightness confinedto leaflet margins
3 Valve continues to moveforward in diastole,mainly from the base
Thickening extended todistal third of the chords
Thickening extendingthrough the entireleaflet (5–8 mm)
Brightness extendinginto the mid-portionsof the leaflets
4 No or minimal forwardmovement of theleaflets in diastole
Extension thickening andshortening of all chordalstructures extending downto the papillary muscles
Considerable thickeningof all leaflettissue (.8 mm)
Extensive brightnessthroughout muchof the leaflet tissue
Adapted from Wilkins et al [50].
W S Choo and R P Steeds
S252 The British Journal of Radiology, Special Issue 2011

(PPM), when the valve implanted is too small for thepatient’s requirements. Second, almost all replacementvalves have trivial or mild transvalvular regurgitation(so-called ‘‘washing jets’’), which varies according tothe PV design and which must be distinguished frompathological regurgitation. Third, imaging may be com-plicated by artefacts and shielding from the PV. Anyrequest for imaging of a PV should be rejected unlessit contains information on the type and size of PVimplanted and the date of replacement, together withsome basic information on the patient, such as BSA, as thisenables the imager to compare the velocities and gradientsfound with those expected from published tables ofnormal values [59]. In particular, baseline assessmentusing the imaging modality to be used during follow-upshould be performed at 6–12 weeks post surgery for allPV replacements. The results then obtained are used tocompare all subsequent changes in PV and ventricularfunction. PVs are imaged from multiple views to obtaininformation on occluder motion, thickening or calcifica-tion, and abnormal motion of the sewing ring (Figure 11).TTE imaging of occluder motion is often inadequatebecause of artefacts, and TOE is needed in most cases ofsuspected prosthetic dysfunction, thombosis or endocar-ditis [60]. The minimum data set for PV assessmentincludes maximal velocity (Vmax m s–1), mean gradient(mmHg) and valve area [AVA (cm2)], together withcomment on regurgitation.
Cardiac catheterisation has a limited role in theassessment of PV dysfunction, although cinefluoroscopyis useful in evaluating the disc mobility of mechanicalvalves. Prospective studies have indicated that althoughDoppler echocardiography allows the measurement ofgradients and areas, as well as the semi-quantification of
regurgitation, fluoroscopy is superior to echocardiogra-phy in identifying disc motion [61]. Cinefluoroscopy israpid and easy to perform and provides valuable infor-mation not only in cases where mechanical PV obstruc-tion is suspected but also when occluder motion isrestricted, leading to transvalvar regurgitation. Cine-fluoroscopy, however, has little value in bioprostheticvalves and is largely being replaced by ECG-gated multi-slice CT, which not only can identify stuck mechanical
Figure 10. Steady-state free procession gradient cine imagingin the horizontal long axis view, demonstrating displacementof the septal leaflet of the tricuspid valve (arrow) towards theapex of the right ventricle (RV) as a result of the failure of thetricuspid valve tissue to delaminate. This results in atrialisationof the RV and enlargement of the right atrium (RA), typical ofEbstein’s anomaly. ASup, anterosuperior; Sep, septal.
(a) (b)
Figure 9. Transthoracic echocardiogram performed from the apical acoustic window to show the four-chamber view, with the leftatrium (LA), left ventricle (LV), right atrium (RA) and right ventricle (RV) displayed. The image on the left is a standard two-dimensionalimage, that on the right is the simultaneously displayed colour Doppler, with yellow indicating flow towards the probe and blue flowaway from the valve. In the RA, a jet of severe tricuspid regurgitation occupies most of the chamber. This jet has a wide vena contractacaused by thickening and fixation of the septal and anterosuperior leaflets of the tricuspid valve (TV), which shows thickened andrestricted TV leaflets with severe tricuspid regurgitation caused by carcinoid heart disease. ASup, anterosuperior; Sep, septal.
Valvular heart disease: an imaging update
The British Journal of Radiology, Special Issue 2011 S253
valves but also can quantify calcification and deline-ate pannus in bioprosthetic valves [62] (Figure 12).Systematic comparison of CT with echocardiography islimited as yet but is likely to develop significantly.Cardiac MRI is safe for all commercially availableprosthetic heart valves, including the earliest inserted
such as the Bjork–Shiley valve, but is less extensivelyused because of artefact in mechanical valves [63]. Infact, almost all sternal wires, clips, stents, occlusiondevices and prosthetic valves within the chest are safe ina 1.5 T magnet, and the only problem within the magnet isinterference with image quality resulting from local image
(a) (b)
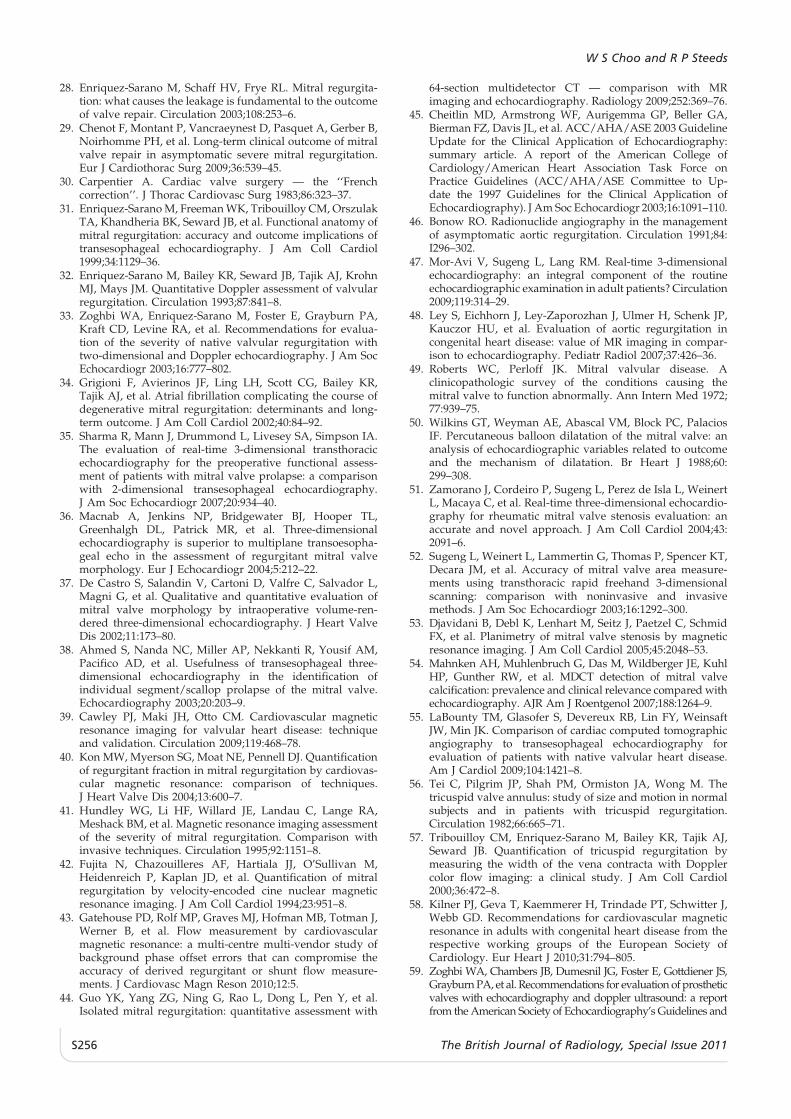
Figure 12. 64-slice electrocardio-gram-gated CT of a 25 mm Car-bomedics (Sorin Group, Milan, Italy)bileaflet mechanical mitral valvereplacement with leaflets (a) openand (b) closed. Parallel alignment ofvalve leaflets should be seen in theopen position.
(a) (b)
(c) (d)
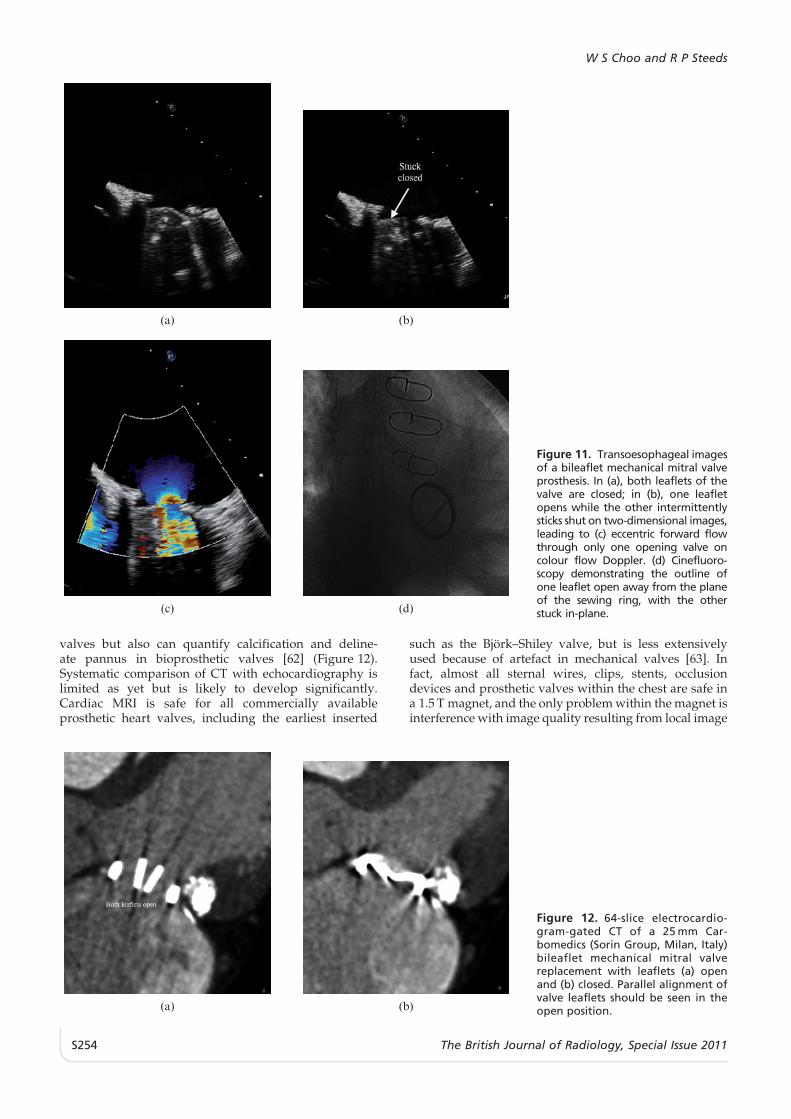
Figure 11. Transoesophageal imagesof a bileaflet mechanical mitral valveprosthesis. In (a), both leaflets of thevalve are closed; in (b), one leafletopens while the other intermittentlysticks shut on two-dimensional images,leading to (c) eccentric forward flowthrough only one opening valve oncolour flow Doppler. (d) Cinefluoro-scopy demonstrating the outline ofone leaflet open away from the planeof the sewing ring, with the otherstuck in-plane.
W S Choo and R P Steeds
S254 The British Journal of Radiology, Special Issue 2011

artefact. On the other hand, no patient with a pace-maker or implanted defibrillator should approach themagnet, although newer MR-compatible pacemakers areavailable.
Conclusion
Cardiac imaging continues to develop at a pace in theassessment of VHD. Echocardiography remains at theforefront of assessment, with an emphasis on the use of3D techniques to improve the reliability of data collectedduring long-term follow-up. There is increasing use ofanatomical and dynamic imaging with CMR and multi-slice CT to provide supplementary diagnostic informa-tion, replacing echocardiography when limitations arisefrom loss of acoustic window. Future directions includeincreased use of peri-operative echocardiography duringpercutaneous valve interventions, replacing the use offluoroscopy; increasing use of CMR for catheter anddevice guidance to expedite the planning and perfor-mance of percutaneous and surgical interventions inVHD; and replacement of cardiac catheterisation prior tosurgical intervention for VHD by multislice CT.
References
1. Iung B, Baron G, Butchart EG, Delahaye F, Gohlke-BarwolfC, Levang OW, et al. A prospective survey of patients withvalvular heart disease in Europe: The Euro Heart Survey onValvular Heart Disease. Eur Heart J 2003;24:1231–43.
2. Nkomo VT, Gardin JM, Skelton TN, Gottdiener JS, Scott CG,Enriquez-Sarano M. Burden of valvular heart diseases: apopulation-based study. Lancet 2006;368:1005–11.
3. Enriquez-Sarano M, Akins CW, Vahanian A. Mitralregurgitation. Lancet 2009;373:1382–94.
4. Das P, Pocock C, Chambers J. The patient with a systolicmurmur: severe aortic stenosis may be missed duringcardiovascular examination. QJM 2000;93:685–8.
5. Roldan CA, Shively BK, Crawford MH. Value of thecardiovascular physical examination for detecting valvularheart disease in asymptomatic subjects. Am J Cardiol1996;77:1327–31.
6. Soler-Soler J, Galve E. Worldwide perspective of valvedisease. Heart 2000;83:721–5.
7. Stewart BF, Siscovick D, Lind BK, Gardin JM, Gottdiener JS,Smith VE, et al. Clinical factors associated with calcificaortic valve disease. Cardiovascular Health Study. J AmColl Cardiol 1997;29:630–4.
8. Otto CM, Lind BK, Kitzman DW, Gersh BJ, Siscovick DS.Association of aortic-valve sclerosis with cardiovascularmortality and morbidity in the elderly. N Engl J Med1999;341:142–7.
9. Chambers J, Das P. Treadmill exercise in apparentlyasymptomatic aortic stenosis. Heart 2001;86:361–2.
10. Baumgartner H, Hung J, Bermejo J, Chambers JB,Evangelista A, Griffin BP, et al. Echocardiographic assess-ment of valve stenosis: EAE/ASE recommendations forclinical practice. Eur J Echocardiogr 2009;10:1–25.
11. Rosenhek R, Binder T, Porenta G, Lang I, Christ G,Schemper M, et al. Predictors of outcome in severe,asymptomatic aortic stenosis. N Engl J Med 2000;343:611–17.
12. Quinones MA, Otto CM, Stoddard M, Waggoner A, ZoghbiWA. Recommendations for quantification of Doppler echo-cardiography: a report from the Doppler Quantification TaskForce of the Nomenclature and Standards Committee of theAmerican Society of Echocardiography. J Am Soc Echo-cardiogr 2002;15:167–84.
13. Bermejo J, Odreman R, Feijoo J, Moreno MM, Gomez-Moreno P, Garcia-Fernandez MA. Clinical efficacy ofDoppler-echocardiographic indices of aortic valve stenosis:a comparative test-based analysis of outcome. J Am CollCardiol 2003;41:142–51.
14. Minners J, Allgeier M, Gohlke-Baerwolf C, Kienzle RP,Neumann FJ, Jander N. Inconsistencies of echocardiographiccriteria for the grading of aortic valve stenosis. Eur Heart J2008;29:1043–8.
15. Goland S, Trento A, Iida K, Czer LS, De Robertis M, NaqviTZ, et al. Assessment of aortic stenosis by three-dimen-sional echocardiography: an accurate and novel approach.Heart 2007;93:801–7.
16. Poh KK, Levine RA, Solis J, Shen L, Flaherty M, Kang YJ,et al. Assessing aortic valve area in aortic stenosis bycontinuity equation: a novel approach using real-time three-dimensional echocardiography. Eur Heart J 2008;29:2526–35.
17. deFilippi CR, Willett DL, Brickner ME, Appleton CP, YancyCW, Eichhorn EJ, et al. Usefulness of dobutamine echo-cardiography in distinguishing severe from nonseverevalvular aortic stenosis in patients with depressed leftventricular function and low transvalvular gradients. Am JCardiol 1995;75:191–4.
18. Pai RG, Varadarajan P, Kapoor N, Bansal RC. Aortic valvereplacement improves survival in severe aortic stenosisassociated with severe pulmonary hypertension. AnnThorac Surg 2007;84:80–5.
19. Chambers J, Bach D, Dumesnil J, Otto C, Shah P, Thomas J.Crossing the aortic valve in severe aortic stenosis: no longeracceptable? J Heart Valve Dis 2004;13:344–6.
20. Bellenger NG, Burgess MI, Ray SG, Lahiri A, Coats AJ,Cleland JG, et al. Comparison of left ventricular ejectionfraction and volumes in heart failure by echocardiography,radionuclide ventriculography and cardiovascular mag-netic resonance; are they interchangeable? Eur Heart J2000;21:1387–96.
21. Caruthers SD, Lin SJ, Brown P, Watkins MP, Williams TA,Lehr KA, et al. Practical value of cardiac magneticresonance imaging for clinical quantification of aortic valvestenosis: comparison with echocardiography. Circulation2003;108:2236–43.
22. Yap SC, van Geuns RJ, Meijboom FJ, Kirschbaum SW,McGhie JS, Simoons ML, et al. A simplified continuityequation approach to the quantification of stenotic bicuspidaortic valves using velocity-encoded cardiovascular mag-netic resonance. J Cardiovasc Magn Reson 2007;9:899–906.
23. O’Brien KR, Cowan BR, Jain M, Stewart RA, Kerr AJ, YoungAA. MRI phase contrast velocity and flow errors inturbulent stenotic jets. J Magn Reson Imaging 2008;28:210–18.
24. Messika-Zeitoun D, Aubry MC, Detaint D, Bielak LF,Peyser PA, Sheedy PF, et al. Evaluation and clinicalimplications of aortic valve calcification measured byelectron-beam computed tomography. Circulation 2004;110:356–62.
25. Feuchtner GM, Dichtl W, Friedrich GJ, Frick M, Alber H,Schachner T, et al. Multislice computed tomography fordetection of patients with aortic valve stenosis andquantification of severity. J Am Coll Cardiol 2006;47:1410–17.
26. Abdulla J, Sivertsen J, Kofoed KF, Alkadhi H, LaBounty T,Abildstrom SZ, et al. Evaluation of aortic valve stenosis bycardiac multislice computed tomography compared withechocardiography: a systematic review and meta-analysis.J Heart Valve Dis 2009;18:634–43.
27. Schoenhagen P, Tuzcu EM, Kapadia SR, Desai MY,Svensson LG. Three-dimensional imaging of the aorticvalve and aortic root with computed tomography: newstandards in an era of transcatheter valve repair/implanta-tion. Eur Heart J 2009;30:2079–86.
Valvular heart disease: an imaging update
The British Journal of Radiology, Special Issue 2011 S255
28. Enriquez-Sarano M, Schaff HV, Frye RL. Mitral regurgita-tion: what causes the leakage is fundamental to the outcomeof valve repair. Circulation 2003;108:253–6.
29. Chenot F, Montant P, Vancraeynest D, Pasquet A, Gerber B,Noirhomme PH, et al. Long-term clinical outcome of mitralvalve repair in asymptomatic severe mitral regurgitation.Eur J Cardiothorac Surg 2009;36:539–45.
30. Carpentier A. Cardiac valve surgery — the ‘‘Frenchcorrection’’. J Thorac Cardiovasc Surg 1983;86:323–37.
31. Enriquez-Sarano M, Freeman WK, Tribouilloy CM, OrszulakTA, Khandheria BK, Seward JB, et al. Functional anatomy ofmitral regurgitation: accuracy and outcome implications oftransesophageal echocardiography. J Am Coll Cardiol1999;34:1129–36.
32. Enriquez-Sarano M, Bailey KR, Seward JB, Tajik AJ, KrohnMJ, Mays JM. Quantitative Doppler assessment of valvularregurgitation. Circulation 1993;87:841–8.
33. Zoghbi WA, Enriquez-Sarano M, Foster E, Grayburn PA,Kraft CD, Levine RA, et al. Recommendations for evalua-tion of the severity of native valvular regurgitation withtwo-dimensional and Doppler echocardiography. J Am SocEchocardiogr 2003;16:777–802.
34. Grigioni F, Avierinos JF, Ling LH, Scott CG, Bailey KR,Tajik AJ, et al. Atrial fibrillation complicating the course ofdegenerative mitral regurgitation: determinants and long-term outcome. J Am Coll Cardiol 2002;40:84–92.
35. Sharma R, Mann J, Drummond L, Livesey SA, Simpson IA.The evaluation of real-time 3-dimensional transthoracicechocardiography for the preoperative functional assess-ment of patients with mitral valve prolapse: a comparisonwith 2-dimensional transesophageal echocardiography.J Am Soc Echocardiogr 2007;20:934–40.
36. Macnab A, Jenkins NP, Bridgewater BJ, Hooper TL,Greenhalgh DL, Patrick MR, et al. Three-dimensionalechocardiography is superior to multiplane transoesopha-geal echo in the assessment of regurgitant mitral valvemorphology. Eur J Echocardiogr 2004;5:212–22.
37. De Castro S, Salandin V, Cartoni D, Valfre C, Salvador L,Magni G, et al. Qualitative and quantitative evaluation ofmitral valve morphology by intraoperative volume-ren-dered three-dimensional echocardiography. J Heart ValveDis 2002;11:173–80.
38. Ahmed S, Nanda NC, Miller AP, Nekkanti R, Yousif AM,Pacifico AD, et al. Usefulness of transesophageal three-dimensional echocardiography in the identification ofindividual segment/scallop prolapse of the mitral valve.Echocardiography 2003;20:203–9.
39. Cawley PJ, Maki JH, Otto CM. Cardiovascular magneticresonance imaging for valvular heart disease: techniqueand validation. Circulation 2009;119:468–78.
40. Kon MW, Myerson SG, Moat NE, Pennell DJ. Quantificationof regurgitant fraction in mitral regurgitation by cardiovas-cular magnetic resonance: comparison of techniques.J Heart Valve Dis 2004;13:600–7.
41. Hundley WG, Li HF, Willard JE, Landau C, Lange RA,Meshack BM, et al. Magnetic resonance imaging assessmentof the severity of mitral regurgitation. Comparison withinvasive techniques. Circulation 1995;92:1151–8.
42. Fujita N, Chazouilleres AF, Hartiala JJ, O’Sullivan M,Heidenreich P, Kaplan JD, et al. Quantification of mitralregurgitation by velocity-encoded cine nuclear magneticresonance imaging. J Am Coll Cardiol 1994;23:951–8.
43. Gatehouse PD, Rolf MP, Graves MJ, Hofman MB, Totman J,Werner B, et al. Flow measurement by cardiovascularmagnetic resonance: a multi-centre multi-vendor study ofbackground phase offset errors that can compromise theaccuracy of derived regurgitant or shunt flow measure-ments. J Cardiovasc Magn Reson 2010;12:5.
44. Guo YK, Yang ZG, Ning G, Rao L, Dong L, Pen Y, et al.Isolated mitral regurgitation: quantitative assessment with
64-section multidetector CT — comparison with MRimaging and echocardiography. Radiology 2009;252:369–76.
45. Cheitlin MD, Armstrong WF, Aurigemma GP, Beller GA,Bierman FZ, Davis JL, et al. ACC/AHA/ASE 2003 GuidelineUpdate for the Clinical Application of Echocardiography:summary article. A report of the American College ofCardiology/American Heart Association Task Force onPractice Guidelines (ACC/AHA/ASE Committee to Up-date the 1997 Guidelines for the Clinical Application ofEchocardiography). J Am Soc Echocardiogr 2003;16:1091–110.
46. Bonow RO. Radionuclide angiography in the managementof asymptomatic aortic regurgitation. Circulation 1991;84:I296–302.
47. Mor-Avi V, Sugeng L, Lang RM. Real-time 3-dimensionalechocardiography: an integral component of the routineechocardiographic examination in adult patients? Circulation2009;119:314–29.
48. Ley S, Eichhorn J, Ley-Zaporozhan J, Ulmer H, Schenk JP,Kauczor HU, et al. Evaluation of aortic regurgitation incongenital heart disease: value of MR imaging in compar-ison to echocardiography. Pediatr Radiol 2007;37:426–36.
49. Roberts WC, Perloff JK. Mitral valvular disease. Aclinicopathologic survey of the conditions causing themitral valve to function abnormally. Ann Intern Med 1972;77:939–75.
50. Wilkins GT, Weyman AE, Abascal VM, Block PC, PalaciosIF. Percutaneous balloon dilatation of the mitral valve: ananalysis of echocardiographic variables related to outcomeand the mechanism of dilatation. Br Heart J 1988;60:299–308.
51. Zamorano J, Cordeiro P, Sugeng L, Perez de Isla L, WeinertL, Macaya C, et al. Real-time three-dimensional echocardio-graphy for rheumatic mitral valve stenosis evaluation: anaccurate and novel approach. J Am Coll Cardiol 2004;43:2091–6.
52. Sugeng L, Weinert L, Lammertin G, Thomas P, Spencer KT,Decara JM, et al. Accuracy of mitral valve area measure-ments using transthoracic rapid freehand 3-dimensionalscanning: comparison with noninvasive and invasivemethods. J Am Soc Echocardiogr 2003;16:1292–300.
53. Djavidani B, Debl K, Lenhart M, Seitz J, Paetzel C, SchmidFX, et al. Planimetry of mitral valve stenosis by magneticresonance imaging. J Am Coll Cardiol 2005;45:2048–53.
54. Mahnken AH, Muhlenbruch G, Das M, Wildberger JE, KuhlHP, Gunther RW, et al. MDCT detection of mitral valvecalcification: prevalence and clinical relevance compared withechocardiography. AJR Am J Roentgenol 2007;188:1264–9.
55. LaBounty TM, Glasofer S, Devereux RB, Lin FY, WeinsaftJW, Min JK. Comparison of cardiac computed tomographicangiography to transesophageal echocardiography forevaluation of patients with native valvular heart disease.Am J Cardiol 2009;104:1421–8.
56. Tei C, Pilgrim JP, Shah PM, Ormiston JA, Wong M. Thetricuspid valve annulus: study of size and motion in normalsubjects and in patients with tricuspid regurgitation.Circulation 1982;66:665–71.
57. Tribouilloy CM, Enriquez-Sarano M, Bailey KR, Tajik AJ,Seward JB. Quantification of tricuspid regurgitation bymeasuring the width of the vena contracta with Dopplercolor flow imaging: a clinical study. J Am Coll Cardiol2000;36:472–8.
58. Kilner PJ, Geva T, Kaemmerer H, Trindade PT, Schwitter J,Webb GD. Recommendations for cardiovascular magneticresonance in adults with congenital heart disease from therespective working groups of the European Society ofCardiology. Eur Heart J 2010;31:794–805.
59. Zoghbi WA, Chambers JB, Dumesnil JG, Foster E, Gottdiener JS,Grayburn PA, et al. Recommendations for evaluation of prostheticvalves with echocardiography and doppler ultrasound: a reportfrom the American Society of Echocardiography’s Guidelines and
W S Choo and R P Steeds
S256 The British Journal of Radiology, Special Issue 2011

Standards Committee and the Task Force on Prosthetic Valves,developed in conjunction with the American College ofCardiology Cardiovascular Imaging Committee, CardiacImaging Committee of the American Heart Association, theEuropean Association of Echocardiography, a registered branchof the European Society of Cardiology, the Japanese Society ofEchocardiography and the Canadian Society ofEchocardiography, endorsed by the American College ofCardiology Foundation, American Heart Association, EuropeanAssociation of Echocardiography, a registered branch of theEuropean Society of Cardiology, the Japanese Society ofEchocardiography, and Canadian Society of Echocardiography.J Am Soc Echocardiogr 2009;22:975–1014; quiz 1082–4.
60. Vahanian A, Baumgartner H, Bax J, Butchart E, Dion R,Filippatos G, et al. Guidelines on the management ofvalvular heart disease: The Task Force on the Managementof Valvular Heart Disease of the European Society ofCardiology. Eur Heart J 2007;28:230–68.
61. Montorsi P, De Bernardi F, Muratori M, Cavoretto D, Pepi M.Role of cine-fluoroscopy, transthoracic, and transesophagealechocardiography in patients with suspected prostheticheart valve thrombosis. Am J Cardiol 2000;85:58–64.
62. LaBounty TM, Agarwal PP, Chughtai A, Bach DS, WizauerE, Kazerooni EA. Evaluation of mechanical heart valve sizeand function with ECG-gated 64-MDCT. AJR Am JRoentgenol 2009;193:W389–96.
63. Levine GN, Gomes AS, Arai AE, Bluemke DA, Flamm SD,Kanal E, et al. Safety of magnetic resonance imaging inpatients with cardiovascular devices: an AmericanHeart Association scientific statement from the Committeeon Diagnostic and Interventional Cardiac Catheterization,Council on Clinical Cardiology, and the Council onCardiovascular Radiology and Intervention: endorsed bythe American College of Cardiology Foundation, the NorthAmerican Society for Cardiac Imaging, and the Society forCardiovascular Magnetic Resonance. Circulation 2007;116:2878–91.
64. American College of Cardiology/American HeartAssociation. 2008 Focused Update Incorporated into theACC/AHA 2006 Guidelines for the Management ofPatients With Valvular Heart Disease: A Report of theAmerican College of Cardiology/American Heart Asso-ciation Task Force on Practice Guidelines. Circulation2008;118:e523–e661.
Valvular heart disease: an imaging update
The British Journal of Radiology, Special Issue 2011 S257