cardiovascular risk prediction using who/ish chart … · ppt file · web view2017-02-03 ·...
TRANSCRIPT
Cardiovascular Risk Prediction Using WHO/ISH Chart in Urban and Rural Subjects Attending
Diabetes Screening Clinic: A Pilot Study
Dr. Rohit A, Dr Balu P SPublic Health Specialist [ NCD]
India
Introduction
Introduction
Introduction
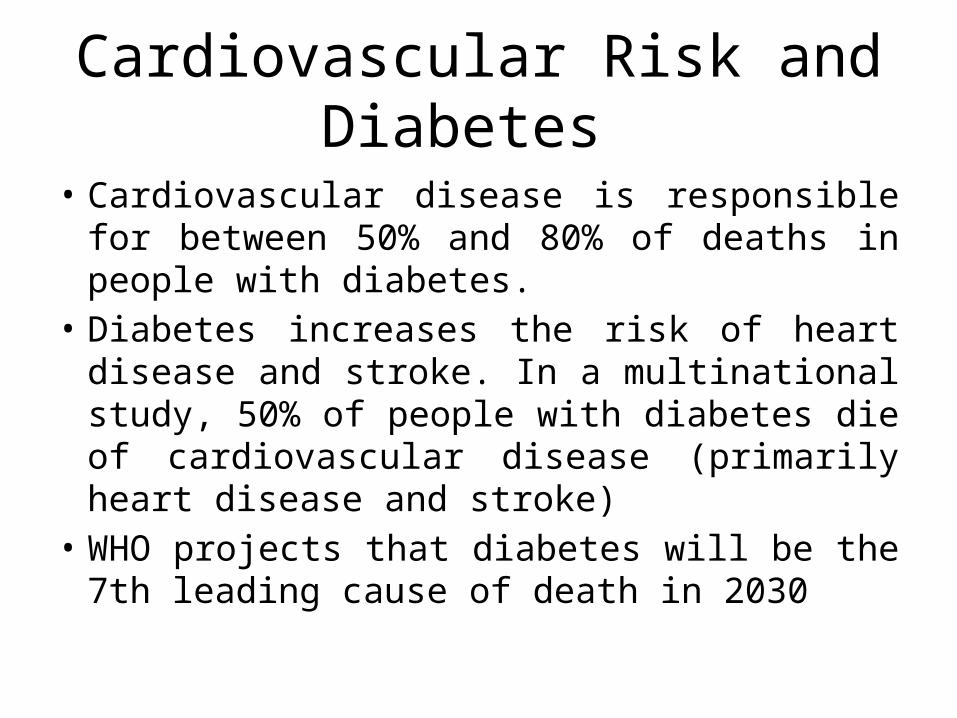
Cardiovascular Risk and Diabetes
• Cardiovascular disease is responsible for between 50% and 80% of deaths in people with diabetes.
• Diabetes increases the risk of heart disease and stroke. In a multinational study, 50% of people with diabetes die of cardiovascular disease (primarily heart disease and stroke)
• WHO projects that diabetes will be the 7th leading cause of death in 2030
Introduction
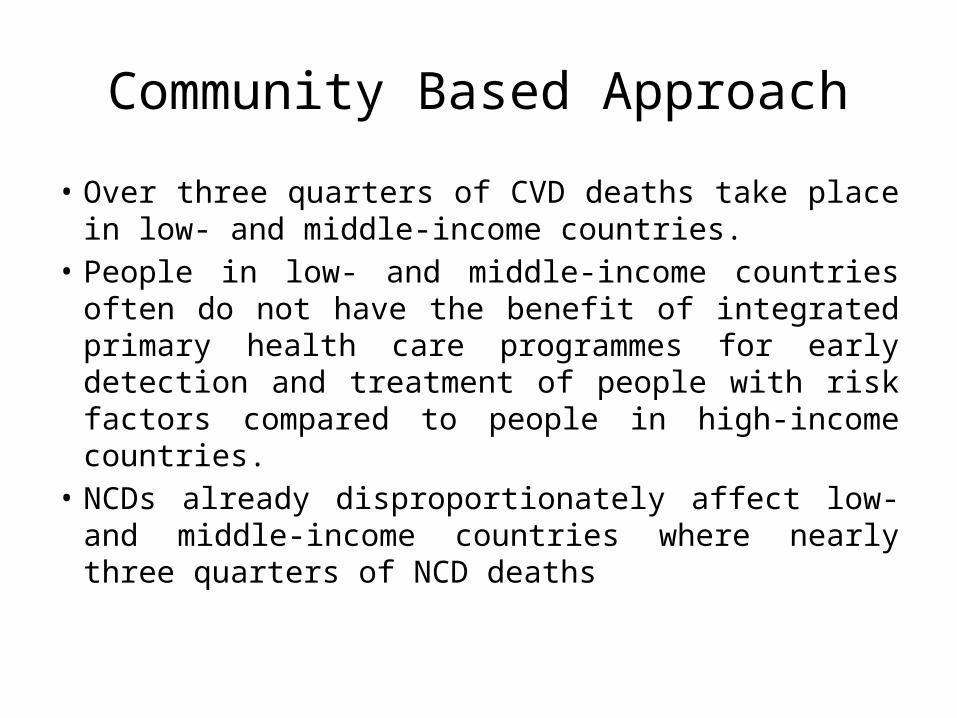
Community Based Approach
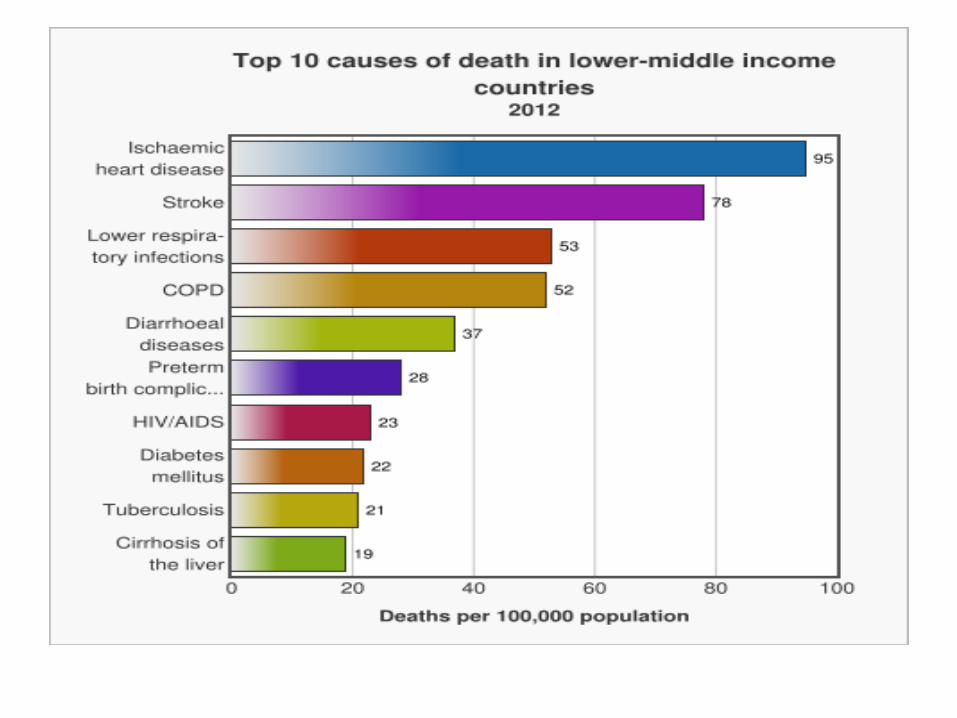
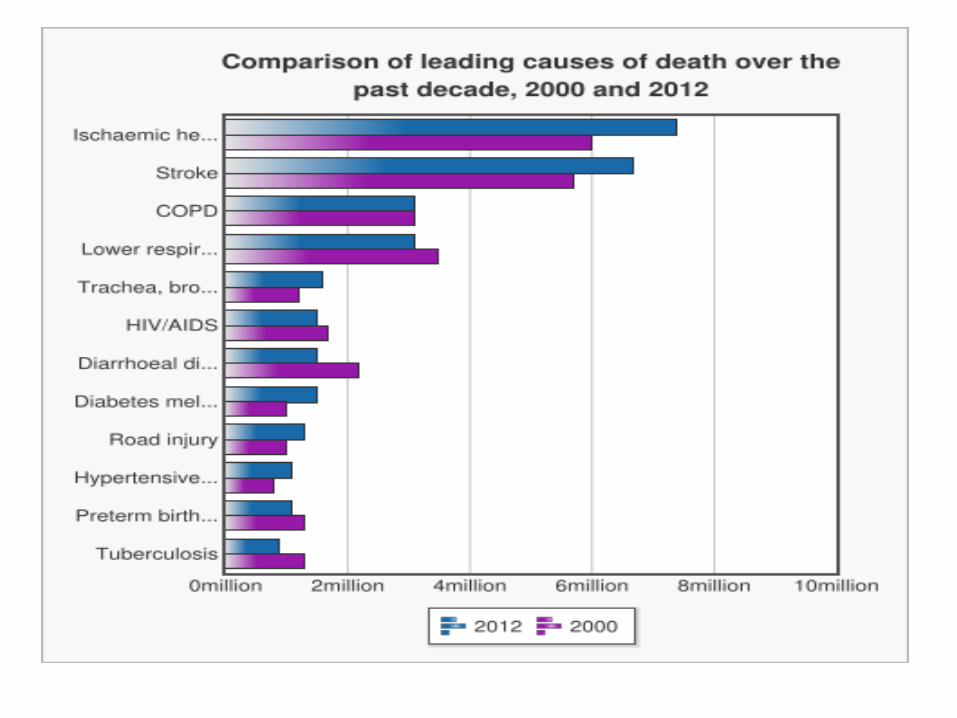
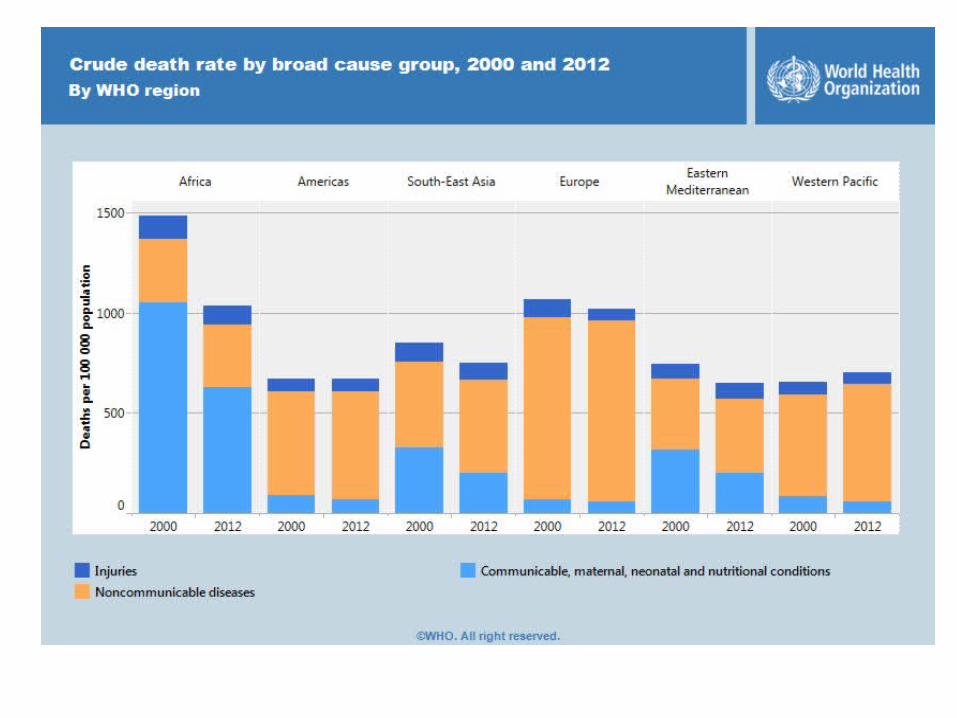
• Over three quarters of CVD deaths take place in low- and middle-income countries.
• People in low- and middle-income countries often do not have the benefit of integrated primary health care programmes for early detection and treatment of people with risk factors compared to people in high-income countries.
• NCDs already disproportionately affect low- and middle-income countries where nearly three quarters of NCD deaths
Introduction
Objective
• To assess 10 year risk of a fatal or non-fatal cardiovascular event in adults attending diabetes screening clinic using WHO/ISH risk prediction chart
Objective
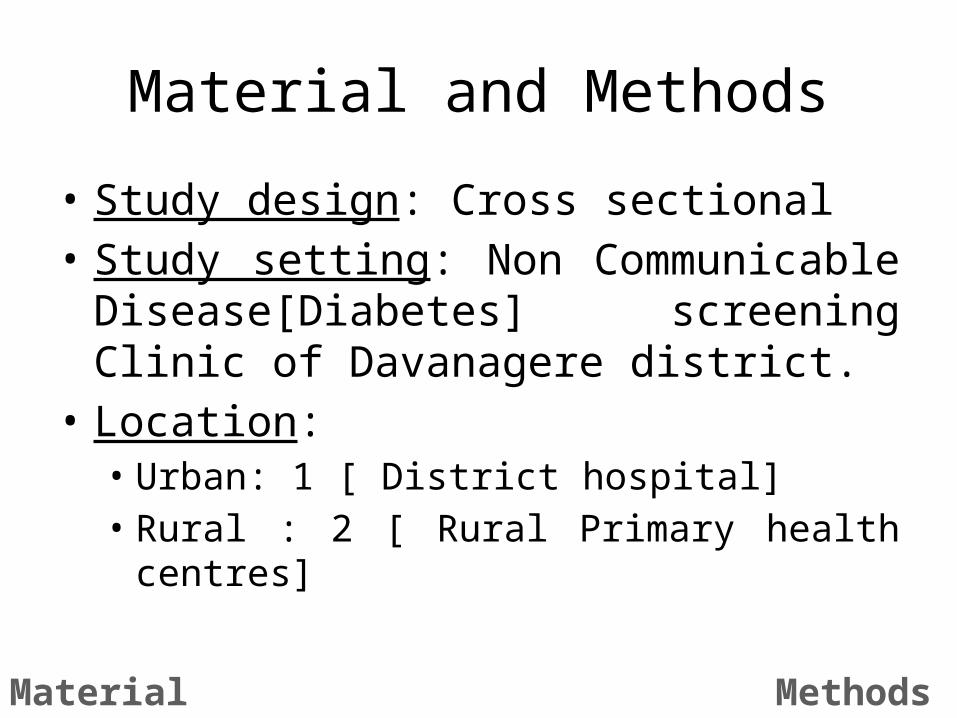
Material and Methods
• Study design: Cross sectional• Study setting: Non Communicable
Disease[Diabetes] screening Clinic of Davanagere district.
• Location: • Urban: 1 [ District hospital]• Rural : 2 [ Rural Primary health centres]
Material Methods

Material and Methods
• Study population: Adults aged more than 40 years
• Inclusion criteria: Age > 40 years• Exclusion criteria: – Pre existing heart condition – Other major cardiac abnormality– Age more than 80 years
Material Methods
Material and Methods
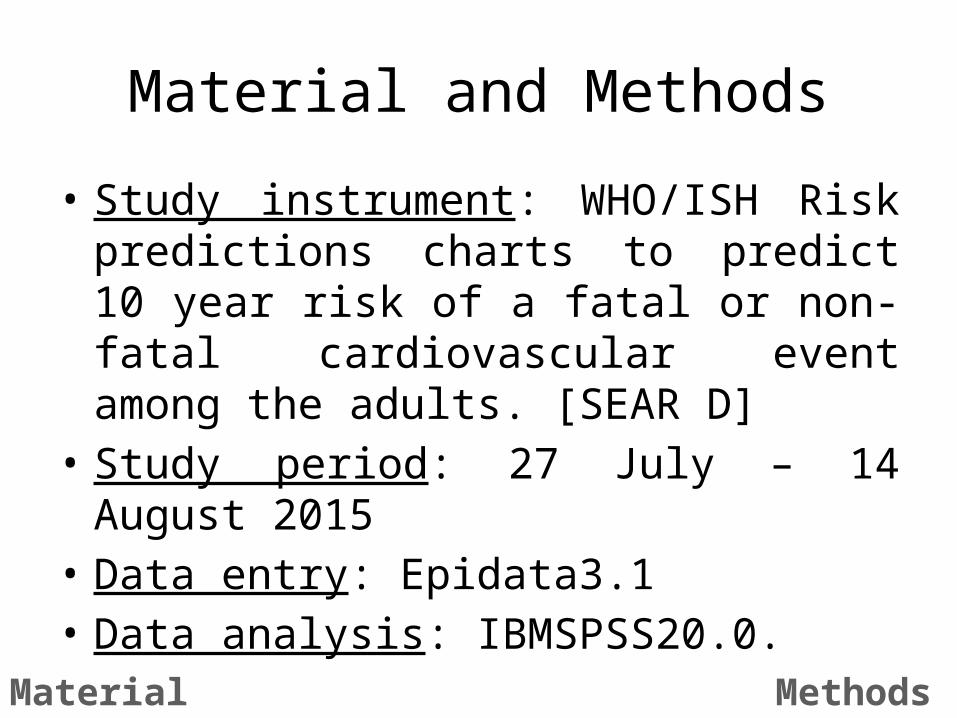
• Study instrument: WHO/ISH Risk predictions charts to predict 10 year risk of a fatal or non-fatal cardiovascular event among the adults. [SEAR D]
• Study period: 27 July – 14 August 2015• Data entry: Epidata3.1• Data analysis: IBMSPSS20.0.
Material Methods
WHO/ISH Chart
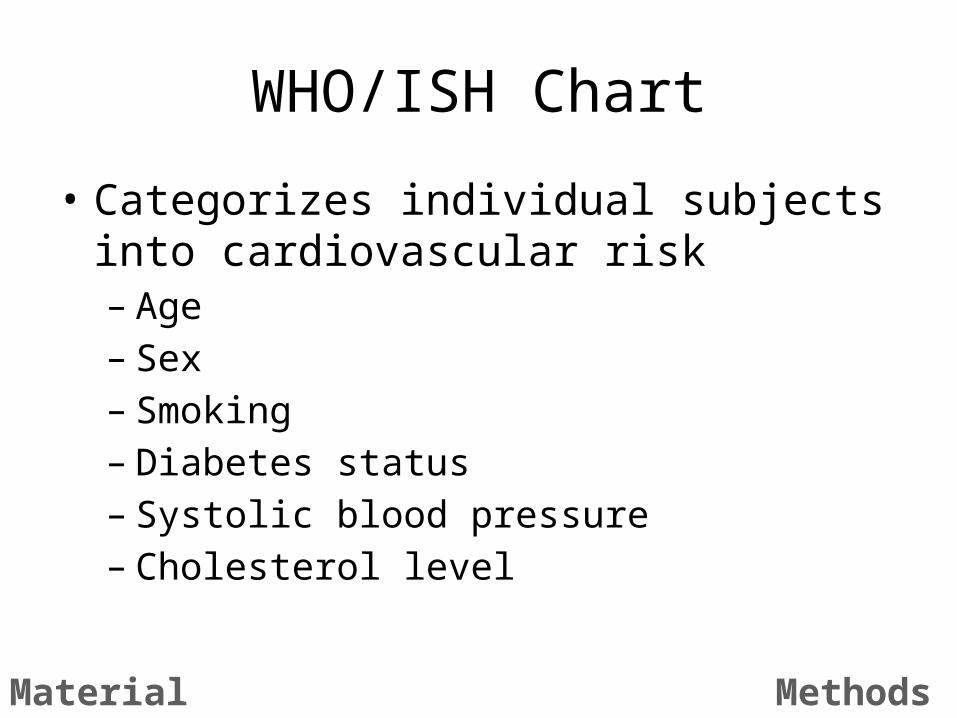
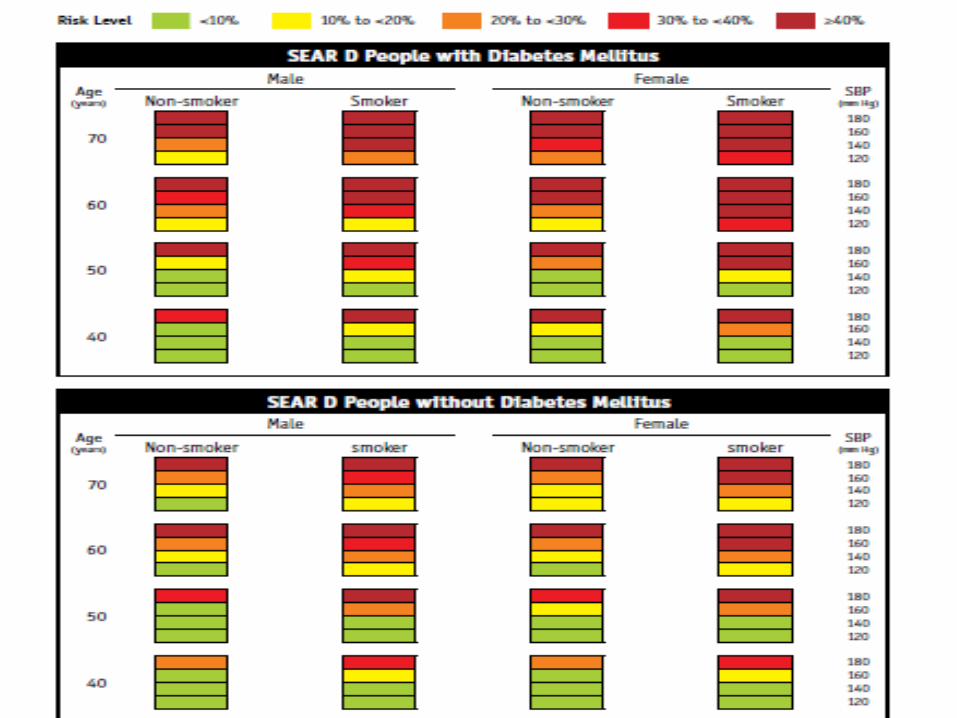
• Categorizes individual subjects into cardiovascular risk – Age– Sex– Smoking– Diabetes status– Systolic blood pressure– Cholesterol level
Material Methods
Results
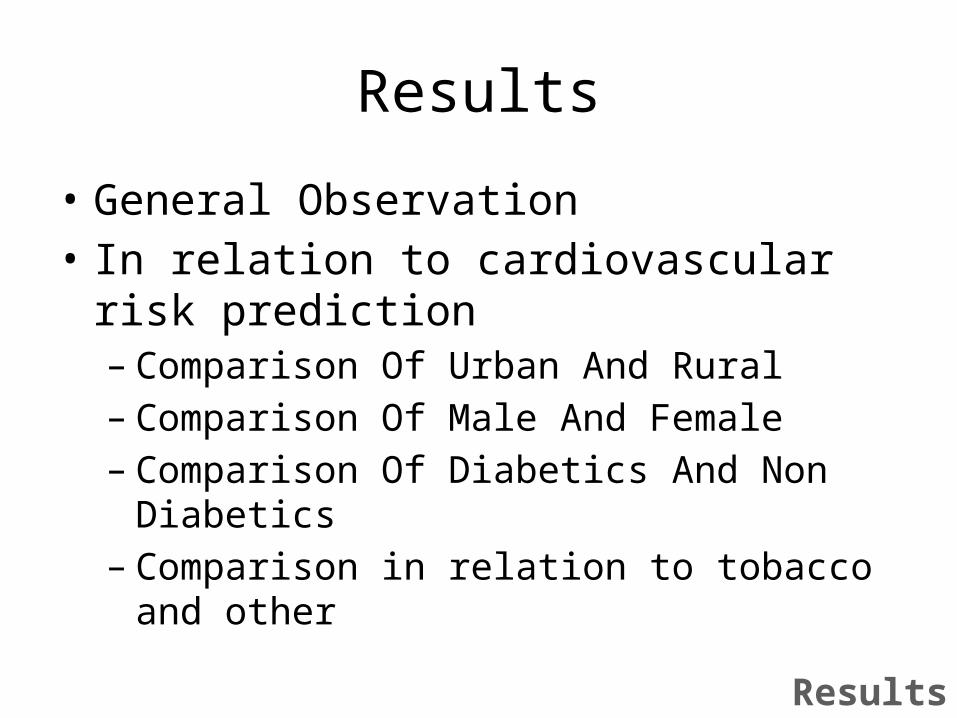
• General Observation • In relation to cardiovascular risk prediction– Comparison Of Urban And Rural– Comparison Of Male And Female– Comparison Of Diabetics And Non Diabetics– Comparison in relation to tobacco and other
Results
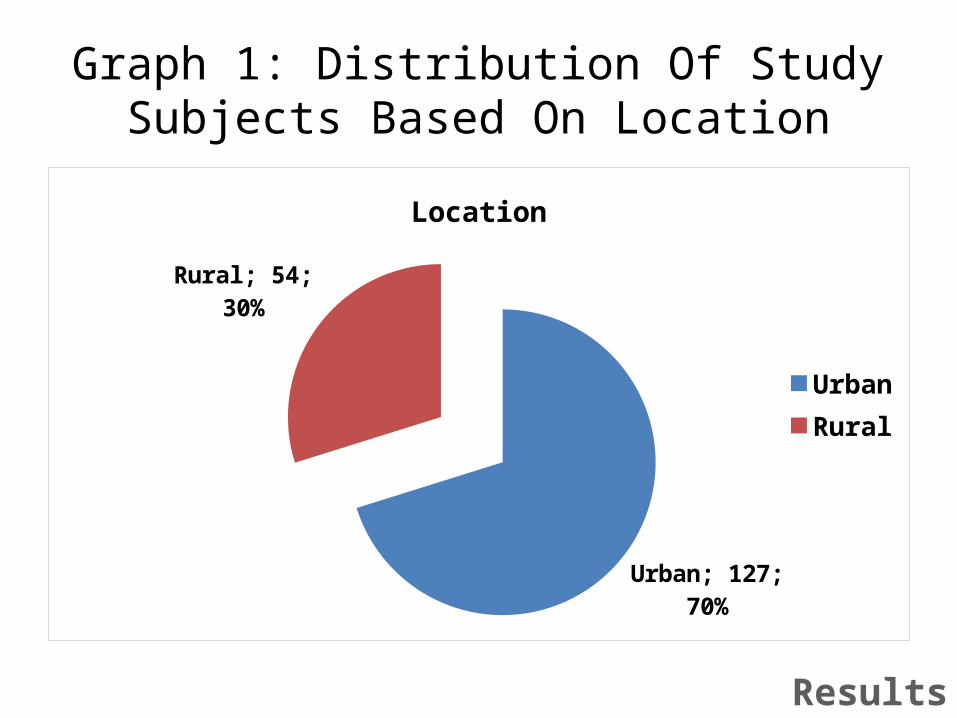
Graph 1: Distribution Of Study Subjects Based On Location
Urban; 127; 70%
Rural; 54; 30%
Location
UrbanRural
Results
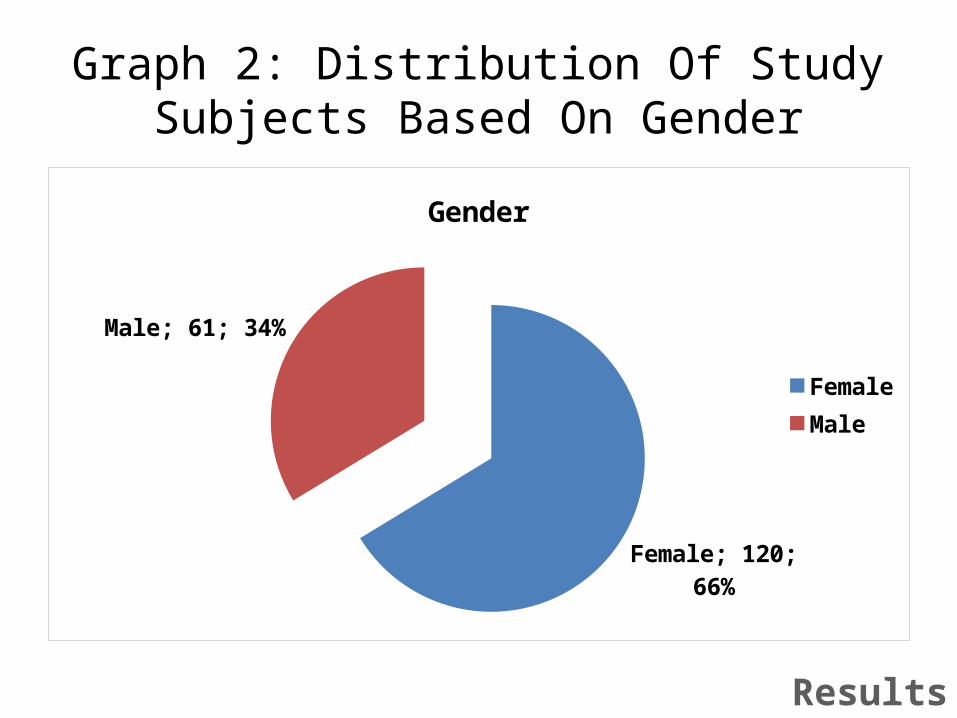
Graph 2: Distribution Of Study Subjects Based On Gender
Female; 120; 66%
Male; 61; 34%
Gender
FemaleMale
Results
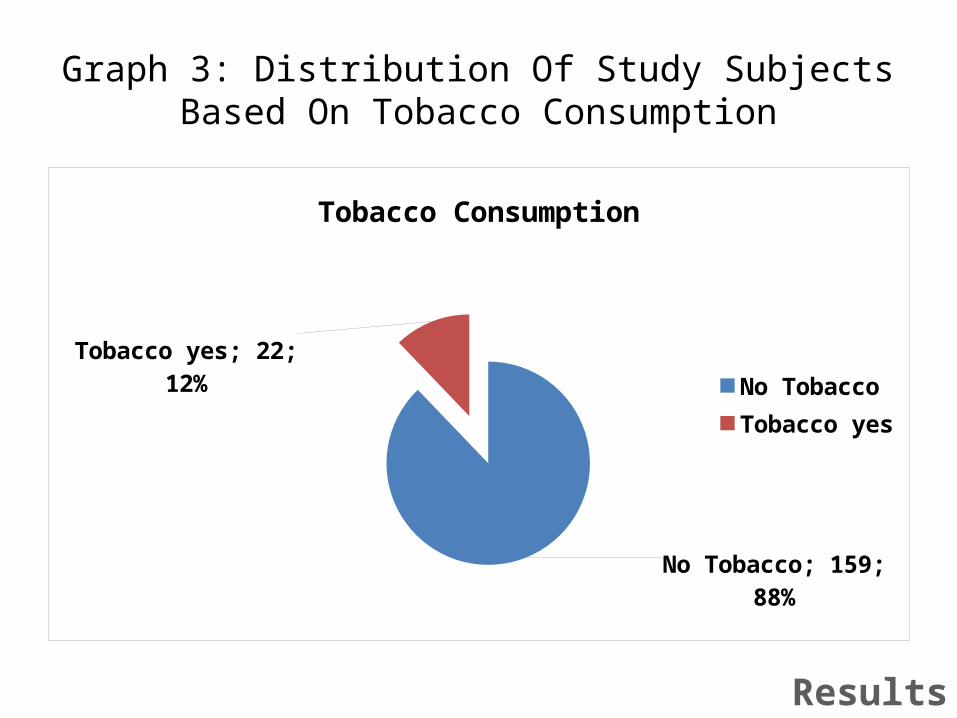
Graph 3: Distribution Of Study Subjects Based On Tobacco Consumption
No Tobacco; 159; 88%
Tobacco yes; 22; 12%
Tobacco Consumption
No TobaccoTobacco yes
Results
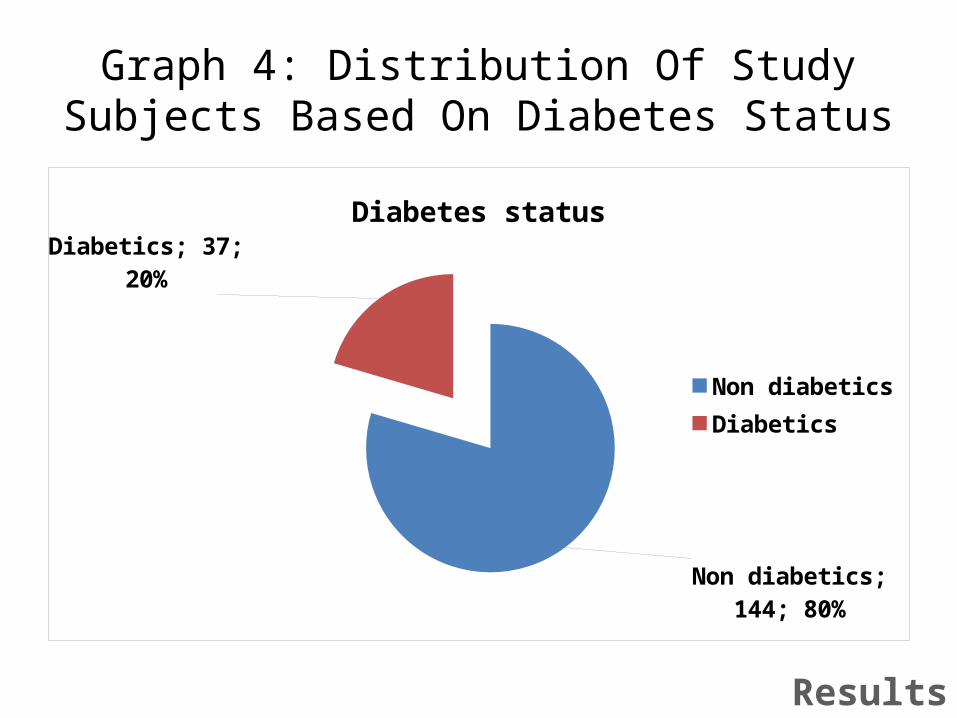
Graph 4: Distribution Of Study Subjects Based On Diabetes Status
Non diabetics; 144; 80%
Diabetics; 37; 20%
Diabetes status
Non diabeticsDiabetics
Results

Graph 5a: Distribution Of Study Subjects Based On Cardiovascular Risk
< 10 %; 127; 70%
10 to 20 %; 31; 17%
20 to 30 %; 14; 8%
30 to 40 %; 3; 2% > 40 %; 6; 3%
Cardiovascular risk
< 10 %10 to 20 %20 to 30 %30 to 40 %> 40 %
Results

Graph 5b: Distribution Of Study Subjects Based On Cardiovascular Risk
< 10 % 10 to 20 % 20 to 30 % 30 to 40 % > 40 %0
20
40
60
80
100
120
140< 10 %; 127
10 to 20 %; 31
20 to 30 %; 1430 to 40 %; 3 > 40 %; 6
Cardiovascular risk
Results

Graph 5c: Distribution Of Study Subjects Based On Cardiovascular Risk
Less than 20 % More than 20 %0
20
40
60
80
100
120
140
160
180 Less than 20 %; 158
More than 20 %; 23
Results
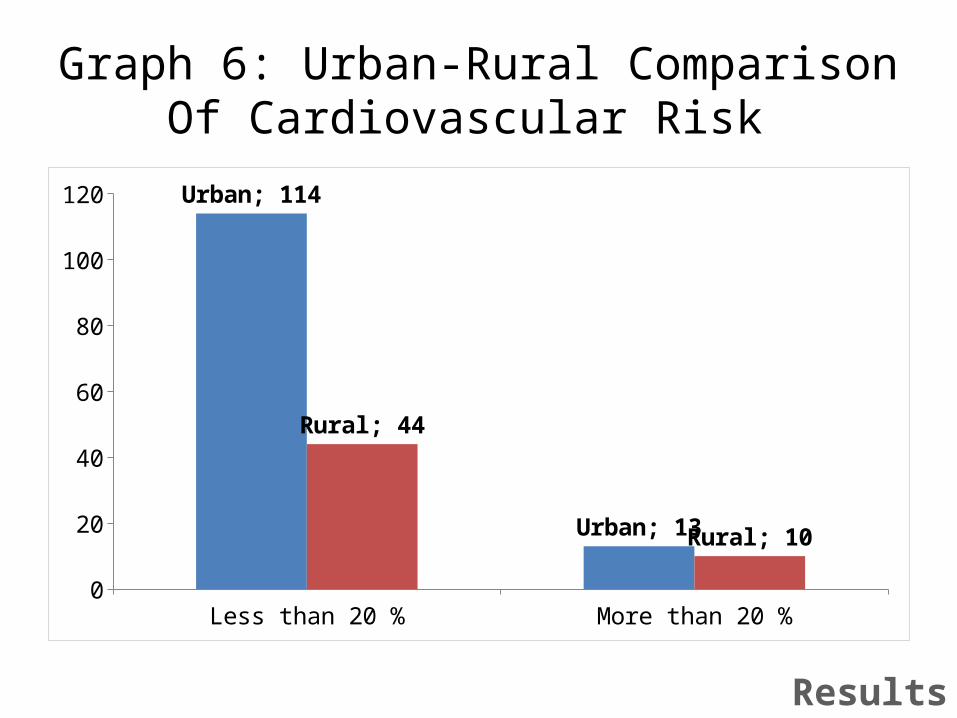
Graph 6: Urban-Rural Comparison Of Cardiovascular Risk
Less than 20 % More than 20 %0
20
40
60
80
100
120 Urban; 114
Urban; 13
Rural; 44
Rural; 10
Results
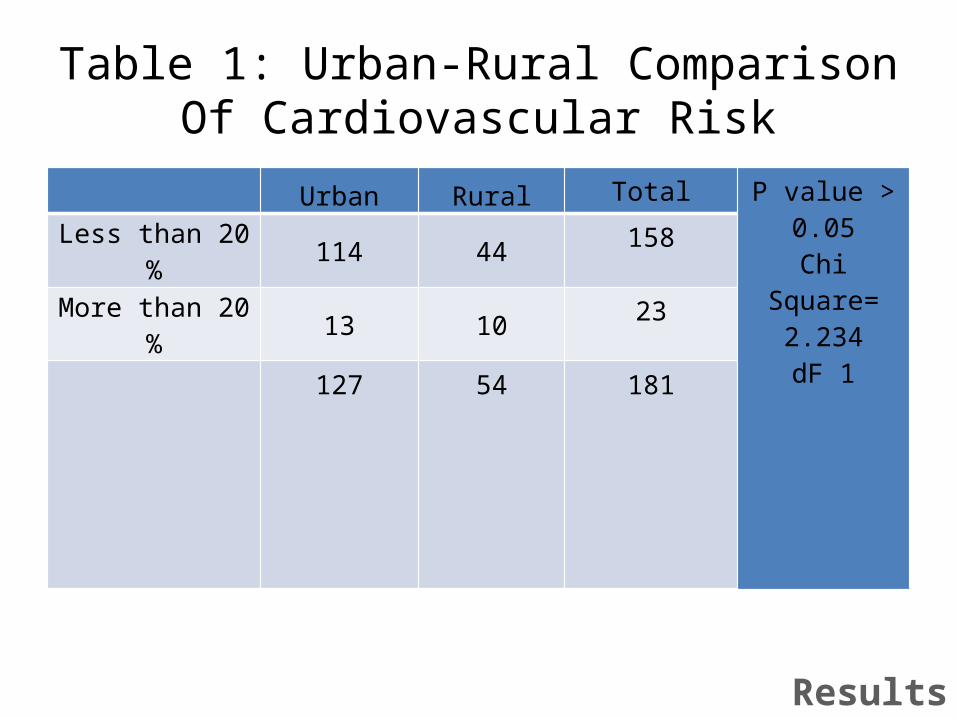
Table 1: Urban-Rural Comparison Of Cardiovascular Risk
Urban Rural Total P value > 0.05Chi Square=
2.234dF 1
Less than 20 % 114 44 158
More than 20 % 13 10 23127 54 181
Results
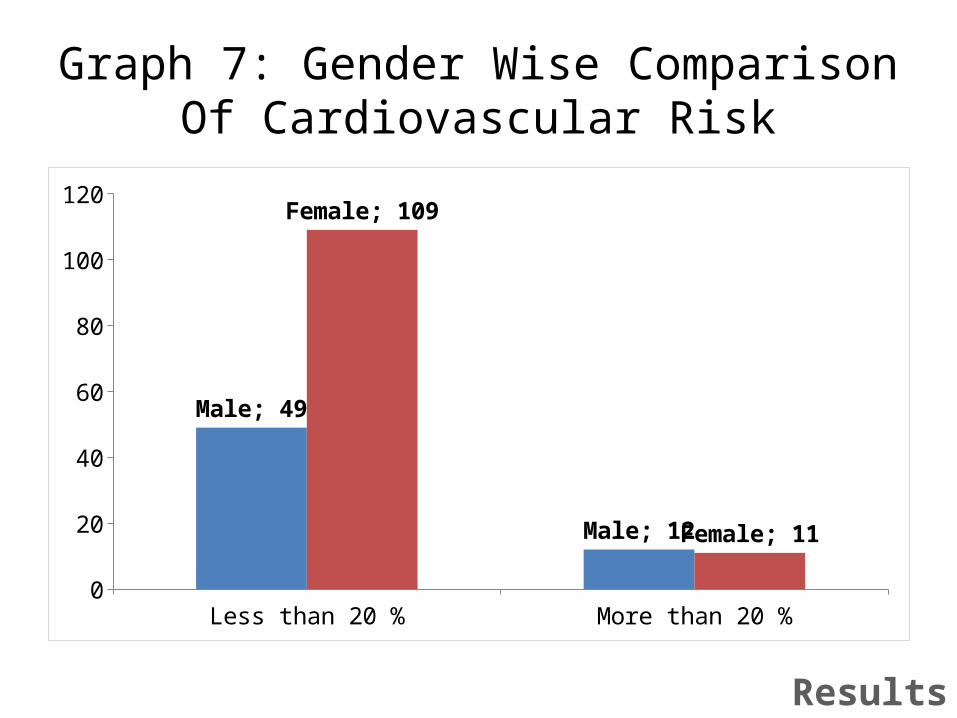
Graph 7: Gender Wise Comparison Of Cardiovascular Risk
Less than 20 % More than 20 %0
20
40
60
80
100
120
Male; 49
Male; 12
Female; 109
Female; 11
Results
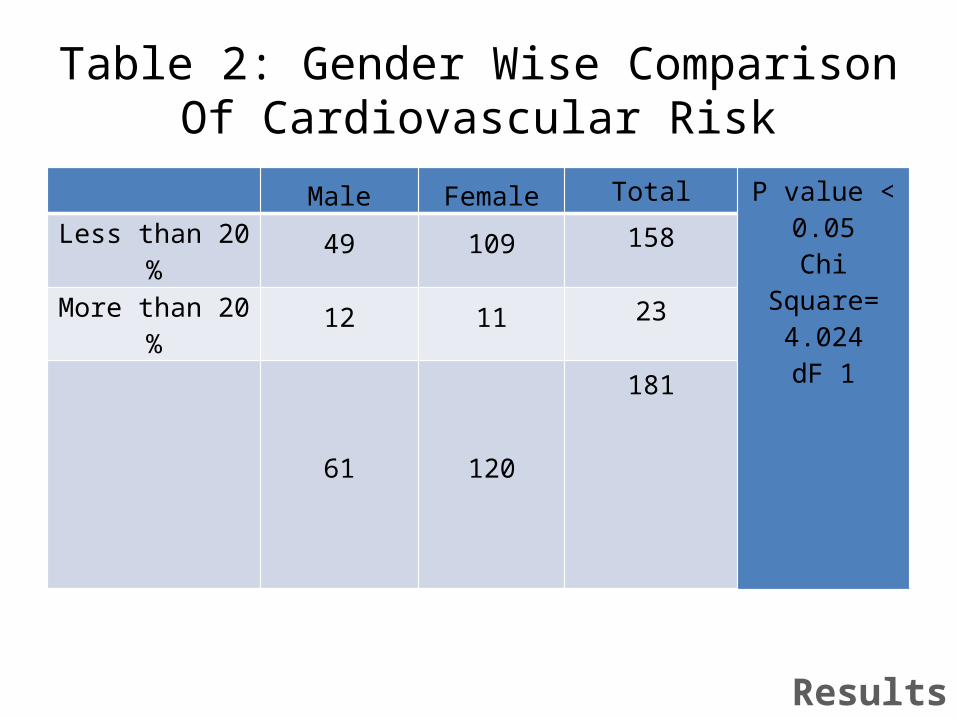
Table 2: Gender Wise Comparison Of Cardiovascular Risk
Male Female Total P value < 0.05Chi Square=
4.024dF 1
Less than 20 % 49 109 158
More than 20 % 12 11 23
61 120181
Results
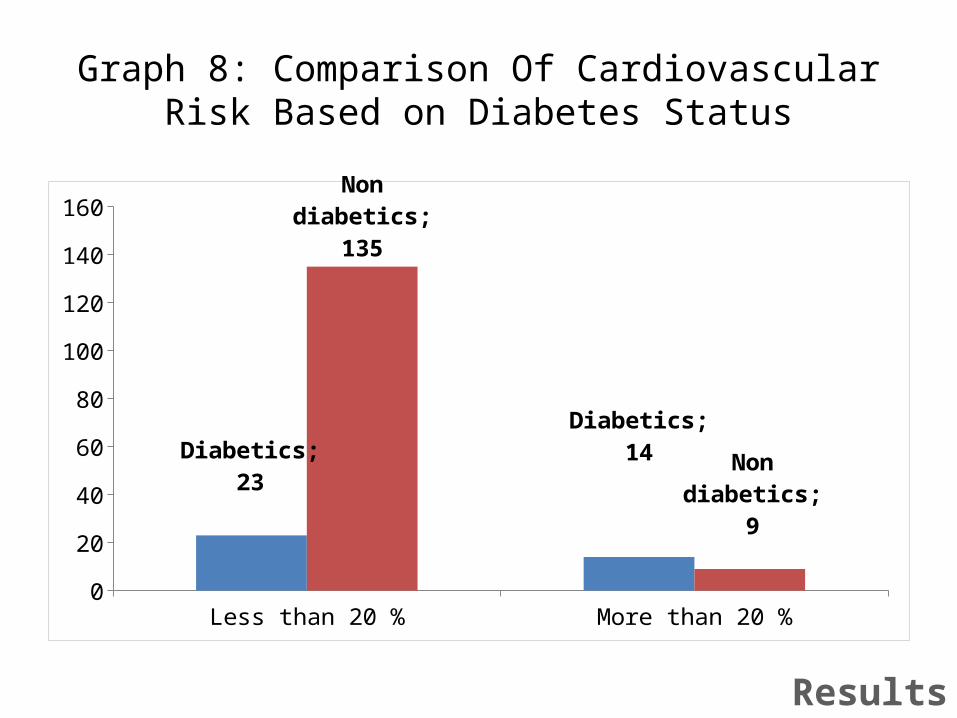
Graph 8: Comparison Of Cardiovascular Risk Based on Diabetes Status
Less than 20 % More than 20 %0
20
40
60
80
100
120
140
160
Diabetics; 23Diabetics; 14
Non diabetics; 135
Non diabetics; 9
Results

Table 3: Comparison Of Cardiovascular Risk Based on Diabetes Status
DiabeticsNon
diabeticsTotal P value < 0.05
Chi Square= 26.479
dF 1Less than 20 % 23 135 158
More than 20 % 14 9 23
37 144181
Results
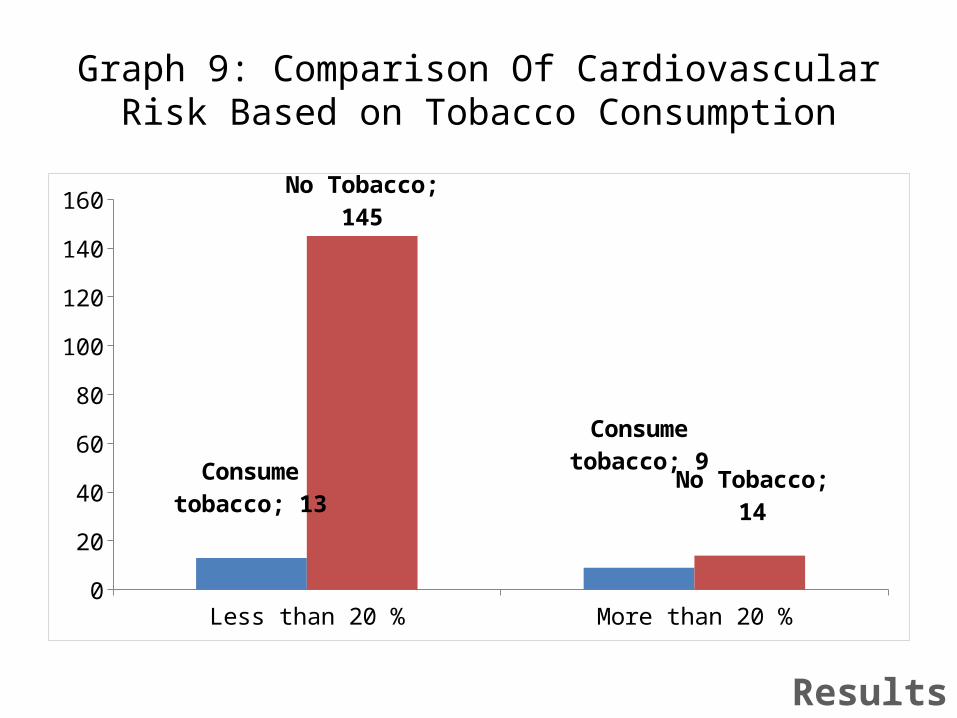
Graph 9: Comparison Of Cardiovascular Risk Based on Tobacco Consumption
Less than 20 % More than 20 %0
20
40
60
80
100
120
140
160
Consume tobacco; 13
Consume tobacco; 9
No Tobacco; 145
No Tobacco; 14
Results
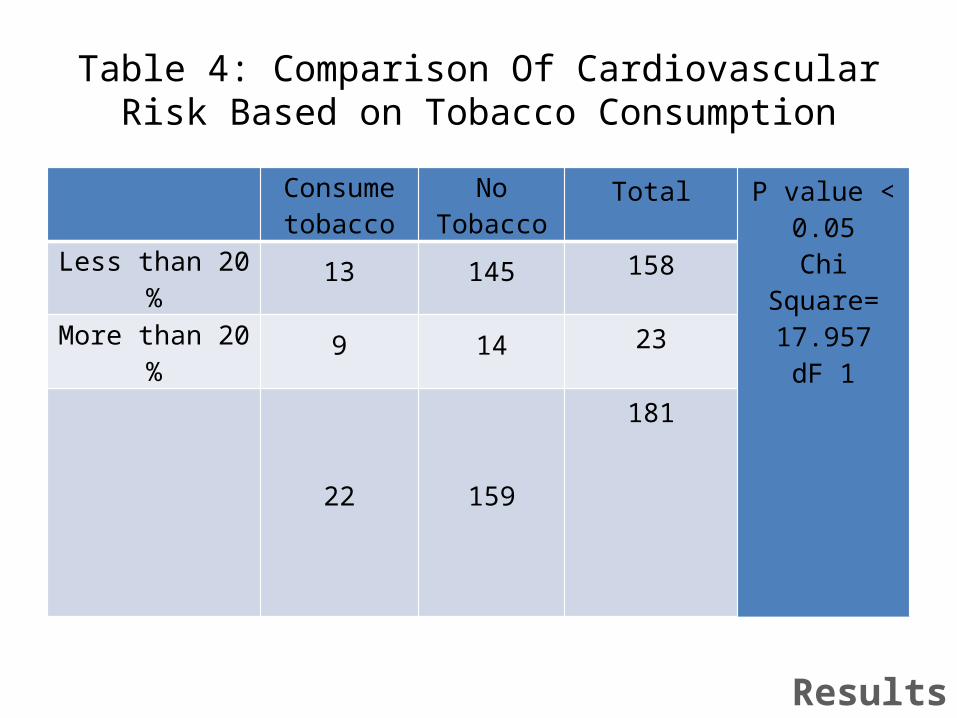
Table 4: Comparison Of Cardiovascular Risk Based on Tobacco Consumption
Consume tobacco No Tobacco
Total P value < 0.05Chi Square=
17.957dF 1
Less than 20 % 13 145 158
More than 20 % 9 14 23
22 159181
Results
Discussion
• Risk of cardiovascular event increases– Age– Gender– Diabetes – Smoking– Waist Hip Ratio– Hypertension– Location
• Studies from India and Abroad
Discussion
Conclusion
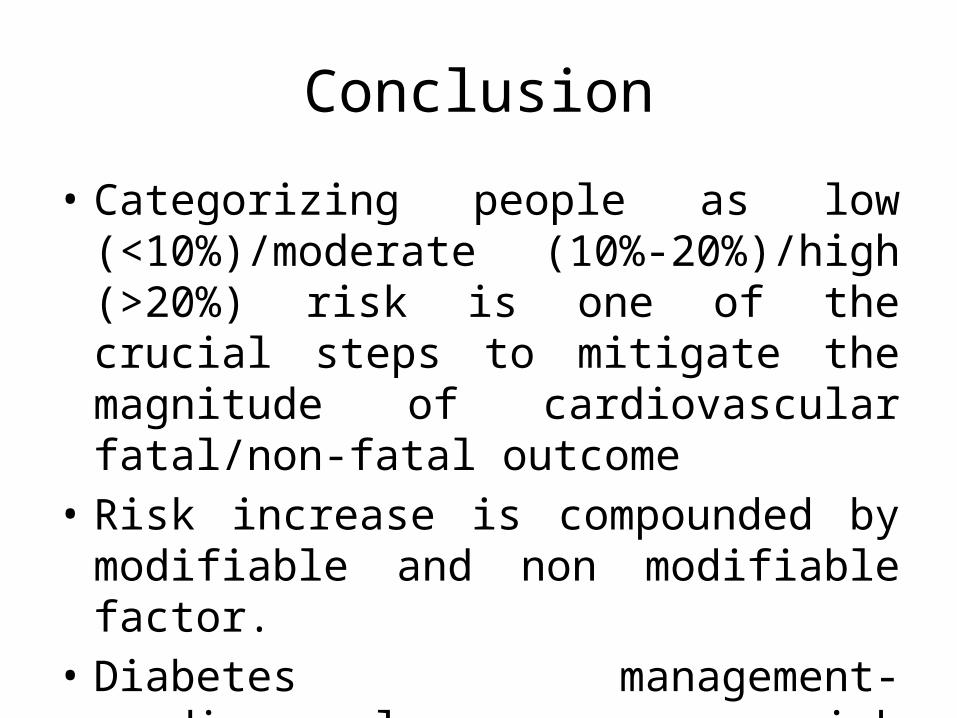
• Categorizing people as low (<10%)/moderate (10%-20%)/high (>20%) risk is one of the crucial steps to mitigate the magnitude of cardiovascular fatal/non-fatal outcome
• Risk increase is compounded by modifiable and non modifiable factor.
• Diabetes management- cardiovascular risk counselling.
Recommendations
• WHO/ISH Risk Prediction Chart– Evidence based– Simple tool– Used in community setting– Training– Counselling
References • Global status report on noncommunicable diseases 2014.
Geneva, World Health Organization, 2012. • World Health Organization. Global Health Estimates: Deaths by
Cause, Age, Sex and Country, 2000-2012. Geneva, WHO, 2014. • Mathers CD, Loncar D. Projections of global mortality and
burden of disease from 2002 to 2030. PLoS Med, 2006, 3(11):e442.
• Roglic G, Unwin N, Bennett PH, Mathers C, Tuomilehto J, Nag S et al. The burden of mortality attributable to diabetes: realistic estimates for the year 2000. Diabetes Care, 2005, 28(9):2130–2135.
References
References• Definition, diagnosis and classification of diabetes mellitus and
its complications. Part 1: Diagnosis and classification of diabetes mellitus. Geneva, World Health Organization, 1999 (WHO/NCD/NCS/99.2).
• Morrish NJ, Wang SL, Stevens LK, Fuller JH, Keen H. Mortality and causes of death in the WHO Multinational Study of Vascular Disease in Diabetes. Diabetologia 2001, 44 Suppl 2:S14–S21.
• Global data on visual impairments 2010. Geneva, World Health Organization, 2012.
• Global status report on noncommunicable diseases 2010. Geneva, World Health Organization, 2011.
References

Acknowledgement
• Dr Alur Manjunath, Principal, JJM Medical College
• Dr Balu P S, Professor, JJM Medical College• Dr Manu A S, JJM Medical College • KHSDRP, Karnataka• Department of Health and Family Welfare,
Davanagere District