carnegie mellon university center for innovation ... · building financial models carnegie mellon...
TRANSCRIPT
Building Financial Models
Carnegie Mellon University Center for Innovation & Entrepreneurship
Financial Modeling
Phil Compton, CoFounder & CFO Malcovery Security
www.malcovery.com February 18, 2015
Building Financial Models
My Background
• BS in Accounting – West Virginia University
• CPA, Entrepreneur, Investor, Advisor
• 30 years of largely entrepreneurial experience – Public Acctg - Coopers & Lybrand (PricewaterhouseCoopers) – Industry – Black Box (BBOX on Nasdaq), Mallett Technology,
WiseWire (CMU startup), CoManage, Netronome – Worked on LBO / IPO / Bankruptcy (Black Box), Sale
(WiseWire to Lycos), VC funding of nearly $60M (CoManage), commercial bank financing, sales contract negotiations, investor relations, Board level involvement, etc.
• Very active in local tech community
Building Financial Models
About Malcovery Security
• Founded at start of 2013, so we’re early stage
• Licensed technology from renowned university cyber security program
• Malcovery’s patented solutions help companies protect their NETWORK and their BRAND from the latest / worst email-based cyber threats (most common attack mode)
• Provide rich threat intelligence and analysis tools used by security teams to protect their company’s network, customers and intellectual property
• Closed 10 Fortune 500 companies in our first year!
Building Financial Models
Building Financial Models - Setting a Planning Horizon
• Typical timeframe is 3 to 4 years
• Usually monthly detail for first 2 years (obviously gets more difficult to estimate as you go out in time)
• What are you planning toward – Initial funding round or eventual liquidity event? – Building company to sell? – Shorter term focus, but be careful – Building company to become public (IPO)? – Not near as realistic
or even desirable these days – Building for the long term and see what happens?
• Be realistic in your numbers and the time it takes to achieve them • You will be viewed as credible / less risky if you are practical and
demonstrate good judgment in your projections • I just happened to build you a good, detailed model! (posted online)
Building Financial Models
Defining Relevant Assumptions
• Document the assumptions you make in building your model – Don’t rely on memory (Notes tab in model)
• Tells the audience a more complete story
• Tells the audience that you understand your own projections
• EVERYTHING affects your cash needs
• What type of company?
• Product or service?
• Build it or Buy it? (i.e. Manufacturer or Reseller)
• Revenues via Direct Sales team or Partners?
• What type / how many employees do you need to build your company and product or service?
Building Financial Models
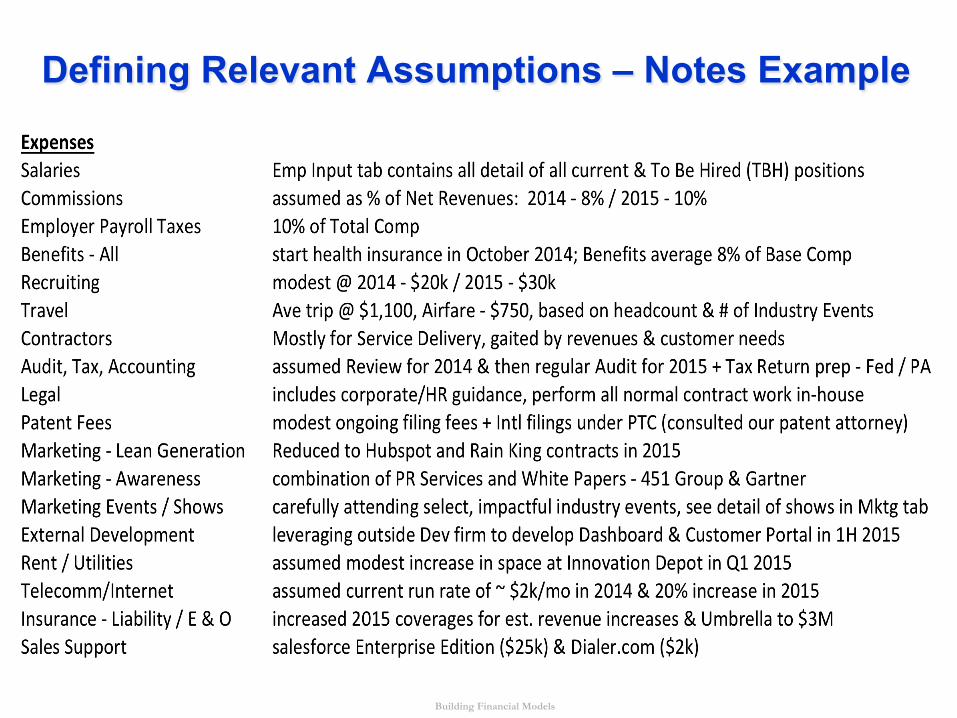
Defining Relevant Assumptions – Notes Example
Building Financial Models
Defining Relevant Assumptions (cont’d)
• What tools do these employees need to do their job?
• Where are you going to put them?
• What physical environment are you going to create?
• What data / telecomm infrastructure will you need?
• How long do you plan to stay in your original space?
• What kind of Marketing efforts will you need to gain mindshare in your industry / segment?
• How much will the Sales team travel?
• ALL these assumptions are “big ticket” costs that affect your initial and ongoing cash needs
Building Financial Models
Speaking of Cash
Cash is not only King …
Cash is KING KONG !!!
Building Financial Models
Developing a Basic Financial Model
• Keep it understandable and easy to update – because you will certainly need to update many times
• No glory in you building an exotic model if it’s too hard to readily review and to maintain
• Based on your assumptions - Build model so that you know what happens if you make changes (sensitivity): – Add a body – Offer more benefits – Purchase more computers / equipment – Need to expand inventory – Open a new office / location – In other words - Add any type of cost
Building Financial Models
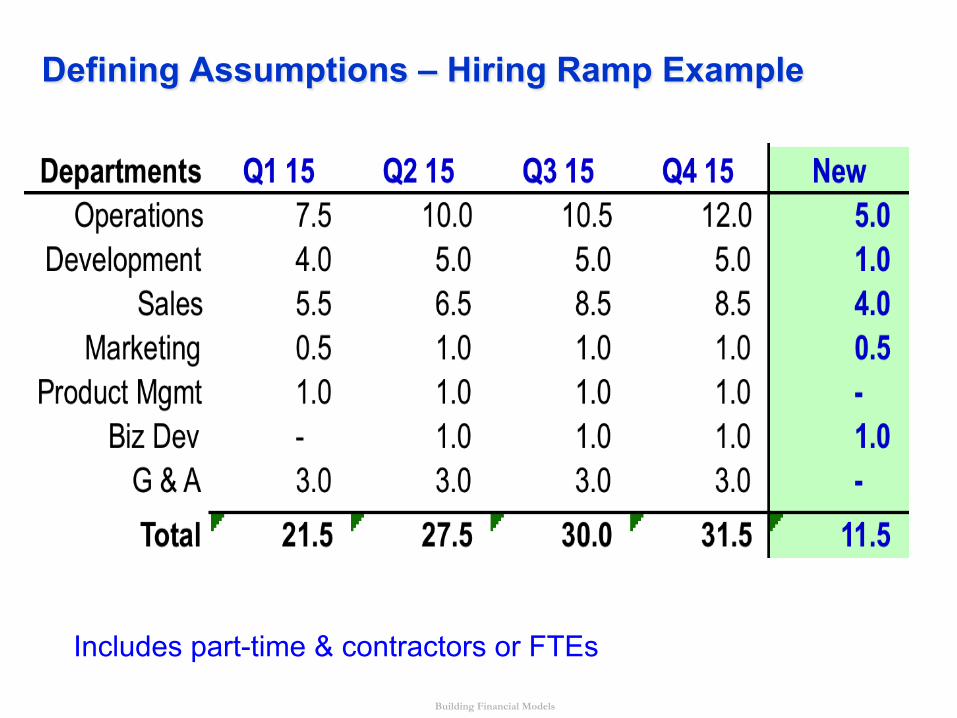
Defining Assumptions – Hiring Ramp Example
Includes part-time & contractors or FTEs
Building Financial Models
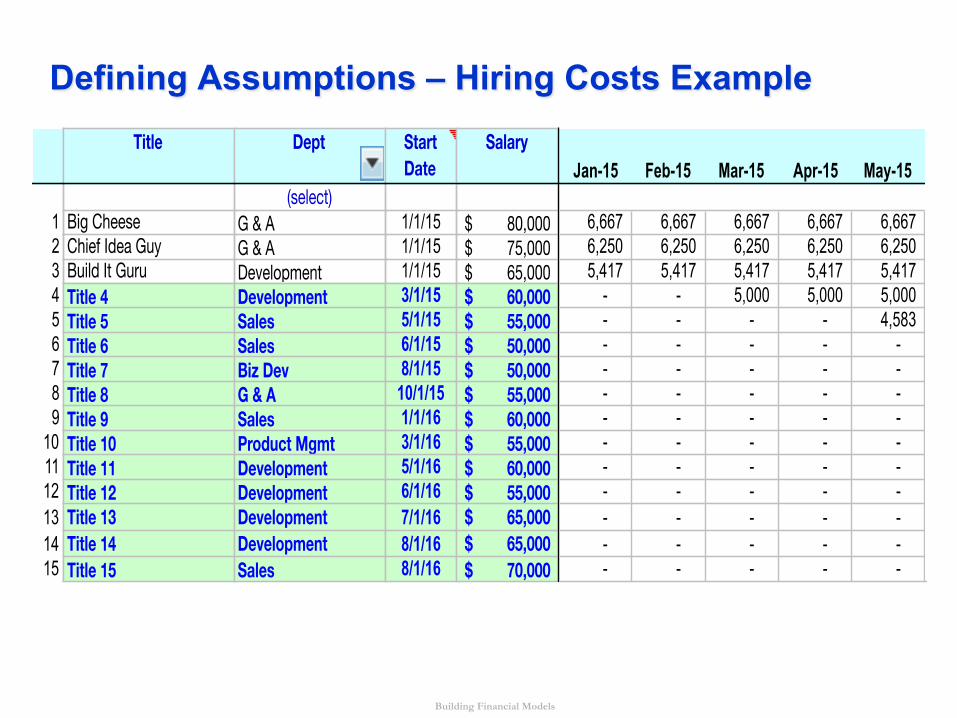
Defining Assumptions – Hiring Costs Example
123456789
101112131415
Title
Big CheeseChief Idea GuyBuild It GuruTitle 4Title 5Title 6Title 7Title 8Title 9Title 10Title 11Title 12Title 13Title 14Title 15
Dept
(select)G & AG & ADevelopmentDevelopmentSalesSalesBiz DevG & ASalesProduct MgmtDevelopmentDevelopmentDevelopmentDevelopmentSales
Start Date
1/1/151/1/151/1/153/1/155/1/156/1/158/1/1510/1/151/1/163/1/165/1/166/1/167/1/168/1/168/1/16
SalaryJan-15 Feb-15 Mar-15 Apr-15 May-15
80,000$ 6,667 6,667 6,667 6,667 6,667 75,000$ 6,250 6,250 6,250 6,250 6,250 65,000$ 5,417 5,417 5,417 5,417 5,417 60,000$ - - 5,000 5,000 5,000 55,000$ - - - - 4,583 50,000$ - - - - - 50,000$ - - - - - 55,000$ - - - - - 60,000$ - - - - - 55,000$ - - - - - 60,000$ - - - - - 55,000$ - - - - - 65,000$ - - - - - 65,000$ - - - - - 70,000$ - - - - -
Building Financial Models
Developing a Basic Financial Model
• Build model so that you perform data entry of variables in specific categories: – Headcount – Operating Expenses (Departments / cost structure) – Capital Expenditures – Revenues – Cost of Goods Sold (forces Inventory needs)
• that, in turn, feed into the 3 main financial statement templates of: – Income Statement – Balance Sheet – Cash Flow Statement
Building Financial Models
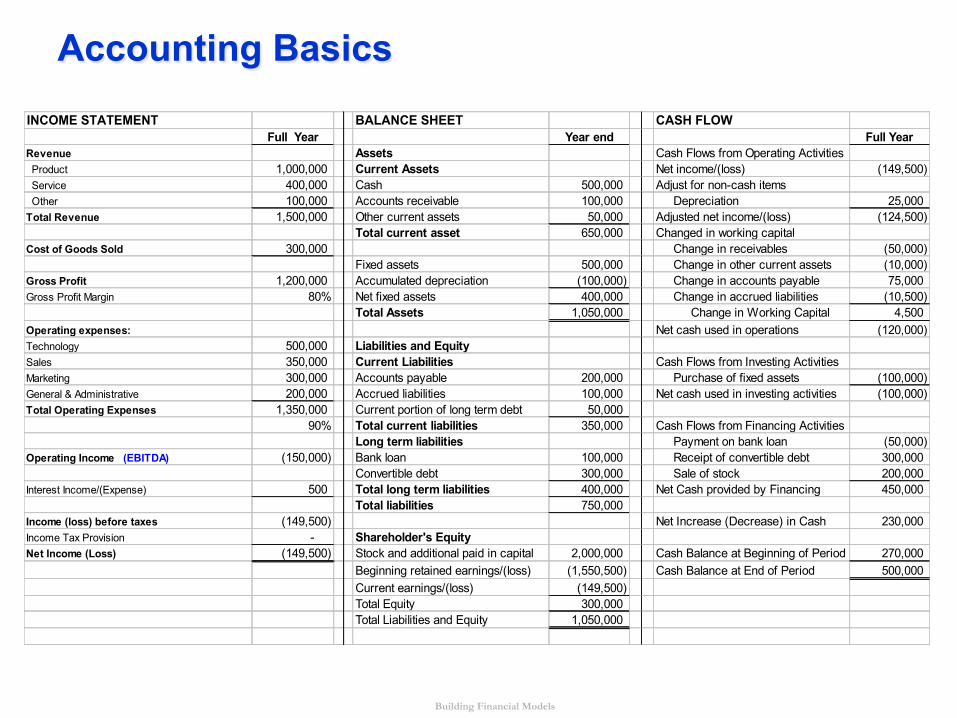
Accounting Basics INCOME STATEMENT BALANCE SHEET CASH FLOW
Full Year Year end Full YearRevenue Assets Cash Flows from Operating Activities Product 1,000,000 Current Assets Net income/(loss) (149,500) Service 400,000 Cash 500,000 Adjust for non-cash items Other 100,000 Accounts receivable 100,000 Depreciation 25,000 Total Revenue 1,500,000 Other current assets 50,000 Adjusted net income/(loss) (124,500)
Total current asset 650,000 Changed in working capitalCost of Goods Sold 300,000 Change in receivables (50,000)
Fixed assets 500,000 Change in other current assets (10,000) Gross Profit 1,200,000 Accumulated depreciation (100,000) Change in accounts payable 75,000 Gross Profit Margin 80% Net fixed assets 400,000 Change in accrued liabilities (10,500)
Total Assets 1,050,000 Change in Working Capital 4,500 Operating expenses: Net cash used in operations (120,000) Technology 500,000 Liabilities and EquitySales 350,000 Current Liabilities Cash Flows from Investing ActivitiesMarketing 300,000 Accounts payable 200,000 Purchase of fixed assets (100,000) General & Administrative 200,000 Accrued liabilities 100,000 Net cash used in investing activities (100,000) Total Operating Expenses 1,350,000 Current portion of long term debt 50,000
90% Total current liabilities 350,000 Cash Flows from Financing ActivitiesLong term liabilities Payment on bank loan (50,000)
Operating Income (EBITDA) (150,000) Bank loan 100,000 Receipt of convertible debt 300,000 Convertible debt 300,000 Sale of stock 200,000
Interest Income/(Expense) 500 Total long term liabilities 400,000 Net Cash provided by Financing 450,000 Total liabilities 750,000
Income (loss) before taxes (149,500) Net Increase (Decrease) in Cash 230,000 Income Tax Provision - Shareholder's EquityNet Income (Loss) (149,500) Stock and additional paid in capital 2,000,000 Cash Balance at Beginning of Period 270,000
Beginning retained earnings/(loss) (1,550,500) Cash Balance at End of Period 500,000 Current earnings/(loss) (149,500) Total Equity 300,000 Total Liabilities and Equity 1,050,000

Building Financial Models
Accounting 101 - Reconciliations INCOME STATEMENT BALANCE SHEET CASH FLOW
Full Year Year end Full YearRevenue Assets Cash Flows from Operating Activities Software 1,000,000 Current Assets Net income/(loss) (149,500) Service 400,000 Cash 500,000 Adjust for non-cash items Other 100,000 Accounts receivable 100,000 Depreciation 25,000 Total Revenue 1,500,000 Other current assets 50,000 Adjusted net income/(loss) (124,500)
Total current asset 650,000 Changed in working capitalCost of Goods Sold 300,000 Change in receivables (50,000)
Fixed assets 500,000 Change in other current assets (10,000) Gross Profit 1,200,000 Accumulated depreciation (100,000) Change in accounts payable 75,000 Gross Profit Margin 80% Net fixed assets 400,000 Change in accrued liabilities (10,500)
Total Assets 1,050,000 Change in Working Capital 4,500 Operating expenses: Net cash used in operations (120,000) Technology 500,000 Liabilities and EquitySales 350,000 Current Liabilities Cash Flows from Investing ActivitiesMarketing 300,000 Accounts payable 200,000 Purchase of fixed assets (100,000) General & Administrative 200,000 Accrued liabilities 100,000 Net cash used in investing activities (100,000) Total Operating Expenses 1,350,000 Current portion of long term debt 50,000
90% Total current liabilities 350,000 Cash Flows from Financing ActivitiesLong term liabilities Payment on bank loan (50,000)
Operating Income (150,000) Bank loan 100,000 Receipt of convertible debt 300,000 Convertible debt 300,000 Sale of stock 200,000
Interest Income/(Expense) 500 Total long term liabilities 400,000 Net Cash provided by Financing 450,000 Total liabilities 750,000
Income (loss) before taxes (149,500) Net Increase (Decrease) in Cash 230,000 Income Tax Provision - Shareholder's EquityNet Income (Loss) (149,500) Stock and additional paid in capital 2,000,000 Cash Balance at Beginning of Period 270,000
Beginning retained earnings/(loss) (1,550,500) Cash Balance at End of Period 500,000 Current earnings/(loss) (149,500) Total Equity 300,000 Total Liabilities and Equity 1,050,000
Building Financial Models
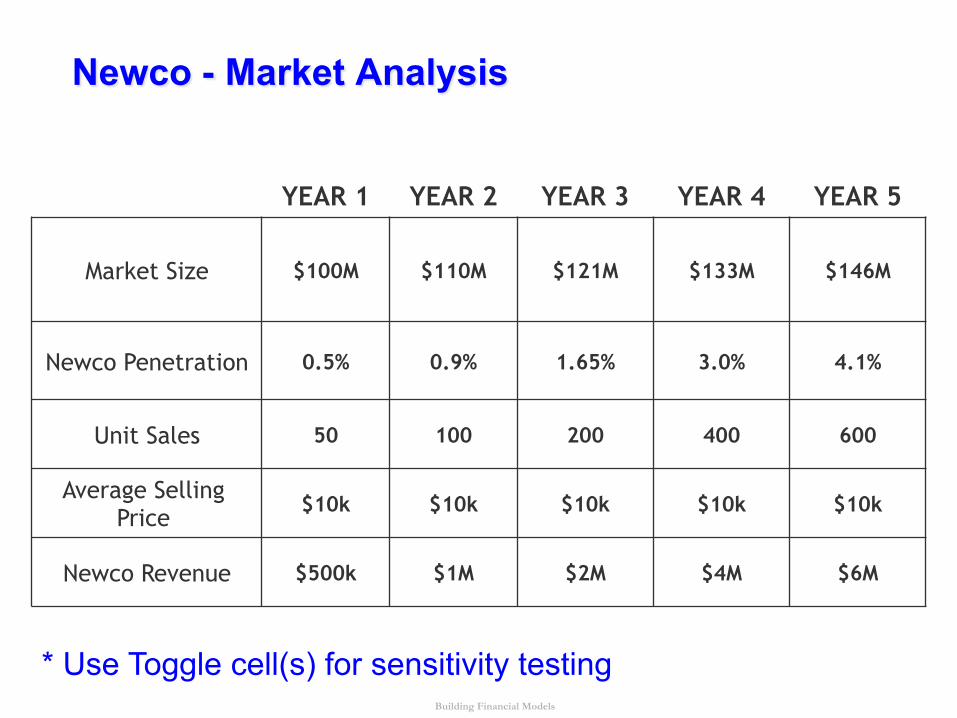
Newco - Market Analysis
YEAR 1 YEAR 2 YEAR 3 YEAR 4 YEAR 5
Market Size $100M $110M $121M $133M $146M
Newco Penetration 0.5% 0.9% 1.65% 3.0% 4.1%
Unit Sales 50 100 200 400 600
Average Selling Price
$10k $10k $10k $10k $10k
Newco Revenue $500k $1M $2M $4M $6M
* Use Toggle cell(s) for sensitivity testing
Building Financial Models
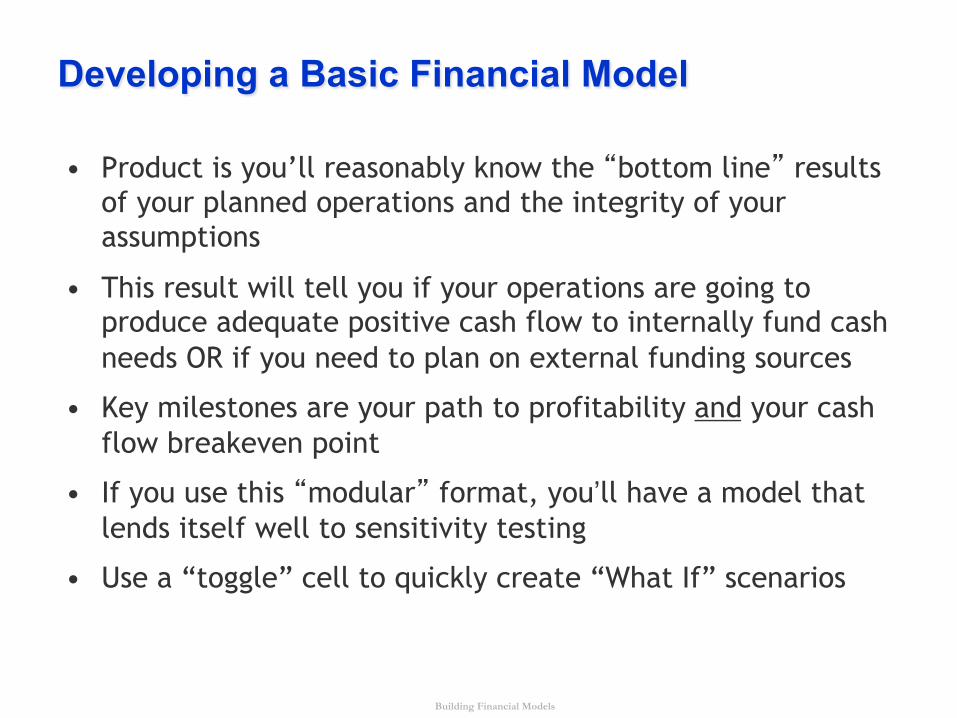
Developing a Basic Financial Model
• Product is you’ll reasonably know the “bottom line” results of your planned operations and the integrity of your assumptions
• This result will tell you if your operations are going to produce adequate positive cash flow to internally fund cash needs OR if you need to plan on external funding sources
• Key milestones are your path to profitability and your cash flow breakeven point
• If you use this “modular” format, you’ll have a model that lends itself well to sensitivity testing
• Use a “toggle” cell to quickly create “What If” scenarios
Building Financial Models
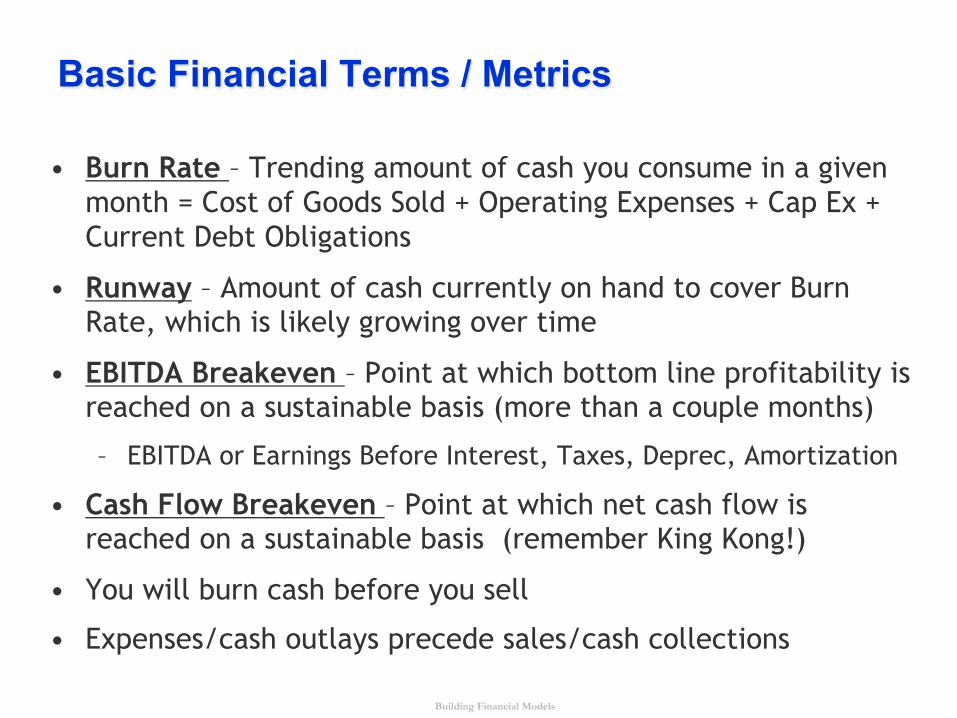
Basic Financial Terms / Metrics
• Burn Rate – Trending amount of cash you consume in a given month = Cost of Goods Sold + Operating Expenses + Cap Ex + Current Debt Obligations
• Runway – Amount of cash currently on hand to cover Burn Rate, which is likely growing over time
• EBITDA Breakeven – Point at which bottom line profitability is reached on a sustainable basis (more than a couple months)
– EBITDA or Earnings Before Interest, Taxes, Deprec, Amortization
• Cash Flow Breakeven – Point at which net cash flow is reached on a sustainable basis (remember King Kong!)
• You will burn cash before you sell
• Expenses/cash outlays precede sales/cash collections
Building Financial Models
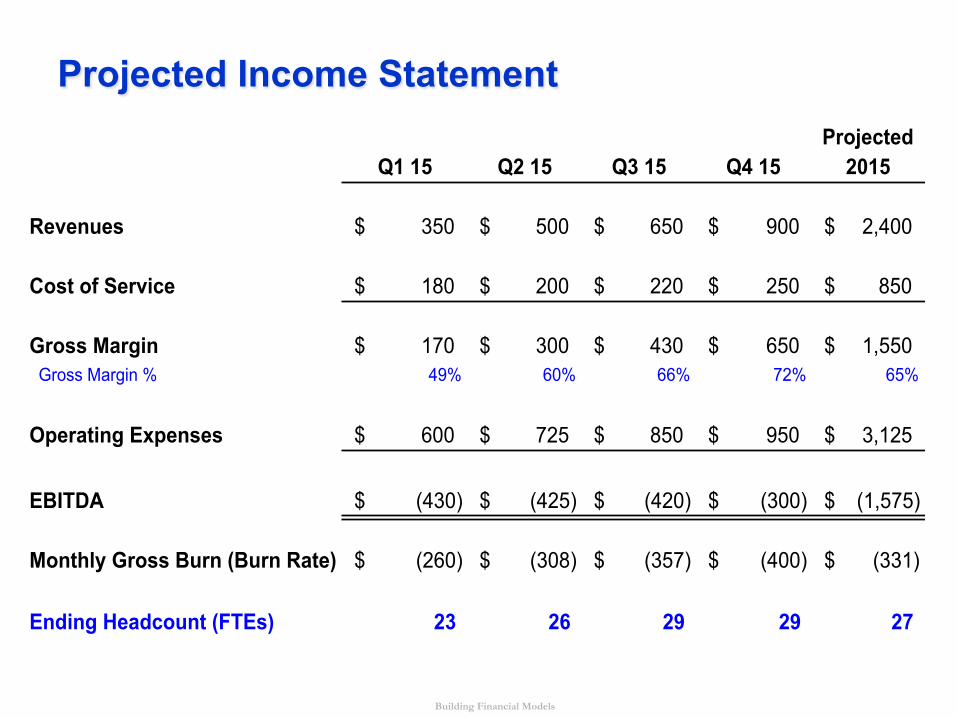
Projected Income Statement Projected
Q1 15 Q2 15 Q3 15 Q4 15 2015
Revenues 350$ 500$ 650$ 900$ 2,400$
Cost of Service 180$ 200$ 220$ 250$ 850$
Gross Margin 170$ 300$ 430$ 650$ 1,550$ Gross Margin % 49% 60% 66% 72% 65%
Operating Expenses 600$ 725$ 850$ 950$ 3,125$
EBITDA (430)$ (425)$ (420)$ (300)$ (1,575)$
Monthly Gross Burn (Burn Rate) (260)$ (308)$ (357)$ (400)$ (331)$
Ending Headcount (FTEs) 23 26 29 29 27
Building Financial Models
Reality Checking Your Model
• You won’t build the perfect model the first time; you may not do it the 3rd or 4th time
• Point is, you have now built a model that can be tested for validity, completeness and integration
• Don’t let your potential investors tell you your model doesn’t flow or that it breaks when tested (do a Test Run)
• Be proactive and perform “what if” analysis
• Add more headcount / increase certain operating costs / increase, then decrease your revenues
• Does the model behave and respond in the way you had envisioned?
• Remember the “toggle” cell to quickly create “What If” scenarios
Building Financial Models
Reality Checking Your Model
• What are the impacts of these changes?
• Will you consume more cash than you had planned on?
• Do you need to reconsider / scale back your original hiring plans – to contain your cost structure?
• Do you need to rethink your revenue projections?
• Do you need to project an external funding event sooner or later than you might have thought?
• Are you closer to the dreaded cash “flame out” date sooner than you had originally projected?
• Conservatism is your friend / Surprise is your enemy
Building Financial Models
Reality Checking Your Model
• Great way to test for reasonableness is to compare to peer companies or at least your industry metrics
– Search for the early year financials of those companies
• Find out who the public companies (or private if you know someone who will share info) are in your space and obtain their financial data – even %’s will help
• Ask advisors / potential investors for metrics on similar companies
• Internet is FULL of information
Building Financial Models
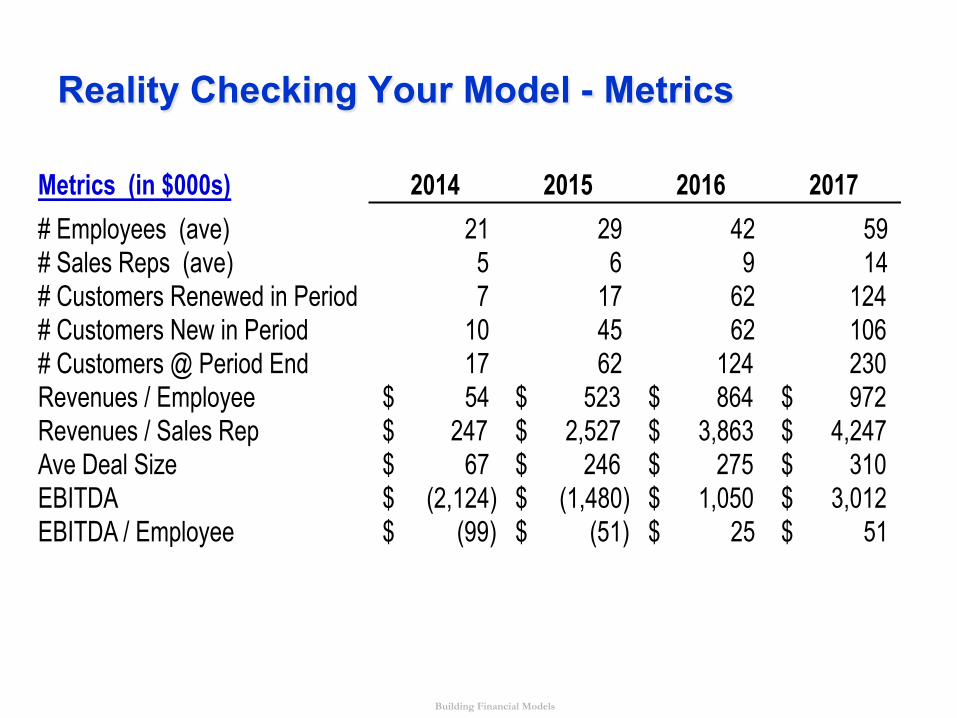
Reality Checking Your Model - Metrics
Metrics (in $000s) 2014 2015 2016 2017# Employees (ave) 21 29 42 59 # Sales Reps (ave) 5 6 9 14 # Customers Renewed in Period 7 17 62 124 # Customers New in Period 10 45 62 106 # Customers @ Period End 17 62 124 230 Revenues / Employee 54$ 523$ 864$ 972$ Revenues / Sales Rep 247$ 2,527$ 3,863$ 4,247$ Ave Deal Size 67$ 246$ 275$ 310$ EBITDA (2,124)$ (1,480)$ 1,050$ 3,012$ EBITDA / Employee (99)$ (51)$ 25$ 51$
Building Financial Models
Figuring out Your Audience
• It is very likely your audience will know more about finance than you will ever know, so it can be intimidating
• The more sophisticated the potential investor, the more you need to be prepared
• Committing those assumptions to writing and stress testing your model in advance place you on more firm ground
• If you are approaching a party for the first time, you need to give them your Business Plan as well (at least Exec Summary)
• It is MUCH more effective and even necessary for them to know the story of your business before reviewing your financial model
• If you are going for another round of financing from an existing party, you can limit this to a narrative update
Building Financial Models
Figuring out Your Audience
• Investors will quickly see if you have been realistic in your model (you likely won’t go from sales of $1M - $10M in 1 year)
• The financial model needs to be credible
• Profitability and cash breakeven do INDEED matter
• Investors are looking for companies to be “Capital Efficient”
• Investors won’t want to see your model projecting an external cash infusion every year
• Cash flows from operations need to reach the point of self funding
Building Financial Models
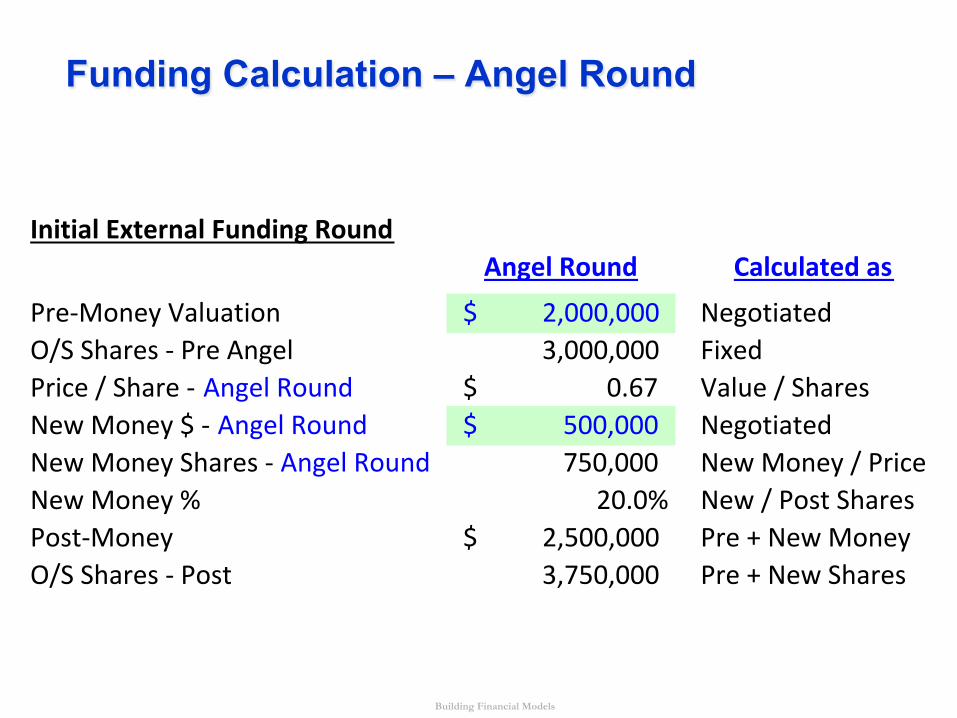
Funding Calculation – Angel Round
Initial'External'Funding'RoundAngel'Round Calculated'as
Pre$Money)Valuation 2,000,000$)))))))))) NegotiatedO/S)Shares)$)Pre)Angel 3,000,000))))))))))) FixedPrice)/)Share)$)Angel)Round 0.67$))))))))))))))))) Value)/)SharesNew)Money)$)$)Angel)Round 500,000$)))))))))))) NegotiatedNew)Money)Shares)$)Angel)Round 750,000)))))))))))))) New)Money)/)PriceNew)Money)% 20.0% New)/)Post)SharesPost$Money 2,500,000$)))))))))) Pre)+)New)MoneyO/S)Shares)$)Post 3,750,000))))))))))) Pre)+)New)Shares
Building Financial Models
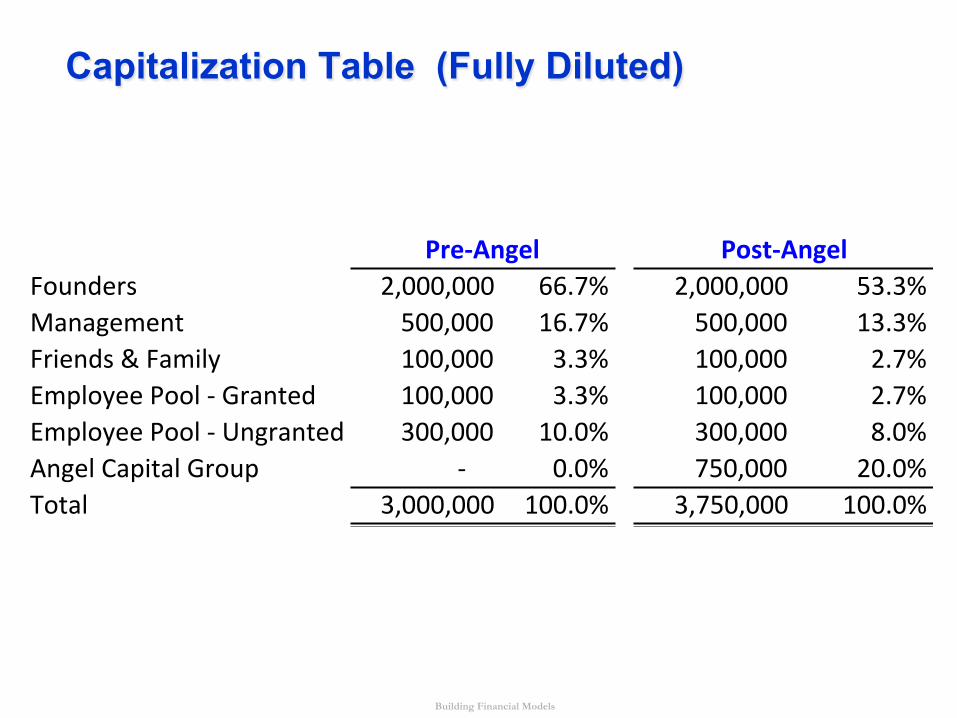
Capitalization Table (Fully Diluted)
Founders 2,000,000,,, 66.7% 2,000,000,,,,, 53.3%Management 500,000,,,,,, 16.7% 500,000,,,,,,, 13.3%Friends,&,Family 100,000,,,,,, 3.3% 100,000,,,,,,, 2.7%Employee,Pool,@,Granted 100,000,,,,,, 3.3% 100,000,,,,,,, 2.7%Employee,Pool,@,Ungranted 300,000,,,,,, 10.0% 300,000,,,,,,, 8.0%Angel,Capital,Group @,,,,,,,,,,,,, 0.0% 750,000,,,,,,, 20.0%Total 3,000,000,,, 100.0% 3,750,000,,,,, 100.0%
Pre$Angel Post$Angel
Building Financial Models
Summary
• Be realistic and conservative
• Thoughtfully consider then document your assumptions
• Include the critical resources you need to build company
• Build the model the right way the First time
– In “modular format
– Takes patience
• Stress test your results – “What if I change . . .?”
• Remember (and respect) who you will be approaching
– They have the money that you need to build and survive
Building Financial Models
Questions / Follow Up
Phil Compton [email protected] Office (855) 625-2683 x706
Cell (412) 719-6599
Building Financial Models
Backup Slides
Example Templates
Building Financial Models
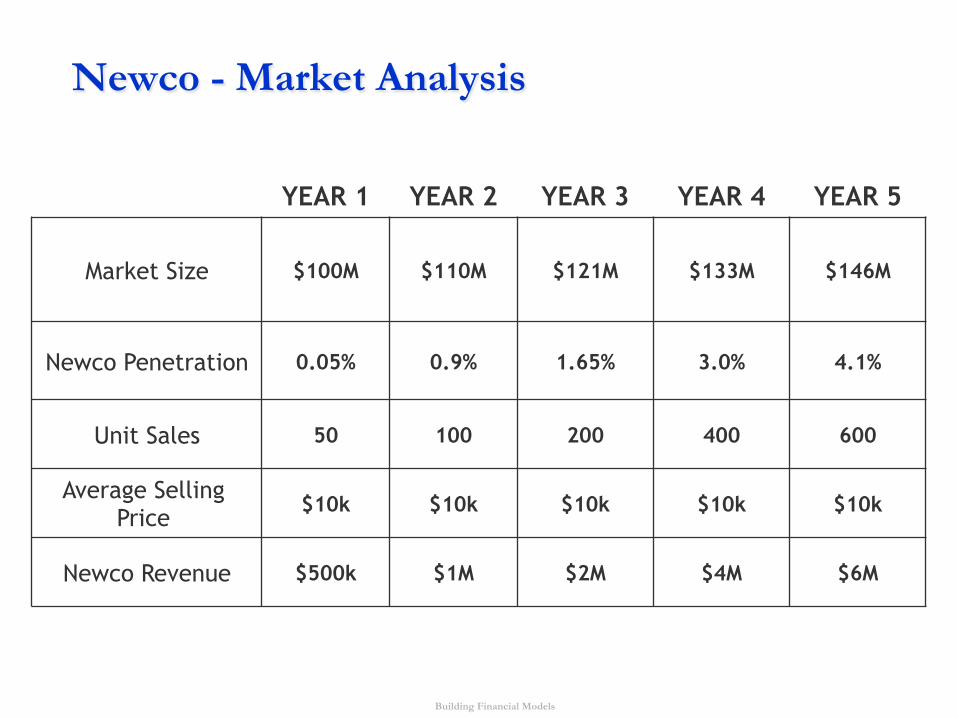
Newco - Market Analysis
YEAR 1 YEAR 2 YEAR 3 YEAR 4 YEAR 5
Market Size $100M $110M $121M $133M $146M
Newco Penetration 0.05% 0.9% 1.65% 3.0% 4.1%
Unit Sales 50 100 200 400 600
Average Selling Price
$10k $10k $10k $10k $10k
Newco Revenue $500k $1M $2M $4M $6M
Building Financial Models
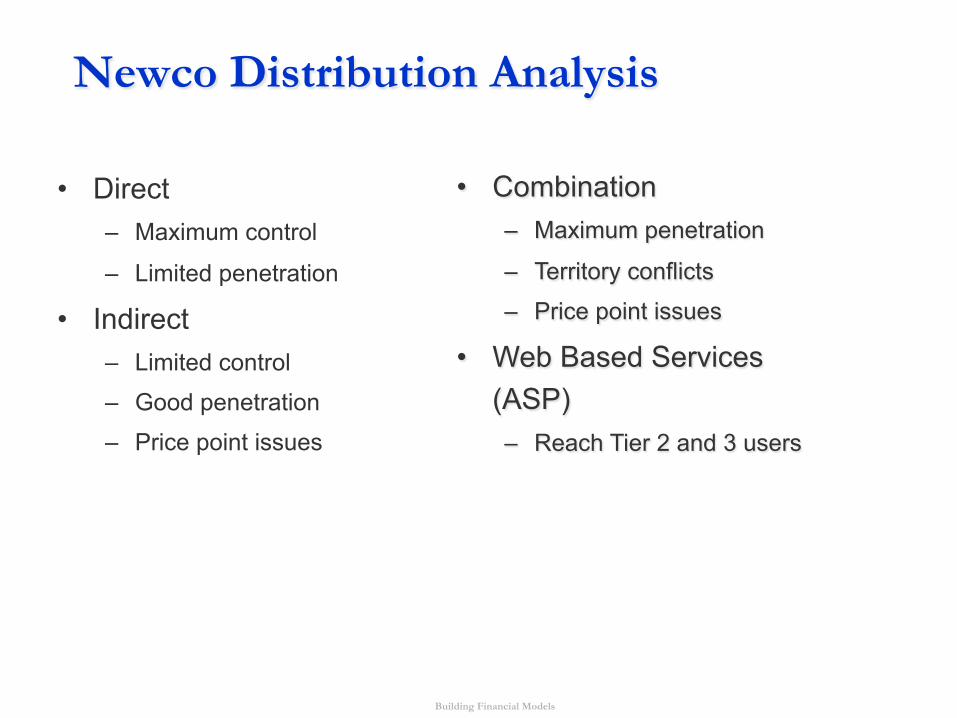
Newco Distribution Analysis • Direct
– Maximum control
– Limited penetration
• Indirect – Limited control
– Good penetration
– Price point issues
• Combination
– Maximum penetration
– Territory conflicts
– Price point issues
• Web Based Services (ASP) – Reach Tier 2 and 3 users
Building Financial Models
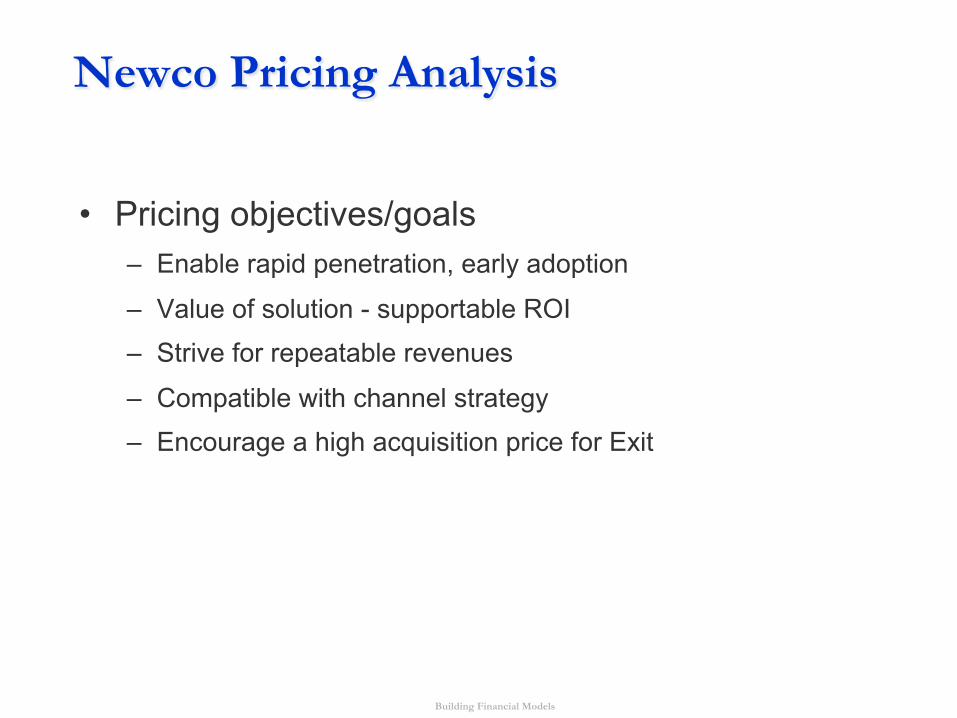
Newco Pricing Analysis
• Pricing objectives/goals – Enable rapid penetration, early adoption
– Value of solution - supportable ROI – Strive for repeatable revenues
– Compatible with channel strategy – Encourage a high acquisition price for Exit
Building Financial Models
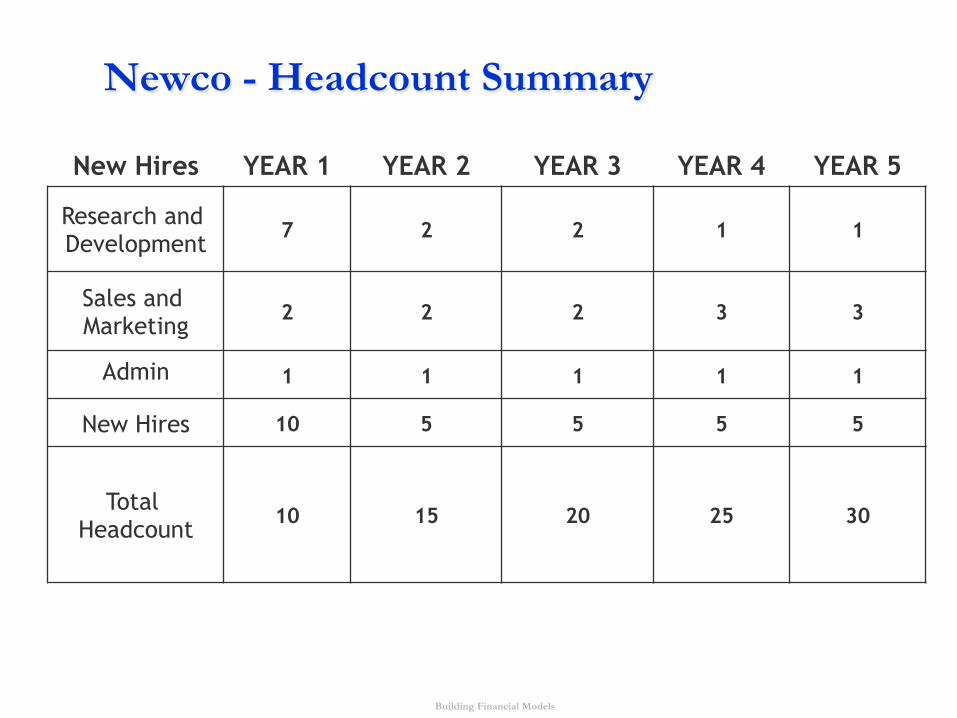
Newco - Headcount Summary
New Hires YEAR 1 YEAR 2 YEAR 3 YEAR 4 YEAR 5
Research and Development
7 2 2 1 1
Sales and Marketing
2 2 2 3 3
Admin 1 1 1 1 1
New Hires 10 5 5 5 5
Total Headcount
10 15 20 25 30
Building Financial Models
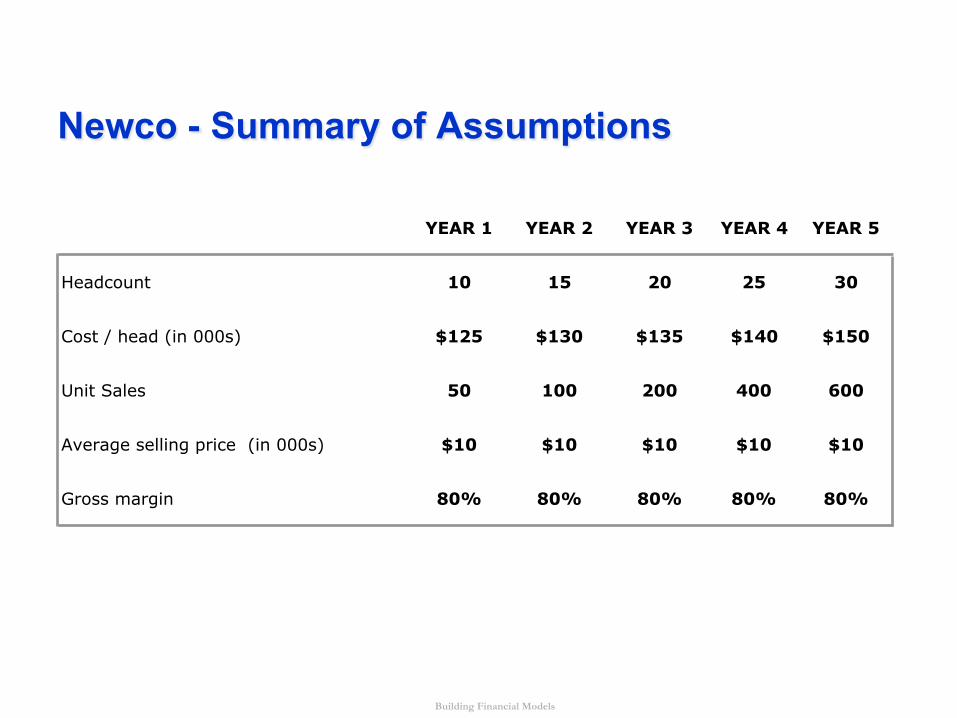
Newco - Summary of Assumptions
YEAR 1 YEAR 2 YEAR 3 YEAR 4 YEAR 5
Headcount 10 15 20 25 30
Cost / head (in 000s) $125 $130 $135 $140 $150
Unit Sales 50 100 200 400 600
Average selling price (in 000s) $10 $10 $10 $10 $10
Gross margin 80% 80% 80% 80% 80%
Building Financial Models
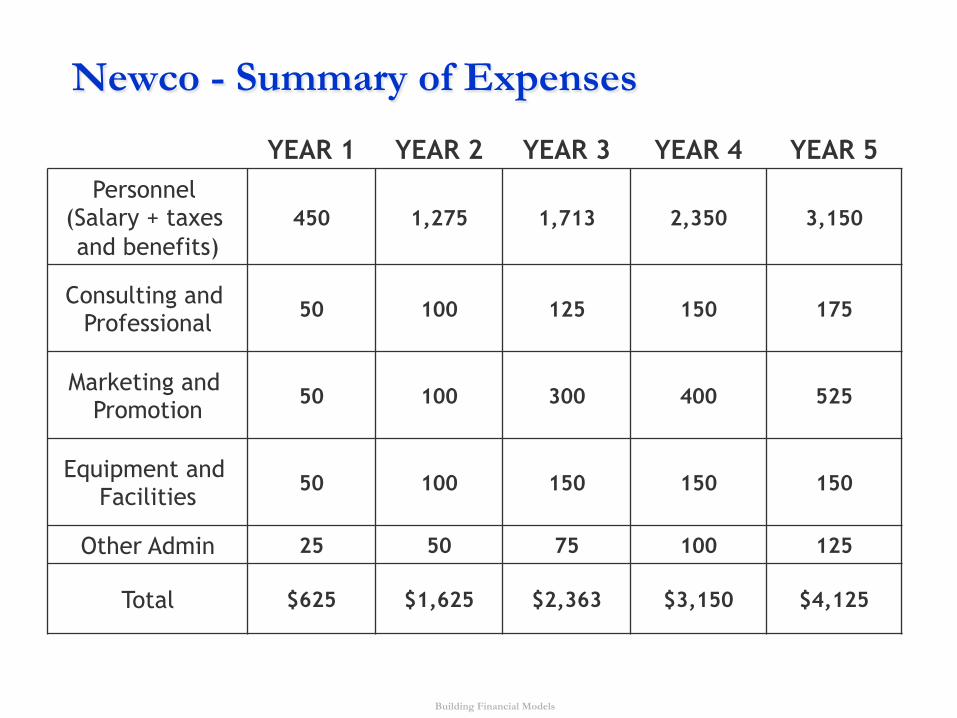
Newco - Summary of Expenses YEAR 1 YEAR 2 YEAR 3 YEAR 4 YEAR 5
Personnel (Salary + taxes and benefits)
450 1,275 1,713 2,350 3,150
Consulting and Professional
50 100 125 150 175
Marketing and Promotion
50 100 300 400 525
Equipment and Facilities
50 100 150 150 150
Other Admin 25 50 75 100 125
Total $625 $1,625 $2,363 $3,150 $4,125
Building Financial Models
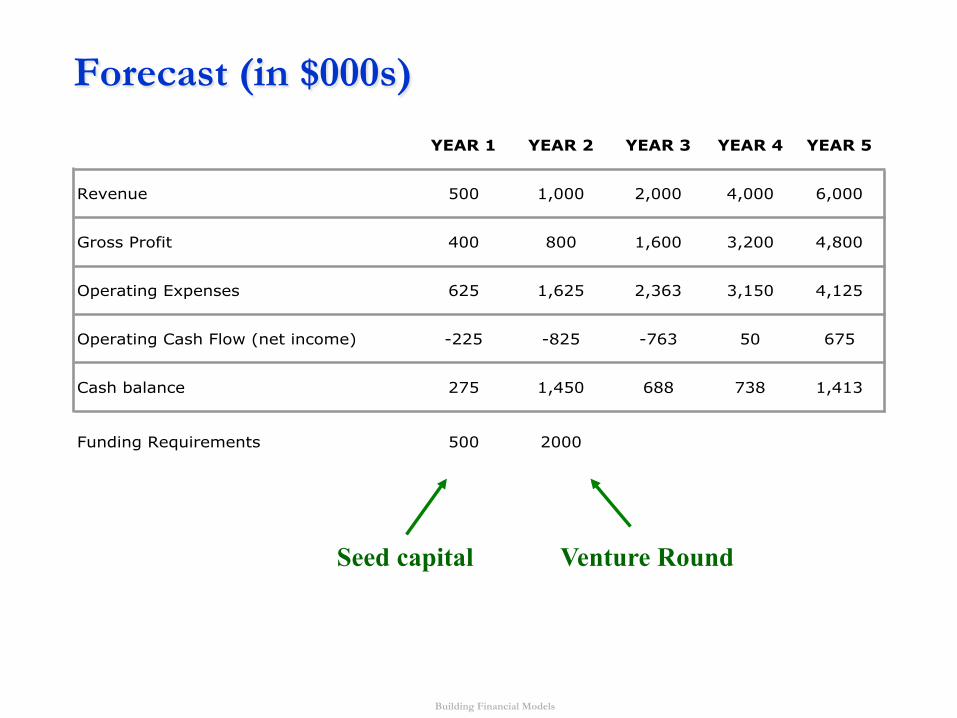
Forecast (in $000s)
Seed capital Venture Round
YEAR 1 YEAR 2 YEAR 3 YEAR 4 YEAR 5
Revenue 500 1,000 2,000 4,000 6,000
Gross Profit 400 800 1,600 3,200 4,800
Operating Expenses 625 1,625 2,363 3,150 4,125
Operating Cash Flow (net income) -225 -825 -763 50 675
Cash balance 275 1,450 688 738 1,413
Funding Requirements 500 2000
Building Financial Models
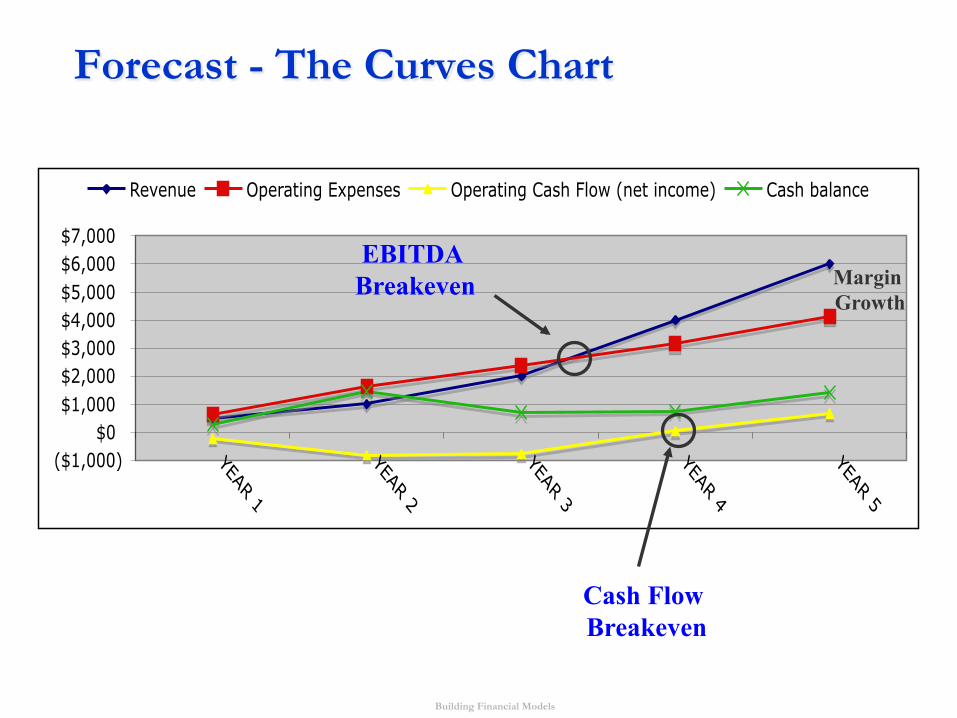
Forecast - The Curves Chart
($1,000)
$0
$1,000
$2,000
$3,000
$4,000
$5,000
$6,000
$7,000
YEAR 1
YEAR 2
YEAR 3
YEAR 4
YEAR 5
Revenue Operating Expenses Operating Cash Flow (net income) Cash balance
Cash Flow Breakeven
EBITDA Breakeven Margin
Growth
Building Financial Models
Addendum
Accounting 101 slides
Building Financial Models
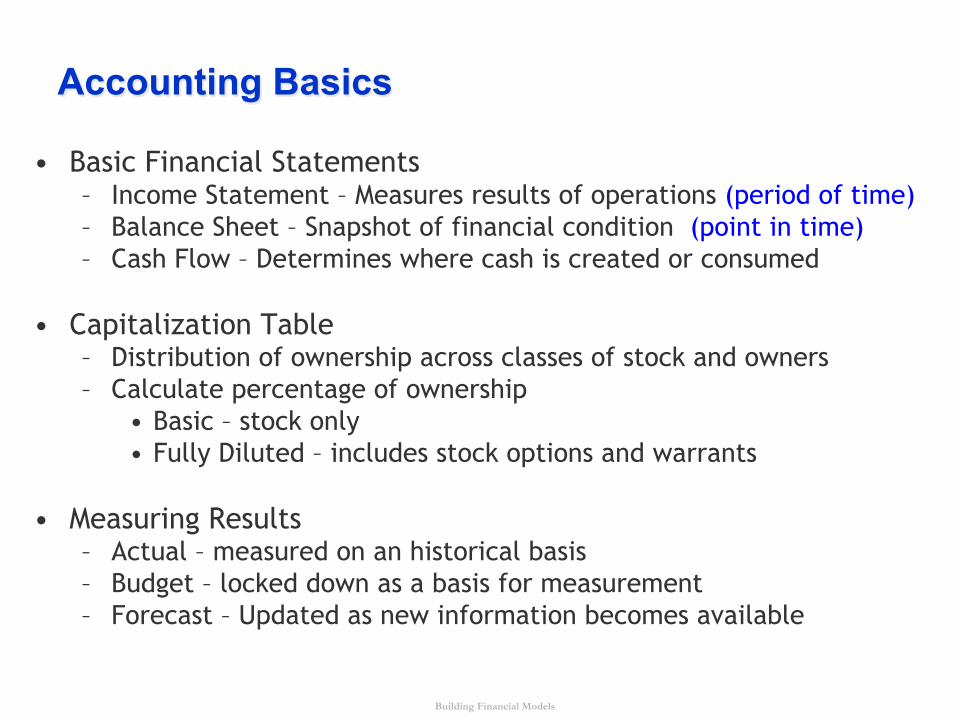
Accounting Basics
• Basic Financial Statements – Income Statement – Measures results of operations (period of time) – Balance Sheet – Snapshot of financial condition (point in time) – Cash Flow – Determines where cash is created or consumed
• Capitalization Table – Distribution of ownership across classes of stock and owners – Calculate percentage of ownership
• Basic – stock only • Fully Diluted – includes stock options and warrants
• Measuring Results
– Actual – measured on an historical basis – Budget – locked down as a basis for measurement – Forecast – Updated as new information becomes available
Building Financial Models
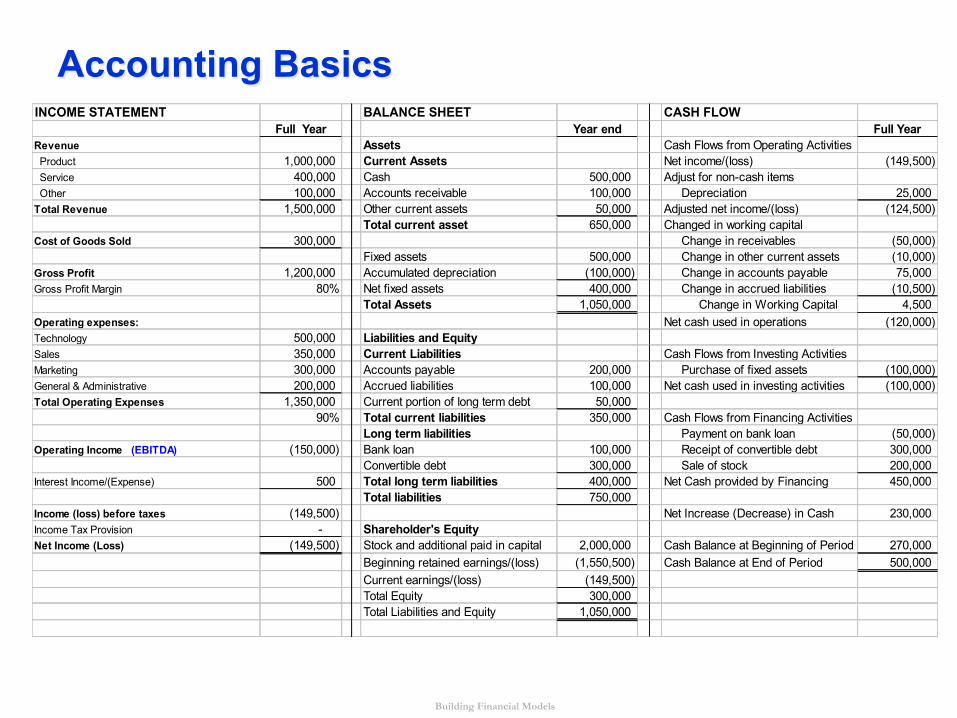
Accounting Basics INCOME STATEMENT BALANCE SHEET CASH FLOW
Full Year Year end Full YearRevenue Assets Cash Flows from Operating Activities Product 1,000,000 Current Assets Net income/(loss) (149,500) Service 400,000 Cash 500,000 Adjust for non-cash items Other 100,000 Accounts receivable 100,000 Depreciation 25,000 Total Revenue 1,500,000 Other current assets 50,000 Adjusted net income/(loss) (124,500)
Total current asset 650,000 Changed in working capitalCost of Goods Sold 300,000 Change in receivables (50,000)
Fixed assets 500,000 Change in other current assets (10,000) Gross Profit 1,200,000 Accumulated depreciation (100,000) Change in accounts payable 75,000 Gross Profit Margin 80% Net fixed assets 400,000 Change in accrued liabilities (10,500)
Total Assets 1,050,000 Change in Working Capital 4,500 Operating expenses: Net cash used in operations (120,000) Technology 500,000 Liabilities and EquitySales 350,000 Current Liabilities Cash Flows from Investing ActivitiesMarketing 300,000 Accounts payable 200,000 Purchase of fixed assets (100,000) General & Administrative 200,000 Accrued liabilities 100,000 Net cash used in investing activities (100,000) Total Operating Expenses 1,350,000 Current portion of long term debt 50,000
90% Total current liabilities 350,000 Cash Flows from Financing ActivitiesLong term liabilities Payment on bank loan (50,000)
Operating Income (EBITDA) (150,000) Bank loan 100,000 Receipt of convertible debt 300,000 Convertible debt 300,000 Sale of stock 200,000
Interest Income/(Expense) 500 Total long term liabilities 400,000 Net Cash provided by Financing 450,000 Total liabilities 750,000
Income (loss) before taxes (149,500) Net Increase (Decrease) in Cash 230,000 Income Tax Provision - Shareholder's EquityNet Income (Loss) (149,500) Stock and additional paid in capital 2,000,000 Cash Balance at Beginning of Period 270,000
Beginning retained earnings/(loss) (1,550,500) Cash Balance at End of Period 500,000 Current earnings/(loss) (149,500) Total Equity 300,000 Total Liabilities and Equity 1,050,000
Building Financial Models
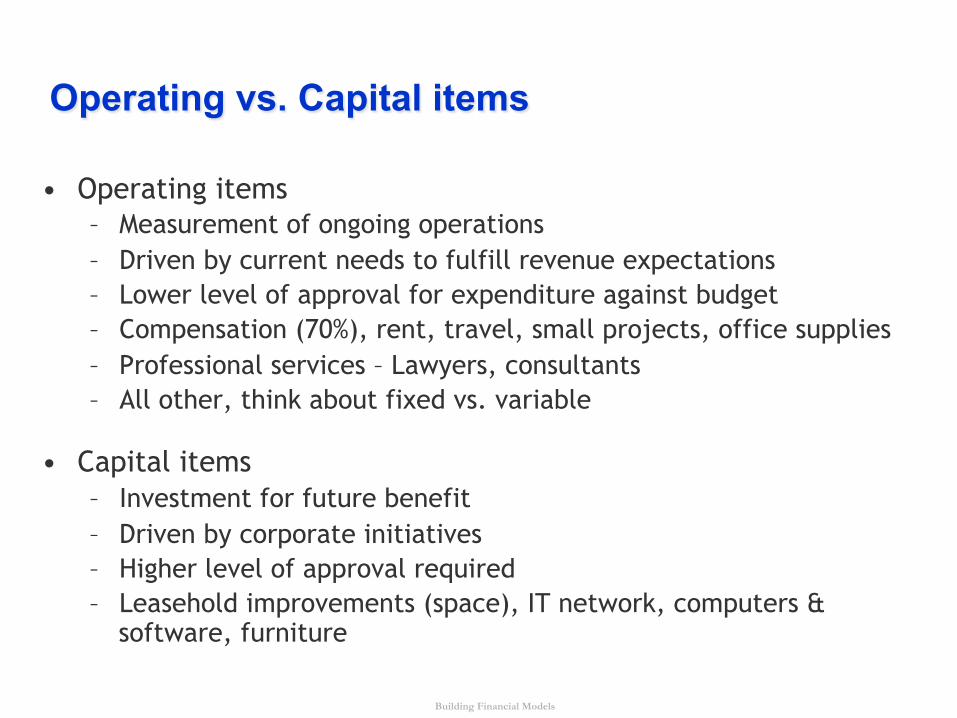
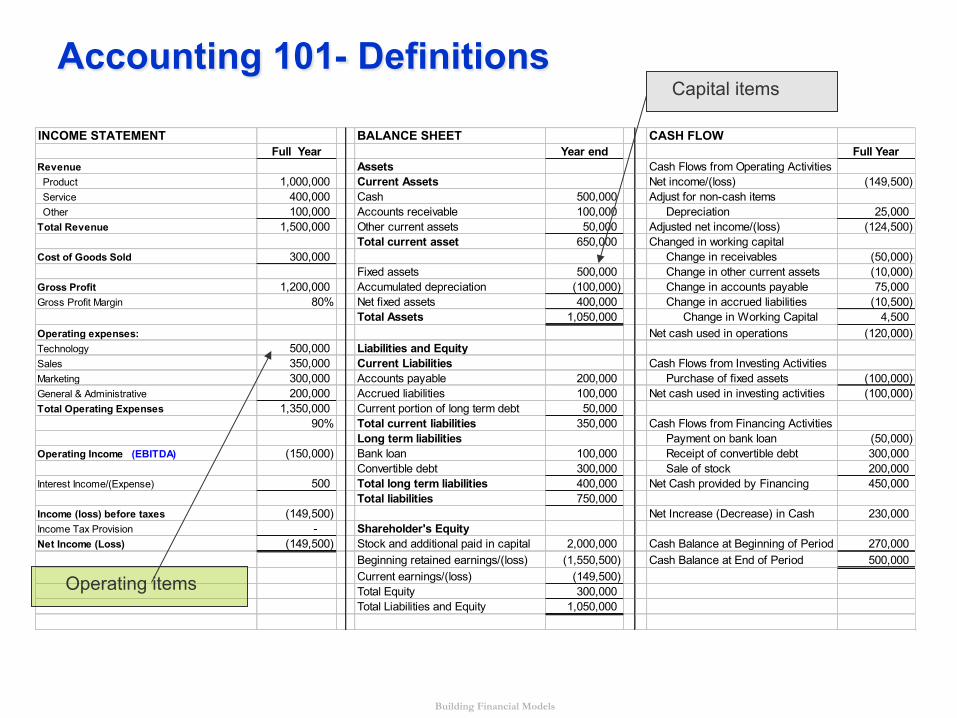
Operating vs. Capital items
• Operating items – Measurement of ongoing operations – Driven by current needs to fulfill revenue expectations – Lower level of approval for expenditure against budget – Compensation (70%), rent, travel, small projects, office supplies – Professional services – Lawyers, consultants – All other, think about fixed vs. variable
• Capital items – Investment for future benefit – Driven by corporate initiatives – Higher level of approval required – Leasehold improvements (space), IT network, computers &
software, furniture
Building Financial Models
Accounting 101- Definitions
INCOME STATEMENT BALANCE SHEET CASH FLOWFull Year Year end Full Year
Revenue Assets Cash Flows from Operating Activities Product 1,000,000 Current Assets Net income/(loss) (149,500) Service 400,000 Cash 500,000 Adjust for non-cash items Other 100,000 Accounts receivable 100,000 Depreciation 25,000 Total Revenue 1,500,000 Other current assets 50,000 Adjusted net income/(loss) (124,500)
Total current asset 650,000 Changed in working capitalCost of Goods Sold 300,000 Change in receivables (50,000)
Fixed assets 500,000 Change in other current assets (10,000) Gross Profit 1,200,000 Accumulated depreciation (100,000) Change in accounts payable 75,000 Gross Profit Margin 80% Net fixed assets 400,000 Change in accrued liabilities (10,500)
Total Assets 1,050,000 Change in Working Capital 4,500 Operating expenses: Net cash used in operations (120,000) Technology 500,000 Liabilities and EquitySales 350,000 Current Liabilities Cash Flows from Investing ActivitiesMarketing 300,000 Accounts payable 200,000 Purchase of fixed assets (100,000) General & Administrative 200,000 Accrued liabilities 100,000 Net cash used in investing activities (100,000) Total Operating Expenses 1,350,000 Current portion of long term debt 50,000
90% Total current liabilities 350,000 Cash Flows from Financing ActivitiesLong term liabilities Payment on bank loan (50,000)
Operating Income (EBITDA) (150,000) Bank loan 100,000 Receipt of convertible debt 300,000 Convertible debt 300,000 Sale of stock 200,000
Interest Income/(Expense) 500 Total long term liabilities 400,000 Net Cash provided by Financing 450,000 Total liabilities 750,000
Income (loss) before taxes (149,500) Net Increase (Decrease) in Cash 230,000 Income Tax Provision - Shareholder's EquityNet Income (Loss) (149,500) Stock and additional paid in capital 2,000,000 Cash Balance at Beginning of Period 270,000
Beginning retained earnings/(loss) (1,550,500) Cash Balance at End of Period 500,000 Current earnings/(loss) (149,500) Total Equity 300,000 Total Liabilities and Equity 1,050,000
Operating items
Capital items
Building Financial Models
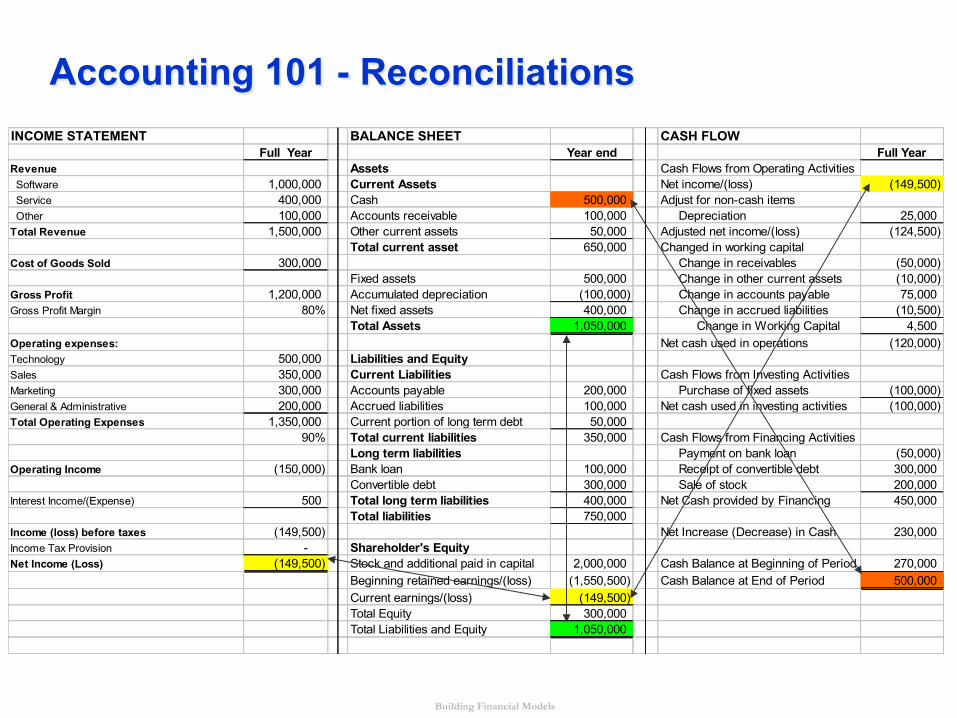
Accounting 101 - Reconciliations INCOME STATEMENT BALANCE SHEET CASH FLOW
Full Year Year end Full YearRevenue Assets Cash Flows from Operating Activities Software 1,000,000 Current Assets Net income/(loss) (149,500) Service 400,000 Cash 500,000 Adjust for non-cash items Other 100,000 Accounts receivable 100,000 Depreciation 25,000 Total Revenue 1,500,000 Other current assets 50,000 Adjusted net income/(loss) (124,500)
Total current asset 650,000 Changed in working capitalCost of Goods Sold 300,000 Change in receivables (50,000)
Fixed assets 500,000 Change in other current assets (10,000) Gross Profit 1,200,000 Accumulated depreciation (100,000) Change in accounts payable 75,000 Gross Profit Margin 80% Net fixed assets 400,000 Change in accrued liabilities (10,500)
Total Assets 1,050,000 Change in Working Capital 4,500 Operating expenses: Net cash used in operations (120,000) Technology 500,000 Liabilities and EquitySales 350,000 Current Liabilities Cash Flows from Investing ActivitiesMarketing 300,000 Accounts payable 200,000 Purchase of fixed assets (100,000) General & Administrative 200,000 Accrued liabilities 100,000 Net cash used in investing activities (100,000) Total Operating Expenses 1,350,000 Current portion of long term debt 50,000
90% Total current liabilities 350,000 Cash Flows from Financing ActivitiesLong term liabilities Payment on bank loan (50,000)
Operating Income (150,000) Bank loan 100,000 Receipt of convertible debt 300,000 Convertible debt 300,000 Sale of stock 200,000
Interest Income/(Expense) 500 Total long term liabilities 400,000 Net Cash provided by Financing 450,000 Total liabilities 750,000
Income (loss) before taxes (149,500) Net Increase (Decrease) in Cash 230,000 Income Tax Provision - Shareholder's EquityNet Income (Loss) (149,500) Stock and additional paid in capital 2,000,000 Cash Balance at Beginning of Period 270,000
Beginning retained earnings/(loss) (1,550,500) Cash Balance at End of Period 500,000 Current earnings/(loss) (149,500) Total Equity 300,000 Total Liabilities and Equity 1,050,000