case file copy - nasa · case file copy semi-annual status ... to injection of glucose-ul- c,...
TRANSCRIPT

N 7 2 3 2 0 8 3
CASE FILECOPY
Semi-Annual Status Rep0rt
NASA Qlmi NgK 06.002.075
30 April 1972
Colorado State University
3ort Collins, Colorado
https://ntrs.nasa.gov/search.jsp?R=19720024433 2018-05-28T16:37:27+00:00Z
TABLE OF CONTENTS
ABSTRACT
Paj
I. INTRODUCTION
II. METABOLIC RESPONSE TO HIGH PRESSURE NARCOSIS
III. EFFECTS OF DILUENT GAS-OXYGEN MIXTURES ON RAT
BRAIN SYNAPTOSOMES 16
IV. STATUS REPORT REFERENCES 28
V. APPENDICES
"Metabolic Chamber System"
Section 1.
Basic manuscript submitted tothe Editors of the Journal ofApplied Physiology by J. P.Jordan, D. P. Clarkson, L. J.Huston, W. W. Martz, and J. B.Simmons II.
Section 2.
Summary of proposed additionof process control and dataacquisition equipment to theexisting hypobaric chambersystem.
32-1
32-16
B. "A Rapid Quantitative Measure ofMetabolic Activity", by J. P. Jordan,C. L. Schatte, D. P. Clarkson, M. L.Corrin, and W. W. Martz. Submittedto the Editors of the AmericanJournal of Physiology.
33

ABSTRACT
In addition to efforts focused towards the identification
of rare-gas effects on metabolism, we have begun experiments
to identify the nature of "inert gas narcosis." The most pre-
valent theories regarding the physiological effects of rare
gases involve an effect of the gases on biomembranes and the
interaction of the gases specifically at the nerve synapse.
With respect to the proposed biomembrane mechanism, a
collaborative research program has been undertaken with the
Royal Naval Physiological Laboratory, Alverstoke, Hants,
England.- This study involves the detailed examination of
the theory that narcosis results from expansion of the cell
membrane under high partial pressures. The research is par-
tially based on the hypothesis that, like oxygen toxicity,
the mechanism of metabolic effects of rare gases may be similar
at both low and high pressures and are simply more observable
at high pressures.
Using adult female goats, the parameters measured include
oxygen consumption, CC^ production, respiration rate, heart
rate, rectal and skin temperatures and the analysis of electro-
encephalograms and evoked response. Additionally, we are
measuring the specific activity of plasma glucose subsequent
to injection of glucose-UL- C, intravenous infusion, specific
activity of expired CC > unesterified fatty acid levels and

whole blood lactate-to-pyruvate ratios. Also being studied
are the effects of acetylsalicylic acid, vitamin E and cati-
onic detergents (which alleviate narcosis) upon metabolic
changes induced by high pressure narcosis.
Examination of rare gas effects on the nerve synapse is
being investigated using rat brain synaptqsomes. Synapto-
somes were isolated by discontinuous sucrose centrifugation
from rats exposed to normoxic mixtures of argon, helium, and
nitrogen and oxygen with all preparative and analytical pro-
cedures being performed in glove bags filled with the respec-
tive test atmospheres. Oxygen consumption rates for synapto-
somes isolated from argon exposed rats were only 70% of the
consumption rates for those isolated from nitrogen exposed
rats. Acetylcholinesterase activity measurements, on the
other hand, are increased by 8% in argon relative to nitrogen.
Helium-oxygen experiments are not sufficiently complete to
evaluate with confidence. These preliminary results suggest
that argon may have the same metabolic effects on synaptosomes
that is does on intact organisms.
During the period covered by this report, two manuscripts
have been published, two have been accepted for publication
and two more are submitted for publication.

INTRODUCTION
In the interim since the last status report, progress
toward identification of the metabolic effects of replacing
atmospheric nitrogen with argon, helium or neon has continued
on several fronts. Research is currently underway on the
metabolic effects of these gases at high pressures and the
effects of diluent gases on metabolism of. nervous tissue
at ambient pressures.
Dr. Christopher Schatte received an appointment as post-
doctoral fellow in the Laboratory of Aerospace Biology in
January, 1972, after successfully completing his doctoral
degree program. In February, Dr. Schatte began the colla-
borative research program in the laboratories of Dr. Peter B.
Bennett at the Royal Naval Physiological Laboratory, Alverstoke,
Hants, England. This program, now in high gear, is proving
extremely beneficial to both the Laboratory of Aerospace
Biology (LAB) and Dr. Bennett's group. The current status of
this research is described in Section II of this report.,
Dr. Schatte will return to the United States approximately
1 September after attending the Fifth Symposium on Underwater
Physiology, 21-25 August, Freeport, British Bahamas.
Dr. William W. Martz is conducting a research project
designed to ascertain the effects of rare gas-oxygen mixtures
on the nerve synapse. The experimental design and preliminary
results of this research are included in Section III of this
Status Report.
Since the last report, David P. Clarkson has successfully
completed both his doctoral preliminary examination and the
foreign language examination. The only remaining requirement
for the Ph.D. degree is his dissertation research project
which is expected to be completed by early.1973. During his
association with the Laboratory of Aerospace Biology,
Mr. Clarkson has immersed himself in every aspect of the
research methodology of the Laboratory. His familiarity with
the program is evidenced by his participation in the prepara-
tion of several manuscripts as reported here and in previous
status reports.
Research on "inert gas narcosis" in the LAB has reached
a stage where it would be extremely beneficial to provide a
level of automatic control for the Metabolic Chamber System.
This chamber system, around which nearly all aspects in the
Laboratory are centered, requires a considerable number of
man-hours both in conducting experiments and in the processing
of data. A proposal for computerization of system control
and data acquisition is being sent to NASA's Office of Life
Sciences for evaluation. The proposal, included as Appendix
A of this report, includes an up-to-date description of the
Metabolic Chamber System and a detailed description of two
possible systems for automatic control and data processing.
The mathematical method for expressing metabolic rate
which has been utilized in this laboratory for several years

has been refined and prepared as a manuscript which has been
submitted to the editors of the American Journal of Physio-
logy. The manuscript, entitled "A Rapid Quantitative Measure
of Metabolic Activity," by J. P. Jordan, C. L. Schatte, D. P.
Clarkson, M. L. Corrin, and W. W. Martz, is included as
Appendix B of this status report.
During the period covered by this report, the following
papers also have been accepted for publication:
"Predictability of P&02 in Different Inert Gas-
Oxygen Environments," by C. L. Schatte, J. B.
Simmons, II, D. P. Clarkson and J. P. Jordan.
(Due in next issue of Space Life Sciences.)
"The Thermal Neutral Temperature of Rats in
Helium-Oxygen, Argon-Oxygen, and Air." by D. P.
Clarkson, C. L. Schatte and J. P. Jordan, Amer.
Journal of Physiology, June, 1972.

METABOLIC RESPONSE TO HIGH PRESSURE NARCOSIS
The majority of the recent work from this laboratory has
been directed at characterizing the metabolic consequences of
exposure to artificial environments encompassing a reduction in
ambient pressure, substitution of various diluent gases for
nitrogen, or both. The consistent result has been that the
so-called "inert or noble gases of the helium group can alter
both metabolic rate and the relative importance of certain
metabolic pathways in rats. Jordan, et al (1) reported that
normoxic mixtures of neon at one atmosphere absolute (ATA)
and 0.33 ATA accelerated the metabolic rate of rats when
compared to atmospheric air controls; at the end of 4 weeks'
exposure, adaptation to the changes had occurred such that
metabolic rate was the same in neon as in air. The view was
expressed that neon appeared to release a metabolic "brake"
which nitrogen normally exerts. Such a "braking" action was
consistent with the findings of Lassiter, et al (2) that
marginal oxygen toxicity, as manifested by reductions in
brain levels of CoA, CoASH, and acetyl CoA, could be attenuated
by adding nitrogen as a diluent gas. Clarkson, e_t al^ (3),
discovered that the oxygen consumption of rats exposed to
normoxic mixtures of argon or helium at the thermal neutral
temperature of each was significantly different than that in
air at ambient pressures of 0.8 ATA. Depression of metabolic
rate in argon relative to air was subsequently observed by
Schatte, et al (4); metabolic rate o£ rats in helium and
nitrogen were not significantly different. Of particular
interest was the fact that very mildly hyperoxic mixtures
of these gases at atmospheric pressure produced a remarkable
variation in metabolic response. While the helium-exposed
animals were virtually unaffected by the lowered oxygen
tension, those in nitrogen showed moderate hypoxic symptoms
and those in argon were substantially affected. It was con-
cluded that both intrinsic properties of the diluent gases
and an undetermined ability to influence oxygen availability
or utilization at the cellular level contributed to the results
Having determined that different diluent gases exert
varying metabolic effects, the fundamental question of "How?"
is yet unanswered. The difficulty in answering the question
is exemplified by the fact that more than a century of interest
of which the last forty years have been particularly intense,
has failed to produce an answer. Nevertheless, much progress
has been made in the particular areas of high pressure physi-
ology and anesthesia, in which the effects of rare gases are
most pronounced and have accordingly been the most extensively
studied. There are several good reasons favoring (and none
contraindicating) the hypothesis that the effects of diluent
gases which we have observed at low pressures may be subtle
manifestations of those seen at high pressures or in a state
of anesthesia. Accordingly, it is to the field of high pres-
sure physiology that the laboratory has in part turned to

further characterize the metabolic aberrations that have been
noted and to perhaps offer a new approach (molecular level
metabolism) towards solving the mystery of high pressure inert
gas narcosis.
Dr. Christopher Schatte, a 1971 product of this laboratory,
has been working since February with Dr. Peter Bennett at the
Royal Naval Physiological Laboratory in Alverstoke, England.
Dr. Bennett is the world's foremost authority on "inert gas
narcosis," and his efforts have resulted in the most plausible
mechanism of narcosis offered to date and a program to develop
a drug which successfully alleviates the symptoms of narcosis.
His pioneering research and vast knowledge of the field coupled
with his laboratory's excellent facilities for research, made
him the logical choice for collaborative research on a goal
common to our two laboratories: definition of the mechanism
of narcosis. Additionally, Dr. Bennett is interested in filling
a large void in the area of metabolic response to narcosis
toward which this laboratory's experience with metabolic
measurements can be applied.
During his tenure in England, Dr. Schatte will perform
experiments intended to gain insight into the following areas:
(1) examination of the theory that narcosis results from an
expansion of the cell membrane under high partial pressures
of diluent gases, (2) whether the primary locus of activity
at the cell membrane is the aqueous or lipoidal phase, (3)

whether there exists a relationship between the degree of
narcosis and metabolic changes, (4) whether the drugs which
Dr. Bennett has found to alleviate the symptoms of narcosis
have any influence on these metabolic changes, and (5) eluci-
dation of the exact biochemical changes which narcosis pro-
duces and the ramifications attendant with them.
It is widely hypothesized that the site of action by
narcotic gases is the lipid fraction of the cell membrane,
an extrapolation of the Meyer-Overton lipid solubility theory
(5). Bennett (6), for instance, has observed that an ionic
imbalance occurs during narcosis in which plasma K increases
while Na decreases, presumably due to exchange between the
extra- and intracellular compartments. From this evidence
and that of certain in vitro experiments (7, 8), it was
inferred that the membrane expands due to increased numbers
of gas molecules "packing" into the lipid component under
high partial pressures. The membrane thus undergoes, or
perhaps cannot undergo, some conformational change which
results in altered permeability to these ions. Electrical
disturbances in the brain and decrements in nerve conduc-
tion are presumed to arise from the altered ionic distribu-
tion.
Another theory, championed by Featherstone, et al (9),
proposes that all proteins, perhaps enzymes, undergo changes
in the polarity of important side chains, because of inter-
action with hydrated gas molecules. Such a phenomenon could

10
modify enzyme-substrate binding and/or change the net
charge of the molecule thereby upsetting electrical balances;
either might result in the reduced neuro-electrical activity
symptomatic of the narcotic state. Alternatively, at high
partial pressures, diluent gases might be forced into the
interior of a protein, upsetting its tertiary or quarternary
structure to the point that it would become dysfunctional.
These phenomena are not mutually exclusive and it is
likely that both may occur. Since the mammalian cell and
mitochondrial membrane is composed of a lipid base with
enzymatic protein embedded in it, expansion of the lipid
would be expected to cause changes in the intricate spatial
relationships of the membrane-bound proteins. Likewise, the
fact that membrane structure is to some extent dependent on
maintaining a charged outer surface (particularly due to
amino acid chains) juxtaposed to a relatively non-polar
interior (lipid hydrocarbons) suggests that the presence of
electrical interaction between gas molecules and the outer
surface could result in at least a reduced conductive medium
and perhaps membrane instability. Thus, a vital molecule
such as ATPase might be hindered if its lipid base on the
membrane were altered to the point that its proximity to ATP
was more distant in addition to the binding site being
obscured by a cluster of hydrated gas molecules which might
be forced in between it and its ATP substrate; such a condi-
tion might prevent its participation in the process of active

11
transport thereby causing ions to accumulate on the wrong
side of the membrane as has been observed.
It is significant that the drugs which Dr. Bennett has
observed to attenuate the EEC depression associated with
narcosis are primarily cationic detergents which generally
associate with non-polar substances (10). Two notable
exceptions are the anti-oxidant vitamin E and the anti-
inflammatory acetylsalicylic acid (aspirin).
It is at uncertainties such as these that the experiments
in England are aimed. Both membrane swelling due to lipid
"packing" with gas molecules (11) and protein binding with
rare gas molecules (12) have been documented in vitro but
the situation in vivo has not been described because of an
inability to measure lipid and protein interactions during
narcosis. It is here that judicious application of metabolic
techniques might prove to be the crucial step. If the lipid
portions of membranes do undergo physical alteration, then
an alteration in the behavior of enzymes attached to them
should result. Since mitochondrial membranes are similar to
cell membranes in composition and structure, measurement of
tricarboxylic acid (TCA) cycle activity might serve as an
indicator of the state of the membrane; one could anticipate
that the general nature of any mitochondrial membrane effects
could be extrapolated to the cell membrane.
12
Conversely, if the gases act in the aqueous phase and
combine primarily with protein, then membrane-bound enzymes
would still be affected albeit in the aqueous phase rather
than the non-aqueous. However, measurement of non-membrane-
bound enzymes, such as those of the glycolytic pathway,
ought to be affected whereas they may not have been in the
case of lipid interaction.
Dr. Schatte is proposing to measure the uptake and
conversion to CC^ of uniformly-labeled glucose- C as an
indication of overall glucose catabolism and particularly
the activity of the TCA cycle. Activity of the glycolytic
enzymes will be inferred from changes in plasma pyruvate:
lactate levels in addition to that of glucose entry rates.
These measurements will be made in both a narcotic state
induced by exposure to normoxic mixtures of nitrogen at 7
ATA as indicated by the decrement in the cortical evoked
response to photic stimuli. Controls will be measured at
1 ATA breathing air. Helium will be similarly tested to
assess any influence of the increased pressure alone since
it appears to have no narcotic properties and is considered
to be a useful gas medium in which to study the influence
of pressure alone. Finally, the nitrogen experiments will
be repeated except that the animals will have been adminis-
tered one. of the drugs which has been shown to ameliorate
the narcotic symptoms; preliminary tests will determine
13
whether cetyltrimethylammonium bromide or vitamin E is
the drug of choice.
Five adult female goats trained to stand restrained
while breathing through a fitted mask will each be exposed
individually to the nitrogen, helium, and nitrogen plus
drug environments. Dietary intake will be uniform to insure
similar post-absorptive states. Prior to the actual experi-
ment, EEC and EGG leads, rectal and skin thermistors, and
jugular cannulae will be positioned.
A priming dose of the radioactive glucose followed by
a continuous infusion will be started one hour prior to the
surface control measurements which will be made every 10
minutes for one hour. This will include EGG and EEC traces,
frequency analysis of the EGG, and evoked response measure-
ment, body temperatures, and expired gas and blood sample
taken for analysis. The surface control period will be
followed by a one-hour test period at pressure with a
similar sampling sequence. Due to the lengthy decompression
involved, a post-pressure control run is not possible.
Physiological analyses will include:
(1) oxygen consumption
(2) C07 productionL>
(3) reespiration rate
(4) heart rate
(5) rectal and skin temperatures
(6) analysis of the EEC and evoked response.

14
Biochemical parameters will include:
(1) specific activity of plasma glucose
(2) specific activity of expired CC^
(3) respiratory quotient
(4) plasma glucose and free fatty acid levels
(5) whole blood levels of pyruvate and lactate.
From the glucose and CC>2 specific activity data, the entry
rate and "irreversible" loss of glucose (glucose uptake)
can be estimated and the percentage of glucose oxidized by
the TCA cycle calculated. Additionally, effects of catechol-
amine secretion can be derived by scrutiny of those para-
meters which are known to be influenced by catecholamines,
i.e., CU consumption, cardiac and respiration rates, plasma
glucose and unesterified fatty acid levels.
From these data, any changes in metabolic rate or shifts
in the relative importance of various pathways can be moni-
tored. It is anticipated that narcosis will slow metabolic
rate which will be reflected in lowered oxygen consumption,
C02 production, glucose uptake and conversion to CC^ > and
plasma pyruvate and lactate levels. Further, it is likely
that plasma unesterified fatty acids will rise as part of a
general stress response to both the pressure and narcosis.
Based on observations that rare gases appear to differen-
tially influence oxygen availability to the cell (4), it is
thought that some degree of cellular hypoxia could be mani-
fest during narcosis, perhaps by increased lactate: pyruvate

15
ratios and elevated fatty acids. It is not felt that the
drugs will have much effect on these metabolic changes since
they appear to rectify only the ionic charge unbalance that
results from narcosis; improvement of the electrical depres-
sion of the brain by the drugs will probably not be accom-
panied by amelioration of the metabolic alterations.
If time permits, experiments may be performed with argon,
to produce a more profound narcosis than nitrogen, or using
different radiosubstrates as might be indicated pending the
results of these experiments. For instance, if glycolytic
pathway enzymes were found to be inhibited by narcosis,
14further assessment could be made using glucose-1- C in
14conjunction with glucose-6- C to determine shifts in the
importance of the glycolytic pathway versus the pentose phos-
phate pathways. Or, if only mitochondrial-bound enzymes were
affected, additional information could be gained by using
radio-labeled TCA intermediates or acetate; also, other mito-
chondrial systems such as fatty acid synthesis would be tested,
Ultimately, we shall address ourselves to the cell membrane
and the question of the ionic perturbations; these almost
certainly involve inhibition of ATPases or a membrane-bound
factor in active transport. While no in vivo assay of ATPase
activity is currently available, experiments involving hor-
mones known to require cyclic-AMP or involve some membrane
component might serve to further elucidate the nature of the
changes due to narcosis at the cell membrane.

16
EFFECTS OF DILUENT GAS-OXYGEN MIXTURES
ON RAT BRAIN SYNAPTOSOMES
The mechanism of "inert gas narcosis" has eluded identi-
fication despite an increased degree of international interest
over the past decade. The two most prevalent theories for
the metabolic effects of rare gases are described in Section
II of this report. While these theories may differ with regard
to specific molecular mechanisms involved, they agree that
rare gases, in some manner, affect or interfere with normal
biomembrane function. Studies on intact animals have not
clarified whether the physical effects of rare gases are gen-
eral or are manifested in specific biomembranes or tissues.
The relative importance of specific tissue interactions
versus general membrane effects described in Section II has
not yet been quantified. Several reports suggest that impor-
tant effects of rare gases occur at the nervous system level
(13, 14, 15, 16, 17). The majority of investigations were
carried out at elevated pressures, often exceeding 20 atm.
The studies indicate that "chemically inert" gases can produce
depressed nerve excitability (15) and nerve fiber blockade (14);
effects which can be reversed upon removal of the "inert gas"
or decreasing its partial pressure. Recently it has been
demonstrated that gas mixtures of 75% helium-25% oxygen can
produce an antiarrhythmic effect in hearts of anesthetized

17
dogs (17). In those studies, helium-oxygen mixtures reduced
baseline heart rate and the concentration of catecholamines.
The effects of helium were believed to be the result of
changes in sympathetic nervous system activity.
It is not yet known whether rare gas-induced alterations
of the electrical properties of the nervous system are the
result of changes in transmembrane potentials, nerve impulse
transport velocities or are manifested at the nerve synapse.
Of these possibilities, nerve synapse function is the most
convenient to investigate biochemically.
Examination of the effect of argon, helium or nitrogen
on isolated rat brain synapses (synaptosomes) was undertaken.
The choice of synaptosomes is based upon their well investi-
gated structural and biochemical properties. Electron micro-
scopic studies indicate that synaptosomes contain a large
amount of storage vesicles with fairly small mitochondria.
Biochemically, isolated synaptosomes carry out both general
metabolic functions as well as those peculiar to the physio-
logical function of nerve endings in vivo. These functions
include cellular respiration (18, 19), protein biosynthesis
(20, 21) and the synthesis of ATP from inorganic phosphate,
as well as the manufacture of the neurohormones acetylcholine
(22), norepinepherine (23), 5-hydroxytryptamine (24), dopa-
mine (23) , and histamine (26).

18
Experimental Procedure
Groups of 5 adult male Holtzman rats (340-390 gin) were
exposed to test gas mixtures consisting of 79^-211 nitrogen-
oxygen, argon-oxygen, or helium-oxygen at ambient pressure
(632 mm Hg) and the thermal neutral temperatures of the respec-
tive mixture (3). Gas mixtures were prepared in cylinders by
partial pressure and final oxygen concentration in the gas
mixture measured by a Beckman paramagnetic oxygen analyzer.
Since the causitive agents in these experiments were
gases, all possible precautions were taken to assure that only
the test gas atmosphere came in contact with animals, tissues
and solutions. Denitrification of solutions was carried out
by heating to 50°C for 30 minutes then placing the solutions
in a vacuum desiccator (23 inches Hg vacuum) for one hour.
After the degasing period, the desiccator was filled with the
test gas mixture under study. Solution containers were then
capped and solutions stored at 0-4 C until use. This proce-
dure was followed for the nitrogen-oxygen mixture as well as
the rare gas-oxygen mixtures in order to assure uniformity in
solution preparation between controls and test-gas evaluation.
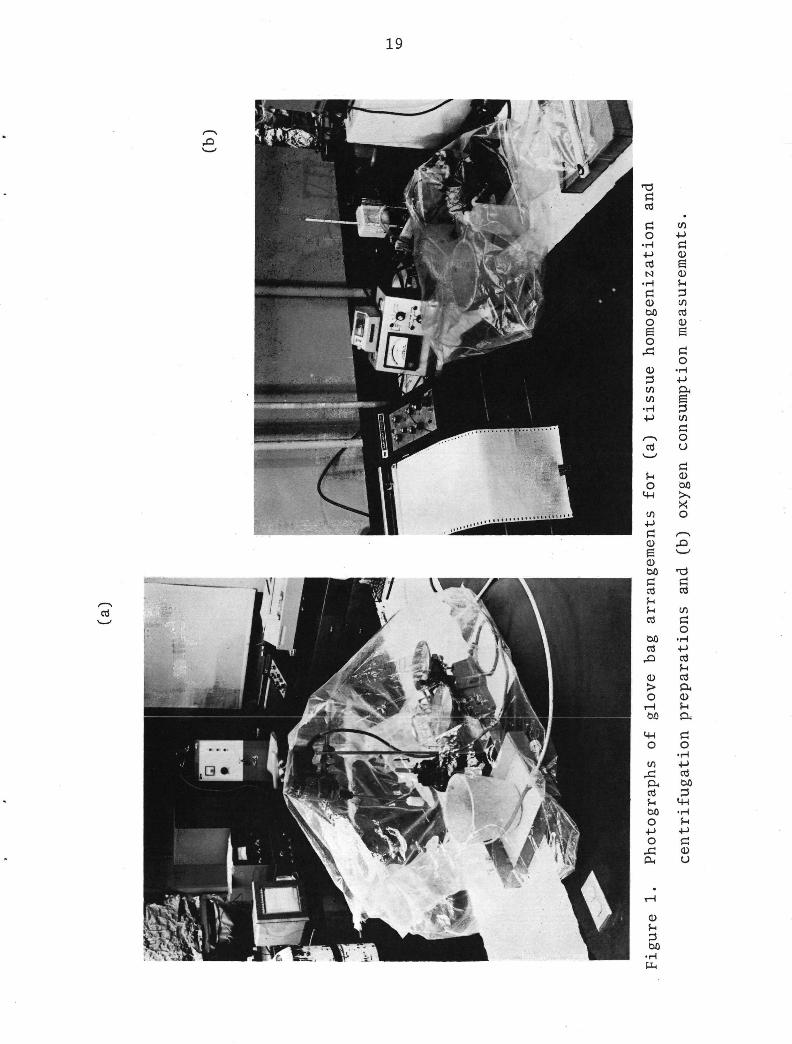
Furthermore, all preparative and analytical procedures
were carried out in glove bags filled with the test-gas mix-
ture being examined during a given experiment. This included
(Figure la) animal sacrifice, brain excision, tissue homogeni-
zation and centrifugation preparation steps. Centrifuge tubes
were filled, balanced and capped while in the glove bags,
19
T3a03
PIO
•H4-»03to•Ha0>DOOeof—>
ri-1
<D
3
(/)
01•HP
/ v
03\^^s
?-<0
MH
c/)
tflPti0)a0)H3COrt<Us(-HK
0• HP
P<a3wcooP!0)MXX0
06<DDOc03fn5H03
03
0)
PH03f-cDOO
03
P03fi03PH0)
O•HPo3DO
PI(DO
bo

20
thereby eliminating the need to flush the centrifuge with
test-gas mixtures. Analytical procedures, oxygen consump-
tion (Figure Ib) and acetylcholinesterase activity measure-
ments, were also carried out in glove bags. Glove bag
procedures, obviously time consuming and inconvenient, were
absolutely required to assure that only the test-gas mixture
under investigation came in contact with the synaptosomal
preparation.
Animal exposure to test-gas mixtures were carried out in
the metabolic chambers using a flow-through system at a gas-
flow rate of 8 liters/min. Exposure periods began at 2200
hours one day and terminated at 0600 hours the following morn-
ing. The 8-hour exposure period is probably far in excess of
that required for animal/test-gas equilibration since Clarkson,
et a.1 (3) measured metabolic effects in about one hour under
nearly identical experimental conditions. Following the expo-
sure period, animals were quickly transferred to an open-ended
glove bag (gas-flow rate = 25 liters/min.) and sacrificed by
decapitation. Brains were rapidly excised and placed in a
tared, capped centrifuge tube and placed on ice. Each brain
was identified and kept separate during the entire isolation
and analytical procedure.
Brains were homogenized with a loose-fitting teflon-in-
glass homogenizer in 9 volumes of 0.32 M sucrose. Synapto-
somes were isolated by discontinuous gradient centrifugation
as described by Gray and Whittaker (25) and modified by

21
Bradford (18). The entire isolation procedure is outlined
in the accompanying flow chart (Figure 2). During initial
isolation runs, final synaptosomal preparations were examined
by electron microscopy (Figure 3) to assure that synaptosomes
had indeed been isolated.
The synaptosomal pellet obtained at final centrifugation
step was resuspended in 2.0 ml 0.32 M sucrose. The resulting
concentrated synaptosome suspension was used for determina-
tion of oxygen consumption rates. An aliquot (0.20 ml) of
this suspension was diluted to 2.0 ml in 0.32 M sucrose and
the resulting dilute synaptosome suspension stored on ice
for acetylcholinesterase activity determinations.
Both acetylcholinesterase activity and oxygen consumption
determinations were carried out at 37 C. Acetylcholinesterase
activity was determined according to Ellman, et al (27). The
assay solutions were prepared in the glove bag in Beckman
glass-stoppered cuvettes with everything except the substrate
(acethlthiocholine--ATC) then sealed with rubber culture-tube
stoppers of the appropriate size. These cuvettes were then
removed from the glove bag and placed in the Beckman DBG Spec-
trophotometer. After temperature equilibration, ATC (100 yl)
was introduced with a Hamilton syringe to start the assay.
The specific activity of acetylcholinesterase is expressed in
terms of micromoles of substrate converted per minute per
milligram of wet brain tissue.

22
BRAIN
InoiWeigh and Homogenize in 9 vol. 0.32 M Sucrose
Centrifuge 1000 xg/ lOmin.
fnizPrecipitate
Wash in 0.32 M Sucrose
Supernatant
Precipitate (discard) WashingsnrCentrifuge 10,000 x g / 20 min.
Supernatant (discard)
aspirate interface,
slowly add 1 vol.distilled H2O, letstand 20 minutes
centrifuge15,000 xg/ 20min.
0.8M
1.2M
1Pellet
resuspend in1.0 ml 0.32 M Sucrose
idiscontinuous sucrose
gradient centrifugation
100,000 x g / 60 min.
.^resuspend pelletin 2.0 ml.
0.32 M Sucrose
C>2 consumptionand acetylcholinesterase
assays
Figure 2. Flow diagram of synaptosome preparation
methodology.

23
Figure 3. Electron photomicrograph of synaptosome prepara-
tion showing synaptosomes (S), mitochondria (M),
synaptic vesicles (SV), and postsynaptic membranes
(P). 19500 X. Courtesy of W. J. Banks, Jr. and
A. M. Sheppard.
24
Oxygen consumption rates were determined with an oxygen
electrode and meter (Yellow Springs Instrument Model 53). The
concentrated synaptosome suspensions were placed (on ice) in
a glove bag (Figure 4) along with the water jacketed cell
compartment, oxygen electrodes and test solutions. After
flushing with test gas (25 liters/min.) the bag was sealed
and 3.0 ml of Krebs-phosphate (Krebs-Ringer) medium (pH 7.4)
was placed in each of the sample cuvettes and allowed to
equilibrate for 5 minutes. An oxygen electrode was then
placed in the cuvette, the oxygen meter and chart recorder
adjusted to 100%, and a sample (0.20 ml) synaptosome suspen-
sion injected into the cuvette with a hypodermic syringe.
Oxygen uptake was followed for 10 minutes and quantified in
terms of yl of 02/minute/mg of wet brain tissue.
Results
Preliminary results of these experiments have been ob-
tained for animals exposed to nitrogen-oxygen and argon-oxygen
test environments (Table I). These results represent average
values for two separate experiments in each test environment.
Measurements were run in duplicate for three synaptosomal
preparations in each experiment.
Synaptosomes isolated from the argon-oxygen atmosphere
consume oxygen at a rate only 70% of that exhibited by synap-
tosomes from the nitrogen environment. Acetylcholinesterase
activities, on the other hand, show an 8% increase for argon
relative to nitrogen controls.

25
Table I. Synaptosomal oxygen consumption (yl 02/min/mg brain)
and acetylcholinesterase activity (yM product/min/
mg brain) for rats exposed to normoxic nitrogen-
oxygen and argon-oxygen mixtures.
ATMOSPHERE 02 CONSUMPTION ACETYLCHOLINESTERASE
Nitrogen-Oxygen
Argon-Oxygen
230
161
321
349
The argon-produced depression of oxygen consumption is
similar to the decrease in metabolic rate which has been
demonstrated in vivo for rats exposed to argon-oxygen atmos-
pheres (3, 4). Previous reports by others attempting to
correlate in vivo and in vitro effects of rare gases on
metabolic rate have utilized entirely in vitro techniques
(28, 29). Tissues under examination were exposed to the
rare gas under examination only after being placed in the
Warburg flask for analysis. Such studies have not been able
to provide a clear correlation between in vivo and i_n vitro
effects of the rare gases. One study (28) showed no measur-
able in vitro metabolic effects for either helium or argon,
while another (29) showed slight depressions in metabolic
rate for both helium and argon relative to nitrogen controls.
It would appear that the ambiguities in in vitro investiga-
tions of "inert gas narcosis" would need to be resolved before
a more satisfactory understanding of this phenomena is possible

26
The increase in acetylcholinesterase activity of nearly
8% for argon relative to nitrogen isolated synaptosomes is
difficult to interpret at this stage of the investigation.
The results are quite preliminary and additional experiments
must be performed before a statistically significant or con-
sistent pattern can be formed. If experiments verify a sig-
nificant effect of rare gases on acetylcholinesterase activity,
subsequent studies will be directed toward identification of
the molecular mechanism of this action. Since acetylcholin-
esterase is a membrane bound enzyme, it would be necessary to
perform kinetics studies in which the enzyme was dissociated
from the membrane. These studies would permit an interpreta-
tion to be made between direct enzyme-rare gas effects and
the effect of the gas upon membrane-protein interactions.
Additional experiments are currently in progress in which
the test-gas mixture consists of helium and oxygen. An initial
experiment with this mixture suggests a small decrease in
oxygen consumption with little or no influence of helium on
acetylcholinesterase activity.
While evidence suggests that rare gases may indeed asso-
ciate with cells and cellular components (30, 12), it would
appear unlikely that the gases would completely equilibrate
in the short time required to start Warburg assay procedures
used in previous in vitro investigations (28, 29). Of even
more concern may be the fact that tissue homogenates used
in these studies probably are not the best system for in vitro
27
metabolic investigations with rare gases. This is particu-
larly true in light of currently prevalent hypotheses regard-
ing the mechanism of "inert gas narcosis." As explained
previously in both this section and Section II, rare gases
are thought to act primarily at the biomembrane level; and
tissue homogenates contain both intact and disrupted cells.
For these reasons, studies such as the one outlined in this
report in which intact cells or cell organelles are isolated
and assayed entirely in the test environment are expected to
render a clearer picture of the cellular and subcellular
mechanism of "inert gas narcosis."

28
REFERENCES
Jordan, J. P., J. B. Simmons, II, D. V. Lassiter, Y.
Deshpande, and D. J. Dierschke. Metabolic effects of
nitrogen and neon as diluent environmental gases. In
Depressed Metabolism, X. J. Musacchia and J. F. Saunders,
(Eds.), American Elsevier Publishing Co., New York, 1969.
pp . 67-113.
Lassiter, D. V., J. P. Jordan, R. L. Coleman and J. B.
Simmons, II. Coenzyme A Aberration in Marginally Hyper-
oxic Space Capsule Environments. Aerospace Med. 43:56-
61, 1972.
Clarkson, D. P., C. L. Schatte, and J. P. Jordan. The
thermal neutral temperature range of rats in helium,
argon, and air. Amer. J. Physiol., In Press, 1972.
Schatte, C. L., J. P. Jordan, R. W. Phillips, J. B. Simmons,
II, and D. P. Clarkson. Non-Thermal Metabolic Response
of Rats to He-CU, No-O^ and Ar-O^ at One Atmosphere.
Submitted to the editors of the American Journal of Physi-
ology. 1972.
Bennett, P. B. The aetiology of compressed air intoxica-
tion and inert gas narcosis. International series of
monographs in pure and applied biology/zoology, Pergamon
Press, London. 1966.
29
6. Bennett, P. B. and A. J. Hayward. Electrolyte imbalance
as the mechanism for inert gas narcosis and anesthesia.
Nature. 213:938-939, 1967.
7. Clements, J. A. and K. M. Wilson. Affinity of narcotic
agents for interfacial films. Proc. Nat. Acad. Sci. 48:
1008-1014, 1962.
8. Miller, K. W., W. D. M. Paton, and E. B. Smith. Site of
action of general anesthetics. Nature 206:574-577, 1965.
9. Featherstone, R. M., C. A. Muehlbaecher, F. L. DeBon, and
J. A. Forsaith. Interactions of inert anesthetic gases
with proteins. Anesthesiol. 22:977-981, 1961.
10. Bennett, P. B. and A. N. Dossett. Mechanism and preven-
tion of inert gas narcosis and anesthesia. Nature 228:j
1317-1318, 1970.
11. Sears, D. F. and S. M. Gittleson. Narcosis of paramecia
with xenon. Fed. Proc. 20:142, 1961.
12. Kwan, E. and A. Trevor. The association of xenon with
subcellular components of the rat cerebral cortex. Mol.
Pharmacol. 5:236-243, 1969.
13. Carpenter, F. G. Depressant Action of Inert Gases on
the Central Nervous System in Mice. Am. J. Physiol. 172:
471-474, 1953.
14. Carpenter, F. G. Anesthetic Action of Inert and Unreac-
tive Gases on Intact Animals and Isolated Tissues. Am.
J. Physiol. 178:505-509, 1954.

30
15. Gottlieb, S. F. and J. M. Weatherly. Physiological
Effects of Nobel Gases on Frog Sciatic Nerve and Gastro-
cnemius Muscle. Am. J. Physiol. 208:407-411, 1965.
16. Paton, W. D. M. and R. N. Speden. Uptake of Anesthetics
and Their Action on the Central Nervous System. Brit.
Med. Bull. 21:44-48, 1965.
17. Raymond, L., R. B. Weiskopf, M. J. Halsey, A. Goldfien,
E. I. Eger, III, and J. W. Severinghaus. Possible Mecha-
nism for the Antiarrhythmic Effect of Helium in Anesthe-
tized Dogs. Science. 176:1250-1252, 1972.
18. Bradford, H. F. Respiration In Vitro of Synaptosomes
from Mammalian Cerebral Cortex. J. Neurochem. 16:675-
684, 1969.
19. Bradford, H.F. and J. S. de Belleroche. Metabolism of
Beds of Mammalian Cortical Synaptosomes: Response to
Depolarizing Influences. J. Neurochem. 19:585-602, 1972.
20. Autilio, L. A., S. H. Appel, P. Pettis and P. L. Gambetti.
Biochemical Studies of Synapseses In Vitro. I. Protein Syn-
thesis. Biochemistry. 7:2615-2622, 1968.
21. Appel, S. H., L. Autilio, B. W. Festoff and A. V. Escueta.
Biochemical Studies of Synapses In Vitro. III. Ionic
Activation of Protein Synthesis. J. Biol. Chem. 244:3166-
3172, 1969.
22. Whittaker, V. P. The Application of Subcellular Fractiona-
tion Techniques to the Study of Brain Function. In Prog.
Biophys. Mol. Biol. 15:39-97, 1965.

31
23. De Robertis, E. Ultrastructure and Cytochemistry of the
Synaptic Region. Science. 156:907-914, 1967.
24. Pottes, L. T. and J. Axelrod. Intracellular Localization
of Catecholamines in Tissues of the Rat. Nature. 194:
581-582, 1962.
25. Gray, E. G. and V. P. Whittaker. The Isolation of Nerve
Endings from Brain: An Electron Microscopic Study of
Cell Fragments Derived by Homogenation and Centrifugation.
J. Anat., London. 96:79-87, 1962.
26. Michaelson, A. I., P. Z. Coffman and D..F. Vedral. The
Regional Distribution of Histamine in Brain of the Rhesus
Monkey (Macaca Mulatta). Biochem. Pharmacol. 17:2435-2441,
1968.
27. Ellman, G. L., K. D. Courtney, V. Andres, Jr., and R. M.
Featherstone. A New and Colorimetric Determination of
Acetylcholinesterase Activity. Biochem. Pharmacol. 7:88-
95, 1961.
28. Cook, S. F. The Effect of Helium and Argon on Metabolism
and Metamorphosis. J. Cell. Comp. Physiol. 36:115-127,
1950.
29. Maio, D. A. and J. R. Neville. Effect of Chemically
Inert Gases on Oxygen Consumption in Living Tissues.
Aerospace Med. 38:1049-1056, 1967.
30. Featherstone, R. M., C. A. Muehlbaecher, F. L. DeBon,
and J. A. Forsaith. Interactions of Inert Anesthetic
Gases with Proteins. Anesthesiology. 22:977-981, 1961.

32
APPENDIX A
The following proposal (Section 2) for compterization
of the metabolic chamber system has been submitted to NASA's
Office of Life Sciences for evaluation. Pagination and
referencing in this appendix are separate from the remainder
of the Status Report.

DESCRIPTION OF
METABOLIC CHAMBER SYSTEM
Laboratory of Aerospace Biology
Colorado State University
1972

SECTION 1
The investigation of the metabolic effects of artificial environments and
breathing atmospheres often requires that experimental animals be held in a variety of
test environments for extended periods of time. We wish to describe a metabolic
chamber system which will perform this important task as well as facilitate the acquisition
of metabolic data.
This chamber system is self-contained except for the addition of C>2 and on
rare occasions diluent gases and removal of animal waste products. The system (Figure 1)
consists of four major sections. These include (a) the metabolic chambers, (b) the scrubber
system for removal of atmospheric contaminants, (c) the atmospheric control unit for
maintenance of chamber pressure and atmospheric composition, and (d) the metabolic
data monitoring system.
METABOLIC CHAMBERS
The animal chambers consist of large autoclaves (length = 3.0 ft.; diameter =
1.5 ft., I.D.) from which the distal end has been removed and replaced by a one-inch
thick clear plexiglass plate (4). This plate permits visual observation of animals during
the course of an experiment and the semi-permanent installation of inlets for electrical
leads and chamber service functions. For example, in our particular situation, the plexiglass
plate is fitted with Poly-Flo bulkhead fittings for test gas atmosphere inlet and outlet,
automatic water delivery system and leads for a barometric pressure altimeter. In addition,
a multipin electrical plug is installed to supply power to a demand pellet-delivery food
dispenser, thermoswitch and fans. Experimental animals are housed within the chambers
in cages constructed of expanded stainless steel. The cage floor area measures 15 x 30
inches and is adequate for 8 to 10 rats in the 300 to 350 gram range.
Four separate animal exposure chambers are housed in a large hypobaric
chamber (Figure 2). This large chamber is used as an "elevator" to bring personnel to
the same barometric pressure as that of a given animal exposure chamber during the
replenishing of the food supply, removal of animal waste products, weighing of animals
and subsequent injection of radioactive substrates, and during sacrifice of the animals for
tissue analysis.

E01
aJSo_o
O_o03
1
T3O
JOCLlf
"o
I.2•6u
3OH
£

S.A.C.S.
SPACECRAFTATMOSPHERECONTROLSYSTEM
Figure 2. Cutaway view of eight-man hypobaric chamber used to house
animal exposure chambers. Only two animal exposure chambers (C)
are shown although the eight-man unit has the capacity to contain
four such chambers.

The food dispensers are shown in Figure 3. Food is delivered from the hopper
to the cup by a gear motor driven auger. One turn of the auger will deliver approximately
370 +. 20 mg of food pellets (Figure 3 unset). Operation of the feeder is controlled by a
photoelectric system as shown in the block diagram (Figure 4a). A cadmium sulfide cell
is located in the bottom of the cup and the light source (two Monsanto light emitting
diodes, 650 nm) is located directly over the center of the cup approximately 6cm from
the photocell. The photocell is connected to a low-gain switching amplifier which in turn
actuates a relay connected in series with the drive motor. When the food cup is empty,
the motor is turned on. Food pellets dropping into the cup block the light beam deener-
gizing the relay. The motor continues to operate for at least one complete revolution at
which point it is shut off by a microswitch actuated by a cam on the shaft of the auger.
Each revolution is tallied by an external electro-mechanical counter. The feeder in each
chamber may either be operated independently or in a master-slave fashion. The use of
these devices provides a much more accurate determination of food consumption than is
possible by the usual food tray weighing method.
Low speed fans and independent chamber temperature control devices are
installed in each of the animal exposure chambers. The installation of the fans assures
a constant low-velocity test gas circulation within the chamber, thereby minimizing possible
temperature and gas composition gradients. This is particularly important in the operation
of test chambers quantifying the rates of ۩2 production following the injection of **C-
labeled substrates.
The temperature control devices are quite simple yet highly efficient, consis-
ting of a thermoswitch inside the chamber and a solenoid valve inserted in the chamber
coolant line. The solenoid valve is normally closed and is actuated to allow coolant flow
when the internal chamber temperature exceeds a preset limit. These systems permit
individual chambers to be operated at different internal temperatures and will control
these temperatures to + 0.5°C over temperatures 0° to 100°C.
Water is supplied to the chambers from a common reservoir by means of an
air-driven syringe and a system of solenoid valves (which permit the use of a single syringe
to deliver water to all the chambers). Animals obtain drinking water from a stainless
steel cup positioned at one end of the cage.

a ^r
8. isx<u
a•s
s8.
T3OOu,
Io
IISo•***-»o
oon
t>u-7•
s8.•6
1S
T3b*
£IM3!
.S
•8•w)
Jb
1•32-*~e
8•ofl«
c5
1•ocs
51•*•>»
JS
•z
IM4
CuO
c«
1
8.•ooot4-l
00Or*-Jrs
_>>
2 *o8.
c.a.
00

A temperature compensated thermal conductivity bridge circuit is used to
maintain a constant water level in each cup. By means of a stepping relay (Figure 4b),
each sensor is sampled at regular intervals (once every 5 minutes). When the water
level drops below the level of the cup thermistor, a change in resistance of the sensor
due to heating effects an unbalanced bridge circuit. This unbalanced bridge circuit
produces a resetting error signal which is fed directly to the gate of a silicon controlled
rectifier (SCR 2N5061) which will then conduct the signal. When a conducting SCR is
sampled by the relay, the sample and hold circuit is switched on; and, on the next
advance of the relay, current is applied to the solenoid supplying air to the syringe
activator, to the solenoid connecting the syringe to the appropriate chamber, and to
the solenoid connecting the syringe to the reservoir. As a result, 5 ml of water is delivered
to the cup. The next two advances of the relay perform the reverse operation; i.e., closing
the inlet to the cup, opening the outlet of the reservoir and returning the syringe plunger
to its former position (thereby filling it), and resetting the sample and hold circuit. The
operation of inlet solenoids is individually tallied, thereby providing an accurate estimate
of water consumption.
GAS SCRUBBER SYSTEM
With a closed environmental system, gaseous waste products produced by the
animals (not only CC^, but CH^ ammonia, light organics, and volatile acids) must be
removed before their concentrations reach toxic levels or even low levels which might
affect the metabolism of experimental animals. Humidity control should also be taken
into account.
The pump leading to the gas scrubber train (Figure 1) evacuates the chamber
and provides approximately a 10 psig head pressure going into the scrubber train. The
pump following the gas scrubbers creates the pressure differential over the gas scrubber
train to assist the flow and at the same time compress the gas into the pressure-volume
tank. Thus, the duplication of pumping capacity is a method of moving gases through
high density liquids.

(a) FEEDER.
RELAY
< 120 VAC (HI)
CONTROLAMPLIFIER
< 120 VAC (LO)
AA
24 vdc
4.5vdc
(b) WATERING SYSTEM.
SENSELINES
Figure 4.
SCRGATES
STEPPING
RELAY
SOLENOID VALVES
-M SAMPLEAND HOLD
TIMEBASE
120 VAC
POWER
Schematic diagrams of (a) food pellet dispensor with demand-
pellet-delivery,
(b) watering system for metabolic chambers.Please refer to text for detailed descriptions.
The output of the vacuum pump is fed directly into a 3-gallon bubbler
containing 3N KOH where the CC>2 is trapped. The KOH scrubber is fitted with a
silicon rubber septum for removal of samples for C(>2 or CO2 quantification. The
output from the KOH bubbler is fed into a concentrated H^SC^ bubbler which serves
the dual function of removing NHj and r^O vapors. To insure maximum contact of
the gas with bubbler liquid, the gas stream is fed into each bubbler through three
sintered teflon inlet diffusers.
Canisters containing Purafil odoroxidant (Borg-Warner Corporation) and
activated carbon respectively are positioned in that order in the effluent line from the
H2SC«4 scrubber. The installation of the canisters insures total removal of residual
^804 vapors, extremely important with regard to pumps, solenoid valves, and the
health of the animals.
ATMOSPHERIC CONTROL UNIT
The Atmospheric Control Unit is the heart of the metabolic chamber system.
The unit possesses three distinctly different sections. These include (a) a constant
pressure animal chamber and altitude control system, (b) the negative pressure system
which brings the effluent gases from the animal chamber through the scrubber train,
and (c) the positive pressure system which reconcentrates the cleaned gases in a pressure-
volume reserve tank feeding them into a gas mixing tank in which the composition of
the gas is monitored and kept constant by the gas analyzer control system. All portions
of the system are controlled from a master console (Figure 5). The constant pressure is
maintained within the animal chamber by use of prepositioncd electrical contacts on the
altimeter (4) which are actuated by changes in chamber pressure opening the appropriate
solenoid valves to allow an increase in the inflow or outflow of gas from the chamber.
In order to properly control the addition and mixing of gases, our system
employs a positive pressure side (Figure 1) in addition to the altitude controlling nega-
tive pressure side. The positive pressure side is necessary for three reasons: (1) to
maintain a reserve volume of gas to prevent aberrant flow, (2) to have a base line
pressure for oxygen analysis, and (3) to maintain precise control over the addition of
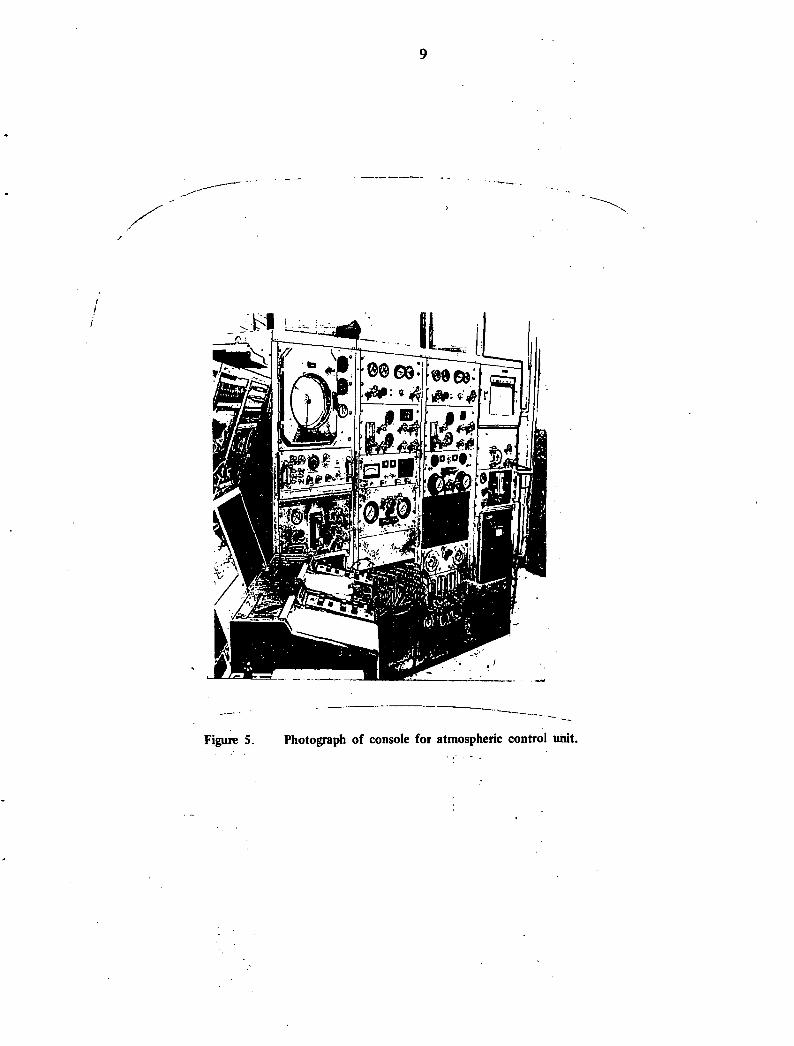
Figure 5. Photograph of console for atmospheric control unit.

10
gases to be mixed. The negative pressure side provides the pressure differential over the
chamber input and output to maintain the preset altitude and flow rate. The effluent
of the vacuum pump is compressed on the pressure side thus closing the system. To
eliminate the possible interjection of contaminants from the pumps into the gas stream,
teflon coated dry-diaphragm aluminum pumps (Thomas Industries) are used.
METABOLIC DATA MONITORING SYSTEM
Several metabolic parameters may be conveniently quantified using this
chamber system. Digital counters are connected to electrical leads for the chamber
temperature controlling solenoids, water and food delivery systems, and oxygen and
diluent systems. These counters tabluate each actuation of the respective systems. A
multipen event recorder (Esterline Angus Model A620X), in conjunction with the digital
counters, provides a convenient, permanent record of the frequency and exact times at
which various metabolic parameters are measured, permitting metabolic patterns to be
compared for experimental and control animals. Metabolic parameters which may be
obtained are food and water consumption, oxygen consumption carbon dioxide produc-
tion and the production of CO2 from selected radio-labeled substrates.
The latter parameter has been used extensively in this laboratory to identify
specific metabolic pathways affected by test environments. In this procedure, animals
are removed from the chamber at predetermined times, weighed and injected intra-
peritoneally with selected radio-substrates (usually acetate-1- C or glucose-1, -6, or -UL- C
at 50 uci/kg body weight) and replaced in the chamber. Rates of CO2 expiration are
determined by taking serial samples from the 3N KOH scrubber and quantifying the
trapped CXK as a function of time. Scrubber samples are usually taken at ten-minute
intervals for three hours after injection.
DISCUSSION
For a more detailed description of the operation of this system, it is con-
venient to begin with a unit of gas in the pressure-volume tank. The gas in this tank is
the chosen gas mixture depleted of oxygen (due to oxygen consumption by the animals)
and cleaned of animal waste by-products. The function of this tank is storage and
11
compression of the circulating gas, providing the capacity to handle fluctuations in the
pressure/volume of the system. Generally, the pressure-volume tank is maintained at
20 psig.
Following the pressure-volume tank is a gas supply tank, whose pressure is
maintained by a regulator at 10 psig providing a flow of gas that is constant on a molar
basis per unit of time. The automatic analysis and mixing of oxygen and diluent gas is
accomplished in this tank.
A Beck man F-3 paramagnetic oxygen process analyzer is used to continuously
monitor the oxygen concentration. A small portion of the gas mixture in the supply
tank is continuously flowed through the analyzer at 350 milliliters per minute and
regulated at 4 psig. The gas exiting from the analyzer is returned to the system via
the negative pressure side with the exit line back pressure maintained by a needle meter-
ing valve. The zero and 100% calibration points are set with diluent gas and pure oxygen,
respectively, at the same flow rate and pressure.
The oxygen analyzer readout has both an adjustable low and high set point
meter relay to control the addition of oxygen. The analyzer has a 30-second response
time; that is to say, with the addition of oxygen to the supply tank, 30 seconds elapse
before the analyzer registers a change in the oxygen concentration. This eliminates the
problem of over compensation due to lag time in mixing in the gas supply tank.
When the oxygen analyzer registers a demand for oxygen, a 45-second delay
timer is started; at the end of this time, a cycle timer opens the oxygen supply valve
for a set amount of time. When the timer is cycled, the oxygen supply valve closes
and the delay timer starts another 45-second interval* This allows the oxygen analyzer
enough time to respond to the new oxygen concentration before further adjustment.
This delay and cycling admission of oxygen is continued until the analyzer registers the
preset concentration of oxygen when all timers return to the ready position.
Diluent gas concentration is maintained in response to total system pressure.
It is added on a similar delay and cycle timer system as the oxygen, so that the oxygen
analyzer will be able to respond to the addition of diluent gas (as a reduction in oxygen
concentration) and add oxygen to correct the resultant oxygen deficiency. The mixed
gas of proper oxygen concentration is fed into the altitude control where its flow rate
into the animal chambers is controlled.

12
The metabolic chamber system will maintain experimental animals in test
environments at any desired atmospheric pressure from 200 to 1000 mm. Atmospheric
pressure in the chamber will usually not vary more than +_ 1% over a 2-day continuous
exposure period with even greater precision (+. 0.5%) possible during shorter exposure
periods. Altitude variations are monitored on both experimental and control chambers
by a two-pen Taylor altitude recorder, and the percent of oxygen in a given test
atmosphere can be maintained at +. 0.5%. Chamber temperature vatiations are monitored
by a Brown "electronic" 16-point recorder calibrated for use with type T thermocouples
which records 2 points of temperature every 30 minutes in each chamber, the circulating
water bath temperature, and room temperature.
The efficiency of the unit is checked by using precise gas analyses with test
pickoff ports valved into the system for connection to a gas-solid chromatograph (GSC).
Separations are conducted on silica gel and molecular sieve 5A columns in series using a
thermal conductivity cell as a detector, and helium as the carrier gas as previously
described (5).
GSC pickoff points are positioned in the chamber input and output lines to
monitor the exact composition of the entrance gas as well as the exhaust gas which
contains waste products introduced by the animals. A scrubber efficiency pickoff point
has been included immediately after the scrubber system.
Contaminant levels in metabolic chambers are influenced by the number of
animals in the chamber and the flow rate of gas through the chamber. Experience has
shown that with 8 animals occupying the chamber, a flow rate of 5 liters/minute STP
is sufficient to prevent CC>2 and ammonia levels from becoming significant.
With any chamber system, there is the possibility of an equipment malfunc-
tion that will accidentally terminate or interrupt an experiment. The likelihood of such
a malfunction is perhaps even greater in a system as complex as the one described in
this manuscript, operating on a 24 hours a day/7 days a week basis. With this in mind,
a malfunction alarm system is installed as an integral part of the metabolic chamber
system.
The alarm system is comprised of several pressure- and micro-switches
positioned at key points and a dedicated telephone line. In the event that one of the
13
system parameters (pressure, temperature, %C>2, etc.) varies from preset limits, the
alarm is triggered either in the laboratory or, via the dedicated telephone line, in
the home of one of the laboratory personnel. Generally, less than 10-15 minutes
elapses between the triggering of the alarm and the arrival of laboratory personnel.
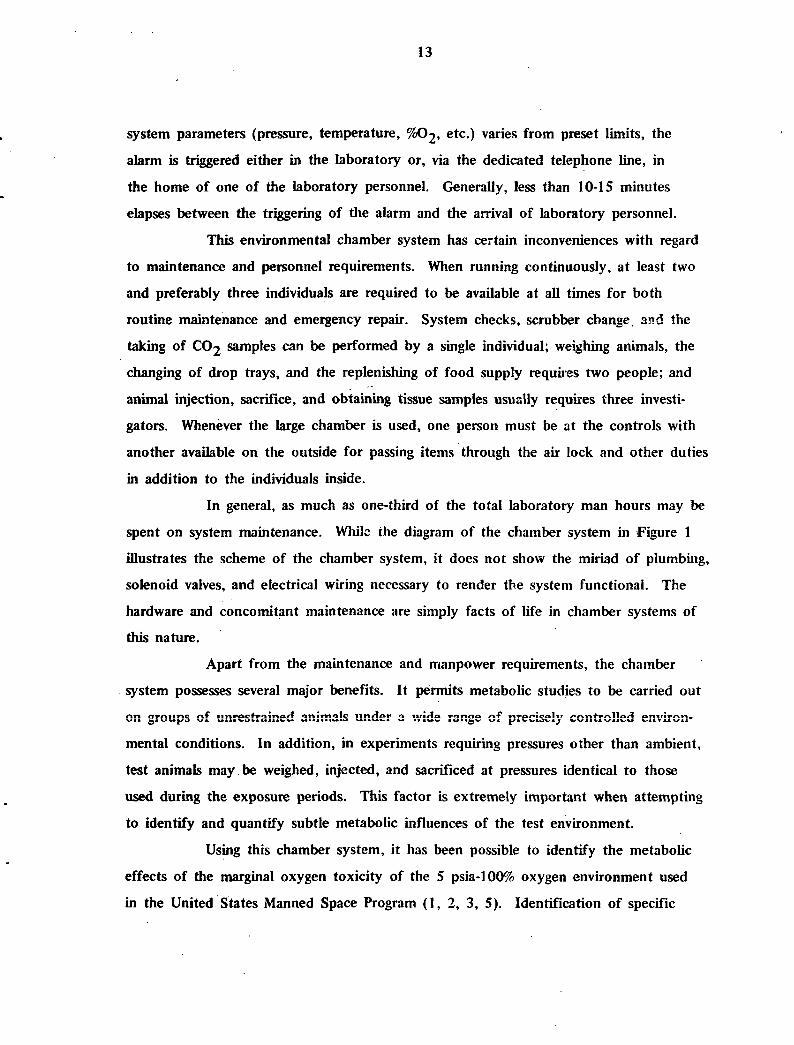
This environmental chamber system has certain inconveniences with regard
to maintenance and personnel requirements. When running continuously, at least two
and preferably three individuals are required to be available at all times for both
routine maintenance and emergency repair. System checks, scrubber change, and the
taking of CO2 samples can be performed by a single individual; weighing animals, the
changing of drop trays, and the replenishing of food supply requires two people; and
animal injection, sacrifice, and obtaining tissue samples usually requires three investi-
gators. Whenever the large chamber is used, one person must be at the controls with
another available on the outside for passing items through the air lock and other duties
in addition to the individuals inside.
In general, as much as one-third of the total laboratory man hours may be
spent on system maintenance. While the diagram of the chamber system in 'Figure 1
illustrates the scheme of the chamber system, it does not show the miriad of plumbing,
solenoid valves, and electrical wiring necessary to render the system functional. The
hardware and concomitant maintenance are simply facts of life in chamber systems of
this nature.
Apart from the maintenance and manpower requirements, the chamber
system possesses several major benefits. It permits metabolic studies to be carried out
OR groups of unrestrained animals under a wide range of precisely controlled environ-
mental conditions. In addition, in experiments requiring pressures other than ambient,
test animals may be weighed, injected, and sacrificed at pressures identical to those
used during the exposure periods. This factor is extremely important when attempting
to identify and quantify subtle metabolic influences of the test environment.
Using this chamber system, it has been possible to identify the metabolic
effects of the marginal oxygen toxicity of the 5 psia-100% oxygen environment used
in the United States Manned Space Program (1, 2, 3, 5). Identification of specific
14
enzymes in key metabolic pathways influenced by this test environment, was
possible even though total animal metabolism as measured by C>2 consumption
did not change (2).
The closed environmental system is proving equally valuable in investi-
gations focused upon identification of the metabolic effects of replacing atmospheric
nitrogen with argon, helium, or neon (6). In addition to precise control of environ-
mental conditions, the closed system described in this manuscript has proven even
more valuable in these studies particularly in the ease of mixing gases for test environ-
ments and economy with regard to the costs of inert gases. One can readily envision
how this metabolic chamber system could be applied to the study of a wide range of
environmental variables including temperature, the metabolic effects of air pollutants,
and smoking.

15
REFERENCES
1. Bond, A. D., J. P. Jordan, and J. B. Allred. Metabolic Changes in Rats
Exposed to an Oxygen-Enriched Environment. Am. J. Physiol. 212:526-
529, 1967.
2. Gorman, R. R., J. P. Jordan, J. B. Simmons, II, and D. P. Clarkson.
Biochemical Adaptation in Rat Liver in Response to Marginal Oxygen
Toxicity. Biochem. J. 125:439-447, 1971.
3. Jordan, J. P., J. B. Allred, C. L. Cahill, and R. T. Clark. Effect of
Discontinuous Exposure of Rats to a High Oxygen-Low Pressure Environ-
ment. Aerospace Med. 37:368-371, 1966.
4. Kollias, J. and J. P. Jordan. An Improved System for Prolonged Exposure
of Small Animals to Artificial Low Pressures. J. Appl. Physiol. 23:742-744,
1965.
5. Lassiter, D. V., J. P. Jordan, R. L. Coleman and J. B. Simmons, II.
Coenzyme A Aberration in Marginally Hyperoxic Space Capsule Environments.
Aerospace Med. 43:57-61, 1972.
6. Schatte, C. L.? J. P. Jordan, R. W. Phillips, J. B. Simmons, II, and D. P.
Clarkson. Non-Thermal Metabolic Response of Rats to He-O2, ^-02 and
Ar-O2 at One Atmosphere. Submitted to the editors of the American
Journal of Physiology. February 7, 1972.
16
SECTION 2
The metabolic chamber system described in the previous section is one of tre-
mendous capability. Its ability to detect subtle changes in whole animal metabolic
behavior in response to the nature of the gaseous environment has been well documented
in this laboratory. However, we find it would be desirable to increase the capacity of
this system so that data may be collected at more frequent intervals than is presently
possible, thereby enhancing the system's sensitivity, and change the methods of data
collection and analysis so that this laboratory's personnel can be more efficiently utilized.
Additionally, in this era of cut-backs in research funding, we feel it would be desirable
to share this system with other investigators in the NASA Life Science Program having
similar interests but unable to assemble such a system due to the expense required. At
the present time, it would be difficult to comply with such requests because of the drain
on personnel-time imposed by this system's configuration.
To improve on the system's overall efficiency and make it possible to offer these
facilities to other NASA investigators, it would be necessary to automate system control,
data collection, and data processing. To effect these necessary changes in system configura-
tion, the following additional types of equipment would be desirable: (1) CC>2 analyzer,
(2) chamber humidity monitor, (3) full servo control of metabolic chamber pressure,
(4) real time acquisition of C(>2 production data, and (5) computer system capable
of data collection, processing, and system control. Figure 1 shows the configuration of
the present system. The desired additions to this system are shown in color.
We first considered a terminal to Colorado State University's CDC 6400 computer
system, but this was rejected when it was found that this facility would not be available
on a 24-hour basis. We subsequently considered several types of mini computers and
calculators for the task. Although many were found adequate, our decision to design the
proposed system around the Data General Corporation's Nova 1200 system is based on
cost, capability, and ability to easily modify the configuration at a later date if desired.
The appendix contains equipment lists for two mini computer configurations plus a list
of additional equipment necessary for process control and data acquisition.
The first computer system (System I), Figure 2, essentially has full real time
capability in that it can be dedicated to several tasks in an apparent simultaneous manner.

17

N /
Figure 2. Configuration of computer system I.
•Position indicator input for multi-sample devic
multi-sample pressure t ransducerpressure t ransducer , metabolic control unit 1pressure t ransducer, metabolic control unit 2thermal mass flownieter. metabolic control unit Ithermal mass f lowmeter. metabolic control unit Ithermal mass f lowmeter. metabolic control unit 2thermal mass f lowmeter. metabolic control unit 2humidity/ temperature monitorgas solid chromatographoxygen analyzer, metabolic control unit 1oxygen analyzer, metabolic control unit 2C02 analyzer/mass spectrometerCCM analyser/mass spectrometermass spect rometermass spec t romete r
multi-sample pressure transducer sampling controlhumidity/ temperature monitor sampling controlgas solid chromatograph sampling controlgas solid chromatograph sample injection controlCO^ analy/er range control/mass spectrometer sample conCOianaly/.cr range controlservo control valve selectorscrvu control valve direction selectorservo control valve actuation controlbinary coded decimal input (BCD)*BCD inputBCD inputBCD inputBCD inpulBCD inputsp art-
alarm trigger controloxygen addition counter, metabolic control unit Ioxygen addition counter, metabolic contro l unit 2diluent addition counter, metabolic control unit Idiluent addition counter, metabolic control unit 2food pellet counter, metabolic control unit 1food pellet counter, metabolic control unit 2w a t e r addition counter, metabolic control unit 1w a t e r addition counter, metabolic control unit 2wate r addition counter, acclimatization chamber 1w a t e r addition counter, acclimatization chamber 2sparespatesparespare
itrol
I P»P«U
Figure 3 Configuratiun of computer system II.
•Position indicator input for multi-sample devices.
multi-sample pressure transducerpressure t ransducer, metabolic control unit Ipressure t ransducer, metabolic control unit 2thermal mass f lowmeter, metabolic control unit Ithermal mass f lowmeter. metabolic control unit Ithermal mast flowmeter, metabolic control unit 2thermal mass f lowmeter, metabolic control unit 2humid i ty / temperature monitorgas solid cinematographoxygen analyzer, metabolic control unit 1oxygen ana lyzer , metabolic control unit 2CO? analyzer/mass spect rometerCO? ana lyze r /mass spectrometermass spec t romete rmass spec t rometer
multi-sample pressure t ransducer sampling controlhumidity/ temperature monitor sampling controlgas solid chromatograph sampling controlgas solid chromatograph sample injection controlCOi analyzer range control/mass spectrometer sample controlCQ^analyzer range controlservo control valve selectorservo contiol valve direction selectorservo contro l va lve actuation controlbinary coded decimal input (BCD)*RCD inputBCD inputBCD inputBCD inputBCD inputspare
alarm trigger cuntroloxygen addition counter, metabolic control unit 1oxygen addition counter, metabolic control unit 2diluent addition counter, metabolic control unit Idiluent addition counter, metabolic control unit 2food pellet counter, metabolic control unit 1food pellet counter, metabolic control unit 2wate r addition counter, metabolic control unit 1water addition counter , metabolic control unit 2water addition counter, acclimatization chamber 1water addition counter, acclimatization chamber 2sparesparesparespare

19
This is made possible by the disk system and large core capacity. The disk system, an
absolute requirement for a real time operating system, permits many of the frequently
used routines and program languages to be stored for extremely rapid access with a few
commands from the terminal or from programs resident in core. It also provides tran-
sient storage either for data collected during a sampling routine (which later may be
recalled and processed before transferring to tape) or for programs running in core at the
time of an interruption effected either by a chamber system service routine or an inter-
ruption requested by some peripheral device, e.g., in this case an oxygen addition counter.
The magnetic tape system serves as a repository for raw and processed data which
can be easily assessed and permanently stored for reference and/or additional data mani-
pulation at some future date. It is also central to the operating system because blocks
of data can be retrieved by the central processor under program control or operator
request for evaluation of system performance and progress of an on-going experiment.
This tape system is also compatible with the University's computer which will be desirable
when manipulation of extremely large amounts of data or very high numerical precision
is required.
A CRT terminal has been included to prevent extensive wear and tear on the
teletype (which is primarily intended in this configuration for the production of hard copy,
paper tape punching, and low-speed paper tape reading) during the development of the
routines required for process control, data acquisition, and data processing. The ASR33
teletype selected for this system has a nominal operating life expectancy of approximately
300 hours and is designed as a throw away. Acquisition of a more substantial teletype
is in excess of the price of the ASR33 and CRT terminal together. Therefore, the CRT
terminal seems justified.
The high-speed paper tape reader is required because all operating systems are
supplied by the manufacturer in the form of paper tape, and all routines developed in
this laboratory will also be on paper tape. Additionally, the teletype reads at a rate of
10 characters/second as opposed to 300 characters/second for the high-speed reader.
Consequently, a very lengthy down time (upwards of one hour) would be required to
load the operating systems, e.g., in the event of disk failure, if only the teletype were
available.
20
The second computer system (System II), Figure 3, is a less expensive configura-
tion of System I. Without disk storage, it can be dedicated .to only one task at a time,
e.g., process control, data acquisition, or data processing. Extensive data processing can
only be accomplished after the computer is off-line from process control and data acqui-
sition duties. Further, without magnetic tape, this configuration does not permit review
of system performance without human intervention, since the punched paper tape has to
be manually loaded into the tape reader. The high-speed tape punch/reader system, how-
ever, will permit a fairly rapid input/output of large amounts of data and provide a some-
what convenient means of sorting these data. Because of the manipulation required, it is
somewhat less desirable than magnetic tape.
Both systems, however, can be interfaced with analog or digital instruments other
than those associated with the chamber system for data acquisition and processing, e.g.,
pH meters, spectrophotometers, gas chromatographs, liquid scintillation spectrometers, etc.
A full description of the Nova Minicomputer system is contained in the publication
enclosed with this outline.
The ancillary equipment will permit the chamber system to be operated under
computer control. The addition of computerized process control capabilities to this system
will not only facilitate its operation but, as a consequence of frequent checks on various
chamber system operating parameters, will permit the early detection of system malfunc-
tions. This will effect more prompt corrections of otherwise potentially disasterous situa-
tions than is presently possible. In addition, data such as CC>2 production, C>2 consumption,
food consumption, and water consumption can be obtained immediately instead of the usual
24-hour turn-around time now experienced with the processing of these data. The addition
of equipment to monitor CC>2 production alone will effect approximately a 30-40% reduc-
tion in time required to process all experimental data as well as freeing personnel for other
pressing tasks. We have elected to delete the request for CC>2 data acquisition equipment
at this time because of uncertainties in the performance of the on-line *'*CO2 monitors
presently available.
Two separate systems for the monitoring of CC>2 have been listed. One is based
on the Beckman model 31 SB infrared CC>2 analyzer, the other on the Varian model GDI 50
mass spectrometer. The primary advantage of the 31 SB is that it is cheaper than the

21
alternate monitoring equipment. The 31 SB, however, does not perform well at
concentrations less than 0.1% or greater than 2-3%. Further, it requires frequent
recalibration (approximately every 8 hours); pretreatment of the gas to be analyzed, e.g.,
removal of water vapor, methane, and ammonia; and remote or manual range switching.
Finally, it can provide an analysis of only one component of the gas stream.
The alternate monitor, the mass spectrometer, is not plagued with any of the
above ailments of the 315B. It requires neither pretreatment of sample gas, unless water
condensation is excessive (this can be gotten around more easily than with the 315B),
nor range switching. In addition to CC>2, it can simultaneously analyze the gas sample
for several other gaseous components, e.g., helium, neon, nitrogen, oxygen, and argon.
In addition to providing data for computation of oxygen consumption and CC>2 produc-
tion, it can potentially serve as an initial control device to maintain a given gas compo-
sition, i.e., oxygen and diluent in the proper proportions. Thus, this instrument would
replace both the presently used gas solid chromatograph and oxygen analyzers and pro-
vide a more complete, accurate and precise method for gas analysis than is possible with
any other type of instrument.
It may be argued that the data acquisition systems outlined in this section are in
excess of that required to actually accomplish the desired tasks. However, it is not an
expression of sound judgment to design a system with a slightly different configuration.
Consequently, a system configured for a given task may no longer be suitable; only through
additional expense and must lost time can it be adapted to the new task. System I would
seem to meet most requirements for adaptability to a large variety of tasks; System II is a
more rigid configuration and such tasks as real time processing can be achieved only
through additional expenditure of time and money. It should be kept in mind, however,
that the two systems presented here represent only two of several possible configurations,
some of which may be equally suitable for the tasks at hand.
It is important to note that prices indicated for the listed equipment are only
approximate; most are as quoted by the various manufacturers in April, May, and June
of 1972, and are subject to change. It is hoped that funding for this project, if approved,
can be distributed over two fiscal years with initial funding in January, 1973, and subse-
quent funding in July, 1973. It would be desirable if the initial funding carried the Nova
1200 system and subsequently the process control equipment.

22
We appreciate that this is an extremely brief outline of a rather extensive project.
For this reason, a more extensive description of the proposed system modification will
be supplied as the situation warrants.

23
APPENDIX
In the lists of computer equipment, the numbers in parentheses following the
equipment descriptions are type numbers. Those numbers without letter suffixes are
subject to a 10% discount; this has been included in the indicated prices.
Except for the mass spectrometer, all listed equipment prices are based on
written, catalog, or telephone quotations. The quotation for the mass spectrometer
was supplied by a company representative and is approximate only. A written quota-
tion for this instrument is in preparation.
The equipment is grouped by manufacturer (supplier) the address of which
follows each group.
NOTE:
It is pertinent to mention here that it will be necessary to negotiate a figure
for indirect costs (i.e., overhead) which would be included in the total
amount requested for funding.

24
SYSTEM I COMPONENT LIST:
Nova 1200 Series Jumbo Mainframe with 8k Core (8102 + 8174) $ 6,435
Extra 8k Core (8174) 2 ea. @ $3690 ea. S 7,380
Power Failure/Auto Restart (8106) $ 360
Low Speed I/O Subassembly (4007) S 180
Real Time Clock (4008) $ 360
Teletype Control (4010) $ 150
ASR33 Teletype (4010A) $ 1,250
Moving Arm Disk Control (4046) $ 3,600
Disk Adaptor and Power Supply (4047) $ 1,530
Diablo Disk, 1247k words (4047A) $ 5,000
Magnetic Tape Control (4030) $ 3,600
Ampex TMX Magnetic Tape Transport, 7 track, 12.5 ips., (4030G) S 4,250
I/O Interface Subassembly (4014) S 180
Basic A/D Interface (4032) $ 630
Chassis and Low Capacity Power Supply for A/D (4055A) $ 900
13-BIT A/D Converter (4055F) $ 950
Buffer Amplifier, Single Ended (40551) S 200
Multiplex Control (4055K) $ 230
Sample and Hold (4055L) S 300
16-Channel Multiplexer (4055N) $ 300
General Purpose I/O Interface (4040) with Relays; 16-Channel, 2 ea. @ $1200 ea.(C-Form Contacts) S 2,400
Back Panel Connector (4045), 2 ea. @ $ 180 ea. $ 360
Paper Tape Reader Control (4011) $ 765
High Speed Paper Tape Reader (401 IB) S 1,800
Real Time Operating System Source Tapes (3147) S 75
6-Foot Vertical Rack (1012A) $ 700
Disc Cartridge (4047C) $ 200
CRT Terminal Control (No part number) S 450
SUPPLIER: Data General Corporation
Southboro, Massachusetts 01772

25
SYSTEM I (Continued)
Hazeltine CRT Terminal (2000) $ 2,486
SUPPLIER: Hazeltine Corporation
Greenlawn, New York 11740
Magnetic Tape, 8V£ inch Reel, 1200 Feet ea., 36 ea. @ $8.25 ea. $ 297
SUPPLIER: Memorex Corporation, Denver District
Denver, Colorado
MISCELLANEOUS: Paper Tape, Paper Rolls, Instrumentation Cableand Connectors not Supplied by Manufacturers $ 1,200
SUPPLIER: Various
TOTAL $48,518

26
SYSTEM II COMPONENT LIST:
Nova 1200 Series Jumbo Mainframe with 8k Core (8102 + 8174) S 6,435
Extra 8k Core (8174) $ 3,690
Power Failure/Auto Restart (8106) $ 360
Low Speed I/O Subassembly (4007) $ 180
Real Time Clock (4008) $ 360
Teletype Control (4010) $ ISO
ASR33 Teletype (401OA) $ 1,250
I/O Interface Subassembly (4014) $ 180
Basic A/D Interface (4032) $ 630
Chassis and Low Capacity Power Supply for A/D (4055A) S 900
13-BIT A/D Converter (4055F) $ 950
Buffer Amplifier, Single Ended (40551) S 200
Multiplex Control (4055K) $ 230
Sample and Hold (4055L) $ 300
16-Channel Multiplexer (4055N) S 300
General Purpose I/O Interface (4040) with Relays; 16-Channel, 2 ea. @ $1200 ea. $ 2,400
Back Panel Connector (4045), 2 ea.@ $180 ea. $ 360
Paper Tape Punch Control (4012) $ 630
Remote Control for Paper Tape Punch (4013) $ 270
High Speed Paper Tape Punch (4012A) $ 1,500
Paper Tape Reader Control (4011) S 765
High Speed Paper Tape Reader (401 IB) $ 1,800
Real Time Operating System Source Tapes (3147) $ 75
6-Foot Vertical Rack (1012A) $ 700
SUPPLIER: Data General Corporation
Southboro, Massachusetts 01772
MISCELLANEOUS: Paper Tape, Paper Rolls, Instrumentation Cable andConnectors not Supplied by Manufacturer $ 1,200
SUPPLIER: Various
TOTAL $25,815

27
PROCESS CONTROL AND DATA ACQUISITION EQUIPMENT:
Operational Amplifier, Model 118K, with Mating Socket $ 24
SUPPLIER: Analog Devices, Inc.
Norwood, Massachusetts 02062
Humidity and Temperature Monitor, 4-Channel with Remote Switching $ 1,285
SUPPLIER: Atkins Technical, Inc.
Gainsville, Florida 32601
Infrared C©2 Analyzer, Model 31 SB, with Remote Range Switching,2 ea. @ $3759 ea. $ 7,518
SUPPLIER: Beck man Instruments, Inc.
Fullerton, California 92634
Thermal Mass Flowmeter, Type 5810, 0-15 Liters/Minute Max., 4 ea @ $373 ea. $ 1,492
Thermal Mass Flowmeter, Type 5810 with Type 5820 Indicator, 0-10 StandardCubic Centimeters/Minute Max. $ 550
Blind-end Power Supply, Type 5810, for Thermal Mass Flowmeters $ 160
Purge Flowmeter, E/C 1500 Series, 2 ea. @ $25 ea. $ 50
SUPPLIER: Brooks Instruments Division
Hatfield, Pennsylvania 19440
Pressure Controller, Series 213, with 303 Stainless Steel Tubulations, 2 ea.@$470ea. $ 940
SUPPLIER: Granville-Phillips Company
Boulder, Colorado 80303
Fluid Switch Wafer, Type Wl 261/1P-12T, 3 ea. @ $245 ea. $ 735
12-Step Solenoid for Fluid Switches, Type WS6-12, 24VDC, 3 ea. @ $55 ea. $ 165
SUPPLIER: Scanivalve, Inc.
San Diego, California 92120
Pressure Transducer, Type DP7, 0-75 psi $ 250
Pressure Transducer, Type AP10, 1-45 psia, 3 ea. @ $325 ea. $ 975
Carrier Demodulator, Type CD 16, for Pressure Transducers, 4 ea. @ $250 ea. $ 1,000
SUPPLIER: Validyne Engineering Corporation
Northridge, California 91324

28
PROCESS CONTROL AND DATA ACQUISITION EQUIPMENT (Continued)
Solenoid Sample Valve, Type 57-000064-00 $ 260
Mass Spectrometer, Type CD 150 $23,000
SUPPLIER: Varian Aerograph
Walnut Creek, California 94598
Miscellaneous Hardware:
This material will consist of service parts for the various equipment listed $ 1,000
as well as tubing and connectors for the fluid switches, pressure transducers,
IR CO2 analyzers/mass spectrometer, and pressure valves.
SUPPLIER: Various
TOTAL with Mass Spectrometer S31,886
TOTAL with IR CO2 Analyzer $16,404
tttttftfftftttttttttftftttftttttttttttffttt.ttffttttfttttttttttftttttttttftt
SYSTEM I with Mass Spectrometer $80,404
SYSTEM I with IR CO2 Analyzer $64,922
SYSTEM II with Mass Spectrometer $57,701
SYSTEM II with IR CO2 Analyzer $42,219

33
APPENDIX B
The following paper entitled, "A Rapid Quantitative
Measure of Metabolic Activity," by J. P. Jordan, C. L. Schatte,
D. P. Clarkson, M. L. Corrin, and W. W. Martz has been sub-
mitted to the editors of the American Journal of Physiology
for publication. The referencing and pagination within the
manuscript are separate from the remainder of the Status
Report.

A Rapid Quantitative Measure of Metabolic Activity
by
John Patrick Jordan, C. L. Schatte, D. P. Clarkson, M. L,
Corrin and W. W. Martz. Laboratory of Aerospace Biology
Department of Biochemistry
Colorado State University
Fort Collins, Colorado 80521

ABSTRACT
A quick, simple measure of metabolic activity by measuring
the conversion of a C-labeled substrate (CQ) to C02 (P)
is described. A plot of In (CQ—P) versus time provides a
readily quantified parameter sensitive to both changes in
metabolic rate and the nature of the substrate oxidized.
14Although acetate-1- C was the substrate most frequently used,
labeled glucose and pyruvate have also been used. The pro-
cedure involves only an initial injection of labeled substrate
followed by collection of expired C02 for approximately 60
minutes. The animal is not anesthesized, restrained, or
starved. Possible interpretations are discussed.

INTRODUCTION
Because of the definitive nature of mathematics, biolo-
gists have long sought to use it as a tool for quantifying
changes in animal metabolism. While classical metabolic
parameters such as oxygen consumption and carbon dioxide
production are used as whole body metabolic rate indicators,
it is advantageous to measure substrate level metabolic acti-
vity in order to increase the sensitivity of measurements
of metabolic aberrations in the whole animal. Such a para-
meter must be quickly and easily measured, readily quantified
for comparative purposes, and cause minimum disturbance to
the animal. The development of such a parameter has been
crucial to work in this laboratory which is concerned with
long-term biochemical adaptation of rats to articifial environ-
ments. The need to maintain as unperturbed a state as is
possible while performing repeated measurements over periods
of several weeks has prompted us to search for a cellular
level indicator that can be repeatedly and reproducibly used
while leaving the rats physiologically unaffected.
14We have found that the injection of acetate-1- C and
14treatment of the resulting C^ expiration curve as a simple
exponential function provides us with an accurate measure of
tricarboxylic acid (TCA) cycle activity (and, therefore, a
major part of cellular oxidative activity) which is readily

quantified for comparisons between different groups of
animals. The sampling time can be as little as 60 minutes,
radioactive analysis requires no chemical treatment, and
reproducibility can be as good as 5%. Except for an initial
intraperitoneal injection, the animals are unrestrained,
unstarved, uncatheterized, and essentially undisturbed in
the environment to which they are exposed. When interpreted
in conjunction with other metabolic parameters, the proce-
dure provides an additional measure of metabolic rate plus
insight into possible biochemical changes which may occur
even in the absence of a change in metabolic rate.
METHODS
In a series of twenty-five experiments, groups of rats
were exposed to artificial environments for periods of a few
days to thirteen weeks. At intervals of 1-7 days throughout
the exposure, groups of 4-12 rats were injected intraperi-
toneally with 25-150 yCi/kg of sodium acetate-1- C in 0.3-
0.5 ml distilled water. The expired gas was bubbled through
a carbon dioxide scrubber containing 10 liters of 3N KOH.
The contents of the scrubber was sampled for periods of 1-24
hours at intervals of 10 minutes for the first hour post-
injection, 20 minutes during the second hour, and 20, 30 or
60-minute intervals thereafter. Activity of the samples was

determined by pipetting 0.1 ml of the KOH solution into 15 ml
of p-dioxane-PPO-POPOP-napthalene-ethanol-Cab-0-Sil* and
counting in a liquid scintillation spectrometer for three
5-minute counts each.
A typical plot of accumulative disintegrations per
minute versus time is shown in Figure 1. The shape of the
curve and its mathematical analysis have been rigorously
treated by others (1, 2, 3) as conforming to the general
equation:
k1t k?t k,tA = A±e
1 + A2e L + A^e
where: A = activity in the expired CO^ at a given time,
t
A_ = activity in the expired C09 .at time, t as an &*
function of rate, kn
k = rate of increase of activity in the expired
COo for a particular length of time
With the intent of using the parameter for comparisons
between groups of animals rather than on an absolute basis,
we have chosen to approach analysis of the data as a first
order exponential function. Further, since it was found that
factors likely to influence the shape and time course of the
expired CC curve do not vary appreciably in our experiments
* PPO=2,5-Diphenyloxazole
POPOP=1,4 bis (2 (4-methyl-5-phenyloxazolyl) )-Benzene

Figure 1
oX
•<—'
EQ.
T3
3
3O
25
; 20
'15
10
1*915
•o
.xiu
20 40 60 80
minutes post injection100
i3 •
. Figure 3
20- 40 60 80
minutes post injection
100
Figure 2
18.0 Ao=6.5 x 10⁸ dprrk=-.00986t=87 minutes
<u'c<
16.0
20 40 60 80minutes post injection
100
r=.958n=36m=.2402b=4.63
10 20 30 40 50 60* 70 80 90 100
% expired

(i.e., bicarbonate pool size, cellular uptake of CC^ >
exchange with bone), the detailed three-compartment analysis
has proved unnecessary. A satisfactory interpretation has
resulted by expressing the data as:
In (14C injected/kg - 14C expired/kg) = kt + CQ
where k is the rate of decrease in total body activity per
kilogram of rat as a function of time t and CQ is the total
activity in the pool at zero time. This represents a com-
bination of the A-. and A2 components while disregarding A?
of the three-compartment analysis. The initial (A- ) component
coincides with the dead time of our system, about 10.minutes,
and, therefore, cannot be accurately measured. The dead
time consists of the events between injection of the substrate
and its appearance as CCU in the scrubbers. These include
absorption into the blood, distribution to the cells, meta-
bolic conversion, transport to the lungs and expiration as
COo> equilibration with the animal chamber gas, and transport
to and equilibration with the scrubber contents.
We have consistently obtained a good fit of the data
during the time (-A ) in which the kinetics were first order;
the non-first-order component (A-r) did not consistently lend
itself to logarithmic analysis. Fortunately, the curves
usually reflected first order kinetics for ab.out 90 minutes.

Thus, a sufficient sampling period was available over the
linear portion of the curve (10-90 minutes) to calculate
the slope of the first-order curve. Additionally, both
our data and the data of others (1, 4) have indicated that
a substantial fraction of injected acetate is expired during
a period of one or, at most, two hours post injection. Sub-
sequent elimination of label from the body does not appear
to significantly affect the results.
The slope of the logarithmic plot was determined by
best fit of a least squares regression analysis (Figure 2).
The resulting value, k or rate constant, was used for quan-
titative comparisons among different experimentally-treated
groups of animals.
RESULTS
As shown in Figure 3, the value of k will vary in magni-
tude as a function of the catabolic rate of the injected sub-
stance; the greater the rate, the greater the value of k.
This particular set of curves represents the conversion of
acetate-1- C to CC^ in rats exposed to neon-oxygen for 4
weeks as compared with air controls and was calculated from
data previously published (5). In this case, acetate oxida-
tion to C02 mirrored both total metabolic rate and the
activity of the tricarboxylic acid cycle; on that basis, the
results graphically illustrate metabolic adaptation to the
neon environment for the four-week period.

The half-life of the metabolic pool can be determined
by extrapolation of the slope to the abscissa. This repre-
sents a graphical computation of the half-life of the sub-
strate as expressed by:
In 2
If the injected substrate mixes with the appropriate
substrate pool(s) of the body within about 10 minutes post
injection, turnover rate of the substrate's metabolic pool
can be calculated in the absence of significant changes in
pool size during the mixing and measuring period.
Of further importance is the fact that the percentage
of injected substrate converted to CO^ can be predicted with
good accuracy from the rate constant, k. Figure 4 shows the
regression line of slope versus percentage of injected label
expired for periods of 2-3 hours post injection. The points
14represent determinations with acetate-1- C injected into
rats whose age and weight varied from 90-240 days and 200-
500 grams, respectively. The correlation coefficient of
0.958 indicates that the slope, determined during the first
hour post injection, can serve to predict the conversion of
labeled acetate for up to three hours. It is likely that
little loss of accuracy would occur for longer collection
periods since a substantial amount of the injected compound

is expired during the first hour after injection. With acetate-
1- C, we have consistently recovered 40-50% and as much as
75% of the injected label during the first 60 minutes after
injection. These values agree with the data of Gould, et al
14(4) who recovered 50% of acetate-1- C from rats in 42 minutes.
We have found the slope values to be repeatable within
+_ 5% when at least 4 animals are used. With groups of 6-12
animals, the sensitivity is such that changes in catabolic
rate due to time of day, prandial state, and reaction to
stress of handling are readily apparent. It is, however,
necessary to maintain a minimum level of total activity
injected into the animals. A group of 3 or 4 animals require
100-150 yCi/kg to insure sufficient expired activity. Groups
of 6-8 rats were customarily injected with 50 yCi/kg while
a 12-rat group needed only 25 yCi/kg for sufficient activity
in the expired CC^ •
DISCUSSION
Requisite with the use of this analysis as an indicator
of metabolic rate are three assumptions. First, changes in
the pool size must be known or assumed to not occur under
the experimental conditions. Without plasma acetate specific
activity measurements, the size of the pool diluted by the
tracer cannot be known; if pool size does change, then an

10
alteration in metabolic rate might be suggested when none,
in fact, occurred.
Second, changes in the fraction of the total acetate
pool entering the TCA cycle must be known or assumed to not
occur. If changes in the amount of label entering the TCA
cycle do occur, an alteration in metabolic rate would be
implied when none had occurred. Such a situation is readily
detected by measuring CC^ specific activity. Since lipid
biosynthesis is the only major alternative for acetate utili-
zation, changes in the rate of lipid synthesis can be measured
by incorporation studies. In the present circumstances, we
have not found appreciable changes in the fraction of total
acetate entering the TCA cycle and have, thus, been able to
dispense with expired COo specific activity measurements.
14Third, it must be assumed that the appearance of CC>2
in the expired gas is proportional to its actual rate of
oxidation; the experimental conditions should not differentially
alter those factors influencing the correlation between actual
oxidation rate and appearance as CCU in the expired gas.
These factors include CC^ diffusion constants, blood supply
14to the tissues, exchange of C02 with total body C02 "stores,"
and ventilation rates. Gould, et al (4) pointed out that the
14rate of catabolism and expiration of C07 can vary with theL*
substrate. They found the two rates did not differ in the
case of acetate or bicarbonate but that succinate oxidation
was faster than its appearance as C07 in the expired gas.

11
A further consideration, although untested as yet, is
that the pathway by which exogenous acetate enters the cell
may be influenced by the experimental conditions while endo-
genous acetate is not. The latter enters an acetate pool
primarily as a result of either carbohydrate or fatty acid
catabolism, whereas injected acetate must cross both the cell
and mitochondrial membranes. It is possible that the two
routes of entry might be differentially affected by an experi-
mental condition such that the injected substrate would not
reflect the true endogenous situation. We feel that under
our experimental conditions of mild physiological stress,
neither the number of acetate pools which may exist nor the
route of entry into the mitochondria complicate interpretation
of the results.
The use of acetate as the test substrate minimizes these
problems while offering an optimal indicator for aerobic oxi-
dation. Since the TCA cycle is dependent on acetate as a sub-
strate its activity must be sensitively reflected in acetate
pool flux. An additional advantage is that acetate uptake by
the cycle must be proportional to oxygen uptake by the cell
and CC>2 produced from it since the major amount of oxygen con-
sumption and CC>2 production occurs via the TCA cycle. In our
hands, the labeled substrate method is significantly more
sensitive than the measurement of oxygen consumption or total
C07 production.

12
Unlike many other metabolic substrates, acetate is used
principally for fatty acid synthesis, steroid synthesis and
TCA cycle oxidation. With inputs into the acetate pool mainly
from pyruvate and fatty acid oxidation, and outflow into the
TCA cycle and lipid synthesis pathways, the variables affecting
pool size and turnover rate are limited. It is unlikely that
minor pathways such as ketone metabolism significantly influence
acetate pool characteristics in all but exceptional circumstances
or specific tissues. Thus, if in a given experiment there is
some doubt about the validity of the assumption that the frac-
tion of the total acetate pool entering the TCA cycle has not
occurred, excellent challenge data can be obtained by simply
measuring the uptake of the acetate label into the total body
lipid as a function of time.
We have used labeled glucose in a similar manner with
good results. Since its pool fluctuates more drastically,
correlation of its rate constant with metabolic rate indicated
by other parameters has not been as good as with acetate.
Using glucose-1- C and glucose-6- C and a modification of
the mathematical procedure of Katz, Landau and Bartsch (6),
we have been able to quantify both the aerobic and anaerobic
catabolism of glucose in rats (7). Rats in a marginally
hyperoxic environment were found to have "normal" total CC>2
production despite partial inhibition of the pyruvate and
succinate dehydrogenase systems, which caused description of
the TCA cycle as indicated by gas-solid chromatography of TCA

13
cycle intermediates. It was found that in the hyperoxic
animals, twice as much glucose was catabolized via the pentose
phosphate pathway at the expense of the glycolytic pathway.
This accounted for the normal total C09 production despite a£i
slowing of the TCA cycle.
Pyruvate-2- C has also been used in limited studies.
It should be emphasized that the method allows the animals to
remain in as normal a state as is possible under the conditions.
This is particularly important when subtle metabolic changes
are being examined since starvation, restraint, repeated with-
drawal of blood, or removal to a foreign testing apparatus
often changes either the rate or the nature of metabolism so
as to obscure the effects of the test variable. Apart from
the initial injection, our rats were tested in the same environ-
ment and physiological state to which they had become accustomed;
the fact that the slope constants predictably varied with the
often marginal stressors to which the animals were exposed is
consistent with the concept that the results are uncomplicated
appreciably by other factors.
Of great importance, too, is the fact that the analytical
procedure is quick and simple. We have adapted a computer
key punch to a liquid scintillation counter which allows the
counts to be prepared directly for computer processing on
the same day as the samples are counted.

14
LITERATURE CITED
1. Kornberg, H. L., R. E. Davies, and D. R. Wood. The
metabolism of C-labeled bic.
Biochem. J. 51:351-357, 1952.
metabolism of C-labeled bicarbonate in the cat.
2. Morris, B. and M. W. Simpson-Morgan. The excretion
of CO- during the continuous intravenous infusion1 '
of NAH C03 in unanesthetized rats. J. Physiol. 169:
713-728, 1963.
3. Shipley, R. A., N. Baker, G. E. Incephy, and R. E.
Clark. C studies in carbohydrate metabolism. IV.
Characteristics of bicarbonate pool system in the rat.
Am. J. Physiol. 197:41-46, 1959.
4. Gould, G. R., F. M. Sinex, I. N. Rosenberg, A. K.
Solomon, and A. B. Hastings. Excretion of radioactive
carbon dioxide by rats after administration of isotopic
bicarbonate, acetate, and succinate. J. Biol. Chem.
177:295-301, 1949.
5. Jordan, J. P., J. B. Simmons, II, D. V. Lassiter, Y. G.
Deshpande and D. J. Dierschke. Metabolic Effects of
Nitrogen and Neon as Diluent Environmental Gases. In
Depressed Metabolism, S. J. Musacchia and J. F. Saunders,
(Eds.) Am. Elsevier Publ. Co., Inc., N.Y., 1969, pp.
67-113.
6. Katz, J., B. R. Landau and G. E. Bartsch. The Pentose
Cycle, Triose Phosphate Isomerization, and Lipogenesis
in Rat Adipose Tissue. J. Biol. Chem. 241:727-740, 1966.
7. Gorman, R. R., J. P. Jordan, J. B. Simmons, II, and D. P.
Clarkson. Biochemical Adaptation in Rat Liver in Response
to Marginal Oxygen Toxicity. Biochem. J. 125:439-447, 1971