case study - green-marine
TRANSCRIPT

Case study:
The use of hybrid technology for a fleet towboat
Presented by Jan Flores, P.E.
2
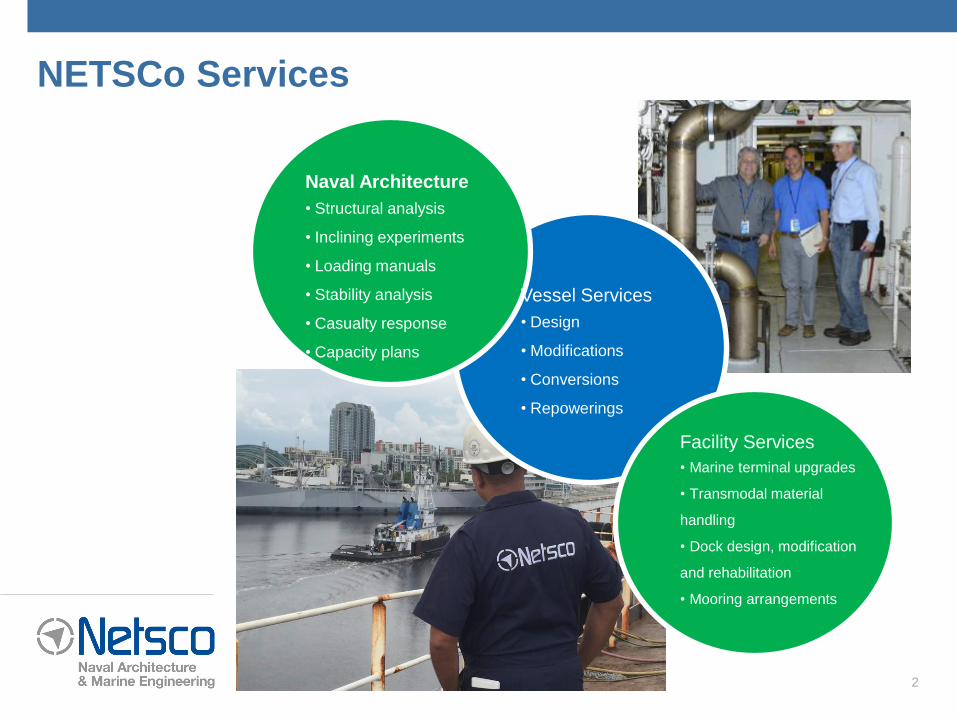
NETSCo Services
Naval Architecture
• Structural analysis
• Inclining experiments
• Loading manuals
• Stability analysis
• Casualty response
• Capacity plans
Vessel Services
• Design
• Modifications
• Conversions
• Repowerings
Facility Services
• Marine terminal upgrades
• Transmodal material
handling
• Dock design, modification
and rehabilitation
• Mooring arrangements

3
NETSCo Area of Expertise
Environmental
Initiatives:• Ballast Water Treatment
• Emissions Reduction
• Energy EfficiencySpecialized Vessels:• ATB’s
• LNG Bunker
• Self Unloaders
• Tankers

• What are Hybrid Technologies?
• Brief History of Hybrid Technologies
• Hybrid Technologies Overview
• Case Study: Fleet Tow Boat• Operational Profiles
• System Selection and Design
• Assumptions and Results
• Case Study: Ferry Barge Push Boat• Operational Profile
• Assumptions and Results
• Going Forward
• Next Steps
Agenda
4

• Combinations of different technologies to provide power
Definition of Hybrid Power
• Fossil Fuel Engines
• Wind Energy
• Battery Power (Chemical)
• Hydro-Electric Power
• Solar Energy
• Fuel Cells
Examples: Any Combo of
5

Brief History of Hybrid Technology
6

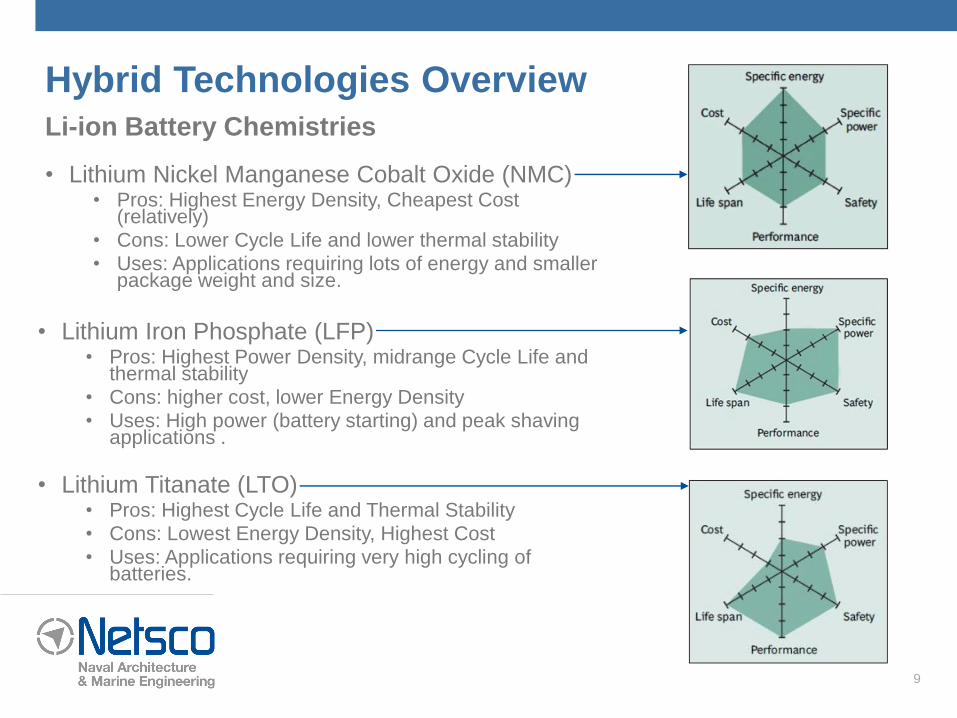
Hybrid Technologies Overview
• Conventional Propulsion• Typically Diesel Engines and Gensets
• Most common propulsion arrangement
• Hybrid Propulsion (Conventional Drive)• Diesel Engine w/ Electric M/G
• Hybrid ready gearbox or combination M/G/reduction gear• PTI or PTO Operation
• Hybrid Propulsion (Electric Drive)• Electric motors provide all propulsion
• Propulsion power form D/G’s or Battery Power
• Plug-in Battery Propulsion• Batteries provide all propulsion power to electric motors
• Clean and quiet operation• Requires massive battery arrays and complex shore charging facilities
Propulsion Arrangements
7

Hybrid Technologies Overview
• All Mechanical• Diesel (typically) engines do all the work
• Diesel Electric• Diesel generators provide power for electric
drive• No direct engine to propeller shaft power
• Boost• Diesel engine provides most of the power• Smaller electric drive assists main engine
• All Electric• Stored power (batteries) provide power for
electric drive• No diesel (or other fuel) engines running
Modes of Operation
8
Hybrid Technologies Overview
• Lithium Nickel Manganese Cobalt Oxide (NMC)• Pros: Highest Energy Density, Cheapest Cost
(relatively)
• Cons: Lower Cycle Life and lower thermal stability
• Uses: Applications requiring lots of energy and smaller package weight and size.
Li-ion Battery Chemistries
• Lithium Iron Phosphate (LFP)• Pros: Highest Power Density, midrange Cycle Life and
thermal stability
• Cons: higher cost, lower Energy Density
• Uses: High power (battery starting) and peak shaving applications .
• Lithium Titanate (LTO)• Pros: Highest Cycle Life and Thermal Stability
• Cons: Lowest Energy Density, Highest Cost
• Uses: Applications requiring very high cycling of batteries.
9

10
Case Study: Fleet Tow Boat
• LOA 54’
• Beam 22’
• HP 1200hp
• Engines (x2) 600hp Cummins KTA19-M3
• Generators (x2) 30kW
Vessel Particulars

11
Case Study: Fleet Tow Boat
• Dockside: 50%(15kWh)
• Transit to Fleet: 15% (290kW)
• Fleeting Operations: 25% (927kW)
• Transit to Dock: 10% (290kW)
Operational Profile
0
500
1000
1500
2000
2500
3000
3500
4000
4500
5000
0
100
200
300
400
500
600
700
800
900
1000
Dockside Tranist to Fleet Fleeting Transit toTerminal
TIM
E H
R
PO
WE
R K
W
OPERATIONAL CONDITIONS
OPERATIONAL PROFILE - CONVENTIONAL PROPULSION
M/E + D/G Power Time

12
Case Study: Fleet Tow Boat
System Selection and Design - Arrangement
• Conventional Propulsion• High fuel consumption • High emissions (CO2, NOX, SOX)
• Hybrid Propulsion (Electric Drive)• High CapEx• High Voltages
• Plug-In Battery Propulsion• Extremely large battery arrays• Complex and expensive shore power connection (battery charging)
• Hybrid Propulsion (Conventional Drive)• Least complex for retrofit application• Low CapEx (compared to other Hybrid solutions)• Flexible modes of operation

13
Case Study: Fleet Tow Boat
System Selection and Design – Li-ion Chemistry
• LFP & LTO
• Higher Cost when compared to NMC
• Lower Energy Density
(more batteries = bigger arrays and additional weight)
• NMC• Smaller Arrays
• Low C Rate Application
(Energy Density more important than Power Density)
• Lower Upfront Cost

14
Case Study: Fleet Tow Boat
System Selection and Design - Arrangement
Battery DC Power to & from Converter
AC Power to & from M/G
AC Power to Switchboard
D/G AC Power to Switchboard
AC Power from Shore Supply
15
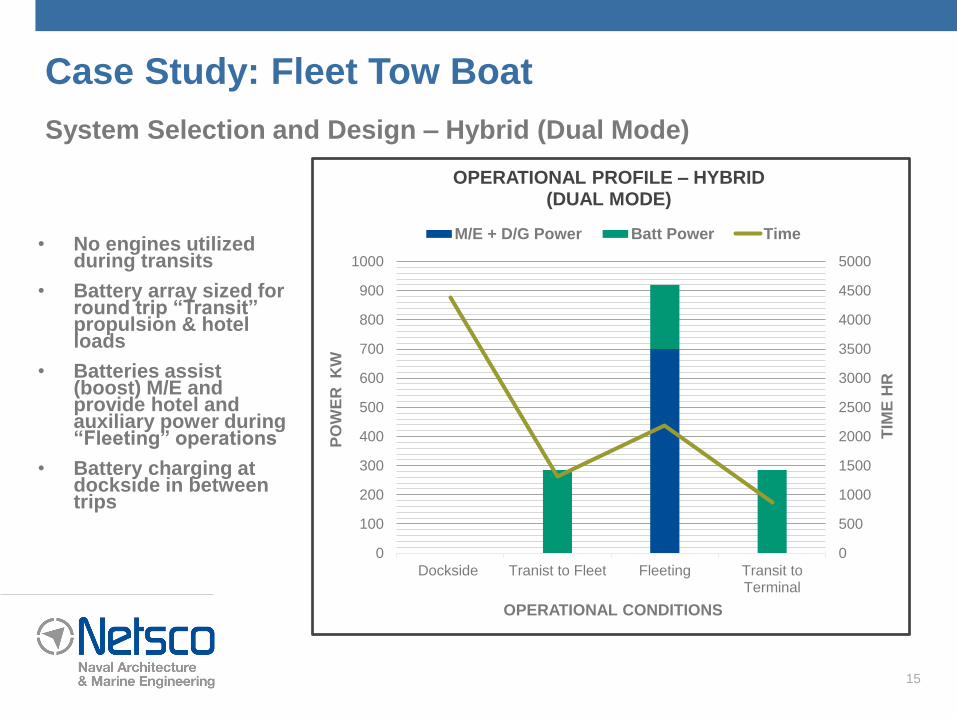
Case Study: Fleet Tow Boat
System Selection and Design – Hybrid (Dual Mode)
• No engines utilized during transits
• Battery array sized for round trip “Transit” propulsion & hotel loads
• Batteries assist (boost) M/E and provide hotel and auxiliary power during “Fleeting” operations
• Battery charging at dockside in between trips
0
500
1000
1500
2000
2500
3000
3500
4000
4500
5000
0
100
200
300
400
500
600
700
800
900
1000
Dockside Tranist to Fleet Fleeting Transit toTerminal
TIM
E H
R
PO
WE
R K
W
OPERATIONAL CONDITIONS
OPERATIONAL PROFILE – HYBRID (DUAL MODE)
M/E + D/G Power Batt Power Time

16
Case Study: Fleet Tow Boat
System Selection and Design – Hybrid (All Electric)
• No engines utilized during transits
• Battery array sized for round trip “Transit” propulsion & hotel loads
• M/E and D/G provide propulsion and electrical power during “Fleeting” operations
• Battery charging at dockside in between trips
0
500
1000
1500
2000
2500
3000
3500
4000
4500
5000
0
100
200
300
400
500
600
700
800
900
1000
Dockside Tranist to Fleet Fleeting Transit toTerminal
TIM
E H
R
PO
WE
R K
W
OPERATIONAL CONDITIONS
OPERATIONAL PROFILE - HYBRID (ALL ELECTRIC)
M/E + D/G Power Batt Power Time

17
Case Study: Fleet Tow Boat
System Selection and Design – Hybrid (Boost Mode)
• M/E and D/G provide propulsion and electrical power during “Transit” operations
• Batteries assist (boost) M/E and provide hotel and auxiliary power during “Fleeting” operations
• Battery charging at dockside in between trips
0
500
1000
1500
2000
2500
3000
3500
4000
4500
5000
0
100
200
300
400
500
600
700
800
900
1000
Dockside Tranist to Fleet Fleeting Transit toTerminal
TIM
E H
R
PO
WE
R K
W
OPERATIONAL CONDITIONS
OPERATIONAL PROFILE - HYBRID (BOOST MODE)
M/E + D/G Power Batt Power Time

18
Case Study: Fleet Tow Boat
Assumptions and Results – Fuel Cost Comparison
Assumptions
• Based on average North American price for MGO ($606 USD/mT)
• Based on average North American kWh price ($0.12 per kWh)
Results
• Vary degrees of savings depending on operational mode when compared to conventional propulsion

19
Case Study: Fleet Tow Boat
Assumptions and Results – Battery Comparison
Assumptions
• * Based on 80% DOD, 85% SOC and 80% EOL capacity
• ** Size of array is representative and can be rearranged to facilitate installation.
• Charge times based on typical 1C charge data, scaled for specified C rate
• *** Based on 8000 Cycle Life at 80% DOD
Results
• Operational Profile and Mode selection had huge impact on the battery array size and charging profile.
• Number of charge/discharge cycles greatly influences calendar life of batteries

20
Case Study: Ferry Barge Push Boat
Operational Profile
0
200
400
600
800
1000
1200
1400
1600
1800
2000
0
100
200
300
400
500
600
Dockside Tranist toCruise Ship
Loading Cruise toLanding
Unloading Landing toCruise
Return toDock
TIM
E H
R
PO
WE
R K
W
OPERATIONAL CONDITIONS
OPERATIONAL PROFILE - CONVENTIONAL PROPULSION
M/E + D/G Power Time

21
Case Study: Ferry Barge Push BoatAssumptions and Results – Fuel Cost Comparison
Assumptions
• Based on average North American price for MGO ($606 USD/mT)
• Based on average North American kWh price ($0.12 per kWh)
Results
• Vary degrees of savings depending on operational mode when compared to conventional propulsion
Dockside – All Electric Mode, batteries
sized for all 3 trips, charging while dockside.
Landing – All Electric Mode, batteries sized
for a single trip, charging while unloading at
landing.

22
Case Study: Ferry Barge Push BoatAssumptions and Results – Battery Comparison
Assumptions
• * Based on 80% DOD, 85% SOC and 80% EOL capacity
• ** Size of array is representative and can be rearranged to facilitate installation.
• Charge times based on typical 1C charge data, scaled for specified C rate
• *** Based on 8000 Cycle Life at 80% DOD
Results
• Operational Profile and Mode selection had huge impact on the battery array size and charging profile.
• Number of charge/discharge cycles greatly influences calendar life of batteries

23
Going Forward
• NO One Size Fits All!!
• Feasibility, Fuel Cost Analysis studies on your vessel or fleet
• Understand Rules (USCG, CLASS)
24
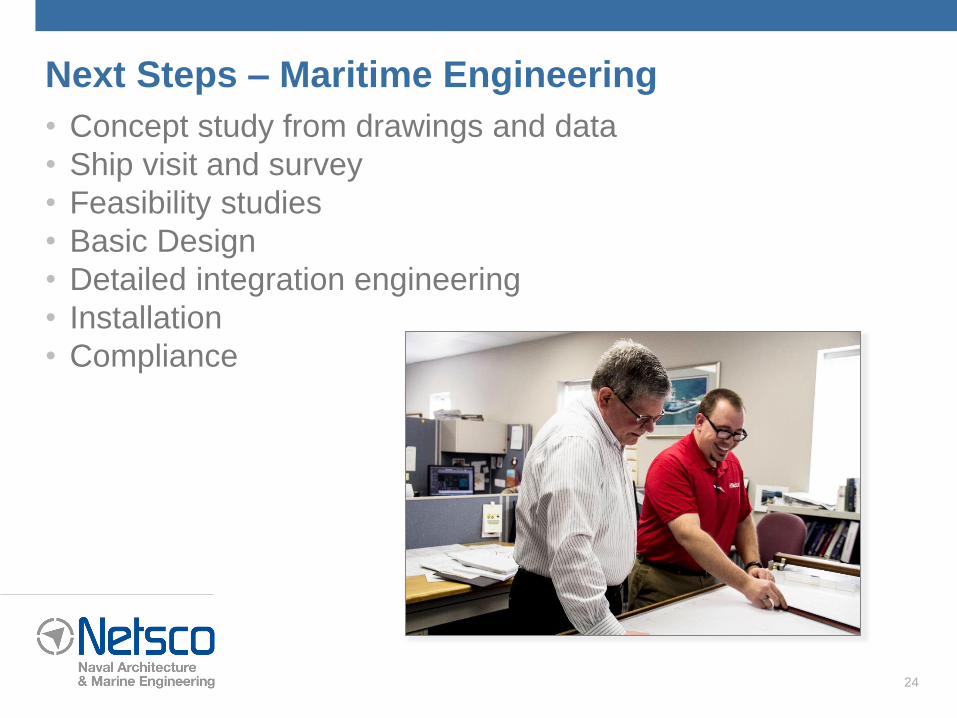
Next Steps – Maritime Engineering
• Concept study from drawings and data
• Ship visit and survey
• Feasibility studies
• Basic Design
• Detailed integration engineering
• Installation
• Compliance

25
Thank you for your time!
Tampa Office
NETSCo, Inc.
Tel: (813) 223.5464
E-mail: [email protected]
Cleveland Office
NETSCo, Inc.
Tel: (440) 236.9191
E-mail: [email protected]