case study - natural gas regional transport trucks among its fleet vehicle services, ryder provides...
TRANSCRIPT


1
Contents
Background .......................................................................................................................................................................... 3
Motivation for Adopting Natural Gas ............................................................................................................................. 4
Financial Benefits ........................................................................................................................................................... 4
Environmental and Energy Benefits ........................................................................................................................... 4
Project-Specific Activities .................................................................................................................................................. 5
Vehicle Deployment ...................................................................................................................................................... 5
Infrastructure Deployment ........................................................................................................................................... 5
Training for Drivers and Technicians ......................................................................................................................... 6
Project Outreach ............................................................................................................................................................ 7
Data Analysis Results ......................................................................................................................................................... 7
Vehicle Operational Data .............................................................................................................................................. 7
Environmental and Energy Impact Data ................................................................................................................... 9
Business Case Data ...................................................................................................................................................... 10
Lessons Learned ................................................................................................................................................................ 11
Natural Gas Vehicles ................................................................................................................................................... 11
Natural Gas Fueling Stations ...................................................................................................................................... 12
Future Plans ....................................................................................................................................................................... 12
Conclusion ......................................................................................................................................................................... 13
Endnotes ............................................................................................................................................................................ 14

2
3
Case Study: Natural-Gas-Fueled Regional Transport Trucks
Background
This case study explores the use of leased heavy-
duty regional transport tractors fueled by
compressed natural gas (CNG) and liquefied
natural gas (LNG). Natural gas shows promise for
this application because fleets can save money on
fuel while gaining other benefits, such as quieter
operation and lower greenhouse gas emissions.
Leasing offers the ability for fleets to minimize
their financial risk in exploring new fuel options,
gaining experience with the fuel on a short-term
basis with minimal capital outlay.
Natural gas was used by Ryder System, Inc. (Ryder) in
a fleet of leased trucks and tractors operated for
regional freight transport in Southern California.
The project was led by the San Bernardino
Associated Governments (SANBAG), and was
partially funded by Clean Cities through the
American Recovery and Reinvestment Act
(Recovery Act) of 2009. Project partners also
received Assembly Bill 118 funding from the
California Energy Commission.i
The project is one of 25 that Clean Cities funded
with $300 million under the Recovery Act, which
itself is only a small percentage of what the U.S.
Department of Energy (DOE) Office of Energy Efficiency and Renewable Energy received. The Clean Cities
projects focus on reducing petroleum consumption and emissions by supporting the adoption of alternative
fuel and advanced technology vehicles across the United States. Partners in these competitively selected
projects contributed more than $500 million in cost share. Through Clean Cities, fleets purchased thousands
of vehicles using a variety of fuels and technologies and hundreds of new and updated alternative fuel
stations.
This account of Ryder’s project reports on the California deployment of around 200 CNG and LNG trucks,
the construction and operation of two liquefied to compressed natural gas (LCNG) fueling facilities, and the
upgrading of a maintenance facility to service natural gas vehicles.ii
Founded in 1933, Ryder is a $6 billion-per-year Fortune 500 organization that provides fleet management and
supply chain services to 50,000 customers. The company has a fleet of around 128,000 trucks in full-service
leases and 43,000 trucks in commercial rental service. Ryder is a member of the DOE Clean Cities National
Clean Fleets Partnership and the EPA SmartWay Transport Partnership.
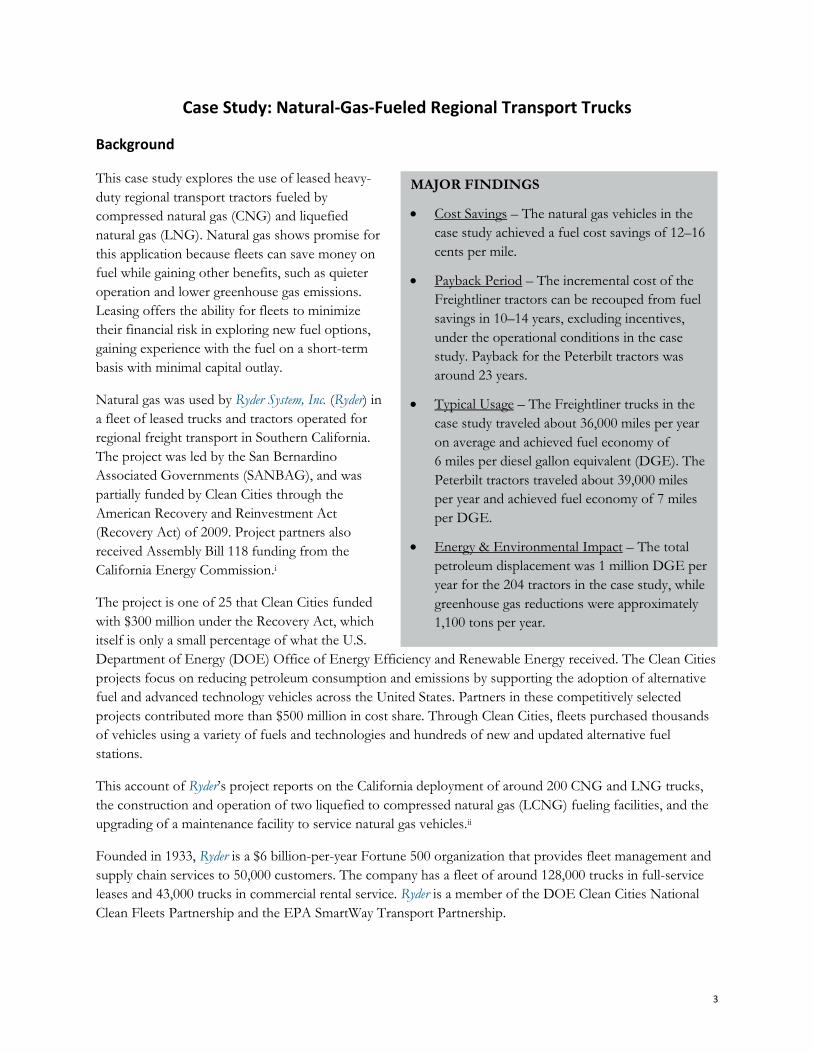
MAJOR FINDINGS
Cost Savings – The natural gas vehicles in the
case study achieved a fuel cost savings of 12–16
cents per mile.
Payback Period – The incremental cost of the
Freightliner tractors can be recouped from fuel
savings in 10–14 years, excluding incentives,
under the operational conditions in the case
study. Payback for the Peterbilt tractors was
around 23 years.
Typical Usage – The Freightliner trucks in the
case study traveled about 36,000 miles per year
on average and achieved fuel economy of
6 miles per diesel gallon equivalent (DGE). The
Peterbilt tractors traveled about 39,000 miles
per year and achieved fuel economy of 7 miles
per DGE.
Energy & Environmental Impact – The total
petroleum displacement was 1 million DGE per
year for the 204 tractors in the case study, while
greenhouse gas reductions were approximately
1,100 tons per year.

4
Among its fleet vehicle services, Ryder provides access to alternative fuel technologies for its leasing
customers. Ryder offers natural gas and hybrid trucks in a variety of truck classes, and continues to evaluate
other alternative fuel technologies. In early 2015, Ryder’s natural gas truck fleet had exceeded 30 million miles
of service.
Ryder has been recognized for its work with the Clean Cities project. The company received an NGVAmerica
Achievement Award for its innovative “Flex-to-Green” leasing approach, which allows a fleet to start with a
conventional vehicle and switch to an alternative fuel vehicle after the first year of a three-year lease. Ryder has
also been recognized by several publications, including Newsweek and Inbound Logistics, for its alternative fuel
and sustainability initiatives.
Motivation for Adopting Natural Gas
Ryder’s fleet customers are interested in natural gas to help them address the challenge of volatile fuel pricing,
because it is more stable and sold at a lower price than diesel. Ryder’s motivation is to demonstrate the
feasibility of using natural gas fuels in commercial trucking applications, provide a domestic and low-carbon
fuel source to its customers, and reduce criteria pollutants and greenhouse gas emissions in Southern
California. Placing these trucks in a rental and leasing fleet can allow fleet customers, with minimal outlay, to
gain confidence in how natural-gas-fueled vehicles will perform for their applications.
Financial Benefits
One main benefit of natural gas for commercial trucking fleets is its low and stable price relative to
conventional transportation fuels. At the two LCNG stations constructed and operated by Ryder, fuel prices
during the project period in 2012 and 2013 were at $2.57 per diesel gallon equivalent (DGE) for CNG, and
$2.79 per DGE for LNG. Diesel fuel prices in California were around $4.18 per gallon, providing a cost
advantage of about $1.50 per DGE for both fuels.
Environmental and Energy Benefits
The use of natural gas in vehicle applications reduces dependence on petroleum and can reduce greenhouse
gas emissions. The Alternative Fuel Life-Cycle Environmental and Economic Transportation (AFLEET)
Tool developed by Argonne National Laboratory for the Clean Cities program estimates that a natural gas
vehicle can reduce lifecycle greenhouse gas emissions by 20% if it has the same fuel economy as a diesel
vehicle (less if the fuel economy for natural gas is lower), and can reduce lifecycle petroleum use by 99%.

5
Project-Specific Activities
Vehicle Deployment
As part of this project, Ryder
deployed a total of 168
Freightliner M2 112 CNG
trucks, 16 Freightliner M2
112 LNG trucks, and 20
Peterbilt 386 LNG trucks.
The Freightliner M2 112
trucks are Class 7-8 single-
and tandem-axle tractors, and
the Peterbilt 386 tractors are
Class 8 tandem-axle tractors.
Figure 1 shows examples of
all three natural gas trucks.
The Freightliner M2 tractors
employed the Cummins Westport
ISL G 8.9-liter spark-ignited natural
gas engine rated at 320 hp and 1,000
lb-ft torque and an Allison 3000-
series automatic transmission. Fuel
capacity was 75 DGE for the CNG
trucks and 86 DGE for the LNG
trucks. Ryder estimated a range for
these trucks of 275 to 325 miles per
fill.
The Peterbilt 386 tractors were equipped with the Westport GX 14.9-liter compression-ignited high-pressure
direct-injection (HPDI) engine with diesel pilot ignition, rated at 475 hp and 1,750 lb-ft torque and equipped
with Fuller 10-speed manual transmissions. Fuel capacity was 240 gallons of LNG (approximately 120 DGE),
giving an estimated range of 550 to 650 miles per fill.
Ryder placed these trucks with 38 lease partners across Southern California. The companies included large
organizations as well as smaller, regional fleets. The trucks were available to customers through short-term
rentals, long-term leases, and Ryder’s dedicated logistics services.
Infrastructure Deployment
Ryder constructed two natural gas fueling stations in support of this vehicle deployment. The LCNG stations
were located at Ryder maintenance facilities in Fontana (Figure 2, completed in July 2013) and Orange,
California (completed in March 2013). Each station cost approximately $2.5 million.
LCNG stations receive and then store LNG in a large tank. The LNG is either dispensed directly as LNG or
it is warmed, vaporized, and compressed for dispensing as CNG. Ryder stated that the LCNG station design
Figure 2. Ryder LCNG Station at the Fontana Maintenance Facility
Figure 1. Ryder Natural Gas Trucks: Freightliner CNG (left), Peterbilt LNG (center), Freightliner LNG (right)

6
has the advantage of a more complete fill for CNG vehicles, because the fuel is produced at a temperature
lower than the ambient air.
Each station offers contractual access for Ryder customers to one LNG dispenser and two CNG dispensers
configured for larger commercial vehicles in a secured area. Two additional CNG dispensers are also available
in a publicly accessible location for use by cars and light-duty trucks.
In addition to the fueling facilities, Ryder also invested in a natural gas vehicle maintenance facility in Rancho
Dominguez, California. Ryder completed this facility in May 2011 with upgrades to the electrical, lighting, air
handling, and ventilation systems. Completion of this facility corresponded with the delivery of the first of
the natural gas trucks for this project. “The completion of Rancho Dominguez as a natural gas-compliant
maintenance facility is a critical milestone demonstrating Ryder’s commitment to alternative fuel vehicle use,”
said Robert Sanchez, Ryder president of Global Fleet Management Solutions. Ryder performed similar garage
upgrades at the Fontana and Orange facilities, as well.
Training for Drivers and Technicians
Ryder worked with Cummins Pacific to develop a complete training program for internal Ryder employees as
well as any customers seeking to lease the natural gas trucks. A six-part online training curriculum was
developed, with modules ranging in length from 5 to 30 minutes. The list of the training classes is provided
below, with a short description of each class.
CNG Driver Orientation: Customers seeking to lease natural gas trucks were required to take this
training course, which covered the major differences between the natural gas trucks and
conventional gasoline and diesel trucks. The course also highlighted the key safety features of the
natural gas vehicles.
Alternative Fuel Safety: Ryder provides this course for internal employees to address the maintenance
requirements of natural gas vehicles. Covered subjects include how to contain the fuel systems
before starting work, which permits are required before starting work, and what to do in the event
something goes wrong during the maintenance process.
Basics of Natural Gas Vehicle Safety: This internal Ryder course explains the differences between CNG
and LNG and provides safety guidelines for each fuel.
CNG Fuel Filter Maintenance: This internal course focuses on servicing and replacing the high-
pressure CNG fuel filters that must be replaced every 1,000 hours or 30,000 miles. The course
explains how to shut off the high-pressure fuel system and relieve the pressure before the filter is
replaced.
Fueling Alternative Fuel Vehicles: Ryder provides this course for its employees on how to fuel natural gas
vehicles (procedures, safety considerations, and draining of low-pressure fuel filters if required).
Mitigation of Natural Gas Hazards: This course for internal Ryder employees describes how to deal with
potential natural gas incidents that might impact employees and the public. Topics include
controlling accidental releases of natural gas, addressing concentration and accumulation of natural
gas, identifying and locating potential ignition sources, and responding to hazardous situations.
The CNG driver orientation class for customers has been taken more than 2,000 times to date, and the
natural gas courses for Ryder employees have been viewed between 400 and 1,300 times (depending on the
class).

7
In addition, Ryder has engaged in education and training beyond these partner-developed courses. The
company conducted orientation meetings with new customers, worked with local fire departments on gas leak
drills and emergency planning, and helped develop training for the California Highway Patrol.
Project Outreach
Both SANBAG and Ryder conducted outreach as an important part of this project, which included a
marketing strategy to build both local and national awareness of the project activities. Outreach work
included e-mail campaigns to encourage Ryder customers to consider the natural gas option; displays of the
natural gas trucks at events such as the ACT Expo; speaking engagements by Ryder staff to describe the
project and its successes; and general outreach to print and broadcast media. Ryder’s public relations team
engaged in around 70 media interviews about the project, developed 40 press releases related to the work, and
published information about the project in its Corporate Sustainability Report.
Data Analysis Results
As required for Clean Cities projects, Ryder provided data on vehicle miles traveled and fuel used by its natural
gas trucks for a 24-month period between 2012 and 2014.iii The data were analyzed to provide insight into the
overall performance (fuel economy, fuel cost, and greenhouse gas emissions) of the vehicles during this time
period.
Vehicle Operational Data
Figures 3 through 6 summarize the
operational data of the natural gas trucks
during the 24-month data collection period.
Figure 3 shows the average annual miles per
truck traveled by vehicle type. In general, the
VMT are relatively low for a regional haul
application, but vary widely within each
vehicle type.iv
Annual Vehicle Miles Traveled
The annual VMT of the Freightliner CNG
trucks ranged from about 3,000 miles per
year to 76,000 miles per year, with about
three-quarters of the trucks being in the
20,000 to 40,000 mile per year range. The Freightliner LNG trucks show a similar spread of annual VMT
(around 5,000 to about 74,000), and about three-quarters of these trucks are in the 20,000 to 40,000 mile
range for annual VMT.
The Peterbilt LNG truck annual VMT ranges from 9,000 to 103,000 miles per year; about half of the trucks
are in the 20,000 to 40,000 annual mile range. In all three cases, 10% to 25% of trucks travel more than
40,000 miles per year, which can produce more favorable incremental cost payback than trucks with lower
annual VMT (as will be discussed later).
Figure 3. Average Annual Vehicle Miles Traveled By Truck Type

8
The very similar annual VMT for the
Freightliner M2 tractors in Figure 3
demonstrates that the tractors were used in
very similar ways by the fleets that leased
them, as would be expected given the only
difference was the choice of CNG or LNG
fuel (truck capabilities were similar in all
other respects). The Peterbilt LNG tractors
were not driven significantly farther each
year than the smaller Freightliners: one
possible explanation (described in more
detail in the Lessons Learned section) is that
these trucks were configured with a very
long wheelbase that made them less
maneuverable and, due to California
regulations, unable to be legally operated on
some of the fleets’ routes.
Annual Fuel Use
Figure 4 illustrates the corresponding
average annual fuel use for the CNG and
LNG trucks. The Freightliner trucks show
similar annual fuel use, as would be
expected given that the trucks use the same
engines and travel similar distances each
year. About 5% of total fuel use for the
HPDI trucks is diesel (shown in orange in
Figure 4), used for pilot ignition to begin
fuel combustion.
Fuel Economy
Figure 5 shows the average fuel economies
of these trucks, expressed in miles per diesel
gallon equivalent (MPDGE). Again, the
Freightliner CNG and LNG trucks achieve
essentially the same fuel economy, which is
appropriate given the very similar
specifications and operations of these
trucks. The Peterbilt HPDI LNG trucks
achieve higher fuel economy than the spark-
ignited Freightliner trucks, which is
expected of the compression-ignited HPDI
system.
Figure 5. Fuel Economy by Truck Type
Figure 4. Average Annual Fuel Use by Truck Type
Figure 6. Average Fuel Cost per Mile by Truck Type
9
Fuel Cost per Mile
Ryder constructed CNG and LNG stations for use by its natural gas truck customers. As noted previously,
Ryder reported that the average fuel cost during this time period was $2.57 per DGE for CNG, and $2.79 per
DGE for LNG. Applying these prices to the VMT in Figure 3 and the fuel use in Figure 4 yields the average
fuel cost per mile for these vehicles, as shown in Figure 6. The Freightliner CNG and Peterbilt LNG have
similar fuel costs per mile because the higher fuel economy of the Peterbilt truck is offset by the higher cost
for LNG and the additional cost of the 5% diesel fuel used by the HPDI engine. The Freightliner LNG
trucks have slightly higher fuel cost per mile than the CNG trucks, as the cost of LNG fuel is higher.
Ryder did not directly provide operational data on diesel baseline trucks in the fleet that would be comparable
to the natural gas vehicles involved in this project. However, Ryder did provide information on how the fuel
economy of the Cummins Westport ISL Gv and Westport HPDIvi engines compares with conventional diesel
vehicles in its fleet. This information was used to estimate the fuel economy of equivalent diesel vehicles.
Average annual VMT for the diesels was assumed the same as for the natural gas vehicles.vii Figure 6 shows
the diesel baseline fuel costs per mile, derived
by applying Ryder’s reported average diesel
price in California during this time period of
$4.18 per gallon to the calculated annual fuel
use.
At these costs, fleet operators using natural
gas can save between 12 and 15 cents per
mile on fuel costs. Maintenance costs were
not included in the Ryder data, but previous
analyses indicate that the incremental
maintenance costs are around 1.7 cents per
mile more for the Cummins Westport spark-
ignited engines.vii
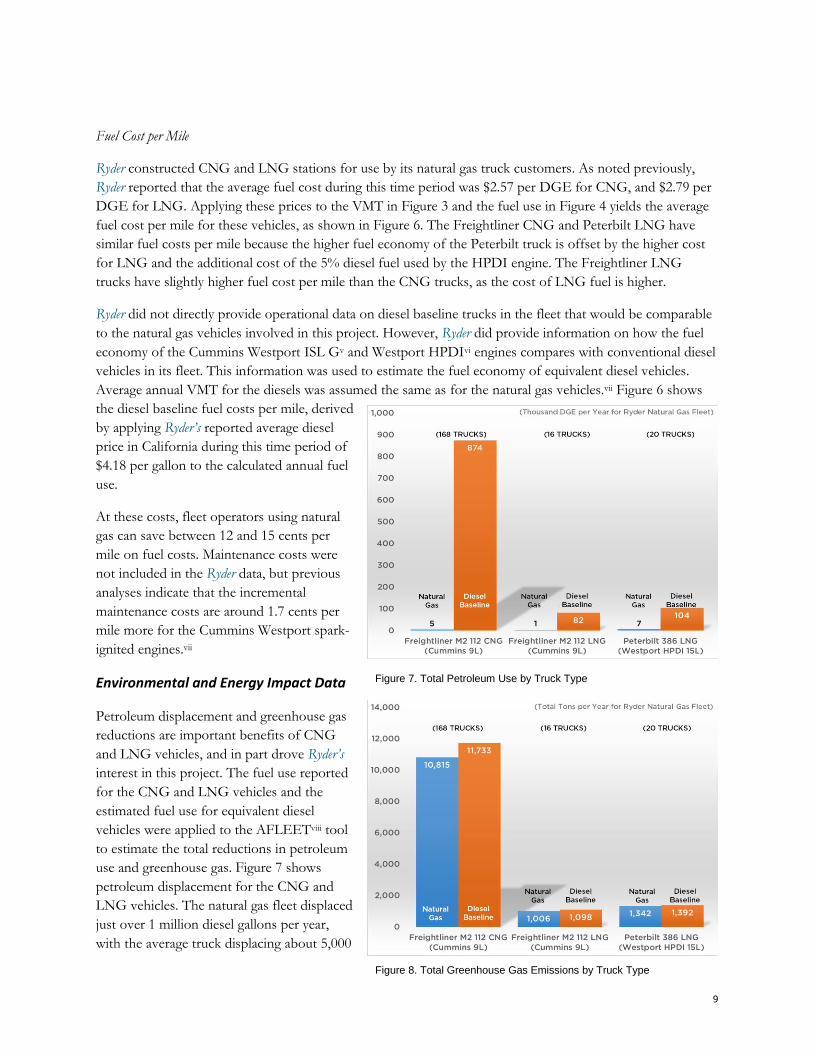
Environmental and Energy Impact Data
Petroleum displacement and greenhouse gas
reductions are important benefits of CNG
and LNG vehicles, and in part drove Ryder’s
interest in this project. The fuel use reported
for the CNG and LNG vehicles and the
estimated fuel use for equivalent diesel
vehicles were applied to the AFLEETviii tool
to estimate the total reductions in petroleum
use and greenhouse gas. Figure 7 shows
petroleum displacement for the CNG and
LNG vehicles. The natural gas fleet displaced
just over 1 million diesel gallons per year,
with the average truck displacing about 5,000
Figure 7. Total Petroleum Use by Truck Type
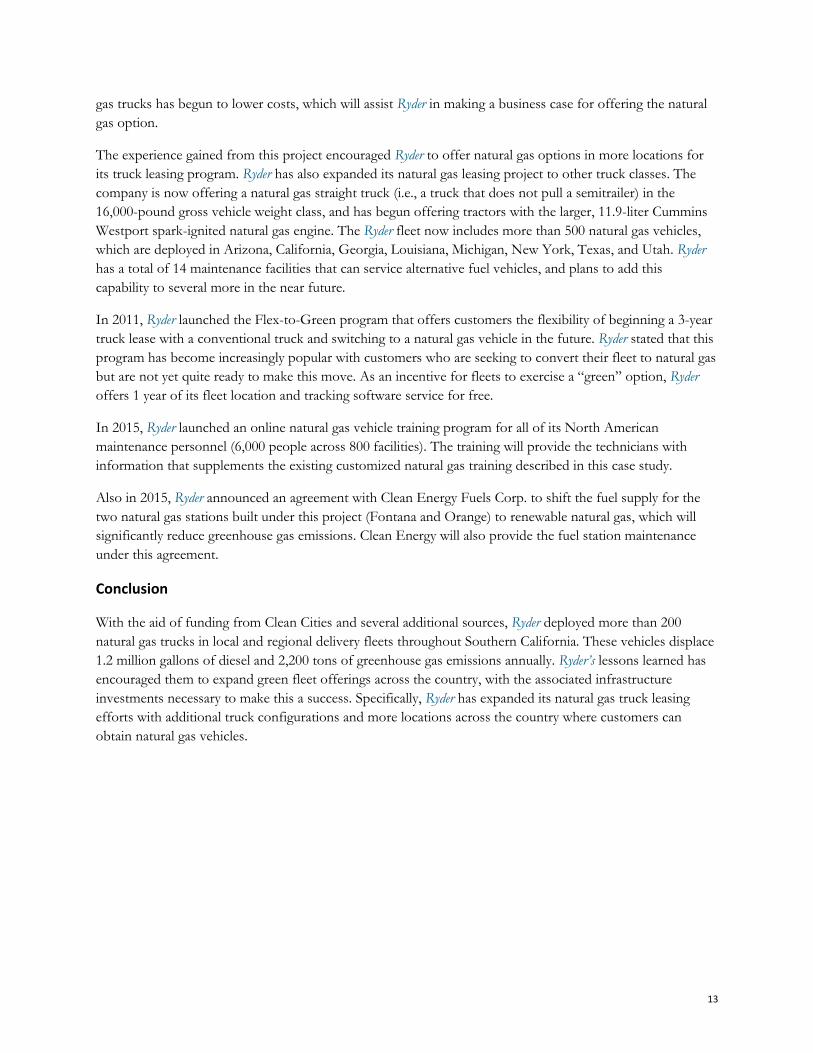
Figure 8. Total Greenhouse Gas Emissions by Truck Type

10
diesel gallons per year. Greenhouse gas emissions are presented in Figure 8. The total reduction in
greenhouse gas emissions for the test fleet is around 1,100 tons per year, an average of 5 tons annually per
truck.
Business Case Data
Fleet vehicles are purchased to do a job profitably; therefore, investments in new technologies must pay for
themselves over time to be a viable choice. This is particularly critical for an organization such as Ryder,
whose business is dependent on providing cost-effective trucks to fleet customers. Fuel cost savings can be
significant for natural gas vehicles, but incremental costs for the vehicles and costs for the fueling stations
must be paid back through these fuel cost savings.
The incremental costs of the trucks at the time of their purchase in 2010 (funded through Clean Cities by
DOE and the California Energy Commission) were:
$53,700 per Freightliner 8.9-liter CNG truck
$59,200 per Freightliner 8.9-liter LNG truck
$109,200 per Peterbilt 14.9-liter LNG truck
The higher incremental cost for the Freightliner LNG trucks over the CNG trucks can be attributed to the
somewhat costlier storage tanks required for LNG. The incremental cost of the Peterbilt LNG trucks was
significantly higher than for the Freightliner trucks because of the HPDI system and the larger storage tank
(to allow for more range).
For Ryder customers, the lease payment for a truck includes the cost for the truck itself (as with a
conventional lease payment for a vehicle) plus maintenance costs. The customer makes arrangements for fuel
separately. Ryder noted that maintenance costs for the natural gas trucks in its fleet are higher than for
comparable diesel vehicles, but these additional costs are not reflected in the lease payment. Over time, Ryder
expects to move along a learning curve to reduce maintenance costs for the natural gas vehicles to a point in
the future where they are lower than for diesel vehicles.
At a minimum, net fuel cost savings for the fleet user will need to enable repayment of truck incremental
costs within a reasonable time frame. If these trucks were purchased by a fleet at the incremental costs listed
above, with the operational conditions and fuel costs reported by Ryder, the simple payback of the
incremental cost for the Freightliner CNG truck would be 10 years; for the Freightliner LNG truck, 14 years;
and for the Peterbilt LNG truck, 23 years. These simple paybacks are somewhat longer than the 1–3 years
that typical heavy-duty fleet operators expect for capital expenditures.
The push for timely payback highlights the need for matching the right truck to the right duty cycle, though
in all cases, payback for the natural gas vehicle will improve if the annual VMT increases. Ryder also stated
that fleet size and the ability to leverage resources are crucial to the business case for natural gas vehicles,
especially in fueling and maintenance. An operator can significantly reduce its fuel costs by having a greater
number of vehicles using the fueling and maintenance facilities, spreading those costs over a larger vehicle
population. Because small fleet operators would have an uphill challenge to enter the natural gas market by
themselves, a leasing arrangement such as Ryder’s can help small fleets begin their natural gas activities.

11
Because Ryder is providing these trucks for lease to customers rather than retaining them for its own fleet use,
the business case calculations are more complex than a simple payback calculation. Ryder must take into
account both the initial purchase price of the vehicle and the potential residual value of the truck at the end of
the customer’s lease term in order to set appropriate lease payments. Ryder has found that the natural gas
trucks depreciate at a faster rate than comparable diesel vehicles. As a result, the lease payment for a natural
gas truck will typically be higher than for a diesel truck, a monthly incremental cost that the lease customer
will try to pay back through fuel cost savings.
One of the main factors establishing the residual value of the truck when Ryder sells it into the secondary
market is the willingness of that secondary buyer to pay for the natural gas option. Ryder stated that, in its
experience, the typical truck buyer in the secondary market is looking to operate that truck for a total of 3
years, and wants a payback of any additional costs (such as those for a natural gas option) in 1 year.
Because Ryder is installing its own fueling stations, this infrastructure cost will need to be amortized as well.
Each LCNG station costs $2.5 million, which will need to be recouped by station operators as a charge
included in the fuel price customers are charged. More station throughput and a higher cost per unit of fuel
will pay the station costs back more quickly, but the cost charged per unit of fuel cannot be so high that the
cost advantage for the fleet customer is erased. Ryder estimates that the capital recovery and profit margin
together represent around 40% of the cost of the fuel.ix
Lessons Learned
Natural Gas Vehicles
Ryder’s participation in the Clean Cities project yielded useful insights about developing the specifications for
natural gas trucks. The fleets who leased the trucks from Ryder used these vehicles in a variety of duty cycles,
ranging from local delivery to over-the-road. This allowed the project to demonstrate the performance of
these trucks in a wide range of commercial truck applications typically dominated by diesel engines.
Economic viability will depend on the particular fleet duty cycle characteristics, and better business cases can
be built with higher annual miles traveled than what was seen in this case study. By providing a visible
example of the capabilities of natural gas vehicles, Ryder believes it has helped kick off the widespread
acceptance of gas alternative fuel vehicles in the trucking market.
Ryder reported that, in general, fleet operators were very satisfied with the performance and drivability of the
Freightliner trucks using the Cummins Westport 8.9-liter engine. At the time Ryder purchased the trucks,
these engines were approved for use in Class 8 tractors at gross vehicle weights up to 80,000 pounds. Ryder
found that the 8.9-liter engine does not have sufficient power in applications that require truck gross vehicle
weights above 66,000 pounds, but is more suited to applications requiring single-axle tractors instead of
tandem-axle tractors.x Ryder noted that the 8.9-liter engine performed well in beverage delivery, where gross
vehicle weights are in the 30,000-pound range—an important lesson learned for the industry as a whole.
Cummins Westport has since lowered the gross vehicle weight limit for the 8.9-liter engine to 66,000 pounds.
The Peterbilt LNG trucks provided additional lessons learned for Ryder. The Westport HPDI trucks, with
their longer wheelbases, were more difficult to place with customers than the Freightliner tractors, but
performed well in the higher-VMT regional haul applications where the truck is best suited to operate. The
Westport HPDI wheelbase is about 2 feet longer because of the need to package LNG tanks for adequate
range, plus diesel tanks and diesel exhaust fluid tanks for the emission control systems. The extra length

12
hindered maneuverability in the urban environments of Southern California, particularly for local delivery
service. It also meant that the trucks could not legally be operated on city streets and state highways where
overall length restrictions are in place.xi
Ryder’s customers preferred the shorter Freightliner trucks in both local- and regional-haul applications where
maneuverability is important and restrictive length laws are in effect. Ryder concluded that the Peterbilt truck
is more suited to a long-haul highway application. In addition, Ryder found that the HPDI engines
experienced some reliability issues with both the engines themselves and the HPDI fuel systems, which also
contributed to the lower level of customer satisfaction.
Ryder learned some lessons about truck specification. To expedite purchases with the Recovery Act funding,
the trucks purchased as part of this project were all based on a single standard specification.xii Ryder found
that this standard specification made the natural gas trucks more difficult to deploy than standard-
specification diesel trucks, because of the impact of payload and range requirements for individual fleets.
Ryder determined that the natural gas trucks should be tailored to the specific needs of the fleet customers to
ensure they can be successfully deployed.
Lead times for procuring natural gas trucks were also an area of concern. Ryder learned that all of the
participating organizations in a natural gas truck project must be aware of the longer lead time for building
and delivering natural gas trucks compared with diesel trucks.
Finally, Ryder noted that customer support is extremely important in the success of an alternative fuel
initiative. Ryder’s dedicated sales resources created positive experiences with customers and assisted with
ensuring consistency for the customer experience with natural gas trucks across the country.
Natural Gas Fueling Stations
Both Ryder and SANBAG gained expertise in planning, designing, and constructing natural gas fueling
stations. One key insight was the need to engage local government organizations early in the planning
process. the Ryder/SANBAG team reached out to the city’s Planning Department when planning the first
station in Orange, but the Planning Department did not initially see the need to have such a meeting. During
the later phases of the project, it became apparent to Ryder that the Planning Department’s unfamiliarity with
natural gas stations and the Clean Cities initiative caused permit delays that set the project back nearly 12
months. When the project team commenced planning for the Fontana station, Ryder and SANBAG took a
proactive approach in educating the local officials instead of waiting for those officials to seek answers to
questions. This led to fewer roadblocks in planning and permitting the second station.
Ryder noted that its ability to make alternative fuel options available to its customers hinges on its ability to
make a business case: sufficient revenue needs to be generated by having a critical mass of customers to pay
back the infrastructure investments for fueling stations and maintenance facility upgrades. Getting this many
customers requires having the right trucks for their applications. Financial assistance from Clean Cities was
critical to making the short-term business case for the initial truck and infrastructure deployments.
Future Plans
Ryder continues to pursue natural gas trucks as a viable alternative to offer customers who are interested in
reducing fuel costs and addressing broader energy security and emissions reduction goals. While the
incremental costs of natural gas trucks in this project were relatively high, the increasing popularity of natural
13
gas trucks has begun to lower costs, which will assist Ryder in making a business case for offering the natural
gas option.
The experience gained from this project encouraged Ryder to offer natural gas options in more locations for
its truck leasing program. Ryder has also expanded its natural gas leasing project to other truck classes. The
company is now offering a natural gas straight truck (i.e., a truck that does not pull a semitrailer) in the
16,000-pound gross vehicle weight class, and has begun offering tractors with the larger, 11.9-liter Cummins
Westport spark-ignited natural gas engine. The Ryder fleet now includes more than 500 natural gas vehicles,
which are deployed in Arizona, California, Georgia, Louisiana, Michigan, New York, Texas, and Utah. Ryder
has a total of 14 maintenance facilities that can service alternative fuel vehicles, and plans to add this
capability to several more in the near future.
In 2011, Ryder launched the Flex-to-Green program that offers customers the flexibility of beginning a 3-year
truck lease with a conventional truck and switching to a natural gas vehicle in the future. Ryder stated that this
program has become increasingly popular with customers who are seeking to convert their fleet to natural gas
but are not yet quite ready to make this move. As an incentive for fleets to exercise a “green” option, Ryder
offers 1 year of its fleet location and tracking software service for free.
In 2015, Ryder launched an online natural gas vehicle training program for all of its North American
maintenance personnel (6,000 people across 800 facilities). The training will provide the technicians with
information that supplements the existing customized natural gas training described in this case study.
Also in 2015, Ryder announced an agreement with Clean Energy Fuels Corp. to shift the fuel supply for the
two natural gas stations built under this project (Fontana and Orange) to renewable natural gas, which will
significantly reduce greenhouse gas emissions. Clean Energy will also provide the fuel station maintenance
under this agreement.
Conclusion
With the aid of funding from Clean Cities and several additional sources, Ryder deployed more than 200
natural gas trucks in local and regional delivery fleets throughout Southern California. These vehicles displace
1.2 million gallons of diesel and 2,200 tons of greenhouse gas emissions annually. Ryder’s lessons learned has
encouraged them to expand green fleet offerings across the country, with the associated infrastructure
investments necessary to make this a success. Specifically, Ryder has expanded its natural gas truck leasing
efforts with additional truck configurations and more locations across the country where customers can
obtain natural gas vehicles.

14
Endnotes
i. This funding is part of the Low Carbon Transportation Investments and Air Quality Improvement
Program (AQIP)—see http://www.arb.ca.gov/msprog/aqip/aqip.htm for additional information.
ii. The information in this case study was obtained from several sources, including quarterly American
Recovery and Reinvestment Act data submissions to DOE, public announcements about the project by
Ryder and other project partners, and the SANBAG final report to DOE on the project (Ryder/SANBAG:
Alternative Fuel Truck Project Final Report, March 2014)
iii. Ryder employed two methodologies for collecting data from the project trucks:
1) From the start of the project through the second quarter of 2012, Ryder tracked vehicle mileage by
recording odometer readings when the vehicle was serviced or refueled. If an odometer reading was not
taken, Ryder used an assumed monthly VMT based on that customer’s typical annual VMT. Fuel economy
was assumed to be 5.5 mpg for the Freightliner trucks and 6.5 mpg for the Peterbilt trucks.
2) After the second quarter of 2012, Ryder used a telematics system (RydeSmart) to collect information on
mileage and fuel use directly from the trucks.
iv. Because the vehicles were leased to third-party customers, the average annual miles per vehicle varied
fairly widely. To describe this variation more thoroughly, the graph below provides a histogram of vehicle
miles traveled in several categories, ranging from 10,000 miles per year or less, to more than 70,000 miles
per year. As this graph shows, the Freightliner CNG vehicles were used mainly in applications from 20,000
miles per year to 40,000 miles per year. The annual miles traveled for the Freightliner LNG trucks are in
the 30,000 to 40,000 mile range, somewhat higher than the CNG trucks. The Peterbilt LNG trucks were
mainly in the 10,000 to 30,000 mile range, with a small percentage in the 60,000 and higher category.

15
v. Ryder stated that the fuel economy for vehicles using the Cummins Westport ISL G 8.9-liter spark-ignited
natural gas engine was about 1520% lower than comparable diesel vehicles available at the time the
project vehicles were purchased. For comparison, Argonne National Laboratory estimated that the energy
equivalent fuel economy penalty of a spark-ignited heavy-duty natural gas vehicle in regional haul
application was 10% relative to a comparable diesel vehicle (The GREET Model Expansion for Well-to-Wheels
Analysis of Heavy-Duty Vehicles, May 2015, https://greet.es.anl.gov/publication-heavy-duty). A 15% fuel
economy penalty for natural gas was used for the Ryder trucks using the ISL G 8.9-liter engine to derive
the equivalent diesel fuel economy.
vi. Ryder stated that the fuel economy of vehicles using the Westport HPDI 14.9-liter compression-ignited
LNG engine was about 10% lower than comparable diesel vehicles available at the time the project
vehicles were purchased. For comparison, Argonne completed a similar analysis for dual fuel natural gas
engines such as the Westport HPDI engines in this study (see reference in endnote v); the fuel economy
penalty for those vehicles was estimated to be 5%. Ryder’s fuel economy differential was used in this
analysis. In both the spark-ignition and HPDI cases, Ryder stated that improvements in diesel fuel
efficiency since the project vehicles were purchased likely account for the difference between their
reported fuel efficiencies for natural gas and diesel vehicles and the more recent Argonne results.
vii. Ryder stated that the natural gas trucks accumulated mileage at a lower annual rate than comparable diesel
trucks in its fleet, but did not provide specifics on the actual level of diesel VMT. As a result, this case
study assumes equivalent VMT levels for natural gas and diesel trucks for the purposes of the comparison
calculations.
viii. The AFLEET tool may be found at https://greet.es.anl.gov/afleet.
ix. In a presentation by Ryder to the Harbor Trucking Association, the fuel price for natural gas listed was
$2.15 per gallon, implying a capital recovery and margin cost contribution of $0.86 per gallon,
http://www.harbortruckers.com/downloads/RES092513%20RyderPresentation.pdf.
x. Ryder observed that the newer 11.9-liter Cummins Westport natural gas engine is a superior product for its
regional haul customers and are receiving very positive feedback.
xi. California restricts the length of tractor-trailers to a maximum of 65 feet on certain state routes and local
streets, http://www.dot.ca.gov/hq/traffops/trucks/truck-length-routes.htm. These are referred to as
“California-legal” trucks, as opposed to STAA (Surface Transportation Assistance Act) trucks that are
legal for the national interstate highway network. STAA trucks have length restrictions only for the trailer,
along with restrictions on the distance between the kingpin (where the trailer attaches to the tractor) and
the axles on the trailer. The 65-foot overall length restriction is in place because the longer STAA trucks
have a larger turning radius than many local roads can accommodate,
http://www.sacdot.com/Pages/TruckRoutes-STAA.aspx. For the Peterbilt HPDI tractors, their
additional wheelbase meant that the tractor could not be used with a 53-foot trailer and stay within the
overall 65-foot length required by California (a shorter trailer would have to be used with these tractors).
xii. Ryder agreed to participate in the project after the original fleet partner withdrew (and after award of the
project to the prime contractor, SANBAG). As a result, Ryder came onboard to the project with little
advance notice and time was limited to execute the vehicle purchases.


