case study: regence cracks the transparency code · forrester research, inc., 60 acorn park drive,...
TRANSCRIPT

Forrester Research, Inc., 60 Acorn park Drive, Cambridge, mA 02140 UsA
Tel: +1 617.613.6000 | Fax: +1 617.613.5000 | www.forrester.com
Case Study: Regence Cracks The Transparency Codeby Elizabeth Boehm, April 4, 2012
FOR: Customer Experience professionals
Key TaKeaWays
Regence’s Transparency solutions Look Very different from Competitors’In a market where most provider directories off er very similar features, Regence’s transparency solution off ers capabilities such as patient reviews, provider practice philosophies, and full treatment episode cost estimators. Th is novel approach is driving high satisfaction and better consumer health decision-making.
User-Centered design Best practices help Regence Buck The industry TrendIn an industry with low customer satisfaction scores, Regence’s results stand out. Its secret? Strict adherence to user-centered design principles including upfront stakeholder research that uncovers needs and goals, ongoing measurement, and continuous iteration help keep the solution on track.

© 2012, Forrester Research, Inc. All rights reserved. Unauthorized reproduction is strictly prohibited. Information is based on best available resources. Opinions reflect judgment at the time and are subject to change. Forrester®, Technographics®, Forrester Wave, RoleView, TechRadar, and Total Economic Impact are trademarks of Forrester Research, Inc. All other trademarks are the property of their respective companies. To purchase reprints of this document, please email [email protected]. For additional information, go to www.forrester.com.
FOR CUsTOmER ExpERIEnCE pROFEssIOnAls
Why Read This RepoRT
In a market where well-established standards define digital capabilities, it’s tempting to stay with the status quo and build tools that meet industry norms. But what if industry norms are badly out of alignment with user needs? It takes courage to re-engineer what has become standard practice, but the results can be impressive. This report outlines how Regence BlueCross BlueShield created a suite of transparency tools (including a provider directory and cost estimator) that drives significant member satisfaction and meaningful health decision support.
Table Of Contents
Regence answers Key Consumer Questions That others don’t
Best practice: Regence Lets User Needs define design Requirements
Regence’s provider Directory And Cost Estimator Tools Drive member Value
Regence drives Better decision-Making With its Transparency suite
next steps: Regence plans Constant Improvement And Broader Dissemination
RECOmmEnDATIOns
how To apply Regence’s Best practices across industries
supplemental Material
notes & Resources
Forrester interviewed Regence BlueCross Blueshield (Regence) about its online capabilities.
Related Research Documents
Health Insurers still struggle To Deliver positive multichannel Customer ExperiencesAugust 15, 2011
Best And Worst Of Website User Experience, 2011: Health Insurersmay 19, 2011
six steps To member-Centric Health plan sitesFebruary 17, 2010
Case study: Regence Cracks The Transparency CodeHow A Focus On User Goals Breaks Down silos Between Online Toolsby Elizabeth Boehmwith Ron Rogowski and Belle Bocal
2
3
13
14
16
ApRIl 4, 2012
FOR CUsTOmER ExpERIEnCE pROFEssIOnAls
Case study: Regence Cracks The Transparency Code 2
© 2012, Forrester Research, Inc. Reproduction prohibited April 4, 2012
RegeNCe aNsWeRs Key CoNsUMeR QUesTioNs ThaT oTheRs doN’T
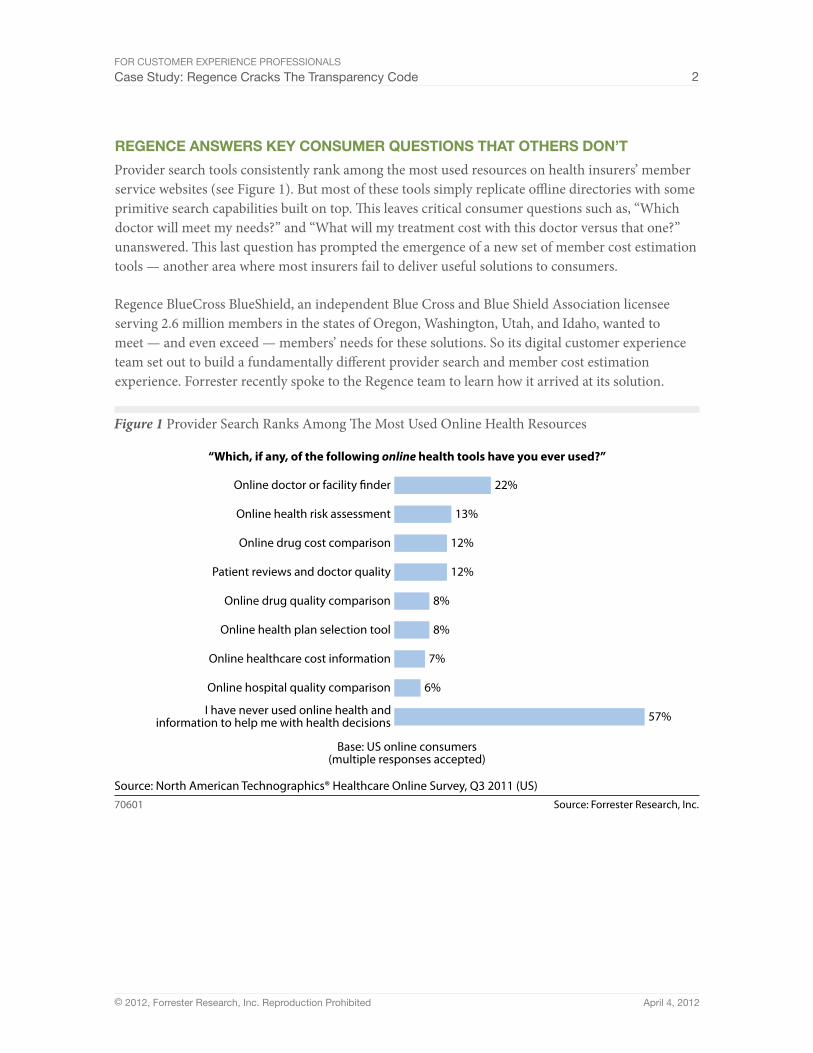
Provider search tools consistently rank among the most used resources on health insurers’ member service websites (see Figure 1). But most of these tools simply replicate offline directories with some primitive search capabilities built on top. This leaves critical consumer questions such as, “Which doctor will meet my needs?” and “What will my treatment cost with this doctor versus that one?” unanswered. This last question has prompted the emergence of a new set of member cost estimation tools — another area where most insurers fail to deliver useful solutions to consumers.
Regence BlueCross BlueShield, an independent Blue Cross and Blue Shield Association licensee serving 2.6 million members in the states of Oregon, Washington, Utah, and Idaho, wanted to meet — and even exceed — members’ needs for these solutions. So its digital customer experience team set out to build a fundamentally different provider search and member cost estimation experience. Forrester recently spoke to the Regence team to learn how it arrived at its solution.
Figure 1 Provider Search Ranks Among The Most Used Online Health Resources
Source: Forrester Research, Inc.70601
“Which, if any, of the following online health tools have you ever used?”
Source: North American Technographics® Healthcare Online Survey, Q3 2011 (US)
Base: US online consumers(multiple responses accepted)
22%
13%
12%
12%
8%
8%
7%
6%
57%
Online doctor or facility finder
Online health risk assessment
Online drug cost comparison
Patient reviews and doctor quality
Online drug quality comparison
Online health plan selection tool
Online healthcare cost information
Online hospital quality comparison
I have never used online health andinformation to help me with health decisions

FOR CUsTOmER ExpERIEnCE pROFEssIOnAls
Case study: Regence Cracks The Transparency Code 3
© 2012, Forrester Research, Inc. Reproduction prohibited April 4, 2012
BesT pRaCTiCe: RegeNCe LeTs UseR Needs defiNe desigN ReQUiReMeNTs
Whereas most health insurers merely copy tools other insurers provide or implement cookie-cutter vendor solutions, Regence started with a fundamental question: What do users want? Recognizing that provider directories and cost estimator tools need to serve the needs of consumers, employers, and healthcare professionals alike, Regence embarked on an in-depth research process involving surveys, focus groups, and one-on-one interviews to:
■ Uncover consumer needs. Regence knew that it wouldn’t do any good to build a tool that matched industry norms and catered to employer and provider sensibilities if it didn’t fundamentally address consumers’ questions. So it reached out to large employer groups and consumers in each of the states it serves and ran focus groups throughout the conception, design, and testing phases of the process. Reaching out to employer groups for ongoing surveys enabled the team to tap into an audience that combined leaders who had bought into Regence’s vision and approach to gain a constant flow of new opinions and fresh eyes. Regence combined the information gleaned from these interviews with survey data and conjoint analysis to prioritize a list of capabilities that would address users’ most important questions.
■ Balance employer expectations. By working through employers, Regence also gained valuable insights into the needs of human resources and benefits managers responsible for purchasing most insurance and defining requirements in requests for proposals. Where the needs and preferences of both stakeholders aligned, Regence prioritized certain capabilities in its design process. Where consumer needs and employer demands came into conflict, however, Regence was able to craft messages to temper and redirect the expectations of its employer clients. Said Torben Nielsen, vice president of eBusiness strategies and services, “We made a decision to side with the end user wherever there was a conflict, as building what was usable in the eyes of the consumer is the shared ultimate goal.”
■ Gain provider trust. Doctors are notoriously skittish about consumer reviews of their services. Whether justified or not, doctor resistance has prevented most insurers from enabling consumer reviews, for fear of alienating their critical network resources. To help their providers adjust to the idea of patient reviews — the top feature requested by consumers for a provider directory — Regence reached out to providers proactively to educate and learn from them regarding this touchy subject. Taking a cue from drug reps, Regence scheduled lunch and learns during which it talked doctors and staff through the concept for provider reviews, showing them how the approach addressed many of their concerns and how the reviews could serve as a form of free market research. Regence also learned about how providers would like to interact with the directory, turning a potential point of contention into a relationship-building service.
FOR CUsTOmER ExpERIEnCE pROFEssIOnAls
Case study: Regence Cracks The Transparency Code 4
© 2012, Forrester Research, Inc. Reproduction prohibited April 4, 2012
Regence’s provider directory and Cost estimator Tools drive Member Value
Armed with a solid understanding of user needs, Regence built a provider directory and cost estimator tool that bear little resemblance to the standard tools available in the market. Regence’s solutions include:
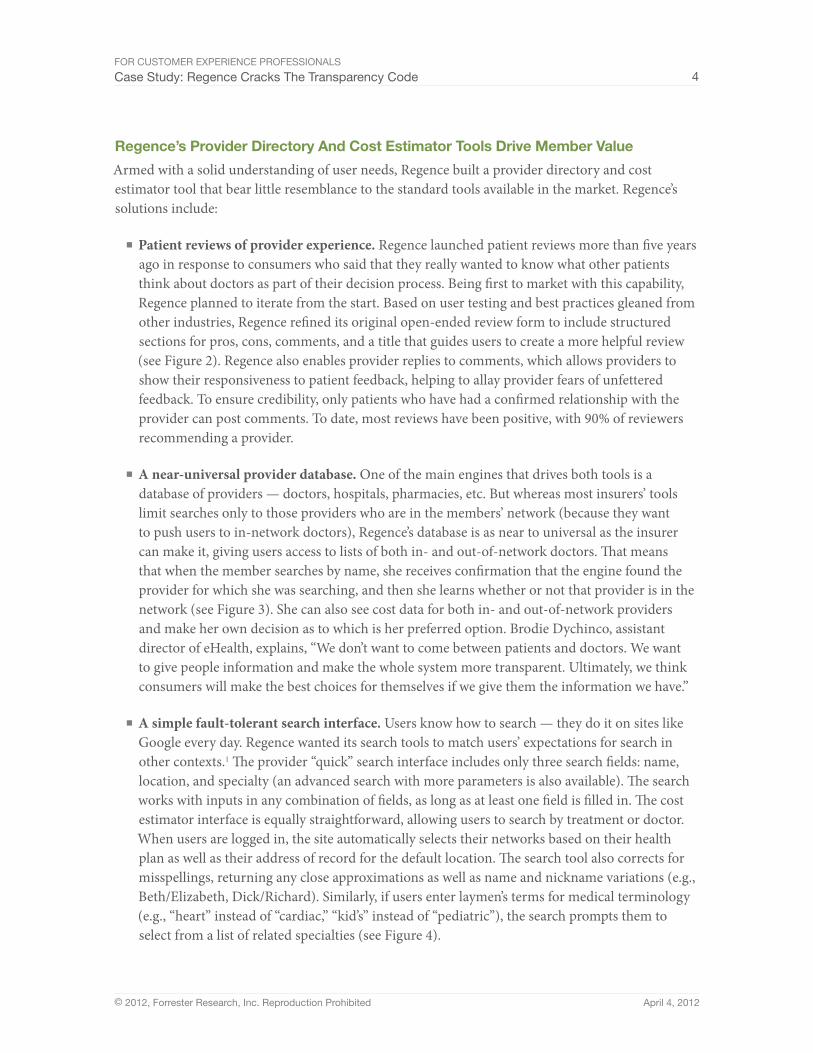
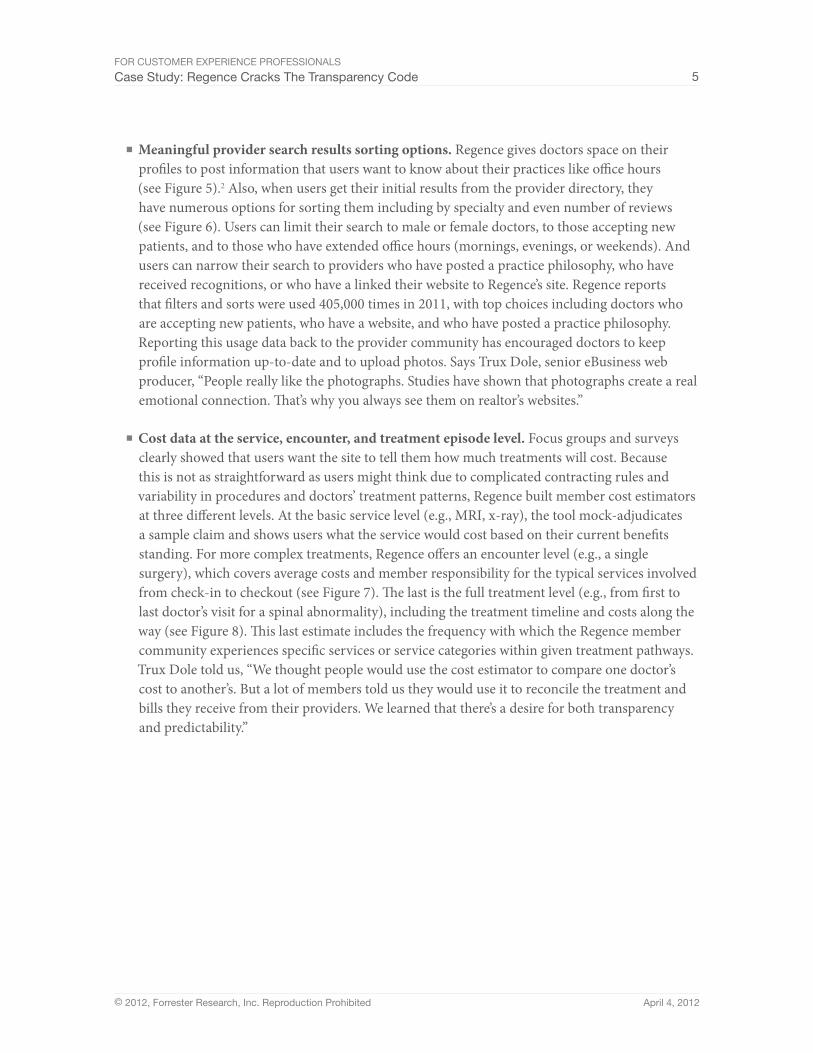
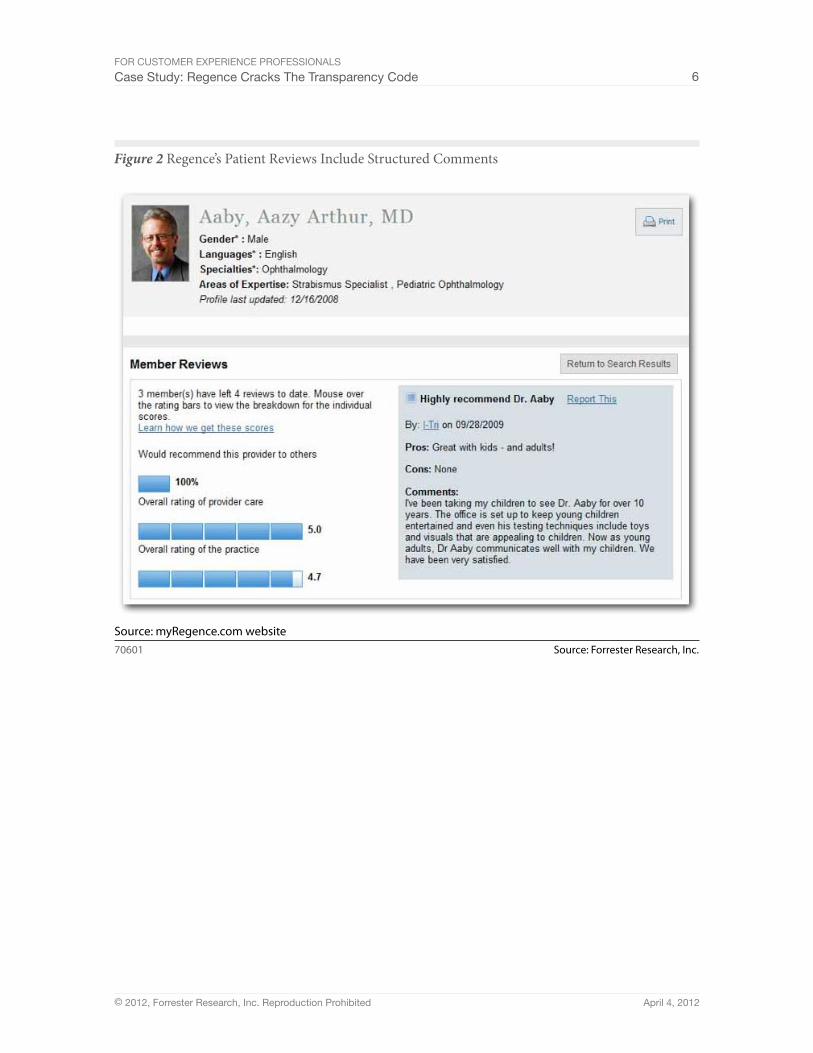
■ Patient reviews of provider experience. Regence launched patient reviews more than five years ago in response to consumers who said that they really wanted to know what other patients think about doctors as part of their decision process. Being first to market with this capability, Regence planned to iterate from the start. Based on user testing and best practices gleaned from other industries, Regence refined its original open-ended review form to include structured sections for pros, cons, comments, and a title that guides users to create a more helpful review (see Figure 2). Regence also enables provider replies to comments, which allows providers to show their responsiveness to patient feedback, helping to allay provider fears of unfettered feedback. To ensure credibility, only patients who have had a confirmed relationship with the provider can post comments. To date, most reviews have been positive, with 90% of reviewers recommending a provider.
■ A near-universal provider database. One of the main engines that drives both tools is a database of providers — doctors, hospitals, pharmacies, etc. But whereas most insurers’ tools limit searches only to those providers who are in the members’ network (because they want to push users to in-network doctors), Regence’s database is as near to universal as the insurer can make it, giving users access to lists of both in- and out-of-network doctors. That means that when the member searches by name, she receives confirmation that the engine found the provider for which she was searching, and then she learns whether or not that provider is in the network (see Figure 3). She can also see cost data for both in- and out-of-network providers and make her own decision as to which is her preferred option. Brodie Dychinco, assistant director of eHealth, explains, “We don’t want to come between patients and doctors. We want to give people information and make the whole system more transparent. Ultimately, we think consumers will make the best choices for themselves if we give them the information we have.”
■ A simple fault-tolerant search interface. Users know how to search — they do it on sites like Google every day. Regence wanted its search tools to match users’ expectations for search in other contexts.1 The provider “quick” search interface includes only three search fields: name, location, and specialty (an advanced search with more parameters is also available). The search works with inputs in any combination of fields, as long as at least one field is filled in. The cost estimator interface is equally straightforward, allowing users to search by treatment or doctor. When users are logged in, the site automatically selects their networks based on their health plan as well as their address of record for the default location. The search tool also corrects for misspellings, returning any close approximations as well as name and nickname variations (e.g., Beth/Elizabeth, Dick/Richard). Similarly, if users enter laymen’s terms for medical terminology (e.g., “heart” instead of “cardiac,” “kid’s” instead of “pediatric”), the search prompts them to select from a list of related specialties (see Figure 4).
FOR CUsTOmER ExpERIEnCE pROFEssIOnAls
Case study: Regence Cracks The Transparency Code 5
© 2012, Forrester Research, Inc. Reproduction prohibited April 4, 2012
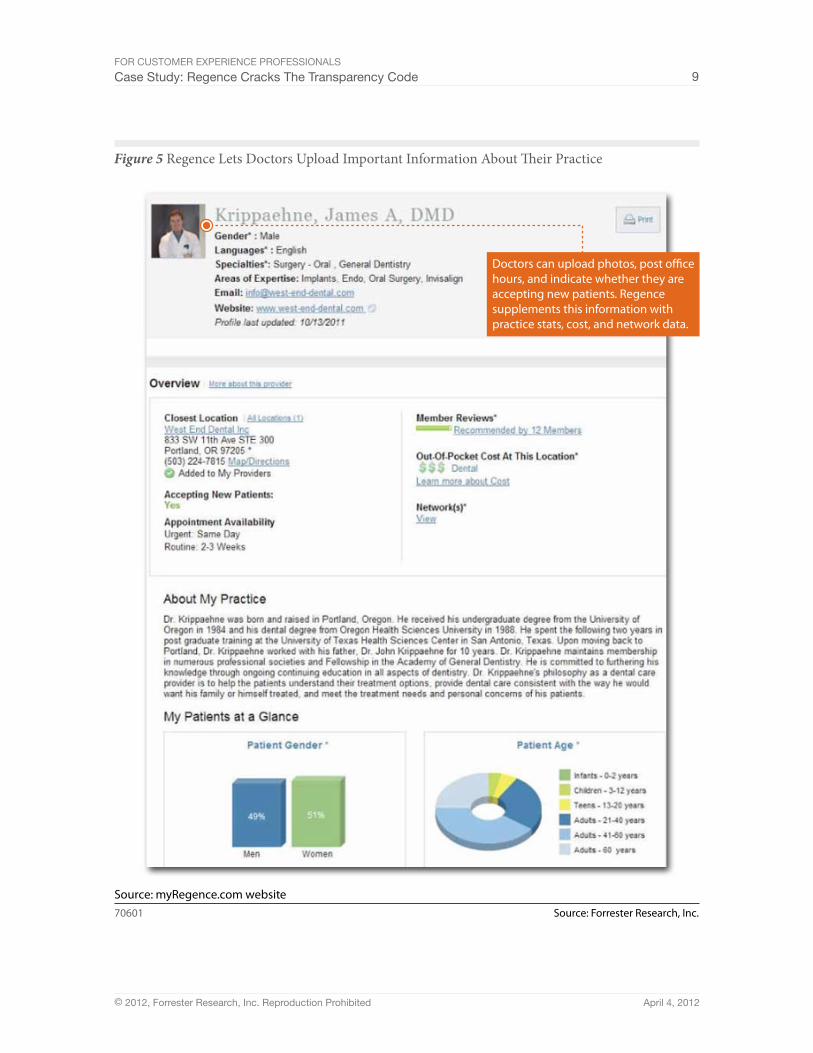
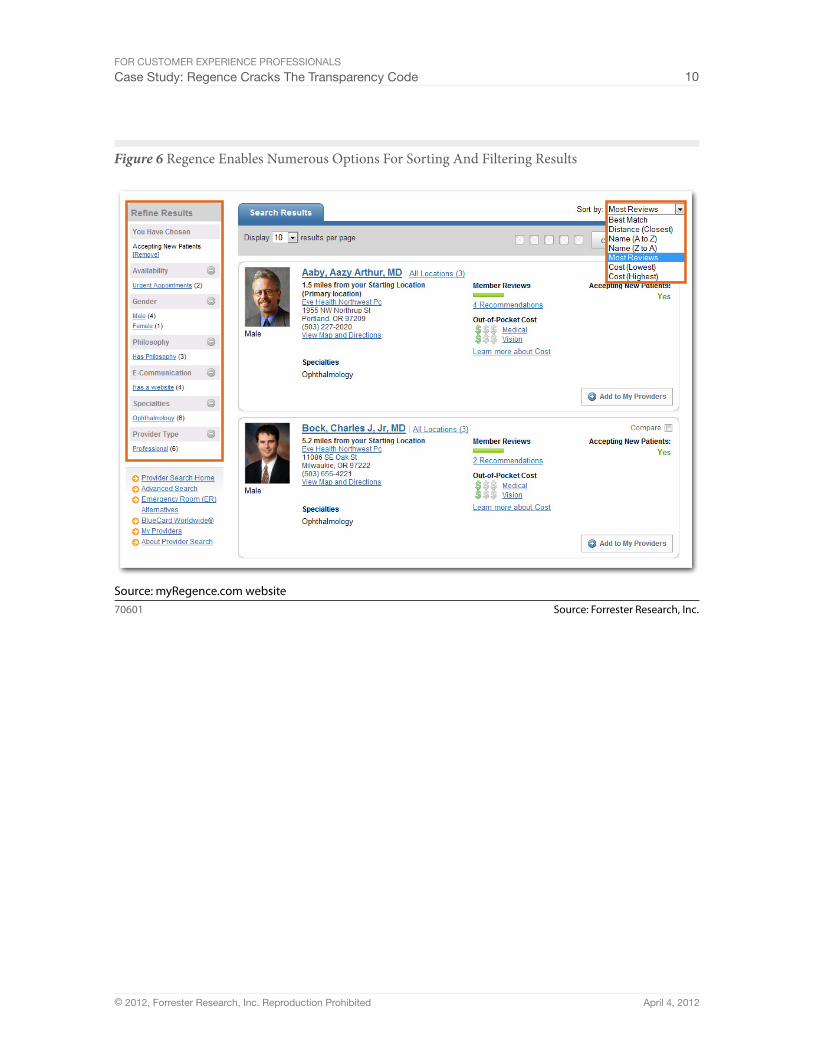
■ Meaningful provider search results sorting options. Regence gives doctors space on their profiles to post information that users want to know about their practices like office hours (see Figure 5).2 Also, when users get their initial results from the provider directory, they have numerous options for sorting them including by specialty and even number of reviews (see Figure 6). Users can limit their search to male or female doctors, to those accepting new patients, and to those who have extended office hours (mornings, evenings, or weekends). And users can narrow their search to providers who have posted a practice philosophy, who have received recognitions, or who have a linked their website to Regence’s site. Regence reports that filters and sorts were used 405,000 times in 2011, with top choices including doctors who are accepting new patients, who have a website, and who have posted a practice philosophy. Reporting this usage data back to the provider community has encouraged doctors to keep profile information up-to-date and to upload photos. Says Trux Dole, senior eBusiness web producer, “People really like the photographs. Studies have shown that photographs create a real emotional connection. That’s why you always see them on realtor’s websites.”
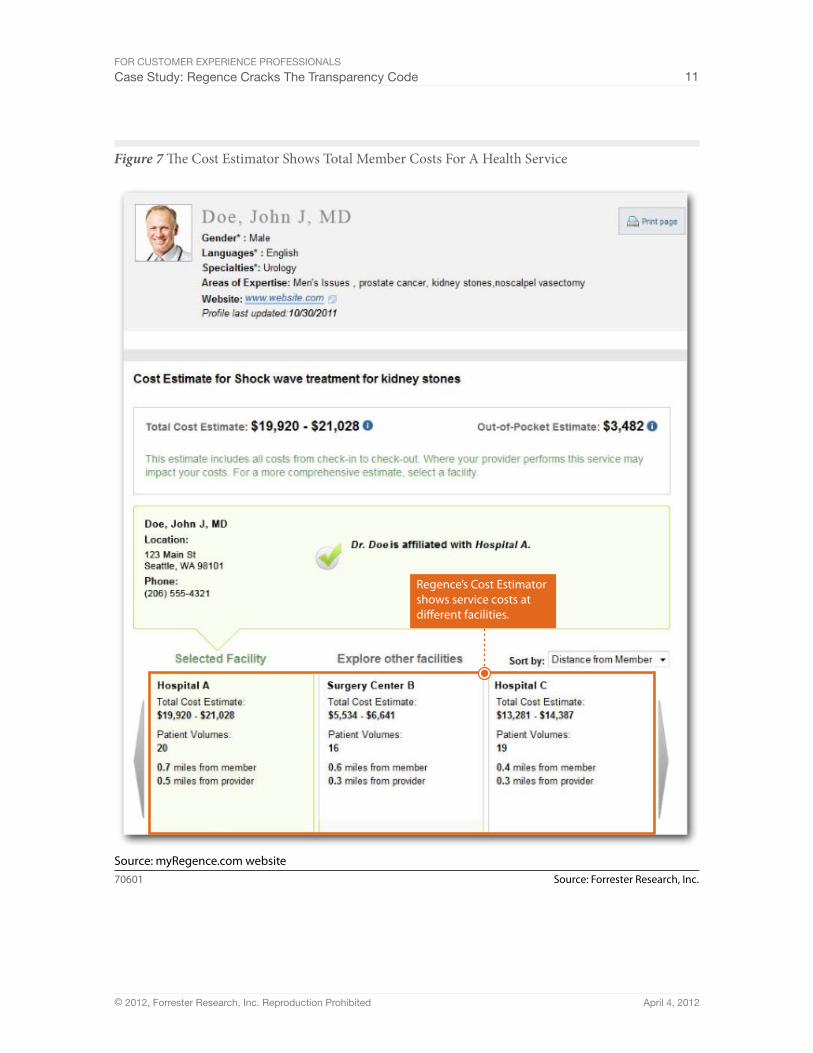
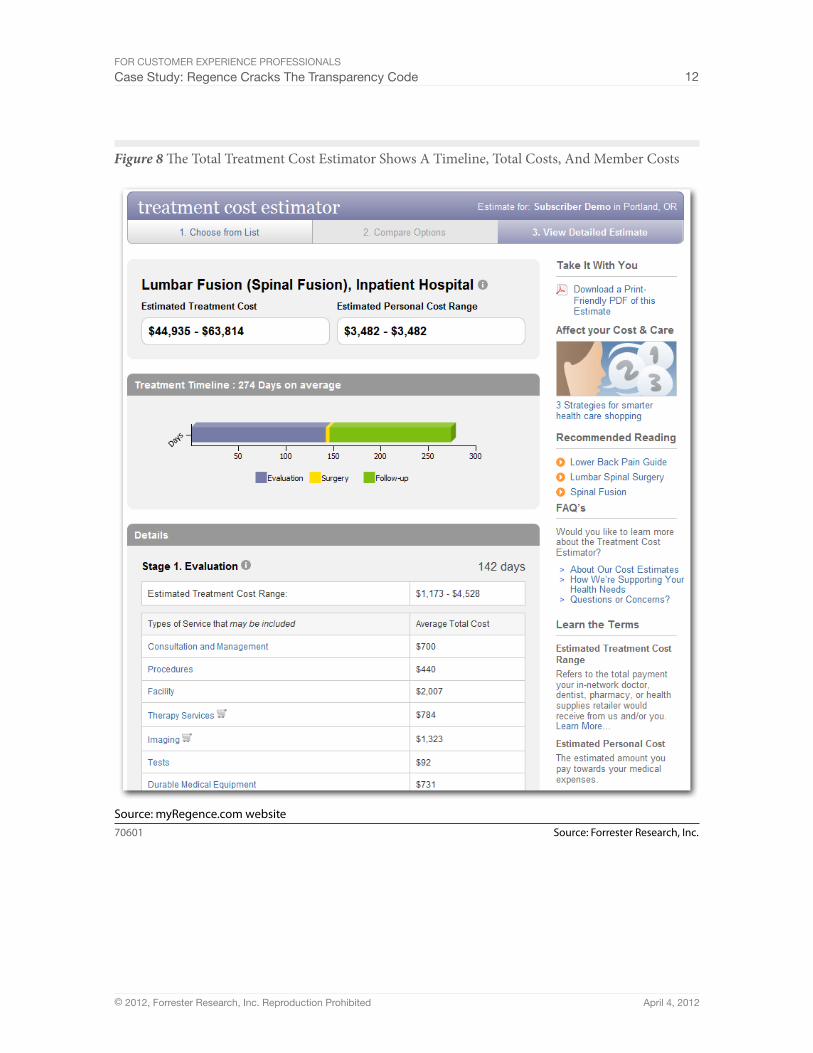
■ Cost data at the service, encounter, and treatment episode level. Focus groups and surveys clearly showed that users want the site to tell them how much treatments will cost. Because this is not as straightforward as users might think due to complicated contracting rules and variability in procedures and doctors’ treatment patterns, Regence built member cost estimators at three different levels. At the basic service level (e.g., MRI, x-ray), the tool mock-adjudicates a sample claim and shows users what the service would cost based on their current benefits standing. For more complex treatments, Regence offers an encounter level (e.g., a single surgery), which covers average costs and member responsibility for the typical services involved from check-in to checkout (see Figure 7). The last is the full treatment level (e.g., from first to last doctor’s visit for a spinal abnormality), including the treatment timeline and costs along the way (see Figure 8). This last estimate includes the frequency with which the Regence member community experiences specific services or service categories within given treatment pathways. Trux Dole told us, “We thought people would use the cost estimator to compare one doctor’s cost to another’s. But a lot of members told us they would use it to reconcile the treatment and bills they receive from their providers. We learned that there’s a desire for both transparency and predictability.”
FOR CUsTOmER ExpERIEnCE pROFEssIOnAls
Case study: Regence Cracks The Transparency Code 6
© 2012, Forrester Research, Inc. Reproduction prohibited April 4, 2012
Figure 2 Regence’s Patient Reviews Include Structured Comments
Source: Forrester Research, Inc.70601
Source: myRegence.com website

FOR CUsTOmER ExpERIEnCE pROFEssIOnAls
Case study: Regence Cracks The Transparency Code 7
© 2012, Forrester Research, Inc. Reproduction prohibited April 4, 2012
Figure 3 Regence’s Provider Directory Includes Out-Of-Network Results
Source: Forrester Research, Inc.70601
Source: myRegence.com website
Search results include bothin- and out-of-network results.Simple icons help users seenetwork status and costimplications.

FOR CUsTOmER ExpERIEnCE pROFEssIOnAls
Case study: Regence Cracks The Transparency Code 8
© 2012, Forrester Research, Inc. Reproduction prohibited April 4, 2012
Figure 4 Regence’s Search Is Fault Tolerant And Helps Prevent Errors
Source: Forrester Research, Inc.70601
Source: myRegence.com website
Search compensates formisspellings oralternative spellings.
Search prompts users withrelated categories, includinglaymen’s terms for healthspecialties.
Source: Forrester Research, Inc.70601
Source: myRegence.com website
Doctors can upload photos, post officehours, and indicate whether they areaccepting new patients. Regencesupplements this information withpractice stats, cost, and network data.
FOR CUsTOmER ExpERIEnCE pROFEssIOnAls
Case study: Regence Cracks The Transparency Code 9
© 2012, Forrester Research, Inc. Reproduction prohibited April 4, 2012
Figure 5 Regence Lets Doctors Upload Important Information About Their Practice
Source: Forrester Research, Inc.70601
Source: myRegence.com website
FOR CUsTOmER ExpERIEnCE pROFEssIOnAls
Case study: Regence Cracks The Transparency Code 10
© 2012, Forrester Research, Inc. Reproduction prohibited April 4, 2012
Figure 6 Regence Enables Numerous Options For Sorting And Filtering Results
FOR CUsTOmER ExpERIEnCE pROFEssIOnAls
Case study: Regence Cracks The Transparency Code 11
© 2012, Forrester Research, Inc. Reproduction prohibited April 4, 2012
Figure 7 The Cost Estimator Shows Total Member Costs For A Health Service
Source: Forrester Research, Inc.70601
Source: myRegence.com website
Regence’s Cost Estimatorshows service costs atdifferent facilities.
FOR CUsTOmER ExpERIEnCE pROFEssIOnAls
Case study: Regence Cracks The Transparency Code 12
© 2012, Forrester Research, Inc. Reproduction prohibited April 4, 2012
Figure 8 The Total Treatment Cost Estimator Shows A Timeline, Total Costs, And Member Costs
Source: Forrester Research, Inc.70601
Source: myRegence.com website
FOR CUsTOmER ExpERIEnCE pROFEssIOnAls
Case study: Regence Cracks The Transparency Code 13
© 2012, Forrester Research, Inc. Reproduction prohibited April 4, 2012
RegeNCe dRiVes BeTTeR deCisioN-MaKiNg WiTh iTs TRaNspaReNCy sUiTe
Regence’s provider search and cost estimator aren’t just qualitatively different from competitors’; they’re driving meaningful improvements in customer experience, including:
■ High satisfaction levels. Regence tracks user satisfaction through periodic surveys to prove the value of its tools while finding improvement opportunities and new solution ideas. In these surveys, 74% of respondents who have used the transparency tools agree that Regence provides the information they need to make better decisions, compared with only 44% of non-tool-users. Eighty-three percent of respondents say that they’re satisfied with myRegence.com overall, and 87% said that they would return to myRegence.com for future information needs.
■ Meaningful behavioral change. The goal of most provider directory tools is to help members get access to cost-effective care by helping them find in-network doctors and facilities that meet their needs instead of going to more expensive (to both members and Regence) out-of-network providers. Twenty-five percent of survey respondents said that they changed their provider choice based on information they gathered through Regence’s transparency solutions. Sixty percent of transparency solution users agree that Regence helps them control their healthcare costs, compared with only 29% of non-tool-users. In addition, top treatment estimator transactions include comparisons of related services such as vaginal birth versus C-section or colonoscopy at a surgical center versus a hospital, indicating that users are comparing costs before getting treatments.
■ Solid engagement levels from both members and providers. To date, members have posted more than 69,000 provider reviews on the Regence site. Seventy-two percent of survey respondents agree that reviews inform and 65% agree that reviews influence their choice of healthcare treatment or healthcare provider. In addition, one-third of providers listed in the database have updated their profiles, adding elements like practice philosophies, hours, and website URLs. Regence’s goal with these tools, ultimately, is as much to enrich the patient-provider experience as to craft a direct Regence-to-consumer experience. In beta testing of Regence’s cost estimator, 54% of testers said that they would be comfortable printing out Regence’s information and having a discussion with their doctor about cost-effective care.
Next steps: Regence plans Constant improvement and Broader dissemination
Unlike many health insurers whose sites operate on periodic major upgrade cycles, Regence’s tools undergo constant improvement based on post-production testing and user feedback. Based on these inputs and other market forces, Regence plans to:
■ Build tighter integration with cost estimation capabilities. While Regence has created a bridge between its provider directory and cost estimation tools, the team plans to integrate them into a single unified experience so that users can drill into any provider and see common
FOR CUsTOmER ExpERIEnCE pROFEssIOnAls
Case study: Regence Cracks The Transparency Code 14
© 2012, Forrester Research, Inc. Reproduction prohibited April 4, 2012
procedures performed and what they cost — without having to link over to a separate tool. Says Torben Nielsen, “Our philosophy is to build airports, not roads. Users should be able to hop from place to place without having to follow a set route.”
■ Expand the scope of the provider database. The current provider database includes all of Regence’s participating providers, all of those in the extended national BlueCard PPO networks, as well as those out-of-network providers for which Regence has received or paid a claim. Collectively, this covers more than 90% of providers in the country. For outside of the US, it also links out to the BlueCard Worldwide directories. In the future, the team would like the database to grow toward the entire universe of national providers so that users will always get a result — and an in- or out-of-network confirmation — when they search by a doctor’s name. In addition, Regence wants to expand the scope of quality data to include all of the doctors in the database.
■ Generate a higher volume of member feedback. Although Regence has collected more than 69,000 instances of provider feedback, some providers have received no feedback at all or have samples too small to generate confidence in the data. Regence uses tailored messages through email marketing techniques to solicit input from users who have left reviews in the past versus those who haven’t. In addition, it runs promotional campaigns integrated with its broader rewards program to incent users to be among the first three reviewers of a provider who currently lacks any feedback. Past campaigns have generated upward of 185% of the typical weekly review volume.
■ Sell a packaged solution to other Blue Cross and Blue Shield Association plans. Working with the Blue Cross and Blue Shield Association, Regence is already selling its patient review capability to other Blue plans. The Association has also established a national data mart into which all participating licensees can deposit their patient reviews, ultimately enabling participants to offer patient reviews across the national networks.
R e c o m m e n d at i o n s
hoW To appLy RegeNCe’s BesT pRaCTiCes aCRoss iNdUsTRies
Regence’s user-centered design approach is not unusual in leading online industries such as retail and travel. But it’s extremely rare in the health insurance market. Bucking the industry trend takes courage — and a laser focus on user goals rather than simply keeping up with competitors. For customer experience professionals who want to break the mold in lagging customer experience industries:3
■ Start with user needs, not user design preferences. When an established solution exists in the marketplace, it’s tempting to focus user testing on advanced prototypes and slight variations on the norm. But before Regence started building, it used one-on-one interviews

FOR CUsTOmER ExpERIEnCE pROFEssIOnAls
Case study: Regence Cracks The Transparency Code 15
© 2012, Forrester Research, Inc. Reproduction prohibited April 4, 2012
and focus groups to learn what users really need and expect from a health insurance site. Customer experience professionals should remember that just because a practice is widespread, that doesn’t necessarily mean that it meets users’ needs. Nothing can replace open-ended questions about user goals and needs. If designers skip to gathering users’ reaction to prototypes, features, and functions, they risk missing the forest for the trees.4
■ Use data to constantly measure and iterate. Regence realized that even designs based on thorough upfront research rarely result in perfect solutions. That’s why the team constantly measures customer responses to existing features through satisfaction surveys that include both quantitative questions and options for open-ended responses. This allows them to iterate on the existing design to make it more useful and usable and also helps the team identify changing user needs to fuel future design options. Customer experience professionals need to craft measurement programs and design processes that incorporate ongoing feedback to keep solutions fresh and on target with user needs.
■ Trust that giving users the information they need will lead to good choices. One of the reasons health insurance websites struggle is because insurers focus too much on what they want users to do, and not enough on what users want to do. For example, insurers want users to stay in-network, so they only show in-network providers. While well intentioned (in-network providers save both members and insurers money), this practice ultimately alienates users. Regence takes a different tack, giving users the information they need and believing that they will make choices that meet their needs — ultimately building trust and brand loyalty. Customer experience professionals should help decision-makers focus on the bigger picture of how design choices affect not only a single transaction but also the broader customer experience.5
■ Find alternative business models to fuel innovation. Regence’s eBusiness customer experience team includes members with broad-based skills — such as interactive marketing, measurement, and user research specialists — that aren’t typical in the health insurance industry. Part of how the team justifies its size is by designing solutions that not only meet its users’ needs but also can ultimately be packaged and sold to other Blue Cross and Blue Shield plans. This brings a revenue stream to Regence that isn’t part of most teams’ business plans. Customer experience professionals who want to think outside of the experience box should consider these less conventional ways to justify their firms’ investments.6

FOR CUsTOmER ExpERIEnCE pROFEssIOnAls
Case study: Regence Cracks The Transparency Code 16
© 2012, Forrester Research, Inc. Reproduction prohibited April 4, 2012
sUppLeMeNTaL MaTeRiaL
Methodology
Forrester conducted the North American Technographics® Healthcare Online Survey, Q3 2011 (US), fielded in July 2011 of 4,793 US individuals ages 18 to 88. For results based on a randomly chosen sample of this size (N = 4,793), there is 95% confidence that the results have a statistical precision of plus or minus 1.4% of what they would be if the entire population of US online individuals ages 18 and older had been surveyed. Forrester weighted the data by age, gender, income, broadband adoption, and region to demographically represent the adult US online population. The survey sample size, when weighted, was 4,760. (Note: Weighted sample sizes can be different from the actual number of respondents to account for individuals generally underrepresented in online panels.) Please note that this was an online survey. Respondents who participate in online surveys have in general more experience with the Internet and feel more comfortable transacting online. The data is weighted to be representative for the total online population on the weighting targets mentioned, but this sample bias may produce results that differ from Forrester’s offline benchmark survey. The sample was drawn from members of MarketTools’ online panel, and respondents were motivated by receiving points that could be redeemed for a reward. The sample provided by MarketTools is not a random sample. While individuals have been randomly sampled from MarketTools’ panel for this particular survey, they have previously chosen to take part in the MarketTools online panel.
how To get More Technographics data insights
Forrester’s North American Technographics Healthcare Online Survey, Q3 2011 (US), of 4,793 US individuals includes many additional questions and parameters by which you can analyze the data contained in this report. If you wish to subscribe to Forrester’s Consumer Technographics services, please contact your account manager or [email protected]. If you are an existing Technographics client, please contact your data advisor at [email protected]. We can provide additional insights about:
■ Demographics. These include age, gender, household size, geographic location, and income.
■ Insurance status. These include plan type (e.g., PPO, HMO, CDHP), Medicare/Medicaid, individual purchaser, primary carrier (not all carriers have a statistically valid sample size), and prescription drug coverage.
■ Disease and prescription status. These include short-term illness, long-term illness, specific disease states (not all disease states have a statistically valid sample size), and use of prescription drugs.
■ Attitudes. These include opinions about insurance plans and expectations for changes in healthcare costs.

FOR CUsTOmER ExpERIEnCE pROFEssIOnAls
Case study: Regence Cracks The Transparency Code 17
© 2012, Forrester Research, Inc. Reproduction prohibited April 4, 2012
Companies interviewed for This Report
Regence BlueCross BlueShield (Regence)
eNdNoTes1 Site search is a critical but unfulfilling part of website user experiences. As complex as search may
seem, users only need two things for a positive site search experience: relevant results and a useful interface. Today’s leading sites use a number of best practices to help users get what they need, such as using autosuggest to help users select the right search terms, recognizing and helping users recover from misspellings, allowing users to filter results by meaningful criteria, and providing alternative search options where appropriate. To get started, customer experience professionals should design search to work with user-centered language, compensate for unintended errors, and blend the search and browse experience. See the March 5, 2010, “Site Search Best Practices: Methods For Creating A Positive Search Experience” report.
2 For full transparency, Regence distinguishes information it provides from that added by the provider with an asterisk.
3 In Forrester’s 2012 Customer Experience Index (CXi), health insurers, Internet service providers, and TV service providers had the lowest industry average scores. See the January 23, 2012, “The Customer Experience Index, 2012” report.
4 At Forrester’s 2011 Customer Experience Forum, panelists from Bentley Design and Usability Center, frog design, and Wells Fargo shared their experiences using exploratory research techniques. While these firms have long used qualitative ethnographic methods to understand how customers actually behave, what motivates and drives them, as well as what opportunities exist to better meet their needs, these firms have realized additional benefits from their exploratory research. Customer experience professionals who want to get the most from their ethnographic research should include stakeholders in the process of research and develop experience models to widely share their findings. See the August 22, 2011, “What Three Companies Learned From Conducting Ethnographic Research” report.
5 One hotel chain Forrester has interviewed tried to design a site that drove users to book more expensive hotel rooms. However, when it tested a design that allowed users to find the least expensive options, its overall bookings skyrocketed — more than offsetting the lower value of the rooms.
6 Similarly, Cisco System’s Quad collaboration tool was originally designed for internal use, but it is now available as a product to external customers. See the October 13, 2011, “Case Study: Cisco Quad Gives Employees CARS Experiences” report.

Forrester Research, Inc. (nasdaq: FORR) is an independent research company that provides pragmatic and forward-thinking advice to global leaders in business and technology. Forrester works with professionals in 19 key roles at major companies providing proprietary research, customer insight, consulting, events, and peer-to-peer executive programs. For more than 28 years, Forrester has been making IT, marketing, and technology industry leaders successful every day. For more information, visit www.forrester.com. 70601
«
Forrester Focuses OnCustomer Experience Professionals
To improve the perceived quality of customer interactions with your
company, you must leverage emerging digital technologies and lead
enterprise-wide customer experience transformations. Forrester helps
you create forward-thinking strategies to justify decisions and optimize
your individual, team, and corporate performance.
caRl eRickson, client persona representing Customer Experience Professionals
About ForresterGlobal marketing and strategy leaders turn to Forrester to help
them make the tough decisions necessary to capitalize on shifts
in marketing, technology, and consumer behavior. We ensure your
success by providing:
nData-driven insight to understand the impact of changing consumer behavior.
nForward-looking research and analysis to guide your decisions.
nObjective advice on tools and technologies to connect you with customers.
nBest practices for marketing and cross-channel strategy.
foR moRe infoRmation
To find out how Forrester Research can help you be successful every day, please contact the office nearest you, or visit us at www.forrester.com, For a complete list of worldwide locations, visit www.forrester.com/about.
client suppoRt
For information on hard-copy or electronic reprints, please contact Client Support at +1 866.367.7378, +1 617.613.5730, or [email protected]. We offer quantity discounts and special pricing for academic and nonprofit institutions.