case study: san francisco federal building - bcxa.org · case study new san francisco federal...
TRANSCRIPT

Mark Levi
U.S. General Services Administration
Case Study: San Francisco Federal Building

Systems
•
Upper Tower Perimeter: Active Natural Ventilation
•
Upper Tower “Cabins”: UFAD•
Lower Tower: UFAD
•
Annex: Conventional VAV
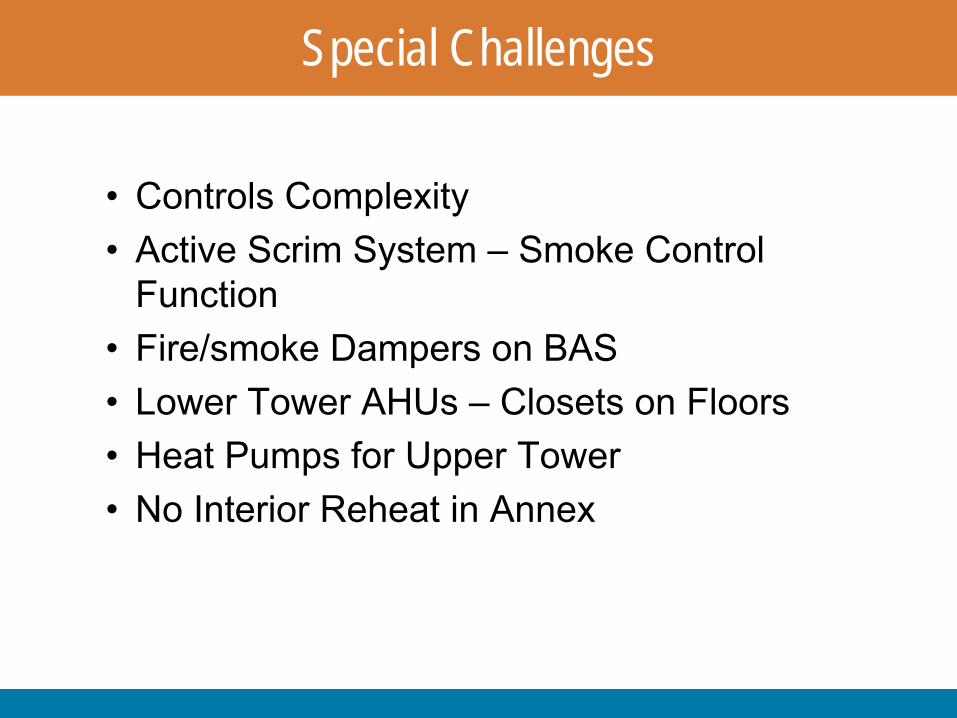
Special Challenges
•
Controls Complexity•
Active Scrim System –
Smoke Control
Function•
Fire/smoke Dampers on BAS
•
Lower Tower AHUs
–
Closets on Floors•
Heat Pumps for Upper Tower
•
No Interior Reheat in Annex

Proactive Efforts
•
Early BAS Programming○
Not followed through by BAS contractor•
Natural Ventilation Simulation by LBNL○
Value lost due to programmer turnover•
Comprehensive Review of Visio Diagrams○
Stalled due to programmer turnover, non-response to comments
•
Commissioning Program○
Delayed functional testing○
Long delay due to bad batch of controllers○
FPTs
after occupancy

Underlying Sources of Problems
•
BAS Contractor Not Prepared for Complexity, Level of Effort
•
BAS Contractor Programmer Turnover •
Product Defect in Firmware –
Contractors Blamed
Electrical, Months Wasted Finding Cause•
Product Substitutions –
Scrim Actuators
•
UFAD Leakage, Thermal Loss Through Slab•
Design Issues: Thermostat Locations, Slab Cooling, Air Circulation, AHU Noise, Etc.
•
Finger-pointing by Parties

Example of Legal Waffling
•
Designer RFI Response (Excerpt) to Scrim Panel Actuator Product Substitution
“[X] takes no exception to the substitution request…With the substitution, [X] will only continue to bear responsibility for the design intent of the sunshade control, but not the design of the wiring or other control design associated with the change in the hardware.”

Energy Performance (Btu/Gsf)
•
SFFB Energy Model: 29,000 btu/gsf•
SFFB CY 2008
47,000 btu/gsf
•
Burton FB (1963) CY 2008 57,000 btu/gsf
•
FB 50 UNP (1933) FY 2006 28,000 btu/gsf

Lessons
•
Complexity + Field Installation Is Precarious•
Complexity Must Be Funded
•
Never Mix Fire/Smoke Systems with BAS•
Has BAS Contractor Read the Specs?
•
Programmer Stability Critical –
BAS Programmer is a Key Person
•
System Problems Can Run Out the Clock


Jonathan Soper, P.E.PrincipalEnovity, Inc.
Case Study New San Francisco Federal Building

Enovity Project Role
•
Commissioning Authority○Contracted during
construction phase in April 2005
•
Operations and Maintenance Contractor○Contracted at Building
Occupancy in Feb 2007
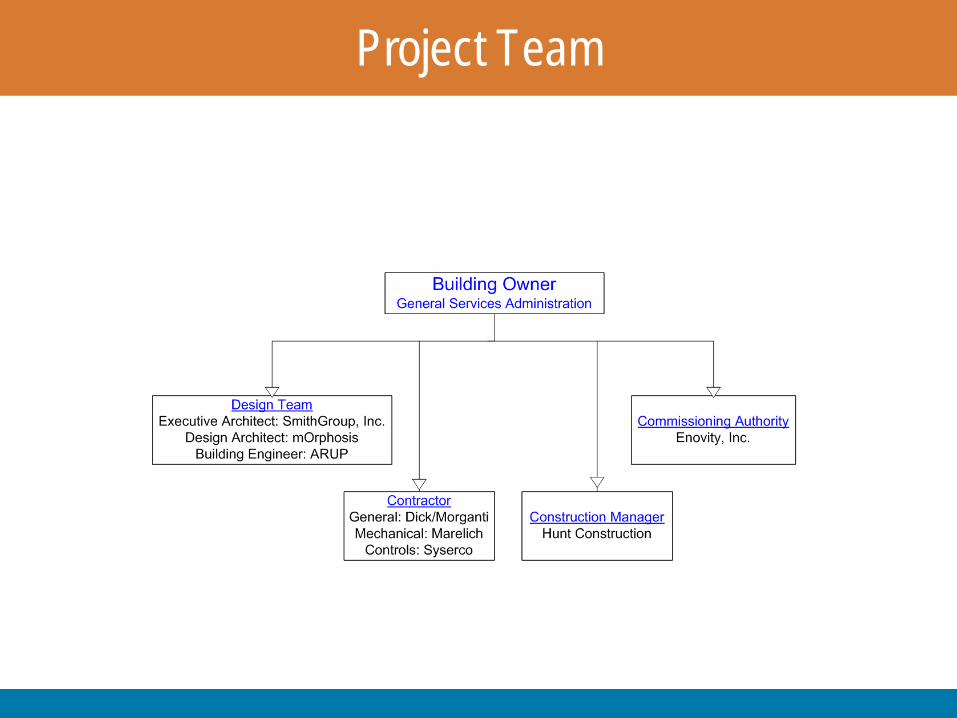
Project Team

Current Project Status
•
Building Occupied for Two Years
•
Construction Phase Cx Complete
•
Outstanding Punch List from Warranty Phase○Enovity
to complete by
Oct 2009

Building Architecture
•
650,000 sq.ft•
Tower•
Annex•
Child Care Center
•
Conference Center
•
Computer Wing
•
Cafeteria•
Sky Garden

Building Architecture Contd
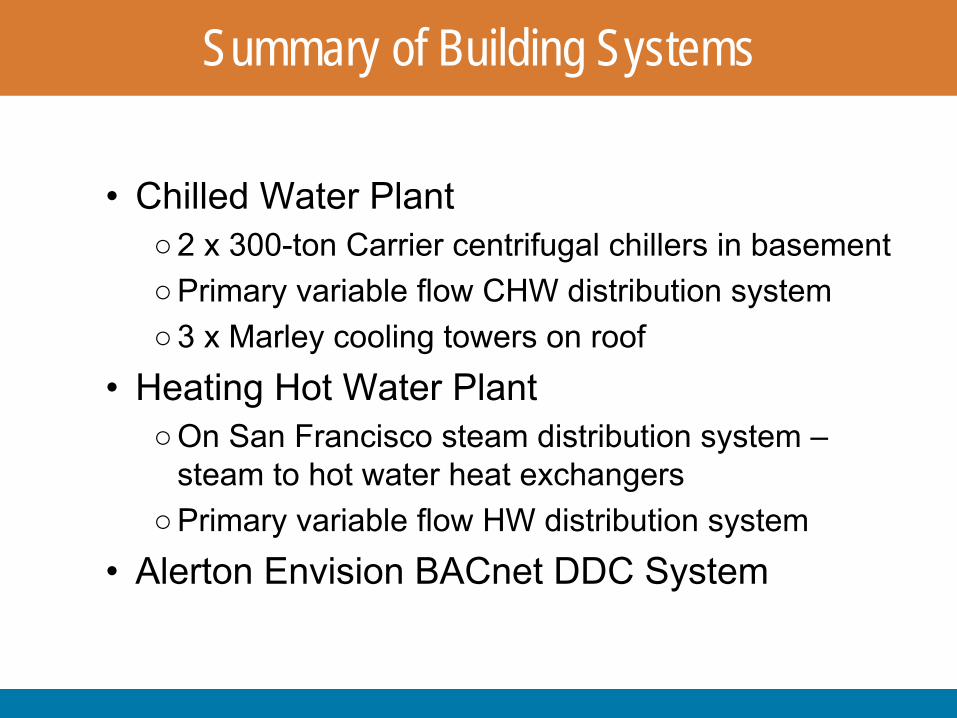
Summary of Building Systems
•
Chilled Water Plant ○2 x 300-ton Carrier centrifugal chillers in basement○Primary variable flow CHW distribution system○3 x Marley cooling towers on roof
•
Heating Hot Water Plant○On San Francisco steam distribution system –
steam to hot water heat exchangers○Primary variable flow HW distribution system
•
Alerton
Envision BACnet
DDC System

Summary of Building Systems Contd.
•
Air Distribution Systems○Traditional VAV overhead systems serves Annex,
Child Care, Conference Center○Under floor VAV built up air handlers serves Tower
floors 2 thru 5○Under floor CV heat pumps serves Tower ‘core’
zones on floors 6 thru 18•
Natural Ventilation System○Natural ventilation system serves Tower ‘perimeter’
zones on floors 6 thru 18

Natural Ventilation System – Morphosis Early Rendition

Natural Ventilation System – System Components

Natural Ventilation System – Fin Tubes & Trickle Vents

Natural Ventilation System – Automatic and Manual Windows
•
UCSD -
Computational Fluid Dynamics shows upward macro flow

Natural Ventilation System – Plan View

Natural Ventilation System – Control System Basics
•
Group windows together •
Closed, half-open or fully-opened positions
•
10 opening modes •
The windward and leeward sides are identified
•
Temperatures, and external pressures measured•
Each half of each floor is independently controlled
•
The system responds to these variables by changing the Mode value by ±1

Natural Ventilation System – ‘Modes’ of Operation
MDN Tric
kle
Ven
ts
Gro
up 1
Gro
up 2
Gro
up 3
Tric
kle
Ven
ts
Gro
up 1
Gro
up 2
Gro
up 3
AST
M
Mode 1 0 0 0 0 0 0 0 0 0Mode 2 1 0 0 0 0.5 0 0 0 0.134
Mode 3 1 0 0 0 0 0.5 0 0 0.265Mode 4 1 1 0 0 0 0.5 0 0 0.521
Mode 5 0 1 0 0 1 0 0 0 0.29Mode 6 0 1 0.5 0 0 0.5 0 0 0.543Mode 7 0 1 0.5 0 0 1 0 0 1Mode 8 0 1 1 1 0 1 0.5 0 2.08Mode 9 0 1 1 1 0 1 0.5 0.5 2.88Mode 10 0 1 1 1 0 1 1 1 3.96
(0= Closed, 0.5= Intermediate position and 1= Open)
Windward Windows Position Leeward Windows Position
Storm Modes
Heating & Rain Modes
Mild Weather & Cooling Modes

SF Outdoor Temperature Behavior
Summer 1% design =78 ºF db/62 ºF wb; Winter 99% design = 39ºF
4045505560657075808590
Jan Feb Mar Apr May Jun Jul Aug Sep Oct Nov Dec
Bars show range of mean max/ mean min
Tem
pera
ture
ºF

SF Outdoor Temperature Behavior
Natural ventilation comfort range superimposed on outdoor air graph
Tem
pera
ture
ºF
4045505560657075808590
Jan Feb Mar Apr May Jun Jul Aug Sep Oct Nov Dec
Need internal pickup of less than 7°F
Comfort range
4 0
4 5
5 0
5 5
6 0
6 5
7 0
7 5
8 0
8 5
9 0
0 .5 2 .5 4 .5 6 .5 8 .5 1 0 .5 1 2 .5

Natural Ventilation System – Commissioning Process
•
Pre-functional Testing○Point to point and sensor location checks ○Sensor calibration checks critical○Over 650 window/ trickle vent actuators to verify
open/closed and 50% position○Verify all window and trickle vent ‘modes’
are
correct before functional testing can begin

Natural Ventilation System – Commissioning Process
•
Functional Testing○Created ‘Commissioning Screen’
on the BAS
○Variables for wind speed, DP, rain sensor, outside air, space and slab temperatures were over-ridden to artificially create the ten (10) ‘Modes’
○Daytime Operation, Night Cooling, Morning Warm- up all were tested
○One half-floor thoroughly tested first then programming downloaded to other floors
○Five re-tests needed before system fully functional

Natural Ventilation System Actual Performance

Natural Ventilation System Actual Performance

Natural Ventilation System Actual Performance
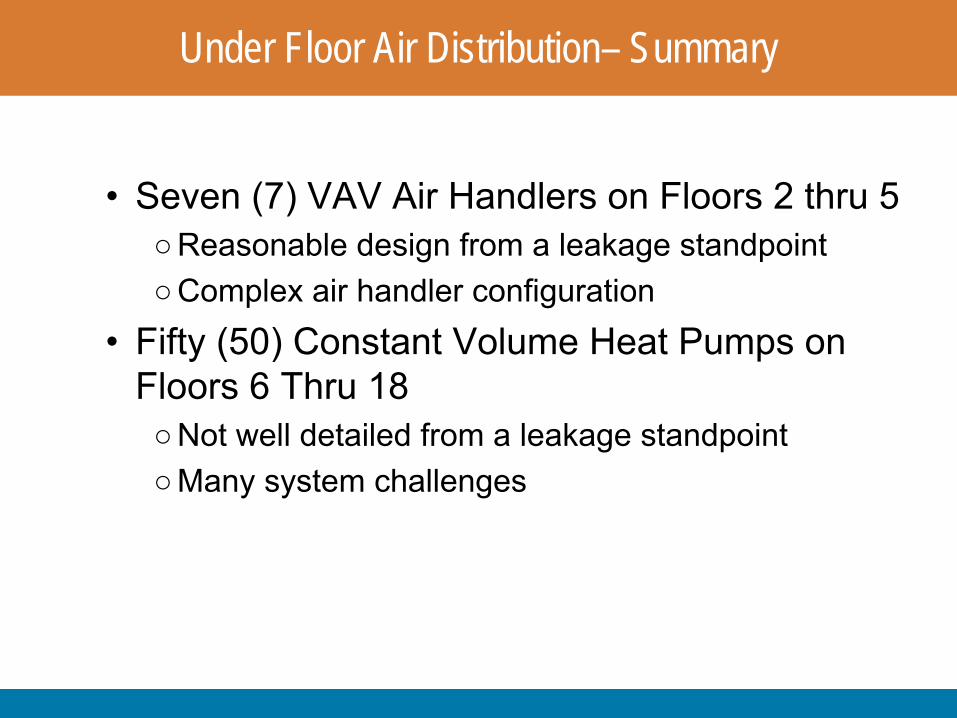
Under Floor Air Distribution– Summary
•
Seven (7) VAV Air Handlers on Floors 2 thru 5○Reasonable design from a leakage standpoint○Complex air handler configuration
•
Fifty (50) Constant Volume Heat Pumps on Floors 6 Thru 18○Not well detailed from a leakage standpoint○Many system challenges

Under Floor VAV Air Handler Details

Under Floor Heat Pump Details

Under Floor System Testing
•
Rigorous Testing on 1 x VAV System and 1 x CV Heat Pump System○ Independent test fan used to pressurize under floor
plenum and measure leakage at different pressures○Category 1 is leakage to unconditioned space and
category 2 is leakage to conditioned space○Very poor results initially (>40% Cat 1) initially and
many leakage paths identified○Smoke test to identify leakage paths○Follow up tests and remediation work required post
occupancy

Testing Technique

Leakage Paths CV Under Floor Heat Pump System

Leakage Paths VAV Under Floor System

Results of Under Floor Testing
Leakage % Leakage Leakage per Area
(cfm) (per Design Airflow) (cfm per sq. ft.)
VAV Vertical Air Handler 0.05 3,267 37% 0.390.07 3,982 45% 0.470.1 4,792 54% 0.57
CV Heat Pump 0.05 1,410 180% 0.670.07 1,757 224% 0.840.1 2,207 282% 1.05
Floor Static Pressure (inches w.c.)
Leakage % Leakage Leakage per Area
(cfm) (per Design Airflow) (cfm per sq. ft.)
Vertical VAV Air Handler 0.05 675 8% 0.080.07 925 10% 0.110.1 1,125 13% 0.13
CV Heat Pump 0.05 340 20% 0.180.07 410 27% 0.220.1 515 31% 0.28
Floor Static Pressure (inches w.c.)
Initial Test ‐ Category 1 Leakage Only
Final Test ‐ Category 1 & 2 Leakage

Testing of Remaining Under Floor Systems
•
Leakage Testing Performed on All Remaining VAV & CV Systems○
CV Heat pump systems -
Cat 1&2 leakage rates generally between 15% & 35% @ 0.08”, two heat pumps as high as 45%
○
Heat pumps supply fans needed to be ramped up above design flows to overcome losses
○
More significant problem with heat pumps is high residence time of air and high supply air temperatures at diffusers
○
VAV Air Handler systems leakage rates between 13% & 25% @ 0.08”, again mostly Cat 2 –
minimal comfort complaints.

Major Outstanding Issues
•
Natural Ventilation System○
Cross flow ventilation creates some cold complaints –
even if space 70 deg.F
‘feels’
colder.
•
Under Floor Systems○
Insufficient cooling capacity in a few of the cabins –
high residence time of air
•
Other○
Chiller over-sized for night time and weekend cooling loads○
Several BAS discrepancies from warranty phase need to be corrected
○
Water side economizer for heat pumps not very effective

Mark LeviGeneral Services Administration (GSA)
(415) 522‐[email protected]
Jonathan SoperEnovity, Inc.
(415) 974‐[email protected]