case study: socialcops + tata trusts in chandrapur
TRANSCRIPT
Microtargeted DevelopmentUsing data intelligence to drive targeted
development for 290 villages in Chandrapur, Maharashtra
with
with multiple local NGOs as implementation partners
Tata Trusts Lead Partner
Hon’ble Minister Sudhir MungantiwarGovernment of Maharashtra
Government Partner
Ashutosh Salil, IASDistrict Collector, Chandrapur
Government Partner
| case study

The Problem1
Driving targeted development in one of India’s most diverse districts
When you have numbers, figures, and data in front of you, you stop shooting in
the dark.
Ashutosh SalilDistrict Collector, Chandrapur Government of Maharashtra
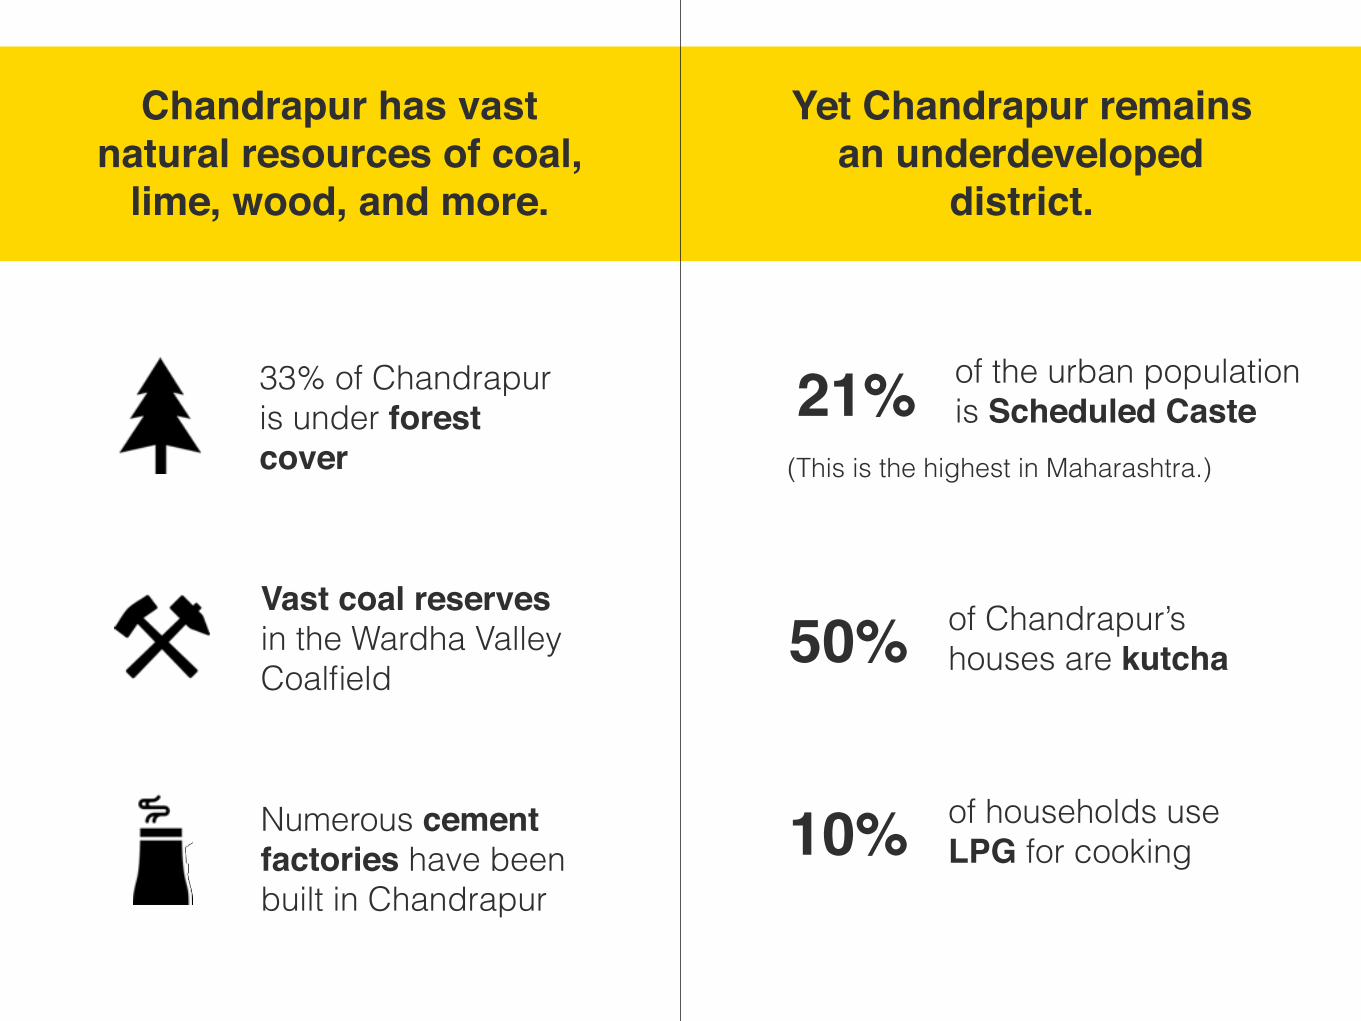
Chandrapur has vast natural resources of coal,
lime, wood, and more.
Yet Chandrapur remains an underdeveloped
district.
33% of Chandrapur is under forest cover
Vast coal reserves in the Wardha Valley Coalfield
Numerous cement factories have been built in Chandrapur
of Chandrapur’s houses are kutcha50%
of households use LPG for cooking10%
of the urban population is Scheduled Caste21%
(This is the highest in Maharashtra.)
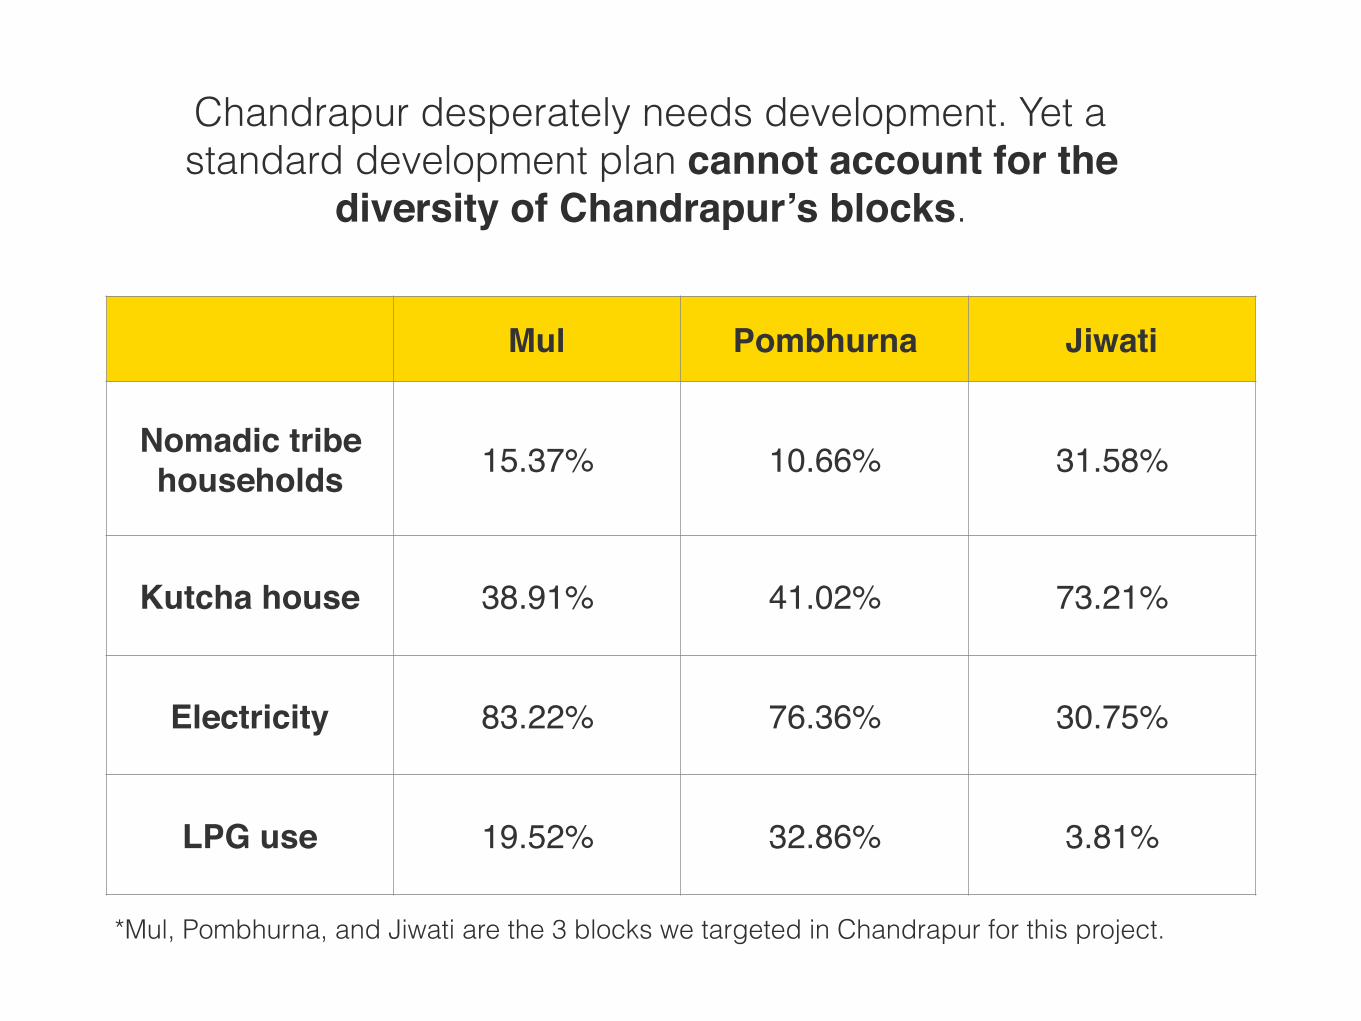
Chandrapur desperately needs development. Yet a standard development plan cannot account for the
diversity of Chandrapur’s blocks.
Mul Pombhurna Jiwati
Nomadic tribe households 15.37% 10.66% 31.58%
Kutcha house 38.91% 41.02% 73.21%
Electricity 83.22% 76.36% 30.75%
LPG use 19.52% 32.86% 3.81%
*Mul, Pombhurna, and Jiwati are the 3 blocks we targeted in Chandrapur for this project.

Not signed up for employment scheme
Needs running water and electricity
Chandrapur’s diversity needs microplanning — unique, targeted development plans for every individual, household,
village, and block.
Needs electricity
Toilet not functionalNot included in
food distribution
No toilet

However, this wasn’t the only issue. There were
4 additional challenges
to deal with…
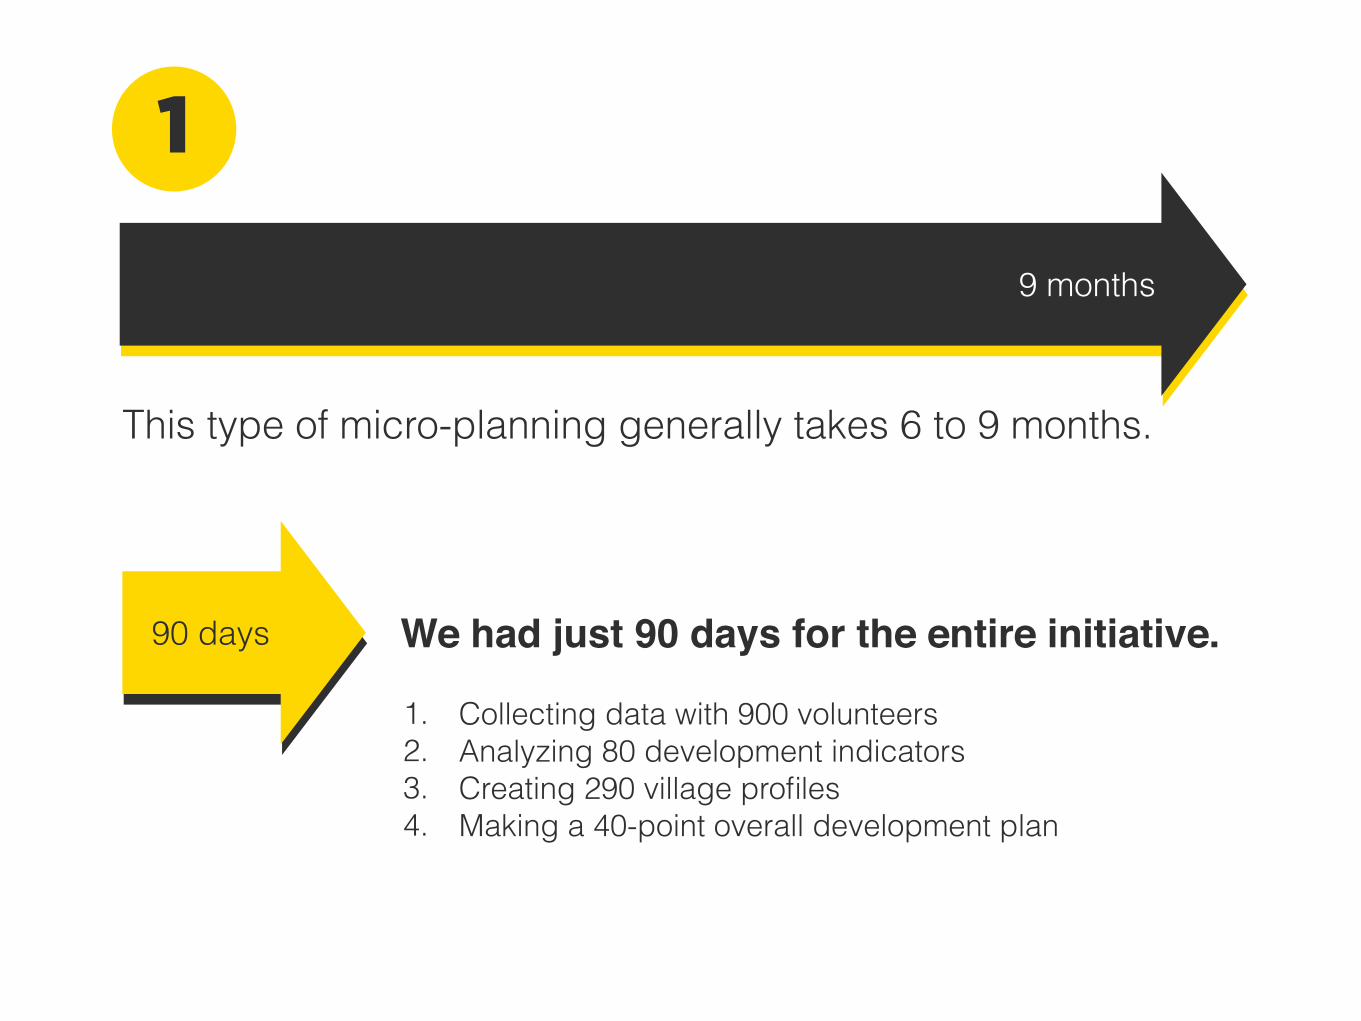
This type of micro-planning generally takes 6 to 9 months.
9 months
We had just 90 days for the entire initiative.90 days
1. Collecting data with 900 volunteers 2. Analyzing 80 development indicators 3. Creating 290 village profiles 4. Making a 40-point overall development plan
1
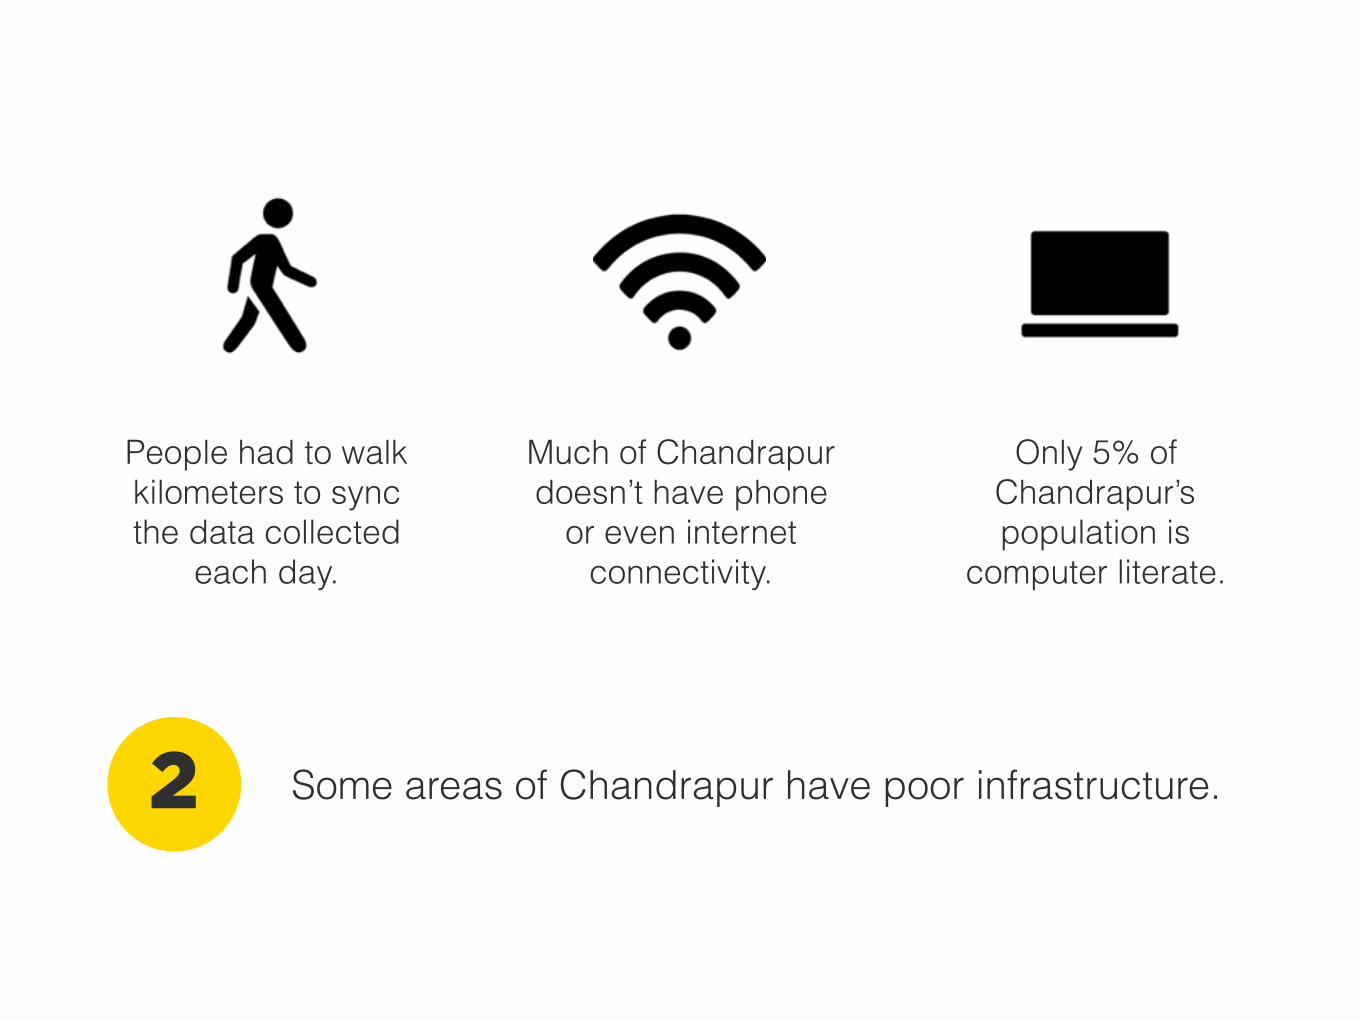
Some areas of Chandrapur have poor infrastructure.2
People had to walk kilometers to sync the data collected
each day.
Only 5% of Chandrapur’s population is
computer literate.
Much of Chandrapur doesn’t have phone
or even internet connectivity.
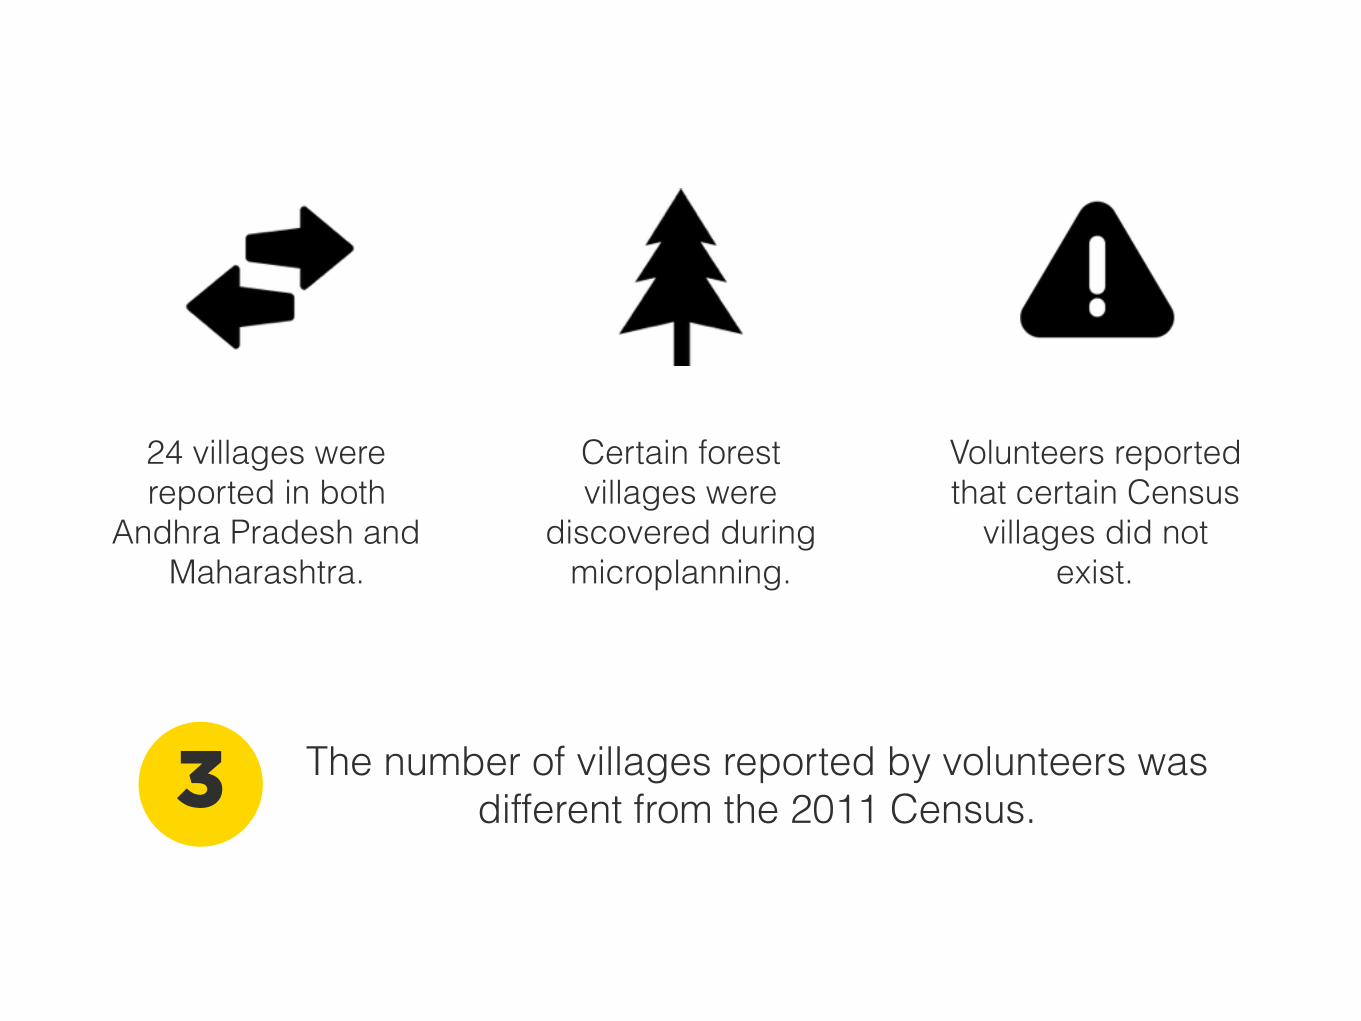
The number of villages reported by volunteers was different from the 2011 Census. 3
24 villages were reported in both
Andhra Pradesh and Maharashtra.
Volunteers reported that certain Census
villages did not exist.
Certain forest villages were
discovered during microplanning.

Blocks had different population demographics, so different government schemes applied to each block.4

Our Solution2
Using data intelligence for targeted, data-driven policies
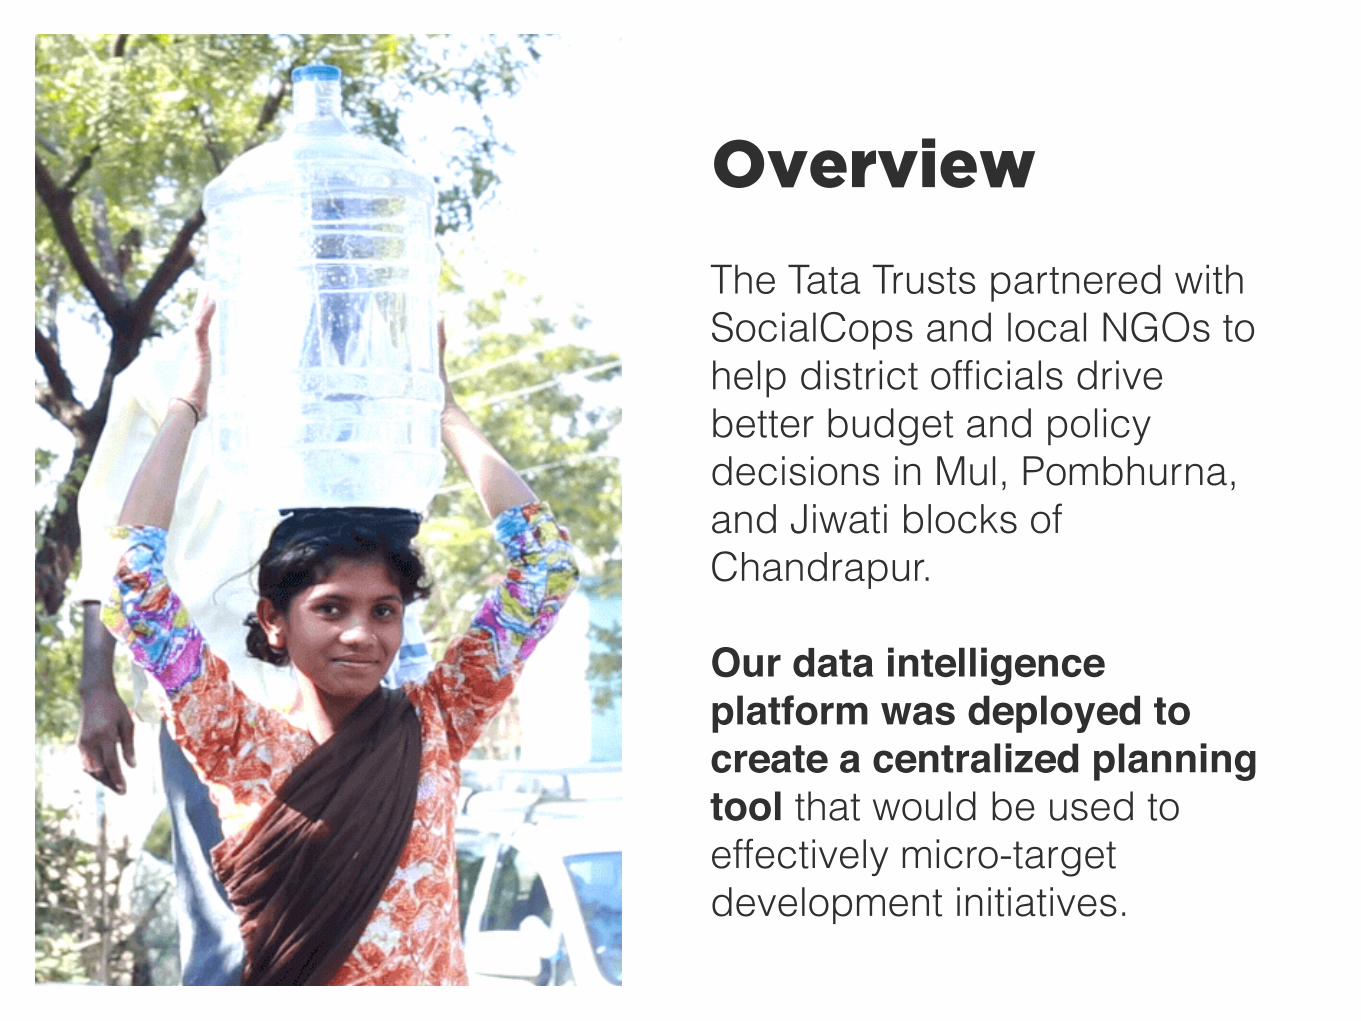
The Tata Trusts partnered with SocialCops and local NGOs to help district officials drive better budget and policy decisions in Mul, Pombhurna, and Jiwati blocks of Chandrapur.
Our data intelligence platform was deployed to create a centralized planning tool that would be used to effectively micro-target development initiatives.
Overview
1. The absence of unintended changes or errors in some data. Integrity implies that the data is an exact copy of some original version, e.g. that it has not been corrupted in the process of being written to, and read back from, a hard disk or during transmission via some communications channel.
data jack (ˈdadǝ jak) n.
1. A wall-mounted or desk-mounted connector (frequently a wide telephone-style 8-pin RJ-45 ) for connecting to data cabling in a building.
Data Intelligence
data intelligence (ˈdadǝ inˈtelǝjǝns) n.
1. The process of transforming all available data — collected from the ground up, sourced from external data sets, and extracted from elaborate internal systems — into intelligent insights that make the best decision crystal clear.
2. The only logical way to make a decision in the twenty-first century.
data link layer (ˈdadǝ lingk ˈlāər) n.
1. Layer two, the second lowest layer in the OSI seven layer model. The data link layer splits data into frames (see fragmentation ) for sending on the physical layer and receives acknowledgement frames. It performs error checking and re-transmits frames not received correctly. It provides an error-free virtual channel to the network layer. The data link layer is split into an upper sublayer, Logical Link Control (LLC), and a lower sublayer, Media Access Control (MAC). one-
Our Platform
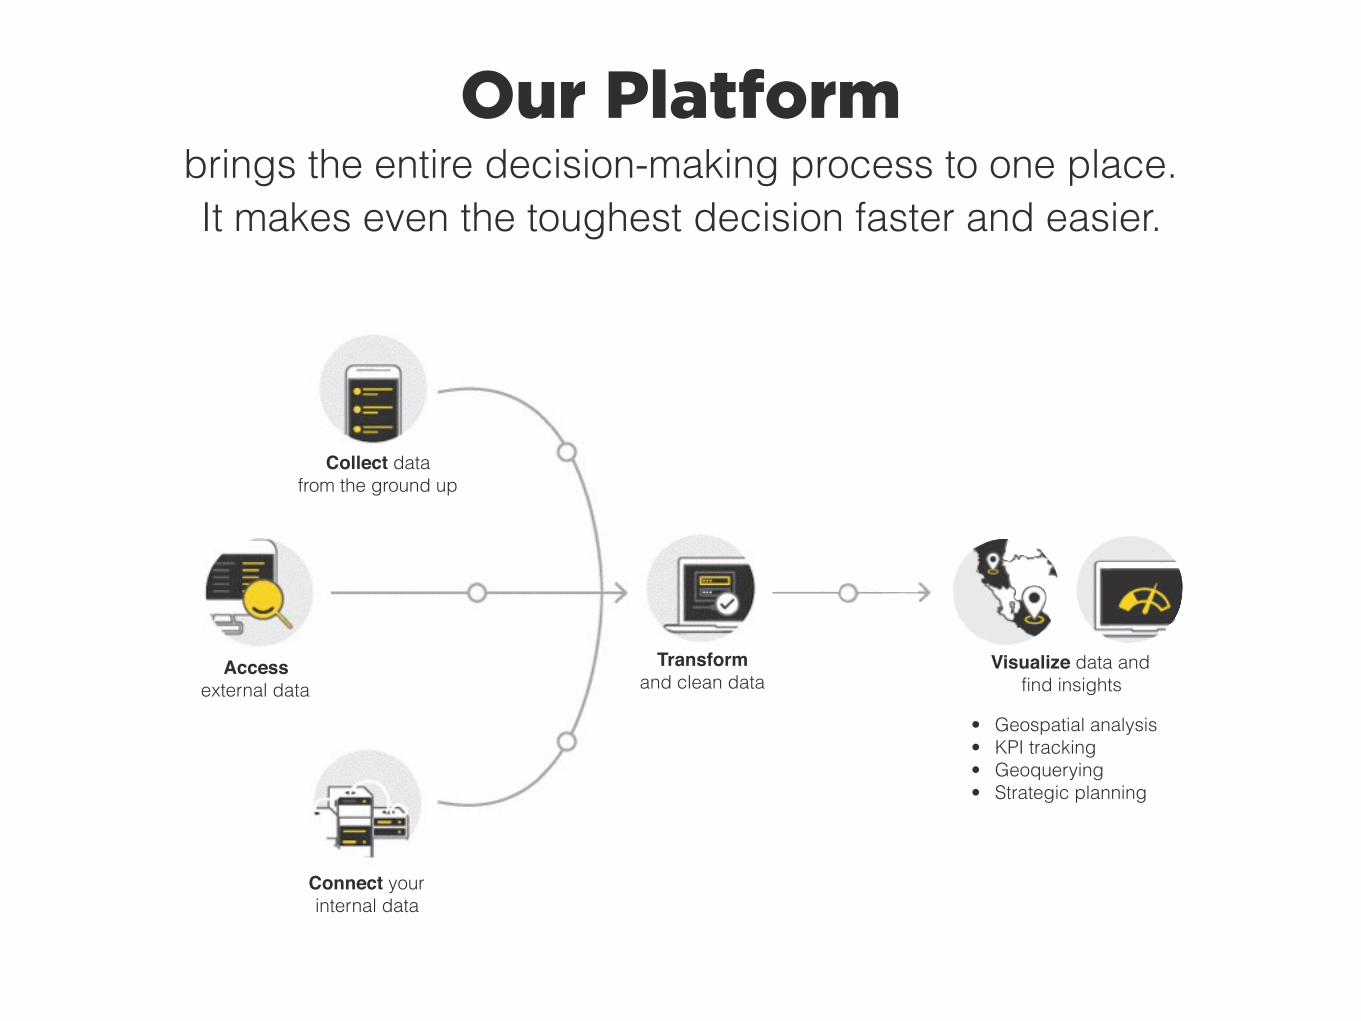
brings the entire decision-making process to one place. It makes even the toughest decision faster and easier.
Access external data
Collect data from the ground up
Connect your internal data
Visualize data and find insights
Transform and clean data
• Geospatial analysis • KPI tracking • Geoquerying • Strategic planning
Our Platform
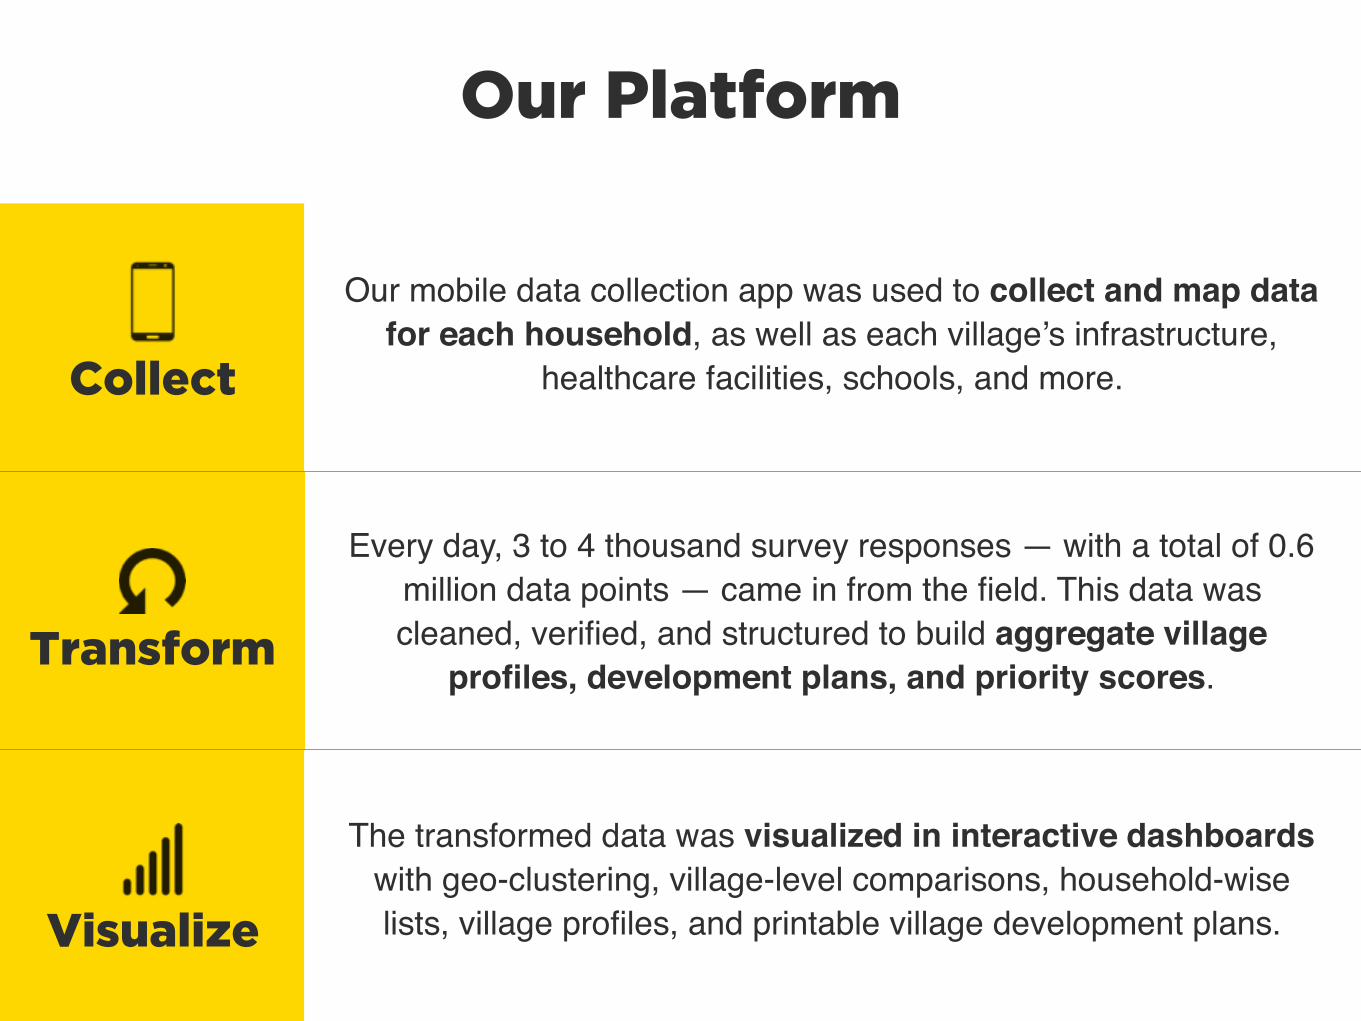
Our mobile data collection app was used to collect and map data for each household, as well as each village’s infrastructure,
healthcare facilities, schools, and more.
Every day, 3 to 4 thousand survey responses — with a total of 0.6 million data points — came in from the field. This data was cleaned, verified, and structured to build aggregate village
profiles, development plans, and priority scores.
The transformed data was visualized in interactive dashboards with geo-clustering, village-level comparisons, household-wise lists, village profiles, and printable village development plans.
Collect
Visualize
Transform
Our Process
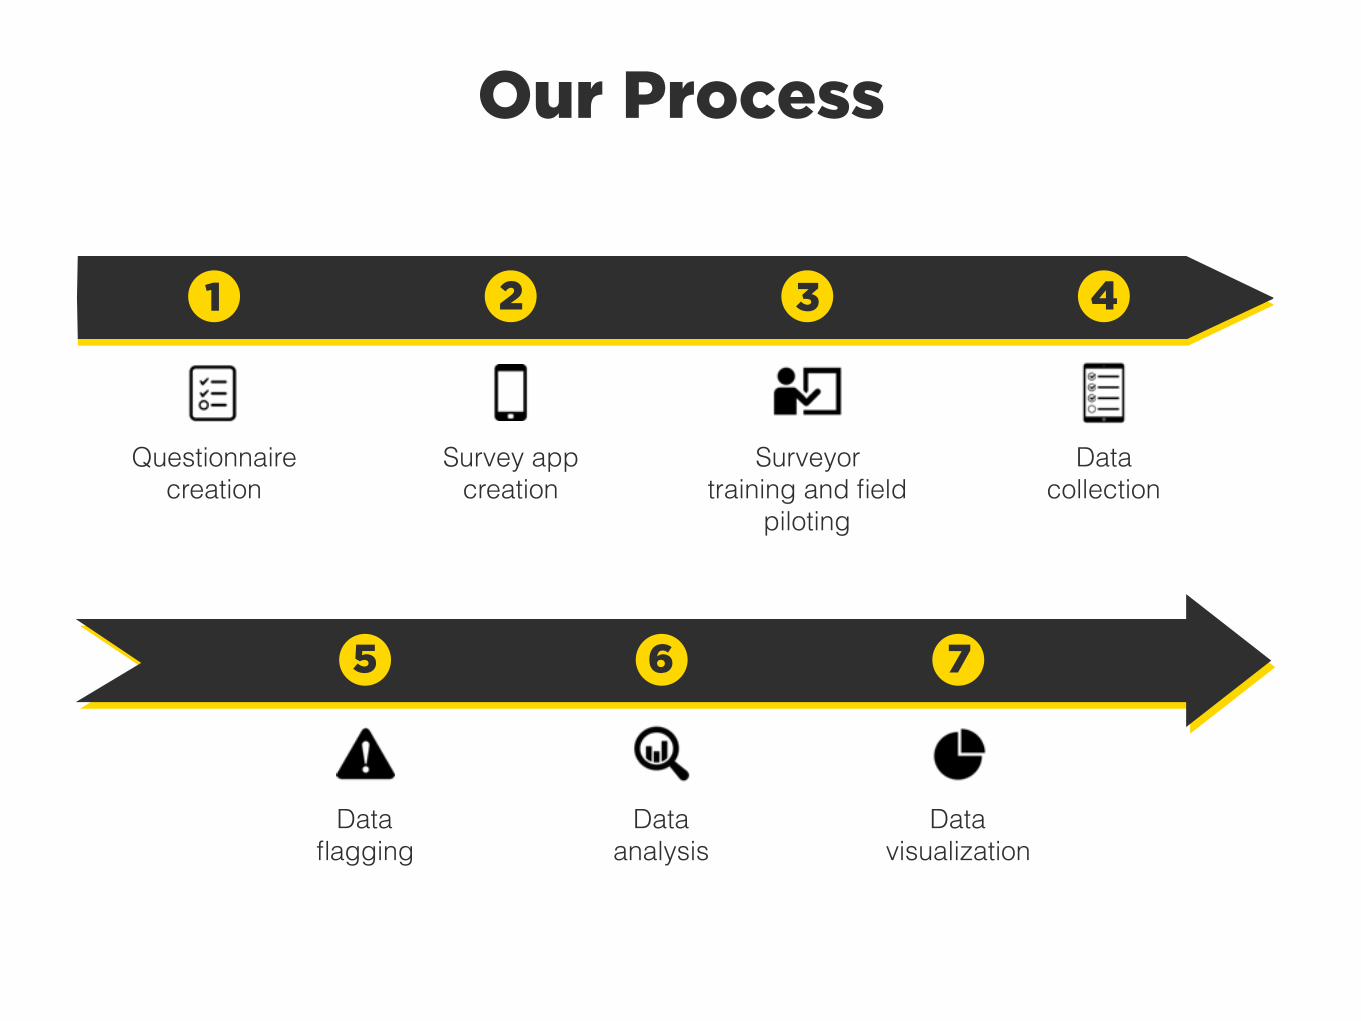
1 2 3 4
Survey app creation
Questionnaire creation
Surveyor training and field
piloting
Data collection
5 6 7
Data analysis
Data flagging
Data visualization
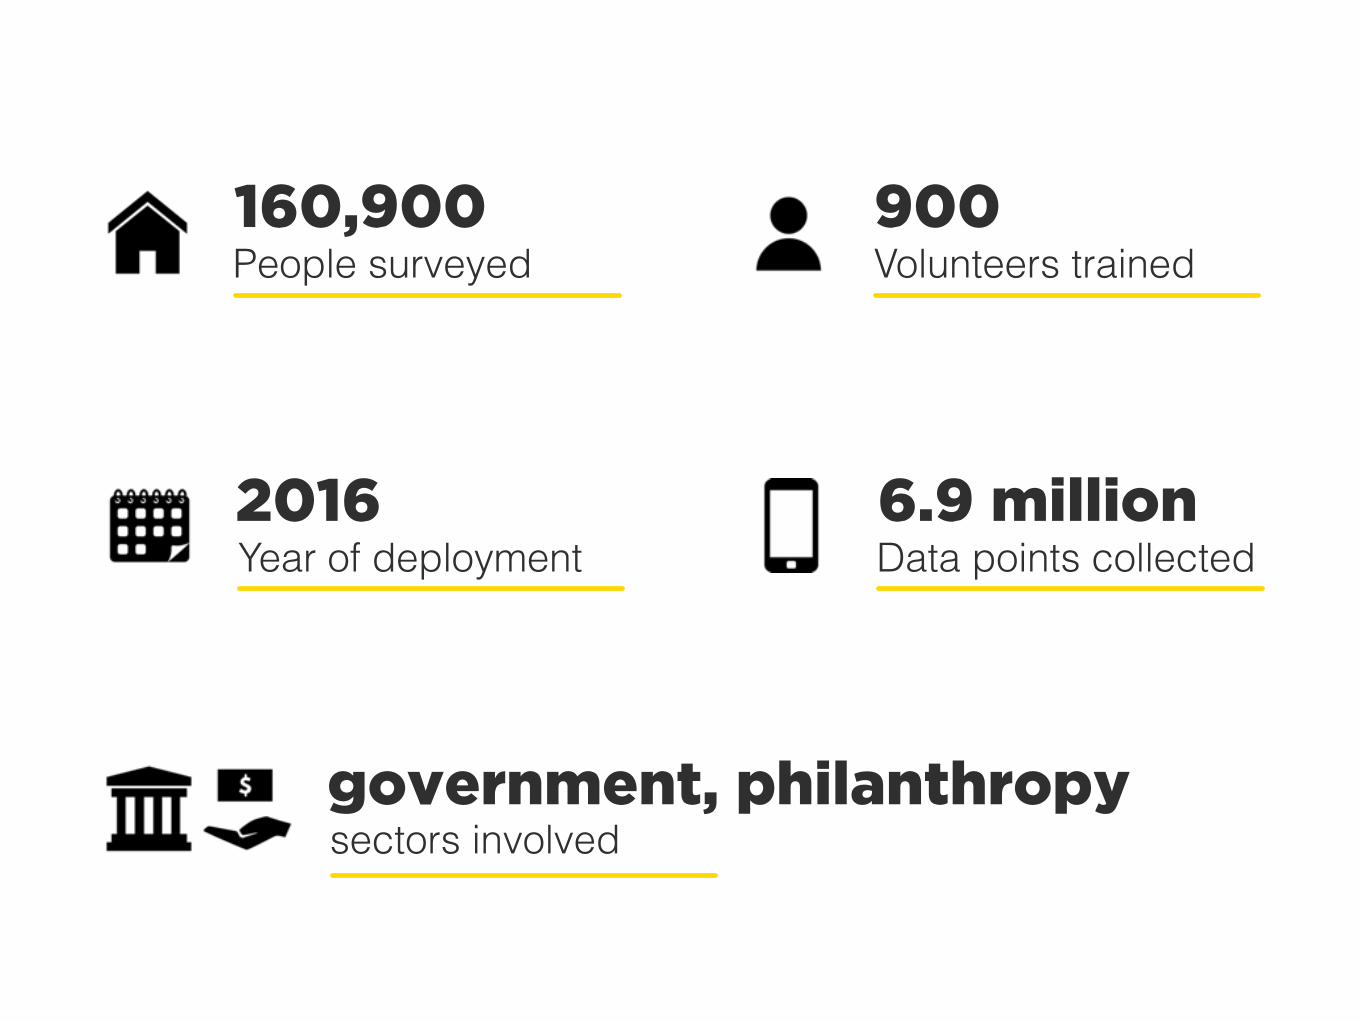
People surveyed900Volunteers trained
160,900
2016Year of deployment
6.9 millionData points collected
government, philanthropysectors involved
The Story3
7 million data points, 290 villages, and 900 surveyors
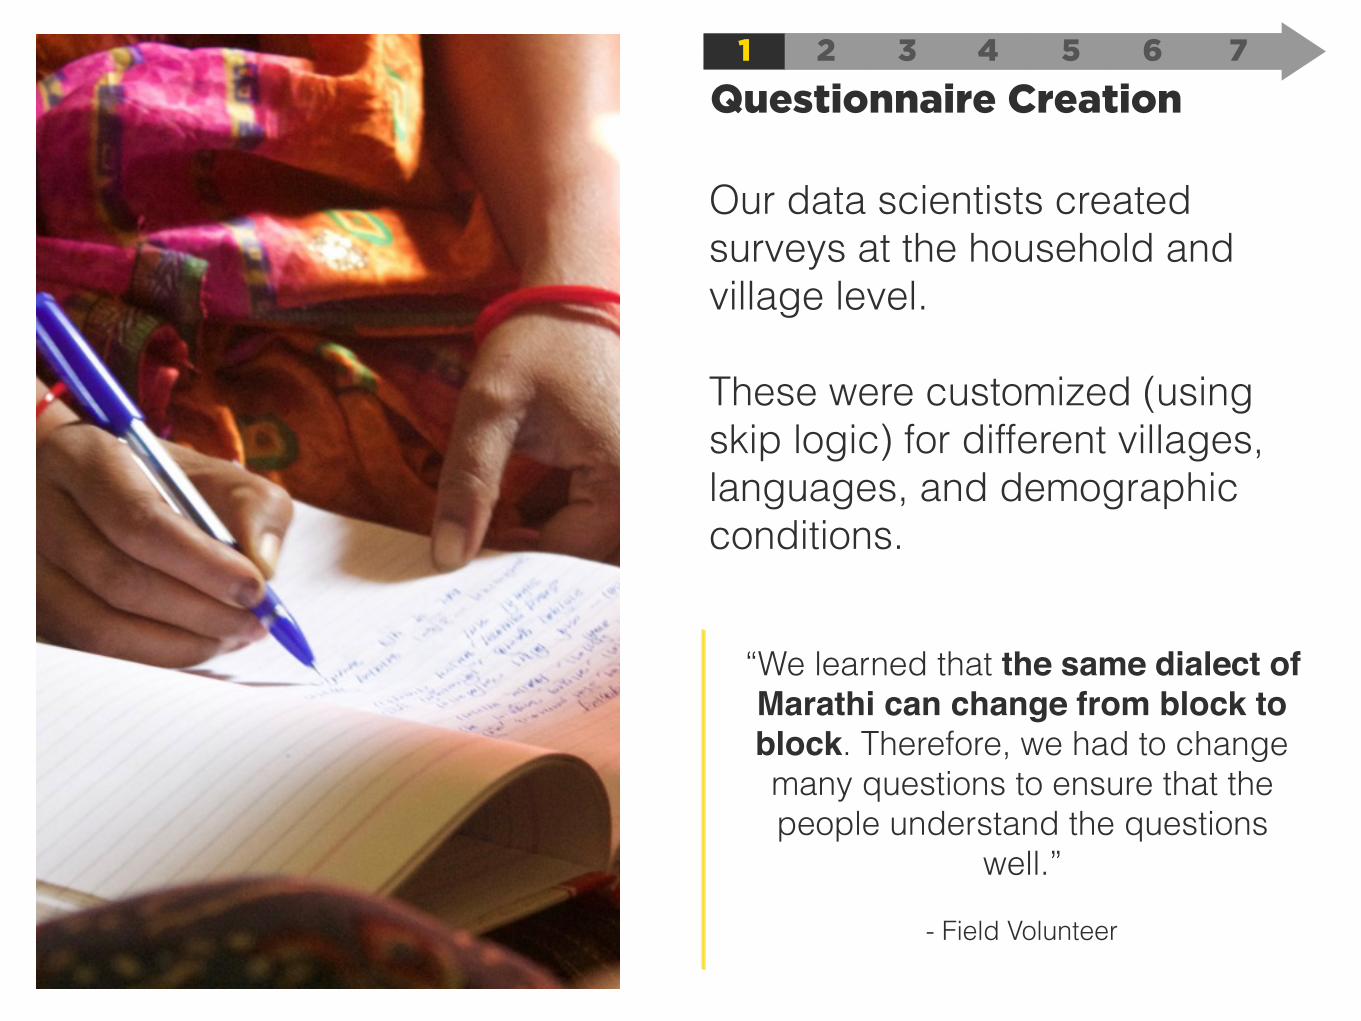
Our data scientists created surveys at the household and village level.
These were customized (using skip logic) for different villages, languages, and demographic conditions.
1 2
Questionnaire Creation3 4 5 6 7
“We learned that the same dialect of Marathi can change from block to block. Therefore, we had to change many questions to ensure that the people understand the questions
well.”
- Field Volunteer
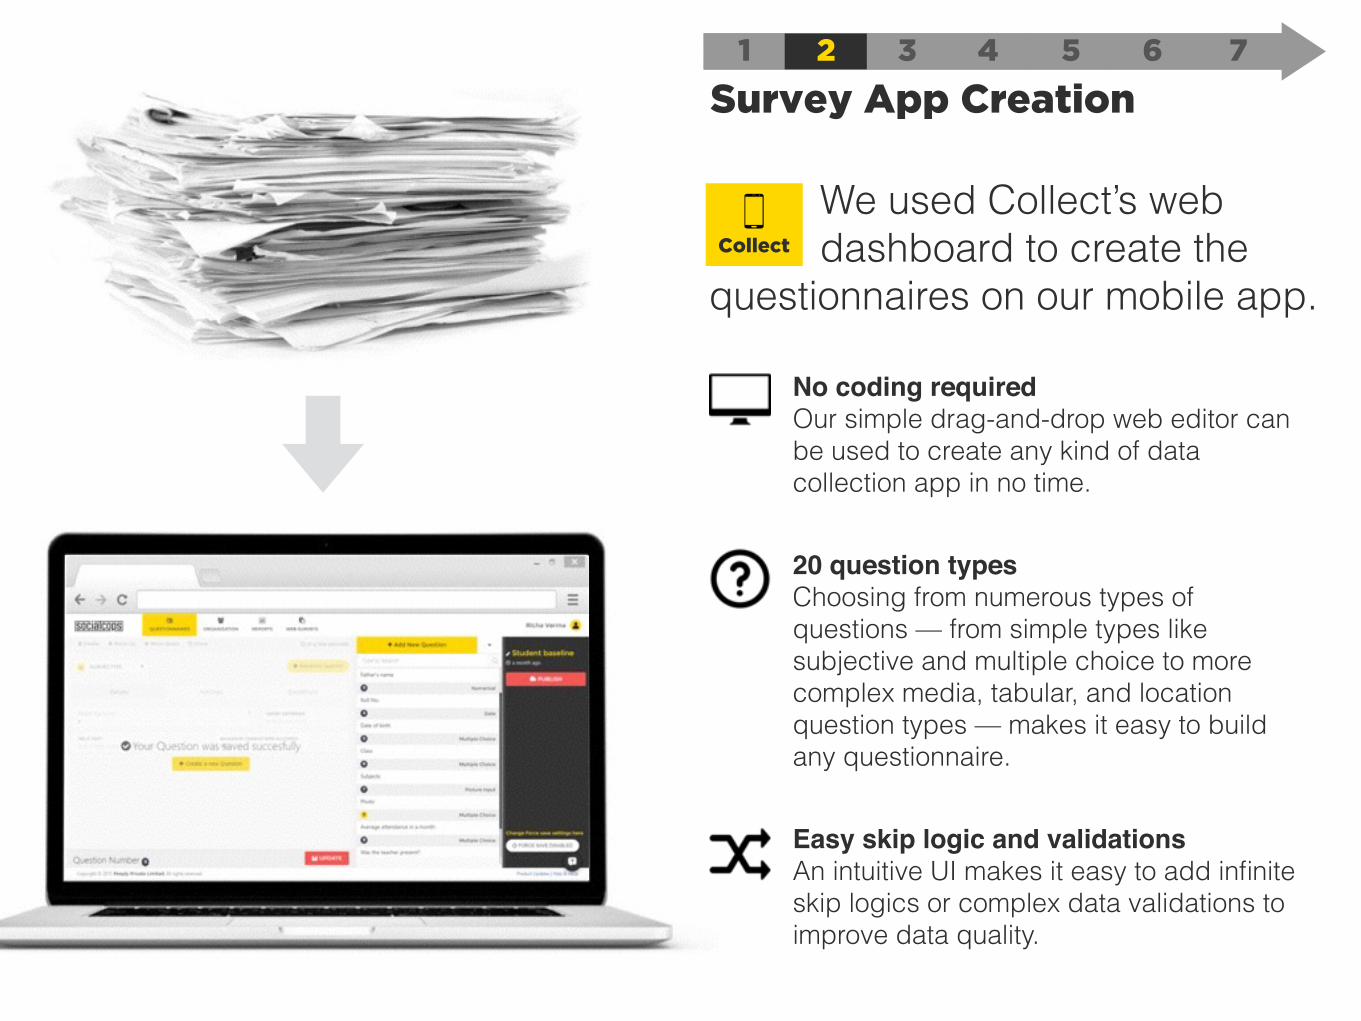
We used Collect’s web dashboard to create the questionnaires on our mobile app.
1 2
Survey App Creation3 4 5 6 7
No coding requiredOur simple drag-and-drop web editor can be used to create any kind of data collection app in no time.
Easy skip logic and validationsAn intuitive UI makes it easy to add infinite skip logics or complex data validations to improve data quality.
20 question typesChoosing from numerous types of questions — from simple types like subjective and multiple choice to more complex media, tabular, and location question types — makes it easy to build any questionnaire.
Collect
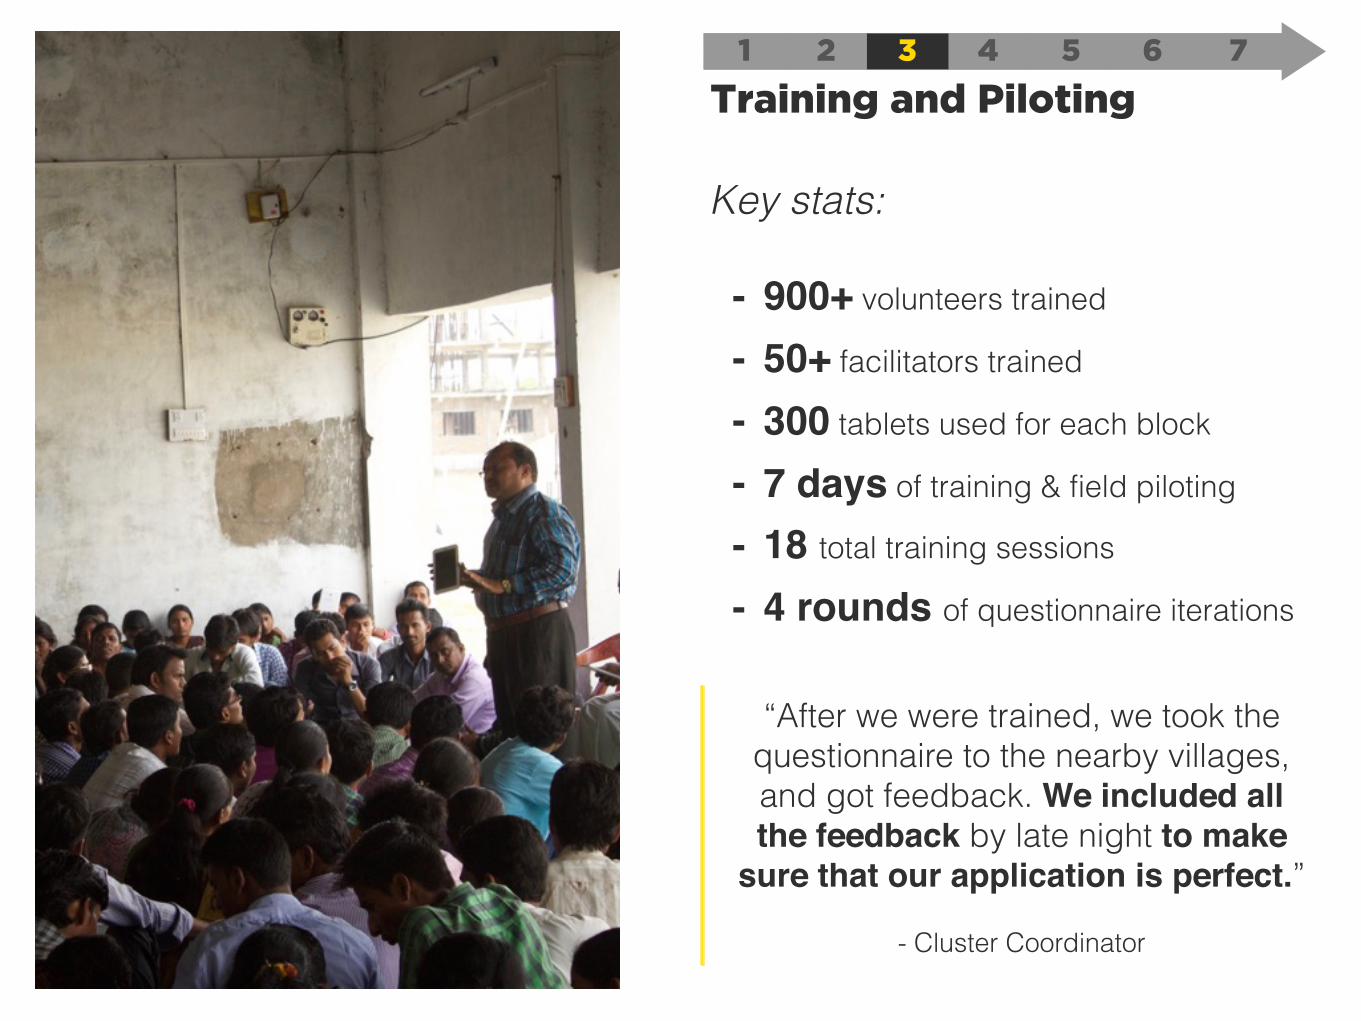
Key stats:
- 900+ volunteers trained
- 50+ facilitators trained
- 300 tablets used for each block
- 7 days of training & field piloting
- 18 total training sessions
- 4 rounds of questionnaire iterations
1 2
Training and Piloting3 4 5 6 7
“After we were trained, we took the questionnaire to the nearby villages, and got feedback. We included all the feedback by late night to make
sure that our application is perfect.”
- Cluster Coordinator
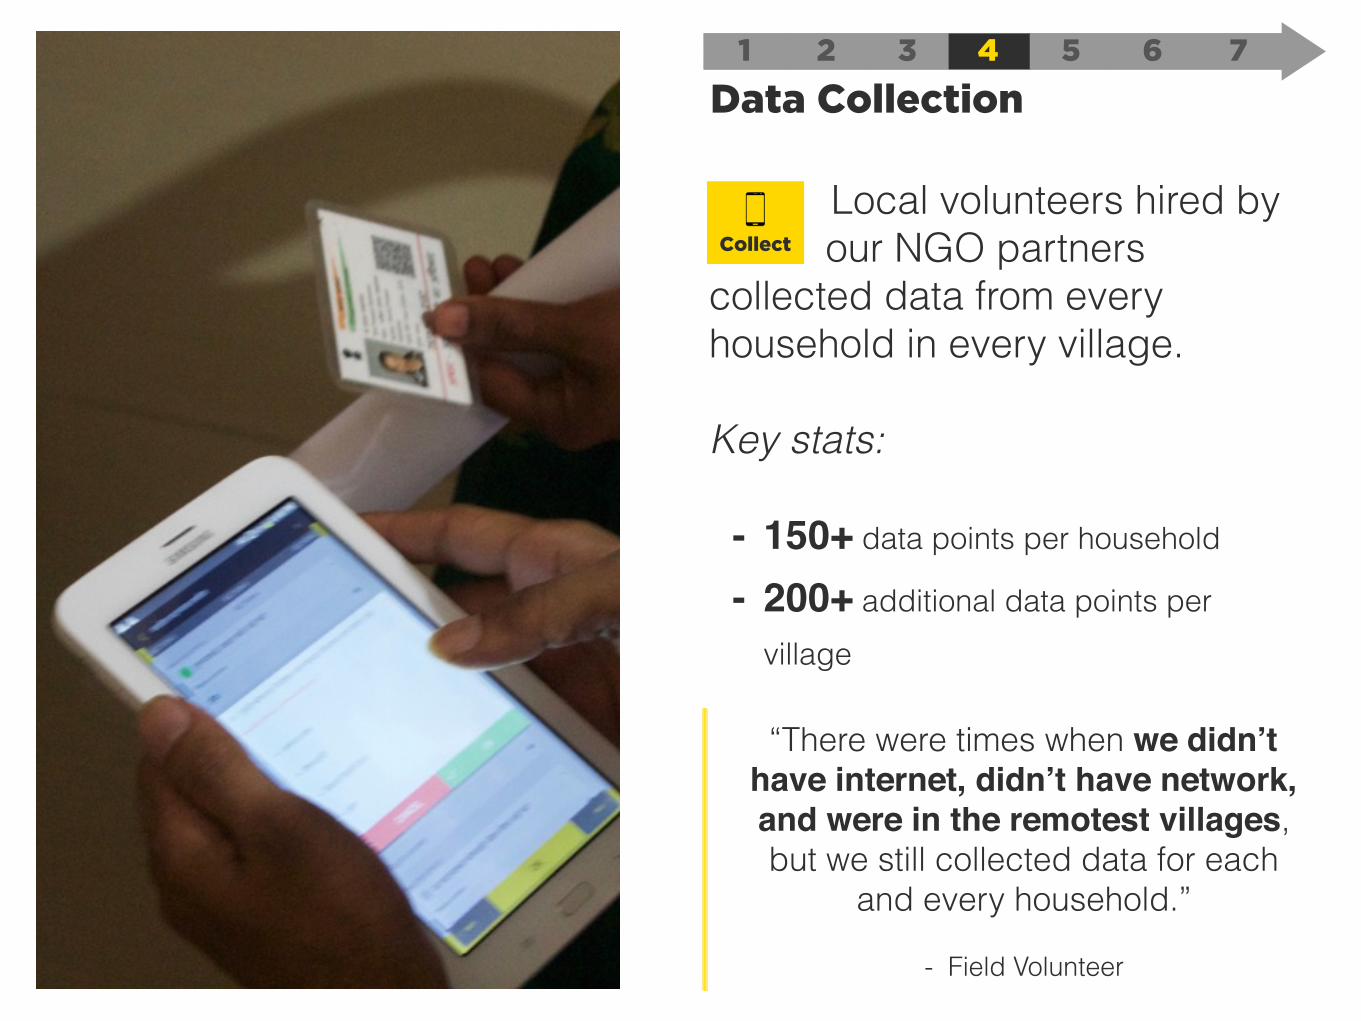
Local volunteers hired by our NGO partners collected data from every household in every village.
Key stats:
- 150+ data points per household
- 200+ additional data points per village
1 2
Data Collection3 4 5 6 7
Collect
“There were times when we didn’t have internet, didn’t have network, and were in the remotest villages, but we still collected data for each
and every household.”
- Field Volunteer

No internet requiredMany parts of Chandrapur did not have mobile or internet service. Data collected offline was continuously saved to tablets’ local storage, then synced to central servers when internet was available.
Marati language Many surveyors only spoke Marati. The entire Collect app — including action buttons and instructions — was converted to Marati language by simply changing the language setting.
Custom geotaggingEvery household was geotagged on a map using GPS, even without internet. Every survey was collected at a specific location to get the location details of school, anganwadi, health centre, etc. in 3 blocks.
1 2
Data Collection3 4 5 6 7
Gollapudi
Name of Village
Ambapuram
Paidurupadu
Rayanapadu
Shahabad
Vemavaram
Enikepadu
Nunna
Collect
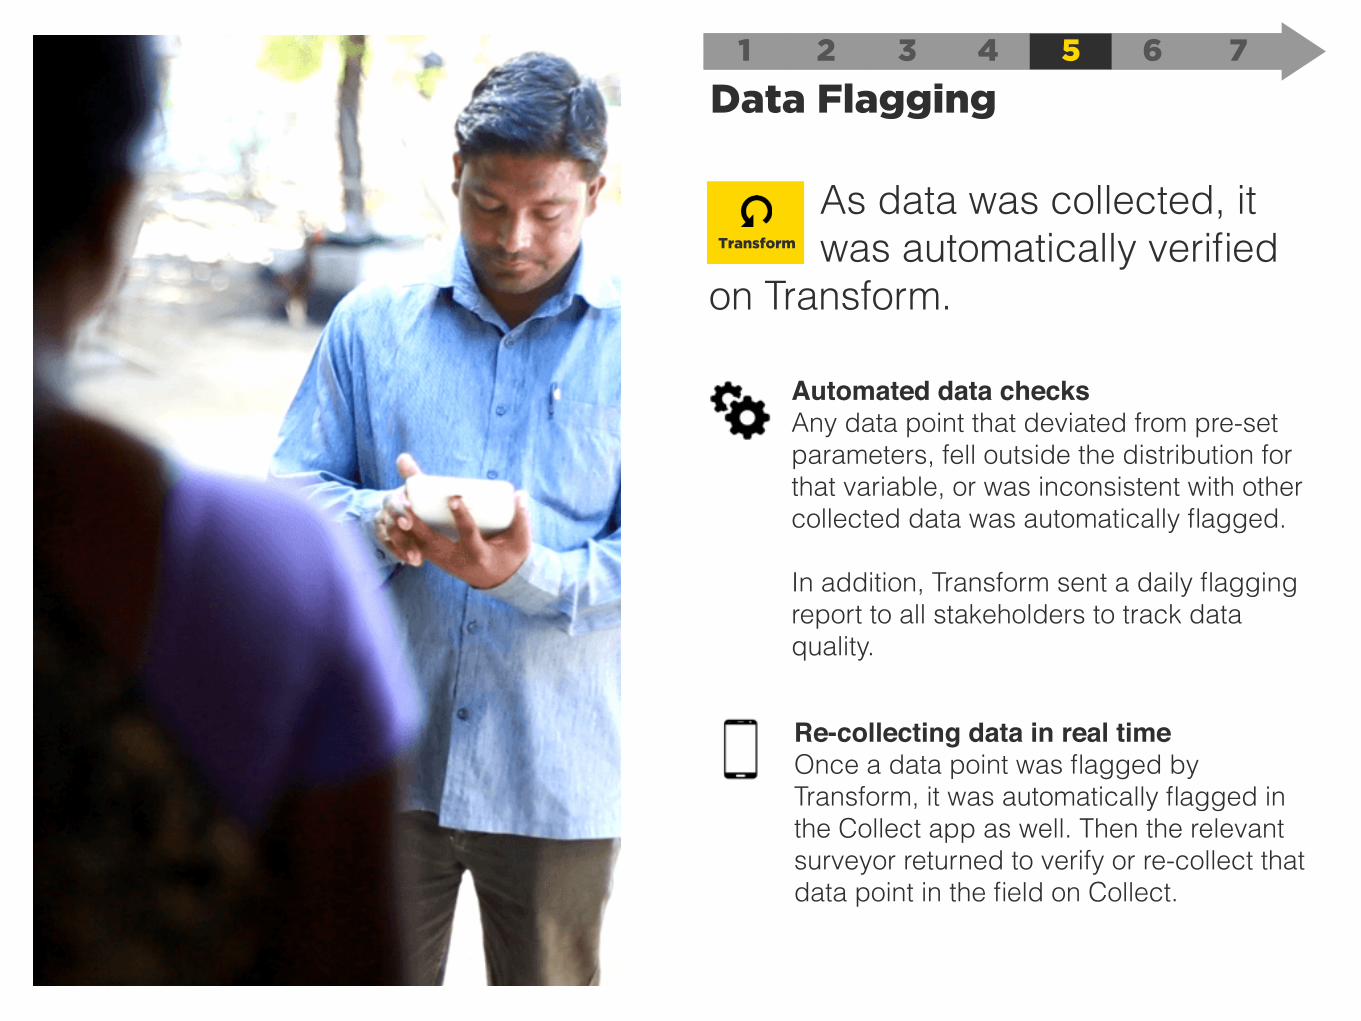
As data was collected, it was automatically verified on Transform.
1 2
Data Flagging3 4 5 6 7
Transform
Automated data checksAny data point that deviated from pre-set parameters, fell outside the distribution for that variable, or was inconsistent with other collected data was automatically flagged.
In addition, Transform sent a daily flagging report to all stakeholders to track data quality.
Re-collecting data in real timeOnce a data point was flagged by Transform, it was automatically flagged in the Collect app as well. Then the relevant surveyor returned to verify or re-collect that data point in the field on Collect.
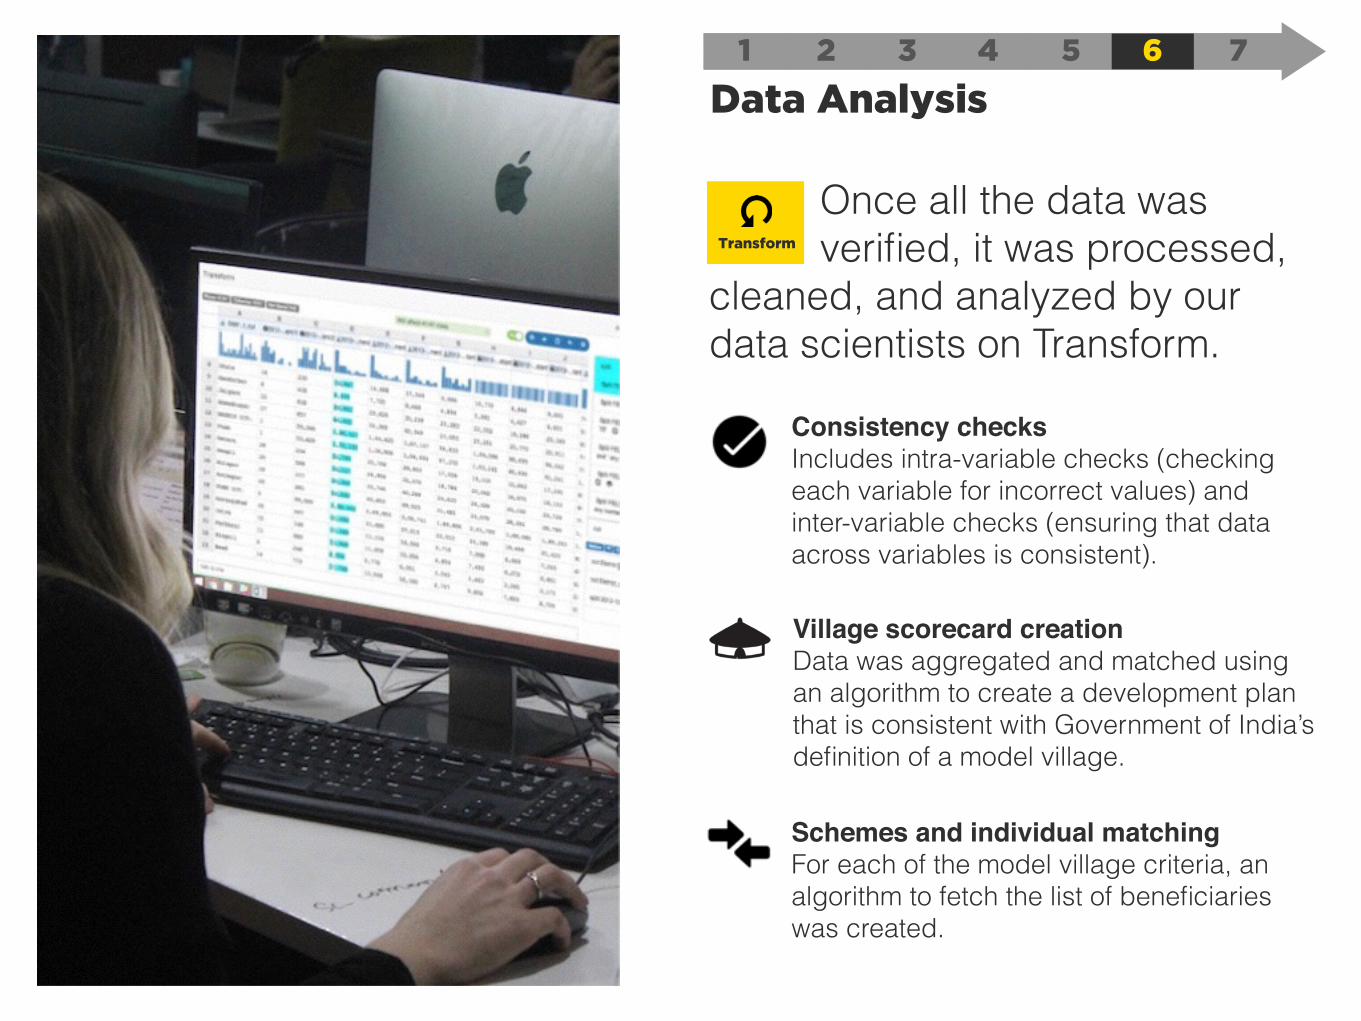
Once all the data was verified, it was processed, cleaned, and analyzed by our data scientists on Transform.
1 2
Data Analysis3 4 5 6 7
Transform
Consistency checksIncludes intra-variable checks (checking each variable for incorrect values) and inter-variable checks (ensuring that data across variables is consistent).
Schemes and individual matchingFor each of the model village criteria, an algorithm to fetch the list of beneficiaries was created.
Village scorecard creationData was aggregated and matched using an algorithm to create a development plan that is consistent with Government of India’s definition of a model village.
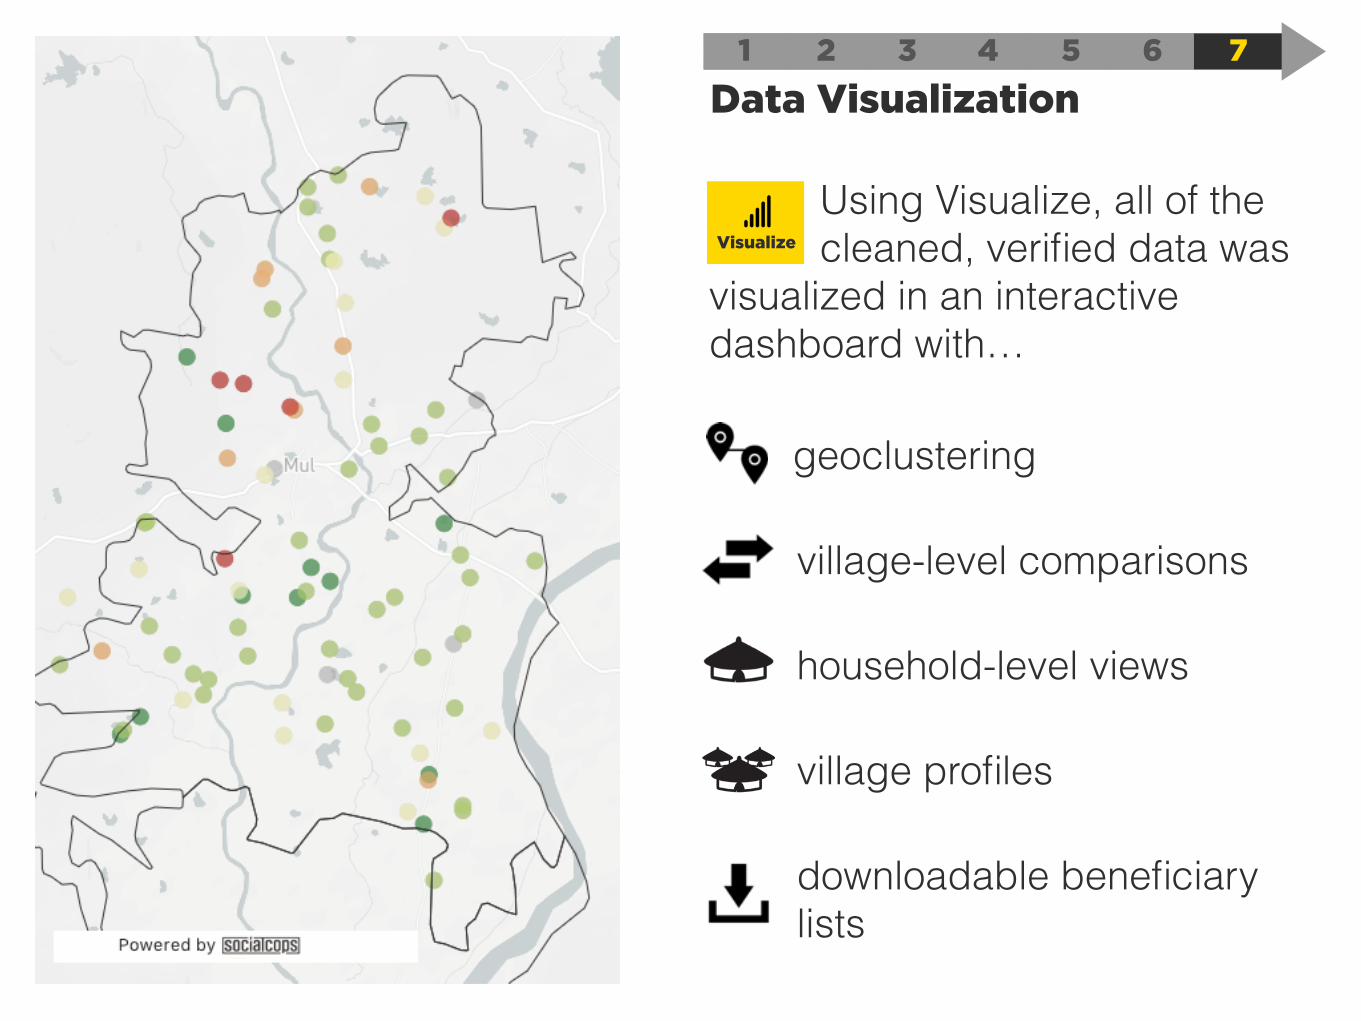
Using Visualize, all of the cleaned, verified data was visualized in an interactive dashboard with…
1 2
Data Visualization3 4 5 6 7
geoclustering
village-level comparisons
household-level views
village profiles
Visualize
downloadable beneficiary lists

1 2
Data Visualization3 4 5 6 7
View insights for each blockVisualize
1 2
Data Visualization3 4 5 6 7
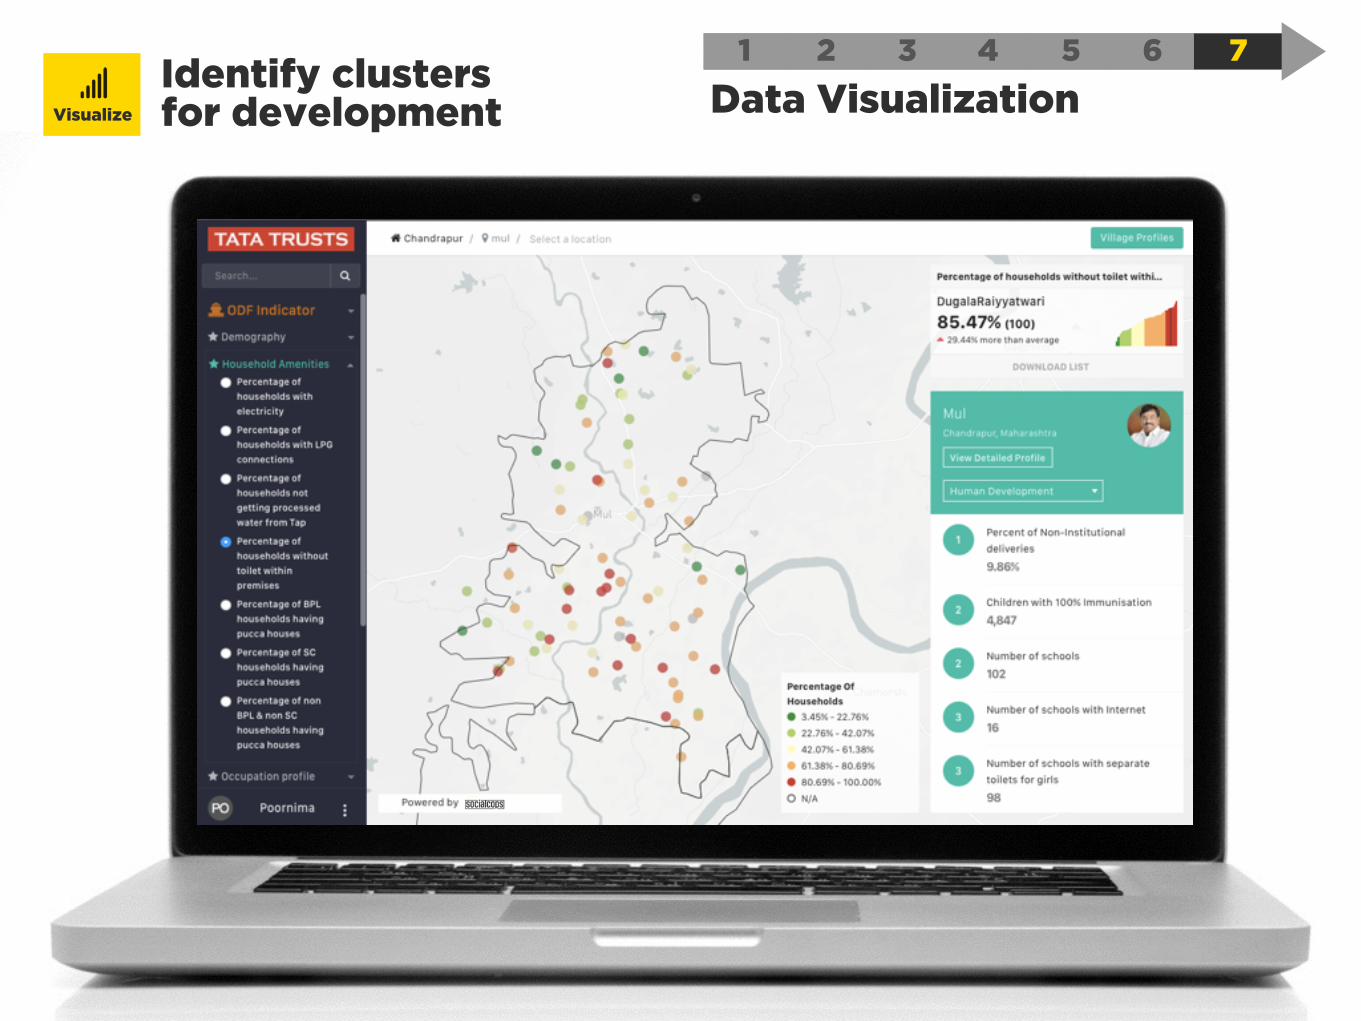
Identify clusters for developmentVisualize
1 2
Data Visualization3 4 5 6 7
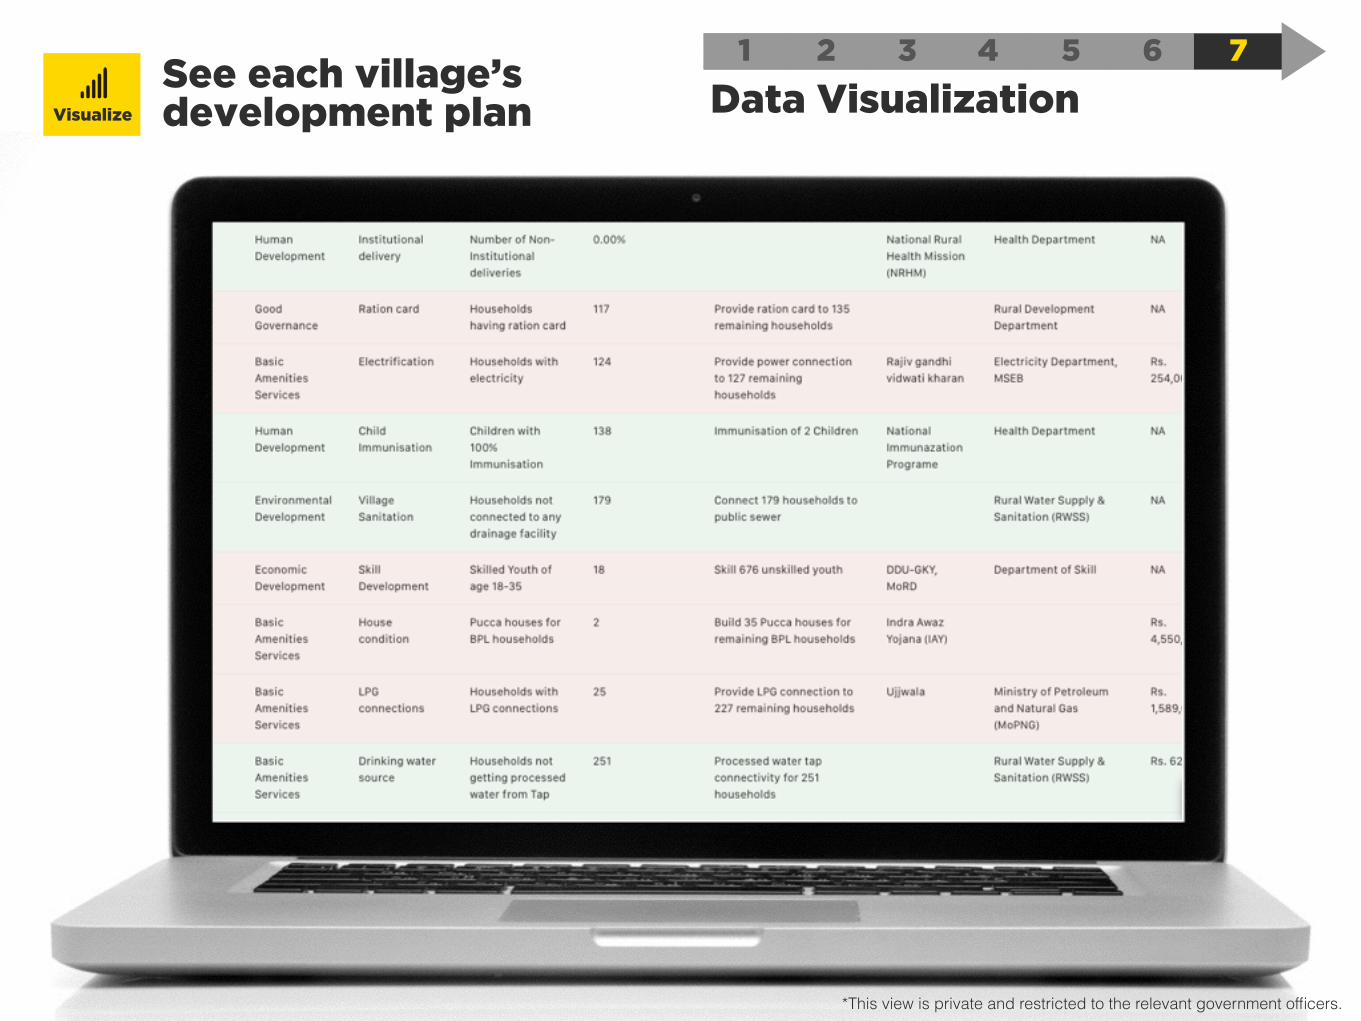
See each village’s development plan
*This view is private and restricted to the relevant government officers.
Visualize
1 2
Data Visualization3 4 5 6 7
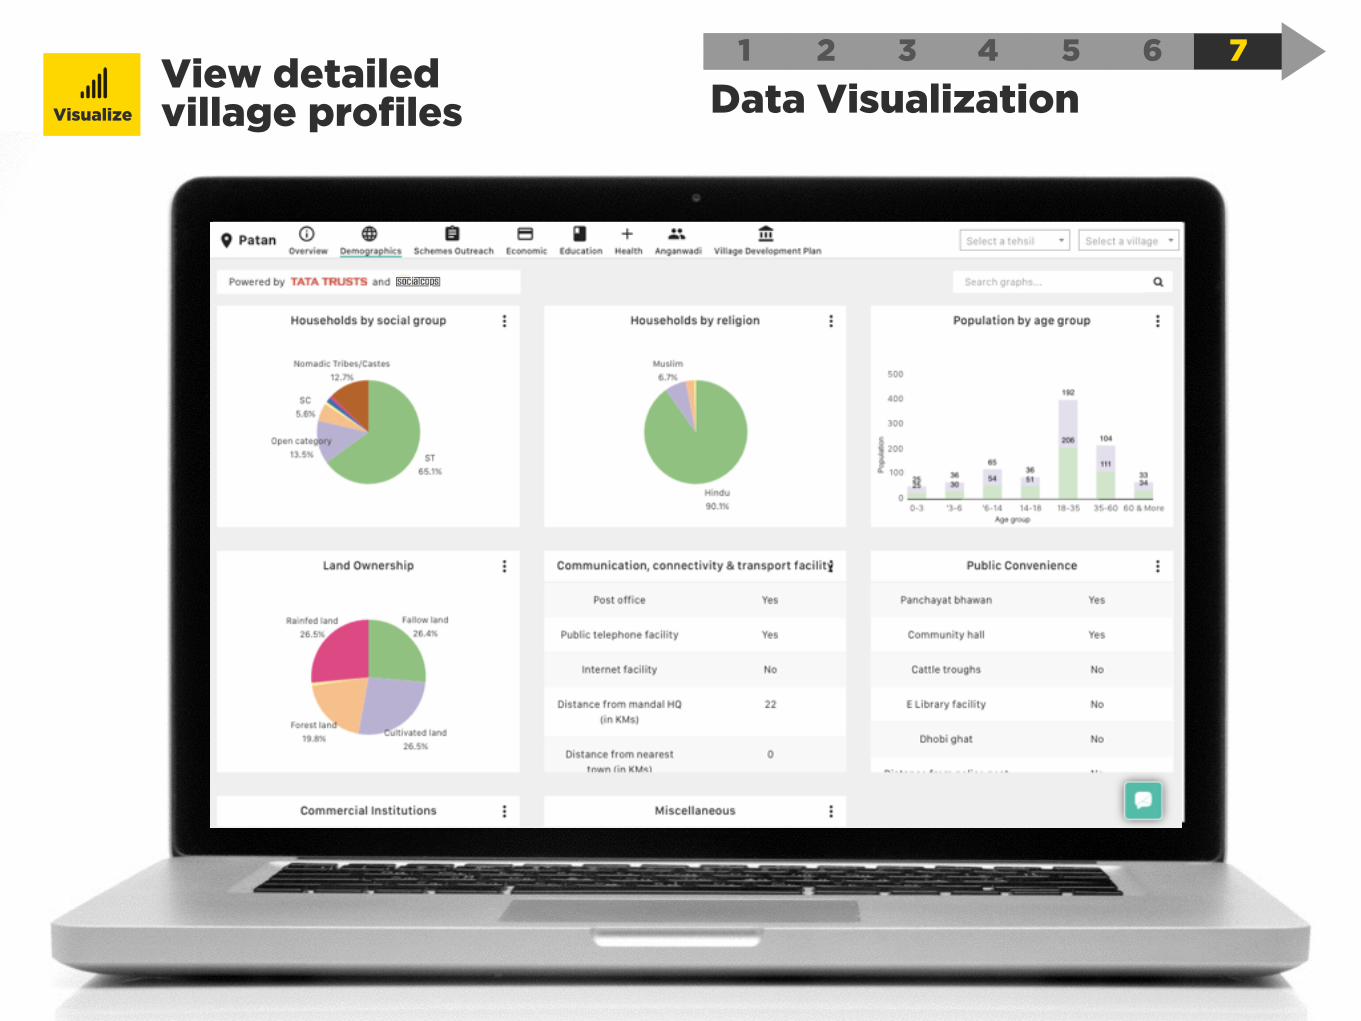
View detailed village profilesVisualize
The Results4
Micro-targeting development to create a model constituency
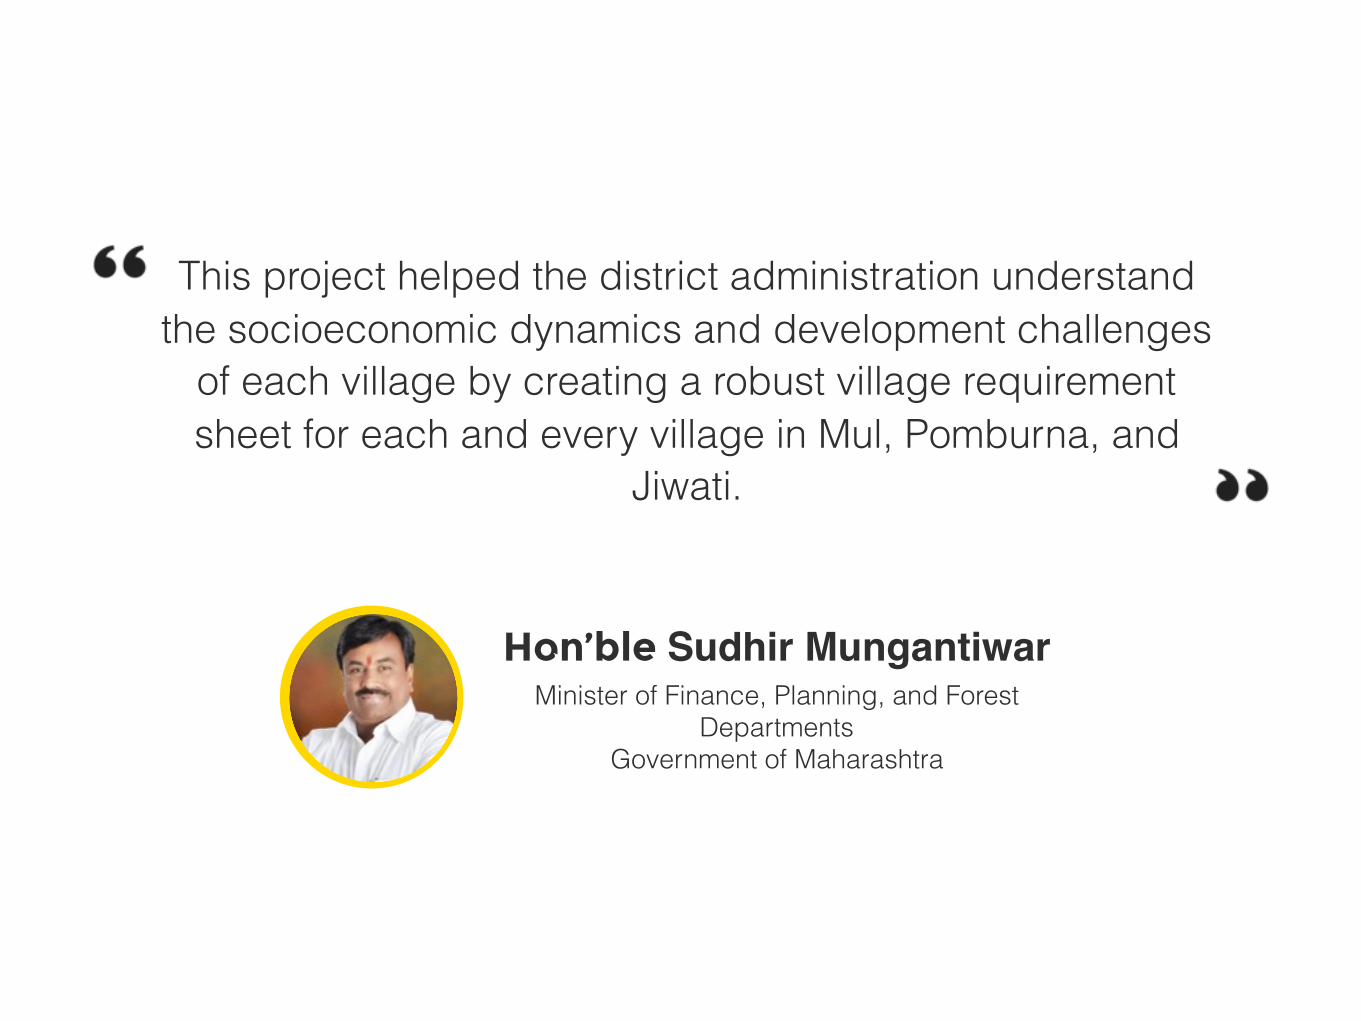
This project helped the district administration understand the socioeconomic dynamics and development challenges
of each village by creating a robust village requirement sheet for each and every village in Mul, Pomburna, and
Jiwati.
Hon’ble Sudhir MungantiwarMinister of Finance, Planning, and Forest
Departments Government of Maharashtra
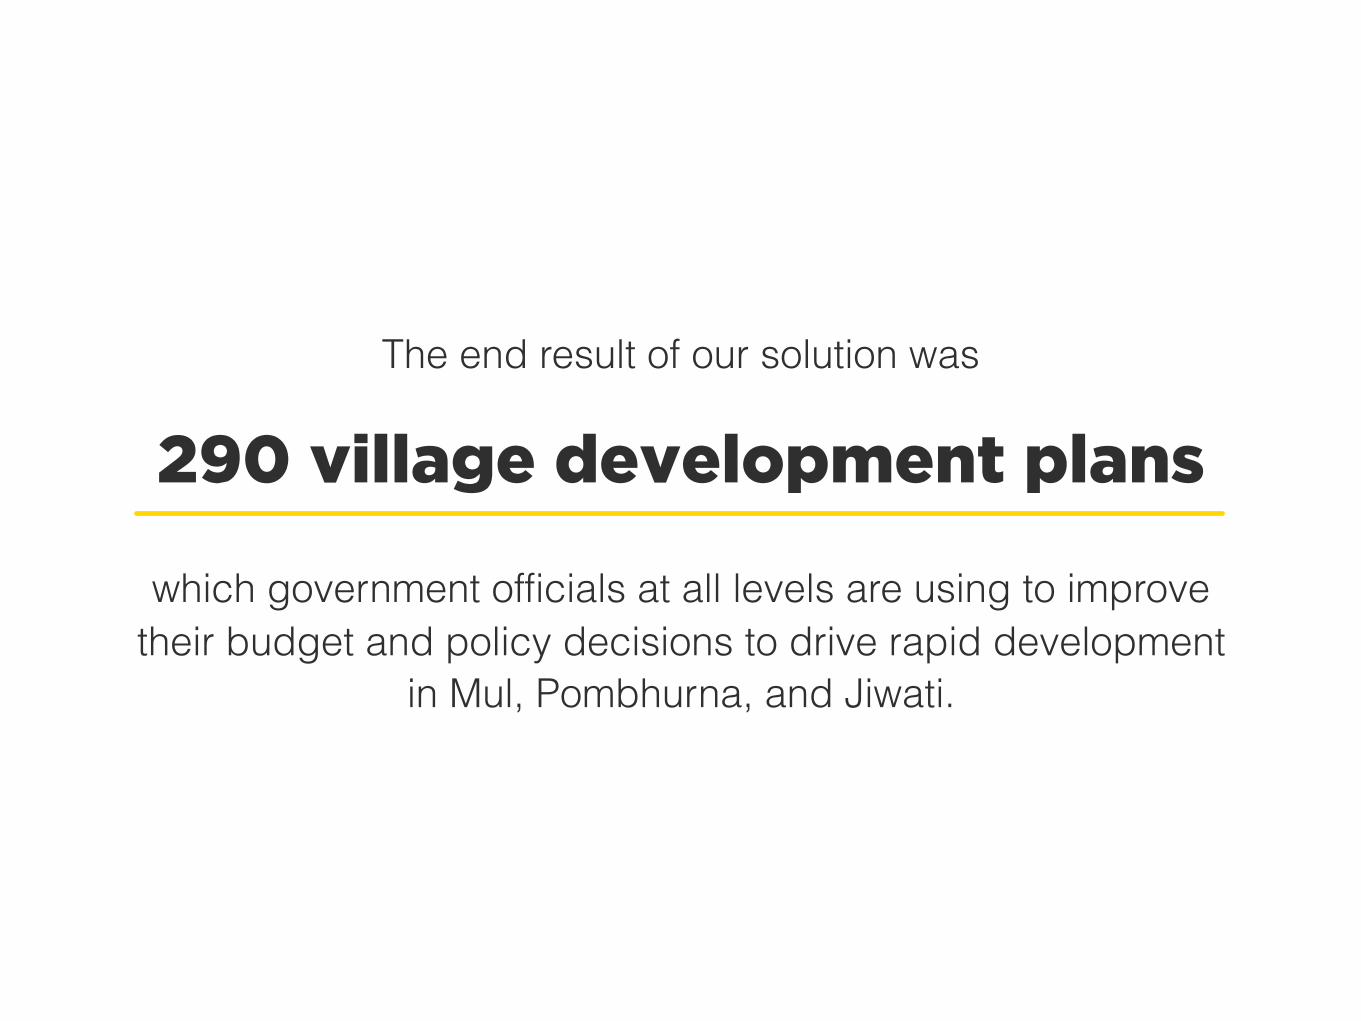
The end result of our solution was
290 village development plans
which government officials at all levels are using to improve their budget and policy decisions to drive rapid development
in Mul, Pombhurna, and Jiwati.

Village Development Plans were sent to Gram Panchayat heads for all 290 villages for their village planning.
The Guardian Minister adopted 18 villages. He will use their plans to convert these villages to model villages.
The Block Development Officer of Mul added 60% of the plans’ suggestions to Mul’s 2016-17 development plan.
Adoption of village development plans1
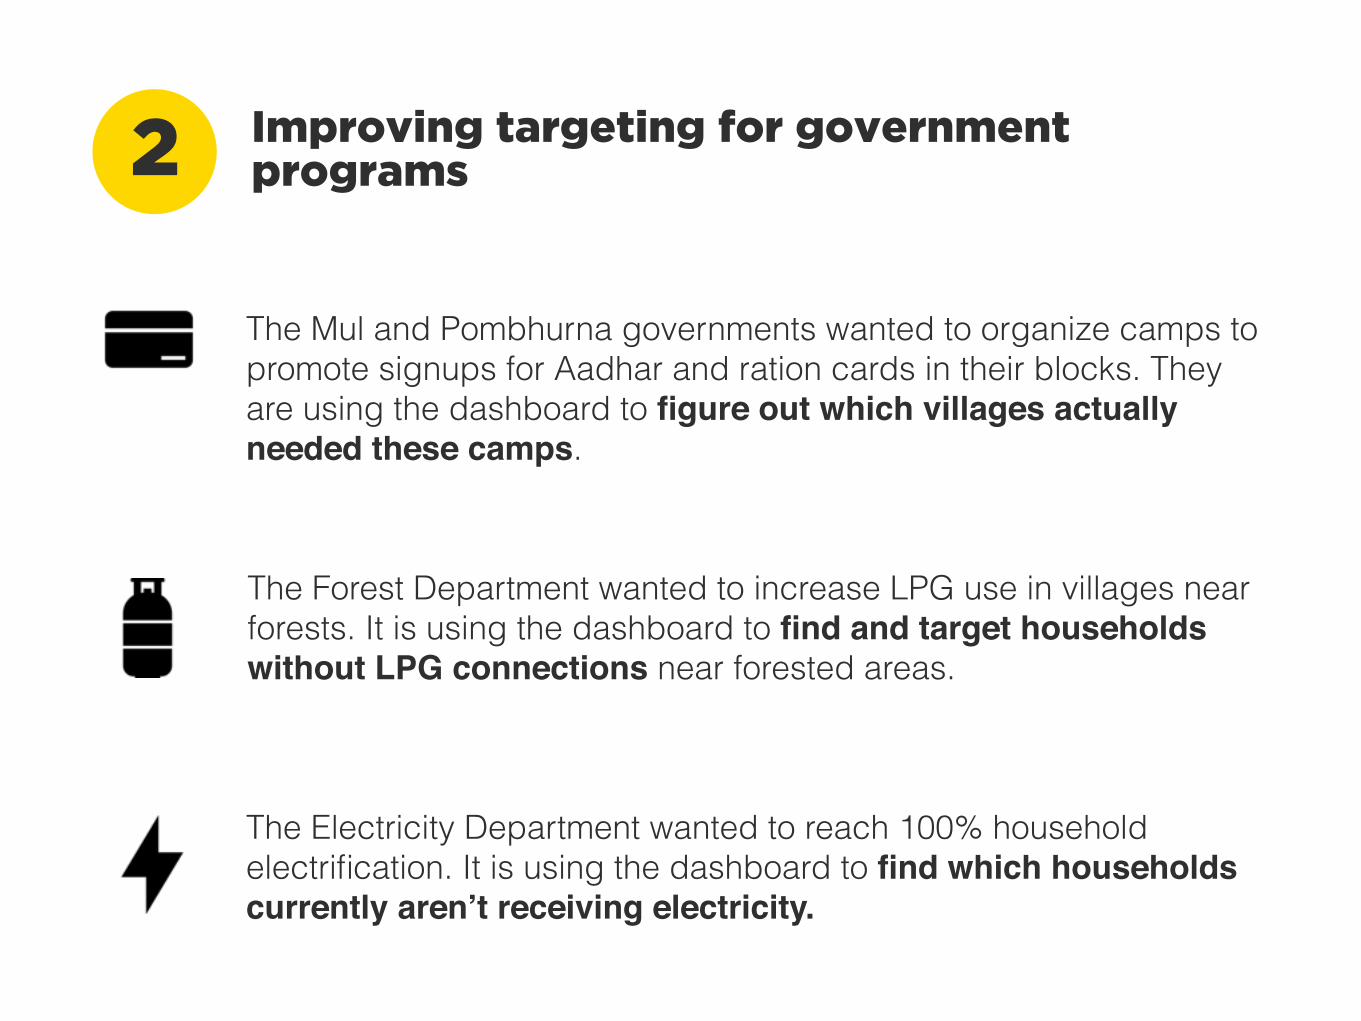
Improving targeting for government programs2
The Mul and Pombhurna governments wanted to organize camps to promote signups for Aadhar and ration cards in their blocks. They are using the dashboard to figure out which villages actually needed these camps.
The Forest Department wanted to increase LPG use in villages near forests. It is using the dashboard to find and target households without LPG connections near forested areas.
The Electricity Department wanted to reach 100% household electrification. It is using the dashboard to find which households currently aren’t receiving electricity.
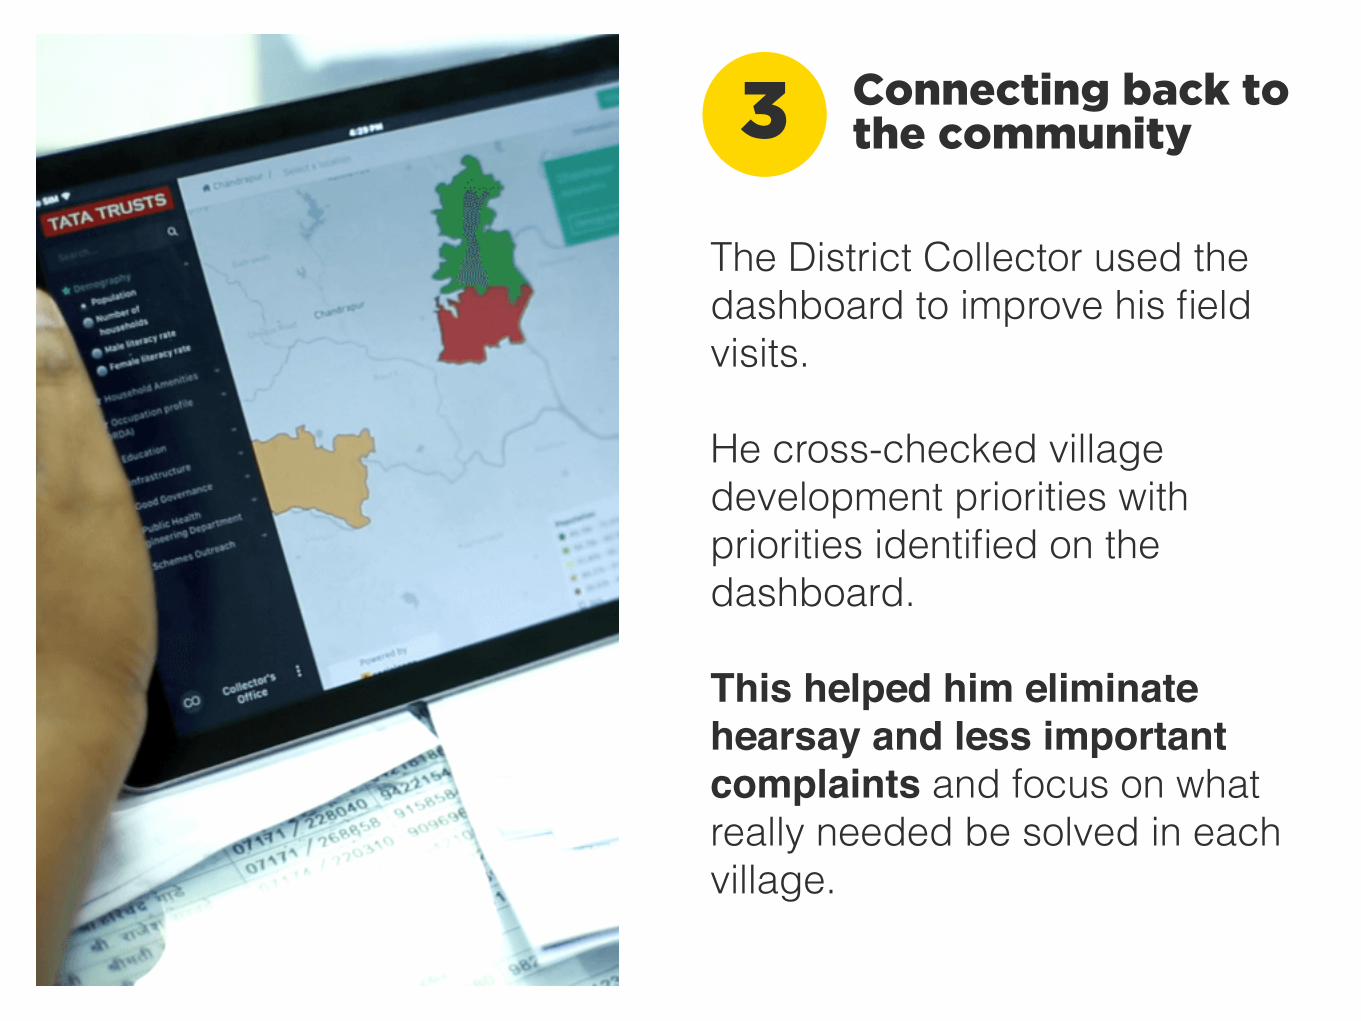
The District Collector used the dashboard to improve his field visits.
He cross-checked village development priorities with priorities identified on the dashboard.
This helped him eliminate hearsay and less important complaints and focus on what really needed be solved in each village.
Connecting back to the community3
We’ve been working with SocialCops closely for the past one and a half years. The amazing thing about
partnering with them — they have ALWAYS delivered!
Paresh ManoharProgram Officer
Tata Trusts

Our Partners5
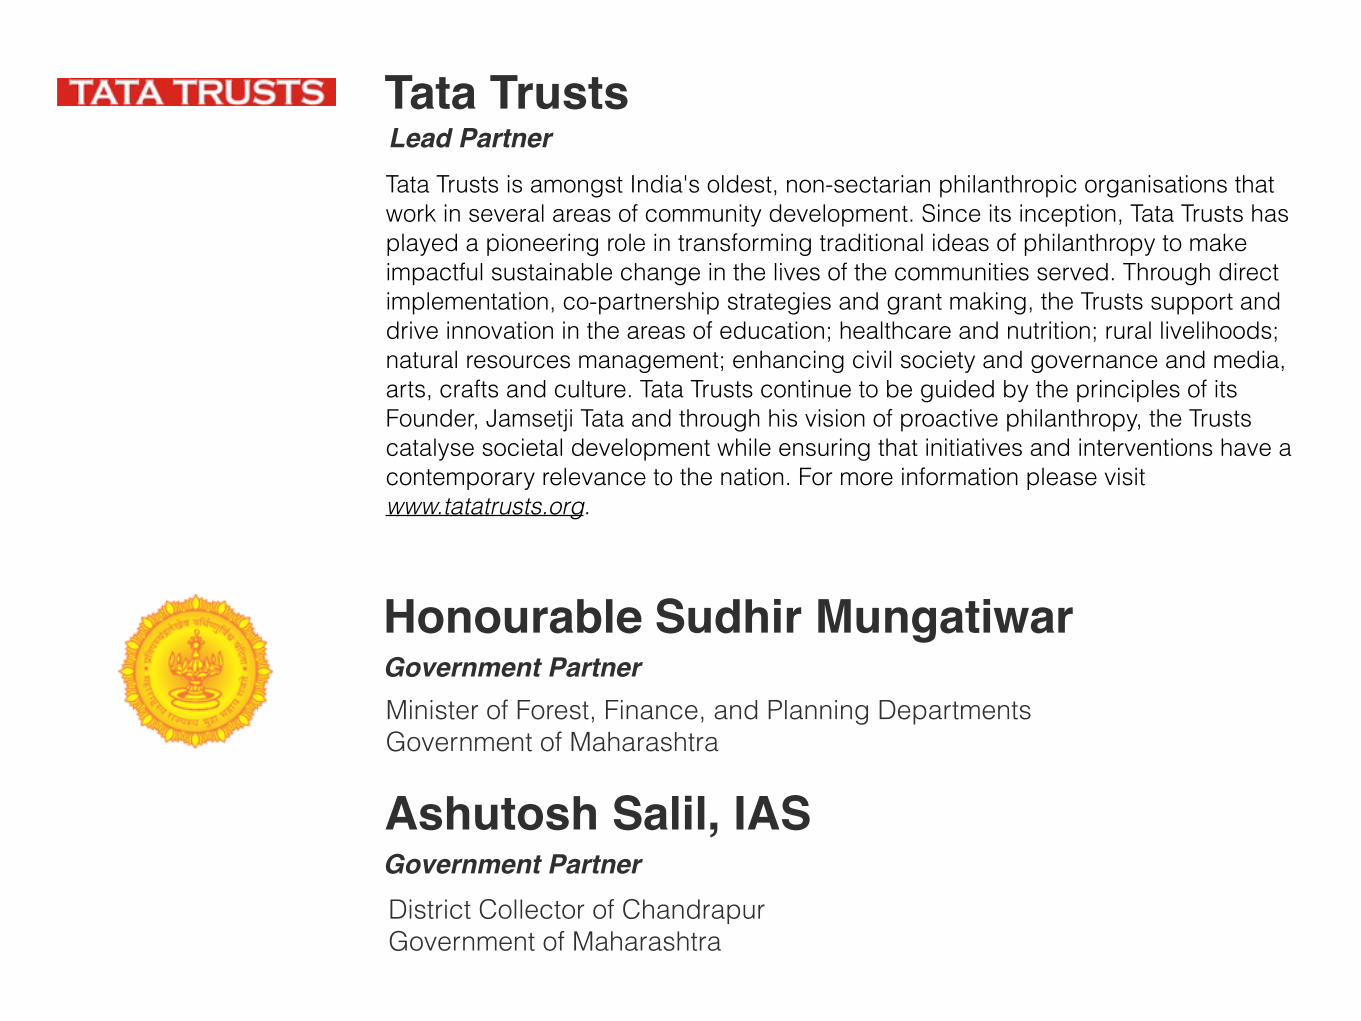
District Collector of Chandrapur Government of Maharashtra
Tata TrustsTata Trusts is amongst India's oldest, non-sectarian philanthropic organisations that work in several areas of community development. Since its inception, Tata Trusts has played a pioneering role in transforming traditional ideas of philanthropy to make impactful sustainable change in the lives of the communities served. Through direct implementation, co-partnership strategies and grant making, the Trusts support and drive innovation in the areas of education; healthcare and nutrition; rural livelihoods; natural resources management; enhancing civil society and governance and media, arts, crafts and culture. Tata Trusts continue to be guided by the principles of its Founder, Jamsetji Tata and through his vision of proactive philanthropy, the Trusts catalyse societal development while ensuring that initiatives and interventions have a contemporary relevance to the nation. For more information please visit www.tatatrusts.org.
Lead Partner
Honourable Sudhir Mungatiwar
Minister of Forest, Finance, and Planning Departments Government of Maharashtra
Ashutosh Salil, IASGovernment Partner
Government Partner

About SocialCops6
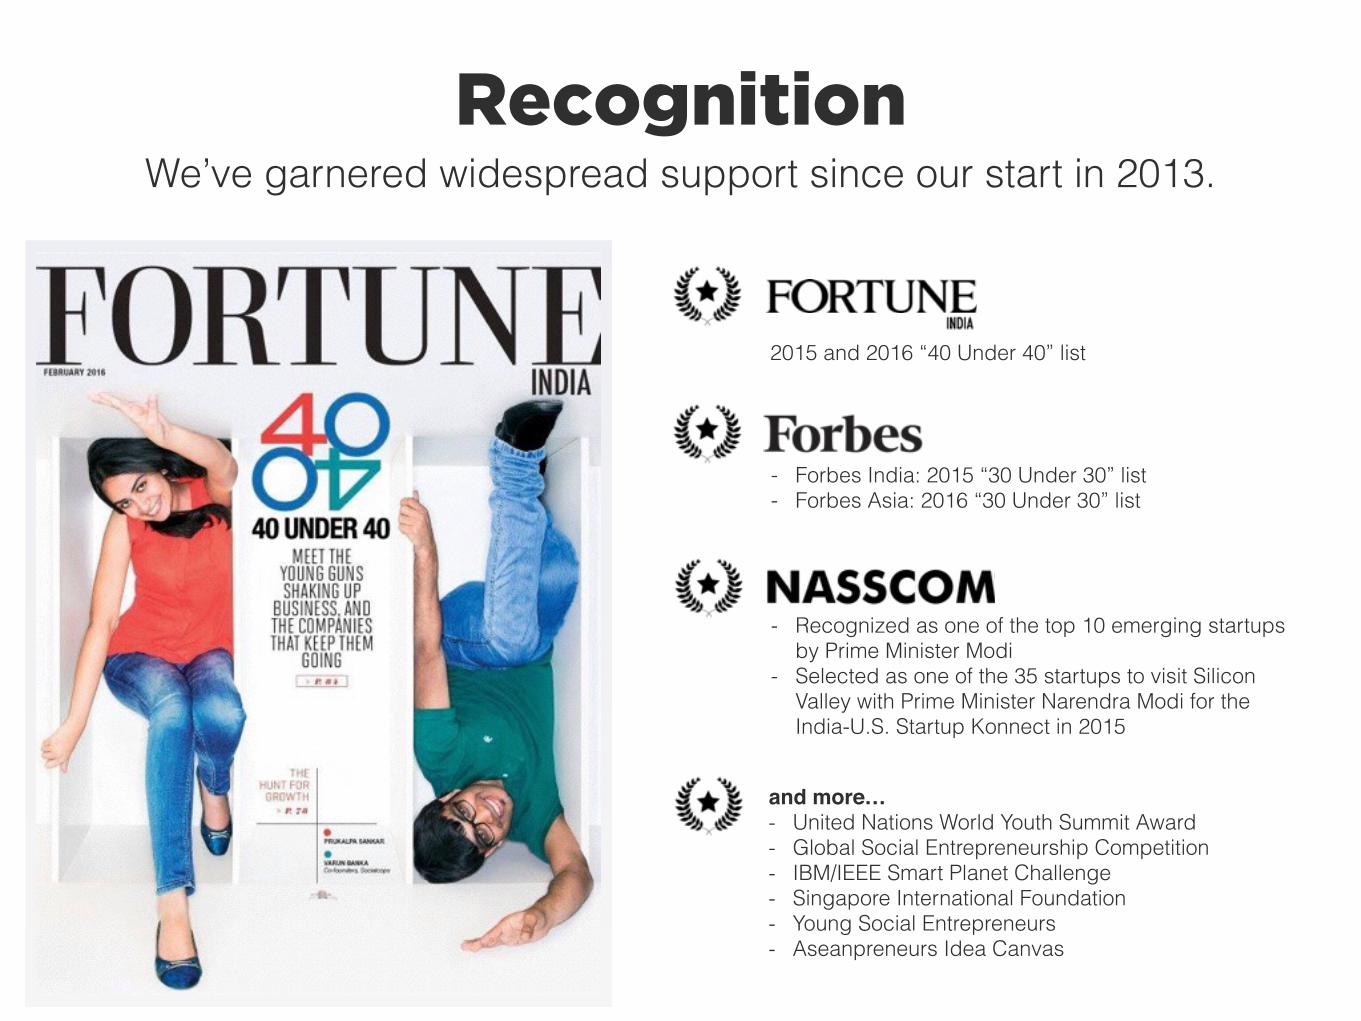
Recognition We’ve garnered widespread support since our start in 2013.
2015 and 2016 “40 Under 40” list
- Forbes India: 2015 “30 Under 30” list - Forbes Asia: 2016 “30 Under 30” list
- Recognized as one of the top 10 emerging startups by Prime Minister Modi
- Selected as one of the 35 startups to visit Silicon Valley with Prime Minister Narendra Modi for the India-U.S. Startup Konnect in 2015
and more…- United Nations World Youth Summit Award - Global Social Entrepreneurship Competition - IBM/IEEE Smart Planet Challenge - Singapore International Foundation - Young Social Entrepreneurs - Aseanpreneurs Idea Canvas
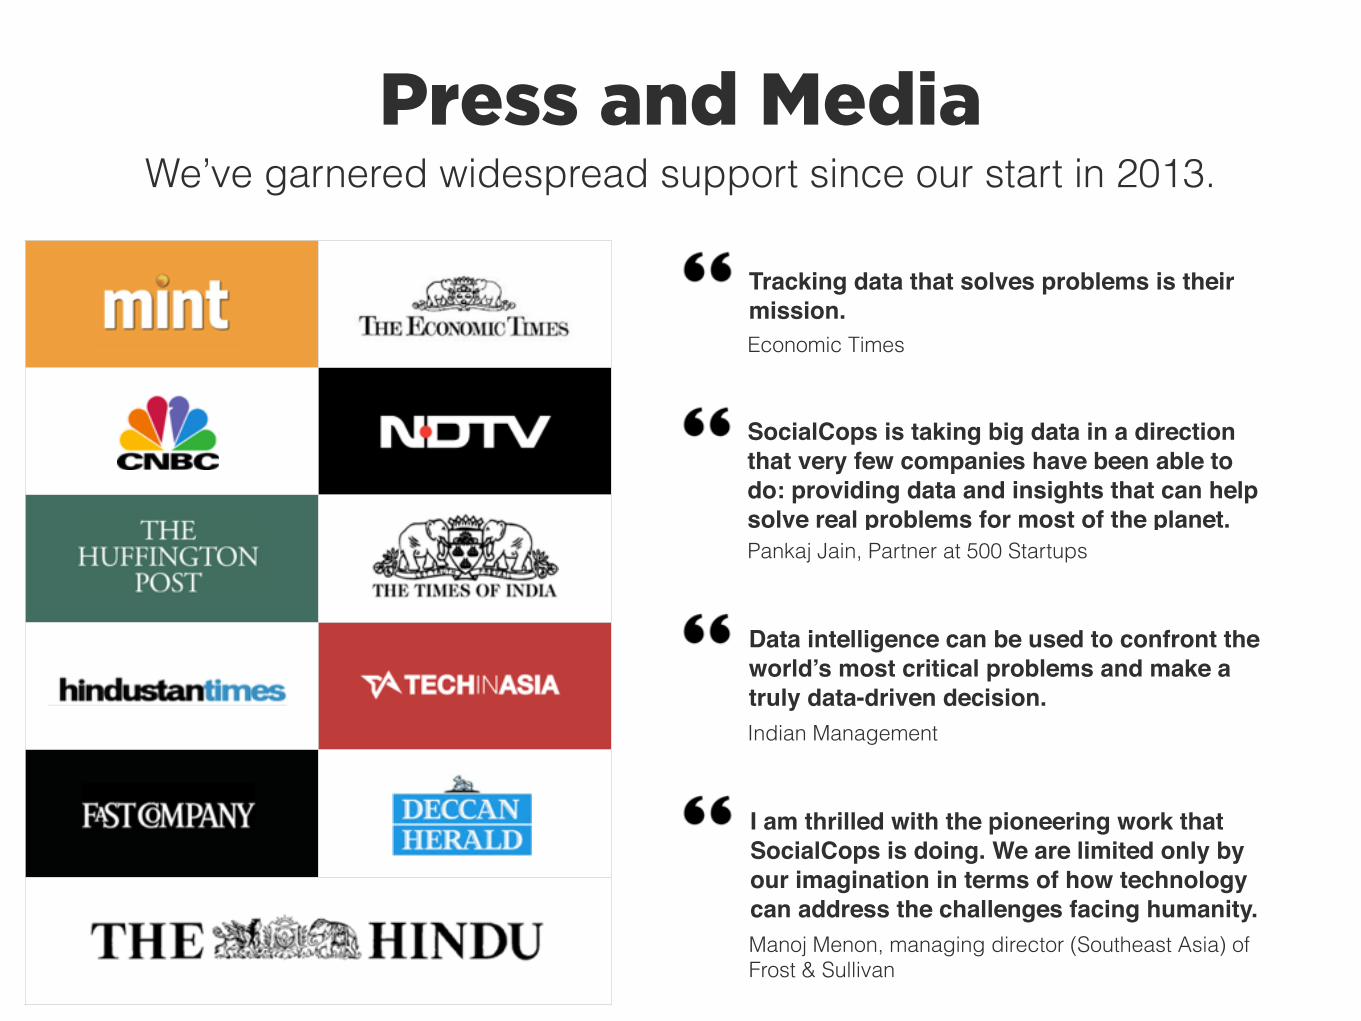
Press and Media We’ve garnered widespread support since our start in 2013.
Data intelligence can be used to confront the world’s most critical problems and make a truly data-driven decision.Indian Management
Tracking data that solves problems is their mission.Economic Times
I am thrilled with the pioneering work that SocialCops is doing. We are limited only by our imagination in terms of how technology can address the challenges facing humanity.Manoj Menon, managing director (Southeast Asia) of Frost & Sullivan
SocialCops is taking big data in a direction that very few companies have been able to do: providing data and insights that can help solve real problems for most of the planet.Pankaj Jain, Partner at 500 Startups
Thank You!For more information or to request a demo of our platform, check out
www.socialcops.com.
[email protected] @Social_Cops