case study - vibration monitoring with scs · this case study presents a vibration monitoring in...
TRANSCRIPT

Case study - Vibration monitoring with SCSDecember 2016
SYSCOM INSTRUMENTS SA SWITZERLAND [email protected] www.bartec-syscom.com scs.bartec-syscom.com
Figure 2. Demolition works generating high vibrations in the surrounding residential area.
SummaryObjective: Vibration monitoring of two residential buildings close to a demolition siteDuration: From October 7th to November 2nd, 2016 (26 days)Location: Zurich (Switzerland)Instrumentation: 2 MR3000C with internal triaxial velocity sensor, 3G module and external battery packRemote analysis: SCS (scs.bartec-syscom.com)Regulation: Swiss norm SN 640312a, in the category «Fre- quent vibration» & «normally sensitive buildings»Output: Comparison of the maximum velocities and frequencies with the Swiss standard
AbstractWhen construction/demolition works are close to residential buildings, the vibration monitoring must assess that the values recorded on the structures do not exceed the thresholds defined by the regulations.
The vibration sensors installed in the structures must be able to com-municate data and alarms to different people, like the monitoring su-pervisor, the site manager and the authorities. For these reasons, the instruments need a permanent internet access.
The versatile MR3000C made by BARTEC SYSCOM is able to auto-matically send alarms via SMS/e-mail and data to an FTP site or to SCS (Syscom Cloud Software). The SCS allows to easily manage data coming from different projects and devices, remotely control the instru-ments and automatically send PDF reports to stakeholders.
This case study presents a vibration monitoring in Zurich (Switzerland) where two MR3000C devices are installed in two residential buildings located close to a demolition site. The MR3000C communicate with the SCS, which allows to manage and analyze the data.
Vibration monitoring efficiency with SCS (Syscom Cloud Software)
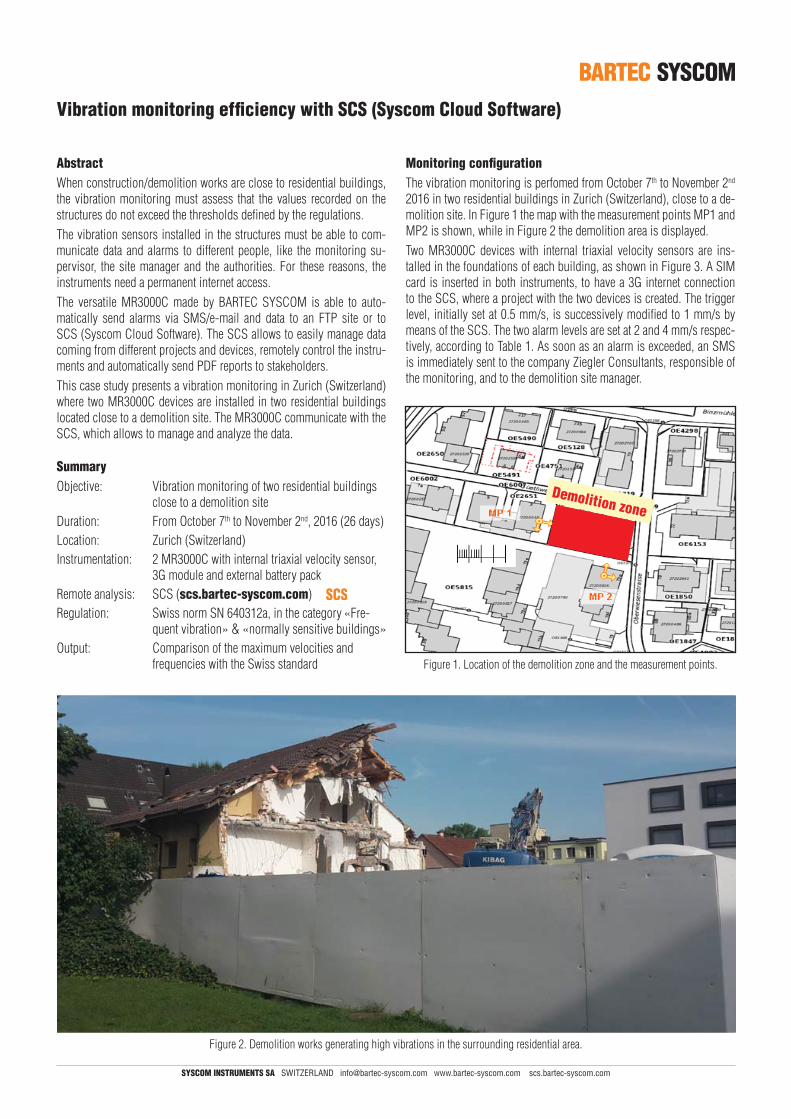
Monitoring configurationThe vibration monitoring is perfomed from October 7th to November 2nd 2016 in two residential buildings in Zurich (Switzerland), close to a de-molition site. In Figure 1 the map with the measurement points MP1 and MP2 is shown, while in Figure 2 the demolition area is displayed.
Two MR3000C devices with internal triaxial velocity sensors are ins-talled in the foundations of each building, as shown in Figure 3. A SIM card is inserted in both instruments, to have a 3G internet connection to the SCS, where a project with the two devices is created. The trigger level, initially set at 0.5 mm/s, is successively modified to 1 mm/s by means of the SCS. The two alarm levels are set at 2 and 4 mm/s respec-tively, according to Table 1. As soon as an alarm is exceeded, an SMS is immediately sent to the company Ziegler Consultants, responsible of the monitoring, and to the demolition site manager.
Figure 1. Location of the demolition zone and the measurement points.
Demolition zone

Case study - Vibration analysis with SCS
Figure 3. Building with measurement point MP1 (a) and the related MR3000C installed in the washroom, at foundation level (b); building with measurement point MP2 (c) and the related MR3000C installed in the electric cabinet, at foundation level (d).
a) b)
c) d)
Figure 4. Background values recorded on the two MR3000C installed on site, in the period from October 20th to 25th (6 days).
Meas. point Device name Address Position Trigger Alarm 1 Alarm 2
MP1 ZC-349ZH3_MP1_Gue_3 Güetliweg 3, Zurich Washroom, at foundation 1 mm/s 2 mm/s 4 mm/s
MP2 ZC-381ZH3_MP2_OW_73g Oberwiesenstrasse 73g, Zurich Cabinet, at foundation 1 mm/s 2 mm/s 4 mm/s
Table 1. Location and parameters of each measurement points.
SYSCOM INSTRUMENTS SA SWITZERLAND [email protected] www.bartec-syscom.com scs.bartec-syscom.com

About BARTEC SYSCOM SYSCOM Instruments SA is a subsidiary of BARTEC GROUP, a multinational manufacturer of industrial safety equipment. SYSCOM Instruments SA is a leading provider of vibration and seismic monitoring equipment for civil engineering and safety related markets, especially for NPP and LNG plants. SYSCOM Instruments SA reputation rests on the reliability of its products, coming from a meticulous control of every design and production aspects.
ConclusionsThe SCS collects and analyzes the data coming from two MR3000C devices installed in Zurich (Switzerland), in two residential buildings affected by the vibrations generated by a close demolition site.
The SCS allows to easily analyze data, to compare the values with the Swiss norm SN 640312a, and to avoid to go on site to change MR3000C parameters. Moreover, the SCS allows to check in real-time the state of health of the monitoring system.
The results obtained by the SCS show that the vibrations produced by the demolition works have not damaged the monitored buildings. All the graphs in this case study are automatically generated by the SCS and not reworked aftwerwards.
Rue de l‘Industrie 211450 Sainte-Croix
T. +41 (0) 24 455 44 11F. +41 (0) 24 454 45 60
SYSCOM Instruments SA SWITZERLAND
Figure 5. Comparison of the Vector Sum of the events with the Swiss norm SN 640312a.
the demolition works generate significant vibrations during the workday) related to normally-sensitive structures. Most events come from MP1, while almost all the events have dominant frequencies smaller than 20 Hz, as expected in residential buildings.
There are no events exceeding the reference curve, meaning that during the entire work period the structural integrity of the buildings was not af-fected. The most critical event is recorded in MP1 and the time histories of the three components are displayed in Figure 6. The maximum value of the Vector Sum is 2.82 mm/s.
Case study - Vibration analysis with SCS
Figure 6. Time histories of the most critical event.
Special thanks to Ziegler Consultants who allowed us to write this case study.
Data analysis with Syscom Cloud Software
The data recorded by the MR3000C devices on site are automatically sent to the SCS (scs.bartec-syscom.com) which is then able to:
• Display recorded data• Remotely change parameters inside the MR3000C• Export data in XMR/BMR (proprietary format) or TXT format• Compare PPV with reference regulation• Generate PDF reports
In Figure 4, the maximum velocity peaks acquired every 4 minutes on the three axes are displayed in the period from October 20th to 25th. The working hours in the demolition sites are well highlighted: 7:30-12:00 and 13:00-17:00. Very low levels were recorded during the weekend (October 22nd and 23rd). The velocity values are generally higher on MP1, which is slightly closer to the demolition area compared to MP2.
In Figure 5, the PPV (Peak Particle Velocity) of the Vector Sum (the mo-dule of the three axes) related to all the 124 events recorded in the entire monitoring period are easily evaluated according to the Swiss norm SN 640312a. Among the different categories described in the norm, the re-ference curve chosen represents the case with frequent vibrations (since