cash on the road - ernst & young · cash collection, as well as by the net impact of changing...
TRANSCRIPT

Cash on the roadWorking capital management in the automotive supply industry 2013

ContentsSummary 1
Relative to 2011, WC performance improved in 2012 2
Reductions in C2C since 2002 4
Wide variations in current WC performance across regions 8
Opportunities going forward 9
Adapting WC strategies to a changing environment 10
How EY can help 12
Methodology 12
Glossary 13
Contacts 14
Cash on the road

1Cash on the road
For the automotive supply industry, 2012 was another challenging year, with sharply diverging trends in automotive production between regions, continuing pricing pressures from original equipment manufacturers (OEMs), an ongoing shift in global demand toward rapid-growth markets, and volatility in commodity prices and exchange rates.
automotive suppliers reported an improvement in WC performance, with overall cash-to-cash (C2C) dropping by 3% from its 2011 levels. These results are in sharp contrast with those published in the previous year, when C2C increased by 6%.
However, our 2012 research also reveals wide regional variations in the degree of change in C2C, exacerbated by the impact of contrasting growth trends. In general, companies based in Europe and, to a lesser extent, Japan reported better WC results, while those based in the US saw their performance deteriorate.
past decade, the automotive supply industry as a whole has managed to reduce its C2C by 4%, driven primarily by progress in billing and cash collection, as well as by
chain and procurement operations. However, these overall results also mask
between regions and countries.
Today, WC performance continues to vary widely between automotive supply companies in different regions. While these performance gaps may be partly due to variations in business models and customers served, they also point to fundamental differences in the degree of management focus on cash and in the effectiveness of WC management processes.
the leading 40 automotive suppliers have up to US$47b tied up unnecessarily in WC.
businesses’ combined sales.
Those companies seeking to achieve further WC gains will need to embrace more substantial changes to how they address a broad range of new operational and market issues. These changes will include building greater responsiveness into systems and processes; achieving supply chain resilience; assuming greater supply chain responsibilities; optimizing global sourcing; taking a balanced approach between cash, cost, service levels and risk; driving WC synergies to make acquisitions deliver higher value; and changing internal behaviors.
Cash on the road is the latest in a series of working capital (WC) management reports based on EY research.
Summary
2 Cash on the road
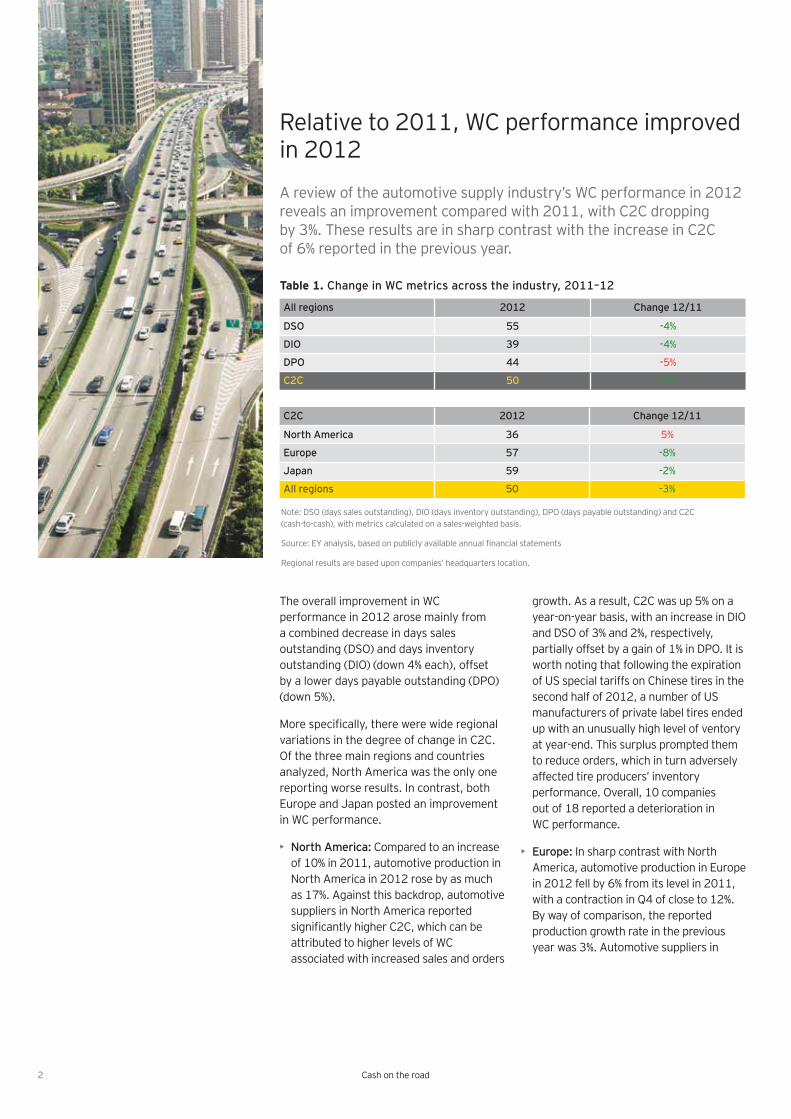
The overall improvement in WC performance in 2012 arose mainly from a combined decrease in days sales outstanding (DSO) and days inventory outstanding (DIO) (down 4% each), offset by a lower days payable outstanding (DPO) (down 5%).
variations in the degree of change in C2C. Of the three main regions and countries analyzed, North America was the only one reporting worse results. In contrast, both Europe and Japan posted an improvement in WC performance.
• North America: Compared to an increase of 10% in 2011, automotive production in North America in 2012 rose by as much as 17%. Against this backdrop, automotive suppliers in North America reported
attributed to higher levels of WC associated with increased sales and orders
growth. As a result, C2C was up 5% on a year-on-year basis, with an increase in DIO and DSO of 3% and 2%, respectively, partially offset by a gain of 1% in DPO. It is worth noting that following the expiration of US special tariffs on Chinese tires in the second half of 2012, a number of US manufacturers of private label tires ended up with an unusually high level of ventory at year-end. This surplus prompted them to reduce orders, which in turn adversely affected tire producers’ inventory performance. Overall, 10 companies out of 18 reported a deterioration in WC performance.
• Europe: In sharp contrast with North America, automotive production in Europe in 2012 fell by 6% from its level in 2011, with a contraction in Q4 of close to 12%. By way of comparison, the reported production growth rate in the previous year was 3%. Automotive suppliers in
A review of the automotive supply industry’s WC performance in 2012 reveals an improvement compared with 2011, with C2C dropping by 3%. These results are in sharp contrast with the increase in C2C of 6% reported in the previous year.
Relative to 2011, WC performance improved in 2012
Table 1. Change in WC metrics across the industry, 2011–12
All regions 2012 Change 12/11
DSO 55 -4%
DIO 39 -4%
DPO 44 -5%
C2C 50 -3%
C2C 2012 Change 12/11
North America 36 5%
Europe 57 -8%
Japan 59 -2%
All regions 50 -3%
Note: DSO (days sales outstanding), DIO (days inventory outstanding), DPO (days payable outstanding) and C2C (cash-to-cash), with metrics calculated on a sales-weighted basis.
Regional results are based upon companies’ headquarters location.

3Cash on the road
Europe managed to reduce C2C by 8%. However, much of the reduction appears to have come from much lower sales and
quarter of the year — compounded by expectations of a further reduction in
resulting in reduced balances of both receivables and payables. DSO and DIO were down 7% and 6%, respectively, while DPO dropped by 5%. Two-thirds of the companies surveyed reported an improvement in WC performance.
• Japan: Full-year results in 2012 for Japan
devastating earthquake and tsunami. Automotive production in Japan rose by 20% in 2012, after falling by 14% the year before. For our sample of automotive suppliers headquartered in Japan, sales increased by as much as 11% in 2012
the fact that production had started to bounce back in the second half of 2011. C2C was down 2% from its level in 2011, driven by a combined fall in DSO and DIO of 8% and 6%, respectively, offset by a drop in DPO of 14%. However, only two companies out of seven reported an improvement in WC performance.
For every region, currency movements and volatility in commodity prices also played a role in driving reported WC performance, with each having varying
impacts on different companies in each region. These impacts can be summarized as follows:
• Currency movements: For companies reporting in US dollars, the relative weakness of the US dollar against the euro at the end of 2012 compared with its average during the year was a negative contributory factor to WC performance. In contrast, for those reporting in euros
WC performance. For companies reporting in Japanese yen, the sudden weakness of the yen against most other major currencies at year-end weighed negatively on WC performance.
• Volatility in commodity prices: Prices for many raw materials used by the automotive supply industry (including steel, aluminum and other metallic materials, as well as rubber and petrochemical-based products) remained highly volatile throughout 2012. For some of these materials, prices were much
global demand weakened, resulting in reduced inventory levels and payables balances for the automotive supply industry at year-end. Note that while agreements in the automotive supply industry usually include price adjustment provisions, the sharing of costs variability remains a subject of negotiation with customers.
3Cash on the road
4 Cash on the road
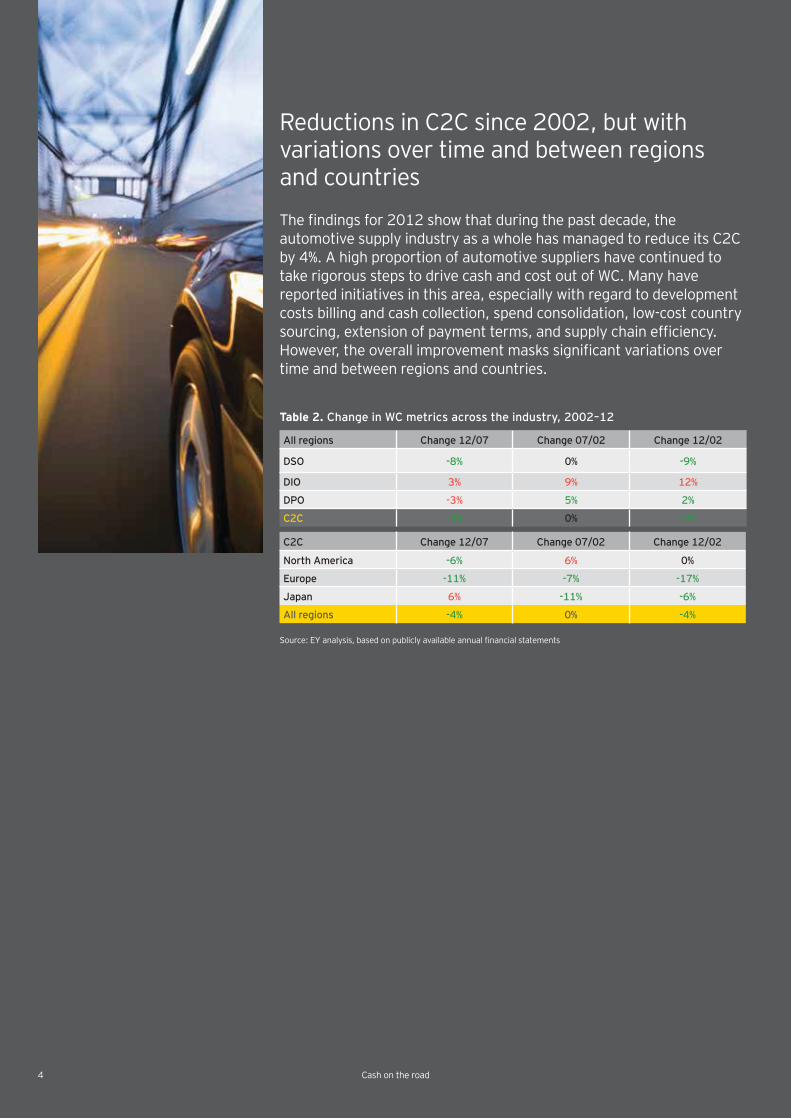
automotive supply industry as a whole has managed to reduce its C2C by 4%. A high proportion of automotive suppliers have continued to take rigorous steps to drive cash and cost out of WC. Many have reported initiatives in this area, especially with regard to development costs billing and cash collection, spend consolidation, low-cost country
time and between regions and countries.
Reductions in C2C since 2002, but with variations over time and between regions and countries
Table 2. Change in WC metrics across the industry, 2002–12
All regions Change 12/07 Change 07/02 Change 12/02
DSO -8% 0% -9%
DIO 3% 9% 12%
DPO -3% 5% 2%
C2C -4% 0% -4%
C2C Change 12/07 Change 07/02 Change 12/02
North America -6% 6% 0%
Europe -11% -7% -17%
Japan 6% -11% -6%
All regions -4% 0% -4%
4 Cash on the road

5Cash on the road
Variations in WC performance overall and for each component
For the industry as a whole, the improvement in WC performance during the last decade has been entirely realized
Performance remained almost unchanged
since 2002 has been driven by a decline in DSO (down 9%) and, to a lesser extent, an increase in DPO (up 2%), partly offset by much higher DIO (up 12%).
• Better receivables performance: All the progress made in receivables since 2002
driven by greater attention to billing and cash collection, as well as by the net impact of changing payment terms with OEMs over time. European OEMs may have chosen to pay early or negotiate shorter terms, while in North America, terms were extended or payments were late, a trend that was accentuated by the termination of supplier fast-pay programs. Japanese OEMs had varied
factor has been the gradual change in the geographical sales mix toward new regions and countries and the resulting effect on average payment terms. Overall, half of the companies analyzed reported an improvement in receivables performance since 2002.
• Broad inventory performance deterioration: With OEMs increasingly adopting lean practices and vendor-managed inventory (VMI) arrangements,
shift of industry inventory toward upstream suppliers. For Tier 1 suppliers, however, this trend was partly mitigated by progress made in streamlining their own supply chains and passing on the cost further up the supply chain. Overall, two-thirds of the companies analyzed reported a deterioration in inventory performance since 2002.
• Stronger payables performance: Progress in this area continues to be supported by better management of the procurement and payables process, as companies seek to drive greater
consolidating spend, changing payment terms, standardizing processes, and working more closely with their own suppliers. Ongoing consolidation in the automotive supply industry has also created larger Tier 1 suppliers with increased buying power, capable of extracting better cash terms from suppliers further upstream. However, the degree of change varied between
and tactics. For example, some companies have been stretching terms with their main suppliers or reducing their supplier base to achieve greater leverage in negotiations. Others have been choosing to pay faster in return for enhanced cash discounts. Overall, two-thirds of the companies analyzed reported an improvement in payables performance since 2002.
5

6 Cash on the road
Variations in WC performance by region
Of the three main regions and countries, Europe reported the biggest improvement in C2C since 2002. Japan also reported better results. In contrast, WC performance for North America remained unchanged over the 10-year period.
• Europe reported a drop of 17% in C2C since 2002, with an acceleration in the
This rapid progress has been driven by a much improved performance in payables (DPO up 11%) and receivables (DSO down 13%), partly offset by higher inventory (DIO up 2%). The performance in
decisions by European OEMs to ease terms or pay early. Two-thirds of the companies analyzed in Europe reported lower C2C. However, it is also worth noting that our analysis is based on a selection of large Tier 1 suppliers, which are likely to be in a stronger position than other companies in the same industry to resist pressure from OEMs and leverage scale.
• Japan saw a fall of 6% in C2C since
years. The overall improvement in WC performance was driven by a dramatic reduction in DSO (down 21%), supported by stronger billing and cash collections. However, this was partly offset by poor results in inventory (DIO up 13%) and
payables (DPO down 13%). Four out of seven companies analyzed in Japan reported lower C2C. Note that WC performance in Japan over time has been severely affected by a number of factors external to the industry, including currency movements, the global downturn of 2008 and the impact of natural disasters. In contrast with most suppliers in other regions, Japanese suppliers’ performance continues to be
conditions imposed by a limited number of domestic customers.
• North America reported a WC performance that remains essentially unchanged since 2002. Improvement in
years. DPO was much higher (up 10%),
increase in DIO (up 13%). DSO was also
adverse impact of some US OEMs stretching terms with their suppliers, but this was partly mitigated by positive changes in payment policies among other OEMs. Half of the companies analyzed in North America reported lower C2C. Note that in addition to the economic and
previously, the profound restructuring of the US automotive industry has had a
industry’s WC.

A global Tier 1 automotive supplier pursued a number of initiatives to improve receivables management during the past few years, but the supplier felt that its performance could still be improved much further. An EY project team was engaged to review the existing processes and design an action plan to help implement leading practices in this area. The planned steps included setting up a collection and dispute management process, designing a receivables management
introducing reports and metrics to monitor and assess progress, and putting in place the right incentives to motivate and change internal behaviors.
For another large Tier 1 automotive supplier, EY helped to design and implement a program to improve the management of payables
program involved segmenting the supplier base according to payment terms, trigger and frequency; renegotiating and harmonizing payment practices for each segment; eradicating the root causes of invoice processing delays; and rationalizing the supplier base after assessing
Case studyVariations in WC levels over the past
have been reshaping the automotive supply industry. These factors include:
• Consolidation of vehicle platforms• Rising product complexity• Accelerating shift of demand to
rapid-growth markets• Globalization of supply chains• Industry consolidation• Continuing pricing pressures from OEMs
Amid these changes, WC initiatives have been implemented across the industry.
• Application of lean manufacturing techniques
• deploying different strategies and solutions for different products or market segments
• global procurement and standardization of processes
• Improvements in billing and cash collections
• under engineering, tooling and R&D contracts
• More effective management of payment terms for customers and suppliers, including renegotiation of terms
• Improved coordination between supply, planning, engineering, manufacturing and logistics functions and processes
• Linking up with OEMs’ processes to improve visibility into demand
• key suppliers and implementation of dual sourcing
• Adoption of common technologies up and down the value chain to enable sharing of real-time and accurate supply and demand information
• Implementation of robust risk management policies
• Tracking and monitoring of WC metrics and linking compensation to these metrics
behind the overall WC improvement
Cash on the road 7

8 Cash on the road
WC performance in the automotive supply industry varies widely across and within regions. These performance gaps are partly due to variations between different countries’ customer bases and payment practices, and partly to the differing commercial, manufacturing and logistics strategies deployed by the companies analyzed within each region.
Wide variations in current WC performance across regions
Comparisons between the WC performances of different regions should be approached with a particular nuance in mind: because some of the business done by North American, European and Japanese suppliers takes place outside their home regions, their WC results can
those in the regions where they are based.
Looking at 2012 performance, North American automotive suppliers exhibit by far the lowest C2C (36 days), owing to a superior performance in each WC metric. By contrast, European and Japanese automotive suppliers carry much higher
automotive suppliers carry the lowest DIO (31 days). This can be attributed to companies in this region having simpler manufacturing and supply chain structures, while their counterparts in Europe tend to have their operations dispersed across a large number of different countries. Vendor-managed inventory arrangements (VMIs) are also less widely used outside North America.
A further regional difference is that suppliers in North America exhibit much higher DPO than their peers in Europe and Japan. While trade terms are generally longer in Europe and Japan, the trend toward globalization in sales and procurement may have dampened the effect of regional payment practices. Some companies also choose to pursue extended payment terms rather than pay faster in return for cash discounts.
In contrast with DIO and DPO, the variations in DSO between different regions
and highly concentrated nature of the industry’s customer base, with most
proportion of their sales outside the region where they are headquartered.
Our analysis also shows a wide spread of C2C performance among companies within each region. Using standard deviation as a measure, North America has the lowest spread (22 days) of the three regions, while Europe has the highest (38 days).
Table 3. WC metrics by region, 2012
North America Europe Japan All regions
DSO 55 56 55 55
DIO 31 43 42 39
DPO 51 42 37 44
C2C 36 57 59 50
Table 4. C2C performance distribution by company within region, 2012
C2C Average* Top quartile Bottom quartile Standard deviation
North America 36 30 57 22
Europe 57 41 82 38
Japan 59 36 84 28
* weighted
8 Cash on the road
9Cash on the road
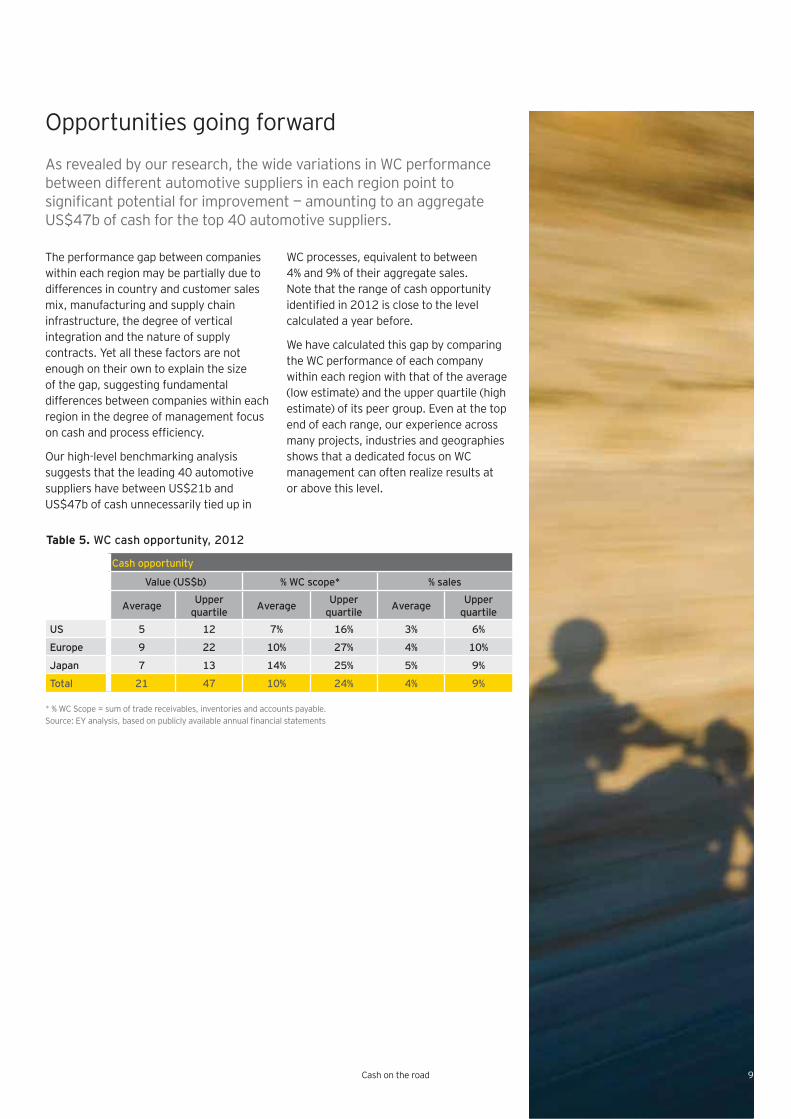
As revealed by our research, the wide variations in WC performance between different automotive suppliers in each region point to
US$47b of cash for the top 40 automotive suppliers.
Opportunities going forward
The performance gap between companies within each region may be partially due to differences in country and customer sales mix, manufacturing and supply chain infrastructure, the degree of vertical integration and the nature of supply contracts. Yet all these factors are not enough on their own to explain the size of the gap, suggesting fundamental differences between companies within each region in the degree of management focus
Our high-level benchmarking analysis suggests that the leading 40 automotive suppliers have between US$21b and US$47b of cash unnecessarily tied up in
WC processes, equivalent to between 4% and 9% of their aggregate sales. Note that the range of cash opportunity
calculated a year before.
We have calculated this gap by comparing the WC performance of each company within each region with that of the average (low estimate) and the upper quartile (high estimate) of its peer group. Even at the top end of each range, our experience across many projects, industries and geographies shows that a dedicated focus on WC management can often realize results at or above this level.
* % WC Scope = sum of trade receivables, inventories and accounts payable.
Table 5. WC cash opportunity, 2012
Cash opportunity
Value (US$b) % WC scope* % sales
Average Upper quartile Average Upper
quartile Average Upper quartile
US 5 12 7% 16% 3% 6%
Europe 9 22 10% 27% 4% 10%
Japan 7 13 14% 25% 5% 9%
Total 21 47 10% 24% 4% 9%
9
10 Cash on the road
The automotive supply industry has made some progress in improving its WC performance in the last decade. But companies seeking to achieve further gains will need to adapt their WC strategies to a broad range of new operational and market issues. Companies should consider building greater responsiveness into systems and processes; achieving supply chain resilience; assuming greater supply chain responsibilities; optimizing global sourcing; taking a balanced approach between cash, cost, service levels and risk; driving WC synergies to deliver higher value from acquisitions; and changing internal behaviors.
Adapting WC strategies to a changing environment
• Building greater responsiveness into systems and processes: One of the biggest challenges facing automotive suppliers today is the need to respond
a business environment that is becoming far more complex to navigate. These trends have resulted in most supply
leaner and more agile, but their complexity has also made them harder to manage. This is why it is imperative that organizations become more responsive. To this end, they need to work more closely with suppliers to align, simplify and standardize processes across the extended enterprise. They must also capture and share reliable, real-time information on demand with their partners. Going forward, they will need to combine lean and agile manufacturing and supply chains solutions, as well as implement better integration and coordination between sales, manufacturing, procurement and supply chain processes.
• Achieving supply chain resilience: Supply chains have become more vulnerable to business disruptions as a result of lean practices, increased outsourcing and reduced supplier bases. As seen in the wake of the natural disasters in Asia in 2011, the impact of such events on supply chains can be severe across the whole network. To manage and mitigate these risks, it is important for automotive suppliers to embed higher resilience into their supply chains while taking into account
with it. To achieve this, a number of actions are necessary. These include re-engineering parts of supply chains, including putting processes in place to help ensure alternative sourcing and provide additional capacity and inventory at critical points for the organization; building agility by enhancing the visibility of products across the network and reducing lead times; developing more collaborative supply chain relationships; and creating a risk management culture in the organization.
• Assuming greater supply chain responsibilities: Tier 1 suppliers are increasingly becoming large-scale
responsibility in the design and manufacturing of the relevant systems and coordinating the supply chains required for their manufacturing and assembly. This trend will require these suppliers to gain manufacturing and assembly capabilities, appropriate technical and engineering expertise, and logistical capabilities to manage the supply chain — all of which can pose complex challenges around internal integration and external collaboration. To overcome these challenges, companies will need to develop true cooperation and coordination, clear systems strategies, close alignment between business processes and information systems, and competencies across the entire value chain. It is also essential to more appropriately share design and development risks (with

risk-sharing embedded in supply contracts), as certain supply chain partners tend to be providing most of the investment.
• Optimizing global sourcing: Global sourcing has become more and more important to automotive suppliers, as they increase their global footprints and seek to optimize their purchasing costs. Yet this shift has also introduced an array of additional risks and challenges, including greater complexity in logistics, potentially longer and more variable lead times, excess safety stocks, and the loss of visibility and control over the manufacturing and delivery processes. As a result, care must be taken when deciding which parts to outsource to third-party manufacturers and which suppliers to use.
• Taking a balanced approach between cash, cost, service levels and risk: In a fast-moving environment, it is critical for companies to actively and consciously manage the trade-offs between cash, cost, service levels and risk that various WC strategies sometimes require. For automotive suppliers, this means regularly revisiting and reassessing their decisions concerning sourcing and outsourcing, lean practices and agile response, cost-to-serve and customer
• Driving WC synergies to deliver higher value from acquisitions: Automotive suppliers have continued to pursue
acquisitions to strengthen their competitive positions, expand their customer base, accelerate innovations and leverage buying power. A successful transaction depends in part on the ability of the acquiring company to realize within a targeted time frame the expected synergies, growth opportunities, cost savings and improved processes from integrating the two businesses. Our experience suggests that WC is often overlooked by the management of automotive suppliers during the pre- and post-transaction process. A transaction can also be a catalyst for more widely sharing internal WC leading practices across the extended organization.
• Changing internal behaviors: To realize all these opportunities in WC, an organization must not only continuously improve leading practices in this key area, but it must also change its internal behaviors. This requires people, process and technology to work more closely together. It also compels organizations to set adequate targets for improvements in sales, cost and cash; accurately assess the progress being made at both a corporate and unit level; and align the compensation of different groups (with
interests) to the relevant performance measures.
11Cash on the road

12
This report is based on a review of the WC performance of 40 of the largest automotive suppliers (by sales) headquartered in North America (18 companies), Europe (15) and Japan (7). Most of them are Tier 1 suppliers
Methodology
The North American companies are: American Axle & Manufacturing Holdings, Meritor, BorgWarner, Cooper Tire & Rubber, Dana Holding, Delphi Automotive, Exide Technologies, Federal-Mogul, Gentex, The Goodyear Tire & Rubber, Johnson Controls, Lear, Magna International, Modine Manufacturing, Superior Industries International, Tenneco, TRW Automotive Holdings and Visteon.
The European companies are: Autoliv, Continental, Faurecia, ElringKlinger, Georg Fischer, GKN, Grammer, Haldex, Michelin, Nokian Tyres, Plastic Omnium, Robert
The Japanese companies are: Aisin Seiki, Bridgestone, DENSO, Tokai Rika, Toyo Tire & Rubber, Toyoda Gosei and Yokohama.
to industry, region and country. It uses metrics based on publicly available annual
The WC performance of individual companies is not disclosed.
How EY can help
We can assist organizations in their transition to a cash-focused culture and help implement the relevant metrics. We can also identify areas for improvement
assist in implementing processes to improve forecasting and frameworks to sustain those improvements.
Companies that undertake WC improvement initiatives often realize a high return on investment. In addition to
optimization — through reduced transactional and operational costs and from lower levels of bad and doubtful debts and inventory obsolescence. Our WC professionals are there to help wherever you do business. It is how EY makes a difference.
EY’s global network of professionals helps clients to identify, evaluate and prioritize realizable improvements to liberate cash from WC through sustainable changes to policy, process, metrics and procedure adherence.
Cash on the road

Glossary• DSO (days sales outstanding): year-end
trade receivables net of provisions, including VAT and adding back securitized and factored receivables, divided by full-year pro forma sales and multiplied by 365 (expressed as a number of days of sales, unless stated otherwise)
• DIO (days inventory outstanding): year-end inventories net of provisions, divided by full-year pro forma sales and multiplied by 365 (expressed as a number of days of sales, unless stated otherwise)
• DPO (days payable outstanding): year-end trade payables, including VAT and adding back trade-accrued expenses, divided by full-year pro forma sales and multiplied by 365 (expressed as a number of days of sales, unless stated otherwise)
• C2C (cash-to-cash): equals DSO, plus DIO, minus DPO (expressed as a number of days of sales, unless stated otherwise)
• Pro forma sales: reported sales net of VAT and adjusted for acquisitions and disposals when this information is available
13Cash on the road

AcknowledgementsOur special thanks go to Marc Loneux, our WC research director, for his energy in driving to completion the data accumulation and analysis required for this report.
EY | Assurance | Tax | Transactions | Advisory
About EY
EY is a global leader in assurance, tax, transaction and advisory services. The insights and quality services we deliver help build trust and confidence in the capital markets and in economies the world over. We develop outstanding leaders who team to deliver on our promises to all of our stakeholders. In so doing, we play a critical role in building a better working world for our people, for our clients and for our communities.
EY refers to the global organization and may refer to one or more of the member firms of Ernst & Young Global Limited, each of which is a separate legal entity. Ernst & Young Global Limited, a UK company limited by guarantee, does not provide services to clients. For more information about our organization, please visit ey.com.
How EY’s Global Automotive Center can help your business
The global recession reset the automotive sector landscape. As the sector recovers, automotive companies across the value chain must focus on profitable and sustainable growth, financial and operational stability, investments in new technologies and seizing opportunities in high-growth markets. If you lead an automotive business, you need to anticipate trends, identify implications and make informed decisions that support your business goals. Our Global Automotive Center enables our worldwide network of more than 7,000 sector-focused assurance, tax, transaction and advisory professionals to share powerful insights and deep sector knowledge with businesses like yours. These insights, combined with our technical experience in every major global automotive market, will help you to accelerate strategies and improve performance. Whichever segment of the automotive sector you are in — from component suppliers to commercial or light vehicle manufacturers or retailers — we can provide the insights you need to succeed.
About EY’s Transaction Advisory ServicesHow you manage your capital agenda today will define your competitive position tomorrow. We work with clients to create social and economic value by helping them make better, more informed decisions about strategically managing capital and transactions in fast changing-markets. Whether you’re preserving, optimizing, raising or investing capital, EY’s Transaction Advisory Services combine a unique set of skills, insight and experience to deliver focused advice. We help you drive competitive advantage and increased returns through improved decisions across all aspects of your capital agenda.
© 2013 EYGM Limited. All Rights Reserved.
EYG no. EDOO81
CSG/GSC2013/1048771ED 0114
In line with EY’s commitment to minimize its impact on the environment, this document has been printed on paper with a high recycled content.
This material has been prepared for general informational purposes only and is not intended to be relied upon as accounting, tax, or other professional advice. Please refer to your advisors for specific advice.
ey.com
Working capital services contacts
Name Telephone Email
Asia Mike Gildea + 6563098809 [email protected]
Wayne Boulton +61 3 9288 8016 [email protected]
Benelux Danny Siemes +31 88 407 8834 [email protected] Simon Rockcliffe +1 416 943 3958 [email protected] Stepanuik +1 416 943 2752 [email protected]
Rasmus Jacobsen +45 51 58 25 24 [email protected]
France Benjamin Madjar +33 1 55 61 00 67 [email protected] Gösta Holmqvist +358 207 280 190Germany Dirk Braun +49 6196 996 27586 [email protected] Wenders + 49 211 9352 13851 [email protected] Ankur Bhandari +91 22 6192 0590 [email protected] Stefano Focaccia +39 0280669423 [email protected] America Matias De San Pablo +5411 4318 1542 [email protected]
Norway
Peter Stenbrink +46 8 5205 9426 [email protected] Johan Nordström +46 8 5205 9324 [email protected] Stenbrink +46 8 5205 9426 [email protected] Thomas Pallgen +41 58 286 40 08 [email protected] & Ireland Jon Morris +44 20 7951 9869 [email protected] Evans +44 20 7951 7704 [email protected] New +44 20 7951 0502 [email protected]
Marc Loneux +44 20 7951 3784 [email protected]
USSteve Payne +1 212 773 0562 [email protected] Kingma +1 312 879 4305 [email protected] Richards +1 212 773 6688 [email protected] Tennant + 1 212 773 3426 [email protected] Wright +1 408 947 5475 [email protected]
Contacts
Global Automotive contacts
Mike HanleyGlobal Automotive Leader
+1 313 628 8260 [email protected]
Jeff HenningGlobal Automotive Markets Leader
+1 313 628 8270 [email protected]
Peter Mao
Automotive Leader
+86 10 5815 2858 [email protected]
Koki ItoJapan Automotive Leader
+81 3 3503 1100 [email protected]
Alicia MasseAutomotive Transaction Advisory Services — Restructuring
+1 313 628 8770 [email protected]