catalog visual 3.0
DESCRIPTION
VISUAL 3.0 the interactive maps software for an intelligent data analysis.TRANSCRIPT

v 3.0
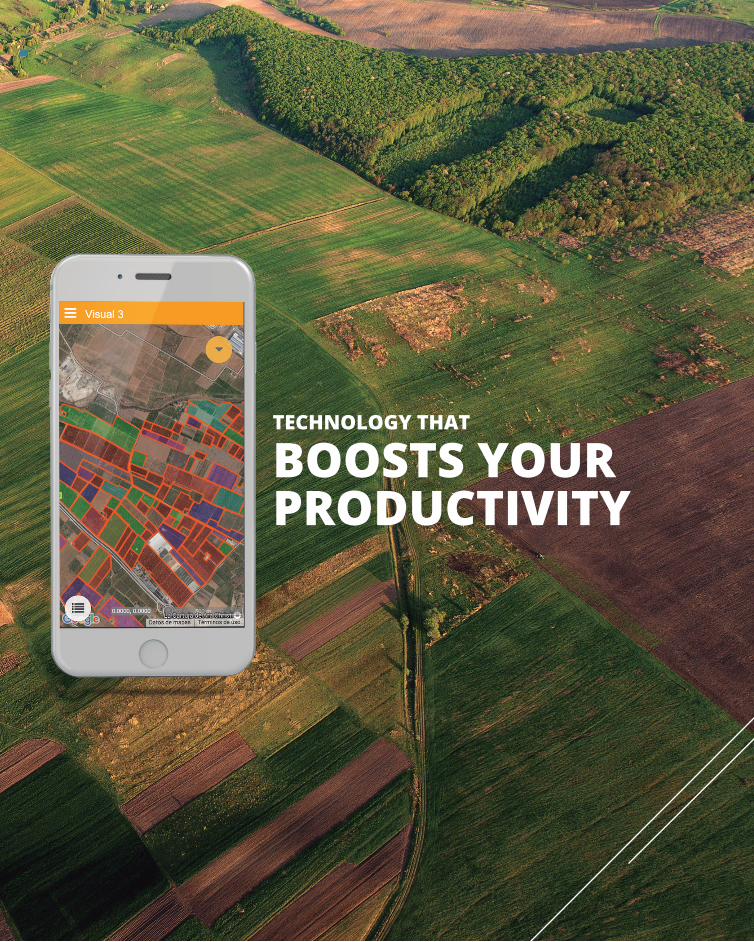
TECHNOLOGY THAT BOOSTS YOUR PRODUCTIVITY

4
TECHNOLOGY FOR A PROFITABLE AGRICULTURAL MANAGEMENTvisual is the technology that improves efficiency and increases the productivity of your agricultural business. The software optimizes the execution of tasks in field, like harvesting or purchases, using a system of custom-made interactive maps and smart data analysis.
5
66

7
SMARTA global view of your business to improve decisions making.
DYNAMICLook up data at plot or general level and compare results.
CUSTOM-MADEChose the technical modules according to your needs.
GRAPHICClassify usingcolor codes.
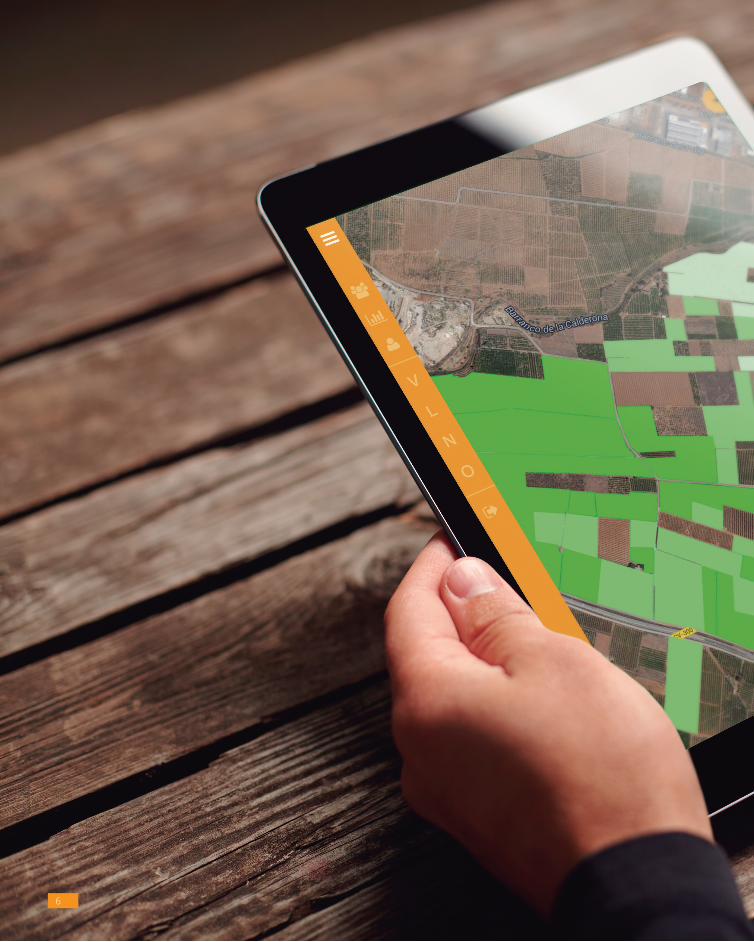
MULTIPLATFORMFrom any computer, tablet or smartphone.
ALWAYS AVAILABLEUse anywhere, onlineand offline.
PRIVATEShare information among your staff.
FLEXIBLEAble to connect with external data sources.
THESOLUTION

8
Find your plots andfind your location inthe field.
Look up currentand historical dataof plots.
Attach picturesand documents toeach plot.
Allocate and register tasks toyour staff.
Connect with farmers and agronomists by email or text messages.
Work withyour staff realtime.
Display the status ofyour plots with interactivemaps.
Check the analysis,use data and makedecisions.
TAKE ADVANTAGE OF THE
FUNCTIONALITIES
99
Global view. Know andcompare how your plotswork.
Profitability. Makedecisions well informed andon time.
Productivity. Expeditethe work of yourstaff.
Performance. Analyzehow your actions change performance.
Growth. Check howyour crops evolve during the season.
Efficiency. Designthe optimum harvestingplan.
Effectiveness. Takecontrol of yourbusiness.
Order. Organize yourwork and keep all your data in a single place.
ENJOY ITS
BENEFITS
10
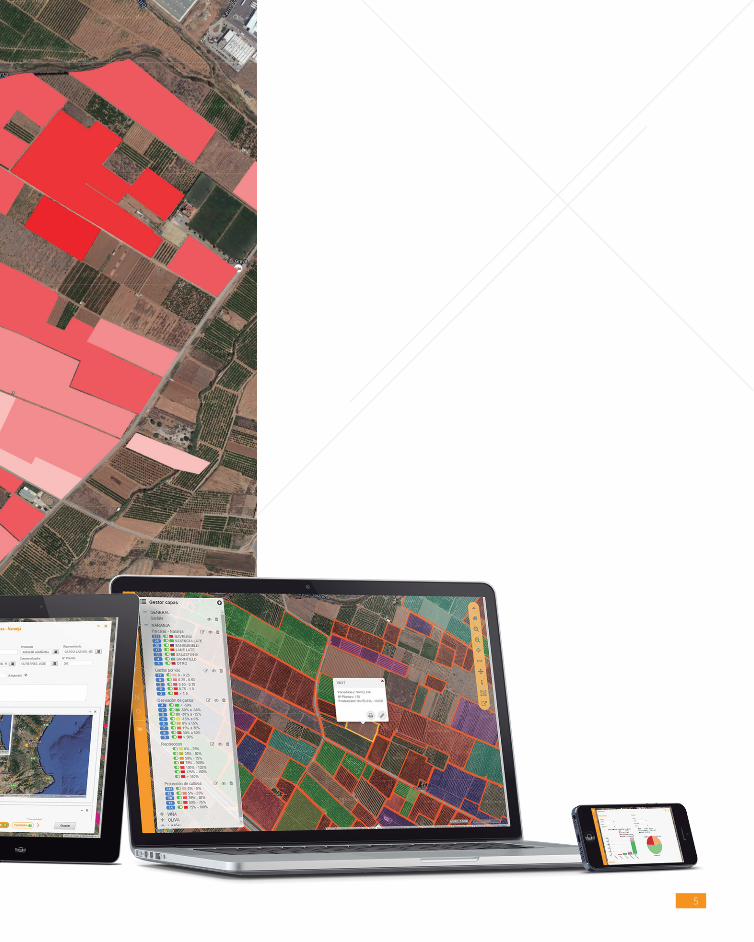
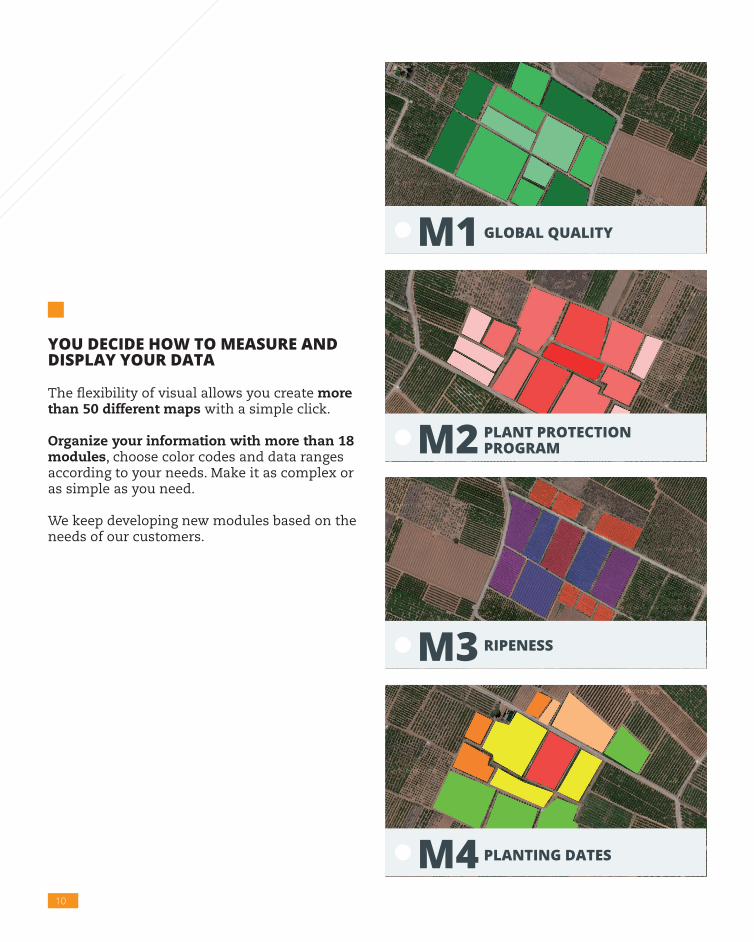
YOU DECIDE HOW TO MEASURE AND DISPLAY YOUR DATA
The flexibility of visual allows you create more than 50 different maps with a simple click.
Organize your information with more than 18 modules, choose color codes and data ranges according to your needs. Make it as complex or as simple as you need.
We keep developing new modules based on the needs of our customers.
M1 GLOBAL QUALITY
M3 RIPENESS
M2 PLANT PROTECTION PROGRAM
M4 PLANTING DATES

11
M5 YIELD
M7 INSPECTIONS & AUDITS
M6 HARVEST PROGRESS
M8 QUALITY CONTROL
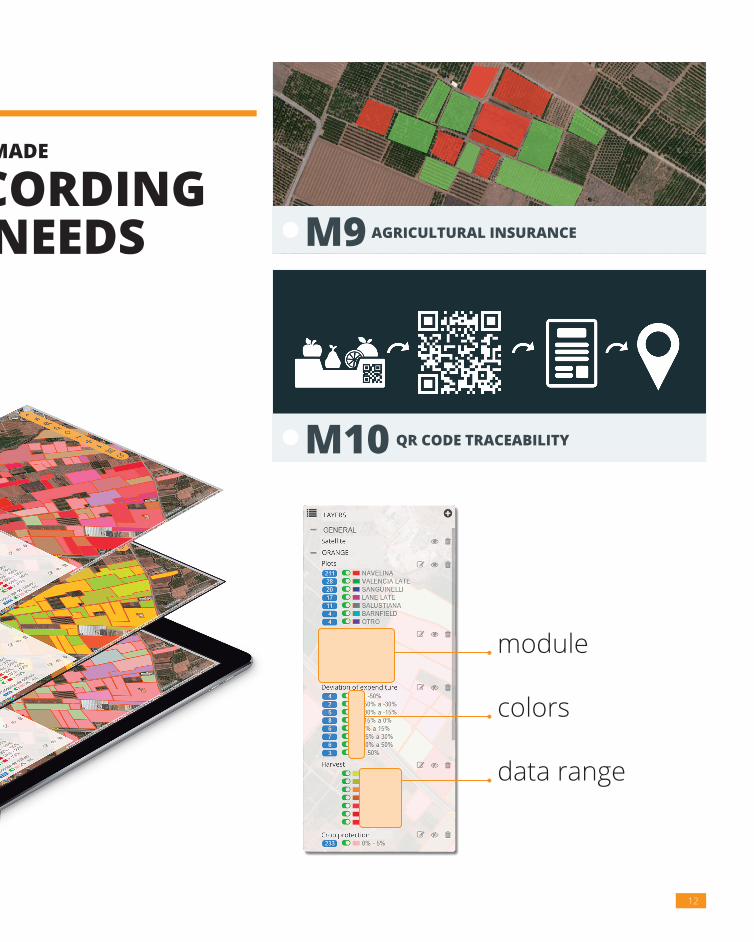
INTERACTIVE CUSTOM-MADE
MAPS ACCORDING TO YOUR NEEDS
12
module
colors
data range
M9 AGRICULTURAL INSURANCE
M10 QR CODE TRACEABILITY
INTERACTIVE CUSTOM-MADE
MAPS ACCORDING TO YOUR NEEDS

13
M11 COST CONTROL M15 VIGOR MAP
M16 POINTS CONTROL
M17 PHENOLOGICAL STAGES
M18 IRRIGATION CONTROL
M12 PHYTOSANITARY
M13 TASK MANAGEMENT
M14 FERTILIZERS

14
HOW DOES visual
BENEFIT DIFFERENTMEMBERS OF YOUR TEAM?
• CEO/CFOs are able to run a more profitable operation with accurate and real-time cost and revenue data, at a field and enterprise level.
• Agronomists are able to scout, communicate and execute recommendations more accurately. Save time by eliminating manual paperwork, and automatically managing and recording all transactions.
As a result youincrease efficiency, profit and yield
• Ops managers get more out of their team through easier task, schedules and people management.
• Buyers have the best tool to identify the purchase, real-time locating the plot, and their features.
• Farmers can update the farming data.
15
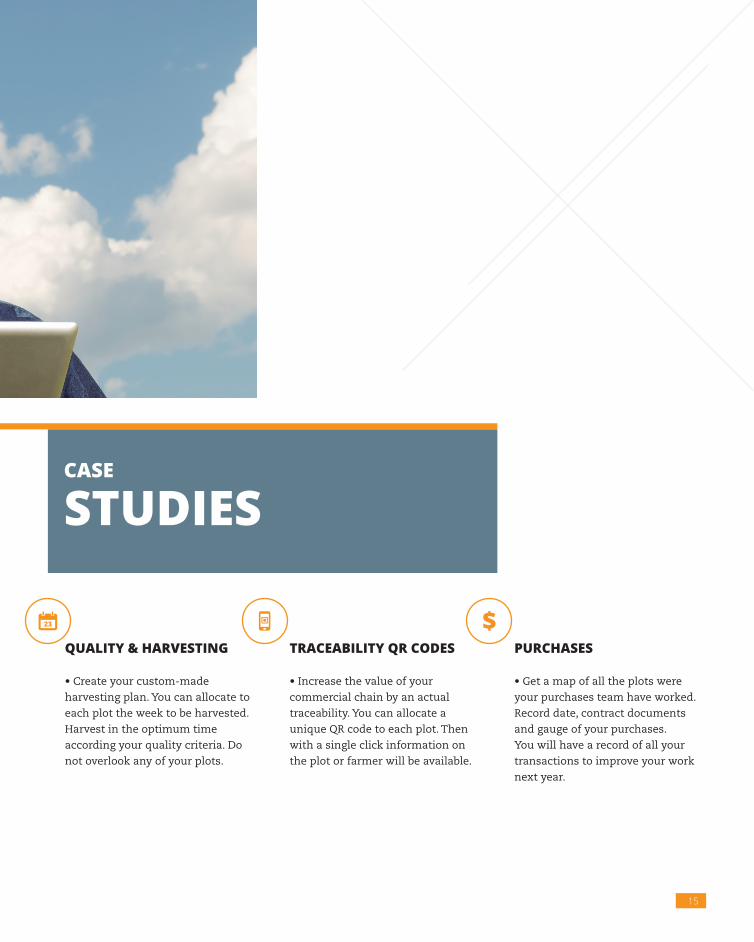
CASE
STUDIES
QUALITY & HARVESTING
• Create your custom-made
harvesting plan. You can allocate to
each plot the week to be harvested.
Harvest in the optimum time
according your quality criteria. Do
not overlook any of your plots.
TRACEABILITY QR CODES
• Increase the value of your
commercial chain by an actual
traceability. You can allocate a
unique QR code to each plot. Then
with a single click information on
the plot or farmer will be available.
PURCHASES
• Get a map of all the plots were
your purchases team have worked.
Record date, contract documents
and gauge of your purchases.
You will have a record of all your
transactions to improve your work
next year.

16
HOW visual
WORKS IN 3 SIMPLESTEPS
STEP 1: SET UPChoose your modules and number of users. In several days you will have all your data uploaded, your maps and the modules ready for you.
STEP 2: TRAININGWe will tell you how visual, already adapted to your needs, works.
STEP 3: SUPPORTWe will assign a person responsible for the success of your investment that will be always available.

17
Data import from:
• Your own ERP or your spreadsheet
• Fieldnotes
• Monitoring devices andsensors
• Images from drones and aerial photography
• Satellite images
• Other data sources
DATA
CONNECTIONSLook up in external data sources
• Agroclimatic data (Weather stations, climate data, soil properties and so on)
• Land Registry office

18
PARTNERS
PROGRAM
With visual partners program you will benefit from programs designed to back up the growth of your company, help you to create new opportunities, increase profitability and closing deals faster. Our partners program includes:
ALLIANCE PARTNER
• A company or individual with
experience in agroindustry sector
willing to present visual to its
contacts and customers.
AMBASSADOR PARTNER
• A company with technologic
capacity and a solid structure that
will represent visual and aspires to
lead visual´s commercial strategy in
the region.
DEVELOPER PARTNER
• A company or organization
providing services for the
agroindustry sector, with a
commercial team, a list of
customers and willingness to
complement the services that
currently offers.

19
visual CUSTOMERS
WORLDWIDE
Spain
France
USA
Chile Australia

VISUAL USA California309 W Main Street, Suite 101
Visalia CA 93291
Tel. +1 (559) 827-1711
VISUAL CHILE SantiagoGlamis 3355
Oficina 405
Tel. +56 (9) 612-21180
VISUAL MADRIDGran Vía, 28–8
28013 Madrid
Tel. +34 915 848 991
Global Innovation AwardsFinalist
VISUAL VALENCIAMayor, 41
46138 Rafelbuñol
Tel. +34 961 410 675