catalytic conversion of syngas to higher alcohols over …778216/fulltext01.pdf · catalytic...
TRANSCRIPT

Catalytic conversion of syngas to higher alcohols over MoS2-based catalysts
Robert Andersson
KTH Royal Institute of Technology
School of Chemical Science and Engineering
Department of Chemical Engineering and Technology
Stockholm, Sweden 2015

Catalytic conversion of syngas to higher alcohols over MoS2-based
catalysts.
ROBERT ANDERSSON
TRITA-CHE Report 2015:2
ISSN 1654-1081
ISBN 978-91-7595-392-2
Akademisk avhandling som med tillstånd av Kungliga Tekniska
högskolan i Stockholm framlägges till offentlig granskning för avläggande
av teknologie doktorsexamen, fredagen den 6 februari 2015 klockan
10:00 i sal D2, Lindstedtsvägen 5, Kungliga Tekniska högskolan,
Stockholm.
© Robert Andersson 2015 Tryck: Universitetsservice US-AB

I am among those who think that science has great
beauty. A scientist in his laboratory is not only a
technician: he is also a child placed before natural
phenomena which impress him like a fairy tale.
MARIE CURIE

i
Abstract
The present thesis concerns catalytic conversion of syngas
(H2+ CO) into a blend of methanol and higher alcohols, an
attractive way of producing fuels and chemicals. This route has the
potential to reduce the oil dependence in the transport sector and,
with the use of biomass for the syngas generation, produce CO2-
neutral fuels.
Alkali promoted MoS2-based catalysts show a high selectivity
to higher alcohols, while at the same time being coke resistant,
sulfur tolerant and displaying high water-gas shift activity. This
makes this type of catalyst especially suitable for being used with
syngas derived from biomass or coal which typically has a low
H2/CO-ratio.
This thesis discusses various important aspects of higher
alcohol synthesis using MoS2-based catalysts and is a summary of
four scientific papers. The first part of the thesis gives an
introduction to how syngas can be produced and converted into
different fuels and chemicals. It is followed by an overview of
higher alcohol synthesis and a description of MoS2-based catalysts.
The topic alcohol for use in internal combustion engines ends the
first part of the thesis.
In the second part, the experimental part, the preparation of
the MoS2-based catalysts and the characterization of them are
handled. After describing the high-pressure alcohol reactor setup,
the development of an on-line gas chromatographic system for
higher alcohol synthesis with MoS2 catalysts is covered (Paper I).
This method makes activity and selectivity studies of higher
alcohol synthesis catalysts more accurate and detailed but also
faster and easier. Virtually all products are very well separated and
the established carbon material balance over the reactor closed
well under all tested conditions. The method of trace level sulfur
analysis is additionally described.
Then the effect of operating conditions, space velocity and
temperature on product distribution is highlighted (Paper II). It is

ii
shown that product selectivity is closely correlated with the CO
conversion level and why it is difficult to combine both a high
single pass conversion and high alcohol selectivity over this
catalyst type. Correlations between formed products and formation
pathways are additionally described and discussed. The CO2
pressure in the reactor increases as the CO conversion increases,
however, CO2 influence on formation rates and product
distribution is to a great extent unclear. By using a CO2-containing
syngas feed the effect of CO2 was studied (Paper III).
An often emphasized asset of MoS2-based catalysts is their
sulfur tolerance. However, the use of sulfur-containing feed and/or
catalyst potentially can lead to incorporation of unwanted organic
sulfur compounds in the product. The last topic in this thesis
covers the sulfur compounds produced and how their quantity is
changed when the feed syngas contains H2S (Paper IV). The effect
on catalyst activity and selectivity in the presence of H2S in the
feed is also covered.
Keywords: catalytic conversion; higher alcohols; mixed alcohols; MoS2;
syngas

iii
Sammanfattning
Titel: Katalytisk omvandling av syntesgas till högre alkoholer över
MoS2-baserade katalysatorer.
Denna avhandling behandlar katalytisk omvandling av
syntesgas (H2 + CO) till en blandning av metanol och högre
alkoholer, ett attraktivt sätt att producera bränslen och kemikalier.
Denna produktionsväg har potential att minska oljeberoendet i
transportsektorn och, om biomassa används för produktionen av
syntesgas, kan dessutom CO2-neutrala bränslen framställas.
Alkaliberikade MoS2-baserade katalysatorer uppvisar en hög
selektivitet till högre alkoholer, medan de samtidigt är
koksresistenta, svaveltoleranta och påvisar hög vattengasskift-
aktivitet. Detta gör denna typ av katalysator speciellt lämpad för
användning med syntesgas producerad från biomassa eller kol,
som typiskt har ett lågt H2/CO-förhållande.
Denna avhandling behandlar olika viktiga aspekter av högre
alkoholsyntes med MoS2-baserade katalysatorer och är en
sammanställning av fyra vetenskapliga publikationer. Den första
delen av avhandlingen ger en introduktion till hur syntesgas kan
produceras och omvandlas till olika bränslen och kemikalier. Den
följs av en översikt över syntes av högre alkoholer och en
beskrivning av MoS2-baserade katalysatorer. Ämnet alkoholer för
användning i förbränningsmotorer avslutar den första delen av
avhandlingen.
I den andra delen, den experimentella delen, behandlas
framställningen av MoS2-baserade katalysatorer och deras
karakterisering. Efter att högtrycksreaktorn för alkoholsyntes
beskrivits, följer en beskrivning av utvecklingen av ett ”on-line”
gaskromatografiskt system för syntes till längre alkoholer med
MoS2-baserade katalysatorer (Publikation I). Den här metoden gör
aktivitets- och selektivitetsstudier av katalysatorer för högre
iv
alkoholer från syntesgas mer exakta och detaljerade men också
snabbare och enklare. Så gott som alla produkter separeras mycket
väl med denna metod och den upprättade kolmaterialbalansen
över reaktorn stänger mycket väl under alla testade förhållanden.
Analysmetoden för mätning av svavel i mycket låga halter beskrivs
också.
Därefter beskrivs effekten av reaktionsbetingelserna,
gas(volyms)hastighet och temperatur, på produktfördelningen
(Publikation II). Det befanns att produktselektiviteten är
sammankopplad med nivån på CO-omsättningen varför det är
svårt att erhålla både en hög omsättning och hög
alkoholselektivitet över denna katalysatortyp. Sambanden mellan
bildade produkter och deras bildningsvägar beskrivs och
diskuteras dessutom. När CO-omsättningen ökar ökar även CO2-
trycket i reaktorn, men hur CO2 påverkar bildningshastigheter och
produktfördelningen är till stor del oklart. Genom att förse
reaktorn med en syntesgas innehållande CO2 kunde effekten av
CO2 studeras (Publikation III).
En ofta betonad fördel med MoS2-baserade katalysatorer är
deras svaveltolerans. Men användningen av en svavelinnehållande
matargas och/eller katalysator kan potentiellt också leda till
oönskade organiska svavelföreningar i produkten. Det sista ämnet
i den här avhandlingen är vilka svavelföreningar som produceras
och hur mängden av dessa förändras när syntesgasen som matas
till reaktorn innehåller H2S (Publikation IV). Effekten på
katalysatoraktivitet och selektivitet i närvaro av H2S i matargasen
beskrivs också.
v
Publications referred to in this thesis
The work presented in this thesis is based on the following
publications. The papers are appended at the end of the thesis, and
are referred to in the text using Roman numerals.
I. R. Andersson, M. Boutonnet, S. Järås
On-line gas chromatographic analysis of higher alcohol
synthesis products from syngas
Journal of Chromatography A, 1247 (2012) 134-145.
II. R. Andersson, M. Boutonnet, S. Järås
Correlation patterns and effect of syngas conversion level
for product selectivity to alcohols and hydrocarbons over
molybdenum sulfide based catalysts
Applied Catalysis A, 417 (2012) 119-128.
III. R. Andersson, M. Boutonnet, S. Järås
Effect of CO2 in the synthesis of mixed alcohols from
syngas over a K/Ni/MoS2 catalyst
Fuel, 107 (2013) 715-723.
IV. R. Andersson, M. Boutonnet, S. Järås
Higher alcohols from syngas using a K/Ni/MoS2 catalyst:
Trace sulfur in the product and effect of H2S containing
feed
Fuel, 115 (2014) 544-550.
Contributions to the publications:
I was the main responsible for planning, performing and
evaluating the experimental work included in papers I-IV. I was
also the main writer of papers I-IV.

vi
Conference contributions
R. Andersson, Y. Xiang, M. Boutonnet, S. Järås, N. Kruse
Chemical Transient Kinetics Applied to CO hydrogenation over
Molybdenum sulfide based catalysts
Poster presented at International conference on functional
materials: Catalysis, Electrochemistry and Surfactants, Fuengirola,
Spain, 2011.
R. Andersson, M. Boutonnet, S. Järås
Effect of temperature and space velocity in Ethanol and Higher
Alcohol Synthesis from syngas over Molybdenum-based catalysts
Poster presented at the Nordic symposium on catalysis,
Marienlyst, Danmark, 2010.
S. Lögdberg, M. Lualdi, R. Andersson, F. Regali, M. Boutonnet, S.
Järås
Biofuels from gasified biomass
Poster presented at COST Action CM0903 workshop, Córdoba,
Spain, 2010.
R. Andersson, M. Boutonnet, S. Järås
Ethanol and higher alcohol synthesis from syngas over
molybdenum-based catalysts from microemulsion
Poster presented at EuropaCat IX: Catalysis for a Sustainable
world, Salamanca, Spain, 2009.
M. Lualdi, S. Lödgberg, R. Andersson, S. Järås, D. Chen
Nickel-Iron-Aluminum-hydrotalcite derived catalysts for the
methanation reaction
Poster presented at EuropaCat IX: Catalysis for a Sustainable
world, Salamanca, Spain, 2009.

vii
R. Andersson, M. Boutonnet, S. Järås
Ethanol and Higher Alcohol Synthesis from syngas over
Molybdenum-based catalysts
Poster presented at North American Catalysis Society Meeting, San
Francisco, USA, 2009.

viii
Table of contents
1 Introduction ................................................................... 1
1.1 Setting the scene ..................................................................... 1
1.2 Scope of the thesis ................................................................... 2
2 Syngas and synthetic fuels .............................................. 5
2.1 Syngas generation and cleaning .............................................. 6
2.1.1 Syngas from coal and biomass ........................................... 7
2.1.2 Syngas from natural gas ..................................................... 8
2.2 Syngas to products .................................................................. 9
2.2.1 Methanol, dimethyl ether and methanol-to-gasoline ........ 9
2.2.2 Fischer-Tropsch ................................................................ 11
2.2.3 Higher alcohols ................................................................ 12
3 Higher alcohol synthesis .............................................. 13
3.1 Introduction .......................................................................... 13
3.2 Catalysts, product distribution and developed processes ..... 15
3.3 Thermodynamics for higher alcohol synthesis ..................... 18
3.4 Higher alcohol synthesis, a historical resume ...................... 21
4 Alcohol fuels for internal combustion engines ............. 25
4.1 Fuel properties ...................................................................... 25
4.2 Alcohols as motor fuel is not new ......................................... 28
4.3 Legislation and current use of alcohols ................................ 28
5 Higher alcohol synthesis with molybdenum sulfide
catalysts........................................................................ 31
5.1 General .................................................................................. 31
5.2 Structure of MoS2 .................................................................. 32
5.3 Alkali and group VIII promoters .......................................... 34
5.4 Reaction mechanism ............................................................. 36
5.5 Anderson-Schulz-Flory (ASF) distribution ........................... 37
6 Catalyst preparation and characterization ................... 41
6.1 Catalysts preparation routes ................................................. 41
6.1.1 Decomposition of sulfur-molybdenum compounds ........ 41
6.1.2 Sulfidation of MoOx ......................................................... 42
6.2 Preparation of K-Ni-MoS2 and MoS2 catalysts ..................... 42

ix
6.3 Catalyst characterization ...................................................... 43
6.3.1 N2 physisorption and ICP-MS ......................................... 43
6.3.2 X-ray diffraction (XRD) ................................................... 44
7 Reaction equipment and analytical system ................... 47
7.1 High pressure alcohol synthesis reactor ............................... 47
7.2 Development of an analytical system for higher alcohol
synthesis products ................................................................ 49
7.2.1 Analytical principles and product separation (GC1) ....... 50
7.2.2 Material balance, selectivity, conversion and
calibration (GC1) .............................................................. 55
7.2.3 Method validation and conclusions (GC1)....................... 57
7.2.4 Trace sulfur analysis (sulfur GC) ..................................... 60
8 Effect of operation conditions and gas feed
composition on product distribution ............................ 61
8.1 Effect of temperature and space velocity on CO
conversion and water-gas shift ............................................. 62
8.2 Selectivity for the promoted catalyst (K-Ni-MoS2) ............... 63
8.3 Selectivity for the non-promoted catalyst (MoS2) ................ 68
8.4 Alkali effect ........................................................................... 70
8.5 Correlation between alcohol, aldehyde and olefin
selectivities ............................................................................ 70
8.6 Alcohol chain growth ............................................................ 73
8.7 Ester formation ..................................................................... 75
8.8 Effect of CO2, H2 and CO partial pressure ............................ 79
9 Sulfur in the product and effect of H2S-containing
feed .............................................................................. 83
9.1 Background and introduction ............................................... 83
9.2 Sulfur products in condensate and gas phase ...................... 84
9.3 Effect of H2S on sulfur products ........................................... 87
9.4 Effect of H2S on CO conversion and product selectivity ....... 89
10 Final discussion and conclusions .................................. 91
Acknowledgements ........................................................... 96
Nomenclature ................................................................... 98
References ...................................................................... 100
Appendices: Papers I-IV


1
Chapter 1
Introduction
1.1 Setting the scene
One of the most important challenges that mankind has to
face in the upcoming years, is to secure energy supply for an ever
energy-thirstier world, while at the same time minimizing the
environmental impact and saving the planet [1]. Until 2050 the
world population is estimated to grow by more than 33% to
9.6 billion [2]. The population growth together with greater
prosperity and incomes in emerging economies drives this
increased energy demand. Using energy more efficiently probably
is the smartest and least costly ways to extend our world’s energy
supplies. However, even with the expected improvements in
energy usage a 37% increase in energy use is projected by the year
2040 and a 20% increase in CO2 emissions [3]. During the same
time period the number of cars and trucks on the world’s roads is
expected to more than double and the demand for oil for transport
to grow by 25% [3].
An interesting alternative for producing liquid fuels and/or
chemicals is via the so called synthesis gas route. Syngas can be
produced from many different carbon-containing materials, such
as coal and natural gas. Biomass is preferably the raw material of
choice, since greenhouse gas-neutral fuels can be produced. The
syngas can, depending on catalyst and operation conditions used,
be converted to either methanol through so-called i.e. methanol
synthesis, long hydrocarbons through so-called Fischer-Tropsch
synthesis or alcohols longer than methanol through so-called
higher alcohol synthesis (HAS). After product upgrading premium
liquid fuels are achieved.

2
1.2 Scope of the thesis
The present thesis concerns the catalytic conversion of syngas
(H2/CO) into a mixture of methanol and higher alcohols.
Producing higher alcohols in this way is better known as higher
alcohol synthesis (HAS) or mixed alcohol synthesis (MAS) and is
an attractive future way for producing fuels and chemicals. Focus
in this work is on the use of H2-poor syngas (with low H2/CO ratio)
which typically is achieved from biomass and coal, while syngas
derived from natural gas gives a syngas much richer in H2. Alkali-
promoted MoS2-based catalysts display a high selectivity to higher
alcohols, while at same time being coke resistant, sulfur tolerant
and displaying high water-gas shift activity. This makes this type of
catalyst especially suitable for being used with syngas derived from
biomass or coal.
The present thesis discusses various important aspects related
to the field of HAS with alkali-promoted MoS2 catalysts, based on
the main findings from the four appended papers.
In the first paper (Paper I), the development of a rapid and
accurate on-line gas chromatographic system for HAS with
MoS2 catalysts is presented. This makes studies of HAS
catalysts more detailed and accurate but also faster and
easier.
In the second paper (Paper II), the effect of operating
conditions, space velocity and temperature on product
distribution is highlighted. Correlations between formed
products, and formation pathways are additionally
discussed.
In the third paper (Paper III), the effect of CO2-containg
feed under constant syngas partial pressures was mainly
studied.
3
In the fourth paper (Paper IV), possible incorporation of
trace sulfur into the alcohol product and the effect on
product distribution with and without H2S in the syngas
feed is discussed.
The work included in this thesis was conducted at the Department
of Chemical Engineering and Technology at the Royal Institute of
Technology (KTH), Stockholm, Sweden.


5
Chapter 2
Syngas and synthetic fuels
Fig. 2.1. Syngas generation and conversion routes to fuel and chemicals.
Adapted from [4]
Liquid fuels and chemicals can be produced by the so called
synthesis gas (syngas) route (see Fig. 2.1). The syngas (H2/CO) in
turn can be created from any suitable carbon source, but the most
common raw materials are coal or natural gas. If the carbon source
is biomass (e.g. wood or organic wastes) also greenhouse gas-
neutral fuels and chemicals can be produced. In countries with
available coal, natural gas or biomass sources, the process
therefore has the possibility to reduce foreign oil dependence,
increase energy security and create employment. A brief overview
of this conversion process from feedstock to products via the
syngas route will follow in this chapter. The major steps in this
process can be seen in Fig. 2.2.
Methanol/DME synthesis
Higher alcohol synthesis
Fischer-Tropsch
synthesis
CH3OH / DME C1-C6 alcohols
Long hydrocarbons
Gasification
Steam reforming
Partial oxidation
Bio mass
Coal
Naturalgas

6
Fig. 2.2. Simplified drawing for production of fuels and chemicals through
the synthesis route.
2.1 Syngas generation and cleaning
In the production of synthetic fuels and chemicals, the syngas
generation, cleaning and conditioning part stands for most of the
investment cost and largest part of the energy use in the plant.
About 60-70% of the investment cost in a natural gas-based
methanol plant is normal [5]. The design of the syngas preparation
part is therefore critical for the economics of the whole plant.
However, the design of the synthesis gas preparation section will
mainly depend on the available feedstock together with the
downstream use of the syngas. Good integration of all processes
and energy usage is essential for plant efficiency and economy [6].
Obviously, the feedstock availability and price also is vital for plant
design, plant size and economy.
Syngas
manufacturing
Product upgrade/
purification
Alcohol and
hydrocarbon
synthesis
O2
steam
Autothermal/
Steam reforming Partial oxidation Gasification
O2
Water removal Water removal
alcohol separation
Water removal
Hydrocracking
Isomerization
Catalytic reforming
Alkylation
Methanol
synthesis
Higher alcohol
synthesis
Fischer-Tropsch
synthesis
Syngas cleaning
and conditioning
Biomass Coal Natural gas

7
2.1.1 Syngas from coal and biomass
The technology for producing syngas is generally separated
into two categories, gasification and reforming. Gasification is the
term used to describe conversion of solid or heavy liquid feedstock
to syngas e.g. coal or biomass, while reforming is used for
conversion of gaseous or light liquid feedstock to syngas e.g.
natural gas. In gasification the carbon source is combined with
steam and/or oxygen to yield a gas containing mainly hydrogen,
carbon monoxide, carbon dioxide and methane. The proportions of
these component gases depend on a number of parameters such as
used feedstock (moisture and composition), gasification medium
(steam, oxygen and/or air) and reaction conditions (temperature,
pressure) together with gasifier and gasification reaction
technology used [7]. There are three main gasifier types (Fig. 2.3):
fixed bed (bubbling or circulating), fluidized bed (downdraft and
updraft) and entrained flow gasifiers, all with their own advantages
and disadvantages [8].
Fig. 2.3. The three most common types of gasifiers. Reproduced with
permission from [9].
Once the feedstock has been converted to gaseous state,
undesirable substances as such as sulfur (COS, H2S), nitrogen
Fixed bed gasifier Fluidized bed gasifier Entrained flow gasifier

8
(NH3, HCN) and halogen compounds (HCl) as well as volatile
metals (K, Na), particulates (soot, dust, char, ash) and tars
(polyaromatics) are removed [10]. The gasification process and the
composition of the feedstock determines this contamination level
[8].
Syngas generated through coal or biomass gasification
typically has a H2/CO ratio in the range 0.45-1.5 [11, 12]. This
means that syngas generated from these resources are much
poorer in H2 and richer in CO than syngas produced from natural
gas.
2.1.2 Syngas from natural gas
The predominant commercial technology for syngas
generation is steam methane reforming (SMR) from natural gas, in
which methane and steam catalytically and endothermically are
converted to hydrogen and carbon monoxide. An alternative
Fig. 2.4. Reactors for syngas production from natural gas. Adapted from
[4].
technology is partial oxidation (POX) in which methane and
oxygen exothermically is converted to syngas. The two
technologies inherently produce syngas with greatly different
H2/CO ratio being about 3-5 in SMR (can be lowered with CO2
addition) and about 1.6-1.9 in POX [13, 14]. Partial oxidation can
steam methane reforming partial oxidation catalytic partial oxidation auto thermal reforming
burners
catalyst
bed
fuel
sulfur
removal
heat recovery
section
O2
CH4
CH4
feed steam
syngas syngas syngas
CH4 O2
catalyst
bed
CH4 + H2O
O2
Combustion:
generation
of heat
syngas
9
be performed both catalytically and non-catalytically. Autothermal
reforming (ATR) is a third alternative, which can be seen as a
hybrid between the two previous in a single reactor. In the
combustion zone, parts of the feed are combusted with oxygen,
while in the reforming zone the remaining feed and the produced
CO2 and H2O are reformed catalytically to syngas. The required
energy for the endothermic reforming reactions is provided by the
exothermic oxidation reactions from the combustion zone.
2.2 Syngas to products
The search for efficient catalytic processes for fuels and
chemicals production from syngas has been going on for more than
a century. Early research and development was to a great part
performed in Germany in the 1910’s-1940’s and the quest for
efficient methanol, higher alcohols and hydrocarbon catalyst share
a common history [15, 16].
2.2.1 Methanol, dimethyl ether and methanol-to-gasoline
The first commercial catalyst for converting syngas (H2/CO)
to methanol was demonstrated by BASF in 1923 [17, 18].
CO + 2H2 → CH3OH ΔH°298K = -90.5 kJ/mol (2.1)
The catalyst contained ZnO-Cr2O3 and was only active at high
temperatures (350-400 ºC) and therefore very high pressures
(240-350 bar) were needed to reach acceptable conversion levels
(conversion is thermodynamically limited) [16]. This catalyst
formulation was used until the end of the 1960’s due to its
resistance towards sulfur, chlorine and group VIII carbonyls even
though more active catalysts were known [19]. The easily poisoned

10
but better Cu-based catalyst thereafter took over since new
efficient chemical and physical wash gas cleaning procedures had
been developed [20].
At present methanol is in general produced from methane
(natural gas) steam reforming, followed by methanol synthesis
using a Cu/ZnO/Al2O3 catalyst. This modern low pressure (50-
100 bar) and temperature (240-260 °C) process (first used in 1966
by ICI) has a selectivity above 99.5%, which is remarkable given
the great number of possible by-products, with methanol being one
of the least thermodynamically favorable products [16, 19].
Methanol is one of the world’s most heavily traded chemical
commodities and every day more than 180,000 tons of methanol is
produced in more than 100 plants worldwide [21].
Formed methanol can be dehydrated by a suitable catalyst
(e.g. γ-Al2O3) to form dimethyl ether (DME) (eq. 2.2) which in
addition to being a well-used chemical, can be used as a clean-
burning gaseous fuel for use in diesel engines (cetane number 55)
[22].
2 CH3OH → CH3OCH3 +H2O (2.2)
In the so called methanol-to-gasoline (MTG) process,
methanol can be converted to gasoline. In this process methanol is
partly dehydrated to produce an equilibrium mixture of methanol,
DME and water, followed by conversion to light olefins (C2-C4) and
in a final reaction step to higher olefins, n/iso-paraffins, aromatics
and naphthenes assisted by a zeolite catalyst (ZSM-5) [23].
MeOH → MeOH + DME + H2O → synthetic gasoline (2.3)
A fully commercial plant, producing 14,500 bbl/day was operated
in New Zealand, 1985-1998. The only presently running MTG plant

11
came on stream in 2009 in China; it has a capacity of 2,500
bbl/day [24].
2.2.2 Fischer-Tropsch
Fischer-Tropsch (FT) synthesis is a series of reactions
converting syngas (H2/CO) into a large spectrum of mainly linear
hydrocarbons (eq. 2.4). The name pays tribute to the Germans
Franz Fischer and Hans Tropsch who invented the method in the
1920’s [25, 26]. Presently, a handful of industrial Fischer-Tropsch
plants are in operation worldwide, operating with syngas derived
from natural gas or coal [27].
CO + 2H2 → -CH2- + H2O ΔH°298K = -165 kJ/mol (2.4)
The reaction is industrially performed with iron or cobalt-based
catalysts typically at a pressure around 20-40 bar [16]. The
product distribution is mainly determined by the operation
temperature and the choice of catalyst [6, 28]. Two operation
modes exist: High-temperature FT (HTFT) and low-temperature
FT (LTFT), which are performed at 300-350 °C and 200-240 °C,
respectively. In HTFT, Fe-based catalysts are used and the main
products are linear low molecular mass olefins, gasoline and
oxygenates [28]. In LTFT, Fe or Co-based catalysts are used for the
production of high-molecular linear waxes [28]. A significant
difference between Fe and Co catalysts is that the iron catalyst has
high water-gas shift activity while the water-gas shift activity for
cobalt catalyst is very poor [29, 30]. This means that the H2/CO-
usage ratio is much lower with the iron catalyst, due to the
simultaneously occurring water-gas shift (WGS) reaction. To
achieve a premium fuel, the raw FT product is upgraded to diesel
or gasoline using processes such as hydrocracking, isomerization,
catalytic reforming and alkylation [6].

12
2.2.3 Higher alcohols
Higher alcohol synthesis will be covered in a separate chapter,
since it is the main concern of this thesis are about.

13
Chapter 3
Higher alcohol synthesis
In the following, a short review of the field of higher alcohols
synthesis (HAS) and the most central concepts are presented. The
chapter starts with a general introduction to the field of higher
alcohol synthesis and the reactions involved. It is followed by a
presentation of the most important catalyst classes and processes
developed for higher alcohol synthesis, and how the alcohol
distributions for these processes look. The development of higher
alcohol synthesis from the start in the early 20th century until
present is briefly covered as well as the thermodynamic limits
imposed in HAS.
3.1 Introduction
Higher alcohol synthesis (HAS) is a series of exothermic
reactions, where CO and H2 (syngas) are converted into short
alcohols over a catalyst (Eqs. 3.1-3.5). A substantial part of the
alcohols should also be longer than methanol, thus the name.
CO + 2 H2 ⇌ CH3OH Methanol (3.1)
2 CO + 4 H2 ⇌ C2H5OH + H2O Ethanol (3.2)
3 CO + 6 H2 ⇌ C3H7OH + 2 H2O Propanol (3.3)
4 CO + 8 H2 ⇌ C4H9OH + 3 H2O Butanol (3.4)
n CO + 2n H2 ⇌ CnH2n+1OH + (n-1) H2O any alcohol (3.5)
The main side reactions are formation of hydrocarbons,
normally dominated by methane (eq. 3.6) together with short
paraffins and olefins. Oxygenated by-products such as aldehydes,

14
esters and ethers might also be formed depending on catalyst and
operation conditions used.
CO + 3H2 ⇌ CH4 + H2O (3.6)
The water-gas shift (WGS) reaction (eq. 3.7) occurs simultaneously
with catalysts having water-gas shift activity.
CO + H2O ⇌ CO2 + H2 ΔH°298K= -41.1 kJ/mol (3.7)
The WGS equilibrium constant is large under the temperatures
applied in higher alcohol synthesis, e.g. K330°C=26.8, K370°C=16.7
[31, 32]. When the catalyst has high water-gas shift activity, this
means that most of the water produced in the alcohol synthesis
(eqs. 3.2-3.5) is converted together with CO in the water-gas shift
reaction to CO2 and H2 (eq. 3.7). As an example, in the temperature
range 330-370°C, 96.4-94.4% of the produced water is converted
to CO2 if the H2/CO=1. The MoS2-based catalysts covered in this
thesis are of this type, displaying very high WGS activity.
This leads us to the definition of H2/CO usage ratio which is
the H2 per CO consumed to form a product e.g. ethanol. Four H2
and two CO are consumed in the formation and ethanol (and
water) (eq. 3.2) i.e. the H2/CO usage ratio is two. This is the usage
ratio over a catalyst without water-gas shift activity. However, if
the ethanol instead is formed over a catalyst with very high water-
gas activity, both the ethanol formation reaction (eq. 3.2) and the
water-gas shift reaction (eq. 3.7) occur simultaneously resulting in
eq. 3.8 and the usage ratio becomes very close to one.
2 CO + 4 H2 ⇌ C2H5OH + H2O H2/CO usage ratio=2 (3.2)
3 CO + 3 H2 ⇌ C2H5OH + CO2 H2/CO usage ratio=1 (3.8)

15
The effect of the water-gas shift reaction on the H2/CO usage ratio
for the most important reaction products is displayed in table 3.1.
For higher alcohol synthesis catalysts having water-gas shift
activity this mean that the feed syngas can have a lower H2/CO.
Table 3.1. The effect of the water-gas shift reaction on H2/CO usage ratio
for the displayed products.
Product H2/CO usage ratio H2/CO usage ratio without water-gas shift with water-gas shift a
Methanol 2 2
Ethanol 2 1
Propanol 2 0.8
Butanol 2 0.71
Methane 3 1 a assuming all H2O formed is converted.
3.2 Catalysts, product distribution and developed
processes
Presently, higher alcohols synthesis is not applied anywhere in
the world on an industrial scale. A handful conceptual processes
based on patented catalytic technologies have been developed and
tested in industrial plants, pilot plants or extensively tested in
bench scale reactors. The catalysts used in these processes are
based on the main HAS catalyst families shown in Table 3.2, giving
very different alcohol product distributions.

16
Table 3.2. Important types of higher alcohol catalysts
a HT=high temperature, LT=low temperature b branched primary alcohols, especially isobutanol in addition to methanol
together with a smaller amounts ethanol and propanol. c straight primary alcohols with a composition resembling the Anderson-Schulz-
Flory (ASF) distribution. d acetaldehyde, ethanol and acetates [33].
Information regarding these processes, such as process name,
catalyst composition and operating conditions can be found in
Table 3.3 while representative alcohol distributions under these
conditions are presented in Table 3.4. Changes in operation
conditions such as temperature, gas hourly space velocity (GHSV)
and syngas composition together with changes in catalyst
composition can, however, greatly change these product
distributions. A remarkable and unifying feature of most HAS
catalysts is the presence of an alkali promoter, either to achieve
higher alcohol selectivity or to stimulate higher alcohol selectivity.
Catalyst type Catalyst composition Product composition
HT methanol a ZnCrO, MnCrO,
ZnMnCrO + alkali
LT methanol a Cu/ZnO, Cu/ZnO/M2O3
(M=Al, Cr) + alkali
Molybendum-based
2
e.g. MoS2, Ni-MoS2, Co-
MoS2, MoC + alkali
MeOH + FT element Cu-Co, Cu-Ni + alkali
Rhodium-based e.g. Li-Mn-Rh, Rh-ZrO2C2 oxygenates d
straight-chain c
C1-C5 alcohols
MeOH + i-BuOH b
(EtOH+PrOH)

17
Tab
le 3
.3. K
ey d
ata
for
HA
S p
roce
sses
[3
4-3
7]
Dev
elo
pm
ent
stag
e
Ind
ust
rial
pla
nt
19
82
-19
87
(1
500
0 t
on
/yea
r)
Pilo
t p
lan
t
(73
0 t
on
/yea
r)
Ben
ch s
cale
Pilo
t p
lan
t
(670
to
n/y
ear)
a Pro
cess
dev
elo
pm
ent
com
pan
y d
isp
laye
d w
ith
in b
rack
ets
b
Met
ano
lo p
iu A
lco
li Su
per
iori
(M
AS)
dev
elo
ped
by
Snam
pro
gett
i, En
ich
em a
nd
Hal
do
r To
psø
e (S
EHT)
c Lu
rgi a
nd
Sü
d C
hem
ie
d D
ow
Ch
emic
als
and
Un
ion
Car
bid
e e In
stit
ut
du
Fra
nça
is d
u P
étro
le (
IFP
) w
ith
Idem
itsu
Ko
san
(IK
)
GH
SV
(h-1
)
30
00
-1
50
00
40
0-
60
00
30
00
-1
00
00
30
00
- 6
00
0
H2/
CO
-ra
tio
0.5
-3
1
1
1.2
-1.8
Pre
ssu
re
(MP
a)
9-1
8
6-1
0
5-2
0
6-1
0
Tem
p.
(°C
)
33
0-4
30
25
0-3
00
25
0-3
50
28
0-3
20
Cat
alys
t ty
pe
(pro
mo
ted
)
Mo
dif
ied
H
T m
eth
ano
l
Mo
dif
ied
LT m
eth
ano
l
Mo
-bas
ed
MeO
H &
FT
ele
men
t
Cat
alys
t
K-Z
n-C
r (C
u)
K-C
u-Z
n-A
l
K-M
oS 2
, K
-Ni-
Mo
S 2,
K-C
o-M
oS 2
K-C
u-C
o-A
l,
K-C
u-N
i-Ti
Pro
cess
nam
ea
MA
S (S
EHT)
b
Oct
amix
(Lu
rgi)
c
HA
S (D
OW
)d
Sub
stif
uel
(IF
P)e
18
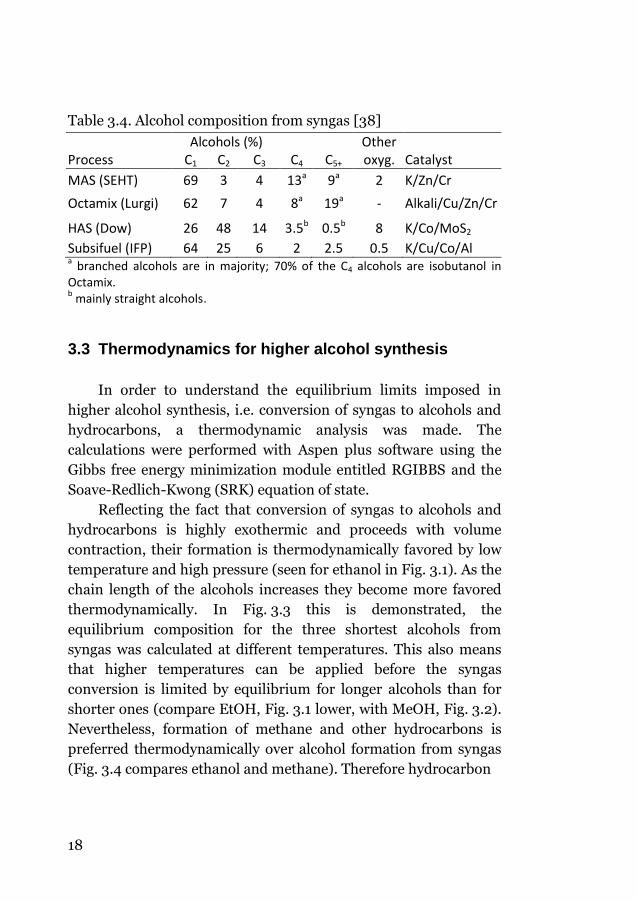
Table 3.4. Alcohol composition from syngas [38]
Alcohols (%) Other Process C1 C2 C3 C4 C5+ oxyg. Catalyst
MAS (SEHT) 69 3 4 13a 9a 2 K/Zn/Cr
Octamix (Lurgi) 62 7 4 8a 19a - Alkali/Cu/Zn/Cr
HAS (Dow) 26 48 14 3.5b 0.5b 8 K/Co/MoS2
Subsifuel (IFP) 64 25 6 2 2.5 0.5 K/Cu/Co/Al a branched alcohols are in majority; 70% of the C4 alcohols are isobutanol in
Octamix. b mainly straight alcohols.
3.3 Thermodynamics for higher alcohol synthesis
In order to understand the equilibrium limits imposed in
higher alcohol synthesis, i.e. conversion of syngas to alcohols and
hydrocarbons, a thermodynamic analysis was made. The
calculations were performed with Aspen plus software using the
Gibbs free energy minimization module entitled RGIBBS and the
Soave-Redlich-Kwong (SRK) equation of state.
Reflecting the fact that conversion of syngas to alcohols and
hydrocarbons is highly exothermic and proceeds with volume
contraction, their formation is thermodynamically favored by low
temperature and high pressure (seen for ethanol in Fig. 3.1). As the
chain length of the alcohols increases they become more favored
thermodynamically. In Fig. 3.3 this is demonstrated, the
equilibrium composition for the three shortest alcohols from
syngas was calculated at different temperatures. This also means
that higher temperatures can be applied before the syngas
conversion is limited by equilibrium for longer alcohols than for
shorter ones (compare EtOH, Fig. 3.1 lower, with MeOH, Fig. 3.2).
Nevertheless, formation of methane and other hydrocarbons is
preferred thermodynamically over alcohol formation from syngas
(Fig. 3.4 compares ethanol and methane). Therefore hydrocarbon

19
Fig. 3.1. Equilibrium mol fraction (left) and equilibrium carbon fraction
(right) as function of temperature for ethanol. This is shown for three
different total pressures, 1 bar (top), 10 bar (middle) and 100 bar
(bottom). A syngas gas with H2/CO=1 inlet ratio has been used in the
calculations and possible products have been set to ethanol, CO2 and
H2O.
0%
10%
20%
30%
40%
50%
150 200 250 300 350 400 450 500 550
Mo
l fra
ctio
n (
%)
Temperature (°C)
1 bar, H2/CO=1
Ethanol
CO2
CO
H2
H2O
Syngas (reactant)EtOH and CO2
(Products)
0%
10%
20%
30%
40%
50%
60%
70%
80%
90%
100%
150 200 250 300 350 400 450 500 550
Car
bo
n f
ract
ion
Temperature (°C)
CO
EtOH
CO2
Sum products(EtOH+CO2)
EtOH limit fromstoichiometry
1 bar, H2/CO=1
0%
10%
20%
30%
40%
50%
150 200 250 300 350 400 450 500 550
Mo
l fra
ctio
n (
%)
Temperature (°C)
10 bar, H2/CO=1
Ethanol
CO2
CO
H2
H2O
EtOH and CO2
(Products)
Syngas (reactant)
0%
10%
20%
30%
40%
50%
60%
70%
80%
90%
100%
150 200 250 300 350 400 450 500 550
Car
bo
n f
ract
ion
Temperature (°C)
CO
EtOH
CO2
Sum products(EtOH+CO2)
EtOH limit from
stoichiometry
10 bar, H2/CO=1
0%
10%
20%
30%
40%
50%
150 200 250 300 350 400 450 500 550
Mo
l fra
ctio
n (
%)
Temperature (°C)
100 bar, H2/CO=1
Ethanol
CO2
CO
H2
H2O
Syngas (reactant)
EtOH and CO2
(Products)
0%
10%
20%
30%
40%
50%
60%
70%
80%
90%
100%
150 200 250 300 350 400 450 500 550
Car
bo
n f
ract
ion
Temperature (°C)
CO
EtOH
CO2
Sum products(EtOH+CO2)
100 bar, H2/CO=1

20
Fig. 3.2. Equilibrium mol fraction (left) and equilibrium carbon fraction
(right) as function of temperature when methanol formation is allowed.
Ptot=100 bar and H2/CO=1 inlet ratio (methanol formation is limited by H2
concentration)
Fig. 3.3. Equilibrium mol fraction (left) and equilibrium carbon fraction
(right) as function of temperature when propanol formation, in addition to
methanol, ethanol, CO2 and H2O, is allowed. Ptot=100 bar and H2/CO=1
inlet ratio.
Fig. 3.4. Equilibrium mol fraction (left) and equilibrium carbon fraction
(right) as function of temperature when methane formation in addition to
ethanol, CO2 and H2O is allowed. Ptot=100 bar and H2/CO=1 inlet ratio.
0%
10%
20%
30%
40%
50%
150 200 250 300 350 400 450 500 550
Mo
l fra
ctio
n (
%)
Temperature (°C)
100 bar, H2/CO=1
MeOH
CO
H2
MeOH (Product)
CO (reactant)H2 (reactant)
0%
10%
20%
30%
40%
50%
60%
70%
80%
90%
100%
150 200 250 300 350 400 450 500 550
Car
bo
n f
ract
ion
Temperature (°C)
CO
MeOH
100 bar, H2/CO=1
MeOH of stoichiometrymax
0%
10%
20%
30%
40%
50%
150 200 250 300 350 400 450 500 550
Mo
l fra
ctio
n (
%)
Temperature (°C)
100 bar, H2/CO=1
CO2PrOHH2OH2COEthanolMeOH
0%
20%
40%
60%
80%
100%
150 200 250 300 350 400 450 500 550
Car
bo
n f
ract
ion
(%
)
Temperature (°C)
100 bar, H2/CO=1Sum products(MeOH+EtOH+PrOH+CO2)
PrOH
CO2
CO
EtOH MeOH
0%
10%
20%
30%
40%
50%
150 200 250 300 350 400 450 500 550
Mo
l fra
ctio
n (
%)
Temperature (°C)
100 bar, H2/CO=1
CH4CO2COH2OH2Ethanol
CH4 and CO2
(Products)
Syngas (reactant)+H2O
0%
10%
20%
30%
40%
50%
60%
70%
80%
90%
100%
150 200 250 300 350 400 450 500 550
Car
bo
n f
ract
ion
Temperature (°C)
CO
CH4
CO2
Sum products(CH4+CO2)
100 bar, H2/CO=1
EtOH

21
formation must be kinetically limited, meaning that a good alcohol
catalyst must impose a kinetic barrier to their formation while at
the same time catalyzing alcohol formation.
Arranging the main products from the most to the least
thermodynamically favorable products the chart become as
follows:
CH4 > paraffin > i-BuOH > n-BuOH > n-PrOH > EtOH > MeOH
3.4 Higher alcohol synthesis, a historical resume
For more than a century it has been known that longer
alcohols can be produced from syngas. In 1913 BASF patented a
process for syngas conversion into a mixture containing
hydrocarbons, alcohols, aldehydes, ketons, acids and other organic
compounds using e.g. an alkalized cobalt and osmium oxide
catalyst [39]. A big step forward was achieved by Fischer and
Tropsch in the early 1920’s when they developed the Synthol
process (not to be confused with the SASOL Synthol process),
which had a much higher alcohol selectivity [25, 26, 40, 41]. The
reaction was performed over an alkalized iron catalyst at 100-
150 bar and 400-450 °C, resulting in a mixture containing mainly
of alcohols, hydrocarbons, aldehydes and ketones [40, 41].
Soon after BASF discovered the ZnO/Cr2O3 catalyst for
synthesis of methanol in 1923, it was found that alkali addition to
the catalyst gave high yields of higher alcohols in addition to
ethanol. From 1927 to 1945, plants of this type were in operation in
the USA and Germany [34]. In the time period 1935-1945 direct
synthesis of higher alcohols assumed considerable importance in
Europe [42]. A modified Synthol process was developed by I.G.
Farbenindustrie from 1940-1945 in which much lower reaction
temperature (190-200 °C) and greater gas recycle, then the

22
original method was applied [43]. Higher alcohol selectivity could
in this way be achieved, while the rest of the product mainly
consisted of olefins and paraffins. A German plant, producing 10-
15 ton/month of liquid product was under construction in the end
of the Second World War, but was never completed after
bombardment in the end of the war [43]. The accessibility of cheap
oil e.g. due to the exploration of the Arab oilfields and a demand
for pure alcohols for chemical use, made the interest for higher
alcohols and other synthetic fuels cease in the time period after the
war.
The interest in HAS thereafter has been renewed in times of
high (or expected high) oil prices and uncertainties regarding
energy supply. In the 1970’s and 1980’s there was an intensive
world-wide research effort on the production and use of synthesis
gas derived from coal as an alternative to crude oil for production
of synthetic fuels. The Arab oil embargo (1973), the Iranian
revolution (1979) and the start of the Iran/Iraq war (1980) spurred
this development, and displayed the Western countries’ heavy
dependence on Middle East oil and vulnerability of such an energy
supply chain. It is at this time virtually all of the most interesting
catalytic systems of today were developed or older methods refined
and improved.
Greatly declined oil prices in the mid-80’s, diminished the
economic and political incentives, and focus switched towards the
environmental benefits of alcohol addition to gasoline. Mixing
alcohols with gasoline was seen as a way to reduce local air
pollution (e.g. CO and ozone) and alcohol’s excellent anti-knock
properties a method to help phasing out or reduce environmentally
questionable octane enhancers such as alkyl-lead, aromatic
hydrocarbons (e.g. benzene) and MTBE (methyl tert-butyl ether).
In the early 21st century HAS saw a revitalized interest from
industry and academia with attention on reducing greenhouse gas
emissions and foreign oil dependence due to increased and
anticipated increase in petroleum prices. While the research in

23
most Western countries are concentrated around on using biomass
as raw material, available coal is the center of attention in China.
The world economic slowdown together with a reduced oil price
has to some extent reduced the interest in HAS during the last few
years.


25
Chapter 4
Alcohol fuels for internal combustion engines
4.1 Fuel properties
Alcohols have fuel properties suitable for use in combustion
engines. They can be used either neat or blended in different
portions with gasoline for use in spark-ignition engines. In
addition hydrous alcohols can be used in specially designed
compression-ignition (diesel) engines if a small amount of ignition
improver is added to the fuel [44].
The octane rating is a measure of the fuel’s ability to resist
auto-ignition and knock, and is therefore a critical fuel property
affecting the design, operation and efficiency of spark-ignited
engines. All alcohols display very high octane numbers compared
to gasoline which makes them very attractive for use either pure or
as gasoline octane enhancer. In Table 4.1 octane number and other
significant fuel properties for a number of alcohols in comparison
with gasoline are shown. Alcohols display higher octane rating and
evaporative cooling (see heat of vaporization in Table 4.1)
compared to gasoline which enables an increase in the engine’s
compression ratio without running into problems with pre-ignition
and knock [45]. Increasing the compression ratio is of great benefit
for overall efficiency, fuel consumption and CO2 emissions [46].
Dedicated alcohol engines, optimized to running on alcohol (or
gasoline with high blending portions of alcohols) therefore would
make it possible to create much more efficient engines, which is
not possible with the currently used “alcohol cars” so called Flex-
fuel Vehicles (FFV), running on both alcohol and gasoline [45].
26
Adding alcohol(s) to gasoline increases the blended fuel’s
octane number much more than predicted from the volume alcohol
added and the individual octane numbers of the alcohol and the
gasoline from which it is produced [47, 48]. This is the property
called blend octane number (Table. 4.1).
The octane number of the alcohols decreases with increased
alcohol chain length while the energy density increases. However,
compared to gasoline the energy density of alcohols is significantly
lower (Table 4.1). Mixing pure methanol with gasoline is often not
preferred; since there is a risk of phase separation if water enters
the fuel system (water and methanol separate from hydrocarbons).
This problem can, however, easily be solved by co-adding other
longer alcohols to stabilize the blend [48].
Appropriate volatility of the alcohols-gasoline blend is also
important to avoid vapor lock problems in regions with high
temperatures and cold start problems when the temperature is low
in colder areas. Despite the low vapor pressures of neat alcohols,
addition of methanol or ethanol to gasoline results in a substantial
increase in the vapor pressure of the fuel (Table 4.1). This happens
because a positive azeotropic mixture is formed when alcohols and
hydrocarbons are mixed, a mixture which has lower boiling point
than the hydrocarbons and alcohols from which it is made [49].
Adding small quantities of methanol or ethanol to the fuel blend
(<1%) increases the fuel vapor pressure greatly [50]. Further
addition in the range of 1%-15% alcohol does not change the vapor
pressure significantly, while higher concentrations lead to its
gradual reduction [50, 51].

27
Table
4.1
. Im
port
ant
fuel pro
pert
ies o
f vari
ous s
hort
alc
oho
ls a
nd
gaso
line [
48
, 5
1-5
3].
a R
eid
vapor
pre
ssure
(R
VP
) at
37.8
°C
. b m
ixtu
re c
onta
inin
g:
10%
(v/v
) alc
ohol and 9
0%
gasolin
e.
Gasolin
e v
apor
pre
ssure
(R
VP
) w
as 6
0 k
Pa.
Fue
lG
aso
lin
eM
eth
ano
lEt
han
ol
1-p
rop
ano
l1-
bu
tan
ol
1-p
en
tan
ol
i-P
rOH
i-b
uta
no
l
Ne
at -
Re
sear
ch o
ctan
e n
um
be
r, R
ON
91-9
910
910
810
598
8611
210
5
Ne
at -
Mo
tor
oct
ane
nu
mb
er,
MO
N81
-89
8988
8885
7697
89
Ble
nd
oct
ane
val
ue
s -
RO
N-
127-
136
120-
135
94-9
612
011
3
Ble
nd
oct
ane
val
ue
s -
MO
N-
99-1
0410
0-10
678
-81
9694
Oxy
gen
co
nte
nt
(wt%
)0-
449
.934
.726
.621
.618
.126
.621
.6
Bo
ilin
g p
oin
t (°
C)
38-2
0464
.778
.397
.211
7.7
138
82.3
107.
9
Sto
ich
iom
etr
ic a
ir/f
ue
l rat
io (
wt/
wt)
14.7
6.46
8.98
10.3
311
.17
11.7
310
.33
11.1
7
He
at o
f co
mb
ust
ion
, LH
V (
MJ/
l)32
.815
.67
21.0
424
.56
26.7
128
.37
23.7
826
.36
He
at o
f va
po
riza
tio
n (
MJ/
l)0.
20-0
.28
0.93
0.73
0.63
0.57
0.53
0.58
0.55
Ne
at -
vap
or
pre
ssu
re (
kPa)
a
55-6
532
166.
22.
212
.43.
3
Mix
- v
apo
r p
ress
ure
(kP
a) a
,b-
8468
6059
6259
28
4.2 Alcohols as motor fuel is not new
The idea of using alcohols to fuel vehicles is as old as the car
industry itself. Automobile pioneer Henry Ford’s first produced car
in 1896 (the Quadricycle) was made to run on pure ethanol, and
one of the most influential cars ever built, the Ford model T (1908-
1927) was designed to run on either ethanol, kerosene or gasoline
[54]. In a New York Times interview in 1925 Ford called ethanol,
“the fuel of the future”, a view that was widely shared in the
automotive industry of the time [55]. The decreasing cost of
gasoline and the discovery of tetra ethyl lead as an octane booster
were some of the factors hindering the alcohol industry’s growth
and gasoline took over [56].
4.3 Legislation and current use of alcohols
Ethanol is the mainly used fuel alcohol and ethanol-gasoline
blends are available in a great number of nations over the world.
United states and Brazil are the main fuel ethanol-producing
countries, with where corn and sugar cane as raw materials,
respectively, being fermented to ethanol [57].
In Brazil there is a widespread use of cars running on 100%
hydrous ethanol (E100) and a 25% ethanol addition to gasoline is
mandatory (E25) [58].
So called flex-fuel vehicles, developed to run on both E85 and
gasoline with less or no ethanol added are available in e.g. the
USA, Brazil and some European countries.
However, the vast majority of the ethanol produced is blended
lower concentration in gasoline for used in standard gasoline cars.
The blend concentration mainly lies between 4 and 10% ethanol.
In the USA, ethanol accounted for about 10% of the total
volume of finished motor gasoline consumed in 2013 [59]. Most
sold gasoline in the US contains some ethanol and 10% ethanol in
29
gasoline (v/v) is mandated in numerous states. Other offered
ethanol-gasoline blends one the US market are, E15 for newer
gasoline vehicles (from the year 2001) and E85 for Flex-Fuel
vehicles [59].
Blending 4-5% ethanol into gasoline is mandatory in several
European countries, while blends up to 10% ethanol are allowed
according to legislation [60].
European Union regulation for ethanol, methanol and other
short alcohols for use in gasoline are presented in Table 4.2 [60].
Also unspecified alcohols are allowed up to the concentrations
stated under the general oxygenate group, as long as the total
oxygen content does not exceed 2.7 wt% oxygen and other parts of
the fuel standard is met, e.g. regarding fuel volatility.
It has long been known that alcohols are suitable fuels for
spark ignition engines, but it was not until the 80’s engines
operating according to the diesel principle were developed for
methanol and ethanol fuels (with addition of ignition improver)
[50]. For use in specially developed diesel engines, the ED95 fuel
was developed. ED95 consists of 95% hydrous ethanol together
with 5% ignition improver (polyethylene glycol) and is sold for
used in specially developed diesel engines in a dozen countries
[61]. In Sweden over 800 Scania busses are running on ED95 [62].
Methanol was for a long time mainly used in high-
performance engines, e.g. in Grand Prix racing vehicles in the
1930’s and in the Indianapolis 500 racing series during the period
1964-2006, but not in ordinary cars. After the 70’s oil crises, the
interest in methanol became intense and it was seen as the most
probable gasoline substitute and gasoline extender, for use in
ordinary cars [44]. Today, the main user and producer of fuel
methanol is China, where M15 represents 8% of the gasoline fuel
pool and it continues to grow [21]. The Chinese methanol is mainly
produced from gasification of domestic coal and its use has risen
rapidly since it can be produced at a low cost, has clean-burning
properties and can increase the nation’s energy security [63].

30
Australia, Israel and Iceland are other countries with increasing
interest and use of methanol in gasoline.
Table 4.2. Motor-gasoline specification and legislation in the European Union [60]
a Test methods shall be those specified in EN 228:2004
b Other mono-alcohols and ethers with a final boiling point no higher than that stated in
EN 228:2004
c No intentional addition allowed
Minimum Maximum
Research octane number 95 —
Motor octane number 85 —
Oxygen content % m/m 3.7
Oxygenates
— Methanol % v/v — 3.0
— Ethanol % v/v 10.0
— Iso-propyl alcohol % v/v — 12.0
— Tert-butyl alcohol % v/v — 15.0
— Iso-butyl alcohol % v/v — 15.0
— Ethers (containing five or more carbon atoms) % v/v — 22.0
— Other mono-alcohols and ethers b % v/v — 15.0
Hydrocarbon analysis:
— olefins % v/v — 18.0
— aromatics % v/v — 35.0
— benzene % v/v — 1.0
Sulphur content mg/kg — 10.0
Lead content g/l — 0.005 c
Distillation:
— percentage evaporated at 100 °C % v/v 46 —
— percentage evaporated at 150 °C % v/v 75 —
LimitsParameter a Unit

31
Chapter 5
Higher alcohol synthesis with molybdenum
sulfide catalysts
5.1 General
In conversion of syngas to organic products, non-promoted
MoS2 catalysts display selectivity to methane and other short
hydrocarbons [64], however, as first revealed by Dow Chemicals
[65] and Union carbide [66], when the MoS2 is promoted with
alkali and pressure applied, high selectivity to mixed alcohols can
be achieved. Doping the MoS2 with alkali is therefore crucial for
obtaining alcohols rather than hydrocarbons. Mainly linear
primary alcohols are produced with alkali/MoS2 catalysts, while
the dominant side products are short hydrocarbons, in particular
methane. Group VIII promoters such as nickel or cobalt are often
added to the catalyst in order to shift the product distribution
towards longer alcohols [67-70]. Even if the sulfide (MoS2) is the
most studied and preferred state of the alkali/Mo catalyst, also
carbide, oxides, phosphides and the metallic form of the catalyst
have been shown to have HAS activity [65, 68, 71]. Molybdenum
sulfide can be prepared from both oxide and sulfide precursors,
but higher HAS activity is reported from sulfide precursors [65].
Unsupported molybdenum sulfide is the preferred state of the
catalyst in the patent literature, however, the active material may
also be placed on suitable carrier materials e.g. carbon, Al2O3 or
SiO2 [65]. At a given temperature alcohol selectivity increases with
increasing pressure, however, the costs associated with carrying
out the reaction at increased pressures also increase [65].

32
Improved alcohol selectivity at higher pressure must therefore be
balanced against rising costs associated with pressure vessels,
compressors and energy use.
A significant difference compared to many other HAS catalytic
systems is that the methanol concentration with MoS2-based
catalysts is as a rule not limited by thermodynamic equilibrium
under normal operation conditions, meaning that the methanol
formation rate is fairly slow.
Molybdenum sulfide-based catalysts (promoted with Ni or Co
on an Al2O3 support) are being used at huge scale for cleaning
petroleum streams from sulfur (hydrodesulfurization) in the
production of fuels in the oil refining industry [72]. Due to
hydrodesulfurization’s very great strategic importance in today’s
oil-dependent society, molybdenum sulfide catalysts of this type
are among the most studied and best described heterogeneous
catalysts. However, the knowledge on hydrodesulfurization
catalysts is hard to apply in HAS because of the essential role of
alkali and the different reactions taking place on the catalyst.
Water-gas shift catalysts based on MoS2 are commercially
available for use when the gas contains sulfur and the syngas has a
low H2/CO ratio (low H2O/C feed ratio) [5, 73, 74]. In addition,
recently increased attention has been directed towards MoS2 as a
sulfur and coke tolerant CO methanation catalyst converting
syngas derived from coal to methane [75].
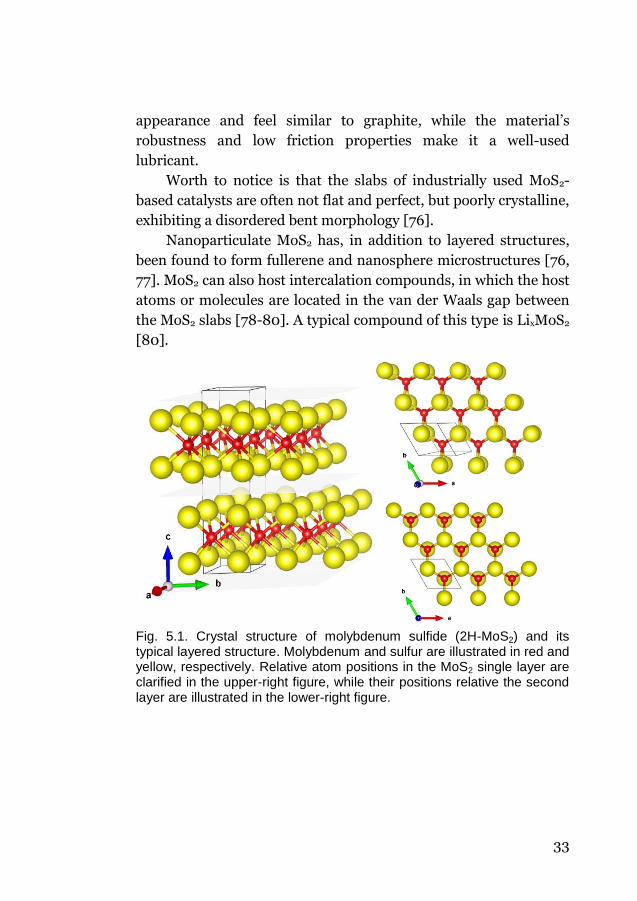
5.2 Structure of MoS2
MoS2 is a layered compound, where each layer consists of a
slab of Mo atoms sandwiched between two slabs of sulfur atoms
(S-Mo-S layer). Molybdenum (Mo4+) is coordinated to six sulfur
ligands (S2-) in a trigonal prismatic configuration and the layers are
held together by van der Waals forces leading to a more or less
stacked organization of MoS2 slabs (Fig. 5.1). These give MoS2 an
33
appearance and feel similar to graphite, while the material’s
robustness and low friction properties make it a well-used
lubricant.
Worth to notice is that the slabs of industrially used MoS2-
based catalysts are often not flat and perfect, but poorly crystalline,
exhibiting a disordered bent morphology [76].
Nanoparticulate MoS2 has, in addition to layered structures,
been found to form fullerene and nanosphere microstructures [76,
77]. MoS2 can also host intercalation compounds, in which the host
atoms or molecules are located in the van der Waals gap between
the MoS2 slabs [78-80]. A typical compound of this type is LixMoS2
[80].
Fig. 5.1. Crystal structure of molybdenum sulfide (2H-MoS2) and its typical layered structure. Molybdenum and sulfur are illustrated in red and yellow, respectively. Relative atom positions in the MoS2 single layer are clarified in the upper-right figure, while their positions relative the second layer are illustrated in the lower-right figure.

34
5.3 Alkali and group VIII promoters
Doping the MoS2 with alkali is essential for obtaining a
catalyst that will produce alcohols rather than hydrocarbons. Alkali
tunes kinetics and energetics of the adsorbed reactants thereby
affecting their relative coverage during reaction. More precisely,
alkali has been postulated to activate CO non-dissociatively and
reduce the availability of activated hydrogen on MoS2, thereby
favoring synthesis of higher alcohols over hydrocarbons [69].
There are different reports regarding which alkali metal is the
most suitable one, but the heavier Cs, Rb, K are very much
preferred over the lighter Na, Li [71, 81-83]. The optimum alkali
level is fairly high, alkali/Mo-molar ratios in the range 0.1-0.7 have
in general been applied [71, 84]. An increased alkali level appears
to be needed at higher reaction temperatures and greater MoS2
surface areas for maximum alcohol productivity [71, 81]. Alkali
addition favors alcohol selectivity over that to hydrocarbon, while
excessive addition leads to a reduced alcohol productivity [81].
Successful alkali promotion can however not be performed
with any alkali salt. Woo and Lee studied the promotion of MoS2
with different potassium precursors and found the correct choice
essential for achieving catalysts with high alcohol selectivity [85,
86]. Successful precursors were able to remove their anion and
spread on the MoS2 surface under reaction conditions, while the
opposite was found true for the bad precursors. Suitable choices
were found to be e.g. K2CO3, K2O2, K2S, while poor promotion
abilities were seen for KCl and K2SO4.
The alkali promoter can be added by either conventional
impregnation or physical mixing. Both methods appear equally
good in the case of K2CO3 promoter, since the activity and
selectivity of the catalyst is the same independently of method used
[86, 87]. Comparing alkali dispersion on a fresh catalyst with one
already used for CO hydrogenation, much higher alkali dispersion
is shown on the latter [85]. This indicates that the two alkali

35
addition methods are comparable since the alkali is highly mobile
and therefore migrates and redistributes under reaction
conditions, giving similar dispersion and therefore performance in
the end. Support for this can also be found in the great change in
activity and selectivity experienced during the first 5-30 hours on
stream, often referred to as the induction period [87, 88]. During
this time CO conversion decreases greatly while a simultaneous
increase in alcohol selectivity and a drop in hydrocarbon selectivity
is witnessed, which is typical for when alkali disperses on MoS2
[85, 89].
Recent research by Santos shows that the induction period
can be shortened if incipient wetness impregnation is used instead
of physical mixture in the case of K2CO3 promoter. This might
simply be related to a higher initial alkali dispersion in the former
relative the latter [87]. They also found the results of K2SO4
promotion to be dependent on the preparation method used;
incipient wetness impregnation gave good promoting effect, while
physical mixing gave bad promoting effect, showing that the
promotional effect not only depends on the precursor, but also on
the way the alkali is incorporated.
Even if MoS2 is fairly stable in air, prolonged storage of
K2CO3/MoS2 in normal atmosphere has been shown to partly oxide
the catalyst (stored for 11 weeks) [86]. In this process some sulfide
(S2-) is converted to sulfate (SO42-) and parts of the Mo4+ to Mo6+,
leading to decreased alcohol selectivity and increased C2+
hydrocarbon production [86]. In order to sidestep catalyst
degradation, minimum contact between the prepared catalyst and
moist air therefore is advised, meaning inert atmosphere storage.
36
5.4 Reaction mechanism
The studies made in order to understand the product
formation mechanisms over MoS2-based catalysts are extremely
few and basically limited to a study by Santiesteban [69]. However,
it is known that co-feeding various alcohols (methanol, ethanol),
aldehydes (acetaldehyde) and olefins (ethene, propene) under
reaction conditions, they can all grow into longer alcohols and
hydrocarbons [90-93]. DFT calculations indicate the pathway for
methane formation on alkali-free MoS2 (10-10 surface) to be as
follows [94]. Observe that CO is adsorbed non-dissociatively.
CO → CHO → CH2O → CH2OH → CH2→ CH3→ CH4 (5.1)
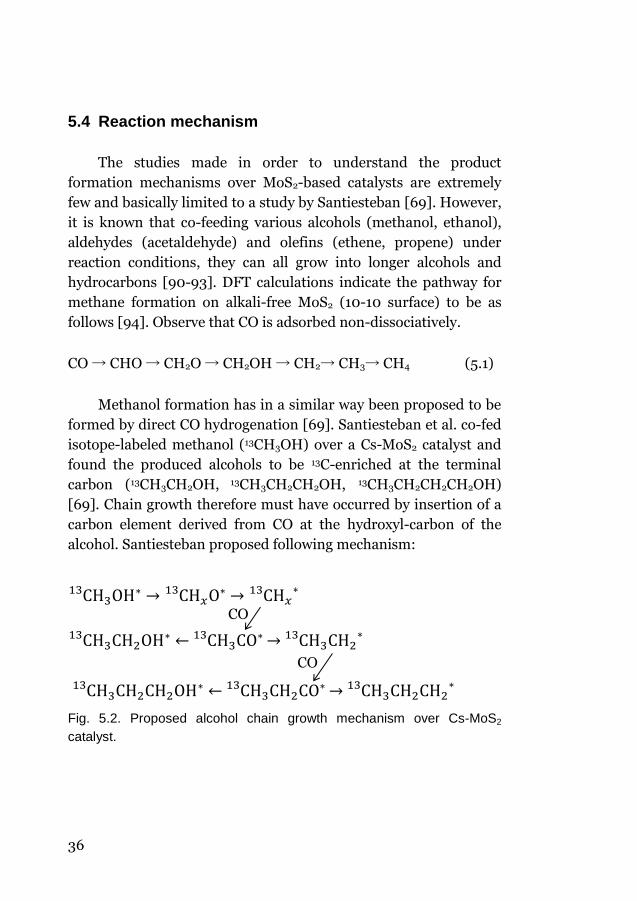
Methanol formation has in a similar way been proposed to be
formed by direct CO hydrogenation [69]. Santiesteban et al. co-fed
isotope-labeled methanol (13CH3OH) over a Cs-MoS2 catalyst and
found the produced alcohols to be 13C-enriched at the terminal
carbon (13CH3CH2OH, 13CH3CH2CH2OH, 13CH3CH2CH2CH2OH)
[69]. Chain growth therefore must have occurred by insertion of a
carbon element derived from CO at the hydroxyl-carbon of the
alcohol. Santiesteban proposed following mechanism:
CH313 OH∗ → CH𝑥
13 O∗ → CH𝑥∗13
CH3CH2OH∗13 ← CH313 CO∗ → CH3CH2
∗13
CH3CH2CH2OH∗13 ← CH313 CH2CO∗ → CH3CH2CH2
∗13
Fig. 5.2. Proposed alcohol chain growth mechanism over Cs-MoS2
catalyst.
CO
CO

37
However, identical experiments with a K-Co-MoS2 catalyst at lower
space velocity gave somewhat different results since two types of
propanol in equal amounts were being produced, 13CH3CH2CH2OH
and CH313CH2CH2OH, while the ethanol composition still was
13CH3CH2OH. Even if the results are a bit non-unifying, nothing
points towards alcohol to alcohol coupling reactions.
Christensen et al., however, proposed an alternative chain
growth route where alcohol-alcohol coupling reactions take place,
based on that fact the butanol formation rate was increased much
more than the propanol formation rate when increased amounts of
ethanol were co-fed [91].
Methane and other hydrocarbons are at least partly expected
to be produced from the corresponding alcohols, but to which
extent this happens is quite unclear [69].
5.5 Anderson-Schulz-Flory (ASF) distribution
The alcohol product distribution from alkali-promoted MoS2
catalysts as well as the hydrocarbon product distribution from
alkali-free MoS2 catalysts have often been deemed to
approximately follow the so-called ASF (Anderson-Schulz-Flory)
distribution [95]. Significant deviations from the ASF distribution
are however often reported, especially for C1 species when
promoters such as Ni or Co are added [70, 96-98]. The ASF
distribution is derived from polymerization kinetics with C1
monomers and is valid when the probability of chain growth (α) is
independent of chain length [99, 100]. Regardless of the exact
mechanism for carbon growth, this means that growth of the
carbon chain occurs by a stepwise addition of a single-carbon
segment derived from CO, and the probability of chain growth is
independent on the length of the growing carbon chain. According
to this model the product distribution can simply be described by a
single parameter, the chain growth probability (α). α is defined by:

38
α = Rp
Rp+Rt
= kp
kp+kt (5.2)
where Rp and Rt are the rates of propagation and termination,
respectively, with Rp=kpθn , Rt=ktθn. kp and kt are the rate
coefficients for propagation and termination, respectively, and θn
is the surface concentration of the chain with n carbon atoms.
Consequently, the probability of chain termination becomes:
1-α = Rt
Rp+Rt
= kt
kp+kt (5.3)
The distribution can mathematically be represented in the
following way:
Sn = n·(1-α)2αn-1 (5.4)
where Sn is the carbon selectivity for chains with n carbon atoms
and α is chain growth probability. A plot of ln (Sn/n) vs. n (ASF
plot) gives a straight line when the chain growth probability (α) is
independent of n.
ln Sn
n = n ln α + ln
(1-α)2
α (5.5)
In higher alcohol synthesis, a number of different product groups
are usually formed, e.g. alcohols, aldehydes, olefins and paraffins.
Fig. 5.3 shows a chain growth model for formation of paraffins and
alcohols from a common intermediate. If the termination
probability ratio between hydrocarbons and alcohols
(RtAlc/RtHC=ktAlc/ktHC) is constant and independent of chain length,
the hydrocarbon and alcohol ASF plots will be copies of each other
only differing by an y-axis offset. The termination probabilities for

39
hydrocarbons and alcohols then become ktHC/(kp+ktHC+ktAlc) and
ktHAlc/(kp+ktHC+ktAlc), respectively, and the y-axis offset in the ASF
plot will reflect the difference in magnitude of the chain
termination probabilities. Chain growth through a common
intermediate to more than two products can be viewed in an
equivalent way.
Fig. 5.3. Chain growth to paraffins and alcohols trough a common
intermediate.
CH4 MeOH Ethane EtOH Propane PrOH CnH2n+2 CnH2n+1OH
CO +H2 C1
kt1HC kt1Alc
kp1 C2
kt2HC kt2Alc
kp2 C3
kt3HC kt3Alc
kpn-1 Cn-1
kt ktn-1HC ktn-1Alc
kp3 kpn


41
Chapter 6
Catalyst preparation and characterization
This chapter starts with describing preparation routes for
synthesizing MoS2-based catalysts. A description of the synthesis
and characterization of the catalysts used in this work then follows.
6.1 Catalysts preparation routes
Two main routes for synthesizing MoS2 catalysts exist;
sulfidation of molybdenum oxide and decomposition of
molybdenum-sulfur material or salt containing over-stoichiometric
amounts of sulfur, e.g. MoS42- or MoS3. The catalysts prepared in
this thesis are examples of the latter method.
6.1.1 Decomposition of sulfur-molybdenum compounds
In the decomposition method, the MoS2 precursor has sulfur
bonds to molybdenum and some of the over-stoichiometric sulfur
is lost during decomposition. A typical example is decomposition
of ammonium tetrathiomolybdate (ATTM), (NH4)2MoS4, as shown
in eq. 6.1 [101].
(NH4)2MoS4 ∆→ 2NH3 + H2S + (3-x)S + MoSx (x=2-3) (6.1)
Decomposition of thiosalts and molybdenum-sulfur materials in
this way leads to more sulfided catalysts compared to the
conventional sulfidation of molybdenum oxides. The sulfur-to-

42
molybdenum ratio might even be above 2, as seen in the
decomposition scheme above.
6.1.2 Sulfidation of MoOx
The conventional way of preparing hydrotreating catalysts is
an example of the metal oxide sulfidation method. Mo and Co or Ni
salts are impregnated onto γ-Al2O3, followed by calcination to
produce the stable oxidic material. The oxide is then sulfided either
prior to or during the start-up of the hydrotreating process by
passing sulfur-containing gas together with hydrogen over the
catalyst. Sulfidation of the oxide(s) in this way is usually difficult
and does not proceed in a regular manner, making the sulfidation
process somewhat incomplete [102, 103].
6.2 Preparation of K-Ni-MoS2 and MoS2 catalysts
A summary of the preparation procedures used for
synthesizing the catalysts used in the present work will follow. Two
catalyst types were prepared, a promoted MoS2 catalyst (K-Ni-
MoS2) and a “pure” MoS2 catalyst. Additional details are available
in Paper II.
The alcohol synthesis catalyst (K-Ni-MoS2) was prepared from
two water solutions; the first solution contained ammonium
tetrathiomolybdate, ((NH4)2MoS4) and the second nickel acetate,
both in quantities equivalent to 47 mmol. The nickel acetate
solution was added dropwise to the (NH4)2MoS4 solution under
strong agitation, and a black suspension was immediately formed
as nickel reacted with thiomolybdate (eq. 6.2).
Ni2+ (aq) + MoS42- (aq) → NiMoS4 (s) (6.2)

43
After have been matured for 1 h under agitation the catalyst
precursor (NiMoS4) was washed, and centrifuged to remove excess
liquid. The precursor was dried and thereafter crushed and sieved
to a pellet size of 45-200 µm. Finely ground K2CO3 was then
mechanically mixed with the ”Ni-MoS4” catalyst precursor and
calcined/decomposed in a tube furnace at 450 °C for 90 min under
flowing H2 atmosphere. During this process a great amount of
sulfur is removed from the catalyst both as elemental sulfur and as
hydrogen sulfide.
The non-promoted MoS2 catalyst was prepared by
decomposition of ammonium tetrathiomolybdate (NH4)2MoS4 at
500 °C and 45 h under flowing H2 atmosphere (eq. 6.1).
6.3 Catalyst characterization
The catalyst characterization results for the studied catalysts
are summarized here. For basic understanding of the applied
characterization techniques the reader is directed to the relevant
literature, e.g. in catalyst characterization or the specific methods.
For details on the instruments, sample preparation, analysis
conditions, and more in depth discussion of the results, the
experimental sections of Papers II and III are advised.
6.3.1 N2 physisorption and ICP-MS
N2 physisorption (adsorption) at the boiling point of liquid
nitrogen (−196 °C) was used to study the catalysts’ surface area
(BET surface area), pore volume and pore distribution [104, 105].
Due to the low specific surface area of the studied catalysts
(Table 6.1), great sample quantities were needed for achieving
accurate analytical results [106]. The recommendation of keeping

44
the total surface area above 40 m2 (40-120 m2) from the
instrument manufacturer was followed [106].
Quantitative element analysis was performed with inductively
coupled plasma atomic emission spectroscopy (ICP-AES) after the
catalyst has been completely dissolved in acid (HCl and HNO3) and
thereafter diluted with water.
The investigated catalysts’ physical properties found from N2
physisorption and ICP-AES measurements are presented in
Table 6.1. The metal ratios (K/Ni and Ni/Mo) were the ones aimed
for and the BET surface areas are low. Also notice the magnitude of
the S/Mo-ratio, sulfur has been removed from the precursor
material (as anticipated) but still fairly high levels are present,
displaying that probably also Ni (or NiMo) in addition to Mo holds
a large amount of sulfur.
Table 6.1. Physical properties of the K-Ni-MoS2 and MoS2 catalysts
Catalyst
N2 physisorption ICP (molar ratio)
BET
(m2/g)
Avg. pore
diameter (Å) Ni/Mo S/Mo K/Mo
K-Ni-MoS2 3.3 329 1.0 2.8 0.7
MoS2 8.6 238 - - -
6.3.2 X-ray diffraction (XRD)
Powder X-ray diffraction (XRD) was used for crystal phase
identification, deduction of unit cell dimensions and crystallite size
determinations. The diffractograms of the promoted and non-
promoted catalysts both display typical MoS2 patterns (Fig. 6.1).
However, for the promoted catalyst the most intense peak is
shifted somewhat towards a lower angle (2θ=13.8) compared to
well-ordered and crystallized MoS2 (2θ=14.4°). The increased
distance between the MoS2 sheets (expansion of the c lattice

45
parameter) (Table 6.2) has been explained to originate from
curved layers where interlayer expansion occurs due to a
mechanism for strain relief [107, 108]. For the promoted catalyst
another MoS2 layered phase is in addition formed, KxMoS2(H2O)y.
This is a KxMoS2 phase which prior to XRD analysis has been
Fig. 6.1. XRD patterns for the MoS2 (blue) and K-Ni-MoS2 (black)
catalysts. For comparison K-MoS2 (green) and Ni-MoS2 (red) prepared
materials are also shown. (From Paper II).
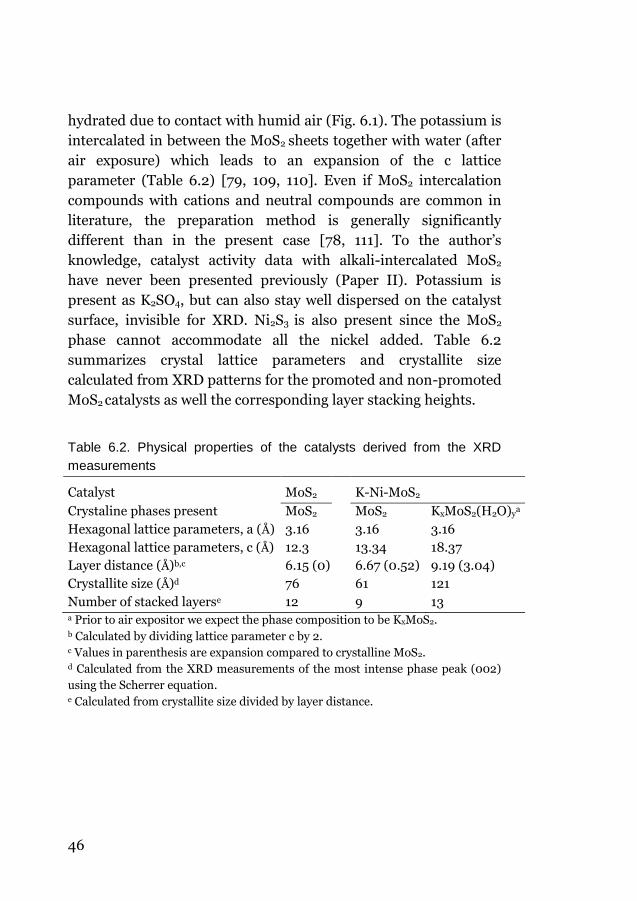
46
hydrated due to contact with humid air (Fig. 6.1). The potassium is
intercalated in between the MoS2 sheets together with water (after
air exposure) which leads to an expansion of the c lattice
parameter (Table 6.2) [79, 109, 110]. Even if MoS2 intercalation
compounds with cations and neutral compounds are common in
literature, the preparation method is generally significantly
different than in the present case [78, 111]. To the author’s
knowledge, catalyst activity data with alkali-intercalated MoS2
have never been presented previously (Paper II). Potassium is
present as K2SO4, but can also stay well dispersed on the catalyst
surface, invisible for XRD. Ni2S3 is also present since the MoS2
phase cannot accommodate all the nickel added. Table 6.2
summarizes crystal lattice parameters and crystallite size
calculated from XRD patterns for the promoted and non-promoted
MoS2 catalysts as well the corresponding layer stacking heights.
Table 6.2. Physical properties of the catalysts derived from the XRD
measurements
Catalyst MoS2 K-Ni-MoS2
Crystaline phases present MoS2 MoS2 KxMoS2(H2O)ya
Hexagonal lattice parameters, a (Å) 3.16 3.16 3.16
Hexagonal lattice parameters, c (Å) 12.3 13.34 18.37
Layer distance (Å)b,c 6.15 (0) 6.67 (0.52) 9.19 (3.04)
Crystallite size (Å)d 76 61 121
Number of stacked layerse 12 9 13 a Prior to air expositor we expect the phase composition to be KxMoS2. b Calculated by dividing lattice parameter c by 2. c Values in parenthesis are expansion compared to crystalline MoS2. d Calculated from the XRD measurements of the most intense phase peak (002)
using the Scherrer equation. e Calculated from crystallite size divided by layer distance.
47
Chapter 7
Reaction equipment and analytical system
In this chapter the equipment and procedures used in the
high-pressure catalytic tests are presented, but to the greatest
extent the chapter is devoted and focused on the work performed
in the development of a rapid and accurate analytical system for
analyzing HAS products (Paper I). Analysis principles of the
developed method are briefly presented and the results displayed
e.g. in terms of product separation and closure of carbon material
balance over the reactor. For complete and more in-depth method
description, the reader is directed to the original paper (Paper I).
7.1 High pressure alcohol synthesis reactor
Higher alcohol synthesis needs to be performed under
pressurized conditions since the reaction otherwise would be
limited by thermodynamics (see section 3.3). However, most often
even higher pressures are applied to increase alcohol selectivity
and reaction rates.
The catalytic CO hydrogenation reactions were performed in a
high-pressure downdraft stainless-steel fixed-bed reactor
(i.d. 9 mm) with 0.65 g K–Ni–MoS2 catalyst (45–250 µm) diluted
by 3 g SiC (average pellet size = 77 µm). Gas flows were regulated
by calibrated mass-flow controllers and reactor pressure was
recorded by a pressure transducer located prior to the reactor oven
which controlled a pressure valve located after the reactor. The
reactor tube was heated by means of a cascade temperature-
controlled oven with a sliding thermocouple in the catalyst bed and
another placed in the oven. The whole reactor oven is located
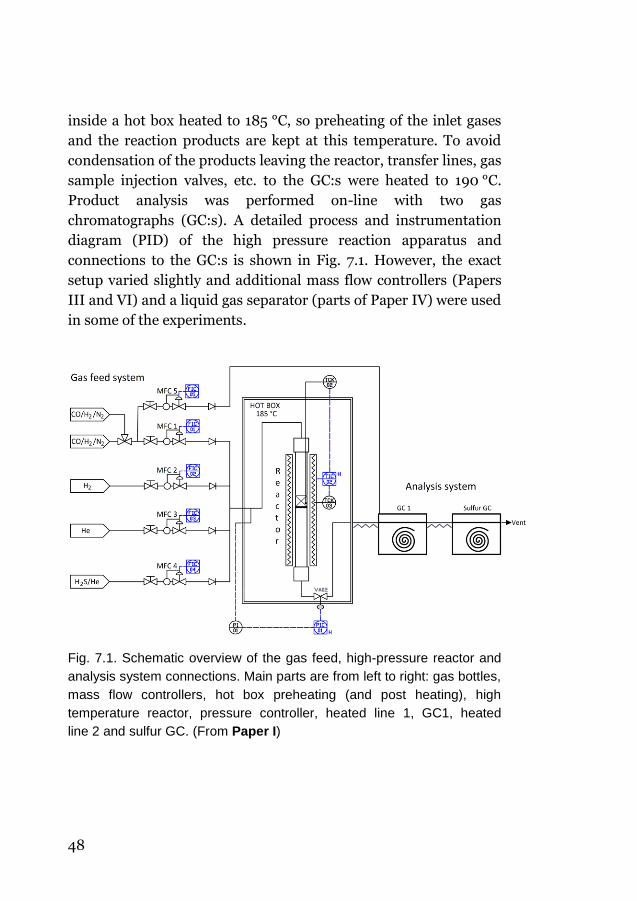
48
inside a hot box heated to 185 °C, so preheating of the inlet gases
and the reaction products are kept at this temperature. To avoid
condensation of the products leaving the reactor, transfer lines, gas
sample injection valves, etc. to the GC:s were heated to 190 °C.
Product analysis was performed on-line with two gas
chromatographs (GC:s). A detailed process and instrumentation
diagram (PID) of the high pressure reaction apparatus and
connections to the GC:s is shown in Fig. 7.1. However, the exact
setup varied slightly and additional mass flow controllers (Papers
III and VI) and a liquid gas separator (parts of Paper IV) were used
in some of the experiments.
Fig. 7.1. Schematic overview of the gas feed, high-pressure reactor and
analysis system connections. Main parts are from left to right: gas bottles,
mass flow controllers, hot box preheating (and post heating), high
temperature reactor, pressure controller, heated line 1, GC1, heated
line 2 and sulfur GC. (From Paper I)
49
7.2 Development of an analytical system for higher
alcohol synthesis products
The interest in syngas conversion to higher alcohols has
motivated the development of improved analytical tools for
product analysis, since the ones generally used suffers from a
number of drawbacks and weaknesses (see Paper I).
Improved analytical tools for product analysis are very
important since they can give more precise and accurate
information from performed catalytic tests. This reduces
uncertainty concerning the obtained results allowing more precise
conclusions to be drawn. By identifying and quantifying more
compounds more information can also be gained from the studies,
to further improve the understanding of how MoS2-based catalysts
work, in the end hopefully permitting the development of better
working MoS2-based catalysts. Minor compounds may also be very
important since they can give clues and information regarding
product intermediates and formation pathways and how these are
changed when the catalyst composition is changed.
An optimized HAS on-line gas chromatographic (GC) system
and method were therefore developed (Paper I) to overcome the
deficiencies in the methods used so far. The goal was to develop a
system and method which are fast and simple to use, but especially
with increased analytical accuracy and precision. The system
should therefore be able to separate and quantify individual
compounds, be totally automated, and the method good enough to
achieve closing material balances over the catalytic reactor setup.
The system was developed for the products formed over alkali-
promoted MoS2 catalysts for HAS, but is not limited to this catalyst
type. Trace amounts of sulfur-containing compounds can also be
found in the product when sulfur-containing catalysts are used
and/or sulfur-containing syngas is fed. To understand to which
degree this happens and in which form the sulfur is incorporated
50
into the liquid product, a system for light sulfur compound
analysis was additionally developed.
The analytical system contains two GCs, where the first GC
performs analysis of inorganic gases as well as hydrocarbons and
oxygenates, making it possible to establish a full carbon material
balance over the reactor, while the second GC is used for trace level
analysis of sulfur compounds. All analysis was performed online
using gas sampling valves and gas loops for sample introduction.
To avoid condensation of products and achieve accurate
measurements, all parts in contact with the sample (valves, sample
loops, valve transfer lines) were located in an insulated valve oven
heated to 190 °C, while transfer lines to and between the GC:s were
kept to a minimum and held at the same temperature.
7.2.1 Analytical principles and product separation (GC1)
Analysis of the main products, all except sulfur, was carried
out on-line using an Agilent 7890 gas chromatograph (GC 1 in
Fig. 7.1) equipped with a thermal conductivity detector (TCD) and
two flame ionization detectors (FID). A schematic overview of the
main parts of the system is shown in Fig. 7.2.
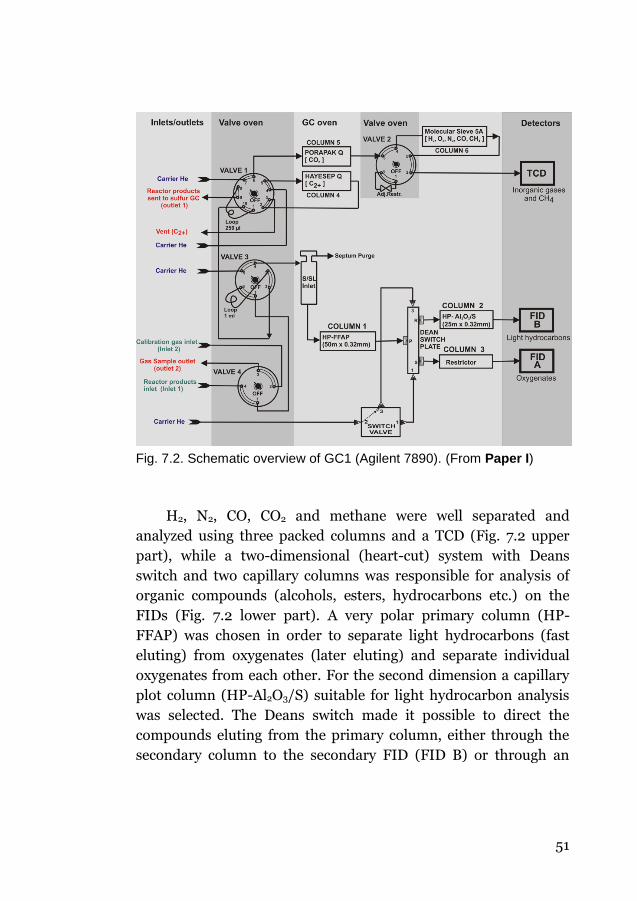
51
Fig. 7.2. Schematic overview of GC1 (Agilent 7890). (From Paper I)
H2, N2, CO, CO2 and methane were well separated and
analyzed using three packed columns and a TCD (Fig. 7.2 upper
part), while a two-dimensional (heart-cut) system with Deans
switch and two capillary columns was responsible for analysis of
organic compounds (alcohols, esters, hydrocarbons etc.) on the
FIDs (Fig. 7.2 lower part). A very polar primary column (HP-
FFAP) was chosen in order to separate light hydrocarbons (fast
eluting) from oxygenates (later eluting) and separate individual
oxygenates from each other. For the second dimension a capillary
plot column (HP-Al2O3/S) suitable for light hydrocarbon analysis
was selected. The Deans switch made it possible to direct the
compounds eluting from the primary column, either through the
secondary column to the secondary FID (FID B) or through an

52
inert restrictor column to the primary FID (FID A), depending on
the Deans switch position (Fig. 7.3a and b, respectively).
By keeping the “Deans switch valve” initially in the on position
and later switch it to the off position (Fig. 7.3a-b), a very good
separation between individual oxygenates and hydrocarbons could
be achieved. Chromatograms of the compounds produced and
identified in the first (hydrocarbons) and second dimension
(oxygenates), respectively, are presented in Figs. 7.4-7.5.
Fig. 7.3. (a and b) Flow path for helium (carrier) and sample compounds
when the Deans switch valve is in “on” and “off” position, respectively
(GC1, Agilent 7890). (From Paper I)
a
b
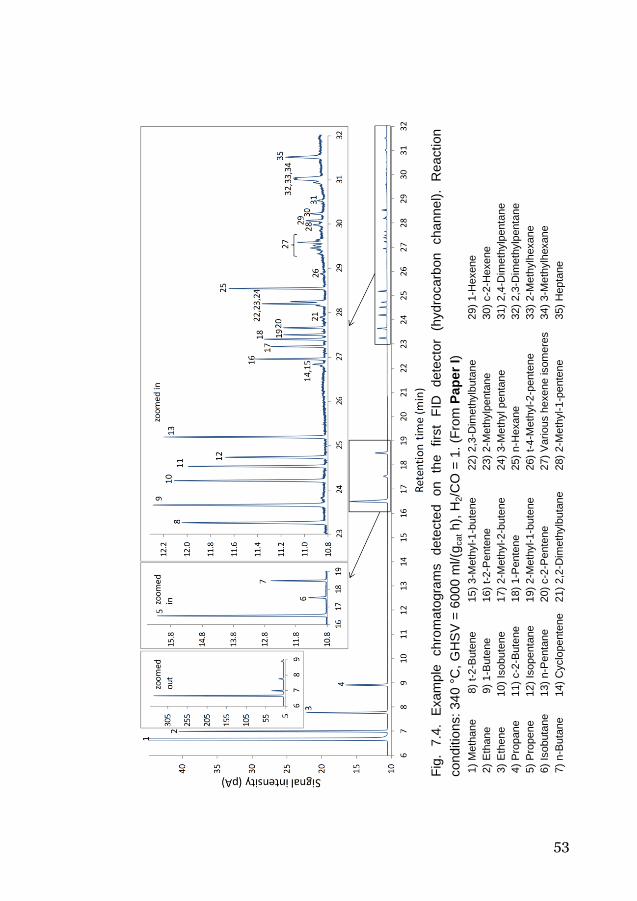
53
Fig
. 7.4
. E
xam
ple
chro
mato
gra
ms
dete
cte
d
on
the
firs
t F
ID
dete
cto
r (h
ydro
carb
on
cha
nne
l).
Reaction
conditio
ns: 34
0 °
C,
GH
SV
= 6
000 m
l/(g
cat h
), H
2/C
O =
1.
(Fro
m P
ap
er
I)
1)
Me
thane
8)
t-2-B
ute
ne
15)
3-M
eth
yl-1-b
ute
ne
22)
2,3
-Dim
eth
ylb
uta
ne
29)
1-H
exene
2)
Eth
ane
9)
1-B
ute
ne
16)
t-2-P
ente
ne
23)
2-M
eth
ylp
enta
ne
30)
c-2
-Hexene
3)
Eth
ene
10)
Isobute
ne
17)
2-M
eth
yl-2-b
ute
ne
24)
3-M
eth
yl penta
ne
31)
2,4
-Dim
eth
ylp
enta
ne
4)
Pro
pane
11)
c-2
-Bute
ne
18)
1-P
ente
ne
25)
n-H
exane
32)
2,3
-Dim
eth
ylp
enta
ne
5)
Pro
pene
12)
Isopenta
ne
19)
2-M
eth
yl-1-b
ute
ne
26)
t-4-M
eth
yl-2-p
ente
ne
33)
2-M
eth
ylh
exane
6)
Isobuta
ne
13)
n-P
enta
ne
20)
c-2
-Pente
ne
27)
Vario
us h
exene isom
ere
s
34)
3-M
eth
ylh
exane
7)
n-B
uta
ne
14)
Cyclo
pente
ne
21)
2,2
-Dim
eth
ylb
uta
ne
28)
2-M
eth
yl-
1-p
ente
ne
35)
Hepta
ne
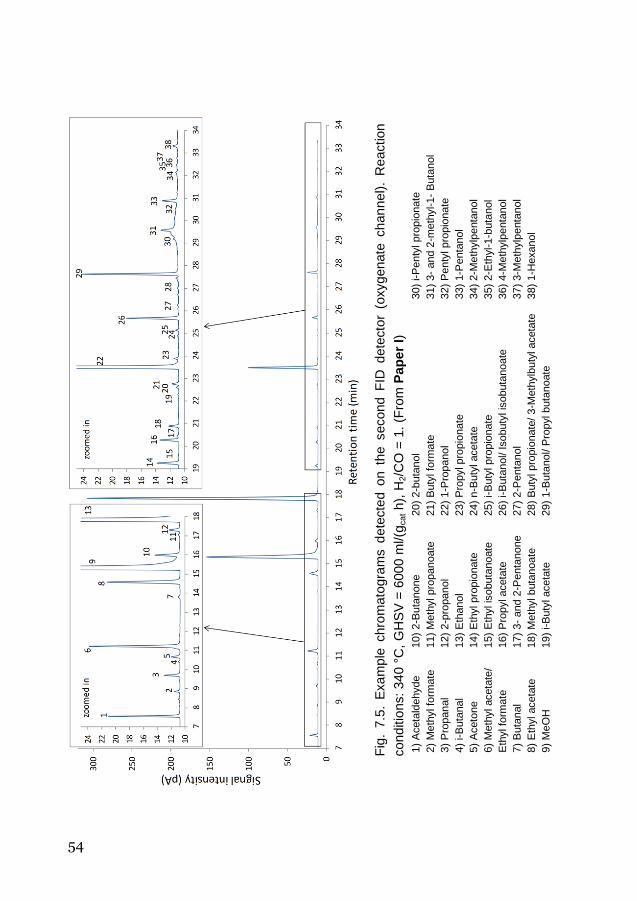
54
Fig
. 7.5
. E
xa
mp
le chro
mato
gra
ms d
ete
cte
d o
n th
e second
F
ID dete
cto
r (o
xygenate
chan
nel)
. R
eaction
conditio
ns: 34
0 °
C,
GH
SV
= 6
000 m
l/(g
cat h
), H
2/C
O =
1.
(Fro
m P
ap
er
I)
1)
Aceta
ldehyde
10)
2-B
uta
none
20)
2-b
uta
nol
30)
i-P
enty
l pro
pio
nate
2)
Me
thyl fo
rma
te
11)
Me
thyl pro
panoate
21)
Buty
l fo
rma
te
31)
3-
and 2
-me
thyl-1-
Buta
nol
3)
Pro
panal
12)
2-p
ropanol
22)
1-P
ropanol
32)
Penty
l pro
pio
nate
4)
i-B
uta
nal
13)
Eth
anol
23)
Pro
pyl pro
pio
nate
33)
1-P
enta
nol
5)
Aceto
ne
14)
Eth
yl pro
pio
nate
24)
n-B
uty
l aceta
te
34)
2-M
eth
ylp
enta
nol
6)
Me
thyl aceta
te/
15)
Eth
yl is
obuta
noate
25)
i-B
uty
l pro
pio
nate
35)
2-E
thyl-
1-b
uta
nol
Eth
yl fo
rma
te
16)
Pro
pyl aceta
te
26)
i-B
uta
nol/ Isobuty
l is
obuta
noate
36)
4-M
eth
ylp
enta
nol
7)
Buta
nal
17)
3-
and 2
-Penta
none
27)
2-P
enta
nol
37)
3-M
eth
ylp
enta
nol
8)
Eth
yl aceta
te
18)
Me
thyl buta
noate
28)
Buty
l pro
pio
nate
/ 3-M
eth
ylb
uty
l aceta
te
38)
1-H
exanol
9)
Me
OH
19)
i-B
uty
l aceta
te
29)
1-B
uta
nol/ P
ropyl buta
noate

55
7.2.2 Material balance, selectivity, conversion and calibration
(GC1)
CO conversion and product selectivity were ascertained from
the TCD measurements using a premixed syngas containing 4% N2
internal standard. With the internal standard method CO, H2, CO2
and CH4 molar flow rates (F) are decided by the measured
compound TCD area (A) and the compound response factor (K)
relative the internal standard. The compounds’ response factors
relative internal standard (Ki/N2) were found by calibration with
two certificated gases standards, each containing CO, H2, CO2, CH4
and N2 with known composition. The definitions and calculations
of CO conversion (XCO) and methane selectivity (SCH4) from TCD
measurements are shown in Eqs. 7.1 -7.3. Selectivity is expressed
in carbon% on a CO2-free basis (and is so throughout this thesis
unless explicitly stated).
XCO in
N
out
N
in
CO
out
CO
in
CO
out
CO
in
CO
AA
AA
F
FF
22/
/1
CO conversion (7.1)
SCH4
(CO2-free).
4
orgC
CH
F
F Methane selectivity (7.2)
SCH4,TCD
=
2
4
CO
out
CO
in
CO
CH
FFF
F
2222222
2424
//
/
///
/
NCO
out
NCONCO
out
N
out
CO
in
N
in
CO
NCH
out
NCH
KAAKAAAA
KAA
(7.3)
Methane selectivity on the TCD detector
The internal normalization method was used for determining the
selectivity to organic compounds since all injected material is

56
eventually detected on the FIDs. Eq. 7.4 shows this for determining
methane selectivity, while other selectivities are determined in an
equivalent way.
SCH4,FID
(CO2-free)
1 1.
444
i j ijij
CHCH
orgC
CH
RA
RA
n
n (7.4)
Selectivity is calculated from the measured FID area (A) of the
compound of interest (methane in Eq. 7.4) and its corresponding
FID response factor (R) (due to non-unity response of the carbon
atoms attached to oxygen) divided by the areas of all organic
carbon molecules (Aij)(alcohols, hydrocarbons, esters etc. of
different carbon lengths) with corrected responses (Rij) summed
together (Eq. 7.4).
The response factor difference between oxygenates and
hydrocarbons are large and therefore significant errors occur if
unity is used also for oxygenates. FID relative response factors
(carbon response per carbon in alcohol relative carbon in
hydrocarbon) for the three shortest alcohols determined by
calibration are as follows: RRFMethanol = 0.70, RRFEthanol = 0.73 and
RRF1-Propanol = 0.83.
As seen the methane selectivity can therefore be decided from
the TCD and FID measurements independently of each other,
meaning that they should ideally be equal to each other. Methane
also creates a link between the two different types of detectors and
makes a complete carbon material balance (MB) over the reactor
possible (Eq. 7.5),

57
FIDCH
CH
COoutCO
inCO
orgCCOoutCO
inCO
outC
inC
S
FFF
F
FFF
F
F
FMB
,
.
4
4
2
2
(7.5)
where FC out and FC in are total carbon flows into and out from the
reactor, respectively. The carbon flow of organic molecules (FC org.)
is calculated from the definition of methane selectivity (Eq. 7.2).
Eq. 7.5 therefore is equal to 100% when the carbon flow into the
reactor is equal to the carbon flow out of the reactor, meaning that
the measurement method works and a complete material balance
is achieved.
7.2.3 Method validation and conclusions (GC1)
The performance of the analytical system was tested during a
period of 80 h using the reactor system loaded with a K-Ni-MoS2
catalyst and a syngas feed with a H2/CO ratio=1. The gas hourly
space velocity (GHSV) and temperature was varied in order to
achieve very different product selectivities and CO conversions. In
this way it was possible to validate that the analytical method
works well, independently of product composition and CO
conversion level.
The methane selectivity determined from both detector types
(TCD and FID) changed in a coherent way and the difference
between them was always very small (Fig. 7.6), independently of
CO conversion and product composition (Table 7.1). This is in
addition to a carbon material balance of around 99.5% (Fig. 7.6)
over the reactor (Cin/Cout), regardless of the product composition,
shows that the method works well under the studied
circumstances. The use of internal standard for the TCD
measurements and carful calibration of the FID response factors
for alcohols (which are far from unity) are believed to be among

58
the important factors for the success. Since the material balance
does not show any signs of failing in the wide test range studied (in
terms of product composition and CO conversion) the method is
believed to work well also at significantly higher or lower
conversion levels and with other HAS catalysts giving different
product compositions.
To conclude, a totally online method was developed which is
simple and fast to use. Virtually all compounds are individually
separated and quantified. The closing material balance under all
and very different product composition displays that the method
works well and the quantification is trustworthy.
Table 7.1. Important reaction products for a few reaction conditions
Temperature (°C) 370 340 340 340 340 340 CO-conversion (%) 31.4 17.8 8.4 5.8 4.1 3.4 GHSV (ml/(gcat h)) 2750 2750 6000 9230 13,845 18,510 Alcohols 57.2 74.0 81.3 84.3 86.5 87.8 MeOH 10.6 25.7 43.0 50.1 55.7 59.5 EtOH 23.2 38.1 32.9 29.7 26.7 24.6 1-PrOH 15.3 8.0 4.2 3.5 3.1 2.8 1-BuOH 3.2 1.0 0.49 0.38 0.37 0.36 Isobutanol 2.5 0.6 0.28 0.21 0.18 0.16 Hydrocarbons 34.2 18.2 12.9 10.0 8.5 7.6 Methane 25.9 15.4 10.7 8.3 6.8 5.9 Ethane 3.3 1.2 0.78 0.50 0.42 0.37 Aldehydes 2.7 1.6 1.4 1.3 1.3 1.3 Acetaldehyde 1.4 1.3 1.2 1.2 1.1 1.1 Esters 4.3 5.7 4.0 4.1 3.5 3.1
Methyl acetate/methyl formate 0.8 2.3 2.3 2.7 2.4 2.2
Ethyl acetate 1.1 1.9 0.9 0.7 0.5 0.4 Methyl propionate 0.4 0.55 0.29 0.27 0.21 0.16 Ethyl propionate 0.6 0.37 0.12 0.07 0.04 0.03 Ketones 0.6 0.17 0.12 0.13 0.13 0.14 Others 1.0 0.25 0.29 0.15 0.05 0.03

59
86
87
88
89
90
91
92
93
94
95
96
97
98
99
10
0
10
1
10
2
05
10
15
20
25
30
35
40
45
50
05
10
15
20
25
30
35
40
45
50
55
60
65
70
75
80
Carbon material balance, Cin/Cout (%)
Conversion (%) and selectivity (C%)
Tim
e o
n s
tre
am (
h)
C CH
4 s
elec
tiv
ity
TC
D (
C%
, C
O2
-fre
e)
CH
4 s
elec
tiv
ity
FID
(C
%, C
O2
-fre
e)
CO
co
nv
ersi
on
(%
)
Car
bo
n m
ater
ial
bal
ance
, C
in/C
ou
t (%
)
T=
34
0 C
,
92
30
ml/
(gca
th)
T=
34
0 C
, G
HS
V=
27
50
ml/
(gca
th)
T=
34
0 C
, G
HS
V=
13
84
5 m
l/(g
cath
)T
=3
40 C
, G
HS
V=
18
51
0 m
l/(g
cath
)
T=
37
0 C
,
GH
SV
=2
75
0 m
l/(g
cath
)
T=
37
0
C,
GH
SV
=6
00
0 m
l/(g
cath
)
T=
37
0 C
92
30
ml/
(gca
th)
13
84
5 m
l/(g
cath
)
18
46
0 m
l/(g
cath
)
23
08
0 m
l/(g
cath
)
T=
37
0 C
,
GH
SV
=2
75
0 m
l/(g
cath
)
T=
34
0 C
,G
HS
V=
60
00
ml/
(gca
th)
Car
bo
n m
ater
ial b
alan
ce,C
in/C
ou
t(%
)
CH
4se
lect
ivit
y TC
D (
C%
, CO
2-f
ree)
CH
4se
lect
ivit
y FI
D (
C%
, CO
2-f
ree)
CO
co
nve
rsio
n (
%)
Fig
. 7.6
. C
O c
onvers
ion,
meth
ane s
ele
ctivity (
calc
ula
ted f
rom
TC
D a
nd t
he t
wo F
ID m
easure
ments
,
respectively
) as w
ell
as c
arb
on b
ala
nce o
ver
the r
eacto
r (C
in/C
out) f
or
ind
icate
d r
eactio
n c
on
ditio
ns.
For
meth
an
e sele
ctivity b
ased o
n th
e T
CD
an
d F
ID m
easure
me
nts
, o
nly
po
sitiv
e and ne
gative
uncert
ain
ty
bars
, re
spectively
, are
pre
sen
ted
to
m
ake
the
fig
ure
cle
are
r.
Consta
nt
rea
ction
conditio
ns: pre
ssure
= 9
1 b
ar
and s
yng
as m
ola
r ra
tio H
2/C
O =
1. (F
rom
P
ap
er
I)
60
7.2.4 Trace sulfur analysis (sulfur GC)
For trace level analysis of sulfur products formed with MoS2-
based catalysts and/or sulfur-containing feed gas, an on-line
Agilent 6890 GC equipped with an Agilent dual plasma 355 sulfur
chemiluminescence detector (SCD) was used and a method
developed. It is an extremely sensitive and selective sulfur detector
which provides a linear and equimolar response to sulfur
compounds without interference from most sample matrices (107 <
g S/g C) [112, 113]. It is therefore a powerful detector and useful
when trace sulfur compounds are to be measured in complex
hydrocarbon/alcohol HAS product. The sulfur reactions taking
place in the dual plasma burner (Eq. 7.6) and SCD (Eq. 7.7) are
shown below together with the light emitted and used for
quantification [113].
S-compound + O2 + H2 → SO + other products (7.6)
SO + O3 → SO2* → SO2 + hν (300–400 nm) (7.7)
All parts in contact with the sample were chosen for sulfur
inertness together with a column suitable for light sulfur
compounds analysis at trace level (GS-GasPro 30m x 0.32mm). In
this way it was possible to perform separation of COS from H2S
and other light sulfur gases without the use of sub-ambient
temperature. Calibration down to 5 ppm sulfur was performed and
major sulfur components identified by retention time matching
and/or MS fragmentation patterns. This system makes it possible
to measure trace amounts of sulfur online simply and quickly,
while the sulfur compounds can be identified and quantified. It is
thus possible to follow and understand what affects sulfur
incorporation, depending on reaction conditions or sulfur addition
in the feed gas, as is described in Paper III and presented in
chapter 9 of this thesis.

61
Chapter 8
Effect of operation conditions and gas feed
composition on product distribution
This chapter summarizes the results from Papers II-III, for
more details and in-depth discussion the reader is referred to these
publications.
In Paper II the focus was to study the effect of the operating
conditions space velocity and temperature on product distribution,
since e.g. secondary reactions of previously produced reaction
products seem to be of great importance for selectivity and activity
in CO hydrogenation over MoS2-based catalysts. To obtain clues
about how these reactions occur and are linked, correlation
patterns between the various products (alcohols, olefins, paraffins,
esters, aldehydes, etc.) and how they are affected by the process
parameters were studied. A potassium and nickel-promoted MoS2
catalyst for alcohol synthesis was mainly evaluated, but for
comparison a non-promoted MoS2 catalyst was additionally tested.
In Paper III the main focus was to study the effect of CO2-
containing syngas, relative CO2-free syngas under identical
reaction conditions and identical inlet H2 and CO partial pressures.
The effect of increased partial pressures of H2 and CO was also
studied, and to some extent also the effect of changed gas hourly
space velocity (GHSV). A K-Ni-MoS2 catalyst was used and the
study was performed during 360 h on stream.

62
8.1 Effect of temperature and space velocity on CO
conversion and water-gas shift
In Paper II the operation conditions gas hourly space velocity
(GHSV) and temperatures were varied over a fairly wide range
while major and minor products were carefully monitored and
quantified using the analytical system presented earlier (Paper I).
In Fig. 8.1 the CO conversion for the K-Ni-MoS2 catalyst is
shown when operation conditions were varied. In addition the CO
conversion for the non-promoted MoS2 catalyst at 370 °C is
displayed. The product composition reveals that the water-gas shift
reaction is very close to equilibrium under all conditions with the
K-Ni-MoS2 catalyst, while it is fairly far from it with the MoS2
catalyst at low temperature and high space velocity conditions.
Fig. 8.1. CO conversion at specified gas hourly space velocities (GHSV)
and temperatures for the K-Ni-MoS2 and MoS2 catalysts. Experimental
conditions: H2/CO=1, P=91 bar. (From Paper II)
0
10
20
30
40
50
0 2000 4000 6000 8000 10000 12000 14000 16000 18000 20000
CO
co
nv
ersi
on
(%
)
Gas hour space velocity (ml/gcat/h)
370°C, 91bar K-Ni-MoS2
350°C, 91bar K-Ni-MoS2
340°C, 91bar, K-Ni-MoS2
330°C, 91bar, K-Ni-MoS2
370°C, 91bar, MoS2

63
8.2 Selectivity for the promoted catalyst (K-Ni-MoS2)
Regardless of whether CO conversion was increased or
decreased by changed space velocity or varied temperature, a clear
trend in alcohol and hydrocarbon selectivity can be witnessed with
the K-Ni-MoS2 catalyst (Fig. 8.2). As the CO conversion increased
the alcohol selectivity decreased while the hydrocarbon selectivity
increased. Non-alcohol oxygenates were also produced in smaller
amounts over this catalyst (Fig. 8.2). This group mainly consists of
short aldehydes (largely acetaldehyde) and esters (e.g. ethyl
acetate) together with very small amounts of ketones (e.g.
acetone).
Fig. 8.2. Oxygenates, alcohols and hydrocarbons selectivity (CO2-free) at
different conversion levels over K-Ni-MoS2. Temperature levels were 330,
340, 350, 370 °C and for each temperature the space velocity 2400,
6000, 12000 and 18000 ml/(gcat h) was varied. Fixed experimental
conditions: H2/CO=1, P=91 bar. (From Paper II)
0
10
20
30
40
50
60
70
80
90
0 10 20 30 40 50
Sel
ecti
vit
y (
C%
)
CO conversion (%)
330 °C340 °C350 °C370 °C370 °C350 °C340 °C330 °C330 °C340 °C350 °C370 °C
Hydrocarbons
Alcohols
Hydrocarbons
Non alcohol oxygenates
Alcohols
Non alcohol
oxygenates

64
Increased conversion not only led to lower alcohol selectivity, the
alcohol distribution also switched towards longer alcohols. At low
conversion level (i.e high space velocity and low temperature), the
selectivity to methanol is high and a small amount of methane is
produced (Fig. 8.3). This indicates that methanol is a primary
product. As the conversion is increased (by decreased space
velocity and/or increased temperature) selectivity gradually shifts
towards longer and longer alcohols (Figs. 8.4-8.6) which are
thermodynamically more stable than the shorter ones, but also
towards methane and other hydrocarbons which are more stable
than alcohols (Figs. 8.3, 8.7-8.8). Alcohols appear to participate in
various secondary reactions in which they grow into longer
alcohols or are hydrogenated and dehydrated to hydrocarbons. The
common formation pathways for longer alcohols and
hydrocarbons (involving secondary reactions), consequently makes
it inherently difficult to achieve both high syngas conversion and
high alcohol selectivity over this catalyst type.
Alkali-promoted MoS2 catalysts have been found to mainly
produce linear alcohols [67, 114] therefore the high isobutanol (and
also branched pentanols) selectivity, especially pronounced at high
temperature (370 °C) and low space velocity, (2400 ml/(gcat h))
was unexpected (Fig. 8.5). The higher reaction temperature and
higher CO conversion level than in most studies, might partly
explain this fact, but the knowledge about branched alcohol
formation can in general be described as absent. Interesting to
notice is also that the high propene selectivity coincided with the
high level of i-BuOH selectivity (compare Fig. 8.5 and Fig. 8.8).
Possibly, CO insertion into an adsorbed propene-like species
followed by hydrogenation is responsible for i-BuOH formation. It
can be speculated that ethene and other olefins can grow to longer
alcohols in an equivalent way.

65
Fig. 8.3. Methane and methanol selectivities (CO2-free) at different
conversion levels over K-Ni-MoS2. Reaction conditions as in Fig. 8.2.
(From Paper II)
Fig. 8.4. Ethanol and propanol selectivities (CO2-free) at different
conversion levels. Reaction conditions as in Fig. 8.2. (From Paper II)
0
10
20
30
40
50
0 10 20 30 40 50
Sel
ecti
vit
y (
C%
)
CO conversion (%)
330 °C340 °C350 °C370 °C370 °C350 °C340 °C330 °C
CH4 370 C
CH4 330 C,
340 C, 350 C
Methanol 330°C
Methanol 340°C, 350°C
Methanol 370 C
Methane
Methanol
EtOH 330°C
EtOH 340°C
EtOH 350°C
EtOH 370°C
PrOH 370°C
PrOH 350°CPrOH 340°C
PrOH 330°C
0
5
10
15
20
25
30
35
0 10 20 30 40 50
Sel
ecti
vit
y (
C%
)
CO conversion (%)
330°C340°C350°C370°C370°C350°C340°C330°C
n-Propanol
Ethanol

66
Fig. 8.5. Isobutanol and branched pentanol selectivities (CO2-free) at
different conversion levels over K-Ni-MoS2. Reaction conditions as in
Fig. 8.2. (From Paper II)
Fig. 8.6. n-Butanol and n-pentanol selectivities (CO2-free) at different
conversion levels. Reaction conditions as in Fig. 8.2. (From Paper II)
0
2
4
6
8
10
0 10 20 30 40 50
Sel
ecti
vit
y (
C%
)
CO conversion (%)
370°C350°C340°C330°C370°C350°C340°C330°C
Branched
Pentanols
iso-Butanol
i-BuOH 350 C
i-BuOH 340 C
Br. Pentanolsi-BuOH 330 C
i-BuOH 370 C
n-BuOH 370 °C
n-BuOH 350 °C
n-BuOH 340 °C
n-BuOH 330 °C
n-PeOH 370 °C
n-PeOH 350 °C
n-PeOH 340 °Cn-PeOH 330 °C
0
1
2
3
0 10 20 30 40 50
Sel
ecti
vit
y (
C%
)
CO conversion (%)
370 °C350 °C340 °C330 °C370 °C350 °C340 °C330 °C
n-Pentanol
n-Butanol

67
Fig. 8.7. Ethane and ethene selectivities (CO2-free) at different
conversion levels over K-Ni-MoS2. Reaction conditions as in Fig. 8.2.
(From Paper II)
Fig. 8.8. Propane and propene selectivities (CO2-free) at different
conversion levels. Reaction conditions as in Fig. 8.2. (From Paper II)
Ethane 370°C
Ethane 350°C
Ethane 340°C
Ethane 330°C
Ethene 370°C
Ethene 350 °C
Ethene 340 °CEthene 330 °C
0
1
2
3
0 10 20 30 40 50
Sel
ecti
vit
y (
C%
)
CO conversion (%)
370°C350°C340°C330°C370°C350°C340°C330°C
Ethene
Ethane
Propene 370°C
Propene 350°C
Propene 340°C
Propene 330 °C
Propane 370°C
Propane 350°C
Propane 340°CPropane 330°C
0
1
2
0 10 20 30 40 50
Sel
ecti
vit
y (
C%
)
CO conversion (%)
370°C350°C340°C330°C370°C350°C340°C330°C
Propane
Propene
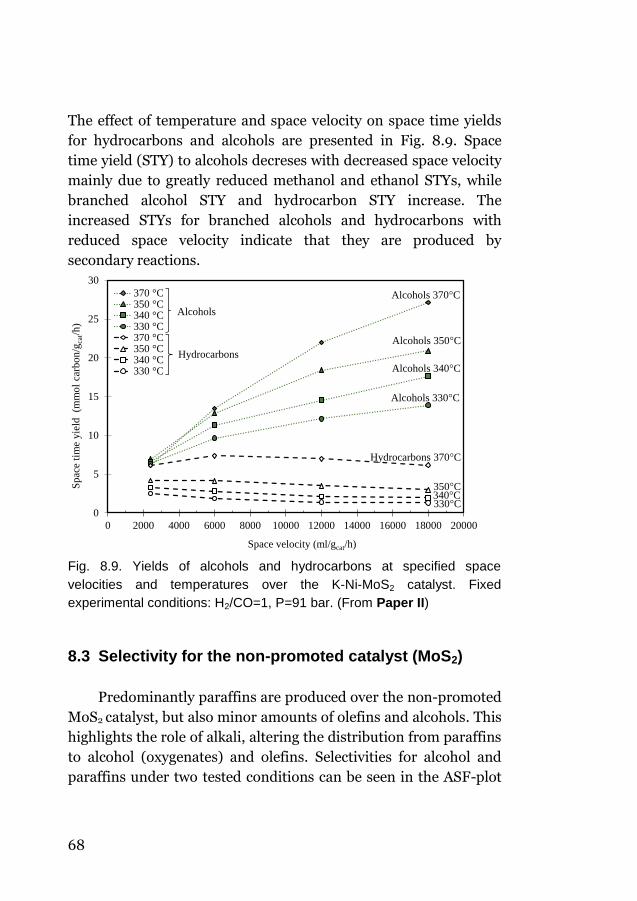
68
The effect of temperature and space velocity on space time yields
for hydrocarbons and alcohols are presented in Fig. 8.9. Space
time yield (STY) to alcohols decreses with decreased space velocity
mainly due to greatly reduced methanol and ethanol STYs, while
branched alcohol STY and hydrocarbon STY increase. The
increased STYs for branched alcohols and hydrocarbons with
reduced space velocity indicate that they are produced by
secondary reactions.
Fig. 8.9. Yields of alcohols and hydrocarbons at specified space
velocities and temperatures over the K-Ni-MoS2 catalyst. Fixed
experimental conditions: H2/CO=1, P=91 bar. (From Paper II)
8.3 Selectivity for the non-promoted catalyst (MoS2)
Predominantly paraffins are produced over the non-promoted
MoS2 catalyst, but also minor amounts of olefins and alcohols. This
highlights the role of alkali, altering the distribution from paraffins
to alcohol (oxygenates) and olefins. Selectivities for alcohol and
paraffins under two tested conditions can be seen in the ASF-plot
0
5
10
15
20
25
30
0 2000 4000 6000 8000 10000 12000 14000 16000 18000 20000
Sp
ace
tim
e yie
ld
(mm
ol
carb
on
/gca
t/h
)
Space velocity (ml/gcat/h)
370 °C350 °C340 °C330 °C370 °C350 °C340 °C330 °C
Alcohols 370 C
Alcohols 350 C
Hydrocarbons 370 C
Alcohols 340 C
Alcohols 330 C
350 C340 C330 C
Hydrocarbons
Alcohols

69
(Fig. 8.10). For a catalyst generally found to produce methane
(methanation catalyst), the elevated pressure applied appears to be
the main reason for the high selectivity to longer hydrocarbons in
this study [115]. Product distribution is to a relatively low extent
affected by space velocity changes, while temperature influences
the product distribution to a significantly larger degree. The
alcohol selectivity varied between 0.5-4.5 % while the olefin
selectivity stayed within 0.2-1 % under the conditions studied
(1830-18200 ml/(gcat h), 340-370 °C).
That the alcohol and olefin selectivities for the non-promoted
MoS2 are decreased by decreased space velocity or increased
temperature indicates that the alcohols and olefins may be
consumed in secondary reactions and hydrogenated to paraffins.
Fig. 8.10. ASF plot for normal paraffins and alcohols for the MoS2
catalyst. Values next to the respective carbon number display selectivity
(Sn) in carbon% (CO2-free). CO conv. (370 °C)=15.8 %, CO conv.
(340 °C)=11.3 %. Experimental conditions: H2/CO=1,
GHSV=6000 ml/gcat/h, P=91 bar. (From Paper II)
24.2
33.7
21.6
7.5
2.9
1.3
21.1
28.9
22.8
9.0
3.8
1.8
0.7
0.4
0.16
1.4
0.7
0.29
-3.5
-2
-0.5
1
2.5
4
0 1 2 3 4 5 6
ln (
Sn/n
)
Carbon number (n)
n-paraffins 370 °C
n-paraffins 340 °C
n-alcohols 370 °C
n-alcohols 340 °C
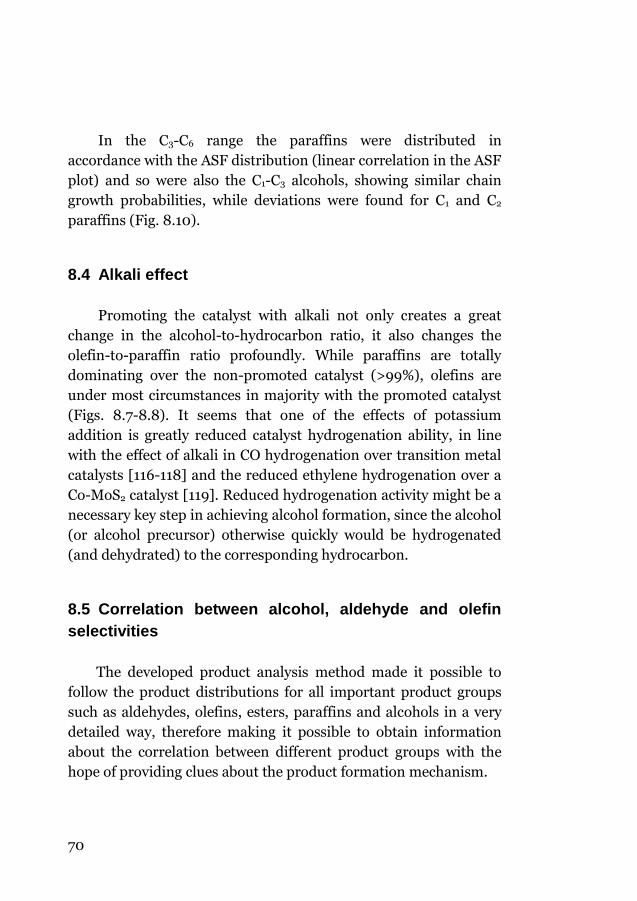
70
In the C3-C6 range the paraffins were distributed in
accordance with the ASF distribution (linear correlation in the ASF
plot) and so were also the C1-C3 alcohols, showing similar chain
growth probabilities, while deviations were found for C1 and C2
paraffins (Fig. 8.10).
8.4 Alkali effect
Promoting the catalyst with alkali not only creates a great
change in the alcohol-to-hydrocarbon ratio, it also changes the
olefin-to-paraffin ratio profoundly. While paraffins are totally
dominating over the non-promoted catalyst (>99%), olefins are
under most circumstances in majority with the promoted catalyst
(Figs. 8.7-8.8). It seems that one of the effects of potassium
addition is greatly reduced catalyst hydrogenation ability, in line
with the effect of alkali in CO hydrogenation over transition metal
catalysts [116-118] and the reduced ethylene hydrogenation over a
Co-MoS2 catalyst [119]. Reduced hydrogenation activity might be a
necessary key step in achieving alcohol formation, since the alcohol
(or alcohol precursor) otherwise quickly would be hydrogenated
(and dehydrated) to the corresponding hydrocarbon.
8.5 Correlation between alcohol, aldehyde and olefin
selectivities
The developed product analysis method made it possible to
follow the product distributions for all important product groups
such as aldehydes, olefins, esters, paraffins and alcohols in a very
detailed way, therefore making it possible to obtain information
about the correlation between different product groups with the
hope of providing clues about the product formation mechanism.

71
Aldehyde and alcohol selectivities for identical carbon
skeletons, for both branched and non-branched products under all
sixteen tested conditions (four different temperatures and four
different space velocities) are all strongly correlated. A few of these
conditions are illustrated in the ASF distribution plots (Fig. 8.11a-
e). The fact that the n-aldehyde and n-alcohol plots are copies of
each other (with a y-axis offset), displaying identical deviations
and chain growth probabilities, clearly indicates that they share a
common intermediate. The termination probabilities to aldehyde
and alcohol, respectively, from this common Cx intermediate, are
very different reflecting their very different product selectivities,
but the ratio between aldehyde and alcohol termination probability
is independent of chain length as seen by the identical shape of the
ASF plots. The termination probability ratio between aldehyde and
alcohol spans between 6% at the highest tested temperature
(370°C) and 3.5% at the lowest tested temperature (330°C). The
alcohol is possibly formed by hydrogenation of the
thermodynamically less stable aldehyde-like surface species. Also
olefin selectivities appear to be correlated to alcohol (and
aldehyde) selectivities (Fig. 8.11a-e), which is especially clear in
Fig. 8.11a when the catalyst surface most probably gets depleted in
C2 species (due to low conversion rate from C1 to C2 species and
fast conversion of C2 to C2+ species) under the high temperature
and low space velocity conditions. This points towards it being
formed from the same intermediate as aldehydes and alcohols, but
the correlation is not as strong as between the alcohols and
aldehydes. Compared to the distribution witnessed for n-alcohols,
especially ethene deviates by being formed to a lower degree than
expected at low temperature and high space velocity, while being
produced in higher concentration than expected at high
temperature and low space velocity (Fig. 8.11a-e). Higher
temperature and lower space velocity might favor dehydration of
ethanol (ethanol-like intermediate) to the thermodynamically
more stable ethene (ethene-like intermediate). Some of this ethene

72
Fig. 8.11. ASF plots for n-alcohols, α-
olefins, linear aldehydes and paraffins
over K-Ni-MoS2. Fixed experimental
conditions: H2/CO=1, P=91 bar.
a) GHSV= 2400 ml/(gcat h) and 370°C,
b) GHSV= 6000 ml/(gcat h) and 370°C,
c) GHSV=12000 ml/(gcat h) and 370°C,
d) GHSV=18000 ml/(gcat h) and 370°C,
e) GHSV=18000 ml/(gcat h) and 330°C.
(From Paper II)
-5
-4
-3
-2
-1
0
1
2
3
4
0 1 2 3 4 5 6
ln (
Sn/n
)
Carbon number (n)
n-alcohols
n-α-olefins
n-aldehydes
n-paraffins
-6
-5
-4
-3
-2
-1
0
1
2
3
4
0 1 2 3 4 5 6
ln (
Sn/n
)
Carbon number (n)
n-alcohols
n-α-olefins
n-aldehydes
n-paraffins
-6
-5
-4
-3
-2
-1
0
1
2
3
4
0 1 2 3 4 5 6
ln (
Sn/n
)
Carbon number (n)
n-alcohols
n-α-olefins
n-aldehydes
n-paraffins
-6
-5
-4
-3
-2
-1
0
1
2
3
4
0 1 2 3 4 5 6
ln (
Sn/n
)
Carbon number (n)
n-alcohols
n-α-olefins
n-aldehydes
n-paraffins
a b
c d
-6
-5
-4
-3
-2
-1
0
1
2
3
4
0 1 2 3 4 5 6
ln (
Sn/n
)
Carbon number (n)
n-alcohols
n-α-olefins
n-aldehydes
n-paraffins
e

73
is most probably also hydrogenated to ethane, favored by high
temperature and low space velocity, even though the potassium
promoter slows down the hydrogenation rate significantly.
By adding up the major linear reaction products for each
carbon number (n-alcohol, n-paraffins and α-olefins), a more
linear ASF plot is created (more ASF-distributed product)
compared to the plots for the individual product groups. This
indicates that a common intermediate is responsible for both
alcohol and hydrocarbon formation and that the chain growth
probability is fairly constant and independent of chain length.
8.6 Alcohol chain growth
Alcohol synthesis catalysts based on MoS2 are chiefly
described as producing linear alcohols, and the emphasis in the
discussion on chain growth is around CO insertion into an alkyl
group, where the alkyl is derived from an alcohol-like intermediate
[69]. This chain growth mechanism fits well with the
experimentally observed carbon chain length-dependent
selectivities resembling the ASF distribution, since it is based on a
chain growth step with a single carbon element (C1 monomer). The
ASF distribution is followed quite well also in the present study,
especially under low temperature and high space velocity
conditions (e.g. Fig. 8.11e), indicating a mechanism similar to the
one just described. However, as the temperature is increased and
the space velocity decreased (CO conversion increased) branched
alcohols start to be produced in substantial amounts (Fig. 8.5). The
alcohol formation model therefore is incomplete and needs to be
revised to deal also with branched alcohols. At higher CO
conversion levels, branched alcohols even dominate over their
linear counterpart (Figs. 8.5-8.6) (seen by comparing branched
and straight C4 and C5 alcohols, respectively).

74
My interpretation is that alcohol chain growth could be
thought of as a combination of two main reaction paths, linear
growth and branched growth. In linear growth, the single carbon
element is inserted into the carbon chain end (the first carbon)
adsorbed onto the catalyst surface, therefore leading to straight-
chain products. At low temperature it seems to dominate since the
alcohol product contains mostly linear ASF-distributed alcohols,
but as the temperature is increased and space velocity lowered,
branched growth gains ground. In branched growth the carbon
element is instead inserted on the “second carbon” of the carbon
chain (and in close proximity to adsorption point), thus explaining
the formation of branched products. According to this theory,
linear growth and branched growth could reflect two quite
different alcohol formation mechanisms or just be a small
modification of the kinetics for a single formation mechanism. The
two mechanisms could, for example, be CO insertion into an alkyl
(derived from an alcohol-like intermediate) and aldol
condensation (e.g. aldol condensation between C3+C1 species
leading to the formation of isobutanol). An example of a single
chain growth mechanism could be that an α-olefin-like species is
involved and that the changed iso-butanol/n-butanol ratio with
temperature simply could reflect the fact that isobutanol formation
from propene at low temperature is kinetically limited and n-
butanol formation favored, but as the temperature increases the
thermodynamically more stable product, isobutanol, gains ground.
Santiesteban et al. hypothesized that propanol was produced
from an ethene-like intermediate, based on the propanol isotope
distribution when labeled MeOH was co-fed over a K-Co-MoS2
catalyst [69].

75
8.7 Ester formation
Esters are together with aldehydes the main non-alcohol
oxygenates over the promoted MoS2 catalysts (Fig. 8.12). By
looking closer into ester and alcohol selectivities under different
conditions, it becomes clear that they are strongly correlated
(Fig. 8.14a-d). The correlation is such that an ester can be thought
of as being formed by two alcohol chains (with some hydrogen
removed) (Fig. 8.13). E.g. the selectivity to propyl acetate (C3+C2)
is correlated to the propanol (C3) and ethanol (C2) selectivities. The
correlation between alcohol and esters also clearly indicates that
esters are being formed by reactions between two alcohol
precursor species.
Fig. 8.12. Ester and aldehyde selectivities at different conversion levels
over the K-Ni-MoS2 catalyst. Temperature levels were 330, 340, 350,
370 °C and for each temperature space velocity 2400, 6000, 12000 and
18000 ml/(gcat h). Fixed experimental conditions: H2/CO=1, P=91 bar.
(From Paper II)
0
1
2
3
4
5
6
7
8
9
0 10 20 30 40 50
Sel
ecti
vit
y (
C%
)
CO conversion(%)
330°C340°C350°C370°C370°C350°C340°C330°C
Esters 340 C
Esters 350 C
Esters 370 C
Ald. 340 C
Aldehydes 370 C
Ald. 350 C
Esters 330 C
Ald. 330 C
Aldehydes
Esters

76
Fig. 8.13. Parts of the ester, part 1 containing the carbonyl group (acyl or
formyl group) and part 2 containing the alkoxy group.
The alkoxy part of the ester molecule (x-axis in Fig. 8.14a-d) is
correlated to the alcohol selectivity in an almost proportional way,
with the exception of methyl esters, which are being formed in
higher quantities than predicted from the methanol selectivity. It
can be speculated that this is due to an increased reactivity of the
C1 species (a methanol-like species, e.g. methoxy anion) compared
to the corresponding longer-chained species.

77
Fig. 8.14. Correlation between ester and alcohol chain lengths at 370 °C
for the K-Ni-MoS2 catalyst. See next page for Fig. 8.14c-d and further
information.
formate x100
alcohol
acetate x100
propionate x100
0
2
4
6
8
10
12
14
16
18
Methyl Ethyl
Propyl Butyl
Isobutyl
0.0
12.1
6.6
8.9
1.2
3.8
17.0
6.4
10.1
1.5
3.9
17.4
7.9
10.3
3.2
Sel
ecti
vit
y (
mo
l %
)
formate x100
alcohol
acetate x100
propionate x100
0
5
10
15
20
25
30
35
40
45
Methyl Ethyl
Propyl Butyl
Isobutyl
6.0
28.6
12.3
9.1
1.0 1.7
42.3
12.8
10.5
1.1 1.5
26.0
7.8
5.2
0.7
Sel
ecti
vit
y (
mo
l %
)
a
b
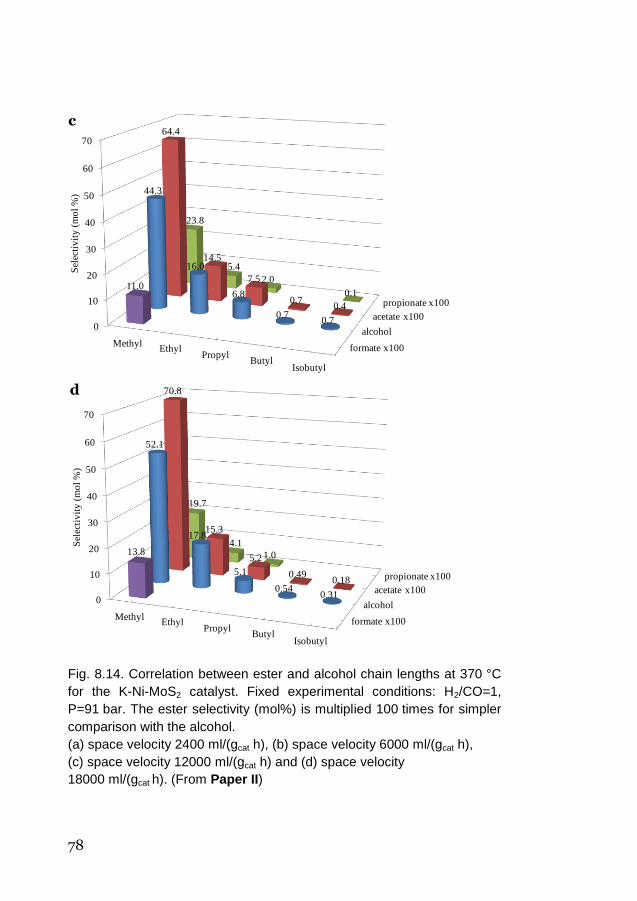
78
Fig. 8.14. Correlation between ester and alcohol chain lengths at 370 °C
for the K-Ni-MoS2 catalyst. Fixed experimental conditions: H2/CO=1,
P=91 bar. The ester selectivity (mol%) is multiplied 100 times for simpler
comparison with the alcohol.
(a) space velocity 2400 ml/(gcat h), (b) space velocity 6000 ml/(gcat h),
(c) space velocity 12000 ml/(gcat h) and (d) space velocity
18000 ml/(gcat h). (From Paper II)
formate x100
alcohol
acetate x100
propionate x100
0
10
20
30
40
50
60
70
Methyl Ethyl
Propyl Butyl
Isobutyl
11.0
44.3
16.0
6.8
0.70.7
64.4
14.5
7.5
0.70.4
23.8
5.4
2.0
0.1
Sel
ecti
vit
y (
mo
l %
)
formate x100
alcohol
acetate x100
propionate x100
0
10
20
30
40
50
60
70
Methyl Ethyl
Propyl Butyl
Isobutyl
13.8
52.1
17.8
5.1
0.540.31
70.8
15.3
5.2
0.490.18
19.7
4.1
1.0
Sel
ecti
vit
y (
mo
l %
)
c
d
a

79
The opposite correlation was found for the carbonyl part of
the ester (y-axis in Fig. 8.14a-d), i.e. much less formate esters (C1)
are formed than expected, while the acetate (C2) and propionate
(C3) esters are correlated almost proportionally to the
corresponding ethanol (C2) and propanol (C3) alcohol selectivities.
Santiesteban et al. performed co-feed experiments with
isotope-labeled methanol (13C) and showed that the methyl group
of methyl acetate is enriched with 13C as well as the terminal
carbon in the acetate part, while the carbonyl carbon consists of 12C
derived from the syngas [69]. For methyl formate the terminal
group was also 13C enriched, meaning it is methanol-derived while
the carbonyl carbon lacks 13C meaning that it is derived from the
syngas. These results are in line with the experimental findings of
this study.
8.8 Effect of CO2, H2 and CO partial pressure
As presented earlier in this chapter, the product distribution is
greatly affected by residence time and temperature in the reactor,
however, it is uncertain to which extent reaction products such as
CO2 influence formation rates and product distribution. It is of
great interest to understand the effect of CO2 on formation rates,
since the CO2 pressure in the reactor increases as the syngas
conversion increases, as it is a main reaction product. Another
reason for studying CO2-containg syngas is that raw syngas usually
contains CO2, and it may be of interest to understand the effect of
CO2-containing syngas being fed to the reactor. To clarify the effect
of CO2 on product selectivity and formation rates, a syngas feed
containing CO2 was compared with one free of CO2, while the inlet
H2 and CO partial pressures and reaction conditions were kept
identical (Paper III).
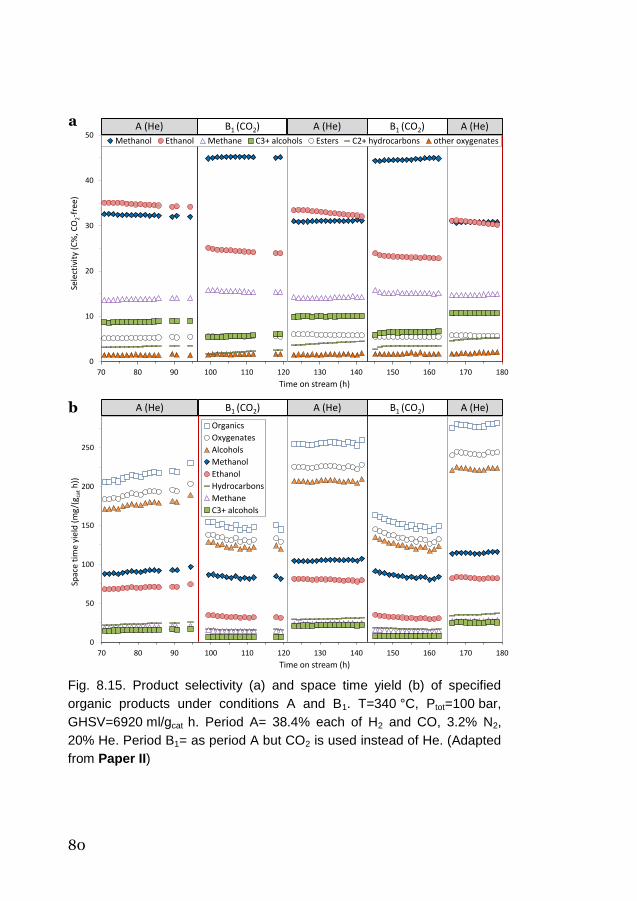
80
Fig. 8.15. Product selectivity (a) and space time yield (b) of specified
organic products under conditions A and B1. T=340 °C, Ptot=100 bar,
GHSV=6920 ml/gcat h. Period A= 38.4% each of H2 and CO, 3.2% N2,
20% He. Period B1= as period A but CO2 is used instead of He. (Adapted
from Paper II)
0
10
20
30
40
50
70 80 90 100 110 120 130 140 150 160 170 180
Sele
ctiv
ity
(C%
, CO
2-f
ree)
Time on stream (h)
Methanol Ethanol Methane C3+ alcohols Esters C2+ hydrocarbons other oxygenates
A (He) B1 (CO2) A (He) B1 (CO2) A (He)
0
50
100
150
200
250
70 80 90 100 110 120 130 140 150 160 170 180
Spac
e ti
me
yiel
d (
mg
/(g ca
th
))
Time on stream (h)
Organics
Oxygenates
Alcohols
Methanol
Ethanol
Hydrocarbons
Methane
C3+ alcohols
A (He) B1 (CO2) A (He) B1 (CO2) A (He)
a
b

81
CO2 in the feed was found to greatly alter selectivity towards
increased methanol selectivity while the ethanol and longer
alcohols (C3+OH) selectivities decreased under the studied
conditions (Fig. 8.15). Additionally, the presence of CO2
profoundly reduced CO conversion and the formation of organic
products, which, together with the reduced higher alcohol
selectivity, meant greatly reduced higher alcohol yield (Fig. 8.15).
The water-gas shift reaction was found to be close to equilibrium
under all tests conditions (determined from material balance)
meaning that large amounts of water were therefore produced
when CO2 was fed to the reactor. It made it impossible to discern
whether CO2 or water is responsible for the activity and selectivity
changes. With CO2 present in the feed, the reverse water-gas shift
reaction takes place until the WGS equilibrium is reached (eq. 3.7),
meaning that the H2 partial pressure is reduced and the CO and
H2O partial pressures increased. A lower H2/CO ratio normally
would favor an increased alcohol and hydrocarbon chain growth
(see next paragraph), but the opposite was witnessed with CO2 in
the feed. Thus CO2 (H2O) causes this effect. CO2 (H2O) is also
responsible for the great reduction in product yield, since the H2
and CO partial pressure changes (due to the WGS reaction) are
fairly small, and should only influence the yield to a minor extent.
Additionally, the negative effect on yield due to the reduced H2
partial pressure, should to a great extent be compensated for by
the increased CO partial pressure, giving a positive contribution to
the amount of product (see next paragraph).
In a similar manner as with CO2 addition, increased partial
pressures of H2 and CO were studied (Paper III). High H2/CO ratio
(H2/CO=1.52) clearly favors total product yield, especially
methanol yield, while low H2/CO-ratio (H2/CO=0.66) leads to
lower total product yield due to lower methanol and hydrocarbon
yield while the formation of longer alcohols i.e. ethanol, propanol
etc. is significantly increased. Without stating exact levels, clearly a

82
syngas feed with fairly low H2/CO ratio and low levels CO2 is
preferred for achieving maximum productivity to longer alcohols.

83
Chapter 9
Sulfur in the product and effect of H2S-
containing feed
In this chapter topics related to sulfur in higher alcohol
synthesis using a K-Ni-MoS2 catalyst are discussed. The aim was to
investigate the sulfur products being formed, their concentrations
and how they were affected when sulfur (H2S) was present or not
present in the feed. The effect on syngas conversion and selectivity
in the presence of sulfur was simultaneously studied. For more
details and in depth information and discussion the reader is
directed to the appended original paper (Paper IV).
9.1 Background and introduction
The level of sulfur in raw synthesis gas (mainly H2S and some
COS) is decided by the raw material, its origin and used production
method. In general significantly higher sulfur levels are found in
syngas derived from coal (0.1-2 %) than from biomass (20-
200 ppm), while the sulfur in natural gas-derived syngas in general
is removed before the syngas generation (often several % before
cleaning) to avoid catalyst deactivation [120, 121].
An often emphasized asset of the MoS2-based catalysts in HAS
is the resistance to sulfur poisoning (in contrast to the sensitive
metal catalysts). This property has been suggested to enable
reduction in syngas cleaning needs and costs related to it.
However, the use of sulfur-containing feed and catalyst might also
lead to incorporation of small amounts of light sulfur compounds
into the alcohol product, as indicated by early research by Dow
84
Chemical and later confirmed by Christensen et al. [67, 122]. The
knowledge regarding the severity of this issue is very scarce, but
nevertheless very important since even trace amounts of sulfur
might create a need for product cleanup if the level is too high for
the intended product use. The sulfur level in gasoline is e.g. limited
to 30 ppmw in United States and 10 ppmw in the European Union
[60, 123], meaning that the accepted sulfur limit of the alcohol
portion of the fuel most certainly will be in that region too.
There are many questions that remain unanswered regarding
the sulfur compounds produced over alkali-MoS2 catalysts and
their concentrations. This is important for understanding whether
cleaning procedures are necessary and if so how they can best be
performed. It is also of great importance to understand the effect
sulfur in the feed has on both alcohol and hydrocarbon
productivities so they can be optimized.
9.2 Sulfur products in condensate and gas phase
Two types of experiments were performed using a K-Ni-MoS2
catalyst which beforehand had been operated for 1000 h on stream
in sulfur-free syngas.
In the first experimental part, condensation of product was
performed using a Peltier-cooled liquid gas separator operated at
9°C and reaction pressure (91 bar). Sulfur free syngas feed was
used, thus the sulfur present in the product derived from the
catalyst. An example chromatogram of the sulfur compounds in
the product condensate can be seen in Fig. 9.1. Product
identification and quantification of the produced sulfur
compounds was achieved by the GC method for trace sulfur
analysis described in section 7.2.3 (Paper I). Applied reaction
conditions and determined sulfur concentrations in both the
condensate and the gas phase are shown in Table 9.1.

85
Fig. 9.1. Chromatogram of sulfur products in collected condensate.
Analysis was performed on an Agilent 6890 with dual plasma sulfur
chemiluminescence detector (SCD). Reaction conditions during collection
as in Table 9.1. (From Paper IV)
It is interesting to notice that although the catalyst has been
exposed to sulfur-free syngas for a long time, the total sulfur
content in the condensate (67 ppmw) is well above the sulfur
legislation for gasoline in both the US and the EU, 10 and 30
ppmw, respectively. The main sulfur products in the condensate
were methanethiol, ethanethiol, dimethyl sulfide (DMS) and ethyl
methyl sulfide (EMS). Very small amounts of propanethiol (PrSH)
were in addition produced (0.2 ppmw), this is much less than
expected considering the fairly high PrOH/MeOH (PrOH/EtOH)
ratio relative the PrSH/MeSH (PrSH/EtSH) ratio (see more in
Paper IV). A number of unidentified sulfur compounds (see
marked peaks in Fig. 9.1), all in concentrations within 0.4-2.4
ppmw S, were in addition present in the fuel.
17 18 19 20 21 22 23 24 25 26 27 28 29 30 31 32 33 34 35 36 37 38 39 40 41 42 43 44 45 46 47 48 49 50 51 52 53 54 55 56 57 58 59 60
Inte
nsi
ty (
a.u
.)
Retention time (min)
Ethanethiol
Dimethyl sulfide
Ethyl Methyl sulfide
40 42 44 46 48 50 52 54 56 58
zoomed in
Methanethiol
Propanethiol

86
Table 9.1. Sulfur products measured in gas phase and in liquid phase, respectively. Feed composition and reaction conditions: 4% N2, 48% H2 and 48% CO, GHSV=6920 ml/(gcath), T=370 °C, Ptot=91 bar. CO conversion and selectivity under these conditions were: CO conv.=16.7%, SAlc.=69.9%, SHC=20.9, Sothers=9.2%
Sulfur compound Concentration in gas phase (ppmv)
Concentration in condensate (ppmw S)
COS 3.1 0.5
H2S 14.3 1.2
Methanethiol 0.5 13.8
Ethanethiol 0.3 10.6
Dimethyl sulfide 0.7 21.3
Ethyl methyl sulfide 0.1 12.2 Unidentified sulfur compounds
0.01 7.9
Total sulfur level 19 67
Christensen et al. are the only ones that have touched the issue of
sulfur in the liquid product over MoS2-based HAS catalysts [122].
They found ethanethiol, 1-propanethiol and 2-methyl-1-propanol,
together with indications of dimethyl sulfide (DMS) and various
thiophenes in the condensate, suggesting that 2-methyl-1-propanol
and thiophenes were among the unidentified sulfur products
(Fig. 9.1.). Diethyl sulfide is also expected due to the high
ethanethiol concentration and the link between thiol and thioether
formation (see Paper IV). The sulfur compounds in the gas phase
were mainly H2S and COS together with very low levels of other
sulfur compounds, the same found in the condensate (Fig. 9.1.).
The major products identified (MeSH, EtSH, DMS and EMS)
appear reasonable based on literature where MoS2 catalysts and a
feed consisting of syngas or alcohols together with H2S has been
studied [124-130]. However, the high concentration of thioethers
(DMS, EMS) relative thiols (MeSH, EtSH) was unexpected, based
on the fact that thiols are the totally dominating products in the
above-described studies and Christensen’s alcohol synthesis study

87
[122]. However, as described below, this is related to the low H2S
concentration (14 ppmv) in this study, while the H2S concentration
was very much higher in the other studies. Research by Paskach et
al. also supports this, since the ratio DMS/MeSH increased greatly
when the H2S/MeOH feed ratio was decreased in their study [129].
9.3 Effect of H2S on sulfur products
In the second experimental part, the liquid-gas separator was
removed and all products analyzed online, while the effect of
170 ppm H2S in the feed was compared with sulfur-free conditions.
Presence of H2S in the feed greatly increased the concentration of
all sulfur compounds compared to sulfur-free feeding conditions
and most of the sulfur remained in the form of H2S (Fig. 9.2). The
organic sulfur concentration in the product gas (excluding COS
and H2S) stayed within 15-18 ppmv when 170 ppmv H2S was feed,
compared to 1.5-3.5 ppmv under H2S-free conditions (Fig. 9.3),
meaning a fivefold difference, roughly speaking. Together with
COS, formations of thiols (methanethiol and ethanethiol) were
especially favored by the presence of H2S. The thioether
concentration was also favored by H2S, however, to a much lower
extent, meaning that the thiol/thioether ratio increased greatly
when H2S was present in the feed gas. Apparently, H2S in the feed
greatly favors thiol formation. While methanethiol was the totally
dominating organic sulfur product when H2S was present in the
feed, dimethyl sulfide most often was found in higher
concentration under H2S-free conditions. There are indications
that the thioethers might be formed by secondary reactions from
the corresponding thiols or alcohol and thiol (see more in
Paper IV), while thiols are believed to be formed by reactions
between H2S and alcohol or H2S and syngas.
Obviously some transient effects can be seen in this study, related
to adsorption of sulfur (Fig. 9.2). Compared to the differences

88
between using H2S-containing or H2S-free feed this uncertainty is
however small and does not conceal the main conclusions.
Fig. 9.2. Sulfur products found in high concentration (a) and low
concentration (b) in products gas vs. time on stream and specified
reaction conditions when no condensation of product was performed.
Feed composition: 39.8% CO, 39.8% H2 and 20.4% N2. During the H2S
feed part the H2S concentration was 170 ppm while the N2 concentration
was decreased equally much. Ptot=9.1 MPa and GHSV=6670 ml/(gcat h).
(From Paper IV).
0
20
40
60
80
100
120
140
160
180
200
220
0 5 10 15 20 25 30 35 40 45 50 55 60 65 70 75 80 85 90 95 100 105 110 115 120
Su
lfu
r co
nce
ntr
atio
n (
pp
mv
)
Time on stream (h)
Sulfur in feed
Total sulfur
H2S
COS
Methanethiol
370 C 355 C 340
C
320 C 305 C 305
C
290 C
H2S in feed H2S-free feed
290
C
370 C 370 C 320
C
340
C
H2Sfree feed370 C
0
5
10
15
20
25
0 5 10 15 20 25 30 35 40 45 50 55 60 65 70 75 80 85 90 95 100 105 110 115 120
Su
lfu
r co
nce
ntr
atio
n (
ppm
v)
Time on stream (h)
COS
Methanethiol
Ethanethiol
Dimethyl sulfide
Ethyl methyl sulfide
Other sulfurs
370 C 355 C 340
C
320 C 305 C 305
C290 C
H2S in feed H2S-free feed
290
C370 C 370 C 320
C
340
C
H2Sfree feed
370 C
b
a
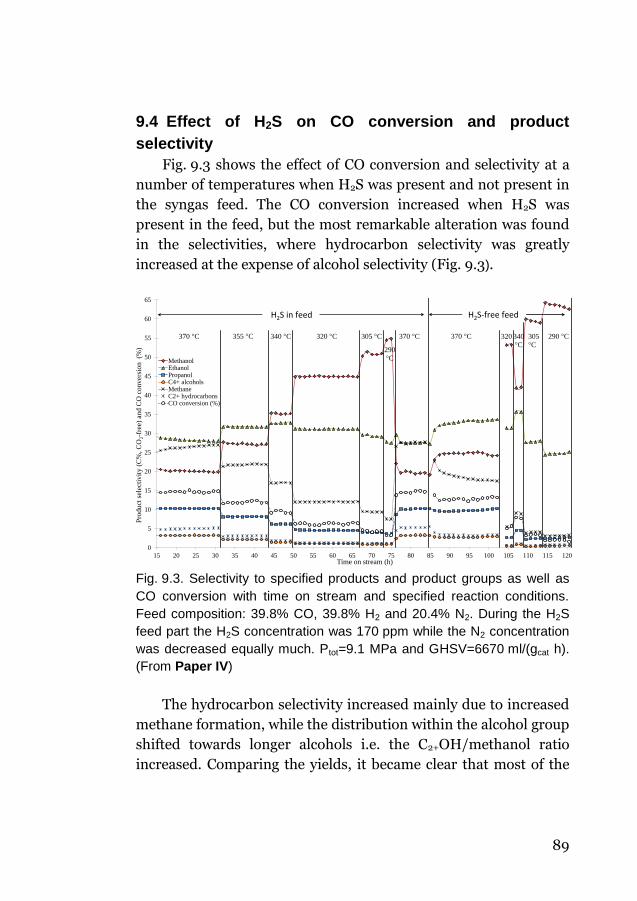
89
9.4 Effect of H2S on CO conversion and product
selectivity
Fig. 9.3 shows the effect of CO conversion and selectivity at a
number of temperatures when H2S was present and not present in
the syngas feed. The CO conversion increased when H2S was
present in the feed, but the most remarkable alteration was found
in the selectivities, where hydrocarbon selectivity was greatly
increased at the expense of alcohol selectivity (Fig. 9.3).
Fig. 9.3. Selectivity to specified products and product groups as well as
CO conversion with time on stream and specified reaction conditions.
Feed composition: 39.8% CO, 39.8% H2 and 20.4% N2. During the H2S
feed part the H2S concentration was 170 ppm while the N2 concentration
was decreased equally much. Ptot=9.1 MPa and GHSV=6670 ml/(gcat h).
(From Paper IV)
The hydrocarbon selectivity increased mainly due to increased
methane formation, while the distribution within the alcohol group
shifted towards longer alcohols i.e. the C2+OH/methanol ratio
increased. Comparing the yields, it became clear that most of the
0
5
10
15
20
25
30
35
40
45
50
55
60
65
15 20 25 30 35 40 45 50 55 60 65 70 75 80 85 90 95 100 105 110 115 120
Pro
du
ct s
elec
tiv
ity
(C
%,
CO
2-f
ree)
an
d C
O c
on
ver
sio
n
(%)
Time on stream (h)
MethanolEthanolPropanolC4+ alcoholsMethaneC2+ hydrocarbonsCO conversion (%)
370 C 355 C 340 C 320 C 305 C 305
C
290 C
H2S in feed H2S-free feed
290
C
370 C 370 C 320 340
C

90
increased CO conversion with added H2S was due to an increased
conversion to methane (and CO2 due to the water-gas shift
reaction). H2S in the feed therefore appears to counteract the effect
of potassium addition, making the catalyst behave more like one
free from alkali promoter i.e. showing increased CO conversion,
hydrocarbon (methane) selectivity and paraffin/olefin ratio while
the alcohol selectivity is reduced.

91
Chapter 10
Final discussion and conclusions
Catalytic conversion of syngas (H2/CO) to higher alcohols over
MoS2-based catalysts is an interesting alternative way of producing
C1-C5 alcohol fuels and chemicals. In this thesis a number of
important issues in the field of higher alcohol synthesis (HAS)
from syngas over MoS2-based catalysts are addressed. The catalytic
tests have been performed in a high pressure fixed catalytic reactor
with in-house prepared primarily potassium promoted Ni-MoS2
catalysts and a syngas feed with H2/CO-ratio=1. The catalysts were
prepared by co-precipitation of nickel and thiomolybdate, which
after drying was decomposed in the presence of alkali promoter.
Alkali-promoted MoS2-based catalysts are among the most
promising catalysts for higher alcohol synthesis e.g. due to their
high selectivity to longer alcohols as well as for being well adapted
to syngas with low H2/CO-ratio, which is typical for raw syngas
derived from biomass or coal.
The first part of the work presented is focused on the effect of
process parameters on product distribution and the correlation
between different compounds over a K-Ni-MoS2 catalyst. The
alcohol and hydrocarbon selectivities were found to be greatly
dependent on the CO conversion level. Increased CO conversion by
means of increased temperature or decreased space velocity, both
affect the product distribution in the same way with decreased
alcohol selectivity and increased hydrocarbon selectivity. However,
increased CO conversion leads to greater long-to-short alcohol
chain ratio. This indicates that shorter alcohols are building blocks
for longer alcohols and alcohols can be converted to hydrocarbons
by secondary reactions (especially methanol converted to

92
methane). As a result, it is inherently difficult to reach both high
single-path conversion and high alcohol selectivity over this
catalyst type. The strong correlation between aldehyde and alcohol
selectivities (C2-C6), displayed by identical deviations and chain
growth probabilities, indicate that they derive from the same
intermediate. Besides this, olefin and alcohol selectivities are
correlated, but the correlation is not as strong as between
aldehydes and alcohols. Fairly high levels of esters were also found
in the product (up to 7-8% C) and the carbon chain correlation
between alcohol (aldehyde) and ester selectivities is strong,
displaying that their formation paths are linked. The ester
selectivity is correlated almost proportionally to the selectivity of
the two corresponding alcohol selectivities, meaning that e.g. ethyl
propionate (C5) selectivity is correlated to a combination of ethanol
(C2) and propanol (C3) selectivities. Much less (alkoxy) formate
esters and more methyl esters are, however, formed than expected
according to the methanol content relative to the other alcohols.
The much greater olefin to paraffin ratio over the promoted
MoS2 catalyst compared to the non-promoted one indicates that
one function of the potassium promoter is to greatly reduce the
hydrogenation function of the catalyst. I therefore believe that
reduced hydrogenation activity is a key step in achieving high
alcohol and olefin selectivities.
The existence of CO2 in the feed greatly reduced the yield to
organic products while product distribution switched towards
short alcohols and hydrocarbons, i.e. methanol selectivity was
greatly increased and selectivity to longer alcohols decreased at the
same time as the methane selectivity was increased while longer
hydrocarbon selectivity decreased. However, if it is really CO2 or
H2O that causes this effect is difficult to say since they are linked
through the water-gas shift (WGS) reaction, which is close to
equilibrium under all reaction conditions. Changing the H2/CO
ratio of the syngas feed clearly shows that high H2/CO ratio
(H2/CO=1.52) favors total product yield, especially methanol yield.

93
Low H2/CO ratio (H2/CO=0.66) on the other hand leads to lower
total product yield due to lower methanol and hydrocarbon yields
while the longer alcohol formation i.e. ethanol, propanol etc. is
significantly increased. A low H2/CO ratio syngas with no or only
small amounts of CO2 is therefore preferred for maximizing the
higher alcohol yield and minimizing hydrocarbon and methanol
formation.
MoS2-based catalysts’ tolerance to sulfur has often been
presented as one of their most favorable characteristics in HAS.
The sulfur tolerance makes it possible to reduce syngas cleaning
needs (sulfur removal) and costs. However, as shown in the thesis,
using sulfur-containing feed and/or sulfur-containing catalyst
might also lead to incorporation of traces of light sulfur
compounds in the product liquid. Previously, the knowledge
regarding sulfur compounds formed and their concentrations was
very limited. After 1000 h on stream using a K-Ni-MoS2 catalyst
and sulfur-free syngas feed, the product condensate collected was
found to contain 67 ppmw of sulfur. The main sulfur compounds
found were methanethiol, ethanethiol, dimethyl sulfide and ethyl
methyl sulfide. Comparing the organic sulfur concentrations in the
product under sulfur-free and 170 ppmv (H2S) sulfur-containing
feed syngas, respectively, the organic sulfur concentration is
roughly five times higher when sulfur is present and especially the
thiol concentration is increased. Most of the sulfur however, was
still present as H2S or transformed to COS. This means that both
with and without sulfur in the feed, the sulfur concentrations in the
liquid product is higher than allowed in the EU and the US for use
in gasoline, meaning some kind of cleaning/distillation etc.
procedure is necessary before it can be used as blendstock in
gasoline. H2S in the feed additionally affects catalyst activity and
selectivity. This was mainly due to an increased methane formation
rate (and CO2) when H2S was present in the feed, thus increasing
CO conversion and lowering alcohol selectivity.

94
In order to achieve accurate and trustworthy results from the
high pressure catalytic tests described here earlier, a fully
automatic on-line gas chromatography method was developed. The
greatest advantage with the developed method is an almost
complete product separation capability between the formed
products (even minor compounds) and a well-closing carbon
material balance over the reactor. Two-dimensional gas
chromatography (2D-GC) with Deans switch was applied, making
it possible to achieve good separation between individual
hydrocarbons (olefins, paraffins, branched, straight etc.) in the
first dimension and individual oxygenates (alcohols, esters,
aldehydes etc.) in the second dimension. The organic products
were measured on two flame ionization detectors (FIDs) and
inorganic gases and methane on a thermal conductivity detector
(TCD). Product composition and syngas conversion level were
varied over a wide range by changes in process parameters in order
to verify method consistency. A constant carbon material balance
of around 99.5% over the reactor (Cin/Cout) was observed and
consistent methane selectivity determined from both the FIDs and
the TCD. This shows that the method works well and the aims were
accomplished, i.e. to develop an easy to use and fast procedure, but
especially a method with increased accuracy, precision and
resolution, allowing truthful and precise conclusions to be drawn
from the catalyst tests.
Further, the power of the successfully developed and
described “sulfur GC” method using an on-line gas chromatograph
(GC) equipped with dual plasma sulfur chemiluminescence
detector (SCD) was presented. It was used for measuring trace
sulfur compounds formed in the HAS product described earlier
and was achieved by using non-sulfur adsorbing materials for parts
in contact with the sample (tubing, valves, columns etc.), a very
suitable detector and optimized operation conditions, making it
possible to measure and quantify light sulfur products at trace level

95
in a hydrocarbon matrix in an easy, accurate and reliable way
which is inherently difficult.

96
Acknowledgements
First and foremost I would like to thank my supervisors
Associate Professor Magali Boutonnet and Professor Emeritus
Sven Järås for giving me the opportunity to carry out doctoral
studies at the division of Chemical Technology. I appreciate the
possibilities you gave me to travel, participate in conferences and
your confidence in me and my work.
Thanks to all colleagues, both former and present, at Chemical
Technology for making the department a stimulating and great
workplace. I will especially remember the camaraderie between the
PhD students and all nice social activities we have had together, all
coffees, barbeques, beers, conferences, trips etc. After many years
at the department there are some people towards which I feel a
great deal of gratitude because of your support to me and my
research.
In particular I want to thank my former high pressure lab
mates, Matteo (HP) Lualdi and Francesco Regali. Thanks for the
scientific discussions and for being great friends.
Special thanks to former KT and present Reformtech
colleague Sara Lögdberg for your support throughout my PhD
work and all nice moments.
Grazie mille lunch club president (ACI) Roberto Lanza for
improving the quality of the lunches and creating nice social
moments with a lot of laughs.
Thank you Xanthias Karatzas for making me train at least
once a week and make me focus on something different than
science for the moment. I enjoyed all the hard fights on the
floorball field.
To Jorge Velasco and Luis Lopez for your humor, providing
me with catalysis books and helping me finding water holes in
Bolivia.
97
To Erik Elm Svensson and Marita Nilsson, I remember
especially the nice “Asian tour” and the EuropaCat conference in
Åbo.
Thank you to the present PhD students Rodrigo Suárez Paris,
Javier “Barri” Barrientos, Moa Ziethén Granlund, Helen Winberg
and my office mates Lina Norberg Samuelsson and Pouya
Haghighi Moud for making my more recent stays at KTH a great
time.
Special thanks to Jöns Jacob Berzelius’ young friend Otto von
Krusenstierna for his scientific enthusiasm, at an age well above
90.
Furthermore, I would like to thank the CPMCT group lead by
Prof. Norbert Kruse for making my months in Brussels and
Université Libre de Bruxelles (ULB) nice. I specially would like to
thank Julien Schweicher, Yizhi Xiang, Melaet Gérôme and Cédric
Barroo for introducing me to the world of transient kinetics as well
as being great friends.
I am very grateful to Christina Hörnell for improving the
linguistic quality of this thesis and the appended papers.
I want to send a bear hug of gratitude to Sara Cavazzini for
supporting and believing in me. You provided me with strength in
my most difficult moments during my PhD and this thesis would
not have been possible without you.
The warmest kiss of great affection I send to the sweet Fatima
Pardo. Your enthusiasm, laugh, smile and positive way, have made
this thesis and my life so much easier and more joyful. We shared
so many great moments and your warm loving heart is always
present. And last, thank you for pushing and supporting me to
finalize this thesis, without you, it still might have been
incomplete.
Finally, I send a warm thanks to my family who deeply cares
about me and provides me with love and support.

98
Nomenclature
2D 2-dimensional
a.u. Arbitrary unit
ASF Anderson-Schulz-Flory
BET Brunauer-Emmett-Teller
BuOH Butanol
DMS Dimethyl sulfide
E10 A blend of 10 percent ethanol and 90% by volume gasoline
E15 A blend of 15 percent ethanol and 85% by volume gasoline
E85 A blend of 85 percent ethanol and 15% by volume gasoline
EMS Ethyl methyl sulfide
EOS Equation of state
EtOH Ethanol
EtSH Ethanethiol
FID Flame ionization detector
FT Fischer-Tropsch
GC Gas chromatograph
GHSV Gas hourly space velocity
HAS Higher alcohol synthesis
ICP Inductively coupled plasma
M15 A blend of 15 percent methanol and 85% by volume gasoline
MeOH Methanol
MeSH Methanethiol
MS Mass spectrometer
MFC Mass flow controller
PrOH Propanol
PrSH Propanethiol
ppb Parts per billion
ppm Parts per million
ppmw Parts per million on weight basis
ppmv Parts per million on volume basis
RRF Relative response factor

99
SCD Sulfur chemiluminescence detector
SRK Soave-Redlich-Kwong (equation of state)
STY Space time yield
TCD Thermal conductivity detector
XRD X-ray diffraction
WGS Water-gas shift
100
References
[1] Key World Energy Statistics 2012, International Energy Agency, Paris, 2012.
[2] World Population Prospects: The 2012 Revision, Department of Economic and Social Affairs/Population Division, United Nations, New York, 2013.
[3] World Energy Outlook 2014, International Energy Agency, Paris, 2014.
[4] J. van de Loosdrecht, J.W. Niemantsverdriet, in: R. Schlögl (Ed.), Chemical Energy Storage, De Gruyter, Berlin, 2013.
[5] J. Rostrup-Nielsen, L.J. Christiansen, Concepts in Syngas Manufacture, Imperial College Press, London, 2011.
[6] A. de Klerk, Fischer–Tropsch Refining, Wiley-VCH, Weinheim, 2011.
[7] J. Corella, J.-M. Toledo, G. Molina, International Journal of Oil, Gas and Coal Technology. 1 (2008) 194-207.
[8] A.V. Bridgwater, Fuel. 74 (1995) 631-653. [9] SubsTech, Combustion, pyrolysis and gasification of scrap tires,
http://www.substech.com/dokuwiki/doku.php?id=combustion_pyrolysis_and_gasification_of_scrap_tires#gasification, accessed: 2014-12-13
[10] P.J. Woolcock, R.C. Brown, Biomass Bioenergy. 52 (2013) 54-84. [11] M.J.A. Tijmensen, A.P.C. Faaij, C.N. Hamelinck, M.R.M. van
Hardeveld, Biomass Bioenergy. 23 (2002) 129-152. [12] K. Göransson, U. Söderlind, J. He, W. Zhang, Renewable and
Sustainable Energy Reviews. 15 (2011) 482-492. [13] J.R. Rostrup-Nielsen, Catal. Today. 21 (1994) 257-267. [14] J.G. Speight, The Biofuels Handbook, Royal Society of Chemistry,
London, 2010. [15] H. Schulz, Appl. Catal., A. 186 (1999) 3-12. [16] C.N. Satterfield, Heterogeneous Catalysis in Industrial Practice, 2
ed., Krieger Pub., Malabar, 1996. [17] A. Mittasch, M. Pier, K. Winkler, BASF, US Patent 1.558.559, 1925. [18] A. Mittasch, M. Pier, BASF, US Patent 1.569.775, 1926. [19] I. Wender, Fuel Process. Technol. 48 (1996) 189-297.

101
[20] S. Lee, Methanol Synthesis Technology, CRC press, Boca Raton, 1989.
[21] The Methanol Institute, Methanol basics, http://www.methanol.org/Methanol-Basics.aspx, accessed: 2014-12-13
[22] J.J. Spivey, Chem. Eng. Commun. 110 (1991) 123-142. [23] G.A. Olah, Á. Molnár, Hydrocarbon Chemistry, 2 ed., Wiley,
Hoboken, 2003. [24] ExxonMobil, Methanol to gasoline (MTG) technology,
http://www.exxonmobil.com/Apps/RefiningTechnologies/files/2014.1205.GTL.NA.pdf, accessed: 2014-12-13
[25] F. Fischer, H. Tropsch, Brennstoff-Chem. 5 (1923) 217-232. [26] F. Fischer, H. Tropsch, Brennstoff-Chem. 5 (1924) 201. [27] A.Y. Krylova, Solid Fuel Chemistry. 48 (2014) 22-35. [28] M.E. Dry, Catal. Today. 71 (2002) 227-241. [29] A. Steynberg, M. Dry, Fischer-Tropsch Technology, Elsevier
Science, Amsterdam, 2004. [30] M.E. Dry, Journal of Chemical Technology & Biotechnology. 77
(2002) 43-50. [31] J.M. Moe, Chem. Eng. Prog. 58 (1962) 33-36. [32] D.S. Newsome, Cat. Rev. - Sci. Eng. 21 (1980) 275-281. [33] P. Forzatti, E. Tronconi, I. Pasquon, Cat. Rev. - Sci. Eng. 33 (1991)
109 - 168. [34] A. Paggini, D. Sanfilippo, G. Pecci, I. Dybkjaer, VII International
Symposium on Alcohol Fuels, Editions Technip, Paris, 1986, pp. 62-67.
[35] P. Courty, P. Chaumette, C. Raimbault, P. Travers, Oil & Gas Science and Technology - Rev. IFP. 45 (1990) 561-578.
[36] J. Sa, Fuel Production with Heterogeneous Catalysis, Taylor & Francis, Boca Raton, 2014.
[37] H. Goehna, P. Koenig, US DOE Indirect Liquefaction: Contractors' Review Meeting Proceedings, 1989, pp. 59-83.
[38] G.A. Mills, Fuel. 73 (1994) 1243-1279. [39] Badische Anilin- & Soda-Fabrik (BASF), German Patent 293787,
1913. [40] F. Fischer, H. Tropsch, German Patent 411216, 1922. [41] F. Fischer, H. Tropsch, Brennstoff-Chem. 4 (1923) 276-288.
102
[42] G. Natta, U. Colombo, I. Pasquon, in: P.H. Emmett (Ed.), Catalysis V, Reinhold, New York, 1957.
[43] V. Haensel, J. P. Jones, W. A. Horne, Ministry of Fuel and Power, Report on investigations by fuels and lubricants teams at the I.G. Farbenindustrie AG. works at Leuna, 1947, pp.93-97.
[44] R.L. Bechtold, Alternative Fuels Guidebook: Properties, Storage, Dispensing, and Vehicle Facility Modifications, Society of Automotive Engineers, Warrendale, 1997.
[45] J.E. Anderson, D.M. DiCicco, J.M. Ginder, U. Kramer, T.G. Leone, H.E. Raney-Pablo, T.J. Wallington, Fuel. 97 (2012) 585-594.
[46] W.J. Piel, ACS Fuels. 39 (1994) 273-281. [47] M. Golombok, Industrial & Engineering Chemistry Research. 38
(1999) 3776-3778. [48] K. Owen, T. Coley, C.S. Weaver, Automotive fuels reference book,
Society of Automotive Engineers, Warrendale, 1995. [49] V.F. Andersen, J.E. Anderson, T.J. Wallington, S.A. Mueller, O.J.
Nielsen, Energy & Fuels. 24 (2010) 2683-2691. [50] C. Wyman, Handbook on Bioethanol: Production and Utilization,
Taylor & Francis, Washington DC, 1996. [51] V.F. Andersen, J.E. Anderson, T.J. Wallington, S.A. Mueller, O.J.
Nielsen, Energy & Fuels. 24 (2010) 3647-3654. [52] T. Wallner, A. Ickes, K. Lawyer, Proceedings of the FISITA 2012
World Automotive Congress, Springer, Berlin Heidelberg, 2013, pp. 15-26.
[53] J. Heywood, Internal Combustion Engine Fundamentals, McGraw-Hill, New York, 1988.
[54] R. Bak, Henry and Edsel: the creation of the Ford Empire, Wiley, Hoboken, 2003.
[55] New York Times, 20 September 1925, pp. 24. [56] B. Aldrich, ABC's of Afv's: A Guide to Alternative Fuel Vehicles,
Diane Publishing, Darby, 1995. [57] Renewable Fuels Association, RFA's 2014 Ethanol Industry Outlook
http://www.ethanolrfa.org/pages/annual-industry-outlook, accessed: 2014-12-13
[58] P. Amineh, G. Yang, Secure Oil and Alternative Energy: The Geopolitics of Energy Paths of China and the European Union, Brill, Leiden, 2012.

103
[59] United States Environmental Protection Agency (EPA), Frequently asked questions, How much ethanol is in gasoline and how does it affect fuel economy?, http://www.eia.gov/tools/faqs, accessed: 2014-12-13
[60] European Union, Fuel Quality Directive 2009/30/EC. [61] SEKAB, ED95 – The green biofuel for heavy transport,
http://www.sekab.com/biofuel/ed95, accessed: 2014-12-14 [62] SEKAB, How we create sustainable transport,
http://www.sekab.com/biofuel/ed95-for-sustainable-transport, accessed: 2014-12-14
[63] The Methanol Institute, Methanol facts, http://www.methanol.org/Methanol-Basics/Resources/China-Methanol.aspx, accessed: 2014-12-14
[64] M. Saito, R.B. Anderson, J. Catal. 63 (1980) 438-446. [65] G.J. Quarderer, G. Cochran, Dow Chemical Company, European
Patent 0119609, 1984. [66] N.E. Kinkade, Union Carbide, International Patent WO8503073,
1984. [67] R.R. Stevens, M.M. Conway, US Patent 4.831.060, 1989. [68] G.J. Quarderer, R.R. Stevens, G.A. Cochran, C.B. Murchison, Dow
Chemical, US patent 4.825.013, 1989. [69] J.G. Santiesteban, C.E. Bogdan, R.G. Herman, K. Klier, in: M.J.
Phillips, M. Ternan (Eds.), Proc. 9th Int. Congr. Catal., Vol. 2, Calgary, 1988, pp. 561-568.
[70] D. Li, C. Yang, N. Zhao, H. Qi, W. Li, Y. Sun, B. Zhong, Fuel Process. Technol. 88 (2007) 125-127.
[71] S. Zaman, K.J. Smith, Catalysis Reviews. 54 (2012) 41-132. [72] J.M. Thomas, W.J. Thomas, Principles and Practice of
Heterogeneous Catalysis, Wiley, Weinheim, 1997. [73] Haldor-Topsøe Inc., Sulphur resistant/sour water-gas shift
catalyst, Product brochure, 2009. [74] Haldor-Topsøe Inc., SSK catalyst Sulphur resistant/sour water-gas
shift catalyst, Product brochure, 2009. [75] J. Liu, E. Wang, J. Lv, Z. Li, B. Wang, X. Ma, S. Qin, Q. Sun, Fuel
Process. Technol. 110 (2013) 249-257. [76] A. Nogueira, R. Znaiguia, D. Uzio, P. Afanasiev, G. Berhault, Appl.
Catal., A. 429–430 (2012) 92-105.

104
[77] R. Vajtai, Springer Handbook of Nanomaterials, Springer, 2013. [78] R.B. Somoano, V. Hadek, A. Rembaum, J. Chem. Phys. 58 (1973)
697-701. [79] R. Schöllhorn, A. Weiss, Journal of the Less-Common Metals. 36
(1974) 229-236. [80] E. Benavente, M.A. Santa Ana, F. Mendizábal, G. González, Coord.
Chem. Rev. 224 (2002) 87-109. [81] N. Koizumi, K. Murai, T. Ozaki, M. Yamada, Catal. Today. 89 (2004)
465-478. [82] N.E. Kinkade, Union Carbide, European Patent 0149255, 1984. [83] G.J. Quarderer, G.A. Cochran, Dow Chemical, US Patent 4.749.724,
1988. [84] K. Klier, R.G. Herman, J.G. Nunan, K.J. Smith, C.E. Bogdan, C.W.
Young, J.G. Santiesteban, in: D.M. Bibby, C.D. Chang, R.F. Howe, S. Yurchak (Eds.), Methane conversion, Elsevier, Amsterdam, 1988, pp. 109-125.
[85] H.C. Woo, I.S. Nam, J.S. Lee, J.S. Chung, Y.G. Kim, J. Catal. 142 (1993) 672-690.
[86] J.S. Lee, S. Kim, K.H. Lee, I.-S. Nam, J.S. Chung, Y.G. Kim, H.C. Woo, Appl. Catal., A. 110 (1994) 11-25.
[87] V.P. Santos, B. van der Linden, A. Chojecki, G. Budroni, S. Corthals, H. Shibata, G.R. Meima, F. Kapteijn, M. Makkee, J. Gascon, ACS Catalysis. 3 (2013) 1634-1637.
[88] H. Xiao, D. Li, W. Li, Y. Sun, Fuel Process. Technol. 91 (2010) 383-387.
[89] R. Andersson, M. Boutonnet, S. Järås, Fuel. 107 (2013) 715-723. [90] N.E. Kinkade, Union Carbide, European Patent 0149256, 1984. [91] J.M. Christensen, P.A. Jensen, N.C. Schiødt, A.D. Jensen,
ChemCatChem. 2 (2010) 523-526. [92] B.L. William, G.B. Patrick, BP Chem, International Patent
WO2007/138300, 2007. [93] M.M. Conway, C.B. Murchison, R.R. Stevens, Dow Chemical, US
Patent 4.675.334, 1987. [94] X.-R. Shi, H. Jiao, K. Hermann, J. Wang, J. Mol. Catal. A: Chem. 312
(2009) 7-17. [95] T.Y. Park, I.-S. Nam, Y.G. Kim, Industrial & Engineering Chemistry
Research. 36 (1997) 5246-5257.

105
[96] D. Li, C. Yang, W. Li, Y. Sun, B. Zhong, Top. Catal. 32 (2005) 233-239.
[97] X. Li, L. Feng, Z. Liu, B. Zhong, D.B. Dadyburjor, E.L. Kugler, Ind. Eng. Chem. Res. 37 (1998) 3853-3863.
[98] P.E. Højlund Nielsen, K. Pedersen, J.R. Rostrup-Nielsen, Top. Catal. 2 (1995) 207-221.
[99] P.J. Flory, J. Am. Chem. Soc. 58 (1936) 1877-1885. [100] R.A. Friedel, R.B. Anderson, J. Am. Chem. Soc. 72 (1950) 1212-
1215. [101] H.C. Woo, I.-S. Nam, J.S. Lee, J.S. Chung, K.H. Lee, Y.G. Kim, J.
Catal. 138 (1992) 525-535. [102] V. Sundaramurthy, A.K. Dalai, J. Adjaye, J. Mol. Catal. A: Chem. 294
(2008) 20-26. [103] P.T. Vasudevan, F. Zhang, Appl. Catal., A. 112 (1994) 161-173. [104] S. Brunauer, P.H. Emmett, E. Teller, J. Am. Chem. Soc. 60 (1938)
309-319. [105] S. Brunauer, L.S. Deming, W.E. Deming, E. Teller, J. Am. Chem. Soc.
62 (1940) 1723-1732. [106] Micromeritics, ASAP 2020, Accelerated Surface Area and
Porosimetry System, Operator’s Manual, 2011. [107] S. Eijsbouts, S.W. Mayo, K. Fujita, Appl. Catal., A. 322 (2007) 58-66. [108] G. Li, C. Li, H. Tang, K. Cao, J. Chen, F. Wang, Y. Jin, J. Alloys
Compd. 501 (2010) 275-281. [109] A. Zak, Y. Feldman, V. Lyakhovitskaya, G. Leitus, R. Popovitz-Biro,
E. Wachtel, H. Cohen, S. Reich, R. Tenne, J. Am. Chem. Soc. 124 (2002) 4747-4758.
[110] A. Andersen, S.M. Kathmann, M.A. Lilga, K.O. Albrecht, R.T. Hallen, D. Mei, J. Phys. Chem. C. 116 (2012) 1826-1832.
[111] G.V.S. Rao, M.W. Shafer, S. Kawarazaki, A.M. Toxen, J. Solid State Chem. 9 (1974) 323-329.
[112] X. Yan, J. Sep. Sci. 29 (2006) 1931-1945. [113] Agilent 355 Sulfur and 255 Nitrogen Chemiluminescence
Detectors - Operation and Maintenance Manual. Manual nr G6600-90006. Agilent Technologies, Wilmington, USA, 2007.
[114] C.B. Murchison, M.M. Conway, R.R. Stevens, G.J. Quarderer, in: M.J. Phillips, M. Ternan (Eds.), Proc. 9th Int. Congr. Catal., Vol. 2, Calgary, 1988, pp. 626-633.
106
[115] K. Pedersen, J.R. Rostrup·Nielsen, I.G.H. Jörgensen, Haldor Topsöe, US Patent 4511674, 1985.
[116] M.E. Dry, T. Shingles, L.J. Boshoff, G.J. Oosthuizen, J. Catal. 15 (1969) 190-199.
[117] M. Röper, in: W. Keim (Ed.), Catalysis in C1 Chemistry, D. Reidel, Dordrecht, 1983, pp. 41-88.
[118] H. Ando, Q. Xu, M. Fujiwara, Y. Matsumura, M. Tanaka, Y. Souma, Catal. Today. 45 (1998) 229-234.
[119] M. Kantschewa, F. Delannay, H. Jeziorowski, E. Delgado, S. Eder, G. Ertl, H. Knözinger, J. Catal. 87 (1984) 482-496.
[120] S. Cheah, D.L. Carpenter, K.A. Magrini-Bair, Energy & Fuels. 23 (2009) 5291-5307.
[121] R.A. Pandey, S. Malhotra, Critical Reviews in Environmental Science and Technology. 29 (1999) 229-268.
[122] J.M. Christensen, P.M. Mortensen, R. Trane, P.A. Jensen, A.D. Jensen, Appl. Catal., A. 366 (2009) 29-43.
[123] Environmental Protection Agency, Federal Register. 65 (2000) 6698-6870.
[124] A. Chen, Q. Wang, Q. Li, Y. Hao, W. Fang, Y. Yang, J. Mol. Catal. A: Chem. 283 (2008) 69-76.
[125] A.P. Chen, Q. Wang, Y.J. Hao, W.P. Fang, Y.Q. Yang, Catal. Lett. 121 (2007) 260-265.
[126] Y.Q. Yang, S.J. Dai, Y.Z. Yuan, R.C. Lin, D.L. Tang, H.B. Zhang, Appl. Catal., A. 192 (2000) 175-180.
[127] Y.Q. Yang, Y.Z. Yuan, S.J. Dai, B. Wang, H.B. Zhang, Catal. Lett. 54 (1998) 65-68.
[128] D.E. Stinn, H.J. Swindell, D.H. Kubicek, M.M. Johnson, Phillips Petroleum, US Patent 5.898.012, 1999.
[129] T.J. Paskach, G.L. Schrader, R.E. McCarley, J. Catal. 211 (2002) 285-295.
[130] O.İ. Şenol, T.R. Viljava, A.O.I. Krause, Appl. Catal., A. 326 (2007) 236-244.