catalytic reduction of n o inside the ammonia burners of ... · as the sodium nitrite stems from...
TRANSCRIPT

JOINT IMPLEMENTATION PROJECT DESIGN DOCUMENT FORM - Version 01
Joint Implementation Supervisory Committee page 1
This template shall not be altered. It shall be completed without modifying/adding headings or logo, format or font.
JOINT IMPLEMENTATION PROJECT DESIGN DOCUMENT FORM VERSION 01 - IN EFFECT AS OF: 15 JUNE 2006
Catalytic Reduction of N2O inside the Ammonia Burners of the
BASF Nitric Acid Plant in Ludwigshafen
presented by
BASF AG
67056 Ludwigshafen
Germany
Ludwigshafen, 6 June 2008

JOINT IMPLEMENTATION PROJECT DESIGN DOCUMENT FORM - Version 01
Joint Implementation Supervisory Committee page 2
This template shall not be altered. It shall be completed without modifying/adding headings or logo, format or font.
CONTENT
A. General description of the project
B. Baseline
C. Duration of the project / crediting period
D. Monitoring plan
E. Estimation of greenhouse gas emission reductions
F. Environmental impacts
G. Stakeholders’ comments
Annexes
Annex 1: Contact information on project participants
Annex 2: Baseline information
Annex 3: Monitoring plan

JOINT IMPLEMENTATION PROJECT DESIGN DOCUMENT FORM - Version 01
Joint Implementation Supervisory Committee page 3
This template shall not be altered. It shall be completed without modifying/adding headings or logo, format or font.
SECTION A. General description of the project
A.1. Title of the project:
Catalytic reduction of N2O inside the Ammonia Burners of the BASF Nitric Acid Plant in Ludwigshafen
Version (Date): 6 June 2008
A.2. Description of the project:
BASF operates a nitric acid production plant at the production site in Ludwigshafen, Germany. Nitric acid has been produced in Ludwigshafen since 1928, with the now installed capacity existing since 1978. Nitric acid (HNO3) is one of the most important and quantitatively one of the top ten industrial chemicals. It is mainly used for the production of fertilizers, aside the manufacture of explosives and chemicals, such as isocyanates and adipic acid. The nitric acid from the Ludwigshafen plant is used for the production of fertilizer, adipic acid and isocyanate in BASF facilities at the production site in Ludwigshafen and partly sold to other BASF sites as well as to third parties. Another product of the nitric acid plant in Ludwigshafen is sodium nitrite, which is used for food additives, precursor for dyes, fibres, pharma, rubber and crop protection.. As the sodium nitrite stems from the same ammonia oxidation reaction as nitric acid and can be calculated as 100% nitric acid equivalent, it is completely included into the project and subsumed under nitric acid production in the following.
Nitric Acid is produced through the oxidation of ammonia (NH3) on precious metal catalyst gauze in the ammonia burner of a nitric acid plant. During the production of nitric acid, nitrous oxide (N2O) is generated as an unintended by-product of the high temperature catalytic oxidation of ammonia. This waste N2O is typically released into the atmosphere, as it does not have any economic value or toxicity at emission levels typical for nitric acid manufacture.
This is also the case at the BASF plant in Ludwigshafen, where some 950,000 tonnes nitric acid equivalents (calculated 100%, including sodium nitrite production calculated as 100% nitric acid equivalent) are produced annually. The plant is a complex network of ten oxidation reactors, feeding NOx gas into a ring line that distributes the gas stream to five high pressure and three low pressure absorption process trains. A selective catalytic reduction system for NOx reduction is integrated into the process trains to reduce NOx in the waste gas below the threshold value specified by German law (BImSchG in connection with TA Luft). Since there is no obligation for BASF to decompose the N2O from the nitric acid plant so far, it is released to the atmosphere with an intensity of ca. 4.9 kg N2O per tonne nitric acid, leading to overall emissions of some 4,165 tons of N2O, equal to 1,291,150 tCO2e per year. This is common practice in the nitric acid industry.
The idea of the JI project is to install selective DeN2O catalysts right below the platinum gauze in the catalytic reactor as a secondary abatement measure. The baskets that hold the catalyst shall be installed in each reactor during the next planned downtimes for prime catalyst replacement and charged with a DeN2O catalyst. The overall investment for this measure is expected to exceed three and a half million Euro, leading to estimated emission reductions of some 280,000 tCO2e per year on average.
With no economic benefit from N2O abatement and the lacking legal obligation, the emission reductions will only be realised when the investment can be financed by a JI project. In addition to the investment barrier, relevant uncertainties regarding the technical feasibility and achievable performance prevent the N2O abatement measures from being the business as usual scenario. So far there is no experience with secondary N2O abatement at atmospheric plants like the one in Ludwigshafen. This is reflected in the European BREF document for this industry, where – in contrast to medium and high pressure plants – no BAT emission factor is given for atmospheric plants.
JOINT IMPLEMENTATION PROJECT DESIGN DOCUMENT FORM - Version 01
Joint Implementation Supervisory Committee page 4
This template shall not be altered. It shall be completed without modifying/adding headings or logo, format or font.
The proposed project considers the future developments both from the technical and regulatory perspective. While it is already clear that German law imposes restrictions on N2O emissions from nitric acid production from October 2010 on, the technical possibilities still have to be explored and improved. The incentive for optimising N2O reduction yield shall come from the JI mechanism, leading to greenhouse gas emission reductions that do not occur in the business as usual scenario.
A.3. Project participants:
Party involved
Legal entity project participant
Please indicate if the Party involved wishes to be considered as project
participant (Yes/No)
Germany (host) BASF AG No
Sweden (investor country)
First talks with potential buyers of ERUs are ongoing. At the time of validation, the buyer has yet to be determined and shall be named at the first verification at the latest1.
Germany has ratified the Kyoto Protocol on 31 May 2002.
A.4. Technical description of the project:
A.4.1. Location of the project:
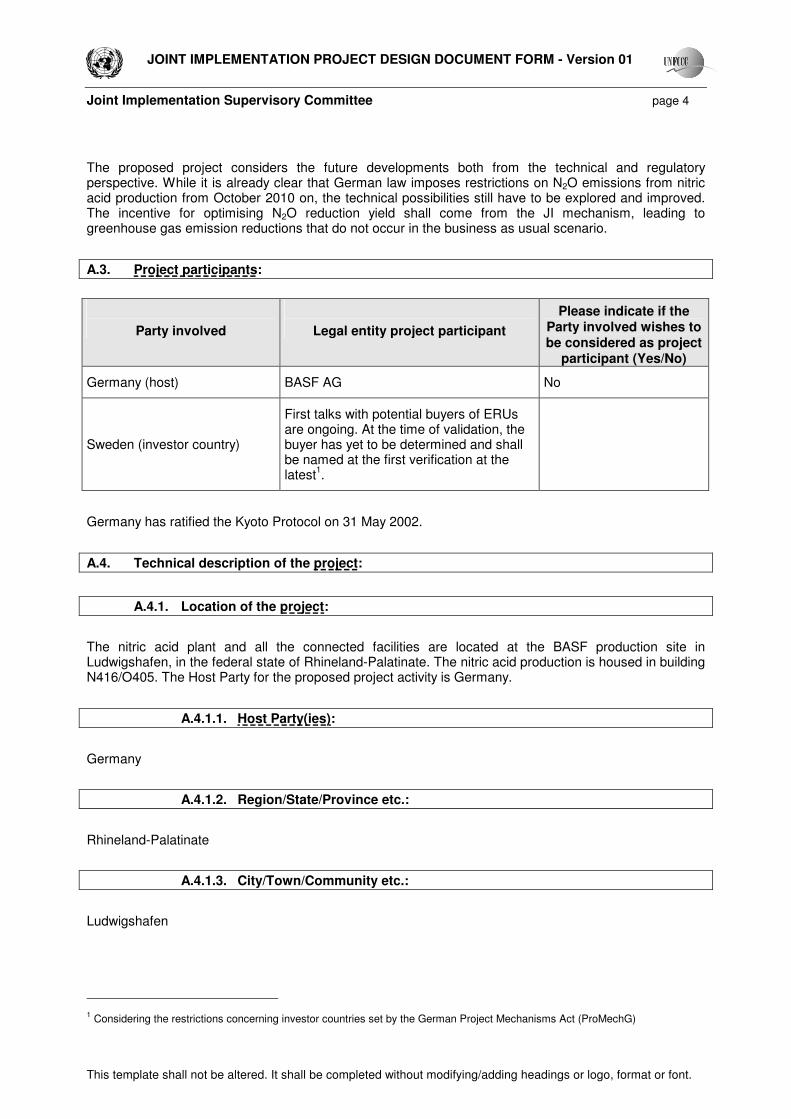
The nitric acid plant and all the connected facilities are located at the BASF production site in Ludwigshafen, in the federal state of Rhineland-Palatinate. The nitric acid production is housed in building N416/O405. The Host Party for the proposed project activity is Germany.
A.4.1.1. Host Party(ies):
Germany
A.4.1.2. Region/State/Province etc.:
Rhineland-Palatinate
A.4.1.3. City/Town/Community etc.:
Ludwigshafen
1 Considering the restrictions concerning investor countries set by the German Project Mechanisms Act (ProMechG)
JOINT IMPLEMENTATION PROJECT DESIGN DOCUMENT FORM - Version 01
Joint Implementation Supervisory Committee page 5
This template shall not be altered. It shall be completed without modifying/adding headings or logo, format or font.
A.4.1.4. Detail of physical location, including information allowing the unique identification of the project (maximum one page):
The nitric acid production is housed in building N416/O405. The following images give an overview:
Image 1: Location of the project activity, GPS coordinates of the plant: N49°31’04”, E08°25’15”.
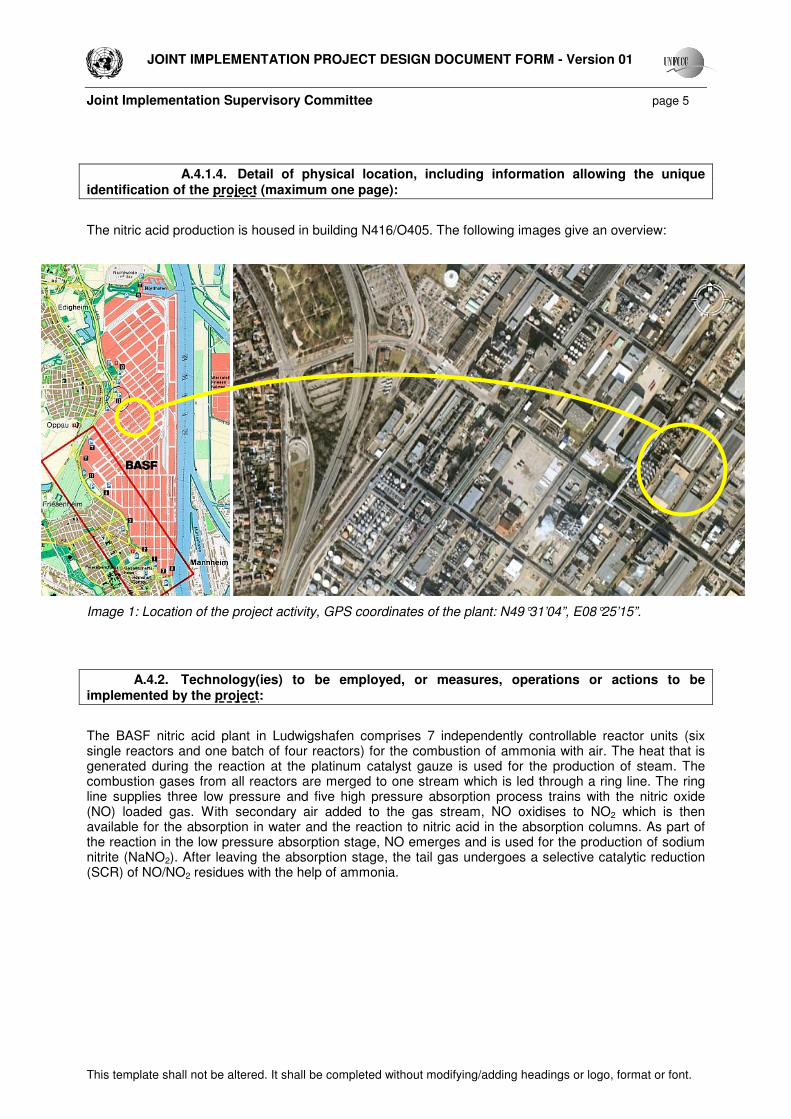
A.4.2. Technology(ies) to be employed, or measures, operations or actions to be implemented by the project:
The BASF nitric acid plant in Ludwigshafen comprises 7 independently controllable reactor units (six single reactors and one batch of four reactors) for the combustion of ammonia with air. The heat that is generated during the reaction at the platinum catalyst gauze is used for the production of steam. The combustion gases from all reactors are merged to one stream which is led through a ring line. The ring line supplies three low pressure and five high pressure absorption process trains with the nitric oxide (NO) loaded gas. With secondary air added to the gas stream, NO oxidises to NO2 which is then available for the absorption in water and the reaction to nitric acid in the absorption columns. As part of the reaction in the low pressure absorption stage, NO emerges and is used for the production of sodium nitrite (NaNO2). After leaving the absorption stage, the tail gas undergoes a selective catalytic reduction (SCR) of NO/NO2 residues with the help of ammonia.

JOINT IMPLEMENTATION PROJECT DESIGN DOCUMENT FORM - Version 01
Joint Implementation Supervisory Committee page 6
This template shall not be altered. It shall be completed without modifying/adding headings or logo, format or font.
Figure 1: Plan of the nitric acid plant
All measurements of volume flow and concentration take place downstream of the DeNOx facility, where the tail gas pressure is ca. 6 barg. The tail gas passes expander turbines and is vented to the atmosphere through five stacks.
The plant operates continuously. The platinum catalysts in the oxidation reactors are replaced every 12 to 15 months. When a catalyst shall be replaced, the accordant reactor is halted for some days. The replacement downtimes of the reactors are distributed over the year, so that nitric acid production is independent from the single reactor maintenance procedures and nitric acid demand can always be satisfied.
Nitrous oxide (N2O) generation during the production of nitric acid is an unavoidable side reaction of the ammonia oxidation. Nitrogen oxidation steps under overall reducing conditions are considered to be potential sources of N2O.2 Reactions that lead to the formation of N2O are undesirable in that they decrease the conversion efficiency of NH3 and reduce the yield of the desired product, NO. Thus, it is in the interest of the nitric acid producer to optimise the operating conditions in a way that as little N2O as possible is formed at the platinum gauze. The unavoidable amounts of N2O are typically vented to the atmosphere together with the waste gas stream.
The proposed project activity comprises secondary N2O abatement by installing baskets inside each oxidation reactor and charge them with DeN2O catalyst right below the platinum gauze in the high temperature zone of the reactor (between 870 and 930 °C). With the help of the DeN2O catalyst, which is produced and under patent by BASF (Type O3-85, O3-86), N2O load in the combustion gas can be reduced from some 700 – 900 ppm to under 400 ppm, depending on technical conditions.
2 See 2006 IPCC Guidelines for National Greenhouse Gas Inventories, p. 3.19.
Air
stackDeNOx
Air
stackDeNOx
7,5 barg
0,5 barg.
Air
stackDeNOx
7,5 barg.
Air
stack
high pressureabsorption DeNOx
7,5 barg.
Air
Q
DeNOx
7,5 barg.
DeN2O
Qadipic acid off gas
1/3
2/3
stack
Air
DeNOx
7,5 barg.
12,5%
87,5%
FIR
high pressureabsorption
high pressureabsorption
high pressureabsorption
high pressureabsorption
low pressureabsorption
Mixer
Ammonia Oxidation Reactors S1 - S10
S1
S2
S7 S8
S9 S10
S3
S4
S5
S6
NH3
Air
NOx ring line
DK 1
DK 2
DK 3
DK 4
DK 5
NDAir
stackDeNOx
Air
stackDeNOx
7,5 barg
0,5 barg.
Air
stackDeNOx
7,5 barg.
Air
stack
high pressureabsorption DeNOx
7,5 barg.
Air
Q
DeNOx
7,5 barg.
DeN2O
Qadipic acid off gas
1/3
2/3
stack
Air
DeNOx
7,5 barg.
12,5%
87,5%
FIR
high pressureabsorption
high pressureabsorption
high pressureabsorption
high pressureabsorption
low pressureabsorption
Mixer
Ammonia Oxidation Reactors S1 - S10
S1
S2
S7 S8
S9 S10
S3
S4
S5
S6
NH3
Air
NOx ring line
DK 1
DK 2
DK 3
DK 4
DK 5
ND
JOINT IMPLEMENTATION PROJECT DESIGN DOCUMENT FORM - Version 01
Joint Implementation Supervisory Committee page 7
This template shall not be altered. It shall be completed without modifying/adding headings or logo, format or font.
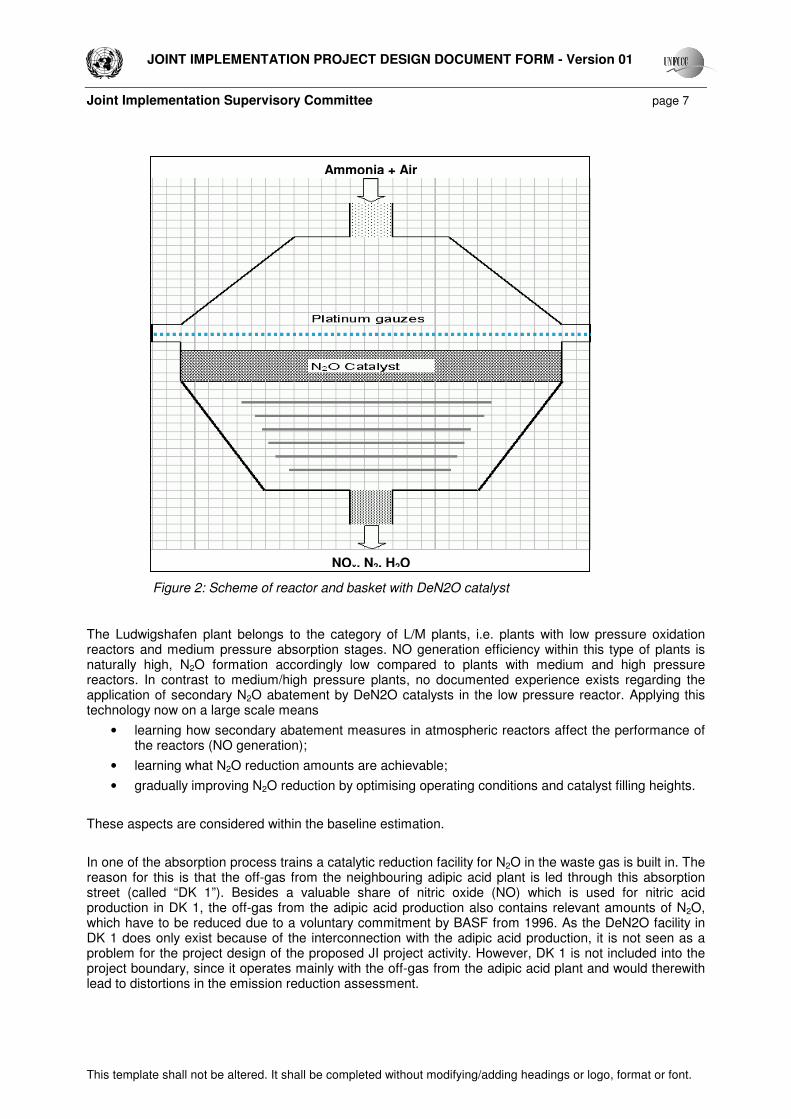
Figure 2: Scheme of reactor and basket with DeN2O catalyst
The Ludwigshafen plant belongs to the category of L/M plants, i.e. plants with low pressure oxidation reactors and medium pressure absorption stages. NO generation efficiency within this type of plants is naturally high, N2O formation accordingly low compared to plants with medium and high pressure reactors. In contrast to medium/high pressure plants, no documented experience exists regarding the application of secondary N2O abatement by DeN2O catalysts in the low pressure reactor. Applying this technology now on a large scale means
• learning how secondary abatement measures in atmospheric reactors affect the performance of the reactors (NO generation);
• learning what N2O reduction amounts are achievable;
• gradually improving N2O reduction by optimising operating conditions and catalyst filling heights.
These aspects are considered within the baseline estimation.
In one of the absorption process trains a catalytic reduction facility for N2O in the waste gas is built in. The reason for this is that the off-gas from the neighbouring adipic acid plant is led through this absorption street (called “DK 1”). Besides a valuable share of nitric oxide (NO) which is used for nitric acid production in DK 1, the off-gas from the adipic acid production also contains relevant amounts of N2O, which have to be reduced due to a voluntary commitment by BASF from 1996. As the DeN2O facility in DK 1 does only exist because of the interconnection with the adipic acid production, it is not seen as a problem for the project design of the proposed JI project activity. However, DK 1 is not included into the project boundary, since it operates mainly with the off-gas from the adipic acid plant and would therewith lead to distortions in the emission reduction assessment.
Ammonia + Air
NOx, N2, H2O

JOINT IMPLEMENTATION PROJECT DESIGN DOCUMENT FORM - Version 01
Joint Implementation Supervisory Committee page 8
This template shall not be altered. It shall be completed without modifying/adding headings or logo, format or font.
A.4.3. Brief explanation of how the anthropogenic emissions of greenhouse gases by sources are to be reduced by the proposed JI project, including why the emission reductions would not occur in the absence of the proposed project, taking into account national and/or sectoral policies and circumstances:
In the absence of the proposed JI project, emission reductions would not occur, because
• no mandatory applicable legal and regulatory requirements to reduce nitrous oxide (N2O) from nitric acid production plants do presently exist in Germany;
• N2O reduction is not common practice at nitric acid plants in Germany and Europe;
• no best available technology reference emission levels are provided by IPPC for atmospheric plants;
• large scale secondary N2O abatement at atmospheric plants is first of its kind in Germany and Europe and thus faces technical barriers and uncertainties;
• relevant uncertainties accrue from a potential loss of production capacity in the atmospheric plant;
• N2O reduction measures require high investments and do not lead to any financial income or economic benefit.
With these reasons, described in more detail below, the continuation of the current situation is the most plausible scenario. Only the income from a JI project may help to finance the investment into climate friendly N2O reduction measures.
A.4.3.1. Estimated amount of emission reductions over the crediting period:
The crediting period shall begin with the installation of the first basket with DeN2O catalyst and availability of the monitoring equipment. The timing depends on two matters:
• The receipt of a letter of approval by the German authority, as this serves as basis for the decision to provide the project budget and order the technical equipment (baskets, catalyst, monitoring system);
• the lead times for the supply of the technical equipment.
With these dependencies, the JI project will start in May 2008 at the earliest.
In compliance with the rules provided by paragraph 5 (3) ProMechG, the crediting period lasts until 31 December 2012. In case future regulations provide for the continuation of the JI project beyond 2012, a prolongation will be considered.
The following table shows the estimated emission reductions for the crediting period (derived in section E.)

JOINT IMPLEMENTATION PROJECT DESIGN DOCUMENT FORM - Version 01
Joint Implementation Supervisory Committee page 9
This template shall not be altered. It shall be completed without modifying/adding headings or logo, format or font.
Years
Length of crediting period 5
Year Estimate of annual emission reductions in tons of CO2e
2008 241,800
2009 483,600
2010 475,540
2011 120,900
2012 120,950
Total estimated reductions [tCO2e]
1,442,740
Annual average of estimated emission reductions [tCO2e]
288,548
A.5. Project approval by the Parties involved:
The German Focal Point issued a letter of endorsement on 1 November 2007 on the basis of a project idea note. With the PDD at hand and the validation report from the AIE, the project approval will be applied at the German Focal Point (German Emissions Trading Authority).

JOINT IMPLEMENTATION PROJECT DESIGN DOCUMENT FORM - Version 01
Joint Implementation Supervisory Committee page 10
This template shall not be altered. It shall be completed without modifying/adding headings or logo, format or font.
SECTION B. Baseline
B.1. Description and justification of the baseline chosen:
The Baseline Scenario is the continuation of the existing situation, as neither a financial incentive nor a legal obligation exist so far that would justify the considerable investment into N2O abatement measures.
This chapter describes the approach chosen to determine the baseline.
The legal framework for baseline setting consists of the following elements:
German Project Mechanisms Act (ProMechG)
§ 5 sets the rules for JI projects in Germany
Appendix B to the annex to decision 9/CMP.1 (JI Guidelines)
sets criteria for baseline setting and monitoring
Guidance on Criteria for Baseline Setting and Monitoring (JISC Guidance)
published by the JI Supervisory Committee (JISC) at its fourth meeting
The JISC Guidance, in accordance with decision 10/CMP.1, offers two basic options for the establishment of a baseline:
1. Using an approved CDM baseline methodology;
2. Establishing a project specific baseline that is in accordance with Appendix B of the JI Guidelines with the option of using selected elements or combinations of approved CDM methodologies or tools, as appropriate.
The UNFCCC provides an approved CDM methodology AM0034 “Catalytic reduction of N2O inside the ammonia burner of nitric acid plants”, that fits to the measures of the project at hand. However, it is not directly applicable because of various reasons. In the following, the AM0034 shall be briefly analysed by dividing it into its relevant elements and demonstrating which elements will be applied for the baseline setting and which not.
Discussion of AM0034 elements
The specifications of the AM0034 methodology are to a large extent based on the assumption that the nitric acid plant operates on discrete production runs, the campaigns. As described above, this is not the case at the plant in Ludwigshafen. The plant operates continuously, with a cluster of ten oxidation reactors together feeding a batch of absorption columns. The shutdowns of the single oxidation reactors for the replacement of the primary catalyst gauzes are distributed over the year, so that the effect of the shutdown times on the overall production as well as the effect of the catalyst replacement on the N2O fraction in the tail gas is hardly noticeable. Primary catalyst gauzes are replaced every 12 to 15 months, i.e. relating to the entire plant a catalyst replacement takes place almost every one and a half months. With this plant layout, all the campaign specific rules of AM0034 have to be adjusted.
refers to
is taken up within the

JOINT IMPLEMENTATION PROJECT DESIGN DOCUMENT FORM - Version 01
Joint Implementation Supervisory Committee page 11
This template shall not be altered. It shall be completed without modifying/adding headings or logo, format or font.
The following table names the accordant elements of AM0034 and briefly refers to their applicability for the proposed project.
Elements: General Element applied
Applicability criteria
All applicability criteria are fulfilled except for two: no baseline campaign is provided and there is a N2O abatement technology currently installed at DK 1. Both aspects are described in the text. The AM0034 criteria do not oppose to the proposed project design.
adjusted
Project boundary
The definition of the project boundary is consistent with AM0034, whereas one of the absorption process trains is permanently excluded, one temporarily, see B.3.
yes
Elements: Baseline & Additionality Element applied
Baseline determination throughout one baseline campaign
Defining one baseline campaign is not possible, due to the continuous production in Ludwigshafen. The baseline emissions are determined by concrete measurements before project start. The Baseline approach is described in B.1.
adjusted
Identification of baseline scenario according to AM0028
While focussing on the baseline criteria formulated in the JI Guidelines and JISC Guidance, the steps to identify the baseline scenario in AM0028 are taken into account.
adjusted
Application of the additionality tool
The official additionality tool will be applied, as this is not only required by AM0034, but also wanted by the German authority. Further information is presented in B.2.
yes
Determination of permitted range of operation parameters
This element provides for the determination of a permitted range of parameters which may impact the formation of N2O in a way that possible modifications to increase N2O generation for the baseline setting is avoided. The application of this element is adjusted due to limited availability of historic data (see B.1).
adjusted
Statistical analysis of baseline emission data
A statistical procedure to eliminate volume flow and N2O concentration data lying outside a 95% confidence interval makes sense in case of large data series. The applied baseline approach consists of a limited number of measured data. Alternative measures to ensure conservativeness apply.
no

JOINT IMPLEMENTATION PROJECT DESIGN DOCUMENT FORM - Version 01
Joint Implementation Supervisory Committee page 12
This template shall not be altered. It shall be completed without modifying/adding headings or logo, format or font.
Cap on baseline campaign length
The AM0034 baseline campaign length shall not exceed the average historic campaign length in order to prevent the increase of the baseline emission factor (as N2O formation is higher at the end of a campaign because of declining catalyst efficiency). As the Ludwigshafen plant does not operate on campaigns and baseline determination will not orient towards a campaign, this element is not applicable.
no
Deduction of measurement uncertainty from baseline emission factor
The uncertainty of monitoring equipment is considered in the baseline emission factor calculation in order to take a conservative approach.
yes
Recalculation of baseline EF in case of shorter project campaign
This rule does only make sense in combination with the emission factor being determined on the basis of one entire campaign (the baseline campaign). As for the proposed project no comparison of project and baseline campaign length is possible, this rule is not applicable.
no
Impact of regulations
The baseline emission factor shall be adjusted as soon as new regulations set limits on N2O emissions from nitric acid plants. This is expected to be the case in the end of 2010, when the German TA-Luft pledges German nitric acid plants to limit mass concentration of N2O in the tail gas to 0.80 g/m³ (equivalent to 2.5 kgN2O/tHNO3).
yes
Elements: Project Emissions Element applied
Project emissions campaign specific
Since the plant does not operate on campaigns, monitoring periods will be defined.
adjusted
Statistical analysis of project emissions
Since a continuous monitoring system will be installed, statistical analysis can be applied. However, the approach is adjusted to consider periods where the same number of DeN2O catalysts are installed.
adjusted
Moving average emission factor
Applying the average emission factor of the previous campaigns in case the actual emission factor of the specific campaign is higher shall ensure a conservative approach and account for possible long-term emission trends. This element shall not be applied for the project at hand. Firstly, this rule is based on the existence of naturally definable periods, the campaigns, which do not exist at the Ludwigshafen plant. Furthermore, this rule lowers the incentive to increase the efficiency of N2O abatement with the growing experience from its application. The project at hand allows for the stepwise installation of the baskets for the DeN2O catalyst over the first year of the crediting period. At the time of replacement of the catalyst (after ca. two years), the layer height might be optimised. The project emissions shall reflect the real emissions during each period.
no
Minimum project emission factor after ten campaigns
A cap on the project emission factor after ten campaigns shall make allowance for a potential built up of platinum deposits. This element shall not apply for the proposed project because of the same reasons as described under “Moving average emission factor” above and because this effect is considered to be negligible due to the low temperatures in the downstream components of the L/M plant.
no
JOINT IMPLEMENTATION PROJECT DESIGN DOCUMENT FORM - Version 01
Joint Implementation Supervisory Committee page 13
This template shall not be altered. It shall be completed without modifying/adding headings or logo, format or font.
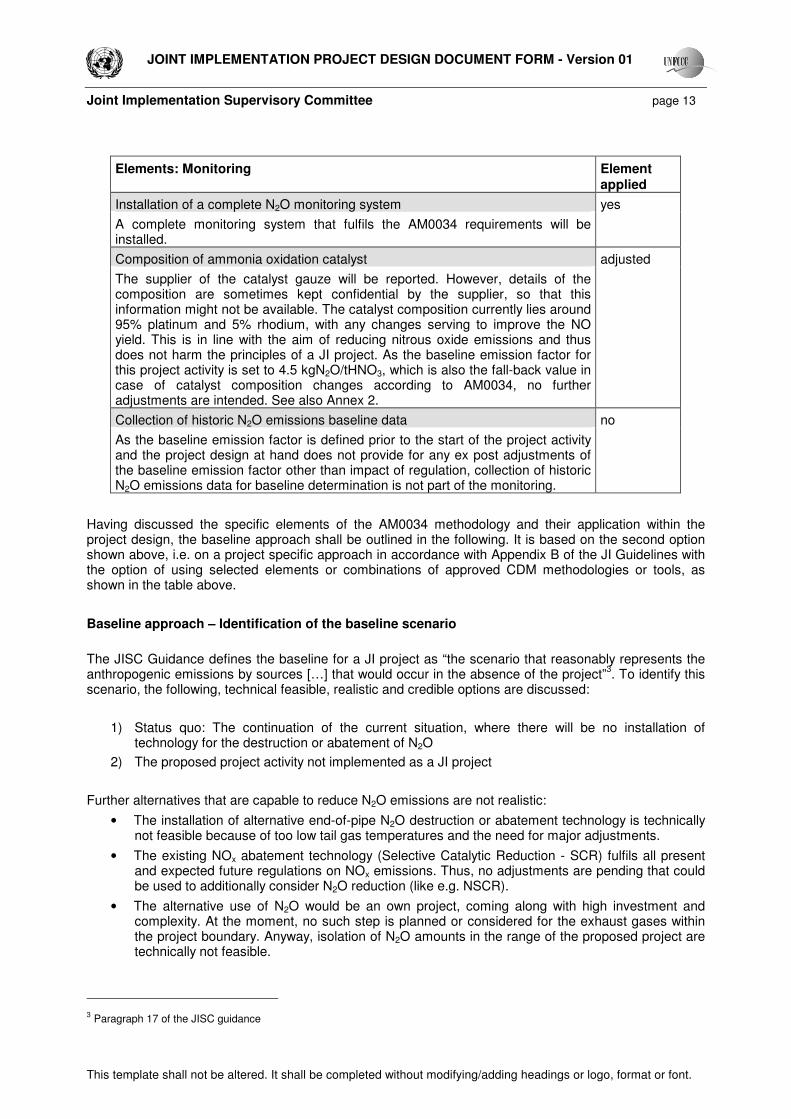
Elements: Monitoring Element applied
Installation of a complete N2O monitoring system
A complete monitoring system that fulfils the AM0034 requirements will be installed.
yes
Composition of ammonia oxidation catalyst
The supplier of the catalyst gauze will be reported. However, details of the composition are sometimes kept confidential by the supplier, so that this information might not be available. The catalyst composition currently lies around 95% platinum and 5% rhodium, with any changes serving to improve the NO yield. This is in line with the aim of reducing nitrous oxide emissions and thus does not harm the principles of a JI project. As the baseline emission factor for this project activity is set to 4.5 kgN2O/tHNO3, which is also the fall-back value in case of catalyst composition changes according to AM0034, no further adjustments are intended. See also Annex 2.
adjusted
Collection of historic N2O emissions baseline data
As the baseline emission factor is defined prior to the start of the project activity and the project design at hand does not provide for any ex post adjustments of the baseline emission factor other than impact of regulation, collection of historic N2O emissions data for baseline determination is not part of the monitoring.
no
Having discussed the specific elements of the AM0034 methodology and their application within the project design, the baseline approach shall be outlined in the following. It is based on the second option shown above, i.e. on a project specific approach in accordance with Appendix B of the JI Guidelines with the option of using selected elements or combinations of approved CDM methodologies or tools, as shown in the table above.
Baseline approach – Identification of the baseline scenario
The JISC Guidance defines the baseline for a JI project as “the scenario that reasonably represents the anthropogenic emissions by sources […] that would occur in the absence of the project”3. To identify this scenario, the following, technical feasible, realistic and credible options are discussed:
1) Status quo: The continuation of the current situation, where there will be no installation of technology for the destruction or abatement of N2O
2) The proposed project activity not implemented as a JI project
Further alternatives that are capable to reduce N2O emissions are not realistic:
• The installation of alternative end-of-pipe N2O destruction or abatement technology is technically not feasible because of too low tail gas temperatures and the need for major adjustments.
• The existing NOx abatement technology (Selective Catalytic Reduction - SCR) fulfils all present and expected future regulations on NOx emissions. Thus, no adjustments are pending that could be used to additionally consider N2O reduction (like e.g. NSCR).
• The alternative use of N2O would be an own project, coming along with high investment and complexity. At the moment, no such step is planned or considered for the exhaust gases within the project boundary. Anyway, isolation of N2O amounts in the range of the proposed project are technically not feasible.
3 Paragraph 17 of the JISC guidance

JOINT IMPLEMENTATION PROJECT DESIGN DOCUMENT FORM - Version 01
Joint Implementation Supervisory Committee page 14
This template shall not be altered. It shall be completed without modifying/adding headings or logo, format or font.
The current situation is in compliance with all applicable legal and regulatory requirements. The plant permission refers to the thresholds specified by German law (BImSchG in connection with TA Luft) regarding allowed NOx emissions in the waste gas. Until now, no such limits exist for N2O emissions. This is going to change in the year 2010. The current version of TA Luft requires existing nitric acid plants to limit N2O concentration in the waste gas to a threshold of 0.80 g/m³ from end of 2010 on. In the case of the nitric acid plant in Ludwigshafen, this requirement is substantiated and documented in an amendment to the plant permission. It states that N2O concentration in the waste gas shall not exceed 0.80 g/m³ from 30 October 2010 on4. With this date, the baseline emission factor will be adjusted in a way that it does not exceed the new threshold value. Thus, both baseline scenario alternatives are in compliance with mandatory laws and regulations. Also from the perspective of dynamic obligations for operators by German legislation, no thresholds can presently be identified. The LVIC BREF, which contains recommendations for best available technology emission levels for different types of nitric acid plants, leaves out a value for low pressure plants5.
While the continuation of the current situation does not face any barriers, the installation of the secondary N2O reduction technology would come with some relevant uncertainties:
• So far there is no experience with the large-scale application of this technology in low pressure plants. Achievable N2O reduction levels and possible impacts on production levels have to be observed and optimised within the first years of the project.
• Especially in the atmospheric reactors in Ludwigshafen the possibility of slightly reduced capacity due to the additional catalyst layer has to be taken into account. This would have to be compensated by the installation of a compressor into the input air stream – meaning additional investments and complexity.
• As far as known, the planned large-scale installation of DeN2O catalyst in atmospheric reactors is first of its kind not only in Germany, but also in Europe. There is no documented experience with this combination, what is confirmed by the lacking BAT value.
Besides these differences between the two scenarios regarding technological barriers and barriers due to prevailing practice, the economical difference turns out to be the most important one. While the continuation of the current situation does not lead to any additional costs or investments compared to the business as usual, the gradual installation of baskets and placement of catalyst fillings means a relevant investment that is expected to exceed three and a half million Euro.
Even with the view to the upcoming necessity to fulfil the legal requirements from October 2010 on, relevant costs accrue in connection with tied up capital and additional catalyst fillings, that have to be replaced approximately every two years.
Since both scenarios do not lead to any financial benefits, the continuation of the current situation is the most plausible scenario.
With this analysis, the following conclusion can be drawn: Scenario 1, the continuation of the current situation, is the most plausible scenario,
• as it is in compliance with all mandatory applicable legal and regulatory requirements,
• does not face any prohibitive barriers
• and is the economically most attractive scenario.
Scenario 1, the continuation of the current situation, is the baseline scenario until October 2010. From October 2010 on, the baseline will be represented by an adapted N2O emission level according to the limits set by German law and the plant permission. In chapter B.2, the baseline scenario will be assessed with the help of the additionality tool.
4 Order by the regional regulatory authority (Struktur- und Genehmigungsdirektion Süd), Neustadt a.d. Weinstraße, 21 June 2004 5 Reference Document on Best Available Technologies for the Manufacture of Large Volume Inorganic Chemicals, European Commission, December 2006, Table 3.14.

JOINT IMPLEMENTATION PROJECT DESIGN DOCUMENT FORM - Version 01
Joint Implementation Supervisory Committee page 15
This template shall not be altered. It shall be completed without modifying/adding headings or logo, format or font.
Baseline Approach – Baseline Emissions
The baseline emission scenario is established by three dedicated measurement series of N2O concentration and gas volume flow in the tail gas of the absorption columns between June and August 2007. Together with the registration of the simultaneous daily nitric acid production this serves to calculate the baseline emission factor. The operating conditions during the day of the measurements are kept constant and lie within the customary, plant specific range.
The following aspects justify the significance and accuracy of this approach:
• The plant layout and operation mode determine a very narrow range of operation parameters where nitric acid production takes place. The main parameter, the ammonia/air ratio, is automatically controlled and stays virtually constant. Oxidation temperature and pressure are dependent on the ammonia/air ratio and thus do accordingly move within very narrow ranges. Representative historical operation parameters are not available, as they were not regularly recorded.
• Besides the constant operation parameters, the distribution of primary catalyst replacements favour representative results also of a limited amount of measurements. The fact that a catalyst replacement takes place around every one and a half months leads to quite constant tail gas characteristics. There is no effect like in plants that run on campaigns, where N2O fractions in the waste gas follow a steadily growing path from the beginning to the end of one campaign. The regular replacement of catalysts leads to an equalisation of this effect. The baseline measurements were carried out in a way that two catalyst replacements took place between them, so that the effects on N2O emissions are reflected in the results and conservativeness is assured.
• The plant layout itself favours the equalisation of any effects emanating from the oxidation reactors, as the tail gas streams from all reactors are merged to one NOx stream that is then again dispersed to the absorption process trains. With this, any possible effects of catalyst replacements on N2O content in the waste gas stream are not only smoothed but also hardly measurable or even assignable to a specific cause by measurements in the tail gas of the absorption columns.
• The German national inventory report states, referring to the IPCC requirements, that it is seen as good practice to determine plant specific emission factors by conducting regular measurements at different times to avoid systematic errors.6 Measurements shall be carried out at the time when changes in the process occur that affect N2O generation. These recommendations are followed with the proposed approach.
An expert opinion, furnished for the Ludwigshafen plant by Prof. Rotard (Chair of Environmental Chemistry, Technical University of Berlin) confirms that this limited set of measurements is adequate to reflect the normal N2O emission characteristics of the plant7.
N2O concentration and gas volume flow were monitored during three days between June and August 2007. The measurements were carried out by an independent, certified company applying calibrated instruments. The average mass of N2O emissions per hour is calculated as product of N2O concentration and gas volume flow rate. The N2O emissions per measurement period are calculated by multiplying N2O emissions per hour with the total number of hours of the measurement period using the following equation:
mmmm OHNCSGVSGBE ×××=−310 Formula 1
6 National Inventory Report 2007 to the UNFCCC, April 2007 (German version), p. 511 7 See Expert opinion, W. Rotard, January 2008
JOINT IMPLEMENTATION PROJECT DESIGN DOCUMENT FORM - Version 01
Joint Implementation Supervisory Committee page 16
This template shall not be altered. It shall be completed without modifying/adding headings or logo, format or font.
where:
BEm Total N2O emissions during the measurement period m (kgN2O)
VSGm Mean gas volume flow rate at the stack in the baseline measurement period (m³/h)
NCSGm Mean concentration of N2O in the stack gas during the baseline measurement period (gN2O/m³)
OHm Operating hours of a baseline measurement day (h)
The plant specific baseline emission factor representing the average N2O emissions per tonne of nitric acid over the baseline measurement period is derived by dividing the total mass of N2O emissions by the total output of 100% concentrated nitric acid for that period. The overall uncertainty of the monitoring system is determined and the measurement error is expressed as a percentage. The N2O emission factor per tonne of nitric acid produced in the baseline period is then reduced by the estimated percentage error as follows:
)100/1()/( UNCNAPBEEF mmBL −×= Formula 2
where:
EFBL Baseline N2O emission factor (kgN2O/tHNO3)
NAPm Nitric acid production during the baseline period (tHNO3)
UNC Overall uncertainty of the monitoring system (%), calculated as the combined uncertainty of the applied monitoring equipment
The baseline measurements and the derivation of the average emission factor are described in Annex 2.
The three measurements, after subtraction of measurement uncertainties, result in an average emission factor of 4.8 kgN2O/tHNO3.
This value does already lie below commonly used emission factors for this sector:
• The IPCC provides a default emission factor of 5 kgN2O/tHNO3 for atmospheric plants8 with an uncertainty range of 10 percent, leading to the conservative default value of 4.5 kgN2O/tHNO3 for the nitric acid industry.
• The German Federal Environment Agency applies an emission factor of 5.5 kgN2O/tHNO3 for the national inventory9.
To ensure conservativeness and to compensate for the limited set of measurements and the disclaimer of AM0034 elements (baseline campaign, statistical analysis of a large set of baseline measurements), the conservative IPCC default emission factor for N2O from nitric acid plants which have not installed N2O destruction measures, 4.5 kgN2O/tHNO3, shall apply for the proposed JI project. With this, the lowest and most conservative value for a N2O emission factor in the nitric acid industry, which is only used as fallback approach by AM0034 in case of lacking data, serves as baseline for the N2O project in Ludwigshafen. This factor does also serve as fall-back value according to AM0034 in case of changes of the ammonia catalyst composition.
8 See 2006 Guidelines for National Greenhouse Gas Inventories, Table 3.3 9 See National Inventory Report 2007 to the UNFCCC, April 2007 (German version), p. 262
JOINT IMPLEMENTATION PROJECT DESIGN DOCUMENT FORM - Version 01
Joint Implementation Supervisory Committee page 17
This template shall not be altered. It shall be completed without modifying/adding headings or logo, format or font.
There are no methodical elements envisaged that allow for the adjustment of the baseline emission factor after project start besides the impact of new regulation. This waiving of accordant elements of AM0034 (like recalculation of baseline emission factor in case of shorter project campaigns, see table above) seems to be justified not only because of the operation mode and layout of the plant (no campaigns), but also because of the short time frame where the derived baseline emission factor will be applied (until October 2010). The presented baseline emission factor reflects the conservative business as usual scenario until new regulatory limits apply.
Normal operating conditions
AM0034 provides for an approach to determine a set of permitted operating conditions in order to avoid the possibility that baseline emissions are overestimated by modification of the production characteristics. The determination concerns
• oxidation temperature,
• oxidation pressure,
• ammonia gas flow rate and
• ammonia to air ratio.
The preferred approach by AM0034 to determine the normal range for those parameters, a statistical analysis of historical data, cannot be followed here due to lacking data series. The following table shows why all parameters lay within the normal range during the baseline measurements.
Oxidation temperature
The oxidation temperature is directly dependent on the ammonia to air ratio and is sporadically recorded. With the help of shift protocols it can be shown that oxidation temperatures vary within a certain range of 40 to 100 °C around an average temperature between 825 and 917 °C at the six single reactors S1 – S6. For the group of the four reactors (S7 – S10) no historic temperatures are available, however, they are usually somewhat higher than in S1 – S6. The oxidation temperature on the baseline measurement days was recorded and lay within the normal range and mostly exceeded the historic average. This represents a conservative approach, as higher temperatures tend to result in lower N2O emissions. However, the measurement results do also show that the temperature is not fully controllable: the temperatures vary between the different reactors (which are identical in construction), although they are fed with the same ammonia-air-mixture.
Oxidation pressure
Oxidation pressure does not change, since the fan at the ammonia/air mixer of the atmospheric plant is technically only capable of adding up to 100 to 120 mbar to the input gas stream to hold up the gas transport to the reactors. The pressure is not adjustable and is not recorded.
Ammonia gas flow rate
The ammonia gas flow rate was 496.6 t/d, 488.0 t/d and 486.6 t/d (expressed as nitrogen) on the three measurement days. This is far from the maximum ammonia gas flow rate. The August 2007 data show that daily ammonia gas flow rates do regularly lie within 480 to 520 tonnes, tending to the upper range.
Ammonia to air ratio
The ammonia to air ratio at the plant in Ludwigshafen is automatically controlled and does steadily move within a narrow range (12.2 to 12.5%) in order to compensate for changes in air humidity. The ammonia to air ratio is continuously measured but not recorded, historic data are not available. The ammonia to air ratio is technically limited to maximum 12.5%.
The description of these parameters shows that the operating conditions were not actively modified in a way that increases N2O generation during the baseline measurements, but rather lay in a range where conservative N2O values were achieved.

JOINT IMPLEMENTATION PROJECT DESIGN DOCUMENT FORM - Version 01
Joint Implementation Supervisory Committee page 18
This template shall not be altered. It shall be completed without modifying/adding headings or logo, format or font.
With the use of the conservative default emission factor of 4.5 kg N2O/tHNO3 instead of the actual calculated 4.9 (without uncertainty), any further non-conservative modifications during the baseline measurements with influence on the future emission reduction calculations are ruled out.
Impact of regulations
From 30 October 2010 on German regulation pledges the nitric acid plant in Ludwigshafen to limit the concentration of nitrous oxide in the tail gas to a maximum of 0.80 g/m³. As the baseline emission factor for the ex-post estimation of baseline emissions is expressed as kg N2O per ton of nitric acid produced, the legal threshold value has to be transferred to this unit. This is done according to the empirical correlation between specific N2O emission levels and N2O concentrations in tail gases presented in the LVIC BREF:
Figure 3: Empirical correlation between specific N2O emission levels and N2O concentration in tail gases
10
The concentration of 0.80 g/m³ equals the value of approximately 407 ppm (vol). According to the above shown diagram this corresponds to specific emissions of 2.5 kgN2O/tHNO3. From 30 October 2010 on, this value shall replace the till then applied baseline emission factor.
No other regulations concerning N2O abatement are currently expected. However, regulatory changes are subject to monitoring and will – when passed and applicable – lead to an adjustment of the applied baseline emission factor. New regulations on the national and European level will be evaluated with respect to their applicability for the Ludwigshafen plant.
10 Taken from BREF for Large Volume Inorganic Chemicals, European Commission, December 2006, p. 102.
JOINT IMPLEMENTATION PROJECT DESIGN DOCUMENT FORM - Version 01
Joint Implementation Supervisory Committee page 19
This template shall not be altered. It shall be completed without modifying/adding headings or logo, format or font.
B.2. Description of how the anthropogenic emissions of greenhouse gases by sources are reduced below those that would have occurred in the absence of the JI project:
For the demonstration of additionality, AM0034 refers to the latest version of the “Tool for demonstration and assessment of additionality” agreed by the Executive Board. This is also recommended as first option by the JISC guidance as well as by the German authority.
As the above presented baseline determination follows an identical approach to the latest version of the additionality tool11, the results from its application shall be briefly summarised here.
Step 1. Identification of alternatives to the project activity consistent with current laws and regulations
Sub-step 1a. Alternatives to the project activity:
The only realistic and credible alternatives available to BASF are:
1) Status quo: The continuation of the current situation, where there will be no installation of technology for the destruction or abatement of N2O
2) The proposed project activity not implemented as a JI project
Sub-step 1b. Consistency with mandatory laws and regulations:
Both alternatives are in compliance with all current mandatory applicable legal and regulatory requirements.
Step 2. Investment analysis
Sub-step 2a. Appropriate analysis method
As the project activity doesn’t generate any financial or economic benefit other than JI related income, simple cost analysis is applied.
Sub-step 2b. Simple cost analysis
The costs for the proposed project activity consist of the investment needed for the installation of the baskets and the repeating costs for the catalyst fillings (the catalyst has to be replaced around every two years). The investment amounts to some 3.7 million Euro. The N2O abatement does not lead to any economic benefits other than JI related income.
Step 4. Common practice analysis
It is difficult to make a statement concerning the application of N2O abatement technologies in other plants in Germany and Europe, as information about the production practices is hardly accessible in the chemical industry. The LVIC BREF helps to get a rough overview regarding common practice N2O emission levels at single plants in Europe. No case is stated where a low pressure plant is equipped with
11 Version 04, adopted by EB 36, see: http://cdm.unfccc.int/methodologies/PAmethodologies/AdditionalityTools/Additionality_tool.pdf (accessed in December 2007)

JOINT IMPLEMENTATION PROJECT DESIGN DOCUMENT FORM - Version 01
Joint Implementation Supervisory Committee page 20
This template shall not be altered. It shall be completed without modifying/adding headings or logo, format or font.
a N2O abatement system or a NSCR for NOx12. Also for other plant technologies, N2O abatement
measures are not common. This is also confirmed by the German national inventory report, where six nitric acid plants are mentioned, but no N2O abatement systems.13 A reference to its first-of-its-kind character is also given in chapter B.1 above.
The stepwise approach shows that the emission reductions are additional to what would occur in the absence of a JI project.
B.3. Description of how the definition of the project boundary is applied to the project:
The project boundary comprises the whole nitric acid plant from the inlet to the oxidation reactors to the stacks, except for “DK 1”, the process train which is mainly fed by the neighbouring adipic acid plant. The nitric acid production of DK 1 is almost completely attributable to the adipic acid plant and shall therefore be excluded from the baseline calculations. The accordant amounts of N2O that come from the nitric acid plant ring line and run through DK 1 are minimal and are neither part of the baseline emission factor calculation nor part of the ex-post baseline emissions calculations nor part of the project emissions and thus do not distort the calculation of emission reductions.
The following figure illustrates the part of the plant which lies within the project boundaries.
Figure 4: Project boundaries
12 See BREF document for LVIC, European Commission, 2006, tables 3.7 and 3.8 13 See German Inventory Report for UNFCCC, April 2007, chapter 4.2.2 and 14.2.2.1.1
JOINT IMPLEMENTATION PROJECT DESIGN DOCUMENT FORM - Version 01
Joint Implementation Supervisory Committee page 21
This template shall not be altered. It shall be completed without modifying/adding headings or logo, format or font.
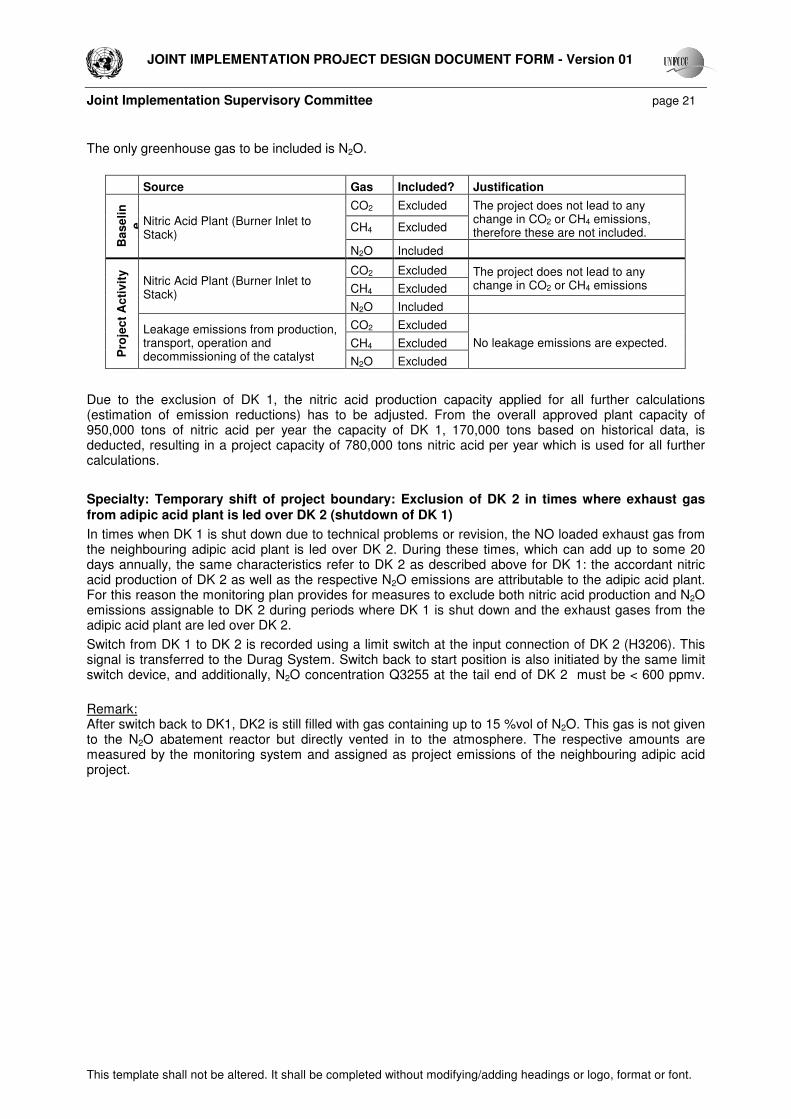
The only greenhouse gas to be included is N2O.
Source Gas Included? Justification
CO2 Excluded
CH4 Excluded
The project does not lead to any change in CO2 or CH4 emissions, therefore these are not included.
Ba
se
lin
e Nitric Acid Plant (Burner Inlet to
Stack) N2O Included
CO2 Excluded
CH4 Excluded The project does not lead to any change in CO2 or CH4 emissions Nitric Acid Plant (Burner Inlet to
Stack) N2O Included
CO2 Excluded
CH4 Excluded
Pro
jec
t A
cti
vit
y
Leakage emissions from production, transport, operation and decommissioning of the catalyst N2O Excluded
No leakage emissions are expected.
Due to the exclusion of DK 1, the nitric acid production capacity applied for all further calculations (estimation of emission reductions) has to be adjusted. From the overall approved plant capacity of 950,000 tons of nitric acid per year the capacity of DK 1, 170,000 tons based on historical data, is deducted, resulting in a project capacity of 780,000 tons nitric acid per year which is used for all further calculations.
Specialty: Temporary shift of project boundary: Exclusion of DK 2 in times where exhaust gas from adipic acid plant is led over DK 2 (shutdown of DK 1)
In times when DK 1 is shut down due to technical problems or revision, the NO loaded exhaust gas from the neighbouring adipic acid plant is led over DK 2. During these times, which can add up to some 20 days annually, the same characteristics refer to DK 2 as described above for DK 1: the accordant nitric acid production of DK 2 as well as the respective N2O emissions are attributable to the adipic acid plant. For this reason the monitoring plan provides for measures to exclude both nitric acid production and N2O emissions assignable to DK 2 during periods where DK 1 is shut down and the exhaust gases from the adipic acid plant are led over DK 2.
Switch from DK 1 to DK 2 is recorded using a limit switch at the input connection of DK 2 (H3206). This signal is transferred to the Durag System. Switch back to start position is also initiated by the same limit switch device, and additionally, N2O concentration Q3255 at the tail end of DK 2 must be < 600 ppmv.
Remark: After switch back to DK1, DK2 is still filled with gas containing up to 15 %vol of N2O. This gas is not given to the N2O abatement reactor but directly vented in to the atmosphere. The respective amounts are measured by the monitoring system and assigned as project emissions of the neighbouring adipic acid project.

JOINT IMPLEMENTATION PROJECT DESIGN DOCUMENT FORM - Version 01
Joint Implementation Supervisory Committee page 22
This template shall not be altered. It shall be completed without modifying/adding headings or logo, format or font.
Air
stackDeNOx
Air
stackDeNOx
7,5 barg.
0,5 barg.NOx-ring line
Air
stackDeNOx
7,5 barg.
Air
stack
high pressureabsorption DeNOx
7,5 barg.
Air
Q
DeNOx
7,5 barg.
Q
adipic acid off gas
stack
AirQ
DeNOx
7,5 barg.
NH3
Air
12,5%
87,5%
FIR
high pressure
absorption
high pressureabsorption
High pressureabsorption
low pressureabsorption
mixer
Ammonia Oxidation Reactors S1 - S10
S1
S2
S7 S8
S9 S10
S3
S4
S5
S6
High pressureabsorption DeN O2
ND
DK5
DK3
DK4
DK1
DK2
H3206limit switch
Q3255
Figure 5: Alternative project boundaries in periods where adipic acid tail gas is led through DK 2

JOINT IMPLEMENTATION PROJECT DESIGN DOCUMENT FORM - Version 01
Joint Implementation Supervisory Committee page 23
This template shall not be altered. It shall be completed without modifying/adding headings or logo, format or font.
B.4. Further baseline information, including the date of baseline setting and the name(s) of the person(s)/entity(ies) setting the baseline:
Date of baseline setting: 21 December 07
The baseline setting was supported and documented by the project consultant:
Felix Nickel
FutureCamp GmbH
Chiemgaustr. 116
81549 München
together with BASF AG.
SECTION C. Duration of the project / crediting period
C.1. Starting date of the project:
The project starts with the installation of the Automated Measuring System (AMS), which is expected to take place in May 2008. The following step is the installation of the first basket and the first catalyst filling, expected for June 2008. The crediting period and the first monitoring period will begin on the first day of normal operation of the first equipped oxidation reactor. The schedule of the start of the project and the crediting period will be described and the according dates named in the first monitoring report.
1 May 2008 is defined as project start.
The baskets and the catalyst will be installed one by one in the ten oxidation reactors at the time of the planned ammonia catalyst replacements. Thus, all oxidation reactors will be equipped with a DeN2O catalyst by the beginning of 2009. The following catalyst replacements are roughly planned:
Oxidation Reactor Catalyst replacement approx. scheduled for
S 4 May 2008
S 3 May 2008
S 6 June 2008
S 1 June 2008
S 2 July 2008
S 5 October 2008
S 7 – S 10 November 2008
Section D.1 presents the different phases of the project with the help of a schematic figure.

JOINT IMPLEMENTATION PROJECT DESIGN DOCUMENT FORM - Version 01
Joint Implementation Supervisory Committee page 24
This template shall not be altered. It shall be completed without modifying/adding headings or logo, format or font.
C.2. Expected operational lifetime of the project:
The project consists of the operation of secondary N2O catalysts within the ten oxidation reactors at the BASF nitric acid plant in Ludwigshafen. The catalyst fillings are expected to be replaced around every two years to maintain the N2O destruction efficiency. The baskets can be replaced in case of any damage. With this, the project has no operational lifetime that depends on the technical characteristics of the equipment. The operational lifetime of the project is linked to the operational lifetime of the nitric acid plant, which is technically not limited.
C.3. Length of the crediting period:
In compliance with the rules provided by paragraph 5 (3) ProMechG, the crediting period lasts until 31 December 2012. As soon as rules for the handling of existing JI projects in Germany after 2012 are published, the prolongation of the crediting period will be initiated.
JOINT IMPLEMENTATION PROJECT DESIGN DOCUMENT FORM - Version 01
Joint Implementation Supervisory Committee page 25
This template shall not be altered. It shall be completed without modifying/adding headings or logo, format or font.
SECTION D. Monitoring plan
D.1. Description of monitoring plan chosen:
According to decision 10/CMP.1, paragraph 4(a), methodologies for monitoring approved by the CDM Executive Board may be applied also for JI projects. As discussed in section B.1., the procedure for the proposed project does basically follow the official methodology AM0034, which contains both a baseline and a monitoring methodology. The AM0034 monitoring methodology shall be applied for the project at hand, taking into consideration the discussion of the AM0034 elements under section B.1.
An automated measuring system (AMS) will be installed using the guidance document EN 14181 and will provide separate readings for N2O concentration and gas flow volume continuously, generating average values for every 60 minutes of operation. Error readings (e.g. downtime or malfunction) and extreme values are automatically eliminated from the output data series by the monitoring system. Besides these two parameters, the temperature and pressure of the stack gas are recorded in the AMS.
Statistical evaluation will be applied to the project data series for N2O concentration and gas flow volume in order to eliminate mavericks from downtime or malfunction of the monitoring system.
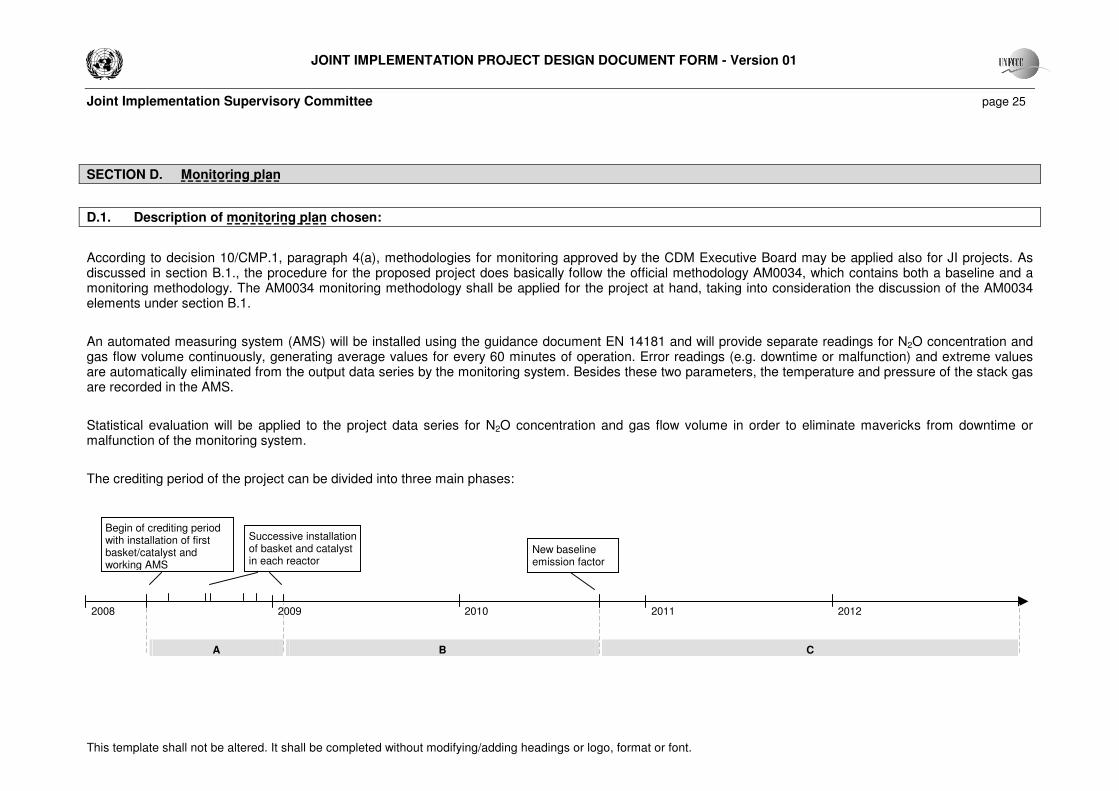
The crediting period of the project can be divided into three main phases:
2008 2009 2010 2011 2012
A B C
Begin of crediting period with installation of first basket/catalyst and working AMS
Successive installation of basket and catalyst in each reactor
New baseline emission factor

JOINT IMPLEMENTATION PROJECT DESIGN DOCUMENT FORM - Version 01
Joint Implementation Supervisory Committee page 26
This template shall not be altered. It shall be completed without modifying/adding headings or logo, format or font.
These phases have the following characteristics:
A
Phase A is characterised by stepwise decreasing specific emissions of N2O due to the successive implementation of the project activity, i.e. the successive installation of baskets and DeN2O catalyst in the oxidation reactors. This shall take place during the planned shutdown times of the single reactors for the replacement of the ammonia catalyst gauze. The approximate schedule for these replacements is shown in C.1. Monitoring in Phase A will consider the periods where the same number of DeN2O catalysts is installed in order not to distort the results of the calculation of the average factors and the statistical analysis. These calculations will be made separately for every period where the same number of DeN2O catalysts is installed.
B
Phase B constitutes the period where all oxidation reactors are equipped with the DeN2O catalyst and the baseline emission factor derived in B.1 is applied. The monitoring periods will last between half a year and one year and are independent from any campaigns, as the plant does operate continuously.
C
Phase C differs from the preceding phase by the application of the new regulatory threshold value for N2O concentration in the tail gas as baseline emission factor. Phase C lasts until 31 December 2012. A prolongation of the crediting period will be attempted in case the then applicable laws and regulation allow for a continuation of a JI project in Germany.
Notwithstanding the specifications of AM0034, the monitoring plan does not include the collection of historic N2O emissions baseline data and accordant parameters prior to the installation of the DeN2O catalyst, as these parameters are fixed and their derivation explained at the time of PDD writing and no ex post adjustments of the baseline emission factor other then impact of regulation do apply. Chapter B.1 describes the derivation of the baseline emission factor.
The following sections describe the parameters which have to be monitored in order to determine project emissions and baseline emissions.
JOINT IMPLEMENTATION PROJECT DESIGN DOCUMENT FORM - Version 01
Joint Implementation Supervisory Committee page 27
This template shall not be altered. It shall be completed without modifying/adding headings or logo, format or font.
D.1.1. Option 1 – Monitoring of the emissions in the project scenario and the baseline scenario:
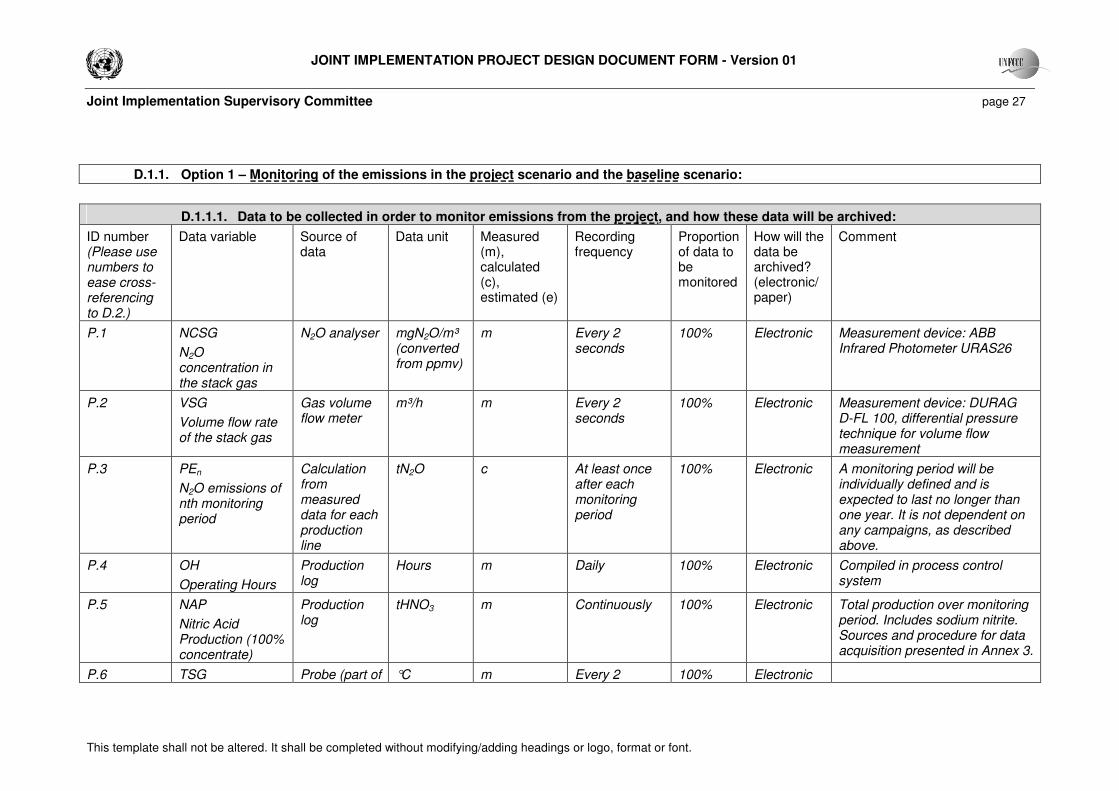
D.1.1.1. Data to be collected in order to monitor emissions from the project, and how these data will be archived:
ID number (Please use numbers to ease cross-referencing to D.2.)
Data variable Source of data
Data unit Measured (m), calculated (c), estimated (e)
Recording frequency
Proportion of data to be monitored
How will the data be archived? (electronic/ paper)
Comment
P.1 NCSG
N2O concentration in the stack gas
N2O analyser mgN2O/m³ (converted from ppmv)
m Every 2 seconds
100% Electronic Measurement device: ABB Infrared Photometer URAS26
P.2 VSG
Volume flow rate of the stack gas
Gas volume flow meter
m³/h m Every 2 seconds
100% Electronic Measurement device: DURAG D-FL 100, differential pressure technique for volume flow measurement
P.3 PEn
N2O emissions of nth monitoring period
Calculation from measured data for each production line
tN2O c At least once after each monitoring period
100% Electronic A monitoring period will be individually defined and is expected to last no longer than one year. It is not dependent on any campaigns, as described above.
P.4 OH
Operating Hours
Production log
Hours m Daily 100% Electronic Compiled in process control system
P.5 NAP
Nitric Acid Production (100% concentrate)
Production log
tHNO3 m Continuously 100% Electronic Total production over monitoring period. Includes sodium nitrite. Sources and procedure for data acquisition presented in Annex 3.
P.6 TSG Probe (part of °C m Every 2 100% Electronic

JOINT IMPLEMENTATION PROJECT DESIGN DOCUMENT FORM - Version 01
Joint Implementation Supervisory Committee page 28
This template shall not be altered. It shall be completed without modifying/adding headings or logo, format or font.
Temperature of stack gas
gas volume flow meter)
seconds
P.7 PSG
Pressure of stack gas
Probe (part of gas volume flow meter)
bar m Every 2 seconds
100% Electronic
P.8 EFn
Emission factor calculated for nth monitoring period
Calculated from measured data
tN2O/tHNO3 c After end of each monitoring period
100% Electronic
P.9 TDK2-ADS
Periods where tail gas of adipic acid plant is led through DK 2
Production log
Date, time m Continuously 100% Electronic Determined by valve position and meter data. Serves for determination of periods where DK 2 is excluded from the project boundaries and the accordant N2O emissions and nitric acid production have to be identified
P.10 DCI
Date and time of installation of a new DeN2O catalyst
Production log
Date, time m At the time of installation of a new DeN2O catalyst
100% Electronic Serves for the determination of periods for which the statistical analysis of concentration (P.1) and gas flow rate (P.2) shall be conducted (see crediting period phases above)
D.1.1.2. Description of formulae used to estimate project emissions (for each gas, source etc.; emissions in units of CO2 equivalent):
Project emissions are determined by calculating the mean values for N2O concentration (P.1) and gas flow (P.2) and multiply those with the number of operating hours (P.4). Statistical analysis will be applied to both N2O concentration (P.1) and gas volume flow (P.2):
a) Calculate the sample mean
b) Calculate the sample standard deviation

JOINT IMPLEMENTATION PROJECT DESIGN DOCUMENT FORM - Version 01
Joint Implementation Supervisory Committee page 29
This template shall not be altered. It shall be completed without modifying/adding headings or logo, format or font.
c) Calculate the 95% confidence interval
d) Eliminate all data that lie outside the 95% confidence interval
e) Calculate the new sample mean from the remaining values
Formula for the calculation of project emissions:
OHNCSGVSGPE kn ×××=−9
, 10 Formula 3
Where:
VSG Mean stack gas volume flow rate for the monitoring period (m³/h)
NCSG Mean concentration of N2O in the stack gas for the monitoring period (mgN2O/m³)
PEn, k Total N2O emissions of production line k of the nth monitoring period (tN2O)
OH Number of hours of operation in the specific monitoring period (h)
Total N2O emissions of monitoring period n are the sum of the emissions of the single production lines:
∑=
=5
1,
kknn PETPE Formula 4
Where:
TPEn Total N2O emissions over all production lines of the nth monitoring period (tN2O)
In order to take into account periods where DK 2 is fed by tail gas from the adipic acid plant and with this excluded from the project boundaries of the project at hand, N2O emissions from DK 2 during these periods have to be deducted from the total:
ADSDKnn PETPEFPE −−= 2 Formula 5

JOINT IMPLEMENTATION PROJECT DESIGN DOCUMENT FORM - Version 01
Joint Implementation Supervisory Committee page 30
This template shall not be altered. It shall be completed without modifying/adding headings or logo, format or font.
Where:
FPEn Final total N2O emissions of the nth monitoring period (tN2O)
PEDK2-ADS N2O emissions at DK 2 during times where DK 2 is fed by adipic acid plant tail gas (tN2O)
From the project emissions (FPEn) and the accordant nitric acid production (P.5) in the monitoring period, the specific project emission factor is calculated:
nnn NAPFPEEF /= Formula 6
Where:
EFn Project N2O emission factor (tN2O/tHNO3)
NAPn Nitric acid production during the monitoring period (tHNO3)
All calculations will be carried out in an appropriate Excel file, where all relevant values from the AMS and the process control system will be entered. In phase A, all calculations will refer to periods where the same number of baskets/DeN2O catalysts are installed in the reactors.

JOINT IMPLEMENTATION PROJECT DESIGN DOCUMENT FORM - Version 01
Joint Implementation Supervisory Committee page 31
This template shall not be altered. It shall be completed without modifying/adding headings or logo, format or font.
D.1.1.3. Relevant data necessary for determining the baseline of anthropogenic emissions of greenhouse gases by sources within the project boundary, and how such data will be collected and archived:
ID number (Please use numbers to ease cross-referencing to D.2.)
Data variable Source of data
Data unit Measured (m), calculated (c), estimated (e)
Recording frequency
Proportion of data to be monitored
How will the data be archived? (electronic/ paper)
Comment
B.1 EFBL
Baseline Emission Factor
Conservative IPCC value
kgN2O/tHNO3 Default value - - - Default value: 4.5 kgN2O/tHNO3. For derivation and justification refer to section B.1 and Annex 2
B.2 NAP
Nitric Acid Production (100% concentrate)
Production log
tHNO3 m Continuously 100% Electronic Total production over monitoring period. Includes sodium nitrite. Sources and procedure for data acquisition presented in Annex 3.
B.3 TDK2-ADS
Periods where tail gas of adipic acid plant is led through DK 2
Production log
Date, time m Continuously 100% Electronic Determined by valve position and meter data. Serves for determination of periods where DK 2 is excluded from the project boundaries and the accordant N2O emissions and nitric acid production have to be identified
B.4 EFreg
Emission limit set by incoming policies or regulations
- - - - - - See „Impact of regulations“ under B.1.
JOINT IMPLEMENTATION PROJECT DESIGN DOCUMENT FORM - Version 01
Joint Implementation Supervisory Committee page 32
This template shall not be altered. It shall be completed without modifying/adding headings or logo, format or font.
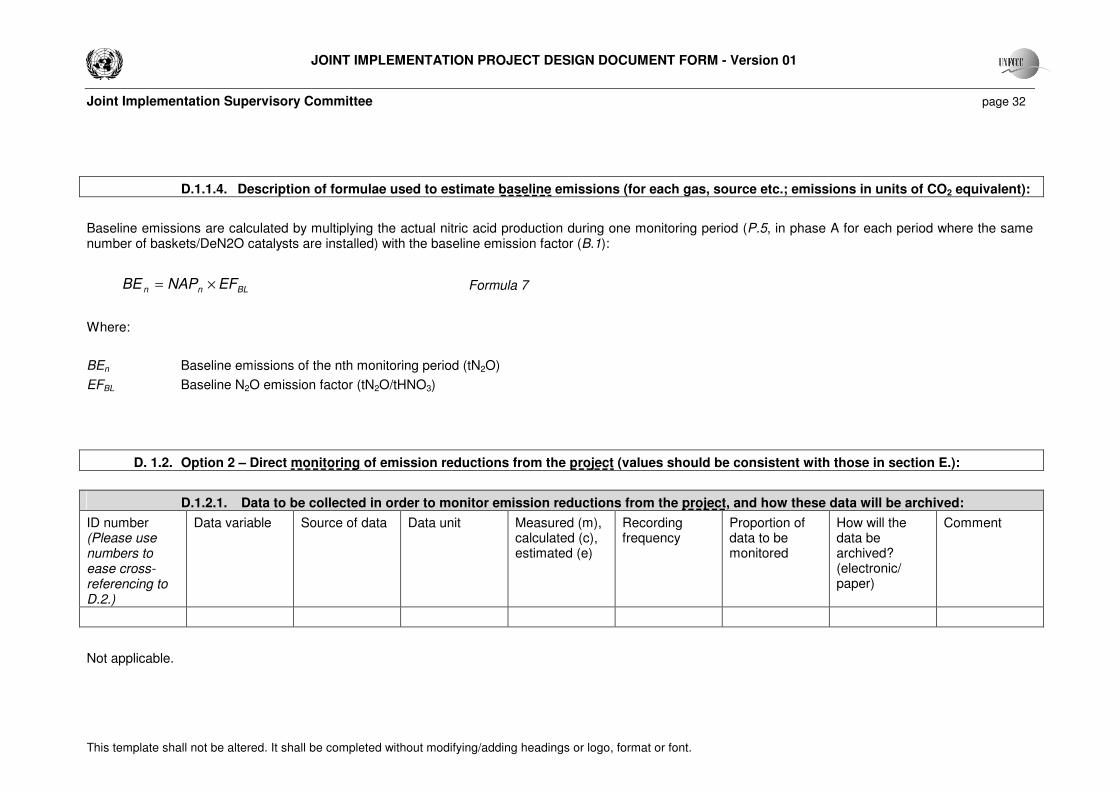
D.1.1.4. Description of formulae used to estimate baseline emissions (for each gas, source etc.; emissions in units of CO2 equivalent):
Baseline emissions are calculated by multiplying the actual nitric acid production during one monitoring period (P.5, in phase A for each period where the same number of baskets/DeN2O catalysts are installed) with the baseline emission factor (B.1):
BLnn EFNAPBE ×= Formula 7
Where:
BEn Baseline emissions of the nth monitoring period (tN2O)
EFBL Baseline N2O emission factor (tN2O/tHNO3)
D. 1.2. Option 2 – Direct monitoring of emission reductions from the project (values should be consistent with those in section E.):
D.1.2.1. Data to be collected in order to monitor emission reductions from the project, and how these data will be archived:
ID number (Please use numbers to ease cross-referencing to D.2.)
Data variable Source of data Data unit Measured (m), calculated (c), estimated (e)
Recording frequency
Proportion of data to be monitored
How will the data be archived? (electronic/ paper)
Comment
Not applicable.

JOINT IMPLEMENTATION PROJECT DESIGN DOCUMENT FORM - Version 01
Joint Implementation Supervisory Committee page 33
This template shall not be altered. It shall be completed without modifying/adding headings or logo, format or font.
D.1.2.2. Description of formulae used to calculate emission reductions from the project (for each gas, source etc.; emissions/emission reductions in units of CO2 equivalent):
Not applicable.
D.1.3. Treatment of leakage in the monitoring plan:
D.1.3.1. If applicable, please describe the data and information that will be collected in order to monitor leakage effects of the project:
ID number (Please use numbers to ease cross-referencing to D.2.)
Data variable Source of data Data unit Measured (m), calculated (c), estimated (e)
Recording frequency
Proportion of data to be monitored
How will the data be archived? (electronic/ paper)
Comment
No leakage emissions do accrue.
D.1.3.2. Description of formulae used to estimate leakage (for each gas, source etc.; emissions in units of CO2 equivalent):
Not applicable.
D.1.4. Description of formulae used to estimate emission reductions for the project (for each gas, source etc.; emissions/emission reductions in units of CO2 equivalent):
The emission reduction for the project activity over a specific monitoring period are determined by deducting the specific emission factor of the monitoring period (EFn, see Formula 6) from the baseline emission factor (EFBL, see B.1) and multiplying the result by the production output of 100% concentrated nitric acid over the monitoring period and the GWP of N2O:

JOINT IMPLEMENTATION PROJECT DESIGN DOCUMENT FORM - Version 01
Joint Implementation Supervisory Committee page 34
This template shall not be altered. It shall be completed without modifying/adding headings or logo, format or font.
( ) ONnnBLn GWPNAPEFEFER 2××−= Formula 8
Where:
ERn Emission reduction of the project for the specific monitoring period (tCO2e)
GWPN2O Global Warming Potential of N2O: 310
As soon as regulations limit the N2O emissions of the nitric acid plant in Ludwigshafen (expected for October 2010), the corresponding plant-specific emission factor cap (max. allowed tN2O/tHNO3) will be derived from the regulatory level. If the regulatory limit is lower than the baseline factor determined for the project, the regulatory limit shall serve as new baseline emission factor, that is:
If EFBL > EFreg, the baseline N2O emission factor shall be EFreg for all calculations. EFreg is the emission limit set by newly introduced policies or regulations (tN2O/tHNO3)
D.1.5. Where applicable, in accordance with procedures as required by the host Party, information on the collection and archiving of information on the environmental impacts of the project:
The project does not have any environmental impact.

JOINT IMPLEMENTATION PROJECT DESIGN DOCUMENT FORM - Version 01
Joint Implementation Supervisory Committee page 35
This template shall not be altered. It shall be completed without modifying/adding headings or logo, format or font.
D.2. Quality control (QC) and quality assurance (QA) procedures undertaken for data monitored:
Data (Indicate table and ID number)
Uncertainty level of data (high/medium/low)
Explain QA/QC procedures planned for these data, or why such procedures are not necessary.
D.1.1.1.: P.1, P.2, P.6, P.7
low Data acquisition by AMS (Automated Measuring System). The analysis equipment will be supplied by ABB Automation GmbH and combined with a data processing system from DURAG GmbH. The system fulfils the latest applicable European standards and norms, especially EN 14181. The devices are accordingly published by the Federal Bulletin14. EN 14181 defines comprehensive quality assurance measures (defined as QAL 2, QAL 3 and AST) which are followed by the installed system and will be adequately documented. Staff will be trained to operate the analysis equipment and the data processing system. In order to ensure highest availability, one of the relevant devices of the AMS, an additional analyzer module, is available for replacement at the plant.
The data recording unit is requesting failure messages every minute. In case of an error message the average value of the last minute is cancelled. In case of more than 20 average minute values are cancelled also the hourly average value is eliminated and the emission reductions of the project activity in this hour will not be considered.
D.1.1.1.: P.4 low Operating hours are by default recorded by the process control system.
D.1.1.1.: P.5 low Nitric acid production, material flows and analytical data are recorded not only for the project activity, but also for accounting and billing. The procedures and data are therefore not only included in the validation and verification process for the JI project, but do also underlie the internal quality procedures and financial auditing. The uncertainty level of these data is consequently low, independent from their use for the JI project.
D.3. Please describe the operational and management structure that the project operator will apply in implementing the monitoring plan:
In order to ensure a reliable and transparent implementation of the monitoring plan, all staff which is in charge of tasks connected to data acquisition for the monitoring will be trained and instructed accordingly. At the time of PDD writing, a detailed concept with the designation of tasks has yet to be elaborated. This will be done in the form of an internal “JI handbook” prior to the start of the project activity and documented in the first monitoring report.
14 See “Bundesanzeiger – Amtlicher Teil, Nummer 194 vom 14. Oktober 2006, Seite 6715: Bekanntmachung über die bundeseinheitliche Praxis bei der Überwachung der Emissionen und der Immissionen“

JOINT IMPLEMENTATION PROJECT DESIGN DOCUMENT FORM - Version 01
Joint Implementation Supervisory Committee page 36
This template shall not be altered. It shall be completed without modifying/adding headings or logo, format or font.
The following chart shows the distribution of responsibilities for the JI project. The overall responsibility lies with the project manager, Heinz-Josef Kneuper. Operational procedures, data acquisition, operation of AMS and process information system, service and maintenance and documentation are allocated to the different functions under the supervision of the project management.
Figure 6: Operational responsibilities for the JI project
The extractive analyzer and the data storage are installed in safes in the analysis room of DK 1. The data processor is installed in the control room and operated by the plant manager.
OperationsManager
Dr. Gmeiner, CAA
Project Manager
Dr. Kneuper, CAA
QualityManagement
Barbig, CAA/Q
TechnicalMaintanance
Lenz, CAA
ElectricalMaintanance
Huk, GTE
AnalyticalServices
Nehring, GTF
EnvironmentalServices
Dr. Clausen, GU
Engineering
Manager
Dr. Schweinfurter, GTE
ProcessEngineering
Vogelsang, GCT

JOINT IMPLEMENTATION PROJECT DESIGN DOCUMENT FORM - Version 01
Joint Implementation Supervisory Committee page 37
This template shall not be altered. It shall be completed without modifying/adding headings or logo, format or font.
Figure 7: Data processing, flow and storage with the DURAG system
D-EMS2000
FernwartungISDN
ND 1
Messwarte O405Switch
Backup HDD Backup HDD
analog, binär
TCP/IP
���PowerMaintErrorIR
01234 5 67 89
. Back
Uras26
N2O
VolumenstromDruck, Temperatur
���PowerMaintErrorIR
012345 6789
. Back
Uras26
N2O
Volumenstrom
Druck, Temperatur
���PowerMaintErrorIR
01234 5 67 89
. Back
Uras26N2O
Volumenstrom
Druck, Temperatur
���PowerMaintErrorIR
01234 5 678 9
. Back
Uras26N2O
���PowerMaintErrorIR
01234 5 678 9
. Back
Uras26
N2O
Volumenstrom
Druck, Temperatur
Volumenstrom
Druck, Temperatur
analog
analog, binär analog, binäranalog, binär
analog, binär
analog analog analog analogDK 2 DK 3 DK 4 DK 5
Anbindung PLSAnalog / binär
Anbindung PLSAnalog / binär
Anbindung PLSAnalog / binär
Anbindung PLSAnalog / binär
Anbindung PLSAnalog / binär
Funkuhr DCF77
D-MS500KE D-MS500KE D-MS500KE D-MS500KE D-MS500KE
NAP-Verrechnung
Kopplung fürNAP-ÜbergabeAnlagenwerte
D-EMS2000
FernwartungISDN
FernwartungISDN
ND 1
Messwarte O405Switch
Backup HDD Backup HDD
analog, binär
TCP/IP
���PowerMaintErrorIR
01234 5 67 89
. Back
Uras26
N2O
���PowerMaintErrorIR
01234 5 67 89
. Back
Uras26
N2O
���PowerMaintErrorIR
01234 5 67 89
. Back
PowerMaintErrorIR
01234 5 67 89
. Back
Uras26
N2O
VolumenstromDruck, Temperatur
���PowerMaintErrorIR
012345 6789
. Back
Uras26
N2O
���PowerMaintErrorIR
012345 6789
. Back
Uras26
N2O
���PowerMaintErrorIR
012345 6789
. Back
PowerMaintErrorIR
012345 6789
. Back
Uras26
N2O
Volumenstrom
Druck, Temperatur
���PowerMaintErrorIR
01234 5 67 89
. Back
Uras26N2O
���PowerMaintErrorIR
01234 5 67 89
. Back
Uras26N2O
���PowerMaintErrorIR
01234 5 67 89
. Back
PowerMaintErrorIR
01234 5 67 89
. Back
Uras26N2O
Volumenstrom
Druck, Temperatur
���PowerMaintErrorIR
01234 5 678 9
. Back
Uras26N2O
���PowerMaintErrorIR
01234 5 678 9
. Back
Uras26N2O
���PowerMaintErrorIR
01234 5 678 9
. Back
PowerMaintErrorIR
01234 5 678 9
. Back
Uras26N2O
���PowerMaintErrorIR
01234 5 678 9
. Back
Uras26
N2O
���PowerMaintErrorIR
01234 5 678 9
. Back
Uras26
N2O
���PowerMaintErrorIR
01234 5 678 9
. Back
PowerMaintErrorIR
01234 5 678 9
. Back
Uras26
N2O
Volumenstrom
Druck, Temperatur
Volumenstrom
Druck, Temperatur
analog
analog, binär analog, binäranalog, binär
analog, binär
analog analog analog analogDK 2 DK 3 DK 4 DK 5
Anbindung PLSAnalog / binär
Anbindung PLSAnalog / binär
Anbindung PLSAnalog / binär
Anbindung PLSAnalog / binär
Anbindung PLSAnalog / binär
Anbindung PLSAnalog / binär
Anbindung PLSAnalog / binär
Anbindung PLSAnalog / binär
Anbindung PLSAnalog / binär
Anbindung PLSAnalog / binär
Funkuhr DCF77
D-MS500KE D-MS500KE D-MS500KE D-MS500KE D-MS500KE
NAP-VerrechnungNAP-Verrechnung
Kopplung fürNAP-ÜbergabeAnlagenwerte
Kopplung fürNAP-ÜbergabeAnlagenwerte

JOINT IMPLEMENTATION PROJECT DESIGN DOCUMENT FORM - Version 01
Joint Implementation Supervisory Committee page 38
This template shall not be altered. It shall be completed without modifying/adding headings or logo, format or font.
D.4. Name of person(s)/entity(ies) establishing the monitoring plan:
The baseline setting was defined and documented by the project consultant:
FutureCamp GmbH
Chiemgaustr. 116
81549 München
with the support and input of BASF AG.

JOINT IMPLEMENTATION PROJECT DESIGN DOCUMENT FORM - Version 01
Joint Implementation Supervisory Committee page 39
This template shall not be altered. It shall be completed without modifying/adding headings or logo, format or font.
SECTION E. Estimation of greenhouse gas emission reductions
E.1. Estimated project emissions:
Due to lacking experience with the large scale application of secondary N2O destruction at atmospheric nitric acid plants, the following numbers are based on a rough estimation of what emission levels could be achieved with the catalyst installed. The applied values for the estimated project emissions follow a decreasing path considering the expected effect of the successive installation of baskets and DeN2O catalyst during phase A (cf. section D.1) and the learning effect until 2012. It is not intended to set any limits on the achievable project emissions, as the JI mechanism shall serve as incentive for research and improvement of secondary abatement at atmospheric nitric acid plants for every ton of nitrous oxide that is reduced compared to the respective baseline scenario.
Year Expected nitric acid production and nitric acid equivalent production [tHNO3, 100%]
Estimated project emission factor [kgN2O/tHNO3]
Estimated project emissions [tN2O]
Estimated project emissions [tCO2e]
2008 780,000 3.5 2,730 846,300
2009 780,000 2.5 1,950 604,500
2010 780,000 2.2 1,716 531,960
2011 780,000 2.0 1,560 483,600
2012 780,000 2.0 1,560 483,600
Table 1: Estimated project emissions
E.2. Estimated leakage:
No leakage emissions do accrue.
E.3. The sum of E.1. and E.2.:
See E.1.
E.4. Estimated baseline emissions:
From the start of the crediting period until October 2010, the baseline emission factor of 4.5 kgN2O/tHNO3 applies. From 30 October 2010 on, the regulatory limit of 2.5 kgN2O/tHNO3 is used as baseline emission factor.
Year Expected nitric acid production and nitric acid equivalent production [tHNO3, 100%]
Baseline emission factor [kgN2O/tHNO3]
Estimated baseline emissions [tN2O]
Estimated baseline emissions [tCO2e]
2008 780,000 4.5 3,510 1,088,100

JOINT IMPLEMENTATION PROJECT DESIGN DOCUMENT FORM - Version 01
Joint Implementation Supervisory Committee page 40
This template shall not be altered. It shall be completed without modifying/adding headings or logo, format or font.
2009 780,000 4.5 3,510 1,088,100
2010 780,000 4.5/2.5 2,250 1,007,500
2011 780,000 2.5 1,950 604,500
2012 780,000 2.5 1,950 604,500
Table 2: Estimated baseline emission
E.5. Difference between E.4. and E.3. representing the emission reductions of the project:
Year Emission reduction [tN2O]
Emission reduction [tCO2e]
2008 780 241,800
2009 1,560 483,600
2010 1,534 475,540
2011 390 120,900
2012 390 120,900
Total 4,654 1,442,740
Table 3: Estimated emission reductions
E.6. Table providing values obtained when applying formulae above:
Values presented in each section.
SECTION F. Environmental impacts
F.1. Documentation on the analysis of the environmental impacts of the project, including transboundary impacts, in accordance with procedures as determined by the host Party:
No environmental impacts are expected. No requirements regarding the analysis of environmental impacts are defined by law or by the competent authority.
F.2. If environmental impacts are considered significant by the project participants or the host Party, please provide conclusions and all references to supporting documentation of an environmental impact assessment undertaken in accordance with the procedures as required by the host Party:
Not applicable, as no environmental impacts were identified.
SECTION G. Stakeholders’ comments
G.1. Information on stakeholders’ comments on the project, as appropriate:
As the project activity is an invisible technical installation at the BASF production site in Ludwigshafen without any negative environmental or social impact, no stakeholders can be identified.

JOINT IMPLEMENTATION PROJECT DESIGN DOCUMENT FORM - Version 01
Joint Implementation Supervisory Committee page 41
This template shall not be altered. It shall be completed without modifying/adding headings or logo, format or font.
Annex 1
CONTACT INFORMATION ON PROJECT PARTICIPANTS
Organisation: BASF AG
Street/P.O.Box:
Building:
City: Ludwigshafen
State/Region: Rhineland-Palatinate
Postal code: 67056
Country: Germany
Phone:
Fax:
E-mail:
URL: www.basf.com
Represented by: Dr. Iven Clausen
Title: Business Manager Greenhouse Gas Projects
Salutation:
Last name:
Middle name:
First name:
Department: GU/EP
Phone (direct): +49 621 60-43160
Fax (direct): +49 621 60-6643160
Mobile:
Personal e-mail: [email protected]

JOINT IMPLEMENTATION PROJECT DESIGN DOCUMENT FORM - Version 01
Joint Implementation Supervisory Committee page 42
This template shall not be altered. It shall be completed without modifying/adding headings or logo, format or font.
Annex 2
BASELINE INFORMATION
In the following, the baseline parameters are explained and the data that are available for validation are presented.
As explained in section B.1, three dedicated series of measurements on different days serve to set the baseline emission factor. The measurements were carried out by ESG – Emissionsmesstechnik und Strömungsmechanik Entwicklung und Anwendung GmbH on 26 June, 6 July and 17 August 2007. The dates were chosen in a way that two catalyst gauze replacements fell into the measuring period in order to record the according effect and take a conservative approach. The ammonia oxidation catalysts were replaced on 2 July (oxidation reactor S 2) and 14 August 2007 (S 1).
The following two tables show the results from the measurements:
Data/Parameter NCSGm
Data unit ppm (vol)
Description Mean concentration of N2O in the stack gas during the baseline measurement period
Source of data used Report on N2O-concentration measurements by ESG, 10 Sep 2007
Value applied
26 Jun 6 Jul 17 Aug
DK-2 595 593 594
DK-3 621 621 590
DK-4 607 623 567
DK-5 617 618 581
ND 852 932 910
Justification of the choice of data or description of measurement methods and procedures actually applied
ESG, a certified engineering company for emission measurements was commissioned to carry out dedicated state-of-the-art measurements of N2O emissions during normal plant operation in order to set the baseline scenario. A separate report on the measurements is available, where the method, the equipment and the handling of uncertainties is described.
Any comment The values, measured and reported as dimensionless quantities (vpm, were converted to g/m³ by applying a molar volume of 22.414 l/mol and a molar mass of 44.01287 g/mol for N2O.
Data/Parameter VSGm
Data unit Nm³/h
Description Mean gas volume flow rate at the stack in the baseline measurement period
Source of data used Report on N2O-concentration measurements by ESG, 10 Sep 2007

JOINT IMPLEMENTATION PROJECT DESIGN DOCUMENT FORM - Version 01
Joint Implementation Supervisory Committee page 43
This template shall not be altered. It shall be completed without modifying/adding headings or logo, format or font.
Value applied
26 Jun 6 Jul 17 Aug
DK-2 41,600 41,200 41,550
DK-3 40,500 40,400 40,333
DK-4 40,000 40,500 39,733
DK-5 39,800 39,400 39,167
ND 103,167 109,167 108,000
Justification of the choice of data or description of measurement methods and procedures actually applied
ESG, a certified engineering company for emission measurements was commissioned to carry out dedicated state-of-the-art measurements of N2O emissions during normal plant operation in order to set the baseline scenario. A separate report on the measurements is available, where the method, the equipment and the handling of uncertainties is described.
Any comment
With these results the daily N2O emissions are calculated for each absorption process train according to Formula 1 and summed up:
Daily N2O emissions [kgN2O/d]
26 June 2007 8,793
6 July 2007 9,461
17 August 2007 9,054
The following table shows the daily nitric acid production on the three measurement days:
Data/Parameter NAPm
Data unit tHNO3
Description Nitric acid production during the baseline period (100% concentrate)
Source of data used Internal production and accounting records
Value applied
26 Jun 6 Jul 17 Aug
1,938 1,907 1,786
Justification of the choice of data or description of measurement methods and procedures actually applied
For the acquisition of production data, the most reliable and traceable sources were used. These are especially the data that are available for accounting and invoicing to customers. Where no data from accounting were available, production logs were used. The derivation of the presented sums is shown in a separate Excel file.
Any comment
Data/Parameter UNC
Data unit
Description Overall uncertainty of the monitoring system (%), calculated as the combined uncertainty of the applied monitoring equipment
Source of data used Report on N2O measurements by ESG
Value applied
26 Jun 6 Jul 17 Aug
1.72% 1.72% 1.72%
Justification of the choice of data or description of measurement methods and
The report of ESG on the three measurement series contains information about maximum allowed uncertainty of the measurement devices and the actual determined error, which is far below the

JOINT IMPLEMENTATION PROJECT DESIGN DOCUMENT FORM - Version 01
Joint Implementation Supervisory Committee page 44
This template shall not be altered. It shall be completed without modifying/adding headings or logo, format or font.
procedures actually applied allowed values. For the calculation of the overall uncertainty, the single measuring errors were collected from and the report and combined following the guidance “Quantifying Uncertainties in Practice” from IPCC (IPCC Good Practice Guidance and Uncertainty Management in National Greenhouse Gas Inventories, Chapter 6, Montreal, May 2000)
Any comment
Applying Formula 2 to the presented data leads to the following emission factors:
Emission factor without considering
uncertainty
[kgN2O/tHNO3]
Emission factor after subtraction of
uncertainty [kgN2O/tHNO3]
26 June 2007 4.5 4.5
6 July 2007 5.0 4.9
17 August 2007 5.1 5.0
Average 4.9 4.8
The plant operated under normal conditions during the baseline measurement days. This is demonstrated by comparing the oxidation temperatures during the baseline measurement days with the available historic records.
The ammonia oxidation catalyst has been supplied by Umicore from Hanau, Germany, the last years. The composition of the gauze is approximately 95% platinum and 5% rhodium.

JOINT IMPLEMENTATION PROJECT DESIGN DOCUMENT FORM - Version 01
Joint Implementation Supervisory Committee page 45
This template shall not be altered. It shall be completed without modifying/adding headings or logo, format or font.
Annex 3
MONITORING PLAN
N2O emissions
The AMS (Automated Measuring System) will be supplied by ABB Automation GmbH and DURAG GmbH from Germany. Analysis equipment (marked with “Q”) will be installed behind the DeNOx facilities:
Figure 8: Analysis equipment of AMS behind DeNOx facilities in each process train
The acquisition of N2O concentration and gas volume flow underlie the strict quality requirements defined by EN ISO 14956 and EN 14181, against which the system is certified. The supplier is aware of the application of the AMS within the scope of AM0034 and guarantees that all requirements are met. An accredited certifier carries out calibration, the operator carries out quality assurance measures.
QAL2 is carried out first time in September 2008 and will then be repeated every three years. QAL 3 is carried out continually on a weekly basis by qualified staff of the quality assurance group of BASF’s business unit CAA/S. AST is repeated annually by an institute certified according to EN ISO 17025.
The following data are recorded by the AMS (reference to table D.1.1.1):
• N2O-concentration in the stack gas (NCSG, P.1)
• Volume flow rate of stack gas (VSG, P.2)
• Temperature of stack gas (TSG, P.6)
• Pressure of stack gas (PSG, P.7)

JOINT IMPLEMENTATION PROJECT DESIGN DOCUMENT FORM - Version 01
Joint Implementation Supervisory Committee page 46
This template shall not be altered. It shall be completed without modifying/adding headings or logo, format or font.
For the calculation of the emission factor for a monitoring period, the 60 minutes mean values for N2O concentration and gas volume flow will be calculated in the Durag System, where the statistical analysis is carried out and mean values are calculated for a monitoring period. Operating hours and nitric acid production data will be taken from the PDA (Production Data Acquisition) system for each monitoring period, and the emission factor for the actual period will be calculated.
Downtime of AMS: In the event that the monitoring system is down, the highest measured value in the monitoring period will be applied for the downtime period for the monitoring period emission factor.
Specific performance characteristics of the monitoring system are described in the supplier’s product description.
Nitric acid production
The products from the absorption processes at the nitric acid plant in Ludwigshafen are nitric acid (HNO3) and sodium nitrite (NaNO2). As the nitric acid plant does also receive both HNO3 and NaNO2 from the neighbouring NO factory and merge these with the production from the own absorption columns, the material flows have to be balanced for the calculation of the amount of 100% nitric acid equivalent produced by the nitric acid plant alone (NAP). The following graphs and explanations show the principle system and procedure for the acquisition of nitric acid production data for a monitoring period. Figure 9 shows material flows, no emission flows. With this, it is independent from the definition of the project boundaries as explained in section B.3. No connection between the nitric acid plant and other plants with respect to gaseous emissions (esp. N2O) does exist.
Figure 9: Material flow of HNO3 and derivative products, schematic overview
NO factory NO
Tanks
Co
nsu
mers
, D
istr
ibu
tors
E
E
E
E
Hydroxyl Amine Plant
Nitric Acid Plant
Oxid
ati
on
Reacto
rs ND
DK 5
DK 4
DK 3
DK 2
DK 1 D
F
HNO3 NaNO2 NaNO2
A B C
HNO3
Remark with respect to project boundaries: The project boundaries, as explained in B.3., do only comprise the nitric acid plant (indicated by green area), since no connection between the different plants regarding N2O emissions does exist.

JOINT IMPLEMENTATION PROJECT DESIGN DOCUMENT FORM - Version 01
Joint Implementation Supervisory Committee page 47
This template shall not be altered. It shall be completed without modifying/adding headings or logo, format or font.
The nitric acid released from the HNO3 plant is fed into tanks, from where the fluid is led through various pipelines to the consumers and distributors. These amounts are not equal to the nitric acid production that will be used to determine the emission reductions, as they include the nitric acid production from the neighbouring NO plant and from DK 1. Therefore the respective amounts have to be deducted from the overall supply in order to obtain the nitric acid generation of the process trains within the project boundaries (DK 2 to DK 5 and ND).
The same is the case with the sodium nitrite amounts: The NaNO2 supplied by the NO plant has to be deducted from the overall amount leaving the nitric acid plant in order to obtain the net generation of the latter. In addition, NaNO2 has to be converted to 100% HNO3 by stoichiometric calculation.
Sodium nitrite production at the nitric acid plant is included into the project, as it is a product from the same reaction as nitric acid, namely the oxidation of ammonia in the reactors. Thus, the N2O generation during ammonia oxidation is directly connected to both nitric acid and sodium nitrite production but cannot be assigned to the different products on a quantity basis. As nitrogen is the central element of the input-output-equation of the plant and N2O is generated in a process step that is independent from the final product, an adequate and complete approach requires the inclusion of all nitrogen containing products into the balance. All products are expressed as 100% nitric acid.
The following table shows information and sources for the above drafted data.
Collection of HNO3 production data
Term, Reference Description of data acquisition
HNO3 inflow from NO factory
Flow: Online measurement (Krohne Optiflux 4000/IFC 300)
Concentration: Daily manual sample drawing and analysis with densimeter
NaNO2 inflow from NO factory
Flow: Online measurement
Concentration: Monthly analysis in laboratory
Stoichiometric conversion to HNO3
Total NaNO2 release (comprises NaNO2 from the NO plant and the HNO3 plant)
Online measurement of flow and concentration by the receiving plant. Data are not collected by PI but forwarded from the receiving plant and included into the Excelfile for the production data acquisition.
Stoichiometric conversion to HNO3
HNO3 production of DK 1
Flow: Online measurement
Concentration: Manual recording of refractometer data
Total HNO3 supply to customers (comprises HNO3 from the NO plant and the HNO3 plant)
Flow: Online measurement (Krohne Optiflux 4000/IFC 300)
Concentration: Daily analysis by certified laboratory. Additional online measurement for quality check.
HNO3 production of DK 2 in periods where adipic acid tail gas is led through DK 2
The determination of periods where DK 2 operates on adipic acid tail gas is part of the monitoring (see D.1.1.1). HNO3 production of DK 2 during these periods will be deducted from overall production.
All measured data from HNO3 and NaNO2 flows are directly normed to 100% HNO3 concentrate.
All data from online measurements are processed and stored by the plant PDA (Production Data Acquisition) system “PI”. From PI, the data are fed into an Excelfile where PI data and manually collected data are consolidated and available for accounting on a monthly basis. These data are the basis for accounting in the SAP system and invoicing/settling to the customers.
The HNO3 production of one monitoring period and within the project boundaries is calculated according to the presented scheme:
A
B
C
D
E
F

JOINT IMPLEMENTATION PROJECT DESIGN DOCUMENT FORM - Version 01
Joint Implementation Supervisory Committee page 48
This template shall not be altered. It shall be completed without modifying/adding headings or logo, format or font.
NAP = ( - ) + ( - ) - -
This equation leads to the net nitric acid production (NAP), expressed as 100% concentrate, that correlates with the project boundaries defined for the N2O emissions (cf. section B.3.). With this, the calculation of the emission factor (quotient from N2O emissions and nitric acid production, cf. Formula 2 and Formula 6) stays consistent.
Changes in the fill level of the tanks are recorded in the Process Control System and will be considered for the end-of-period balancing.
While the above described focuses on the principle scheme of balancing the HNO3 and NaNO2 flows in order to obtain the net amounts produced by the nitric acid plant, the following page shows the list of meters (flow and concentration) and measurements that deliver the data for the nitric acid production calculation. The list is available as an Excel file (German language) and is part of the monitoring plan.
E C B A D F
= Net Production of HNO3
at the nitric acid plant, expressed as 100% HNO3 concentrate
= Net Production of NaNO2
at the nitric acid plant, expressed as 100% HNO3
concentrate
= Net Production of HNO3
at the nitric acid plant outside the project boundaries, expressed as 100% HNO3 concentrate
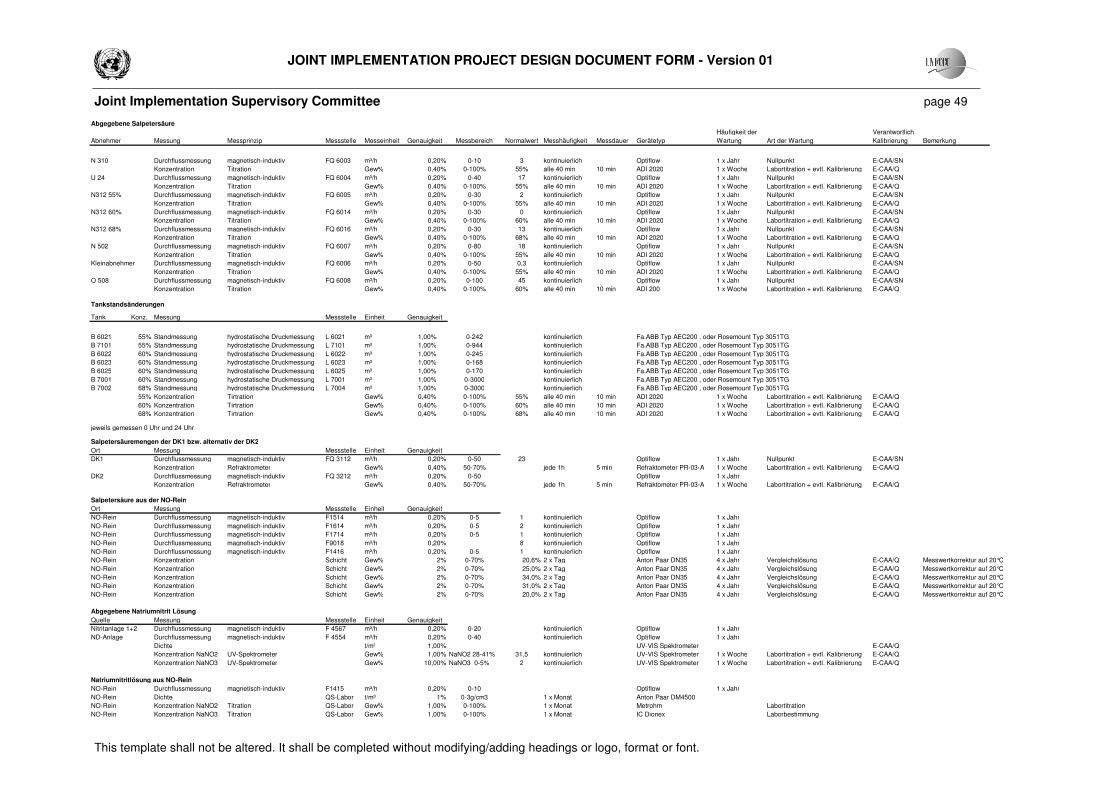
JOINT IMPLEMENTATION PROJECT DESIGN DOCUMENT FORM - Version 01
Joint Implementation Supervisory Committee page 49
This template shall not be altered. It shall be completed without modifying/adding headings or logo, format or font.
Abgegebene Salpetersäure
Abnehmer Messung Messprinzip Messstelle Messeinheit Genauigkeit Messbereich Normalwert Messhäufigkeit Messdauer GerätetypHäufigkeit der Wartung Art der Wartung
Verantwortlich Kalibrierung Bemerkung
N 310 Durchflussmessung magnetisch-induktiv FQ 6003 m³/h 0,20% 0-10 3 kontinuierlich Optiflow 1 x Jahr Nullpunkt E-CAA/SNKonzentration Titration Gew% 0,40% 0-100% 55% alle 40 min 10 min ADI 2020 1 x Woche Labortitration + evtl. Kalibrierung E-CAA/Q
U 24 Durchflussmessung magnetisch-induktiv FQ 6004 m³/h 0,20% 0-40 17 kontinuierlich Optiflow 1 x Jahr Nullpunkt E-CAA/SNKonzentration Titration Gew% 0,40% 0-100% 55% alle 40 min 10 min ADI 2020 1 x Woche Labortitration + evtl. Kalibrierung E-CAA/Q
N312 55% Durchflussmessung magnetisch-induktiv FQ 6005 m³/h 0,20% 0-30 2 kontinuierlich Optiflow 1 x Jahr Nullpunkt E-CAA/SNKonzentration Titration Gew% 0,40% 0-100% 55% alle 40 min 10 min ADI 2020 1 x Woche Labortitration + evtl. Kalibrierung E-CAA/Q
N312 60% Durchflussmessung magnetisch-induktiv FQ 6014 m³/h 0,20% 0-30 0 kontinuierlich Optiflow 1 x Jahr Nullpunkt E-CAA/SNKonzentration Titration Gew% 0,40% 0-100% 60% alle 40 min 10 min ADI 2020 1 x Woche Labortitration + evtl. Kalibrierung E-CAA/Q
N312 68% Durchflussmessung magnetisch-induktiv FQ 6016 m³/h 0,20% 0-30 13 kontinuierlich Optiflow 1 x Jahr Nullpunkt E-CAA/SNKonzentration Titration Gew% 0,40% 0-100% 68% alle 40 min 10 min ADI 2020 1 x Woche Labortitration + evtl. Kalibrierung E-CAA/Q
N 502 Durchflussmessung magnetisch-induktiv FQ 6007 m³/h 0,20% 0-80 18 kontinuierlich Optiflow 1 x Jahr Nullpunkt E-CAA/SNKonzentration Titration Gew% 0,40% 0-100% 55% alle 40 min 10 min ADI 2020 1 x Woche Labortitration + evtl. Kalibrierung E-CAA/Q
Kleinabnehmer Durchflussmessung magnetisch-induktiv FQ 6006 m³/h 0,20% 0-50 0,3 kontinuierlich Optiflow 1 x Jahr Nullpunkt E-CAA/SNKonzentration Titration Gew% 0,40% 0-100% 55% alle 40 min 10 min ADI 2020 1 x Woche Labortitration + evtl. Kalibrierung E-CAA/Q
O 508 Durchflussmessung magnetisch-induktiv FQ 6008 m³/h 0,20% 0-100 45 kontinuierlich Optiflow 1 x Jahr Nullpunkt E-CAA/SNKonzentration Titration Gew% 0,40% 0-100% 60% alle 40 min 10 min ADI 200 1 x Woche Labortitration + evtl. Kalibrierung E-CAA/Q
Tankstandsänderungen
Tank Konz. Messung Messstelle Einheit Genauigkeit
B 6021 55% Standmessung hydrostatische Druckmessung L 6021 m³ 1,00% 0-242 kontinuierlich Fa.ABB Typ AEC200 , oder Rosemount Typ 3051TGB 7101 55% Standmessung hydrostatische Druckmessung L 7101 m³ 1,00% 0-944 kontinuierlich Fa.ABB Typ AEC200 , oder Rosemount Typ 3051TGB 6022 60% Standmessung hydrostatische Druckmessung L 6022 m³ 1,00% 0-245 kontinuierlich Fa.ABB Typ AEC200 , oder Rosemount Typ 3051TGB 6023 60% Standmessung hydrostatische Druckmessung L 6023 m³ 1,00% 0-168 kontinuierlich Fa.ABB Typ AEC200 , oder Rosemount Typ 3051TGB 6025 60% Standmessung hydrostatische Druckmessung L 6025 m³ 1,00% 0-170 kontinuierlich Fa.ABB Typ AEC200 , oder Rosemount Typ 3051TGB 7001 60% Standmessung hydrostatische Druckmessung L 7001 m³ 1,00% 0-3000 kontinuierlich Fa.ABB Typ AEC200 , oder Rosemount Typ 3051TGB 7002 68% Standmessung hydrostatische Druckmessung L 7004 m³ 1,00% 0-3000 kontinuierlich Fa.ABB Typ AEC200 , oder Rosemount Typ 3051TG
55% Konzentration Tirtration Gew% 0,40% 0-100% 55% alle 40 min 10 min ADI 2020 1 x Woche Labortitration + evtl. Kalibrierung E-CAA/Q 60% Konzentration Tirtration Gew% 0,40% 0-100% 60% alle 40 min 10 min ADI 2020 1 x Woche Labortitration + evtl. Kalibrierung E-CAA/Q
68% Konzentration Tirtration Gew% 0,40% 0-100% 68% alle 40 min 10 min ADI 2020 1 x Woche Labortitration + evtl. Kalibrierung E-CAA/Q
jeweils gemessen 0 Uhr und 24 Uhr
Salpetersäuremengen der DK1 bzw. alternativ der DK2
Ort Messung Messstelle Einheit GenauigkeitDK1 Durchflussmessung magnetisch-induktiv FQ 3112 m³/h 0,20% 0-50 23 Optiflow 1 x Jahr Nullpunkt E-CAA/SN
Konzentration Refraktrometer Gew% 0,40% 50-70% jede 1h 5 min Refraktometer PR-03-A 1 x Woche Labortitration + evtl. Kalibrierung E-CAA/QDK2 Durchflussmessung magnetisch-induktiv FQ 3212 m³/h 0,20% 0-50 Optiflow 1 x Jahr
Konzentration Refraktrometer Gew% 0,40% 50-70% jede 1h 5 min Refraktometer PR-03-A 1 x Woche Labortitration + evtl. Kalibrierung E-CAA/Q
Salpetersäure aus der NO-Rein
Ort Messung Messstelle Einheit GenauigkeitNO-Rein Durchflussmessung magnetisch-induktiv F1514 m³/h 0,20% 0-5 1 kontinuierlich Optiflow 1 x JahrNO-Rein Durchflussmessung magnetisch-induktiv F1614 m³/h 0,20% 0-5 2 kontinuierlich Optiflow 1 x JahrNO-Rein Durchflussmessung magnetisch-induktiv F1714 m³/h 0,20% 0-5 1 kontinuierlich Optiflow 1 x JahrNO-Rein Durchflussmessung magnetisch-induktiv F9018 m³/h 0,20% 8 kontinuierlich Optiflow 1 x JahrNO-Rein Durchflussmessung magnetisch-induktiv F1416 m³/h 0,20% 0-5 1 kontinuierlich Optiflow 1 x JahrNO-Rein Konzentration Schicht Gew% 2% 0-70% 20,6% 2 x Tag Anton Paar DN35 4 x Jahr Vergleichslösung E-CAA/Q Messwertkorrektur auf 20°CNO-Rein Konzentration Schicht Gew% 2% 0-70% 25,0% 2 x Tag Anton Paar DN35 4 x Jahr Vergleichslösung E-CAA/Q Messwertkorrektur auf 20°CNO-Rein Konzentration Schicht Gew% 2% 0-70% 34,0% 2 x Tag Anton Paar DN35 4 x Jahr Vergleichslösung E-CAA/Q Messwertkorrektur auf 20°CNO-Rein Konzentration Schicht Gew% 2% 0-70% 31,0% 2 x Tag Anton Paar DN35 4 x Jahr Vergleichslösung E-CAA/Q Messwertkorrektur auf 20°CNO-Rein Konzentration Schicht Gew% 2% 0-70% 20,0% 2 x Tag Anton Paar DN35 4 x Jahr Vergleichslösung E-CAA/Q Messwertkorrektur auf 20°C
Abgegebene Natriumnitrit Lösung
Quelle Messung Messstelle Einheit GenauigkeitNitritanlage 1+2 Durchflussmessung magnetisch-induktiv F 4567 m³/h 0,20% 0-20 kontinuierlich Optiflow 1 x JahrND-Anlage Durchflussmessung magnetisch-induktiv F 4554 m³/h 0,20% 0-40 kontinuierlich Optiflow 1 x Jahr
Dichte t/m³ 1,00% UV-VIS Spektrometer E-CAA/QKonzentration NaNO2 UV-Spektrometer Gew% 1,00% NaNO2 28-41% 31,5 kontinuierlich UV-VIS Spektrometer 1 x Woche Labortitration + evtl. Kalibrierung E-CAA/QKonzentration NaNO3 UV-Spektrometer Gew% 10,00% NaNO3 0-5% 2 kontinuierlich UV-VIS Spektrometer 1 x Woche Labortitration + evtl. Kalibrierung E-CAA/Q
Natriumnitritlösung aus NO-Rein NO-Rein Durchflussmessung magnetisch-induktiv F1415 m³/h 0,20% 0-10 Optiflow 1 x Jahr NO-Rein Dichte QS-Labor t/m³ 1% 0-3g/cm3 1 x Monat Anton Paar DM4500NO-Rein Konzentration NaNO2 Titration QS-Labor Gew% 1,00% 0-100% 1 x Monat Metrohm LabortitrationNO-Rein Konzentration NaNO3 Titration QS-Labor Gew% 1,00% 0-100% 1 x Monat IC Dionex Laborbestimmung