catalyzing clean infrastructure investment veronique bishop world bank workshop on risk management...
TRANSCRIPT

Catalyzing Clean Infrastructure Investment
Veronique BishopWorld Bank
Workshop on Risk Management Tools in Carbon Finance
November 19-20, 2003

Outline
• Investment constraints
• How carbon finance can help
• Risk sharing
• Combining CF with other instruments
• Workshop objectives & organization
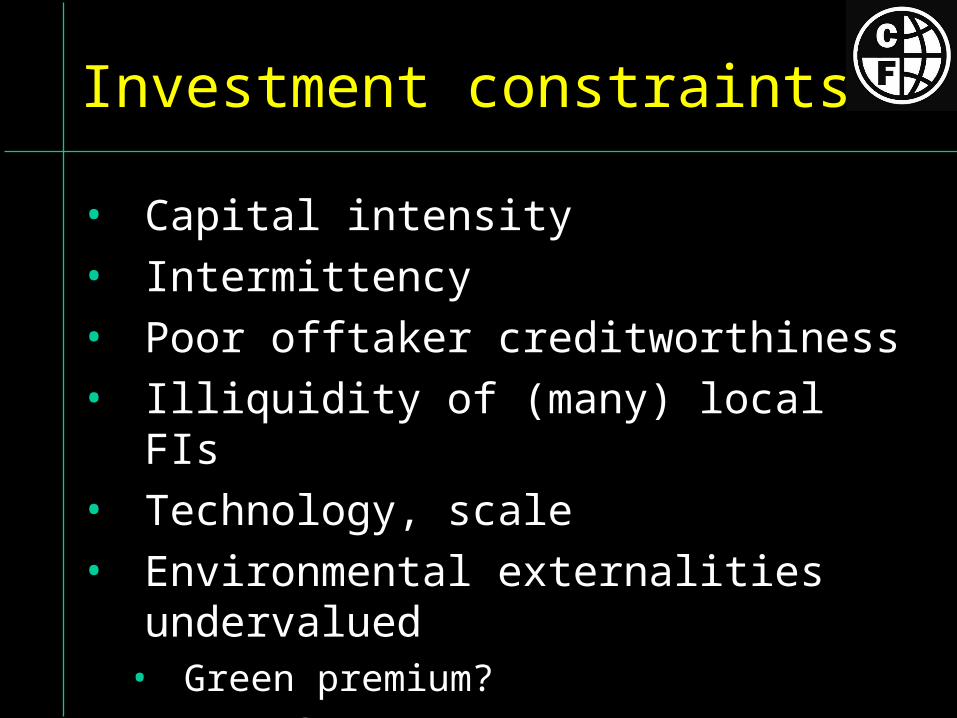
Investment constraints
• Capital intensity
• Intermittency
• Poor offtaker creditworthiness
• Illiquidity of (many) local FIs
• Technology, scale
• Environmental externalities undervalued• Green premium? • Kyoto?

Capital intensity
• [Chart showing discounted cost per kWh for range of generation sources]

How carbon finance can help
• Increased cash flow boosts returns
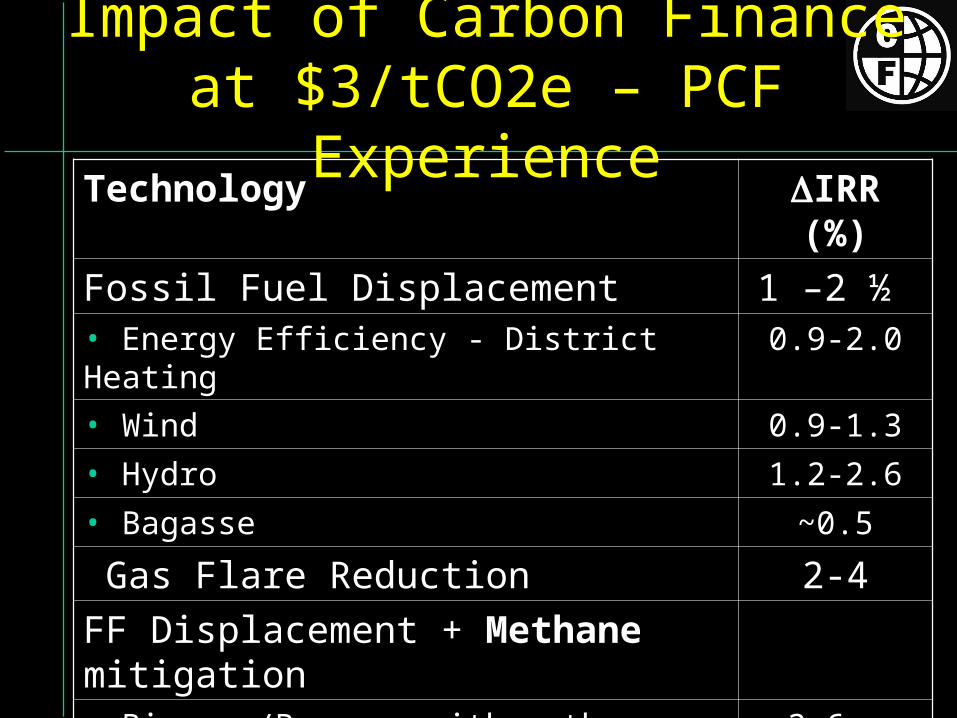
Impact of Carbon Finance at $3/tCO2e – PCF Experience
Technology IRR (%)
Fossil Fuel Displacement 1 –2 ½ • Energy Efficiency - District Heating 0.9-2.0
• Wind 0.9-1.3
• Hydro 1.2-2.6
• Bagasse ~0.5
Gas Flare Reduction 2-4
FF Displacement + Methane mitigation• Biomass/Bagasse with methane kick 3.6 - >5.0
• Municipal Solid Waste with methane kick >5.0

Annual Data Uganda Costa Rica Chile
off-grid grid grid
ERs (000 t) 49 61 79-138*
Net Gen.(GWh) 30 75 160
CO2 ERs/GWh 1664 807 494-860
ER (USc/kWh) 0.50 0.24
* Gas vs.
0.15-0.26
coal BL
Grid- vs. Off-grid Hydro ($3/tCO2e)
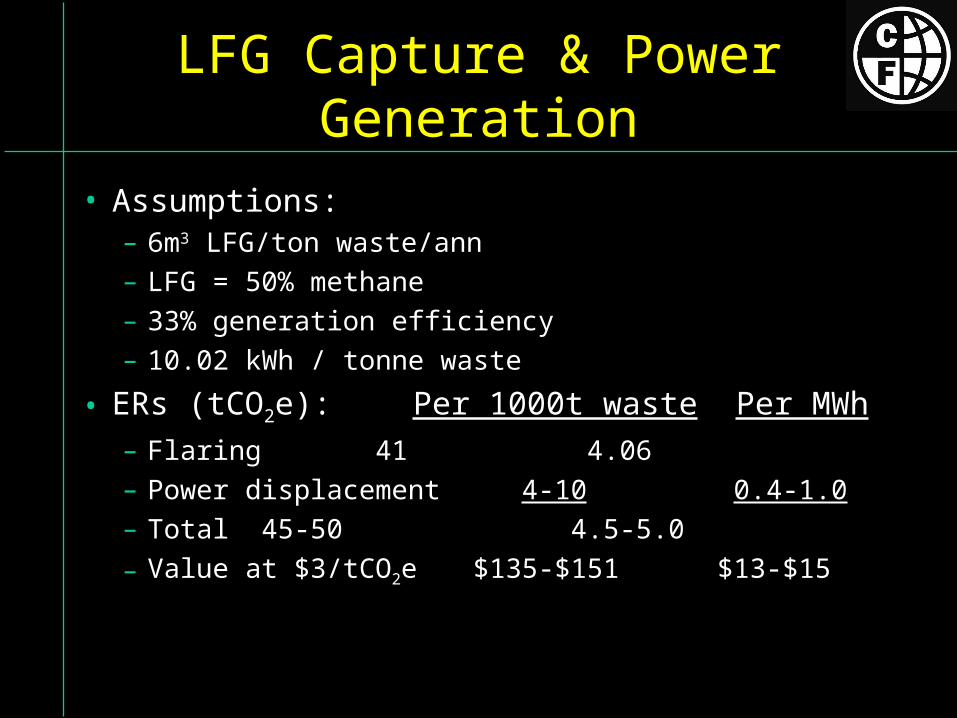
LFG Capture & Power Generation
• Assumptions: – 6m3 LFG/ton waste/ann
– LFG = 50% methane
– 33% generation efficiency
– 10.02 kWh / tonne waste
• ERs (tCO2e): Per 1000t waste Per MWh– Flaring 41 4.06
– Power displacement 4-10 0.4-1.0
– Total 45-50 4.5-5.0
– Value at $3/tCO2e $135-$151 $13-$15
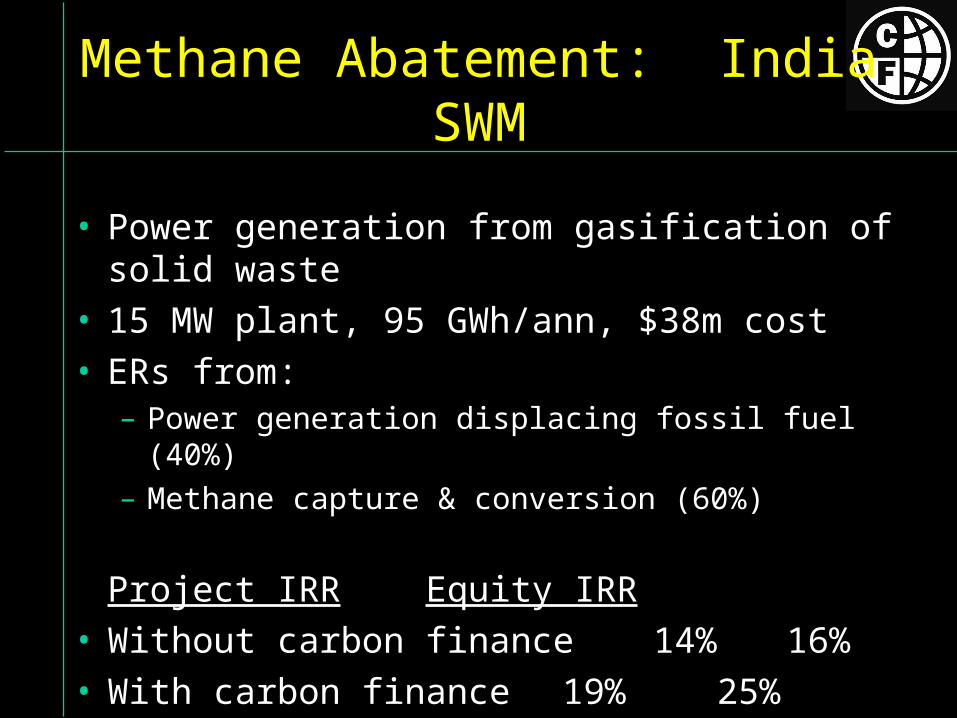
• Power generation from gasification of solid waste• 15 MW plant, 95 GWh/ann, $38m cost• ERs from:
– Power generation displacing fossil fuel (40%)
– Methane capture & conversion (60%)
Project IRR Equity IRR• Without carbon finance 14% 16%• With carbon finance 19% 25%
Methane Abatement: India SWM
Impact of Carbon Finance
0
5 0 0
1 2 3 4 5 6 7 8 9 10 11 12 13 14

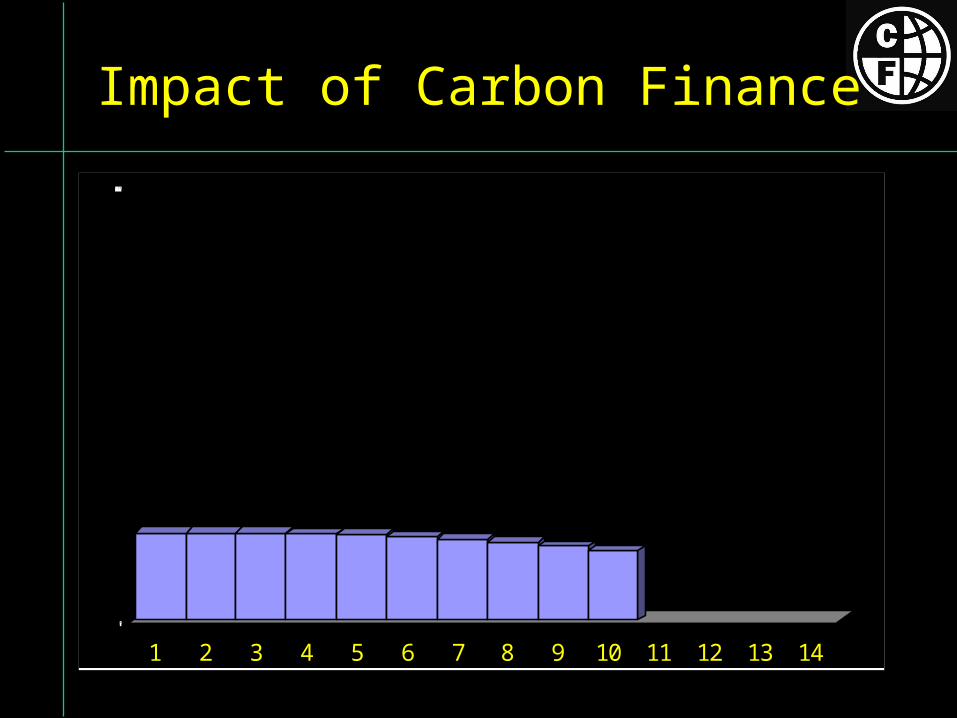
Impact of Carbon Finance
0
5 0 0
1 2 3 4 5 6 7 8 9 10 11 12 13 14
• Increased cash flow boosts IRRs
• High quality cash flow reduces risk
Impact of Carbon Finance

• Increased cash flow boosts IRRs
• High quality cash flow reduces risk– OECD - sourced– $- or €- denominated– Investment grade payorEliminate currency convertibility or transfer risk
Impact of Carbon Finance

• Increased cash flow boosts IRRs
• High quality cash flow reduces risk– OECD - sourced – $- or €- denominated– Investment grade payorEliminate currency convertibility or transfer risk
• Financial engineering helps access capital markets
Impact of Carbon Finance

Host Country
LendersSponsor/ Project
CF
ERPA
Financing Agr.’s
Engagements re:• Regulation (e.g. tariffs)• Kyoto Protocol compliance
Ltr. of Approval
ERs
Basic Deal Structure
ER payment
Debt service
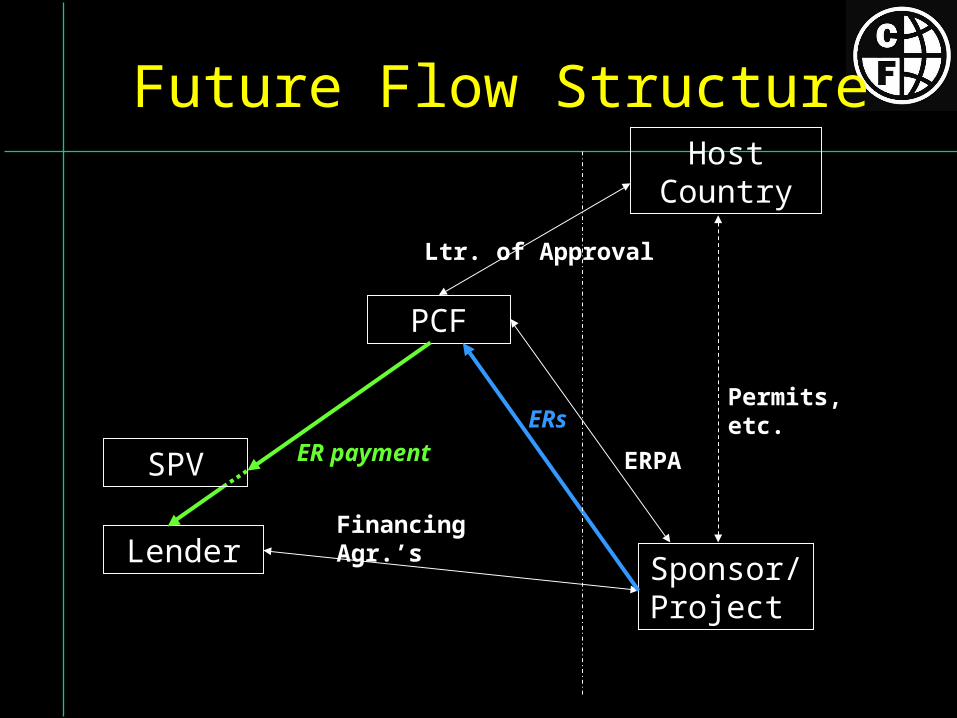
Host Country
Lender Sponsor/ Project
PCF
ERPA
Financing Agr.’s
Ltr. of Approval
ER paymentSPV
ERsPermits, etc.
Future Flow Structure
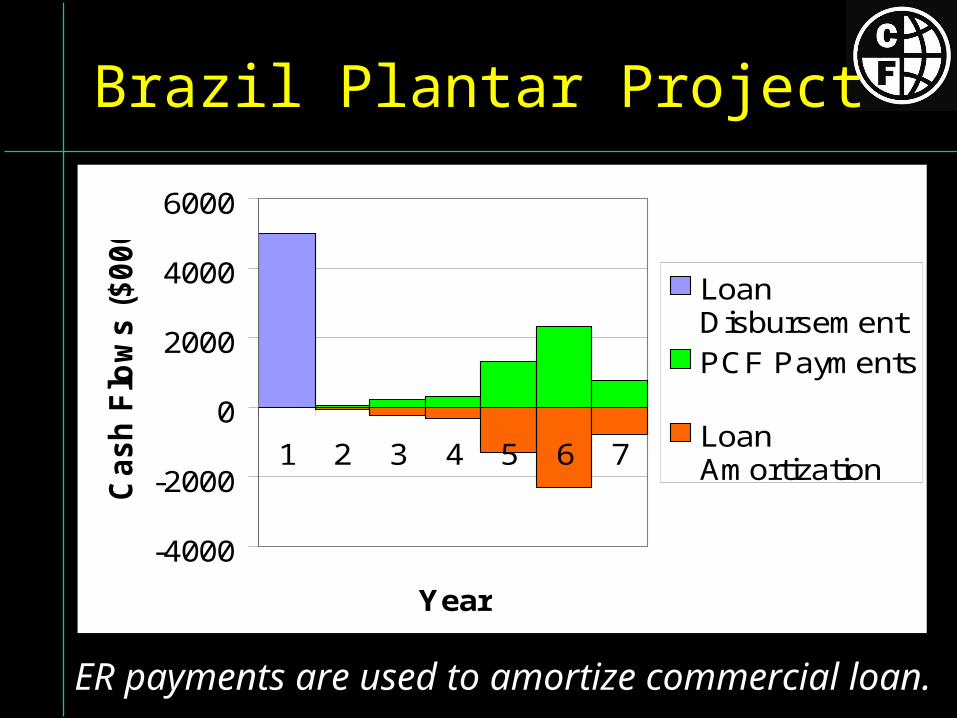
Brazil Plantar Project
-4000
-2000
0
2000
4000
6000
1 2 3 4 5 6 7
Year
Cash
Flo
ws (
$000)
LoanDisbursementPCF Payments
LoanAmortization
ER payments are used to amortize commercial loan.

Risk sharing in WB CF deals
• Project risk: assumed primarily by Seller• Kyoto & Baseline risk: primarily by CF
– Delivery = VERs (not CER/ERU)– JI VERs backed by AAUs– Early crediting– Switch to first track if eligible
• Market risk: assumed entirely by CF• Country risk: shared
– Letter of Approval (ERPA)– Host Country Agreement (JI)
Combining CF with other instruments
• Guarantees
• Subsidy funds

Host Country
LendersSponsor
PCF
ERPA
Financing Agr.’s
Engagements re:• Regulation (e.g. tariffs)• Kyoto Protocol compliance
Ltr. of Approval
ER payment
Project
Future Flow + Guarantee
SPV
ERs
Guaran-tor Counter-guarantee
Guarantee Agr.

Uganda
Lenders
Energy Fund
PCF
ERPA
Financing Agr.’s, Loan
Host Country Agr.
ER payment
Project
Uganda Hydro: Energy Fund
SPV
ERs
IDA
Credit Agr.
Concession, Subsidy
$
$
$
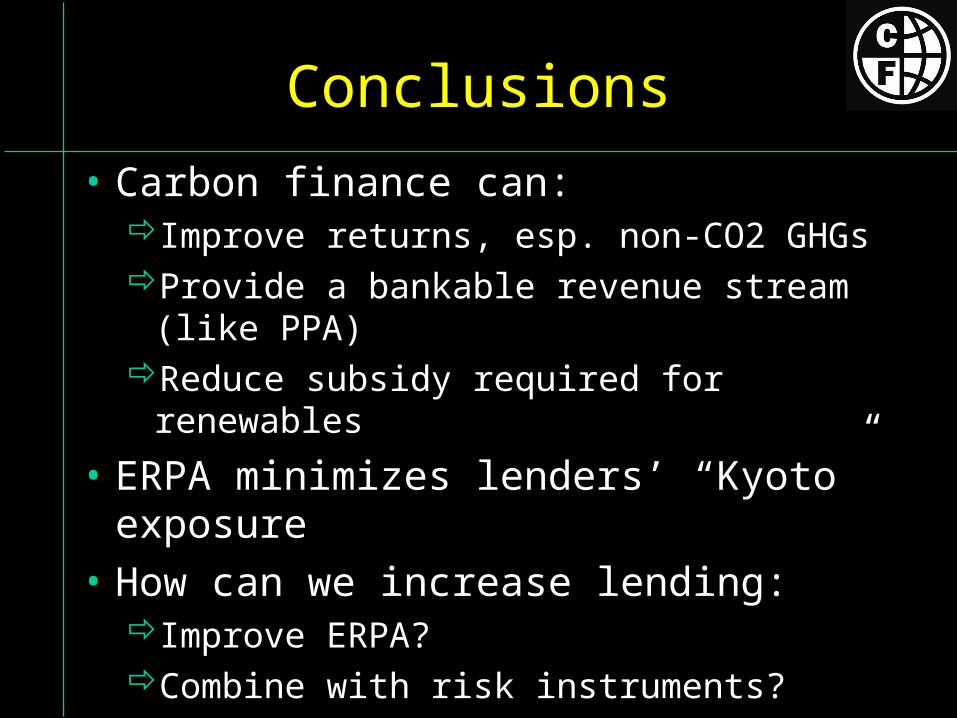
Conclusions
• Carbon finance can:Improve returns, esp. non-CO2 GHGsProvide a bankable revenue stream (like PPA)Reduce subsidy required for renewables
• ERPA minimizes lenders’ “Kyoto” exposure
• How can we increase lending:Improve ERPA?Combine with risk instruments?

Workshop objectives
• Break down risks faced by clean tech projects
• Examine risk instruments
• Consider how to tailor risk instruments to CDM/JI projects
• Agree to move forward
Workshop programme
• Overview
• Case studies
• Risk instruments– Plenary – Breakout groups– Rapportage
• Next steps
Thank you!
www.carbonfinance.org
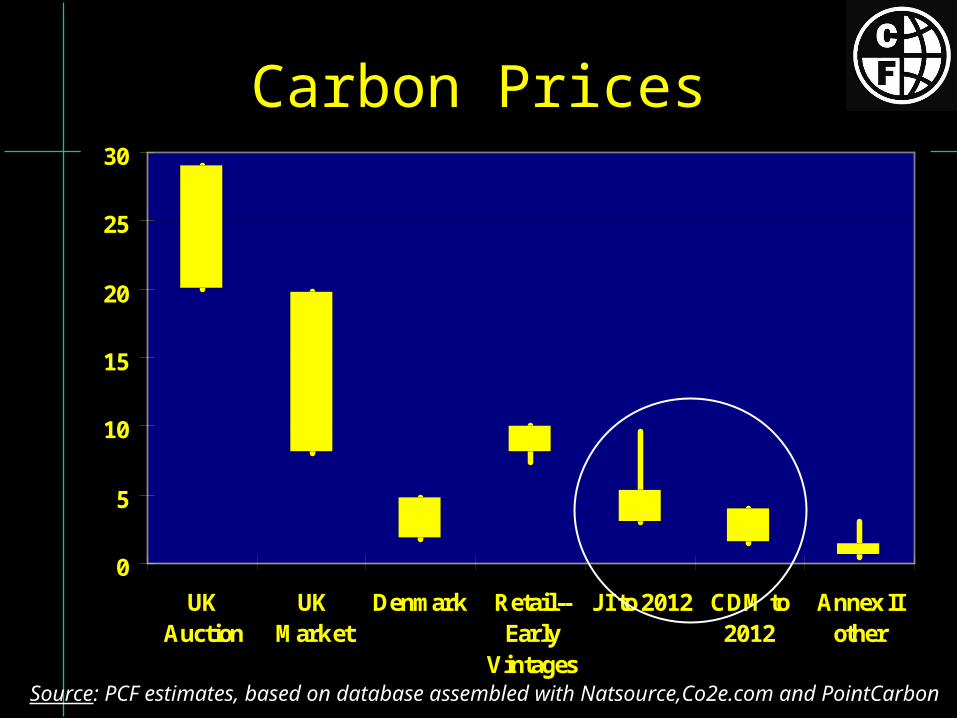
Carbon Prices
0
5
10
15
20
25
30
UKAuction
UKMarket
Denmark Retail--Early
Vintages
JI to 2012 CDM to2012
Annex IIother
Source: PCF estimates, based on database assembled with Natsource,Co2e.com and PointCarbon
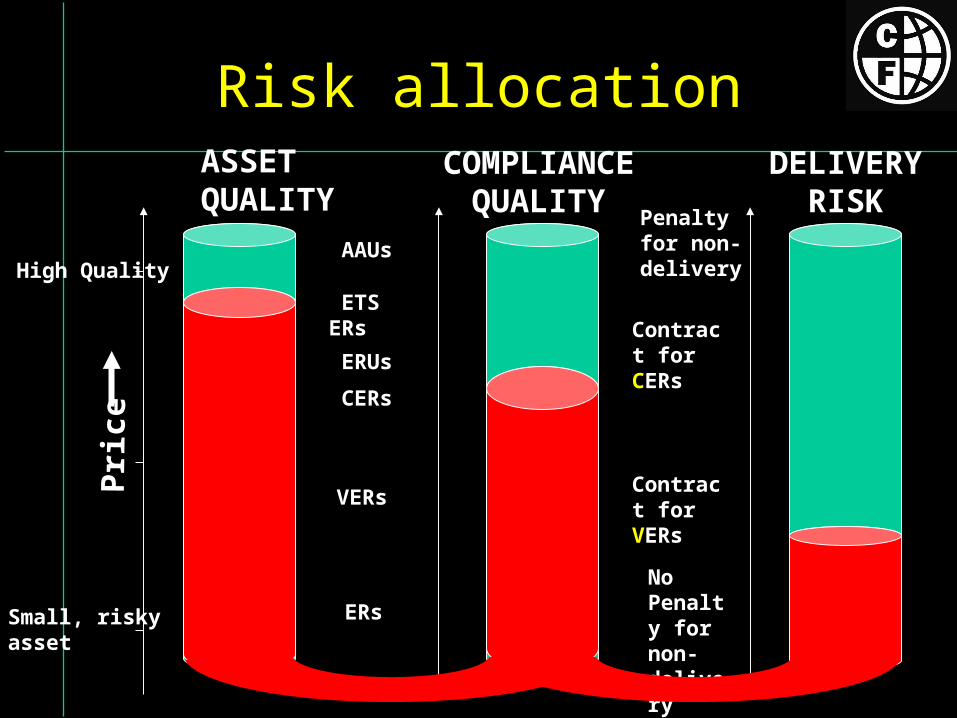
Small, risky asset
High Quality
ASSET QUALITY
CERs
VERs
COMPLIANCE QUALITY
No Penalty for non-delivery
Penalty for non-delivery
DELIVERY RISK
ERs
Risk allocation
AAUs
ERUs
Pri
ce
ETS ERsContract for CERs
Contract for VERs

What accounts for the price range?
• Supply & demand• Compliance quality• Asset quality• Allocation of risks

1. Supply and demand
• Willingness to pay:– price signals / announcements
• C/ERUPT tender signals• penalties: UK >= £20/tCO2e; Denmark max €5/tCO2e• tax benefits• expectations
– additional environmental/social benefits
• Market imperfections: – information – uncertainty esp. Russia, US– short-term supply/demand factors e.g. UK market

2. Compliance quality
• Government allowances• Eligibility: KP, ETS,“green certificates”• 2008-12 ERUs/CERs• Pre-2008 VERs

3. Asset quality
• Delivery risk: – quality of carbon asset (baseline risk)– financial viability of:
• project entity
• sponsor (recourse)
• offtaker (strength of offtake contract or market)
– construction period– contract duration
• Country risk

• Pricing as a function of:– Market conditions (current and projected)– Project, sector and country risk– Volatility of projected ERs (generally related to
baseline and resource risk)– Degree of overcollateralization– Whether KP has been ratified by host country– Upfront payments– Credit enhancement
CF Carbon Prices
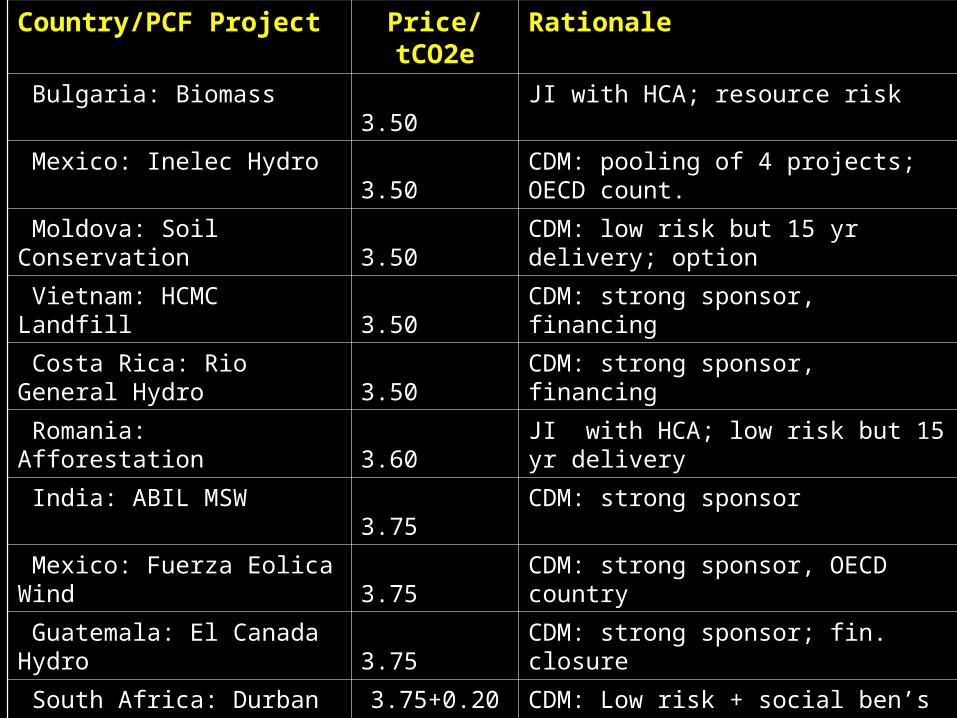
Country/PCF Project Price/tCO2e Rationale Volume 000tCO2e Value US$m
Bulgaria: Biomass 3.50 JI with HCA; resource risk 500 1.75
Mexico: Inelec Hydro 3.50 CDM: pooling of 4 projects; OECD count. 1,857 6.5
Moldova: Soil Conservation 3.50 CDM: low risk but 15 yr delivery; option 1,456+ opt =1,800 5.10
Vietnam: HCMC Landfill 3.50 CDM: strong sponsor, financing 2,500 8.75
Costa Rica: Rio General Hydro 3.50 CDM: strong sponsor, financing 1,800 6.30
Romania: Afforestation 3.60 JI with HCA; low risk but 15 yr delivery 777 2.80
India: ABIL MSW 3.75 CDM: strong sponsor 1,500 5.63
Mexico: Fuerza Eolica Wind 3.75 CDM: strong sponsor, OECD country 2,000 7.50
Guatemala: El Canada Hydro 3.75 CDM: strong sponsor; fin. closure 2,000 7.50
South Africa: Durban MSW 3.75+0.20 CDM: Low risk + social ben’s 3,800 15.01
Colombia: Wind 3.50+0.50 CDM + social ben’s 800 3.20
Bulgaria: District Heating 4.00 JI with HCA; ERPA with Municipality 1,000 3.50
Uganda: Small Hydro (2001) 3.00 CDM; semi-fixed payments 1,300 3.90
Brazil: Seq. & Biomass 3.50 CDM 1,514 5.30
Chile: Small Hydro –firm 3.50 CDM 1,000 3.50
Costa Rica: Renewables 3.50 CDM : umbrella; small projects 547 wind +172 hydro 1.92 +0.60
Chile: Small Hydro –option 3.50+0.75 CDM 750 3.19
Latvia LFGTE (2000) 4.11+ JI : Minimum guaranteed by Host Country 388-602 2.47

World BankCarbon Finance Vehicles
BioCarbon Fund
Netherlands CDM Facility
Development + Carbon = Carbon with a human face
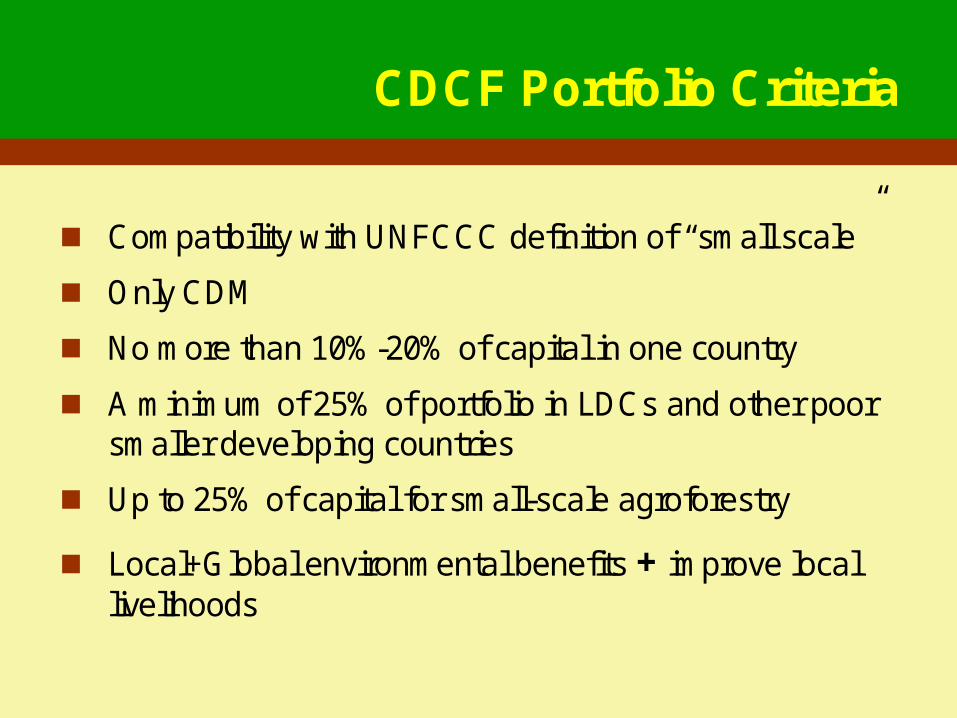
CDCF Portfolio Criteria
Compatibility with UNFCCC definition of “small scale”
Only CDM
No more than 10%-20% of capital in one country
A minimum of 25% of portfolio in LDCs and other poor smaller developing countries
Up to 25% of capital for small-scale agroforestry
Local+Global environmental benefits + improve local livelihoods

BioCarbon Fund
Harnessing the carbon market to sustain ecosystems and alleviate poverty
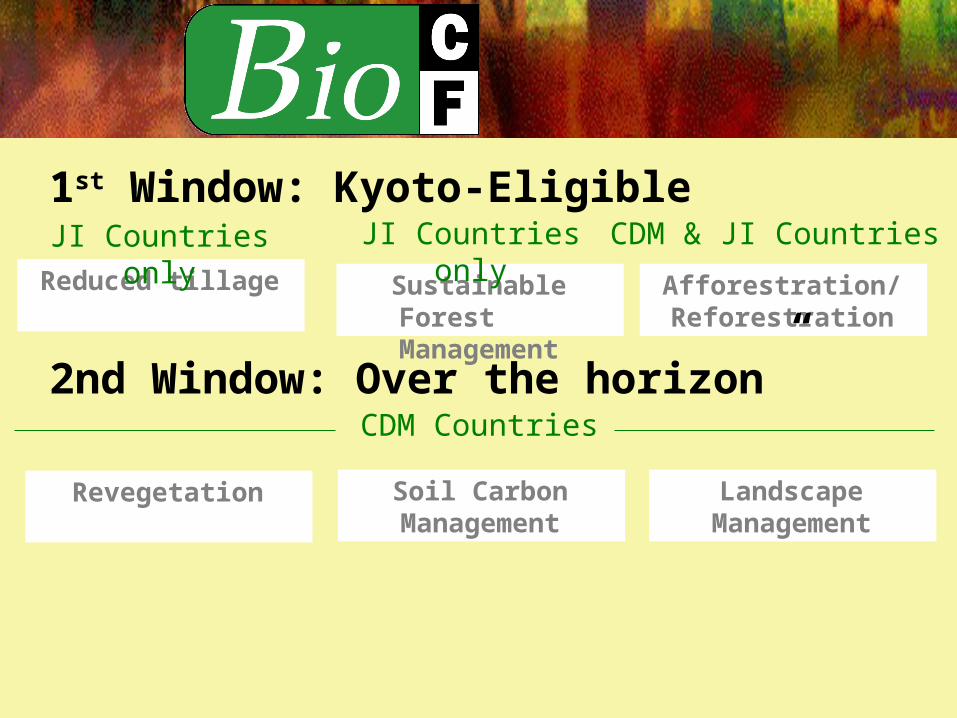
Reduced tillage
JI Countries only
1st Window: Kyoto-Eligible
Sustainable Forest Management
Afforestration/ Reforestration
CDM & JI CountriesJI Countries only
2nd Window: Over the horizon”
Revegetation Soil Carbon Management
Landscape Management
CDM Countries