cats qs l2o layer 2
TRANSCRIPT

CATS L2O Layer Products Quality Statements: Version 2.00
1
CATS L2O Layer Products Quality Statements
Version Release: 2.00
07 July 2017
1.0 Introduction This document offers a general quality assessment of the CATS Level 2 Operational (L2O) Layer data products, as described in CATS Data Product Catalog, and explains the information needed by the science community for accurate and effective use of the CATS data products. We insist that all CATS data users examine this document for the latest updates before publishing any scientific papers using the CATS data products. This document describes the accuracy of CATS data products as determined by the CATS Algorithm Group. The purpose of this data quality summary is to briefly demonstrate significant validation results; inform users of areas that can lead to misinterpretation of the data; provide links to relevant documents describing the CATS data products and algorithms used to generate them; and propose planned algorithm revisions.
2.0 Data Product Maturity The maturity levels of each parameter reported in the CATS L2O Layer data products are identified in this document and may be different for the various parameters since validation efforts and uncertainties of some parameters are different compared to others. The data product maturity levels for the CATS data products, adapted from the CALIPSO maturity levels, are defined in Table 1. Since CATS has only been in operation for one year, the many parameters in the L2O products are still assigned a product maturity level of provisional.

CATS L2O Layer Products Quality Statements: Version 2.00
2
Table 1. CATS Maturity Level Definitions (adapted from CALIPSO)
Beta: Early release products for users to gain familiarity with data formats and parameters. Users are strongly cautioned against the indiscriminate use of these data products as the basis for research findings, journal publications, and/or presentations.
Provisional: Limited comparisons with independent sources have been made and obvious artifacts fixed.
Validated Stage 1: Uncertainties are estimated from independent measurements at selected locations and times.
Validated Stage 2: Uncertainties are estimated from more widely distributed independent measurements.
Validated Stage 3: Uncertainties are estimated from independent measurements representing global conditions.
External:
Data are not CATS measurements, but instead are either obtained from external sources (e.g., GMAO, ISS) or fixed constants in the CATS retrieval algorithm (e.g., calibration altitude).
3.0 Documents and References The following documents provide additional information for data users to reference:
1. The CATS Algorithm Theoretical Basis Document (ATBD) 2. The CATS Data Product Catalog: Release 3.0 (PDF) 3. Overview of L1 Data Processing Algorithms (PDF) 4. CATS Instrument and Project Overview (PDF) 5. CATS Data Read Routine in Interactive Data Language (IDL)
4.0 CATS Operating Modes To meet the project science goals, CATS operates in three different modes using four instantaneous fields of view (IFOV) as shown in Figure 1:
• Mode 7.1: Multi-beam backscatter detection at 1064 and 532 nm, with depolarization measurement at both wavelengths. The laser output is split into two transmit beams, one aimed 0.5º to the left and one 0.5º to the right, effectively making two tracks separated by 7 km (~4.3 mi) at Earth’s surface. This operational mode can no longer be used due to a failure in laser 1 electronics.
• Mode 7.2: Demonstration of HSRL aerosol measurements. This mode was designed to use the injection-seeded laser operating at 1064 and 532 nm to demonstrate a high spectral resolution measurement using the 532-nm wavelength. However, this mode has been limited to 1064 nm backscatter and depolarization ratio because issues with stabilizing the frequency of laser 2 prevent collection of science quality HSRL and 532 nm data.

CATS L2O Layer Products Quality Statements: Version 2.00
3
• Mode 7.3: Demonstration of 355-nm profiling. This mode was designed to use the injection-seeded laser operating at 1064, 532, and 355 nm to demonstrate 355-nm laser performance. Unfortunately, due to an unexpected failure in the laser optical path, CATS will not collect data in this mode.
Figure 1. CATS three main Science Modes for operation, with details of each mode’s capabilities and operational status.
5.0 CATS Level 2O Layer Data Products The CATS L2O Layer data product includes day or night vertical profiles (approximately a half orbit) of geophysical parameters derived from Level 1 data, such as the vertical feature mask and layer-integrated properties (i.e. optical depth, lidar ratio). The main parameters reported in the CATS L2O Layer data product are identification of atmospheric features and optical properties of these layers. Shortly after the CATS Version 2-00 L2O data products for Mode 7.2 were released, three issues were identified in the Version 2-00 L2O data products for Mode 7.2 that have been updated in the L2O V2-01:
1. The new variable “Percent Opacity” was not populated with values in the L2O V2-00 data products.
2. Aerosol layers in direct contact with water clouds were flagged as opaque and the AOD was reported as -1. This was due to an error in the CEAL
CATS L2O Layer Products Quality Statements: Version 2.00
4
(Cloud Embedded in Aerosol Layer) routine and is ONLY the case for aerosol layers in direct contact with water clouds.
3. No optical properties are reported for aerosol layers directly above water clouds in the L2O V2-00 data products because the CEAL routine did not properly sequence the layers by altitude when separating them. This is ONLY an issue for above cloud aerosol layers in direct contact with water clouds and does not impact the vertical feature mask in the L2O V2-00 data products.
Please note that if you are using the L2O V2-00 data for applications other than aerosol near clouds and atmospheric opacity, then you will not see any difference between L2O V2-00 and V2-01. 5.1 Layer Descriptors and Feature Type Number of Layers The number of layers found in a specific 5 km profile. The CATS layer detection is performed following the methodology described in the CALIOP Algorithm Theoretical Basis Document. It is a threshold-based layer detection method that uses the 1064 nm attenuated scattering ratio, unlike the CALIPSO algorithm that uses 532 nm. The CATS L2O V1-05 layer detection algorithm only performed layer detection at a single horizontal resolution of 5km horizontal (60m vertical), while the CALIOP algorithm will successively run the profile scanner at coarser and coarser horizontal resolutions ranging from 5 km to 80 km in order to detect increasingly tenuous layers. Strongly scattering layers are more accurately detected than weakly scattering layers, especially during daytime. Because signal-to-noise ratios (SNR) are higher during nighttime compared to daytime, nighttime detection of features is easier than daytime. This is typical for all lidar systems. Comparisons of global aerosol detection frequencies and thin cloud fractions with CALIPSO V4.10 exhibited a lack of detection of thin cirrus clouds and aerosol layers in CATS L2O V1-05, especially over land during daytime. The CATS V2-00 L2O data now includes layer detection at both 5 and 60 km horizontal resolutions, as well as a parameter that specifies the horizontal resolution a layer was detected at. The reported number of layers, and corresponding layer properties are the merged product of layers detected at both 5 and 60 km. Layers detected at 60 km are reported in the 12 corresponding 5 km profiles, with the same top and base altitudes. The CATS V2-00 L2O data now reports more layers than the V1-05, especially during daytime over land. Initial comparisons of CATS V2-00 and CALIPSO V4.10 cloud and aerosol detection frequencies are much more favorable during daytime. For CATS, the layer detection is performed using the 1064 nm backscatter signal for two main reasons:
1) The CATS 1064 nm minimum detectable backscatter is lower than 532 nm, making it a better option for more accurate layer identification (Tables 4.1 and 4.2).
2) For absorbing aerosols, the absorption optical thickness increases with decreasing wavelength. This effect reduces the backscattered signal at 532 nm with respect to

CATS L2O Layer Products Quality Statements: Version 2.00
5
1064 nm, such that the 532 nm backscatter is not sensitive to entire vertical extent of the aerosol layer. Because the 1064 nm wavelength is only minimally affected by aerosol absorption, the vertical extent of the absorbing aerosol layer is more fully captured from 1064 nm backscatter profiles rather than those from 532 nm.
Since CATS can detect the full vertical extent of the aerosol layer above the cloud, it is extremely important that the algorithm also distinguish these as two separate layers. The CATS layer detection algorithm includes a Cloud-Embedded in Aerosol Layer (CEAL) routine to identify clouds embedded within aerosol layers by searching for a significant change in the vertical structure of the 1064 nm ATB. The CATS V2-00 L2O data now separates layers that show distinct differences or layering in depolarization ratio. This is common when dust aerosols are directly above and in contact with marine aerosols, or when thick clouds contain both ice particles near the top of the cloud and liquid water particles near cloud base. A second CEAL routine of the CATS layer detection algorithm was created to separate such a layer into 2 layers if a significant change in the vertical structure of the depolarization ratio is observed. This results in more layers detected in CATS V2-00 L2O, and more accurate aerosol typing and cloud phase determination. More information on the CATS layer detection algorithms is located in the CATS ATBD. The CATS false positive rejection scheme utilizes the feature-integrated backscatter (FIB) of layers and the horizontal persistence of layers as criteria for rejecting layers. Horizontal Resolution of Layer Detection The horizontal resolution an atmospheric layer was detected at is reported for each atmospheric layer within a 5 km profile. The values correspond to the horizontal resolution needed to detect that specific layer. There are only three values that can be reported:
• 0 = a layer was not detected • 5 = the layer was detected at 5 km • 60 = the layer was detected at 60 km
Layers detected at 60 km are common in the CATS L2O V2-00 daytime data, but rarely reported in the nighttime data, as these layers are typically detected at 5 km. Layer Top Bin Layer Base Bin The bin number at the layer top and base altitudes are reported in for every layer within a 5 km profile. The uncertainties associated with determining layer top and base locations are detailed in the CALIPSO Feature Detection ATBD (PDF). There are a few general guidelines users should be aware of when using these products:
• Strongly scattering layers are more accurately detected than weakly scattering layers.
• Because signal-to-noise ratios (SNR) are higher during nighttime compared to daytime, nighttime detection of features is easier than daytime. This is typical for all lidar systems.
• Detection of the highest layer in a 5 km profile is more reliable than lower layers in a multi-layer scene.

CATS L2O Layer Products Quality Statements: Version 2.00
6
• The base bin/altitude reported may not be the true base. For highly scattering features, the layer base may appear lower than it really is due to multiple scattering effects. Also, opaque layers that completely attenuate the backscatter signal will cause the reported base to be higher than reality.
For L2O V1-04 and later, the layer base bin is decreased by one bin (increase in height) when the base bin is directly above the surface detection. This was done to avoid contamination of the layer-integrated properties of the layer from the surface return signal. Layer Top Altitude (Validated Stage 1) Layer Base Altitude (Validated Stage 1) Layer top and base altitudes, units of kilometers above mean sea level, are reported in for every layer within a 5 km profile. CATS measures the layer top and base altitude to within 60 meters, a function of the on-board data averaging scheme. The CATS Version 2-06 L1B data release included an error in the algorithm that remaps the raw CATS data to the final CATS data frame (-2.0 to 30.0 km at 60 m vertical resolution). The error caused certain bins in Mode 7.2 to contain the same value of backscatter as the bin above. As a result, layer top and base heights are never detected at these bins in the V1-03 of the L2O data products. For CATS L1B V2-07 and L2O V1-04, this error has been corrected. Users that are analyzing cloud and aerosol top/based height distributions are advised to use the L1B V2-07 and L2O V1-04 data or later for their analysis. Please note that when using a small amount of data (several granules), layer detection may still favor some bins over others due to interpolation from the raw 78 m vertical bins to the 60 m vertical bins reported in the data products. This affect is very minimal when using large amounts of data (>200 granules). For V2-00, layers detected at 60 km are reported in the 12 corresponding 5 km profiles, with the same top and base altitudes. Layer Top Temperature Layer Base Temperature Temperature, in degrees C, at the layer top/base altitude reported for each 5 km L2O profile. NASA Goddard Earth Observing System version 5 (GEOS-5) forecasts provided by the NASA Global Modeling and Assimilation Office (GMAO) deliver a forecast of the atmospheric temperature and pressure profiles for 72 vertical levels (0-85 km AGL) at a horizontal resolution of 10 seconds that is subset along the ISS orbit track. These parameters are read in from the L1B data product and interpolated to the CATS 5 km L2O horizontal resolution. Temperature values are interpolated from the ancillary meteorological data provided by the GMAO. Layer Top Pressure Layer Base Pressure Pressure, in millibars, at the layer top/base altitude reported for each 5 km L2O profile. Pressure values are interpolated from the ancillary meteorological data provided by the GMAO. Feature Type (Validated Stage 1) An assessment of the feature type (e.g., cloud vs. aerosol) is reported for each

CATS L2O Layer Products Quality Statements: Version 2.00
7
atmospheric layer found within a 5 km profile. The values that correspond to specific feature types are shown in Table 2. A comprehensive description of the feature types, including their derivation and physical significance, quality assessments, and guidelines for interpreting them can be found in the CATS ATBD. For L2O V1-04, layers with a base above the tropopause height, or layers with a top above the tropopause height and weak backscatter (IATB < 0.005) are considered aerosols. Previous versions used 18 km as the threshold and not the tropopause height.
Table 2. Definitions of the CATS Feature Type Parameter Interpretation of Values 0 = Invalid 1 = Cloud 2 = Undetermined 3 = Aerosol
Based on statistical comparisons of CATS L2O V1-05 cloud and aerosol detection frequencies with CALIPSO, and aerosol type with GEOS-5, it was determined that the CATS Cloud-Aerosol Discrimination (CAD) algorithm was incorrectly classifying liquid water clouds as lofted dust mixture or smoke aerosols. This is partly due to enhanced depolarization ratios within water clouds due to multiple scattering, and an inability to utilize the backscatter color ratio in the CAD algorithm due to the noisy 532 nm backscatter data. Since true lofted dust and smoke layers tend to have large horizontal extent, a horizontal persistence test was added to the CATS Cloud-Aerosol Discrimination (CAD) algorithm for L2O V2-00 to identify liquid water clouds with enhanced depolarization ratios of small horizontal extent and correctly classify them as clouds. The result is a reduction of dust mixture and smoke aerosol detection over remote parts of the Earth’s oceans in CATS L2O V2-00 data. Cloud Phase (Validated Stage 1) For each atmospheric layer defined as a cloud in the feature type parameter, an assessment of the cloud phase (e.g., ice vs. liquid water) is reported. The values that correspond to specific cloud phases are shown in Table 3. A comprehensive description of the cloud phases, including their derivation and physical significance, quality assessments, and guidelines for interpreting them can be found in the CATS ATBD. Statistical comparisons of CATS V1-05 ice and water cloud detection frequencies with CALIPSO V4.1 data yield very similar results.
Table 3. Definitions of the CATS Cloud Phase Parameter Interpretation of Values 0 = invalid 1 = water cloud 2 = unknown cloud phase 3 = ice cloud
Aerosol Type (Validated Stage 1)

CATS L2O Layer Products Quality Statements: Version 2.00
8
For each atmospheric layer defined as an aerosol in the feature type parameter, an assessment of the aerosol type is reported. The values that correspond to specific aerosol types are shown in Table 4. A comprehensive description of the aerosol types, including their derivation and physical significance, quality assessments, and guidelines for interpreting them can be found in the CATS ATBD.
Table 4. Definitions of the CATS Aerosol Type Parameter Interpretation of Values 0 = Invalid 1 = Marine 2 = Polluted Marine 3 = Dust 4 = Dust mixture 5 = Clean/Background 6 = Polluted Continental 7 = Smoke 8 = Volcanic
For aerosols, the feature subtype is one of eight types: invalid, marine, polluted marine, dust, dust mixture, clean/background, polluted continental, smoke, and volcanic. Smoke aerosols consist primarily of soot and organic carbon (OC), while clean/background is a lightly loaded aerosol consisting of sulfates (SO42-), nitrates (NO3-), OC, and Ammonium (NH4+). Polluted continental is background aerosol with a substantial fraction of urban pollution. Marine is a hygroscopic aerosol that consists primarily of sea-salt (NaCl), whereas polluted marine is a mixture of marine with smoke, dust or polluted continental aerosols. Dust mixture is a mixture of desert dust and smoke or urban pollution (polluted continental). If the CATS observables do not clearly indicate one of these 8 aerosol types, the aerosol layer is interpreted as “invalid”. The CATS L2O V1-05 aerosol typing algorithm was unable to classify polluted continental aerosols over water, as the algorithm required surface type and layer elevation and thickness criteria for discriminating spherical smoke and polluted continental aerosols owing to similarity between backscatter and depolarization properties. Therefore, in the V2-00 aerosol typing algorithm, simulated aerosols from the NASA Goddard Earth Observing System version 5 (GEOS-5) model are incorporated to help discriminate smoke from polluted continental aerosols when CATS observations (surface type, layer elevation, and layer thickness) alone could not identify an aerosol type for spherical aerosols. Aerosols in GEOS-5 are constrained by the utilization of the MODIS derived Quick Fire Emission Database (QFED) for carbonaceous aerosols, the use of advanced emission inventories of nitrates and sulfates, and through the assimilation of MODIS Aerosol Optical Thickness (AOT) for constraining the aerosol loading. The CATS aerosol typing routine for L2O V2-00 now employs the GEOS-5 aerosol speciation information sampled along the ISS track to assist the algorithm in differentiating smoke aerosols from polluted continental aerosols over land only when

CATS L2O Layer Products Quality Statements: Version 2.00
9
GEOS-5 simulates an aerosol layer within the detection limits of CATS at the exact altitude of the CATS observed aerosol layer. The result is an increase of polluted continental aerosol detection, particularly over water, and a decrease in smoke aerosol detection over highly populated regions of the Earth (China, Europe, Eastern U.S.) in CATS L2O V2-00 data. Comparing the frequency of occurrence of aerosol type between CATS and CALIPSO, it was determined that CATS had a high bias in smoke layers in regions where smoke is known to mix with dust (e.g. south Asia). Therefore, CATS depolarization-based thresholds for classifying dust and dust mixture were reduced from 0.30 and 0.20 to 0.25 and 0.15, respectively. Superficial “striping” is also visible in the CATS L2O V1-05 aerosol type browse images for horizontally homogeneous dust and smoke aerosol layers. Horizontal persistence tests were added to the CATS aerosol typing algorithm to avoid this “striping” and report aerosol types that are more consistent with the profiles in an 80 km range surrounding a specific 5 km CATS L2O V2-00 profile. Sky Condition (Validated Stage 1) For each 5 km profile, an assessment of the sky condition (e.g., cloudy vs. clear) of the column is reported. The values that correspond to specific sky conditions are shown in Table 5. A comprehensive description of the algorithms used to determine feature types can be found in the CATS ATBD.
Table 5. Definitions of the CATS Sky Condition Parameter Interpretation 0 = clean skies (no clouds/aerosols) 1 = clear skies (no clouds) 2 = cloudy skies (no aerosols) 3 = hazy/cloudy (both clouds/aerosols)
Percent Opacity (Provisional) The quantification of opacity is reported for each 5 km CATS L2O V2-00 profile. The values correspond to the fraction of the total number of L1B 350 m profiles that make up that L2O 5 km profile in which no surface return was detected. For CATS, a profile is considered opaque if no surface return is detected in all L1B 350 m profiles that make up that L2O 5 km profile. The opacity flag has a value of either 1 (opaque profile) or 0 (transparent profile). Thus, the percent opacity will be 1.0 for opaque profiles, and some value less than 1.0 for transparent profiles. Please note that the opacity flag distinguishes when the backscatter signal becomes completely attenuated due to that feature. 5.2 Layer-Integrated Properties Integrated Attenuated Backscatter (1064 nm – Validated Stage 1, 532 nm - Provisional)

CATS L2O Layer Products Quality Statements: Version 2.00
10
The integrated attenuated backscatter (IAB or g’), which has units of sr –1 and is reported at 532 and 1064 nm for each atmospheric layer within a 5 km profile. The primary sources of uncertainty in the CATS IAB are the calibration constant, signal noise, and accuracy of the top and base determination. However, there are a few things CATS data users should be aware of:
1. The CATS backscatter signal is more robust at 1064 nm than 532 nm. For Mode 7.1, this is attributed to the fact that the laser is outputting more energy at 1064 nm (1.40 mJ compared to 0.88 mJ at 532 nm). For Mode 7.2, data at 532 nm is noisy due to issues with stabilizing the seeded laser (laser 2). Since the frequency stability is poor on laser 2, it is not aligned properly with the CATS etalon causing very weak signal transmission.
2. Both CATS wavelengths in daytime conditions have lower signal to noise ratio (SNR) and higher minimum detectable backscatter for Mode 7.1 than nighttime. The poorer performance during daytime is due to solar background noise, typically an issue for daytime operation of any lidar.
3. The low depolarization purity of CATS measurements at 532 nm, if uncorrected, causes a high bias in the integrated values of backscatter and depolarization ratio at 532 nm, as well as a low bias in the 1064-532 backscatter color ratio. This data is corrected for the poor depolarization purity at 532 nm, but biases in the 532 nm layer-integrated products (attenuated backscatter, color ratio, and depolarization ratio) of 5-10% still remain.
4. Initial telescope alignment procedures were conducted 5-9 February, 2015 for the LFOV and RFOV. The result was slightly better alignment in the RFOV optical path, as minimum datable backscatter for the RFOV was 10% lower than the LFOV for data up to 09 March 2015. Additional telescope alignment procedures for the LFOV in early March reversed the affect. Thus, the LFOV signal is more robust for data after 09 March, 2015. Users should keep this in mind when comparing data from the two IFOVs.
5. The 1064 nm signal in mode 7.2 is very robust, with higher SNR and lower minimum detectable backscatter than the Mode 7.1 data. We highly recommend using the 1064 nm data for any analysis that is wavelength-independent (i.e. layer detection, relative backscatter intensity).
The backscatter calibrations at both 532 and 1064 nm have been improved for CATS V2-08 L1B and V2-00 L2O data. Detailed comparisons of CATS L1B V2-07 1064 nm attenuated total backscatter data with CALIPSO 1064 nm data and modeled Rayleigh 1064 nm profiles revealed a low bias in CATS L1B V2-07 attenuated total backscatter values due to higher uncertainties in the correction for molecular folding than expected. For L2O V2-00, the molecular folding correction factor, alpha, is computed every 10 seconds (as opposed to once per granule in earlier versions) and more iterations were added. In addition, the altitude range for computing solar background counts was changed to 33-35 km to remove effects of multiple scattering from liquid water clouds near the surface. The molecular folding slope (22-26 km) and calibration (now 22-26 km) altitudes were also adjusted for more accurate estimates and consistency with one-another. These changes result in CATS 1064 nm attenuated total backscatter (Mode 7.2)

CATS L2O Layer Products Quality Statements: Version 2.00
11
that compare very favorably with CALIOP and modeled Rayleigh profiles at the same wavelength. Given that the 1064 nm attenuated total backscatter is used to retrieve nearly all L2O data products, especially the layer-integrated attenuated backscatter, the accuracy of these products has also improved. Integrated Attenuated Backscatter Uncertainty (Provisional) For version 1.05, the uncertainty in the integrated attenuated backscatter contains fill values (-999.9). For V2-00, the uncertainty in the integrated attenuated backscatter is reported for each layer within a 5 km profile. The values reported are absolute uncertainties, not relative, thus the units are identical to the units of the integrated attenuated backscatter (sr –1). Attenuated Backscatter Statistics This variable reports the minimum, maximum, mean, and standard deviation of the 532 and 1064 nm attenuated total backscatter coefficients for each layer within a 5 km profile, in units km –1 sr –1. Integrated Volume Depolarization Ratio (Validated Stage 1) Pulsed lasers, such as the ones used in the CATS instrument, naturally produce linearly polarized light. Using a beam splitter in the receiver optics, the perpendicular and parallel planes of polarization of the backscattered light are measured. The integrated volume depolarization ratio is defined as the ratio of perpendicular integrated attenuated backscatter to parallel integrated attenuated backscatter, and has values between 0.2 and 0.6 for non-spherical particles such as ice crystals. Deriving accurate depolarization ratios from CATS data requires knowledge of the relative gain between the perpendicular and parallel channels of the CATS receiver, referred to as the polarization gain ratio (PGR). Integrated volume depolarization ratios are reported for each layer within a 5 km profile. When the CATS laser begins operation after being turned off (for ISS activities, instrument reboots, etc.), the laser polarization is not pure. This results in inaccurate integrated volume depolarization ratios for several granules, depending on how long the laser was off, until the laser polarization stabilizes. CATS Version 2-00 L2O data includes a new Depolarization Quality Flag (Section 5.9) to notify users of granules with depolarization ratio values of poor quality. Integrated Volume Depolarization Ratio Uncertainty (Provisional) For version 1.05, the uncertainty in the integrated volume depolarization ratio contained fill values (-999.9). For V2-00, the uncertainty in the integrated volume depolarization ratio is reported for each layer within a 5 km profile. The values reported are absolute uncertainties, not relative. Volume Depolarization Ratio Statistics This variable reports the minimum, maximum, mean, and standard deviation of the 532 and 1064 nm volume depolarization ratio for each layer within a 5 km profile. Integrated Spectral Depolarization Ratio (Provisional)

CATS L2O Layer Products Quality Statements: Version 2.00
12
The integrated spectral depolarization ratio (Mode 7.1 data only) is defined as the ratio of 1064 nm integrated volume depolarization ratio to 532 nm integrated volume depolarization ratio, and can help determine aerosol layer types as outline in the CATS ATBD. Integrated spectral depolarization ratios are reported for each layer within a 5 km profile. CATS users should be aware of the new Depolarization Quality Flag (Section 5.9) for V2-00 L2O data that specifies granules with depolarization ratio values of poor quality. Integrated Spectral Depolarization Ratio Uncertainty (Provisional) For version 1.05, the uncertainty in the integrated spectral depolarization ratio (Mode 7.1 data only) contains fill values (-999.9). For V2-00, the uncertainty in the integrated spectral depolarization ratio is reported for each layer within a 5 km profile. The values reported are absolute uncertainties, not relative. Spectral Depolarization Ratio Statistics This variable reports the minimum, maximum, mean, and standard deviation of the spectral depolarization ratio (Mode 7.1 data only) for each layer within a 5 km profile. Integrated Attenuated Total Color Ratio (Provisional) The integrated attenuated total color ratio is defined as the ratio of 1064 nm integrated attenuated backscatter to 532 nm integrated attenuated backscatter, and can help distinguish cloud and aerosol layers as outline in the CATS ATBD. Integrated attenuated total color ratios are reported for each layer within a 5 km profile. For V2-00, the algorithms for backscatter calibration and molecular folding correction were updated for Mode 7.1 at both 532 and 1064 nm just as they were in Mode 7.2. More iterations were added to the molecular folding computation, and the altitude range for computing solar background counts, molecular folding slope, and calibration were all changed to 22-26 km, making all three computations consistent. This results in CATS 532 and 1064 nm attenuated total backscatter, and thus integrated attenuated total color ratio (in Mode 7.1), that compare very favorably with CALIOP and modeled Rayleigh profiles at the same wavelength. Integrated Attenuated Total Color Ratio Uncertainty (Provisional) For version 1.05, the uncertainty in the integrated attenuated total color ratio contains fill values (-999.9). For V2-00, the uncertainty in the integrated attenuated total color ratio is reported for each layer within a 5 km profile. The values reported are absolute uncertainties, not relative. Attenuated Total Color Ratio Statistics This variable reports the minimum, maximum, mean, and standard deviation of the total color ratio for each layer within a 5 km profile. 5.3 Layer Optical Properties Measured Two-Way Transmittance

CATS L2O Layer Products Quality Statements: Version 2.00
13
The measured two-way particulate transmittance is reported for each layer where an extinction profile could be calculated within a 5 km profile. The measured two-way particulate transmittance for a layer is the ratio of the two-way particulate transmittance at the bottom of the layer and the two-way particulate transmittance at the top of the layer, and typical values are between 0 and 1. Measured Two-Way Transmittance Uncertainty For version 1.05, the uncertainty in the measured two-way transmittance contains fill values (-999.9). For V2-00, the uncertainty in the measured two-way transmittance are reported for each layer within a 5 km profile. The values reported are absolute uncertainties, not relative. Two-Way Transmittance Measurement Region The two-way transmittance measurement region, reported in km, defines the "clear air" region immediately below the layer used to compute the measured two-way transmittance to derive the constrained lidar ratio of a layer. Feature Optical Depth (1064 nm – Validated Stage 1, 532 nm - Provisional) The optical depth of all atmospheric particulate layers, clouds, and aerosol throughout the column are reported for each 5 km profile. The optical depths are obtained by integrating the 532 (Mode 7.1 only) and 1064 nm cloud and/or aerosol extinction within the layer. Since the feature optical depths are a layer integral product, any large uncertainties or poor extinction retrievals from bins within the layer will propagate downward and may impact the quality of all the feature optical depths. Therefore, users are strongly encouraged to use the feature optical depth uncertainties, extinction QC flag, and feature type score to assess the quality of the feature optical depths. CATS data users should be aware of three main things when using feature optical depth data:
1. CATS is only capable of penetrating to the layer base if the total feature optical depth is less than ~4. If the feature is opaque to the lidar, then the reported feature optical depths are set to -1.0 because the lidar is only measuring the apparent base of the layer, not the true optical depth of the layer.
2. The extinction QC values for the layer should be examined to determine if the extinction retrievals were bad. In general, solutions where the final lidar ratio is unchanged (extinction QC = 0) yield physically plausible solutions more often.
3. Features with invalid or undetermined feature type, cloud phase, or aerosol type, may have erroneous optical depths.
The optical depth of all atmospheric features are reported for each particulate layer (clouds and aerosols) regardless of the lidar ratio selection method. Histograms of CATS L2O V1-05 cirrus optical depth exhibit a peak in the frequency distribution around a COD of 2.7 as a result of the CATS “modified default” lidar ratio algorithm. This issue is only apparent in CATS L2O V1-05 data when computing extinction and optical depth in cases where the lidar ratio was iteratively reduced in order to process to the bottom of the layer (Extinction QC_Flag = 2 [transparent] or 7 [opaque]). The algorithm was updated

CATS L2O Layer Products Quality Statements: Version 2.00
14
for CATS L2O V2-00 to change the amount that the lidar ratio gets modified from a fixed value of 0.5 to the current lidar ratio adjusted by a scale factor. The value of scale factor is related to the two-way transmittance of the last high quality bin and/or the relative progress through the layer of the last high quality bin, depending on the situation. For cases where the lidar ratio was increased in order to stay within transmittance bounds (Extinction QC Flag= 3), the interval of the iteration remains a fixed value of 0.5. Given the improvements in the quality of the CATS backscatter data, the CATS layer effective multiple scattering factor for ice clouds was updated in V2-00 products to 0.65 (Mode 7.2). This change will also impact the retrievals of feature optical depth. The values for Mode 7.1 remained the same (0.423 at 1064 nm and 0.545 at 532 nm).
Feature Optical Depth Uncertainty (Provisional) There are three main sources (ignoring multiple scattering) of the uncertainty in the feature optical depth, estimated at each wavelength:
• signal-to-noise ratio (SNR) within a layer • calibration accuracy • accuracy of the lidar ratio used in the extinction retrieval
Except for constrained solutions, where a lidar ratio estimate can be obtained directly from the attenuated backscatter data, lidar ratio uncertainties are almost always the dominant contributor to optical depth uncertainties, and the relative error in the layer optical depth will always be at least as large as the relative error in the layer lidar ratio. For version 1.05, the uncertainty in the feature optical depth contains fill values (-999.9). For V2-00, the uncertainty in the feature optical depths is reported for each layer within a 5 km profile. The values reported are absolute uncertainties, not relative. Lidar Ratio The particulate extinction-to-backscatter ratio, or lidar ratio, is required to retrieve extinction and backscatter coefficient profiles, as well as optical depth from CATS measurements. There are 4 basic categories of lidar ratio input sources: constrained, unconstrained default, modified default, and opaque. The lowest uncertainties are found for transparent layers in which the AOD, and thus extinction coefficient, can be directly retrieved (or “constrained”) using the transmission loss through the layer. All other cases require a default value based on the type and subtype of the layer being analyzed. CATS ice cloud lidar ratios are assigned based on relationships with layer integrated depolarization ratio and geographic location, shown in Table 6, as retrieved from CPL and CALIPSO data. Values of 18.0 sr and 22.0 sr are used for liquid water clouds and clouds of unknown phase, respectively. For aerosols, the lidar ratio is assigned from a look-up table based on the aerosol type and the values are very similar to those used in CALIPSO, CPL and GLAS algorithms, as shown in Table 7. If this lidar ratio remains unmodified through the solution process, we describe this category as “unconstrained default” or just default.

CATS L2O Layer Products Quality Statements: Version 2.00
15
Table 6: CATS Ice Cloud Default Lidar Ratios Location Land Type Sp
Mid-Latitude Land 24.0 Mid-Latitude Ocean 30.0
Tropics Land 28.0 Tropics Ocean 32.0
Using the constrained technique, CATS V1-05 data yielded mean smoke and dust lidar ratios at 1064 nm of 42 and 38 sr, respectively. Given this value for dust, and the CALIPSO V4.1 default 1064 nm lidar ratios for dust of 44 sr, the CATS L2O V2-00 default lidar ratio values for dust and dust mixture have been changed to 40 sr (Table 7). Also due to recent results from AERONET and CALIPSO V4.1 default 1064 nm lidar ratios for marine of 23 sr, the CATS L2O V2-00 default lidar ratio values for marine and marine mixture have been changed to 25 and 30 sr, respectively (Table 7). This parameter reports the lidar ratio in use at the conclusion of the extinction processing for each layer, equivalent to the “Final Lidar Ratio” in CALIPSO data products.
Table 7: CATS Aerosol Default Lidar Ratios
Aerosol Type 532 nm V1 1064 nm V2 1064 nm Marine 25.0 45.0 25.0
Marine Mixture 45.0 40.0 30.0 Dust 45.0 55.0 40.0
Dust Mixture 35.0 45.0 40.0 Clean/Background 55.0 35.0 35.0
Polluted Continental 65.0 35.0 35.0 Smoke 70.0 40.0 40.0
Volcanic 45.0 35.0 35.0 Ice Water Path (1064 nm – Validated Stage 1, 532 nm - Provisional) Ice water path (IWP) is the integral of ice water content (IWC) from ice cloud layer top to layer base, reported for each ice cloud layer within a 5 km profile. Ice water path has units of gm –2. For Mode 7.2 data, only the 1064 nm IWP is reported. For Mode 7.1 data, both the 532 and 1064 nm IWP is reported. The IWC is calculated as a parameterization function of the CATS ice particle extinction retrievals as outlined in the CATS ATBD. Ice Water Path Uncertainty (Provisional) For version 1.05, the uncertainty in the IWP contains fill values (-999.99). For V2-00, the uncertainty in the IWP is reported for each ice cloud layer within a 5 km profile. The values reported are absolute uncertainties, not relative, thus the units are identical to the units of the IWP (gm –2). Layer Effective Multiple Scattering Factor (Provisional)

CATS L2O Layer Products Quality Statements: Version 2.00
16
The layer effective multiple scattering factors, for each layer within a 5 km profile, are reported at each wavelength according to layer type and subtype. Values range from just above 0, which indicates significant contributions to the backscatter signal from multiple scattering, to 1, which corresponds to minimal (if any) multiple scattering (single scattering only). Multiple scattering effects are different for various aerosols particle types, ice particles, and water droplets. The CATS and CALIPSO ATBDs provides a discussion of multiple scattering factors for ice clouds and several aerosol types. For CATS, the layer effective multiple scattering factors in V1-05 products are:
• Ice Clouds: Comparing CATS and CPL lidar ratios and extinction coefficients within ice clouds result in values of 0.673 (Mode 7.2) and 0.423 (Mode 7.1) at 1064 nm and 0.545 (Mode 7.1) at 532 nm (Note: these values are still being tested and may be updated in future data product versions). Scaling the CALIPSO layer effective multiple scattering factor of 0.60 using instrument measurement geometries yield higher values (closer to the Mode 7.2 1064 nm value), so these Mode 7.1 factors likely include instrument biases in addition to multiple scattering effects.
• Water Clouds: Values of 0.55 (Mode 7.2, 1064 nm), 0.50 (Mode 7.1, 532 nm), and 0.40 (Mode 7.1, 1064 nm) are used for water cloud effective multiple scattering factors at both wavelengths based on scaling the CALIPSO values. More work will be conducted to update this value for future versions.
• Aerosols: A value of 1.00 is used for both wavelengths because simulations of multiple scattering effects on AOD retrievals suggest the effects are small in most cases. CALIPSO also uses a value of 1.0.
Given the improvements in quality of the CATS backscatter data, the CATS layer effective multiple scattering factor for ice clouds was updated in V2-00 products to 0.65 (Mode 7.2). This change will also impact the retrievals of extinction and feature optical depth. The values for Mode 7.1 remain the same (0.423 at 1064 nm and 0.545 at 532 nm). 5.4 CATS Geolocation CATS Geolocation (Validated Stage 1) Knowledge of the location of the CATS laser spot on the earth is required for the useful analysis of the CATS backscatter data. The location of the CATS laser spots are calculated from the position, velocity, and attitude information found in the ISS Broadcast Ancillary Data (BAD) together with the known angular offset of the laser line-of-site (LOS) vector from the instrument’s nadir vector in the CATS L1B processing. For more details about improvements to the CATS geolocation algorithms, please see the CATS L1B Products Quality Statement for Version 2.08. The geolocation parameters reported in the CATS L2O data products have three elements for each 5 km L2O profile. These elements represent the first, mean, and last value of the 13 L1B profiles that make up one 5km L2O profile:
1. Index Top Bin (all IFOVs) – The bin id of the CATS data frame where the top of the CATS profile is located, as computed from the ISS BAD.
2. CATS Latitude (all IFOVs) – Ground latitude of the CATS laser spot, in

CATS L2O Layer Products Quality Statements: Version 2.00
17
degrees, as computing from the ISS BAD. 3. CATS Longitude (all IFOVs) – Ground longitude of the CATS laser spot, in
degrees, as computing from the ISS BAD. 4. CATS Angle (all IFOVs) – The off-nadir viewing angle of the CATS laser spot,
in degrees, as computing from the ISS BAD. 5. Lidar Surface Altitude (all IFOVs) - This is the surface elevation at each laser
IFOV footprint, in kilometers above local mean sea level, obtained from identifying the backscatter return of the earth’s surface.
6. Solar Azimuth Angle – Solar azimuth angle, in degrees, reported for each 5 km L2O profile. Solar azimuth angle values are interpolated from the ancillary meteorological data provided by the GMAO.
7. Solar Zenith Angle - Solar zenith angle, in degrees, reported for each 5 km L2O profile. Solar zenith angle values are interpolated from the ancillary meteorological data provided by the GMAO.
5.5 Instrument Parameters and Laser Energy There are several parameters that report details on instrument constants, calibration, performance, and laser energy. These parameters are:
1. Horizontal Resolution - This is an HDF metadata field that defines the horizontal resolution of the CATS data profiles, which is currently set to 5 km.
2. Bin Size - This is an HDF metadata field that defines the size, in kilometers, of the CATS vertical (range) bins. The bin size is 60 meters or 0.06 km.
3. Number Bins - This is an HDF metadata field that defines the number of vertical bins in each CATS data frame. Since the CATS data frame ranges from -2.0 km to 28.0 km, and the bin size is 0.06 km, there are 533 bins in each profile.
4. Number 5 km Profiles - This is an HDF metadata field that defines the number of 5 km CATS L2O profiles in the granule file.
5. Bin Altitude Array – Altitude, in kilometers, at the middle of each of the 533 vertical bins in each CATS data frame, which ranges from roughly -2.0 km to 30.0 km.
5.6 Time and Profile Parameters The following parameters are reported in the Level 2O data product to identify each 5 km CATS L2O record (profile).
1. Profile UTC Date - This is an HDF metadata field that defines the date (DDMMYYY) of each 5 km CATS L2O record.
2. Profile UTC Time - This is an HDF metadata field that defines the time, in fraction of the day, of each 5 km CATS L2O record. The time reported in the CATS L2O data products have three elements for each 5 km L2O profile. These elements represent the first, mean, and last value of the 13 L1B profiles that make up one 5km L2O profile
3. Profile ID - This is an HDF metadata field that contains the ID number of each 5 km CATS L2O record.
4. Day Night Flag - This is an HDF metadata field that identifies the illumination

CATS L2O Layer Products Quality Statements: Version 2.00
18
condition (day or night) of each 5 km CATS L2O record. 5.7 Ancillary Data There are two ancillary data parameters, other than those already listed from GMAO and the ISS, in the CATS L2O data products:
1. Surface Type (all IFOVs) - International Geosphere/Biosphere Programme (IGBP) classification of the surface type at each laser IFOV footprint. The IGBP surface types reported by CATS are the same as those used in the CERES/SARB surface map.
2. DEM Mean Elevation (all IFOVs) - This is the surface elevation at each laser IFOV footprint, in kilometers above local mean sea level. The DEM for version prior to V2-08 were obtained from the 1x1 km GMTED2010 digital elevation map (DEM) (see http://topotools.cr.usgs.gov/gmted_viewer/ for details). The CATS V2-08 L1B data release includes a new Digital Elevation Model (DEM) from JPL created for CloudSat and CALIPSO. The DEM has a horizontal resolution of ~500 m. For CATS L1B V2-08, the DEM from JPL is interpolated and reported in the data products with a horizontal resolution of 350 m.
5.8 Quality Flags Feature Type Score (Provisional) The feature type score provides a numerical confidence level for the classification of layers by the CATS cloud-aerosol discrimination (CAD) algorithm, reported for each atmospheric layer within a 5 km profile. The CATS feature type score is similar to the CALIPSO CAD Score, but the CATS feature type score is an integer value ranging from -10 to 10 for each atmospheric layer (CALIPSO CAD Score ranges from -100 to 100). Table 8 illustrates that the sign of the feature type score identifies a layer as either cloud (positive) or aerosol (negative), while the magnitude of the feature type score represents the confidence in our classification. A value of 10 indicates complete confidence that the layer is a cloud, while -10 indicates the accurate classification of an aerosol layer. When the feature type score equals 0, the layer is just as likely to be a cloud as it is an aerosol, and thus the classification is undetermined. If the optical and physical properties of the layer are considered invalid for clouds and aerosols, these layers are assigned a feature type score of -999.
Table 8. The interpretation of the CATS Feature Type Score.
Layer Type CAD Score Cloud 1 to 10
Aerosol -10 to -1 Undetermined 0
Bad Data -999 The CATS CAD algorithm is a multidimensional probability density function (PDF)
CATS L2O Layer Products Quality Statements: Version 2.00
19
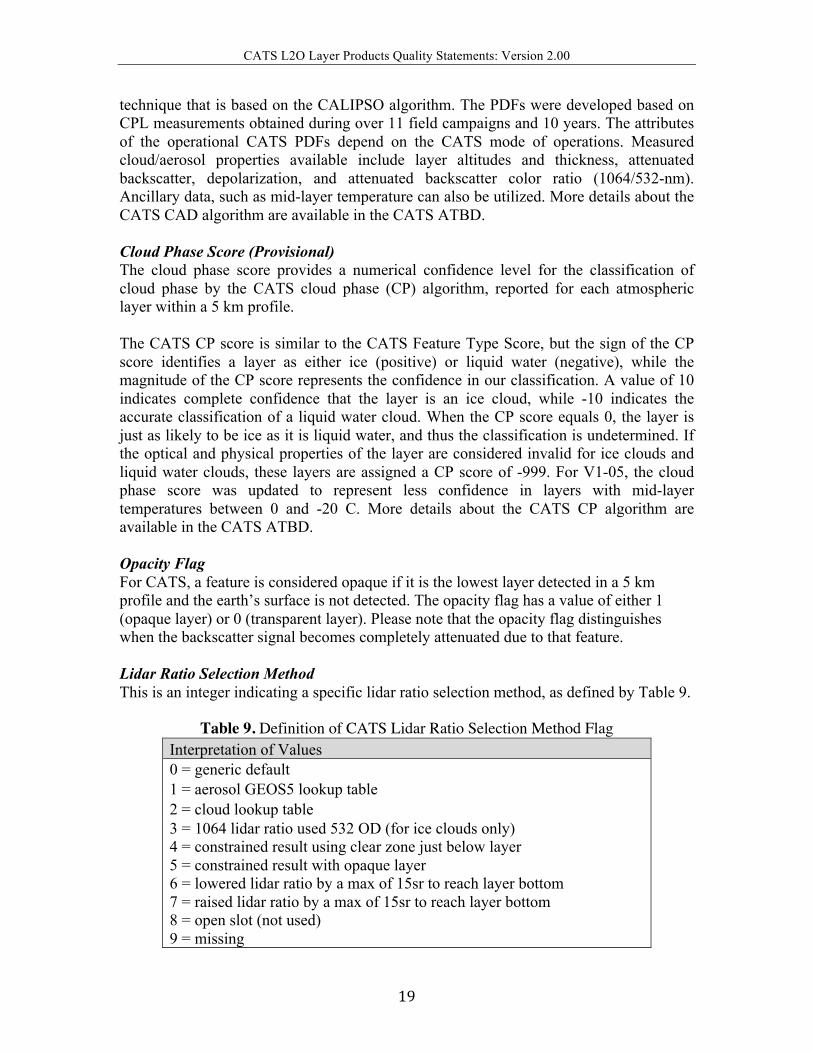
technique that is based on the CALIPSO algorithm. The PDFs were developed based on CPL measurements obtained during over 11 field campaigns and 10 years. The attributes of the operational CATS PDFs depend on the CATS mode of operations. Measured cloud/aerosol properties available include layer altitudes and thickness, attenuated backscatter, depolarization, and attenuated backscatter color ratio (1064/532-nm). Ancillary data, such as mid-layer temperature can also be utilized. More details about the CATS CAD algorithm are available in the CATS ATBD. Cloud Phase Score (Provisional) The cloud phase score provides a numerical confidence level for the classification of cloud phase by the CATS cloud phase (CP) algorithm, reported for each atmospheric layer within a 5 km profile. The CATS CP score is similar to the CATS Feature Type Score, but the sign of the CP score identifies a layer as either ice (positive) or liquid water (negative), while the magnitude of the CP score represents the confidence in our classification. A value of 10 indicates complete confidence that the layer is an ice cloud, while -10 indicates the accurate classification of a liquid water cloud. When the CP score equals 0, the layer is just as likely to be ice as it is liquid water, and thus the classification is undetermined. If the optical and physical properties of the layer are considered invalid for ice clouds and liquid water clouds, these layers are assigned a CP score of -999. For V1-05, the cloud phase score was updated to represent less confidence in layers with mid-layer temperatures between 0 and -20 C. More details about the CATS CP algorithm are available in the CATS ATBD. Opacity Flag For CATS, a feature is considered opaque if it is the lowest layer detected in a 5 km profile and the earth’s surface is not detected. The opacity flag has a value of either 1 (opaque layer) or 0 (transparent layer). Please note that the opacity flag distinguishes when the backscatter signal becomes completely attenuated due to that feature. Lidar Ratio Selection Method This is an integer indicating a specific lidar ratio selection method, as defined by Table 9.
Table 9. Definition of CATS Lidar Ratio Selection Method Flag Interpretation of Values 0 = generic default 1 = aerosol GEOS5 lookup table 2 = cloud lookup table 3 = 1064 lidar ratio used 532 OD (for ice clouds only) 4 = constrained result using clear zone just below layer 5 = constrained result with opaque layer 6 = lowered lidar ratio by a max of 15sr to reach layer bottom 7 = raised lidar ratio by a max of 15sr to reach layer bottom 8 = open slot (not used) 9 = missing

CATS L2O Layer Products Quality Statements: Version 2.00
20
Constrained Lidar Ratio Flag This is an integer indicating the constrained lidar ratio condition, as defined by Table 10.
Table 10. Definition of CATS Constrained Lidar Ratio Flag Interpretation of Values 0 = useful value using nominal “constrained’ procedure 1 = useful value using opaque “constrained’ procedure 2 = constrained lidar ratio outside thresholds 3 = below layer clear zone too small 4 = clear zone signal error > threshold 5 = Tp_sq < allowed min 6 = Tp_sq at or below 0.0 7 = useful 1064 lidar ratio using 532 OD (for ice clouds only) 8 = Tp_sq at or below 0.0 in opaque cloud conditions 9 = missing
Extinction QC Flag This is an integer indicating a specific extinction condition, as defined by Table 11.
Table 11. Definition of CATS Extinction QC Flag Interpretation of Values -1 = calculation not attempted 0 = non-opaque layer extinction analysis nominal 1 = layer hit earth’s surface before layer bottom reached, adjusted bottom 2 = lowering lidar ratio thru iteration process successful 3 = raising lidar ratio thru iteration process successful 4 = # of iterations maxed out, analysis stopped 5 = signal inside layer saturated before bottom, analysis stopped 6 = layer is opaque, layer OD= -1, initial lidar ratio accepted 7 = layer is opaque, layer OD= -1, lidar ratio iteration successful 8 = layer OD out of bounds (invalid) OD= -999.9 9 = layer analysis invalid because final lidar ratio out of bounds
Depolarization Quality Flag (Provisional) CATS V1-05 1064 nm depolarization ratios within cirrus clouds for Mode 7.2 yielded more variability than expected compared to CPL 1064 nm and CALIOP 532 nm data. When the CATS laser begins operation after being turned off (for ISS activities, instrument reboots, etc.), the laser polarization is not pure. This results in inaccurate depolarization values for several granules, depending on how long the laser was off, until the laser polarization stabilizes. CATS Version 2-00 L2O data includes a new Depolarization Quality Flag to notify users of granules with depolarization ratio values of poor quality (Table 12). Granules with suspect depolarization values are now indicated with values of 1 or 2 in the Depol_Quality_Flag variable and users should only use granules with Depol_Quality_Flag = 0 for studies of particle sphericity. The Mode 7.1

CATS L2O Layer Products Quality Statements: Version 2.00
21
laser does appear to suffer from a similar issue, but not to the same extent. That laser stabilizes more quickly.
Table 12. Definitions of the CATS Depolarization Quality Flag Interpretation of Values 0 = Valid, good quality depolarization data 1 = Depolarization ratio biased low due to recent laser turn on 2 = Depolarization ratio biased high as laser stabilizes
5.9 Metadata Parameters Below is a list of metadata parameters not discussed in the previous sections:
Parameter ProductID Product_Version_Number Product_Creation_Date Product_Creator Granule_Start_DateTime Granule_Stop_DateTime Granule_Production_DateTime Granule_Start_Latitude Granule_Start_Longitude Granule_Stop_Latitude Granule_Stop_Longitude Granule_Start_RDM Granule_Stop_RDM Granule_Start_Record_Number Granule_Stop_Record_Number L1B_Input_Version_Number

CATS L2O Layer Products Quality Statements: Version 2.00
22
6.0 Data Release Versions
CATS Level 2 Operational Layer Data Product Night/Day Granules layer products
Release Date Version Data Date Range Maturity Level
March 2016 1.03 3/25/2015 to Present (Mode 7.2) Provisional
June 2016 1.04 3/25/2015 to Present (Mode 7.2) Provisional
Aug. 2016 1.05 2/10/2015 to Present (All Modes) Provisional
July 2017 2.00 3/25/2015 to Present (All Modes) Validated Stage 1