causes and consequences of oil price shocks on the uk …ceerp.hw.ac.uk/repec/hwc/wpaper/002.pdf ·...
TRANSCRIPT

Causes and Consequences of Oil
Price Shocks on the UK Economy
Marco Lorusso and Luca Pieroni
CEERP Working Paper No. 2 November 2015
Heriot-Watt University
Edinburgh, Scotland
EH14 4AS
ceerp.hw.ac.uk

Causes and Consequences of Oil PriceShocks on the UK Economy
Marco Lorusso�
Heriot-Watt UniversityLuca Pieroniy
University of Perugia
November 2015
Abstract
In this paper, we assess the impact of oil price �uctuations on the UKeconomy. We use an empirical strategy which allows us to decompose oilprice changes from the underlying source of the shock. Our results showthat, since the mid-1970s, oil price movements have been mainly associatedwith shocks to oil demand rather than oil supply. We also �nd that theconsequences of oil price changes on UK macroeconomic aggregates dependon the di¤erent types of oil shocks. While increases in global real economicactivity do not depress the UK economy in the short run, shortfalls incrude oil supply cause an immediate fall in GDP growth. In addition, sincemonetary policy depends on the nature of the shock hitting the oil market,domestic in�ation increases following a rise in the real oil price. Finally,our results also show that in response to oil price increases, the governmentde�cit decreases.
JEL Classi�cation: E31, E32, Q41, Q43, Q48.Keywords: Oil Price Shocks, Vector Autoregressions.
�Corresponding author. E-mail: [email protected], Institute of Petroleum Engi-neering, Heriot-Watt University, Conoco Centre, Edinburgh EH14 4AS, Tel: +44 (0)131 4514578.
yE-mail: [email protected], Department of Political Science, University of Perugia, ViaPascoli 20, 06123, Perugia, Italy, Tel. +39 075 585 5280.

1. Introduction
Since the dramatic oil price spikes of the 1970�s, and the consequent global
recession, economists have analysed oil price �uctuations in order to understand
their economic impact. In this regard, a large number of studies have investigated
the macroeconomic e¤ects of oil price shocks (see, Hamilton, 1983 and 2003;
Burbidge and Harrison, 1984; Bernanke et al., 1997; Papapetrou, 2001; Lee and
Ni, 2002; Bernanke, 2004; Barsky and Kilian, 2004; Peersman, 2005; Blanchard
and Galí, 2007; Kilian, 2008 and 2009; Peersman and Van Robays, 2009; Lombardi
and Van Robays, 2011; Morana, 2013).
Although these studies have found a negative correlation between oil price
increases and economic performance, a strong divergence appeared in the analysis
of the causes of oil price �uctuations. The assumption of the oil price as an
exogenous driver to economic fundamentals, which does not distinguish between
the di¤erent sources of oil price �uctuations1, was shown inappropriate by Kilian
(2009). This author suggested important evidences of a reverse causality from
macroeconomic aggregates to oil prices and also showed that oil prices are
driven by structural demand and supply shocks which have direct e¤ects on the
macroeconomy.
In this paper, we aim to analyse the impact of oil price changes on the UK
economy. We use a structural vector autoregression (VAR) approach and adopt a
two-stage method in order to identify and estimate our model. In the �rst stage,
we assess the causes of oil price changes depending on the underlying source of the
shock; that is, we investigate whether the oil price has been driven by a supply or a
demand disturbance. In the second stage, we examine the e¤ects of the structural
shocks estimated in stage 1 on a set of UK macroeconomic aggregates such as
output growth, in�ation, nominal interest rate and government de�cit.
The empirical strategy adopted is in accordance with the approach of Kilian
(2009), which endogenizes the e¤ects of oil price, and is fully consistent with the
1See, for example Hamilton (2003).
2

theoretical framework based on Dynamic Stochastic General Equilibrium (DSGE)
models developed by Bodenstein et al. (2008), Nakov and Pescatori (2010), Nakov
and Nuño (2011), Bodenstein et al. (2011), Bodenstein and Guerrieri (2011) and
Bodenstein et al. (2012).2
The analysis developed in this paper also focuses on the demand side of the
oil market. It is worth noting that the traditional emphasis on physical oil supply
shocks in explaining oil price �uctuations is misplaced as provided by a large
number of studies such as Barsky and Kilian (2002), Kilian (2008), Apergis and
Miller (2009), Basher et al. (2012), Kilian and Murphy (2012) and (2014), Kilian
and Hicks (2013), Baumeister and Peersman (2013).
Hitherto, most of the papers analysing the relationship between oil and the
macroeconomy have focused on the United States. There have also been a few
cross-country studies. For example, Berument et al. (2010) showed that oil price
increases have positive e¤ects on output growths of several Middle East and North
African countries (such as Algeria, Iran, Iraq, Kuwait, Libya, Oman, Qatar, Syria,
and the United Arab Emirates). Baumeister et al. (2010) found a smaller e¤ect
on Euro Area GDP of oil supply shocks than in the United States, although
similar e¤ects were found from oil shocks driven by world activity in the two areas.
Peersman and Van Robays (2012) compared the macroeconomic e¤ects of several
types of oil shocks across a set of advanced economies and found that these e¤ects
di¤er signi�cantly depending upon the underlying driver of the price change. More
recently, the paper of Aatstveit et al. (2015), using a FAVAR model, examines the
importance of demand from emerging and developed countries as drivers of the
real oil price.
In contrast to the above literature, our paper focuses on the response of the
UK macroeconomy to global oil price changes. We expect the United Kingdom to
be a very interesting study case as it is the largest producer of oil in the European
2Using a DSGE model, Milani (2009) proposed an innovative approach in order to investigatethe e¤ects of oil prices on US macroeconomic aggregates. In particular, this author emphasizedthe changing e¤ect that oil prices have on the formation of economic agents�expectations andthe role of learning.
3

Union. In particular, we analyse how the e¤ects of oil price �uctuations on the UK
economy may depend on the nature of the underlying shock. Our structural VAR
model distinguishes between oil price changes caused by exogenous disruptions
in oil production, oil demand shocks driven by global real economic activity and
oil market-speci�c demand shocks associated with the uncertainty about future
supply.
The sample of our analysis covers the period 1976-2014. In this regard, an
additional contribution is to estimate the VAR model with monthly data. Indeed,
our empirical set up heavily relies on delay restrictions that are economically
plausible only at monthly frequency. As far as the causes of oil price shocks
are concerned, our results con�rm the �ndings of Kilian (2009) for the sample
1976-2007, adding the explaination of oil price variations in recent years. We �nd
that, since the mid-1970s, most large and persistent �uctuations in the real price
of oil have been associated with the cumulative e¤ects of oil demand rather than
oil supply shocks. The fact that �ow supply disruptions have had small e¤ects on
the real oil price does not mean that political events in the Middle East do not
matter. On the contrary, these events have a¤ected the real oil price by shifting
expectations about future shortages of oil supply relative to oil demand.
Turning to the consequences of oil price shocks on the UK economy, we �nd
that oil supply disruptions induce an immediate fall in domestic GDP growth and
cause a sustained increase in domestic in�ation. Our estimates show that increases
in aggregate demand, initially, have a negligible e¤ect on UK output growth but
in the long term they tend to depress it. Although the overall performance of the
UK economy deteriorates, after an increase in the oil price, UK public �nances
improve. In addition, our impulse response analysis indicates that the Bank of
England responds di¤erently to oil price �uctuations associated with unanticipated
booms in oil demand compared to oil price changes due to unexpected oil supply
disruptions. Indeed, the nominal interest rate increases after both aggregate
demand shocks and oil market-speci�c demand shocks occur, whereas negative
4

shocks to the oil supply induce the Bank of England to reduce its policy interest
rate.
The rest of the paper is structured as follows. In the next section we discuss
the speci�cation and identi�cation of our empirical model. Section 3 discusses
the results distinguishing between the causes of oil price changes and the e¤ects
of oil price �uctuations on the UK economy. Section 4 concludes suggesting
improvements for future researches.
2. The Empirical Framework
We estimate the causes and consequences of oil price shocks in two distinct stages.
Firstly, we use a structural VAR (SVAR) framework to capture supply and demand
conditions in the oil market. Accordingly, we apply the identifying assumptions on
the relationships between the world variables in order to recover three structural
shocks a¤ecting oil prices: oil supply shocks, aggregate demand shocks and oil
market-speci�c demand shocks (or precautionary demand shocks). In particular,
oil supply shocks are shocks to current availability of crude oil. Aggregate demand
shocks a¤ect the current demand for crude oil coming from changes in the global
business cycle. Oil market-speci�c demand shocks are those driven by shifts in
the precautionary demand for oil; they come from the uncertainty about shortfalls
of expected supply relative to expected demand. The latter shock includes the
holdings of oil inventories as insurance against oil supply disruptions.
In stage 2, we assess the impact of structural innovations, estimated in stage 1,
on several UK macroeconomic aggregates such as real GDP growth, CPI in�ation,
the nominal interest rate and the real government de�cit. The use of two-stage
procedure presents two advantages. Firstly, our approach enables us to keep
the number of variables in our SVAR manageable (less than four) given the
computational requirements associated with estimating larger VARs. Secondly,
separating the process of identifying structural shocks in the oil market removes
the need to employ further identi�cation restrictions on the UK macroeconomic
5

aggregates.
2.1. Modelling the Causes of Oil Price Shocks: a World SVAR
2.1.1. Data
We consider monthly data for the sample period 1976:1-2014:12.3 In order to
estimate the World structural VAR, we use the percentage change of global
crude oil production (�prodt) obtained by the log di¤erences of world crude oil
production in millions per barrels pumped per day (averaged by month).4
The index of global real economic activity (reat) is a measure of the component
of worldwide real economy activity which drives demand for industrial commodities
in global markets (Kilian, 2009). This index is based on dry cargo single voyage
ocean freight rates. As argued by Klovland (2004), world economic activity is the
most important determinant of the demand for transport services. Thus, following
the original idea of Kilian (2009), increases in freight rates are indicators of strong
cumulative global demand pressures.
The real price of oil (rpot) is obtained from the series of the US crude oil
imported acquisition cost by re�ners. There are at least three motivations for this
choice with respect to the Europe Brent spot price. Firstly, as we can observe from
Figure 1, the Europe Brent spot price and US crude oil imported acquisition cost
by re�ners have very close patterns during the period considered. Secondly, the
series of US crude oil imported acquisition cost by re�ners is available at monthly
frequency back to January 1974.5 As we will explain below, the monthly frequency
of this data series is crucial for the identi�cation assumptions of our SVAR. Thirdly,
the longer sample size of this series allows us to consider the relevant episodes that
occurred during the 1970�s.
3We use the sample period 1974:1-1975:12 as training sample for our estimates.4See Appendix A for a detailed description of data sources and the construction of the series
used to estimate the World SVAR.5On the contrary, the monthly series of the Europe Brent spot price is available only from
May 1987.
6

Figure 1: US Crude Oil Imported Acquisition Cost by Re�ners and Europe Brent SpotPrice, May 1987 to December 2014
Source: US Department of Energy.
Here, we show the nominal and real oil price series at monthly frequency from
the period January 1974 to December 2014 (Figure 2). As we can observe from
the graph, the crude oil price rose persistently from the end of the 1970�s to the
mid-1980�s. Except for the peak episodes observed in 1990-1991 and 1999-2000,
the oil price remained fairly stable at around $20 per barrel from 1986 until the
end of 2001. Later that year, the path of oil price steepened sharply until the end
of 2008, and this surge was followed by an even more spectacular collapse. In 2011,
the oil price went back to the level achieved in 2007-2008. Finally, we observe a
plunge in the oil price at the end of 2014.
7

Figure 2: Real and Nominal Oil Prices (US Crude Oil Imp. Acq. Cost by Re�ners)
Source: US Department of Energy and US Bureau of Economic Analysis.
2.1.2. Speci�cation and Identi�cation of the Model
As a benchmark speci�cation for our model, we adopt a SVAR, whose reduced
form is de�ned by the following dynamic equation:
B0yt = ct +24Xl=1
Blyt�l + ut (1)
where yt = (�prodt; reat; rpot)0 indicates the three-variable vector of variables
speci�ed above, ct is a vector of constants and ut denotes the vector of reduced-
form innovations. As an identi�cation strategy, we adopt a Cholesky factorization
so to recover the vector of structural shocks "t from the reduced-form error ut in
(1), according to the following scheme:
"t =
24 "�prodt
"reat"rpot
35 =0@ �11�21�31
0�21�32
00�33
1A24 uoil supply shockt
uaggregate demand shockt
uoil market-speci�c demand shockt
35 (2)
8

The Cholesky ordering in (2) corresponds to assuming the following set of
conditions. Firstly, crude oil supply shocks are de�ned as unpredictable
innovations to global oil production, that is, oil demand shocks (uaggregate demand shockt
and uoil market-speci�c demand shockt ) do not in�uence crude oil supply (uoil supply shockt ) in
the same month. This assumption is plausible since adjusting oil production is
costly for oil producer countries and because the state of the crude oil market is
di¢ cult to forecast in the very short run. Hence, oil producer countries tend to
respond slowly to oil demand shocks.
Secondly, shocks to global real economic activity that are not explained by oil
supply shocks are identi�ed as shocks to global demand for industrial commodities.
We de�ne these shocks as aggregate demand shocks. We assume that shocks
to oil market-speci�c demand (uoil market-speci�c demand shockt ) do not in�uence global
real economic activity (uaggregate demand shockt ) in the same month. In general, our
assumption is reasonable because global real economic activity responds with a
delay to oil price increases.
Finally, shocks to the real oil price that are not explained by oil supply shocks
or aggregate demand shocks by construction re�ect changes in the demand for oil
in contrast to changes in the demand for all industrial commodities. We de�ne
these shocks as oil market-speci�c demand shocks. In particular, these shocks
represent the �uctuations in precautionary demand for oil due to uncertain future
oil supply.
We estimate the VAR reduced-form equation (1) using least squares. The
resulting estimates are used to construct the SVAR model. We adopt the inference
method used by Gonçalves and Kilian (2004) which implies a recursive-design wild
bootstrap with 2,000 replications.6
6This method is successful in dealing with conditional heteroskedasticity of unknown formin autoregressions. It is well known that there is evidence of conditional heteroskedasticity inthe residuals of many estimated dynamic regression models involving monthly data and, in thiscase, standard residual-based bootstrap methods of inference for autoregressions are invalidatedby conditional heteroskedasticity.
9
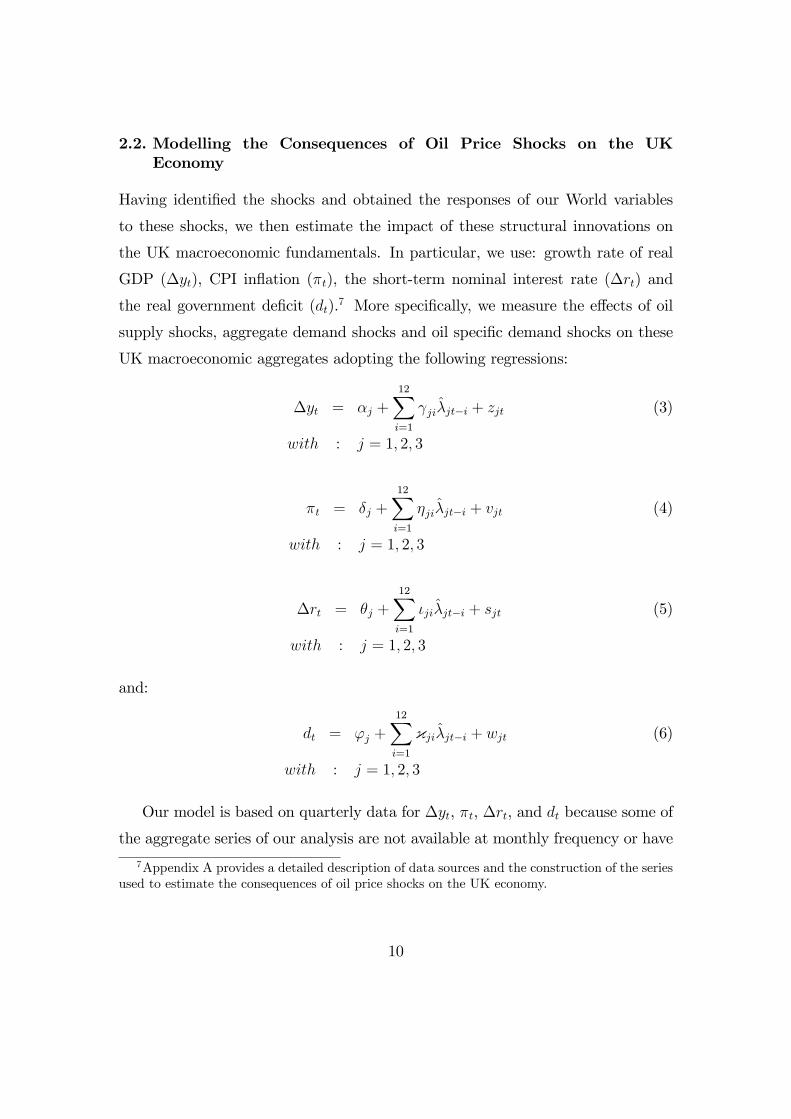
2.2. Modelling the Consequences of Oil Price Shocks on the UKEconomy
Having identi�ed the shocks and obtained the responses of our World variables
to these shocks, we then estimate the impact of these structural innovations on
the UK macroeconomic fundamentals. In particular, we use: growth rate of real
GDP (�yt), CPI in�ation (�t), the short-term nominal interest rate (�rt) and
the real government de�cit (dt).7 More speci�cally, we measure the e¤ects of oil
supply shocks, aggregate demand shocks and oil speci�c demand shocks on these
UK macroeconomic aggregates adopting the following regressions:
�yt = �j +12Xi=1
ji�jt�i + zjt (3)
with : j = 1; 2; 3
�t = �j +12Xi=1
�ji�jt�i + vjt (4)
with : j = 1; 2; 3
�rt = �j +12Xi=1
�ji�jt�i + sjt (5)
with : j = 1; 2; 3
and:
dt = 'j +12Xi=1
{ji�jt�i + wjt (6)
with : j = 1; 2; 3
Our model is based on quarterly data for �yt, �t, �rt, and dt because some of
the aggregate series of our analysis are not available at monthly frequency or have
7Appendix A provides a detailed description of data sources and the construction of the seriesused to estimate the consequences of oil price shocks on the UK economy.
10

a short time span.8 Our choice of using all the data series at quarterly frequency
allows us to easily compare the estimated results of each macroeconomic aggregate.
Thus, in equations (3)-(6), �jt represents the measure of quarterly shocks
(estimated in model (1)) constructed by averaging the monthly structural
innovations for each quarter:
�jt =1
3
3Xi=1
uj;t;1 (7)
with : j = 1; 2; 3
where uj;t;1 indicates the estimated residual for the j�th structural shock in theith month of the tth quarter of the sample.9 In equations (3)-(6) the impulse
response coe¢ cients correspond to ji, �ji, �ji, and {ji, respectively. The numberof lags is determined by the maximum horizon of the impulse response function,
which is set to twelve quarters. Finally, in equations (3)-(6), zjt, vjt, sjt and
wjt are potentially serially correlated errors. In order to deal with possible serial
correlation in the error term we use block bootstrap methods. Following the usual
empirical strategy, all our estimated results are obtained with block size 4 and
20,000 bootstrap replications.
Our regression model (3)-(6) assumes that, within a given quarter, there is no
feedback from �yt, �t, �rt, and dt to �jt, j = 1; 2; 3 such as we can assess their
e¤ects on UK macroeconomic aggregates. The assumption that oil supply shocks,
aggregate demand shocks and oil market-speci�c demand shocks are exogenous to
GDP growth, CPI in�ation, nominal interest rate and government de�cit is based
on the fact that the United Kingdom is "small" in the sense that movements in
UK economic variables have no e¤ect on world variables. In fact, although the
United Kingdom produces oil, its average share of oil production in the period
8In particular, for the sample period 1976:1-2014:12, data at monthly frequency is availableonly for the short-term nominal interest rate. The series of the CPI in�ation starts in 1988:1,whereas the one of real government de�cit only in 1993:1. Moreover, we do not use interpolatedreal GDP growth data because interpolation is known to cause spurious dynamics.
9These quarterly averages are not exactly uncorrelated, but their correlation is so low thatthey can be treated as uncorrelated.
11

1976-2014 was 3% with a peak of 5% from 1984 to 1986 and it was 1% in 2014
according to the statistics of US Energy Information Administration (Monthly
Energy Review). Similarly, UK petroleum consumption has been on average
3% of world consumption during the period 1976-2014 (US Energy Information
Administration - Monthly Energy Review).
3. Results
In this section, we show the estimation results of our empirical model. We start
by discussing the estimates concerning the causes of oil shocks (Section 3.1) and
successively we focus on the consequences of oil shocks on the UK economy (Section
3.2).
3.1. Causes of Oil Shocks: Estimates
Figure 3 shows the historical evolution of the structural shocks considered in our
model for the period 1976-2014. Our analysis focuses on the episodes associated
with the major changes in the real oil price. Our estimated results con�rm the
�ndings of Kilian (2009) for the sample 1976-2007, although we are able to explain
oil price variation in recent years (2008-2014).
From Graph (a), we do not observe any oil supply disruption corresponding
to the Iranian Revolution occurring in 1978-1979. Accordingly, the reductions of
oil supply due to the Iranian Revolution were more than o¤set by increases in
production from other oil producer countries.
Di¤erently, in coincidence with the Iran-Iraq War in 1980, we �nd evidence of
a substantial shortfall in crude oil supply.
Graph (b) shows that repeated large positive shocks to global aggregate
demand occurred in 1978, 1979 and 1980, while from Graph (c), we observe a
large unanticipated increase of oil market-speci�c demand during 1979. Indeed,
episodes of Iranian Revolution, the Iranian hostage crisis and the Soviet invasion
of Afghanistan all created concern about the future availability of oil supply from
12

the Middle East and induced a higher precautionary demand for oil.
Focusing on the most recent years (2002 to mid-2008), the large increase in the
real oil price was driven by a series of positive aggregate demand shocks associated
with shifts in global real economic activity (Graph (b)). Interestingly, during the
same period, we �nd that oil supply shocks played a negligible role in oil price
�uctuations (Graph (a)). We also observe that, at the end of 2008, the plunge in
the real price of oil re�ected the falls of aggregate demand and oil market-speci�c
demand, respectively (Graphs (b) and (c)).
Figure 3: Historical Evolution of the Structural Shocks, 1976-2014
Note: Annual frequency average of structural residuals implied by the SVAR model (1).
The last episode that we analyse concerns the surge in the oil price that
occurred from 2011 to mid-2014. As we can see from Graph (c), there is evidence
of a series of positive oil market-speci�c demand shocks. Indeed, serious concerns
about political instability in the Middle East have emerged with protests taking
place in Tunisia and Egypt. Some signs of civil unrest have also appeared in
13

Lebanon, Algeria and Yemen. All these events have created concerns about future
oil shortages in the Middle East. As Barrell et al. (2011) have argued, the
repeated oil market-speci�c demand shocks which occurred in this period can also
be explained by the sharp rise in investors�demand as the �nancial crisis unfolded,
with investors pulling out of complex �nancial assets in search of a safer haven.
Figure 4 shows the impulse response analysis of global oil production, global
real economic activity and the real price of oil to one standard deviation structural
shocks. In particular, we normalize the signs of the shocks in order to induce an
increase in the oil price.
Graph (a) shows that an unanticipated oil supply disruption implies an
immediate strong reduction of global oil production. After one year, we observe
a partial recovery of global oil production. This result is generally explained with
the evidence that in the presence of a negative oil production shock in one region,
producer countries of other areas in the World increase their production. From
Graph (b), we see that an unanticipated oil supply disruption does not signi�cantly
a¤ect global real economy activity, while causes a small and partially signi�cant
increase in the real price from fourth to seventh month (Graph (c)).
We note that an unexpected increase in aggregate demand implies an expansion
of global oil production, that becomes signi�cant three months after the shock
occurs, a signi�cant increase in the global real economic activity and a sharp, very
persistent and statistically signi�cant, increase in the real oil price (Graph (d), (e)
and (f), respectively).
While an unanticipated expansion of oil market-speci�c demand does not
in�uence global oil production, it causes a temporary increase in the global real
economic activity, that is signi�cant until the tenth month, and an immediate
large increase in the real oil price (Graph (g), (h) and (i)). The last e¤ect is very
persistent and highly signi�cant.
Our results con�rm the �ndings of Kilian (2009) and Alquist and Kilian (2010).
In particular, the most important result emerging from our IRF is that shortfalls
14

in oil supply have small and partially signi�cant e¤ects on oil price changes. As
argued above, oil supply disruptions in one region are compensated by increases of
endogenous oil supply from other regions of the world. Accordingly, the question
that arises is: how can one explain the large increases in the real oil price following
the major political events in the Middle East? Figure 4 shows that the answer
coincides with the sharp increases of precautionary demand for oil. These changes
in precautionary demand are caused by shifts in expectations of future oil supply.
Such expectations respond on impact to exogenous political events in the Middle
East and cause a large increase in the oil price.
Figure 4: Impulse Response Analysis to One St. Dev. Shocks
Note: Solid red lines: point estimates; dash and dotted blue lines: one and two
standard error bands, respectively.
The cumulative e¤ects of oil demand and supply shocks on the real price of
oil are shown in Figure 5. These results con�rm the previous �ndings that oil
supply shocks have played a small role in terms of determination of oil price,
15

while aggregate demand shocks and oil market-speci�c shocks explain most of the
variation in the oil price.
In particular, Graph (c) shows that the surge in the oil price in 1980 was
caused by the increase in precautionary demand for oil whereas, during the 1980-
1982 period, aggregate demand grew continuously, causing the rise in the oil price
(Graph (b)). Consequently, we strengthen the conclusions the increase in the oil
price that occurred in late 1979, which continued until 1985, was mainly caused
by demand shocks, while during this period, oil supply shocks do not in�uence
substantially oil price variation.
We also observe that the fall in the real price of oil that occurred in 1986
was mainly associated with the fall in oil market-speci�c demand. The increase
of Saudi Arabia oil production following the fall of OPEC cartel in the late 1985
does not seem to explain the drop in the oil price in in 1986 (Graph (a)).
In 1990-1991, we note a large increase in the oil market-speci�c demand that
caused the sharp increase in the oil price (i.e., precautionary demand for oil) in
response to expected shortfalls in oil supply due to the Kuwait Invasion. The latter
episode also caused a physical disruption in oil supply. Again, oil market-speci�c
demand shock was the main cause of the oil price surge of 1999-2000 (Graph (c)).
Turning to more recent episodes of oil price �uctuations, we �nd that the
increase in the oil price during the 2002-2008 period coincided with a very large
swing in global real economic activity (Graph (b)). Indeed, during this period,
there was sustained global demand pressure and the oil price increased more than
other commodity prices. The latter e¤ect occurred because the supply of crude
oil supply stagnated between 2002 and 2008 (Graph (a)). At the end of 2008, the
drop in oil price was associated with the fall in oil market-speci�c demand (Graph
(c)).
We know that between 2011 and mid-2014 there has been a sustained increase
in oil market-speci�c demand that pushed up the oil price and that this rise of
precautionary demand for oil was associated with social and political instability in
16

the Middle East and North African regions. In particular, the unrest sweeping
Tunisia in early 2011 rapidly spread over into many surrounding countries,
including major oil producers, such as Algeria and, most signi�cantly, Libya.
Clearly, instability in the region automatically raised worries of supply disruptions
and possible oil shortage. Moreover, between 2011 and mid-2014, the worsening
of the �nancial crisis tended to increase precautionary demand for oil (Barrell et
al., 2011). Finally, the plunge in the oil price that started in mid-2014 seems to
be associated with the decreases of both aggregate demand and oil market-speci�c
demand.
Figure 5: Historical Decomposition of Real Oil Price
Note: Estimation results obtained from the SVAR model (1).
Our analysis is in accordance with the results of Barsky and Kilian (2002) and
Kilian (2009), which show that most large and persistent �uctuations in the real
price of oil since the mid-1970s have been associated with the cumulative e¤ects of
oil demand rather than oil supply shocks. Moreover, our analysis contrasts with
17

the traditional studies that suggest that all major �uctuations in the price of oil
can be attributed to disruptions of oil supply triggered by political events occurred
in the Middle East (Hamilton, 1983, 2003 and 2009).
The fact that �ow supply disruptions have had small e¤ects on the real oil price
does not mean that political events in the Middle East do not matter. These events
have a¤ected the real oil price by shifting expectations about future shortages of
oil supply relative to oil demand. As we explained above, in our model these
expectations are captured by shocks to precautionary demand for oil, showing
that oil market-speci�c demand shocks cause large �uctuations in the real oil price
even when oil supply is unchanged.
3.2. Consequences of Oil Shocks on the UK Economy: Estimates
In this section, using our model speci�ed according to equations (3)-(6), we analyse
the e¤ects of the identi�ed shocks on UK macroeconomic variables: GDP growth,
CPI in�ation, the nominal interest rate, and the real government de�cit.
We start by analysing the responses of domestic GDP growth and CPI in�ation
to these shocks as shown in Figure 6 (Graphs (a), (b), (c) and (d), (e) (f),
respectively).
The response of GDP growth to oil supply disruptions is negative throughout
all quarters. However, the one-standard error con�dence intervals indicate that
the negative response is signi�cant only for the �rst �ve quarters. The response of
GDP growth to aggregate demand expansions is positive, but is not statistically
signi�cant. Seven quarters after the shock occurs, it turns to negative and it
becomes signi�cant from the second year onwards. Instead, one-standard error
con�dence intervals indicate that the response of GDP growth to oil market-speci�c
demand shock is not statistically signi�cant at all horizons. There is only some
evidence of a decline in GDP growth rate six quarters after the shock occurs.
Inspecting the in�ation responses, we note that negative oil supply shocks
lead to statistically signi�cant increases in CPI in�ation throughout all quarters.
In addition, the impact of increases in aggregate demand on the UK consumer
18

price level is positive and statistically signi�cant from the �rst year onwards. The
maximum is reached three years after the shock occurs. Lastly, the impact of
expansions of oil market-speci�c demand on UK in�ation is around zero throughout
all quarters.
Figure 6: IRFs of the UK Real GDP Growth and CPI In�ation to Each Str. Shock
Note: Solid blue lines: point estimates; dash and dotted blue lines: one and two
standard error bands, respectively.
Our results are in accordance with the �ndings of Millard and Shakir (2013)
for the UK economy10. In particular, oil supply disruptions induce an immediate
fall in GDP growth and cause a sustained increase in in�ation.10Millard and Shakir (2013) have employed an empirical framework with time-varying
parameters in order to understand how the impact of oil price shocks on the UK economymay have developed over time. However, as argued by Kilian (2014), the idea of analysingthe responses of several macroeconomic aggregates to oil demand and supply shocks within atime-varying parameter VAR is not practical. Time-varying parameter VARs do not providean e¢ cient estimation since they consider samples that are not long enough in order to have asu¢ cient variation in oil demand and oil supply shocks. Moreover, our identifying assumptionshold only using data at monthly frequency. However, it is well documented that, although time-varying parameter VARs work well with quarterly data, they are computationally infeasible whenusing monthly data.
19

We �nd that increases in aggregate demand initially have a negligible e¤ect on
UK output growth, but in the long run they tend to depress it, in accordance with
the �ndings of Kilian (2009) for the US economy. This last result can be explained
as follows. On impact, positive unexpected global economic shocks stimulate UK
real GDP growth and o¤set the growth-retarding e¤ects of a higher real price of oil.
However, as this stimulus disappears over time, the response of UK GDP growth
becomes negative. The most relevant example in this concern is the "Great Surge"
in the real price of oil between 2002 and mid-2008. During this period, the UK
economy did not experience any severe recession because the oil price surge was
mainly driven by unexpectedly strong demand for oil from emerging Asia which
o¤set the negative e¤ects of higher oil prices and other imported commodities.
Similarly to the results of Peersman and Van Robays (2012), we �nd that
positive precautionary demand shocks have a very small impact on GDP growth
and have no signi�cant e¤ects on domestic in�ation. These �ndings suggest that
precautionary demand shocks have small and insigni�cant e¤ects on domestic GDP
growth and CPI in�ation because the UK is an oil producer country. That is, the
UK economy has been less a¤ected by changes in inventory holdings compared to
typical oil importing countries because it had the possibility to increase its own
oil production in order to self-insure against interruptions to foreign oil supply
instead of drawing upon inventory holdings.
Figure 7 shows the impulse response functions for the UK nominal interest
rate (Graphs (a), (b), (c)) and the real government de�cit (Graphs (d), (e), (f)) to
shocks of oil supply disruptions, aggregate demand and oil market-speci�c demand.
We observe that the nominal interest rate progressively falls in response to
oil supply disruptions (Graphs (a), (b) and (c)). One-standard error con�dence
intervals indicate that the response of the UK nominal interest rate to this shock is
statistically signi�cant starting from the fourth quarter. The increase in aggregate
demand induces a positive nominal interest rate, statistically signi�cant from the
third quarter onwards. In addition, positive oil speci�c-market demand shocks
20

cause an increase in the nominal interest rate. The positive impact of oil speci�c-
market demand shocks on the nominal interest rate is statistically signi�cant from
the second to the seventh quarter.
We deduce that the Bank of England responds di¤erently to oil price
�uctuations associated with unanticipated booms in oil demand with respect to oil
price changes due to unexpected oil supply disruptions. This result is consistent
with the �ndings of Peersman and Van Robays (2012). Evidently, these di¤erent
responses of the monetary authority relate to the corresponding e¤ects of oil
demand shocks and oil supply shocks on the UK economy.
For example, as we have shown in Figure 6, an unexpected demand boom
driven by the global business cycle does not depress the UK economy in the short
run. Conversely, an unanticipated oil supply disruption reduces immediately UK
real output growth. This implies di¤erent reactions of UK monetary authority
depending on the composition of the oil demand and oil supply shocks underlying
the oil price shock.
In particular, the evidence shows that the nominal interest rate increases after
both an aggregate demand shock and an oil market-speci�c demand shock. In
this regard, the positive response to aggregate demand shocks is consistent with
the Bank of England�s decision to raise interest rates before the oil price shock of
1978-1980. Indeed, looking at the 3 Month Treasury Bills series, it is evident that
the Bank of England had been steadily raising interest rates from mid-1977 to the
end of 1980.
Figure 7 also shows that negative shocks to oil supply induce the Bank of
England to decrease the nominal interest rate. This result is in line with the
�ndings of Kilian and Lewis (2011) about the behaviour of the Federal Reserve
in the case of negative oil supply shocks. The negative response of the nominal
interest rate to unanticipated oil supply disruptions is consistent with the view
that the Bank of England considers the resulting oil price increases as adverse
demand shocks.
21

In response to negative shocks of crude oil supply, the UK government de�cit
decreases. The one-standard error con�dence intervals indicate that the negative
response is signi�cant for all the quarters considered. As we can observe from
Graph (e), the response of UK government de�cit to increases in aggregate demand
is not statistically signi�cant at all horizons. Similarly, expansions of oil market-
speci�c demand have non-signi�cant e¤ects on the UK government de�cit. Thus,
we conclude that since the UK is an oil producer country, this increase in oil price
implies an improvement of government oil revenues and government budget.
Figure 7: IRFs of the UK Nom. Int. Rate and Gov. Def. to Each Str. Shock
Note: Solid blue lines: point estimates; dash and dotted blue lines: one and two
standard error bands, respectively.
Our estimated result is consistent with previous UK literature (see, among the
others, Powell and Horton, 1985; Hall et al., 1986; Young, 2000; OECD Economic
Surveys, 2002; OBR, 2010; Barrel et al., 2011). All these studies have found that,
after an increase in the oil price, the UK �scal position is positively a¤ected by
22

the additional North Sea revenues stemming from the petroleum revenue tax and
the VAT applied on oil products. In this regard, Young (2000) argued that in a
scenario of high oil price, although the performance of UK economy deteriorates,
the government represents one of the few winners in the short term.
4. Conclusions
In this paper, we have studied the causes and the consequences of oil price
�uctuations on the UK economy. Our empirical approach assumes that the real
oil price is endogenous with respect to macroeconomic fundamentals and identi�es
the causes and consequences of oil price shocks by a two-stage method. In the �rst
stage, we identi�ed shocks to the World oil price from oil supply, aggregate demand
and oil market-speci�c demand. In the second stage, we assessed the impact of
structural innovations estimated in the �rst stage on several UK macroeconomic
aggregates such as, real GDP growth, CPI in�ation, nominal interest rate and real
government de�cit.
Several important insights emerge from our analysis. We �nd that, since the
mid-1970s, shortfalls in oil supply have had small e¤ects on oil price changes.
Therefore, our results contrast with the view that major oil price changes
are caused by disruptions in oil supply triggered by exogenous political events
occurring in the Middle East. Instead, we �nd that major �uctuations in the real
oil price coincide with shifts in precautionary demand for oil.
Our IRFs show di¤erent responses of UK macroeconomic aggregates depending
on the underlying shock a¤ecting oil price. More speci�cally, GDP growth goes
down immediately in response to negative oil supply shocks whereas increases in
aggregate demand, initially, have small e¤ects on domestic output growth but, in
the long run, they tend to reduce it. In general, our estimated responses show that
oil shocks cause a sustained increase in UK in�ation.
Focusing on UK monetary policy, we �nd that the nominal interest rate
increases after both aggregate demand shocks and oil market-speci�c demand
23

shocks. The opposite occurs in the case of negative shocks to oil supply. Our
estimated responses also indicate that the increase in the real oil price induces an
improvement of UK public �nances due to the rise in oil revenues.
To conclude, we believe that the empirical approach presented in this
paper provides a useful framework in order to understand the causes and the
consequences of oil price shocks on the UK economy. Given the promising results
of this paper, we consider as a sound extension of this work the development of
a DSGE model which is able to distinguish between several causes of �uctuations
in the global demand for industrial commodities and to estimate the impact of
alternative policy choices. We leave this line of investigation for future research.
24

References
[1] Aastveit, K., Bjørnland, H., & Thorsrud, L., 2015. "What drives oil
prices? Emerging versus developed economies," Journal of Applied
Econometrics, Forthcoming.
[2] Alquist, R., & Kilian, L., 2010. "What do we learn from the price of
crude oil futures?," Journal of Applied Econometrics, vol. 25(4), pages 539-
573.
[3] Apergis, N., & Miller, S., 2009. "Do structural oil-market shocks a¤ect
stock prices?" Energy Economics, vol. 31(4), 569-575.
[4] Barrell, R., Delannoy, A., & Holland, D., 2011. "The impact of high
oil prices on the economy," National Institute Economic Review, vol.
217(F68).
[5] Barsky R., & Kilian L., 2002. "Do we really know that oil caused the
great stag�ation? A monetary alternative," Bernanke B, Rogo¤ K
(eds), NBER Macroeconomics Annual 2001, pages 137-183.
[6] Barsky, R., & Kilian, L., 2004. "Oil and the Macroeconomy Since the
1970s," Journal of Economic Perspectives, vol. 18(4), pages 115-134.
[7] Basher, S., Haug, A., & Sadorsky, P., 2012. "Oil prices, exchange rates
and emerging stock markets." Energy Economics, vol. 34 (1), pages 227-
240.
[8] Christiane, B., Peersman G., & Van Robays, I., 2010. "The economic
consequences of oil shocks: di¤erences across countries and time,"
RBA Annual Conference Volume, in: Renée Fry & Callum Jones &
Christopher Kent (ed.), In�ation in an Era of Relative Price Shocks, Reserve
Bank of Australia.
25

[9] Baumeister, C., & Peersman, G., 2013. "The role of time-varying price
elasticities in accounting for volatility changes in the crude oil
market," Journal of Applied Econometrics, vol. 28(7), pages 1087-1109.
[10] Bernanke, B., 2004. "Oil and the economy," Remarks at the Distinguished
Lecture Series, Darton College, Albany, GA, 21st October.
[11] Bernanke, B., Gertler, M., & Watson, M., 1997. "Systematic monetary
policy and the e¤ects of oil shocks," Brookings Papers on Economic
Activity, vol. 28(1), pages 91-157.
[12] Berument, M., Ceylan, N., & Dogan, N., 2010. "The impact of oil price
shocks on the economic growth of selected MENA1 countries," The
Energy Journal, vol. 31, Number 1.
[13] Blanchard, O., & and Galí, J., 2007. "The Macroeconomic E¤ects of Oil
Price Shocks: Why are the 2000s so di¤erent from the 1970s?,"
NBER Chapters, in: International Dimensions of Monetary Policy, pages
373-421.
[14] Bodenstein, M., Erceg, C., & Guerrieri, L., 2008. "Optimal monetary
policy with distinct core and headline in�ation rates," Journal of
Monetary Economics, vol. 55, pages S18-S33.
[15] Bodenstein, M., & Guerrieri, L., 2011. "Oil e¢ ciency, demand, and
prices: a tale of ups and downs," International Finance Discussion Papers
1031, Board of Governors of the Federal Reserve System (US).
[16] Bodenstein, M., Erceg, C., & Guerrieri, L., 2011. "Oil shocks and external
adjustment," Journal of International Economics, vol. 83(2), pages 168-184.
[17] Bodenstein, M., & Guerrieri, L., & Kilian, L., 2012. "Monetary Policy
Responses to Oil Price Fluctuations," IMF Economic Review, vol. 60(4),
pages 470-504.
26

[18] Burbidge, J., & Harrison, A., 1984. "Testing for the e¤ects of oil-price
rises using vector autoregressions," International Economic Review, vol.
25(2), pages 459-484.
[19] Gonçalves, S., & Kilian, L., 2004. �Bootstrapping autoregressions
with conditional heteroskedasticity of unknown form,� Journal of
Econometrics, vol. 123(1), pages 89-120.
[20] Hall, S., Henry, B. & Herbert, R., 1986. "Oil prices and the economy,"
National Institute Economic Review, vol. 116(38).
[21] Hamilton, J., 1983. "Oil and the macroeconomy since World War II,"
Journal of Political Economy, vol. 92 (2), pages 228-248.
[22] Hamilton, J., 2003. "What is an oil shock?" Journal of Econometrics, vol.
113(2), pages 363-98.
[23] Hamilton, J., 2009. "Causes and consequences of the oil shock of 2007-
08," Brookings Papers on Economic Activity, vol. 40(1), pages 215-283.
[24] Kilian, L., 2008. "The economic e¤ects of energy price shocks," Journal
of Economic Literature, vol. 46, pages 871-909.
[25] Kilian, L., 2009. "Not all oil price shocks are alike: disentangling
demand and supply shocks in the crude oil market," American
Economic Review, vol. 99, pages 1053-1069.
[26] Kilian, L., 2014. "Oil price shocks: causes and consequences," Annual
Review of Resource Economics, vol. 6(1), pages 133-154.
[27] Kilian, L., & Hicks B., 2013. "Did unexpectedly strong economic growth
cause the oil price shock of 2003-2008?" Journal of Forecasting, vol. 32,
pages 385-394.
27

[28] Kilian, L., & Lewis L., 2011. "Does the Fed respond to oil price shocks?"
Economic Journal, vol. 121, 1047-1072.
[29] Kilian, L., & Murphy D., 2012. "Why agnostic sign restrictions are not
enough: understanding the dynamics of oil market VAR models,"
Journal of the European Economic Association, vol. 10, pages 1166-1188.
[30] Kilian, L., & Murphy, D., 2014. "The role of inventories and speculative
trading in the global market for crude oil," Journal of Applied
Econometrics, vol. 29(3), pages 454-478.
[31] Klovland, J., 2004. �Business cycles, commodity prices and shipping
freight rates: some evidence from the pre-WWI Period,� Paper
presented at Workshop on Market Performance and the Welfare Gains of
Market Integration in History, Florence, Italy.
[32] Lee, K., & Ni, S., 2002. "On the dynamic e¤ects of oil price shocks: a
study using industry level data," Journal of Monetary Economics, vol.
49, pages 823-852.
[33] Lombardi, M., & Van Robays, I., 2011. "Do �nancial investors destabilize
the oil price?," Working Paper Series 1346, European Central Bank.
[34] Milani, F., 2009. "Expectations, learning and the changing
relationship between oil prices and the macroeconomy," Energy
Economics, vol. 31, 827-837.
[35] Millard, S., & Shakir, T., 2013. "Oil shocks and the UK economy: the
changing nature of shocks and impact over time," Bank of England
working papers 476.
[36] Morana, C., 2013. "The oil price-macroeconomy relationship since the
mid-1980s: a global perspective," The Energy Journal, vol. 34, Number
3.
28

[37] Nakov, A., & Pescatori, A., 2010. "Oil and the great moderation,"
Economic Journal, Royal Economic Society, vol. 120(543), pages 131-156.
[38] Nakov, A., & Nuño, G., 2011. "A general equilibrium model of the oil
market," Banco de España Working Papers 1125, Banco de España.
[39] Papapetrou, E., 2001. "Oil price shocks, stock market, economic
activity and employment in Greece." Energy Economics, vol. 23(5),
pages 511-532.
[40] Peersman, G., 2005. "What caused the early millennium slowdown?
Evidence based on vector autoregressions," Journal of Applied
Econometrics, vol. 20(2), pages 185-207.
[41] Peersman, G., & Van Robays, I., 2009. "Oil and the Euro area economy,"
Economic Policy, vol. 24(60), pages 603-651.
[42] Peersman, G., & Van Robays, I., 2012. "Cross-country di¤erences in the
e¤ects of oil shocks," Energy Economics, vol. 34(5), pages 1532-1547.
[43] O¢ ce for Budget Responsibility, 2010. "Assessment of the e¤ect of oil
price �uctuations on the public �nances".
[44] Organization for Economic Cooperation and Development, 2002. "The
reverberations of the oil price shock" OECD Economic Surveys - United
Kingdom - Annex III.
[45] Powell, S. & Horton, G., 1985. "The economic e¤ects of lower oil prices,"
GES Working Paper, no. 76 (Treasury Working paper, no. 34).
[46] Young, G., 2000. "The e¤ects of higher oil prices on the UK economy,"
National Institute Economic Review, vol. 174(8).
29

5. Appendix A: Data
�prodt : as we described in the main body of the paper, this is the percentage
change of global crude oil production. This series is obtained by the log di¤erences
of world crude oil production in millions per barrels pumped per day (averaged by
month). The source is the US Department of Energy.
reat : as we described in the main body of the paper, this is the index of
the global real economic activity. The source of this series is Kilian website:
http://www-personal.umich.edu/~lkilian/reaupdate.txt.
Kilian (2009) provides a clear explanation in order to obtain reat. In particular,
the data series to construct this index are taken from representative single-
voyage freight rates available in the monthly report on "Shipping Statistics and
Economics" published by Drewry Shipping Consultants Ltd. These data series
relate to various bulk dry cargoes consisting of grain, oilseeds, coal, iron ore,
fertilizer and scrap metal. In order to eliminate the �xed e¤ects for di¤erent
routes, commodities and ship sizes, Kilian adopts two steps. Firstly, he computes
the period-to-period growth rates for each series. Secondly, he takes the equal-
weighted average of these growth rates and cumulates the average growth rate.
The �nal series is de�ated by the US CPI and linearly detrended. The base month
is January 1986. Kilian also provides evidence that this index based on industrial
commodity markets well represents the level of global real economic activity.
rpot : as we described in the main body of the paper, this is the real price
of oil and it is expressed in log terms. This series is obtained from the re�ner
acquisition cost of imported crude oil. The source is US Department of Energy.
The nominal series of oil price is de�ated by the US CPI. The source is the US
Bureau of Economic Analysis.
�yt : it is the growth rate of UK real GDP. This series is obtained by the log
di¤erences of real UK GDP: "gross domestic product, chained volume measures,
seasonally adjusted (£m)". The source is O¢ ce for National Statistics (code ABMI
in Quarterly National Accounts).
30
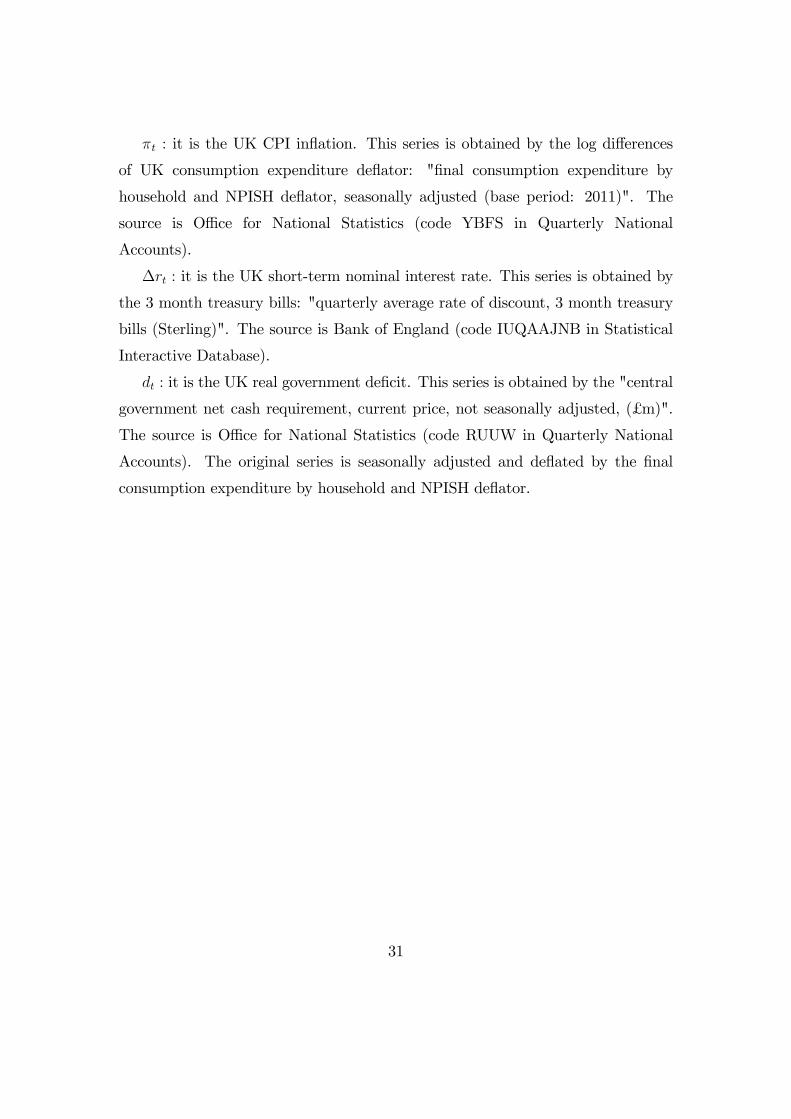
�t : it is the UK CPI in�ation. This series is obtained by the log di¤erences
of UK consumption expenditure de�ator: "�nal consumption expenditure by
household and NPISH de�ator, seasonally adjusted (base period: 2011)". The
source is O¢ ce for National Statistics (code YBFS in Quarterly National
Accounts).
�rt : it is the UK short-term nominal interest rate. This series is obtained by
the 3 month treasury bills: "quarterly average rate of discount, 3 month treasury
bills (Sterling)". The source is Bank of England (code IUQAAJNB in Statistical
Interactive Database).
dt : it is the UK real government de�cit. This series is obtained by the "central
government net cash requirement, current price, not seasonally adjusted, (£m)".
The source is O¢ ce for National Statistics (code RUUW in Quarterly National
Accounts). The original series is seasonally adjusted and de�ated by the �nal
consumption expenditure by household and NPISH de�ator.
31