causes and consequences of skipping class in collegecauses and consequences of skipping class ......
TRANSCRIPT

Causes and Consequences of Skipping Class in College
Carlos Dobkin, Ricard Gil, Justin Marion1
Economics Department, UC Santa Cruz
April 2007
Abstract
In this paper we estimate the effect of class attendance on exam performance by implementing a policy in three large economics classes that required students scoring below the median on the midterm exam to attend class. This policy generated a large discontinuity in the rate of post-midterm attendance. We estimate that near the threshold, the post-midterm attendance rate was 36 percentage points higher for those students facing compulsory attendance. The discontinuous attendance policy is also associated with a significant difference in performance on the final exam. We estimate that a 10 percentage point increase in a student’s overall attendance rate results in a 0.17 standard deviation increase in the final exam score without adversely affecting performance on other classes taken concurrently. Given the large estimated effect of attendance on exam performance, we then consider what motivates student absenteeism by implementing two campus wide surveys of lecture attendance. First, we observe characteristics and attendance rates of 180 large lecture courses and find little relationship between attendance and factors within the instructor’s control. Next, we conducted a web survey of undergraduates. The three main reasons undergraduates report missing class is that they needed to sleep, they felt the class was useless or they needed to prepare for another class.
1 Email: [email protected], [email protected], [email protected]. We appreciate the helpful comments of Dan Friedman, Muriel Niederle, Al Roth, and Donald Wittman. Lauren Malone, Lindsey Freitas, David Friedman, Ryan Lipert, and Katy Wallace provided excellent research assistance.
1. Introduction
The National Center for Educational Statistics estimates that American colleges and universities
spend $32 billion yearly on student instruction alone.2 This is about $12,000 per full time student.
Despite this, a significant fraction of students fail to attend course lectures, which are traditionally the
primary means by which educational material is presented to students. Past estimates place the rate of
student absenteeism as high as 40 percent (Romer, 1993). Why do students willingly forego a substantial
portion of classroom time, and what price do they pay?
From a labor market perspective, the answer to this question is not trivial. The private returns to
college performance are potentially high, for instance if firms view good grades as a signal of future
productivity. Several studies have found a strong relationship between college performance and
graduates’ salaries. Jones and Jackson (1990) find that one extra point of grade point average is
associated with 8.5 percent higher wages five years after graduation (see also James et al, 1989, and Wise,
1975).
A growing literature has attempted to understand the causes and consequences of skipping class.
Past studies have found a uniformly robust positive relationship between class attendance and
performance.3 A commonly encountered problem in the literature is the difficulty in disentangling the
causal effect of class attendance from unobserved factors such as a student’s intrinsic motivation or
interest that are almost surely correlated with both attendance and class performance.
In this paper, we use a regression discontinuity design to investigate how attendance affects
student performance on exams. To overcome the problems caused by unobserved variables, we
implemented a novel attendance policy in three large economics classes. We made attendance mandatory
for students scoring below the median on the midterm exam. Since the mandatory attendance policy is
applied to students discontinuously based on their midterm exam score, we can exploit the resulting 2 2002-2003 NCES survey http://nces.ed.gov/programs/digest/d05/tables/dt05_347.asp accessed 8/28/2006. 3 See for instance Bratti and Staffolini (2002) , Cohn and Johnson (2006), Devadoss and Foltz(1996), Dolton, Marcenaro and Navarro (2003), Durden and Ellis (1995), Kirby and McElroy (2003), Marburger(2001), Park and Kerr (1990), Rodgers (2002), Romer (1993), Schmidt (1983), and Stanca (2006).
1
discontinuity in attendance rates to identify the effect of class attendance on performance. The resulting
regression discontinuity estimates will not suffer from omitted variables bias if the unobserved student
characteristics vary continuously across the policy threshold.
The compulsory attendance policy had a significant effect on post-midterm attendance. We
estimate that near the threshold, the post-midterm attendance rate was 36 percentage points higher for
students facing compulsory attendance. This resulted in a 28 percentage point difference in the overall
class attendance rate at the threshold. The attendance policy also resulted in a significant discontinuity in
student performance on the final exam. Students scoring just above the median on the midterm, and
therefore not subject to mandatory attendance, on average scored 0.46 standard deviations lower on the
final exam than students just below the median. The instrumental variables estimates indicate that a 10
percentage point increase in a student’s overall attendance rate results in a 0.17 standard deviation
increase in the final exam score. We obtain similar results from both parametric and nonparametric
specifications, suggesting our estimates are not subject to specification error.
One concern with this design is that students in the mandatory attendance group may adjust to the
increased time spent in class by reducing the time and effort the spend on other methods for learning the
material such as teaching assistant sections, homework, and tutoring sessions. Any compensating
behavior of this sort will bias the estimated effect of class attendance downward. However, we do not
find a noticeable response by students in observable measures of effort.
Finally, attending class comes at an opportunity cost of lost time, which could be devoted to other
activities. Of primary concern is the effect of the mandatory attendance policy on student performance in
other classes. Our results may overstate the positive effect of a mandatory attendance policy on academic
performance if there are negative spillovers on other classes, for instance through crowding out effort
spent studying for other classes. We anticipate any such spillovers are likely be small, since the
mandatory attendance policy is inducing approximately one extra attended lecture per week on average,
or in other words at most two extra hours spent on the experiment class per week. We instead find that
students subject to the mandatory attendance policy in fact scored slightly higher in other classes taken
2

concurrently, though the estimated effect is not statistically significant. Therefore, we find that the
mandatory attendance policy is on the whole a positive factor in students’ academic achievement.
We feel our design offers a significant improvement over approaches taken by previous studies in
dealing with the problem of unobserved student characteristics. One approach taken in prior work is to
control in an OLS regression for factors that are likely to be correlated with student motivation. For
instance, Romer (1993) includes past GPA and fraction of past problem sets completed as proxies for
unobserved student motivation and ability. As Stanca (2006) notes, however, these controls are likely to
be only imperfectly correlated with the omitted variables, which will lead to OLS giving biased estimates.
A second approach controls for student-level fixed effects. Stanca (2006) regresses student exam
performance on a variable measuring attendance during the period the exam covered, using within student
variation in attendance over time. Using a related approach, Marburger (2001) relates the likelihood of a
student missing a question on a multiple choice exam to the student’s attendance on the day that the
material in the question was covered. This approach is appealing in that it is able to account for average
levels of student motivation and interest; however it will not be valid if a students’ interest varies across
the various subjects covered within a course. Finally, Chen and Lin (2006) perform an experiment where
they randomly removed slides from the power point presentation used during lecture. They find that
students scored worse on exam questions covering material on removed slides. This study suggests there
is a benefit to being exposed to material in class but does not give us an estimate of the value to attending
class.
In light of the large estimated benefits in terms of performance, we also explore the patterns and
causes of class attendance and how students intend to make up for the classes they miss. We explore
these issues in two ways. First, we sent four research assistants to survey all large lecture courses taught
at the UC Santa Cruz campus in the spring quarter of 2006. The research assistants counted the number of
students attending and recorded various class characteristics. We find that immutable course
characteristics, such as the time the course starts, play the largest role in determining attendance, and
3

aside from making lecture attendance mandatory, factors within the instructor’s control play little role in
determining attendance rates.
Next, we conducted a web survey of students across campus asking how many classes they
missed in the prior week, why they missed those classes, and how they intended to make up for the
absences. The majority of students missed at least one class, and the primary reason students do not
attend class is that they slept in. Most students intend to make up for skipped lectures. For instance, 54
percent of those who skip plan to attend a TA review section to make up for missed class. This result,
combined with the fact that in our classes we fail to see a response in TA section attendance to the
mandatory lecture attendance policy, suggests a commitment problem where students do not follow
through on their intentions to make up for missed material. Mandatory attendance may therefore increase
students’ time devoted to class.
The paper proceeds as follows. In section 2, we discuss the three sources of data used – the
policy experiment in our own classes, the campus-wide survey of lecture classes, and the web survey of
UC Santa Cruz students. In section 3, we describe the methods we will use to estimate the relationship
between attendance and performance. In section 4 we discuss the results, and section 5 concludes.
2. Data
There are three sources of data for this project: administrative data from three large classes in
which we implemented a class attendance policy, an observational survey of 180 classes and a web based
survey of a random sample of 1000 students. We describe each data source in detail in the subsections
below.
2.1 Administrative Data from Three Large Classes
4

In three large intermediate level economics classes4, we implemented a policy where class
attendance was voluntary up until the day of the midterm. After the midterm, students with grades below
the median exam score were required to attend class, while class attendance was still voluntary for
students that scored above the midterm. The midterm for each of these courses occurred at approximately
the middle of the quarter. In addition to the midterm, the course grade was based on a final exam and a
series of problem sets.5
The policy was announced on the first day of class, and students were reminded of the policy on
the day the midterms were returned. The students that scored below the median on the midterm were also
reminded via e-mail that they were required to attend class. The teaching assistants recorded attendance as
students arrived for lecture and insured that students that left before the end of the class were not marked
down as attending.
Each class also had several weekly review sections held by teaching assistants, and the university
offered a weekly group tutoring session that students could attend to obtain additional help with course
material. For each student as part of the course administration we recorded TA section attendance,
tutoring sessions attended, scores on the homework, score on the midterm, score on the final, gender, year
in school, and major. We also obtained information on each student’s cumulative GPA entering the
quarter and performance in other courses taken in the same quarter as the experiment course.
2.2 Survey of Class Characteristics and Attendance
We hired a team of four research assistants to attend each lecture course with more than 50
students taught in the spring quarter of 2006 at UC-Santa Cruz. There were 180 such courses taught that
4 Two of the courses were intermediate microeconomics, and the third was introduction to econometrics. The course composition was primarily sophomores, juniors, and seniors, with typically a very small fraction of the class comprised by freshmen. 5 Exams typically consisted of long-response problems, including a true-false section where the grade was based on the student’s explanation and one or more multi-part extended problems. The authors of the study were the instructors for the courses; however the exam grading was entirely carried out by between two and four teaching assistants (TA) who each graded a portion of the exam. In general, the teaching assistants who performed the grading duties were not informed which students were subject to compulsory attendance, though in two sections one of the TAs who helped grade also assisted with entering midterm scores.
5

quarter. For each class surveyed, the research assistants arrived 15 minutes before lecture was scheduled
to start and asked three students if class attendance was mandatory, and if so was the attendance policy
enforced in some way. The research assistant also asked each student if the lecture notes were posted
online, or if there were some other outside source for the lecture material. After the class started the
research assistant observed the class and determined the answers to a series of questions about the
professor’s teaching style. The questions included how organized and energetic the instructor was, what
teaching modality the professor used, and how engaged the students in the class were.6 At the 15th minute
of the lecture, the research assistant counted the number of students in the class and then counted them
again 5 minutes later. After each course had been observed once, the research assistants began surveying
randomly selected courses a second time. In total, 74 courses were observed more than once, leading to a
total of 254 class observations. Many of the observations occurred on days with exams or when a video
was shown. Dropping these left 211 usable observations.
2.3 Web Based Student Survey
We administered a web based survey to 1,000 randomly selected students on the second to last
week of the quarter. The students were e-mailed a description of the survey, which included a link to the
online survey.7 The survey asked students how many classes they skipped, how many hours they spent
working, how many hours they spent on extracurricular activities, how they made up for skipped classes
and an open ended question on why they skipped class. Of the 1,000 students we contacted via e-mail,
418 completed the survey.
3. Methods
We start by examining the impact of the class attendance policy graphically by plotting the
various outcomes over the support of the midterm score. We then estimate the impact of the policy on the 6 The survey instrument the research assistants used is presented in Appendix E. 7 A screenshot of the web bases survey is included in Appendix F.
6
various outcomes and the return to attending class using both parametric and nonparametric models. The
details of the two approaches are presented in the two following subsections.
3.1 Parametric model
The primary goal of this paper is to estimate the effect of class attendance on final exam
performance. We are interested in estimating the following relationship
0 1 2i iy B attend Xi iβ β ε= + + + (1)
where yi is the exam score for student i, is the attendance rate for student i, and iattend iX are the
observable characteristics of student i. The parameter of interest is the return to attending class 1β . Getting
consistent estimates of this parameter is complicated by the fact that there are probably omitted variables,
such as motivation, that are correlated with both class attendance and performance in the class.
To solve this problem we take advantage of the discontinuity in attendance induced by the class
policy. This lets us compare students that scored just below the median on the midterm and were required
to attend class with those who scored just above and were not required to attend class. These two groups
are likely to be very similar in their pre midterm characteristics easing concerns about omitted variables
bias. Furthermore, students do not know ahead of time exactly what the median score of the midterm will
be. In settings with a policy threshold that is known ex ante, the regression discontinuity design is
potentially subject to the manipulation of the running variable. For instance, if the policy threshold was
known in advance and the midterm score were a deterministic function of effort, then unmotivated
students may provide just enough effort to score above the median. Not only is the median score not
known in advance, but also the midterm score is not a deterministic function of effort due to factors such
as noise in grading, the particular questions that happen to be asked on the exam, and the random
variation in performance on a given day. Therefore, even if students knew the cutoff well in advance,
unobserved motivation will still be continuous across the threshold.
7
We estimate the discontinuity that occurs at the midterm parametrically using the following
model
0 1 1( )i i iattend ab f midterm Xi iα α ε= + + +Π + (2)
where is the attendance for individual i, is an indicator variable equal to 1 if individual i
scored above the median on the midterm,
iattend iab
( i )f midterm is a low order polynomial of the midterm score,
Xi is a set of covariates, and iε is an idiosyncratic error term. The coefficient 1α is the estimate of how
much the mandatory attendance policy changes the outcome . To determine if the mandatory
attendance policy affected students’ final exam scores we estimated the following model
iattend
0 1 2( )i i iy ab g midterm Xi iδ δ γ= + + +Π + (3)
where yi is the exam score for student i and iγ is the idiosyncratic error term. To obtain the instrumental
variables estimate of the return to attending class we examine the ratio 1 1/δ α .8
The instrumental variables estimate is still potentially subject to omitted variables bias if students
respond to the compulsory attendance policy by adjusting the amount of time they allocate to other modes
of learning. For instance if students required to attend class reduced how much they study, this will lead
us to underestimate the benefits of class attendance. While we do not observe how much time students
spent studying, we do have several measures of outside effort, such as attendance of sections run by the
teaching assistants, homework scores, and the use of university provided tutors. We will estimate
specifications similar to (3) with measures of these other forms of effort as the dependant variable to
determine if students respond to the compulsory attendance policy by altering their level of effort.
3.2 Nonparametric model
Though we experiment with different parametric specifications, and a visual examination of the
data suggests that the regression specified above fits that data well, one important limitation of the
8 In Appendices A-D we present graphical and regression evidence on how sensitive the results are to the order of the polynomial and the size of the window around the discontinuity the regression is estimated from.
8
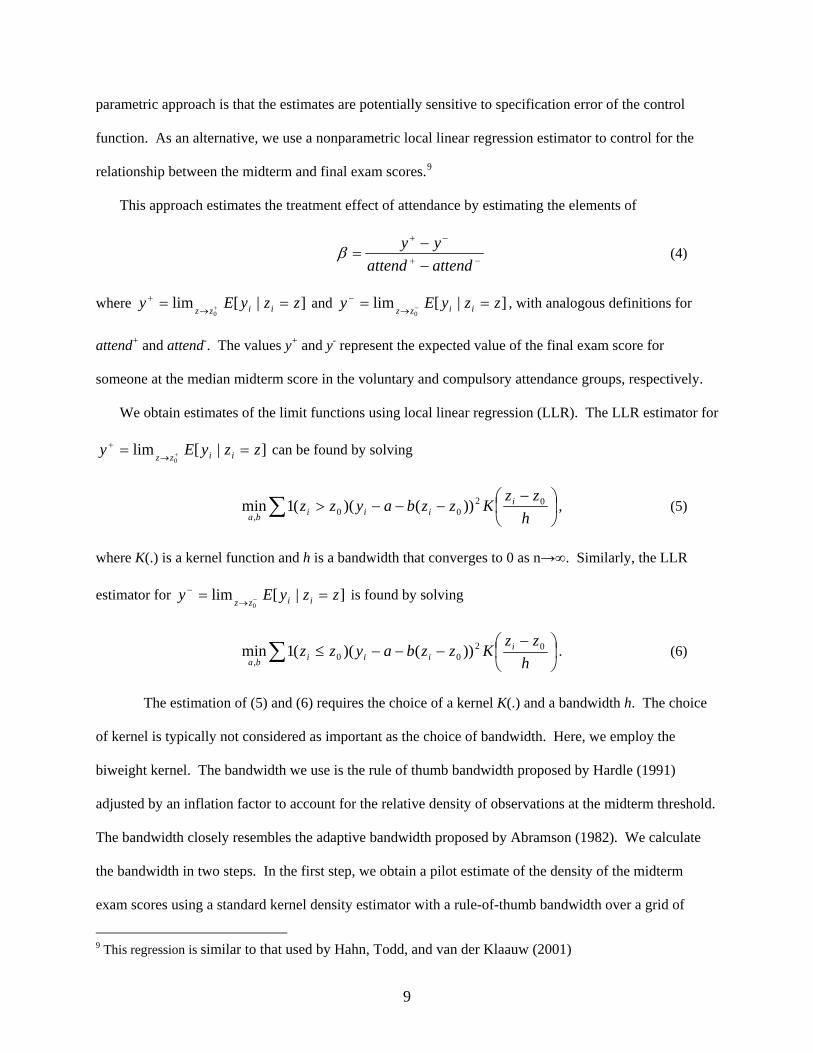
parametric approach is that the estimates are potentially sensitive to specification error of the control
function. As an alternative, we use a nonparametric local linear regression estimator to control for the
relationship between the midterm and final exam scores.9
This approach estimates the treatment effect of attendance by estimating the elements of
−+
−+
−−
=attendattendyyβ (4)
where and , with analogous definitions for
attend
]|[lim0
zzyEy iizz == +→+ ]|[lim
0zzyEy iizz == −→
−
+ and attend-. The values y+ and y- represent the expected value of the final exam score for
someone at the median midterm score in the voluntary and compulsory attendance groups, respectively.
We obtain estimates of the limit functions using local linear regression (LLR). The LLR estimator for
can be found by solving ]|[lim0
zzyEy iizz == +→+
∑ ⎟⎠⎞
⎜⎝⎛ −
−−−>h
zzKzzbayzz i
iiiba
0200,))()((1min , (5)
where K(.) is a kernel function and h is a bandwidth that converges to 0 as n→∞. Similarly, the LLR
estimator for is found by solving ]|[lim0
zzyEy iizz== −→
−
∑ ⎟⎠⎞
⎜⎝⎛ −
−−−≤h
zzKzzbayzz i
iiiba
0200,))()((1min . (6)
The estimation of (5) and (6) requires the choice of a kernel K(.) and a bandwidth h. The choice
of kernel is typically not considered as important as the choice of bandwidth. Here, we employ the
biweight kernel. The bandwidth we use is the rule of thumb bandwidth proposed by Hardle (1991)
adjusted by an inflation factor to account for the relative density of observations at the midterm threshold.
The bandwidth closely resembles the adaptive bandwidth proposed by Abramson (1982). We calculate
the bandwidth in two steps. In the first step, we obtain a pilot estimate of the density of the midterm
exam scores using a standard kernel density estimator with a rule-of-thumb bandwidth over a grid of
9 This regression is similar to that used by Hahn, Todd, and van der Klaauw (2001)
9

points spanning the support of z. The estimated density for each grid point is obtained from the kernel
estimator
∑=
⎟⎟⎠
⎞⎜⎜⎝
⎛ −=
n
i
jj h
zzK
hnzf
1 '11)(~
(7)
where h’ is the rule of thumb bandwidth obtained from
5/106.1*' −= nch σ . (8)
The constant c for the biweight kernel is 2.778, and σ represents the standard deviation of the running
variable, z.
The second step involves inflating the rule-of-thumb bandwidth h’ using the relative density
observed at the threshold, such that 5.0 ))(~/'*( zfGhh = , where G is the average density across all grid
points. This will allow the rule-of-thumb to adjust to the density of observations near the threshold,
becoming smaller as there are relatively more observations and larger when there are relatively few.
4. Results
In this section we start by using the discontinuities in class attendance caused by the mandatory
attendance policy to get unbiased estimates of the return to attending class. We then determine what class
level characteristics are correlated with low attendance. We finish by examining students’ explanations
for why they missed class and how they report making up for missing class.
4.1 Class attendance and performance
In the three courses with the attendance policy the average attendance rate was 78 percent in the
period before attendance became mandatory. This is only slightly higher than 75 percent attendance rate
we observed campus wide in the first half of the quarter. The attendance rates of individual students in
the three courses where the attendance policy was implemented varied significantly. As shown in Figure
10
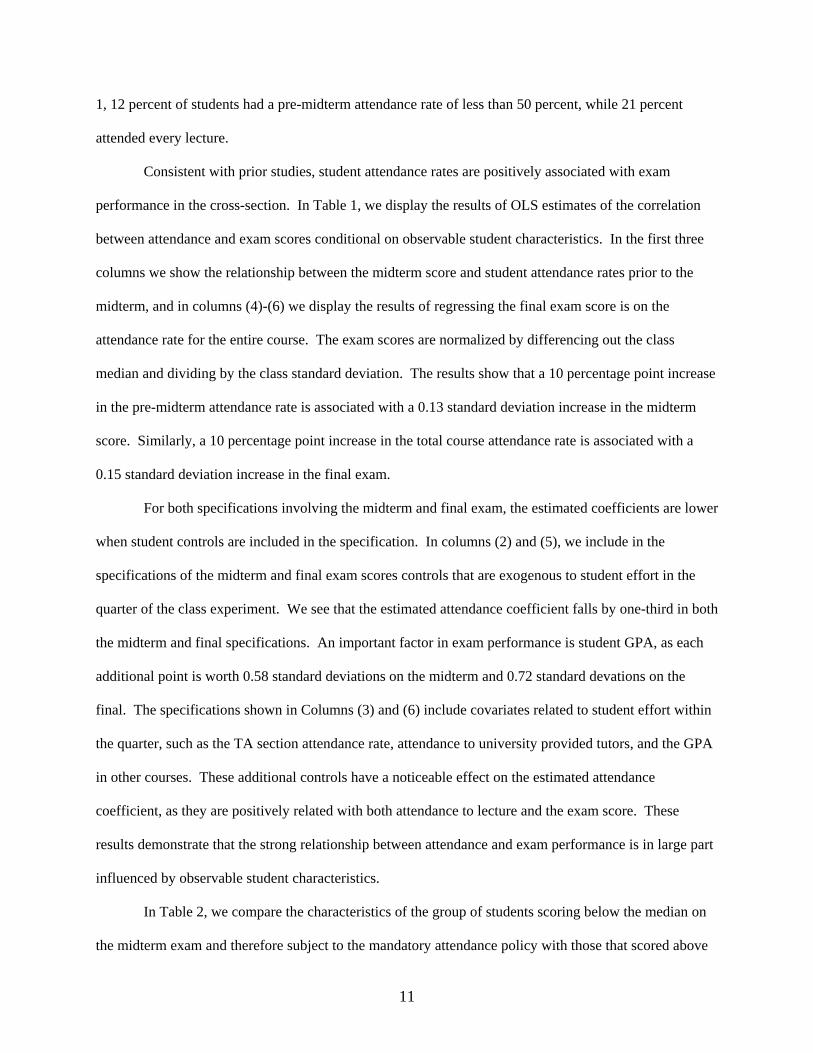
1, 12 percent of students had a pre-midterm attendance rate of less than 50 percent, while 21 percent
attended every lecture.
Consistent with prior studies, student attendance rates are positively associated with exam
performance in the cross-section. In Table 1, we display the results of OLS estimates of the correlation
between attendance and exam scores conditional on observable student characteristics. In the first three
columns we show the relationship between the midterm score and student attendance rates prior to the
midterm, and in columns (4)-(6) we display the results of regressing the final exam score is on the
attendance rate for the entire course. The exam scores are normalized by differencing out the class
median and dividing by the class standard deviation. The results show that a 10 percentage point increase
in the pre-midterm attendance rate is associated with a 0.13 standard deviation increase in the midterm
score. Similarly, a 10 percentage point increase in the total course attendance rate is associated with a
0.15 standard deviation increase in the final exam.
For both specifications involving the midterm and final exam, the estimated coefficients are lower
when student controls are included in the specification. In columns (2) and (5), we include in the
specifications of the midterm and final exam scores controls that are exogenous to student effort in the
quarter of the class experiment. We see that the estimated attendance coefficient falls by one-third in both
the midterm and final specifications. An important factor in exam performance is student GPA, as each
additional point is worth 0.58 standard deviations on the midterm and 0.72 standard devations on the
final. The specifications shown in Columns (3) and (6) include covariates related to student effort within
the quarter, such as the TA section attendance rate, attendance to university provided tutors, and the GPA
in other courses. These additional controls have a noticeable effect on the estimated attendance
coefficient, as they are positively related with both attendance to lecture and the exam score. These
results demonstrate that the strong relationship between attendance and exam performance is in large part
influenced by observable student characteristics.
In Table 2, we compare the characteristics of the group of students scoring below the median on
the midterm exam and therefore subject to the mandatory attendance policy with those that scored above
11
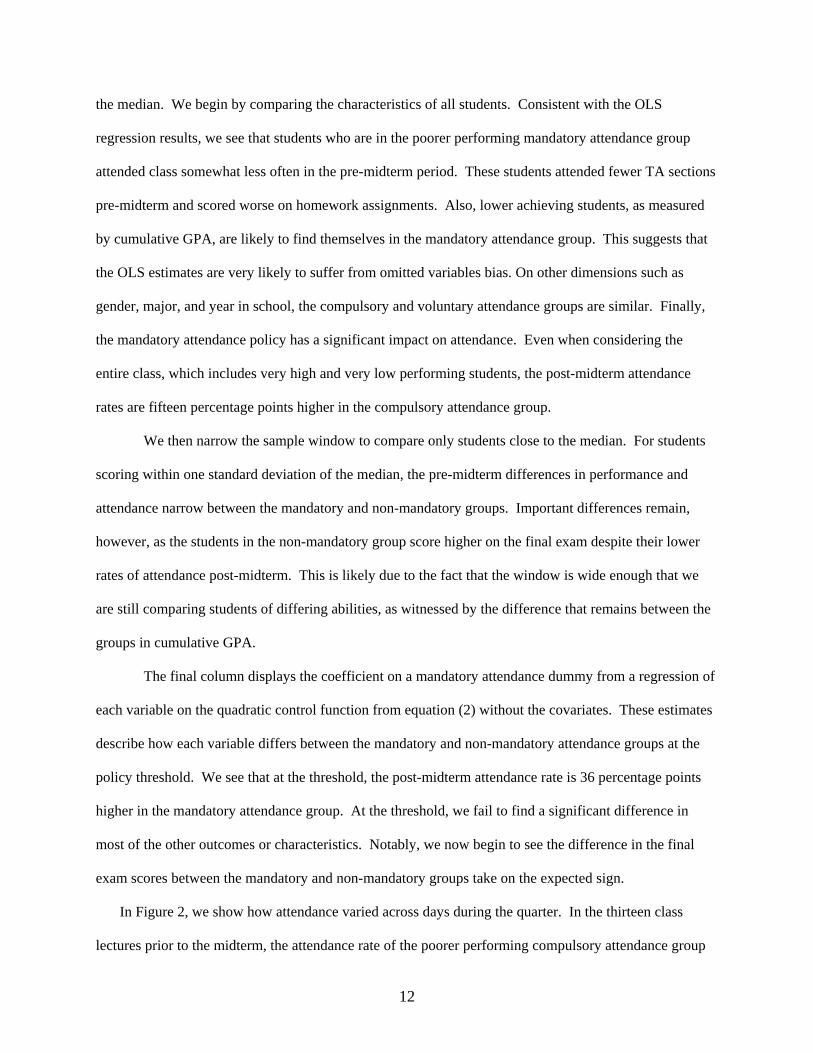
the median. We begin by comparing the characteristics of all students. Consistent with the OLS
regression results, we see that students who are in the poorer performing mandatory attendance group
attended class somewhat less often in the pre-midterm period. These students attended fewer TA sections
pre-midterm and scored worse on homework assignments. Also, lower achieving students, as measured
by cumulative GPA, are likely to find themselves in the mandatory attendance group. This suggests that
the OLS estimates are very likely to suffer from omitted variables bias. On other dimensions such as
gender, major, and year in school, the compulsory and voluntary attendance groups are similar. Finally,
the mandatory attendance policy has a significant impact on attendance. Even when considering the
entire class, which includes very high and very low performing students, the post-midterm attendance
rates are fifteen percentage points higher in the compulsory attendance group.
We then narrow the sample window to compare only students close to the median. For students
scoring within one standard deviation of the median, the pre-midterm differences in performance and
attendance narrow between the mandatory and non-mandatory groups. Important differences remain,
however, as the students in the non-mandatory group score higher on the final exam despite their lower
rates of attendance post-midterm. This is likely due to the fact that the window is wide enough that we
are still comparing students of differing abilities, as witnessed by the difference that remains between the
groups in cumulative GPA.
The final column displays the coefficient on a mandatory attendance dummy from a regression of
each variable on the quadratic control function from equation (2) without the covariates. These estimates
describe how each variable differs between the mandatory and non-mandatory attendance groups at the
policy threshold. We see that at the threshold, the post-midterm attendance rate is 36 percentage points
higher in the mandatory attendance group. At the threshold, we fail to find a significant difference in
most of the other outcomes or characteristics. Notably, we now begin to see the difference in the final
exam scores between the mandatory and non-mandatory groups take on the expected sign.
In Figure 2, we show how attendance varied across days during the quarter. In the thirteen class
lectures prior to the midterm, the attendance rate of the poorer performing compulsory attendance group
12
was consistently lower on each day, as one would expect. Attendance started out high in the first week
and then tapered off, picking back up as the midterm approached. On the day the midterms are returned,
attendance is near the highest for the entire quarter. On this day, students find out their scores and learn
whether they are in the compulsory attendance group. On the day of the following lecture, the attendance
rate of the voluntary group drops substantially to only 60 percent, while the attendance rate of the
mandatory group increases to 85 percent and hovers there for the remainder of the quarter. We will show
that the pattern seen in the voluntary group resembles that observed in other classes on campus, where
after the midpoint of the quarter, attendance drops off noticeably. It appears that the primary effect of the
mandatory policy is in preventing the post-midterm attendance decline.
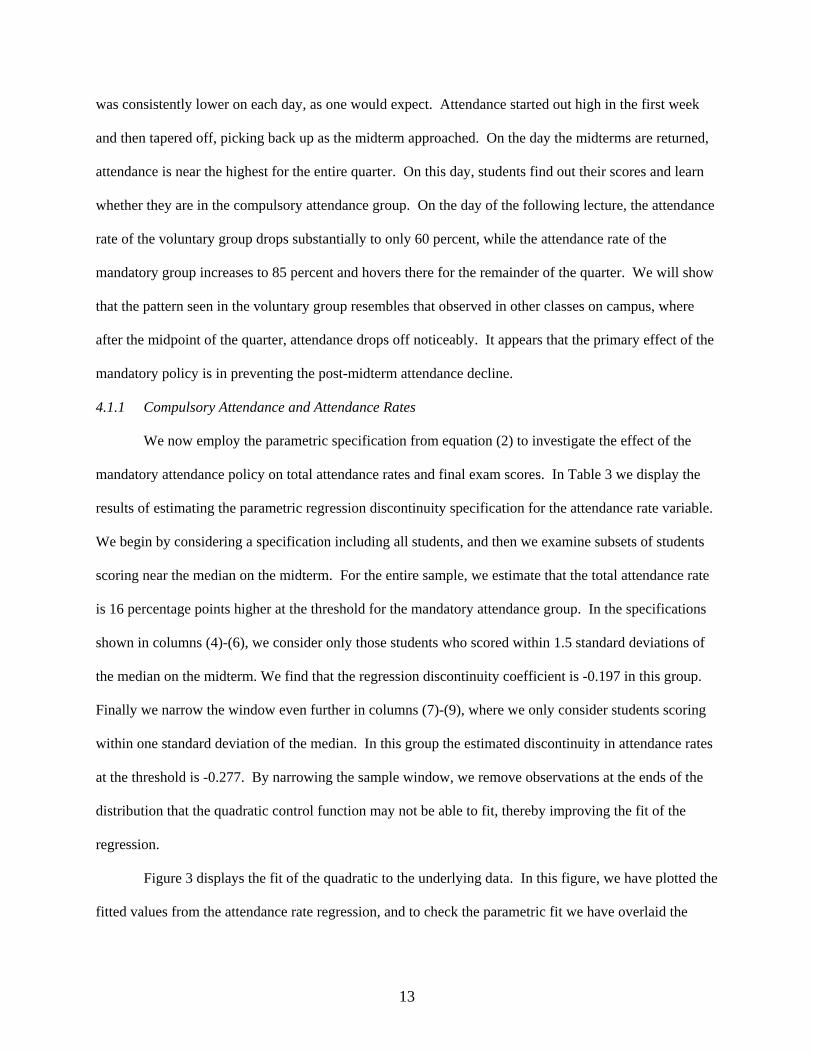
4.1.1 Compulsory Attendance and Attendance Rates
We now employ the parametric specification from equation (2) to investigate the effect of the
mandatory attendance policy on total attendance rates and final exam scores. In Table 3 we display the
results of estimating the parametric regression discontinuity specification for the attendance rate variable.
We begin by considering a specification including all students, and then we examine subsets of students
scoring near the median on the midterm. For the entire sample, we estimate that the total attendance rate
is 16 percentage points higher at the threshold for the mandatory attendance group. In the specifications
shown in columns (4)-(6), we consider only those students who scored within 1.5 standard deviations of
the median on the midterm. We find that the regression discontinuity coefficient is -0.197 in this group.
Finally we narrow the window even further in columns (7)-(9), where we only consider students scoring
within one standard deviation of the median. In this group the estimated discontinuity in attendance rates
at the threshold is -0.277. By narrowing the sample window, we remove observations at the ends of the
distribution that the quadratic control function may not be able to fit, thereby improving the fit of the
regression.
Figure 3 displays the fit of the quadratic to the underlying data. In this figure, we have plotted the
fitted values from the attendance rate regression, and to check the parametric fit we have overlaid the
13

average attendance rate in each of a series of 0.02 standard deviation wide midterm score bins.10 This
figure clearly illustrates the dramatic discontinuity in attendance around the threshold. Also, the quadratic
control function of the running variable seems successful at capturing the primary features of the
relationship between attendance rates and the midterm score. The effect of the mandatory attendance
policy comes from its impact on post-midterm attendance rates, as shown by Figure 4. In this figure, we
see that there is virtually no discontinuity in pre-midterm attendance, while there is a large discontinuity
in post-midterm attendance.
4.1.2 Compulsory Attendance and Final Exam Score
We next estimate how the final exam score varies across the policy threshold. Figure 5 illustrates
how the final exam changes over the support of the midterm. In this figure, we plot the mean final exam
scores over a set of midterm score bins. Those students whose midterm score fell just below the median
score noticeably higher than those students scoring just above the median. Interestingly, while there is a
strong positive relationship between the midterm and final exam score, there is also significant mean
reversion in the final exam scores. Students scoring 1.3 standard deviations above the median on the
midterm only score just over 0.5 standard deviations above the median on the final exam.
In Table 4 we present the corresponding regression results. For the entire sample, the estimated
discontinuity is -0.140, indicating that at the threshold, those in the compulsory attendance group score
0.140 standard deviations higher on the final exam than those not in the compulsory attendance group.
This difference is not statistically significant though. However, the estimated affect of compulsory
attendance increases as we narrow the sample window around the threshold. Within 1.5 standard
deviations of the cutoff, the compulsory attendance group scores 0.265 standard deviations higher.
Finally, when we consider only those scoring within one standard deviation of the cutoff, the estimated
effect of compulsory attendance is 0.457 standard deviations higher on the final exam. The inclusion of
other controls in addition to the quadratic control function seems to have a small effect on the results.
10 The regression is estimated off the individual data but to make the figure more interpretable we plot the averages for the cells rather than the underlying data.
14

With no controls, the discontinuity coefficient is -0.427. Adding controls for student characteristics such
as gender, year in school, major, and cumulative GPA brings the coefficient to -0.413. The final
coefficient of -0.457 is obtained when also controlling for TA section attendance, tutor attendance, and
GPA in other courses in the same quarter.
4.1.3 Confounding Factors
One motivation for separately considering specifications controlling for teaching assistant section
attendance and the use of tutor services is that these are endogenously determined variables. One concern
with these specifications relates to the possibility that students are substituting effort across alternative
forms of learning. Students in the compulsory attendance group may respond to induced attendance by
reducing effort in other ways. While we do not observe time spent studying outside class, we can get a
sense for the magnitude of this substitution by examining the observable forms of effort.
In Figure 6, we plot how TA section attendance varies over the support of the midterm score. As
this figure shows, however, there seems to be virtually no discontinuity in the attendance rate to TA
sections at the threshold. Another measure of student effort is performance on the homework. We plot
how average homework scores vary across the policy threshold in Figure 7. While this measure may be
problematic since homework performance may be directly influenced by attendance, we feel that the
largest component is student effort. Again, we see little evidence of a discontinuity in performance across
the threshold.
These results also cast doubt on a separate source of endogeneity that may bias the results. Since
course grades are determined by a student’s relative standing in the class, mandatory attendance for those
scoring below the median may have an equilibrium effect on the effort of students scoring above the
median. First, the untreated students may anticipate the higher performance of the treated group and
increase their effort to keep up, thereby biasing downward the estimated effect of attendance. On the
other hand, untreated students may think there will be a penalty assessed on the treated students who fail
to attend class and will feel that less effort is required, thereby biasing our estimates upward. However,
we find no difference in measures of effort across the threshold. This would seem to rule out such
15
equilibrium effects except in the unlikely case that the attendance policy effects effort equally for the
treated and untreated students.
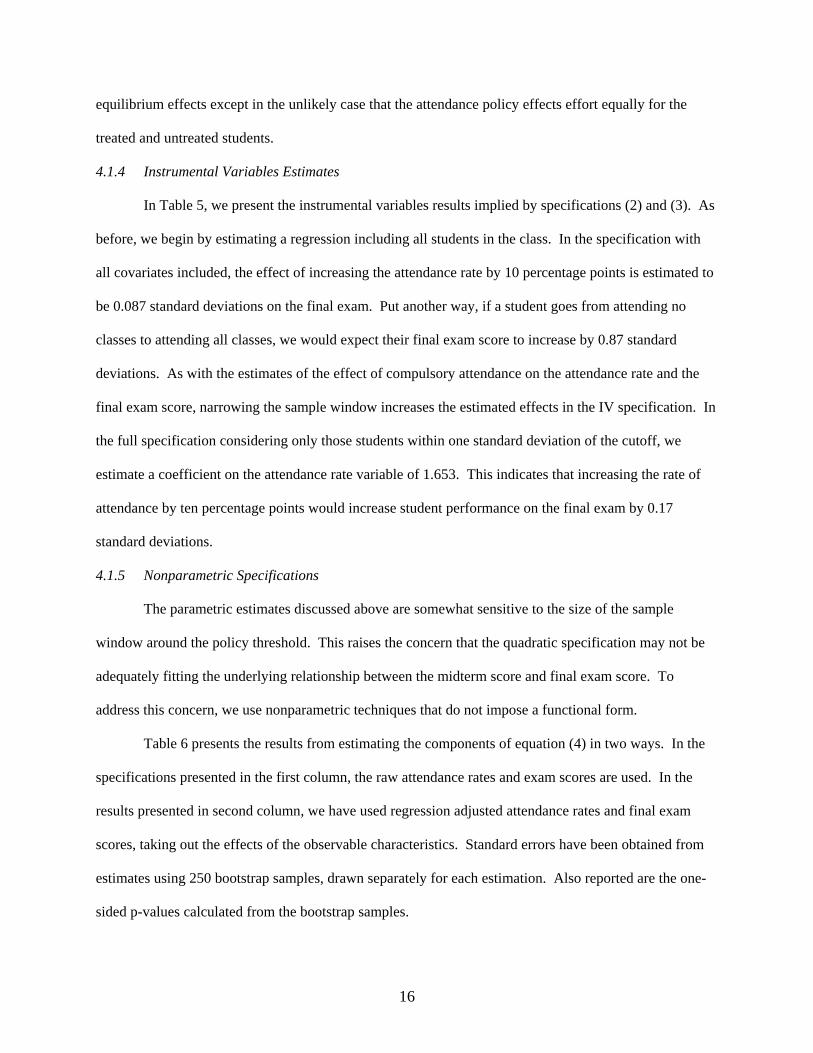
4.1.4 Instrumental Variables Estimates
In Table 5, we present the instrumental variables results implied by specifications (2) and (3). As
before, we begin by estimating a regression including all students in the class. In the specification with
all covariates included, the effect of increasing the attendance rate by 10 percentage points is estimated to
be 0.087 standard deviations on the final exam. Put another way, if a student goes from attending no
classes to attending all classes, we would expect their final exam score to increase by 0.87 standard
deviations. As with the estimates of the effect of compulsory attendance on the attendance rate and the
final exam score, narrowing the sample window increases the estimated effects in the IV specification. In
the full specification considering only those students within one standard deviation of the cutoff, we
estimate a coefficient on the attendance rate variable of 1.653. This indicates that increasing the rate of
attendance by ten percentage points would increase student performance on the final exam by 0.17
standard deviations.
4.1.5 Nonparametric Specifications
The parametric estimates discussed above are somewhat sensitive to the size of the sample
window around the policy threshold. This raises the concern that the quadratic specification may not be
adequately fitting the underlying relationship between the midterm score and final exam score. To
address this concern, we use nonparametric techniques that do not impose a functional form.
Table 6 presents the results from estimating the components of equation (4) in two ways. In the
specifications presented in the first column, the raw attendance rates and exam scores are used. In the
results presented in second column, we have used regression adjusted attendance rates and final exam
scores, taking out the effects of the observable characteristics. Standard errors have been obtained from
estimates using 250 bootstrap samples, drawn separately for each estimation. Also reported are the one-
sided p-values calculated from the bootstrap samples.
16
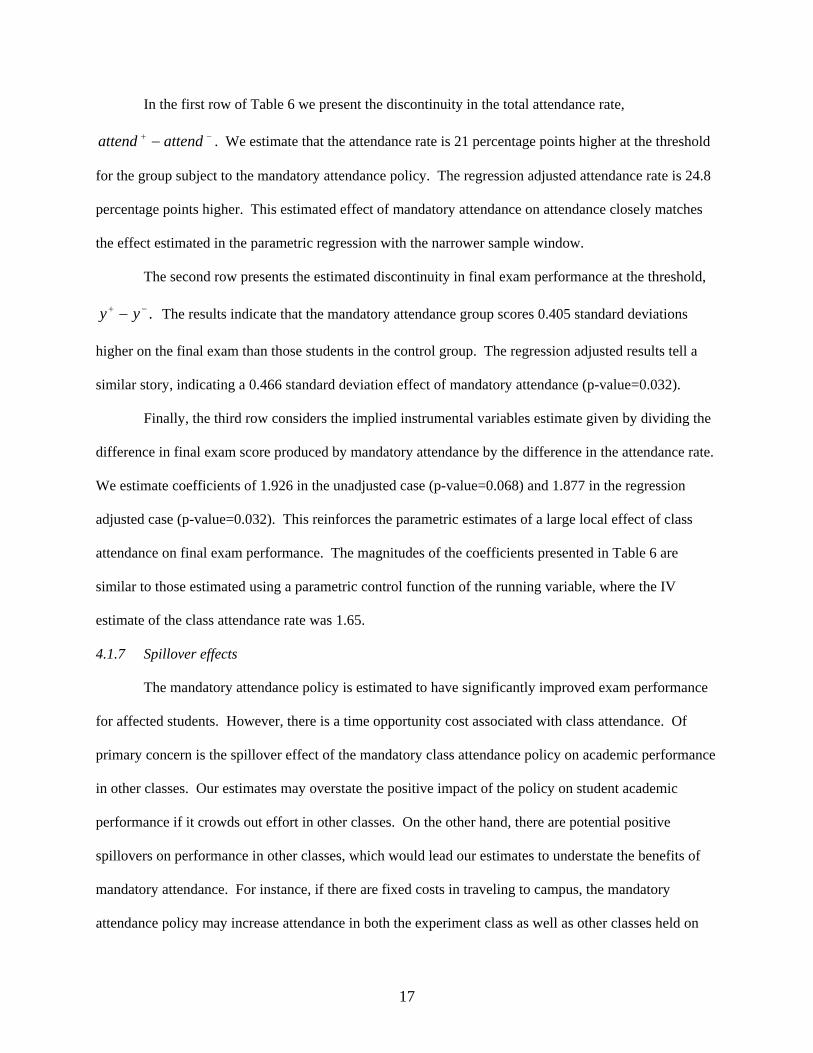
In the first row of Table 6 we present the discontinuity in the total attendance rate,
. We estimate that the attendance rate is 21 percentage points higher at the threshold
for the group subject to the mandatory attendance policy. The regression adjusted attendance rate is 24.8
percentage points higher. This estimated effect of mandatory attendance on attendance closely matches
the effect estimated in the parametric regression with the narrower sample window.
−+ − attendattend
The second row presents the estimated discontinuity in final exam performance at the threshold,
The results indicate that the mandatory attendance group scores 0.405 standard deviations
higher on the final exam than those students in the control group. The regression adjusted results tell a
similar story, indicating a 0.466 standard deviation effect of mandatory attendance (p-value=0.032).
.−+ − yy
Finally, the third row considers the implied instrumental variables estimate given by dividing the
difference in final exam score produced by mandatory attendance by the difference in the attendance rate.
We estimate coefficients of 1.926 in the unadjusted case (p-value=0.068) and 1.877 in the regression
adjusted case (p-value=0.032). This reinforces the parametric estimates of a large local effect of class
attendance on final exam performance. The magnitudes of the coefficients presented in Table 6 are
similar to those estimated using a parametric control function of the running variable, where the IV
estimate of the class attendance rate was 1.65.
4.1.7 Spillover effects
The mandatory attendance policy is estimated to have significantly improved exam performance
for affected students. However, there is a time opportunity cost associated with class attendance. Of
primary concern is the spillover effect of the mandatory class attendance policy on academic performance
in other classes. Our estimates may overstate the positive impact of the policy on student academic
performance if it crowds out effort in other classes. On the other hand, there are potential positive
spillovers on performance in other classes, which would lead our estimates to understate the benefits of
mandatory attendance. For instance, if there are fixed costs in traveling to campus, the mandatory
attendance policy may increase attendance in both the experiment class as well as other classes held on
17
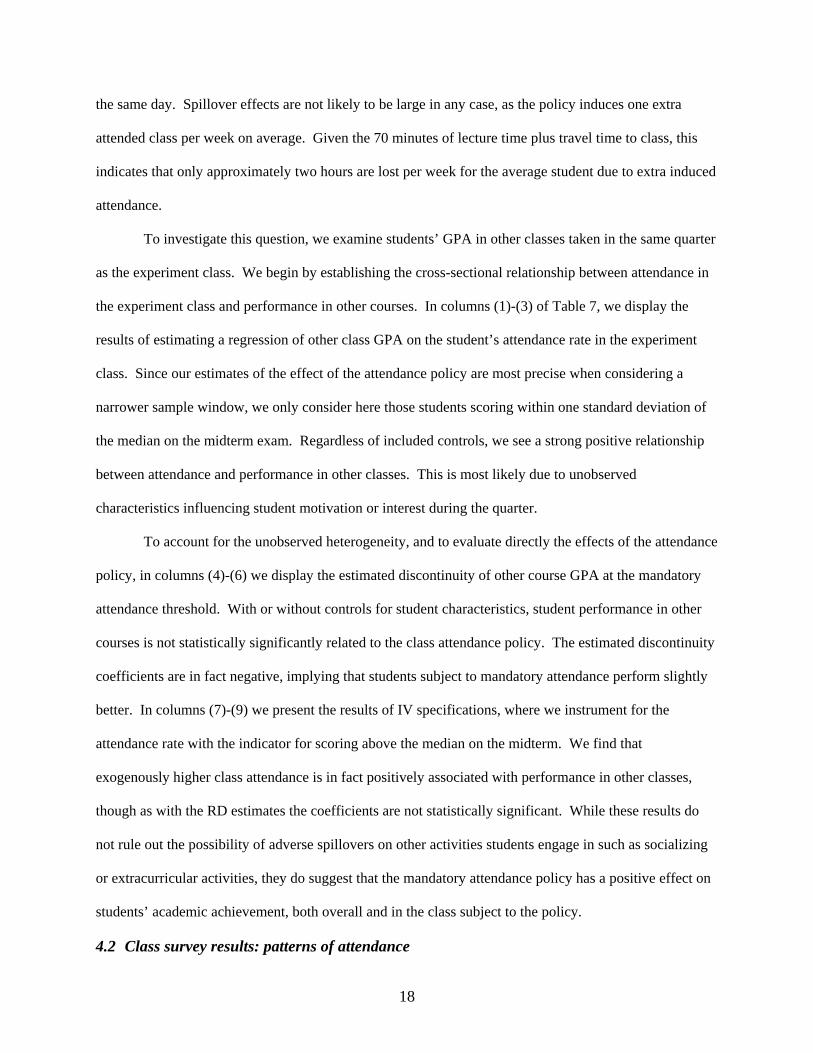
the same day. Spillover effects are not likely to be large in any case, as the policy induces one extra
attended class per week on average. Given the 70 minutes of lecture time plus travel time to class, this
indicates that only approximately two hours are lost per week for the average student due to extra induced
attendance.
To investigate this question, we examine students’ GPA in other classes taken in the same quarter
as the experiment class. We begin by establishing the cross-sectional relationship between attendance in
the experiment class and performance in other courses. In columns (1)-(3) of Table 7, we display the
results of estimating a regression of other class GPA on the student’s attendance rate in the experiment
class. Since our estimates of the effect of the attendance policy are most precise when considering a
narrower sample window, we only consider here those students scoring within one standard deviation of
the median on the midterm exam. Regardless of included controls, we see a strong positive relationship
between attendance and performance in other classes. This is most likely due to unobserved
characteristics influencing student motivation or interest during the quarter.
To account for the unobserved heterogeneity, and to evaluate directly the effects of the attendance
policy, in columns (4)-(6) we display the estimated discontinuity of other course GPA at the mandatory
attendance threshold. With or without controls for student characteristics, student performance in other
courses is not statistically significantly related to the class attendance policy. The estimated discontinuity
coefficients are in fact negative, implying that students subject to mandatory attendance perform slightly
better. In columns (7)-(9) we present the results of IV specifications, where we instrument for the
attendance rate with the indicator for scoring above the median on the midterm. We find that
exogenously higher class attendance is in fact positively associated with performance in other classes,
though as with the RD estimates the coefficients are not statistically significant. While these results do
not rule out the possibility of adverse spillovers on other activities students engage in such as socializing
or extracurricular activities, they do suggest that the mandatory attendance policy has a positive effect on
students’ academic achievement, both overall and in the class subject to the policy.
4.2 Class survey results: patterns of attendance
18

In light of the large estimated effects of class attendance on performance, we document the
patterns of attendance across classes and then quantify the factors that influence class attendance. This
will provide some indirect insight into some of the factors that influence students’ decisions regarding
class attendance. In the 211 lecture classes we surveyed in the Spring Quarter of 2006 with usable
observations, the average attendance rate was 67 percent. However we find that attendance varied very
significantly across classes. The worst attended class had a 19 percent attendance rate, and in 12 classes
all students were in attendance. In Figure 8 we present the histogram of class attendance. The majority of
classes have between 35 and 90 percent of the students attending, with the modal class having an
attendance rate of between 60 and 65 percent.
In Figure 9 we present the time path of attendance by gender over the course of the quarter. The
figure shows that men and women have very similar attendance patterns. Also, attendance is high at the
beginning of the quarter and subsequently drops off rapidly, reaching a low point in week six, perhaps
following midterm exams. In week ten, the week before finals, attendance recovers to the pre-midterm
rates. Figure 10 shows the attendance pattern by class starting time. The classes with an 8 AM start time
are very sparsely attended, with only slightly more than half of the students attending. Attendance slowly
increases through the day with the highest attendance among the classes in the early evening.
Next, we examine which factors are able to explain class attendance patterns across classes. We
regress the attendance rate observed in a particular lecture on a set of lecture, instructor, and course
characteristics. The results of this estimation are shown in Table 8. Surprisingly, instructor
characteristics such as age, English proficiency, appearance, and legible writing are not significant
determinants of attendance. The insignificance of the instructor appearance variable is interesting in light
of past results finding a positive association between attractiveness and student ratings of the professor
(see Hamermesh and Parker, 2005). Nor does it seem to matter how material is conveyed to students, as
the use of an overhead projector, the chalkboard, or power point are not statistically significantly
correlated with class attendance. Few of the variables under the instructors control have a noticeable
impact on class attendance. One exception is making lecture notes available online which depresses
19

attendance by 4.5 percent. Unsurprisingly mandatory attendance and monitoring student attendance are
associated with increased student attendance.
Class characteristics largely out of instructors’ control seem to exert the largest influence over
attendance rates. Factors such as the week of the quarter, day of the week, start time, and class size all
have effects on attendance rates in the expected direction. Finally, having an exam coming up in the next
seven days is associated with an increase in attendance of 8.4 percent. These results suggest that there is
little a professor can do to raise attendance rates short of making class mandatory.
4.3 Web survey results: motivations for absenteeism
Finally, we turn to the results of the web survey of class attendance, which are shown in Table 9.
Of the 1000 students surveyed 413 responded and on average reported skipping 15 percent of their classes
in the preceding week. This is considerably below approximately 30 percent of students that were
observed to be missing from the randomly selected lecture classes surveyed on the second to last week of
the quarter which is when the survey was conducted. This discrepancy may be because the student survey
covered all classes including small ones that typically have high attendance rates, while the class survey
covered only lecture classes. Another possibility is that students that responded to the survey may be
more responsible than the typical student, though it would require a very high absentee rate from the non-
respondents to explain the discrepancy. Another, possibly more plausible explanation is that the
respondents are underreporting the rate at which they skip class.
In all, 56 percent of students report skipping at least one class in the prior seven days. The most
common reason for missing class is sleeping in. This motivation was provided by 25 percent of those
who skipped. The next most popular reasons provided were the closely related answers that class was
“boring” or “useless,” which combined account for 25 percent of responses. Finally 14 percent indicated
that they skipped a class in order to complete work for another class.
How do students report they make up for missed classes? Most of them indicate that they intend
to read from the textbook, with 79 percent providing this response. A common make-up method was
20
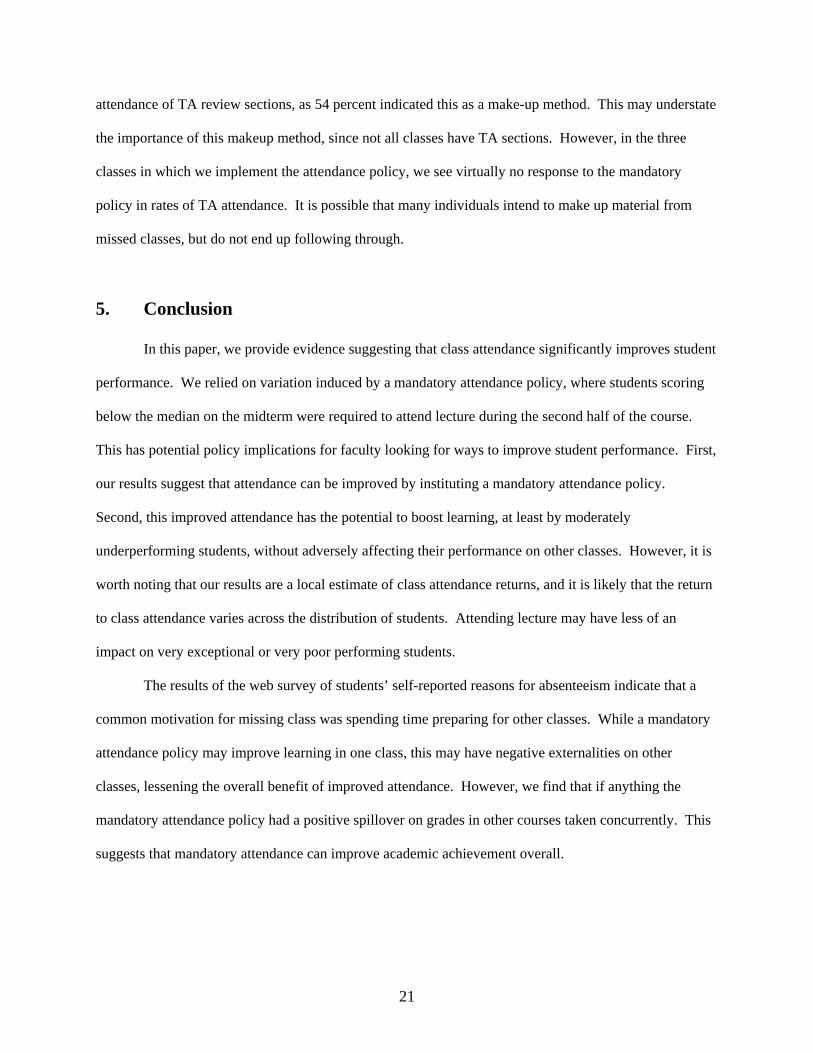
attendance of TA review sections, as 54 percent indicated this as a make-up method. This may understate
the importance of this makeup method, since not all classes have TA sections. However, in the three
classes in which we implement the attendance policy, we see virtually no response to the mandatory
policy in rates of TA attendance. It is possible that many individuals intend to make up material from
missed classes, but do not end up following through.
5. Conclusion
In this paper, we provide evidence suggesting that class attendance significantly improves student
performance. We relied on variation induced by a mandatory attendance policy, where students scoring
below the median on the midterm were required to attend lecture during the second half of the course.
This has potential policy implications for faculty looking for ways to improve student performance. First,
our results suggest that attendance can be improved by instituting a mandatory attendance policy.
Second, this improved attendance has the potential to boost learning, at least by moderately
underperforming students, without adversely affecting their performance on other classes. However, it is
worth noting that our results are a local estimate of class attendance returns, and it is likely that the return
to class attendance varies across the distribution of students. Attending lecture may have less of an
impact on very exceptional or very poor performing students.
The results of the web survey of students’ self-reported reasons for absenteeism indicate that a
common motivation for missing class was spending time preparing for other classes. While a mandatory
attendance policy may improve learning in one class, this may have negative externalities on other
classes, lessening the overall benefit of improved attendance. However, we find that if anything the
mandatory attendance policy had a positive spillover on grades in other courses taken concurrently. This
suggests that mandatory attendance can improve academic achievement overall.
21
References
Abramson, Ian S. (1982) “On Bandwidth Variation in kernel Estimates-A Square Root Law,” The Annals of Statistics 10, p. 1217-1223.
Bratti, Massimiliano and Stefano Staffolani. (2002) “Student Time Allocation and Educational
Production Functions,” Working Paper Number 170, University of Ancona. Chen, Jennjou and Tsui-Fang Lin. (2006) “Class Attendance and Exam Performance: A Randomized
Experiment,” working paper, National Chengchi University. Cohn, Elchanan and Eric Johnson. (2006) “Class Attendance and Performance in Principles of
Economics,” Education Economics 14, p. 211-233. Devadoss, S. and J. Foltz. (1996) “Evaluation of Factors Influencing Student Class Attendance and
Performance,” American Journal of Agriculture Economics 78, p. 499-507. Dolton, P., Marcenaro, D. and L. Navarro. (2003) “The Effective Use of Student Time: A Stochastic
Frontier Production Function Case Study,” Economics of Education Review 22, p. 547-560. Durden, C. and V. Ellis. (1995) “The Effects of Attendance on Student Learning in Principles of
Economics,” American Economic Review Papers and Proceedings 85, p. 343-346. Hahn, Jinyong, Petra Todd, and Wilbert van der Klaauw. (2001) “Identification and Estimation of
Treatment Effects With a Regression-Discontinuity Design,” Econometrica 69, p. 201-209. Hamermesh, Daniel S. and Amy Parker (2004) “Beauty in the Classroom: instructors’ pulchritude and putative pedagogical productivity,” Economics of Education Review 24, 369–376. Hardle, Wolfgang. (1991) Smoothing Techniques With Implementation in S, New York: Springer-Verlag. James, E., Alsalam, N., Conaty, J.C. and To D.L. (1989) “College quality and future earnings: where
should you send your child to college?” American Economic Review Papers and Proceedings 79, p. 247-252.
Jones, Ethel B. and John D. Jackson. (1990) “College Grades and Labor Market Rewards,” The Journal
of Human Resources 25, p. 253-266. Kirby, A. and B. McElroy. (2003) “The Effect of Attendance on Grades for First Year Economics
Students in University College Cork,” The Economic and Social Review 34, p. 311-326. Marburger, R. (2001) “Absenteeism and Undergraduate Exam Performance,” Journal of Economic
Education 32, p. 99-110. Park, Kang H. and Peter M. Kerr. (1990) “Determinants of Academic Performance: a Multinomial Logit
Approach,” Journal of Economic Education 21, p. 101-111. Rodgers, Joan. (2002) “Encouraging Tutorial Attendance at University Did Not Improve Performance,”
Australian Economic Papers 41:3, p. 255-266.
22

Romer, David. (1993) “Do Students Go to Class? Should They?” Journal of Economic Perspectives 7, p.
167-174. Schmidt, Robert. (1983) “Who Maximizes What? A Study in Student Time Allocation,” American
Economic Review Papers and Proceedings 73, p. 23-28. Stanca, L. (2006) “The Effects of Attendance on Academic Performance: Panel Data Evidence for
Introductory Microeconomics,” Journal of Economic Education, forthcoming. Wise, D. (1975) “Academic Achievement and Job Performance,” American Economic Review 65, p. 350-
366.
23
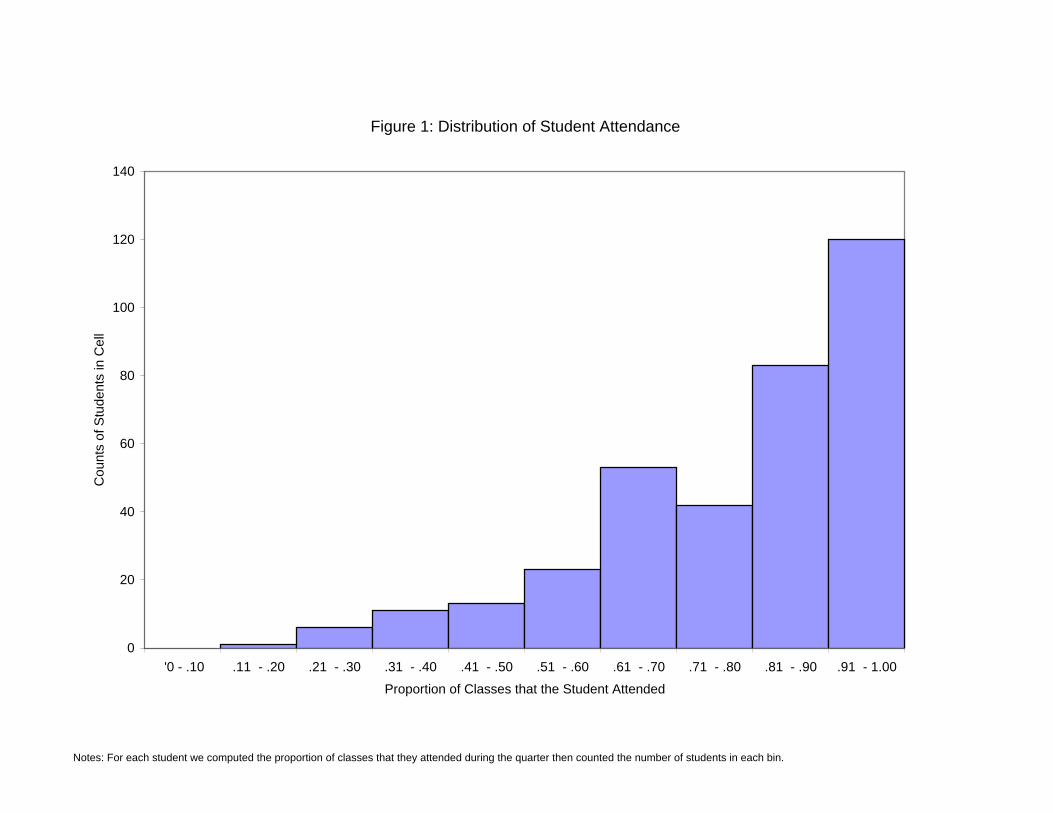
Notes: For each student we computed the proportion of classes that they attended during the quarter then counted the number of students in each bin.
Figure 1: Distribution of Student Attendance
0
20
40
60
80
100
120
140
'0 - .10 .11 - .20 .21 - .30 .31 - .40 .41 - .50 .51 - .60 .61 - .70 .71 - .80 .81 - .90 .91 - 1.00
Proportion of Classes that the Student Attended
Cou
nts
of S
tude
nts
in C
ell

Notes: Attendance on day of midterm was 100% and it is not included in the graph. Students scoring below the midterm were required to attend class for the remainder of the quarter.
Figure 2: Percent of Students Present on Each Day in Classes with Attendance Policy
0
0.1
0.2
0.3
0.4
0.5
0.6
0.7
0.8
0.9
1
-13 -12 -11 -10 -9 -8 -7 -6 -5 -4 -3 -2 -1 0 1 2 3 4 5 6 7 8 9 10 11 12 13
Days from Midterm
Perc
ent o
f Stu
dent
s At
tend
ing
Above Median on MidtermBelow Median on Midterm
Midterms Returned and Reminder Regarding Attendance Policy Made.

Note: Students scoring below the midterm were required to attend class for the remainder of the quarter.
Figure 3: Class Attendance Over the Support of Midterm Score
0
0.1
0.2
0.3
0.4
0.5
0.6
0.7
0.8
0.9
1
-1.5 -1 -0.5 0 0.5 1 1.5
Normalized Midterm Score in Standard Deviations
Pro
porti
on A
ttend
ing

Figure 4: Class Attendance Over Support of Midterm Score
0
0.1
0.2
0.3
0.4
0.5
0.6
0.7
0.8
0.9
1
-1.5 -1 -0.5 0 0.5 1 1.5
Normalized Midterm Score in Standard Deviations
Pro
porti
on A
ttend
ing
Red Circles = Pre Midterm AttendanceBlack Triangles = Post Midterm Attendance

Figure 5: Final Exam Over Support of Midterm Score
-1.5
-1
-0.5
0
0.5
1
1.5
-1.5 -1 -0.5 0 0.5 1 1.5
Normalized Midterm Score in Standard Deviations
Nor
mal
ized
Fin
al E
xam
Sco
re in
Sta
ndar
d D
evia
tions
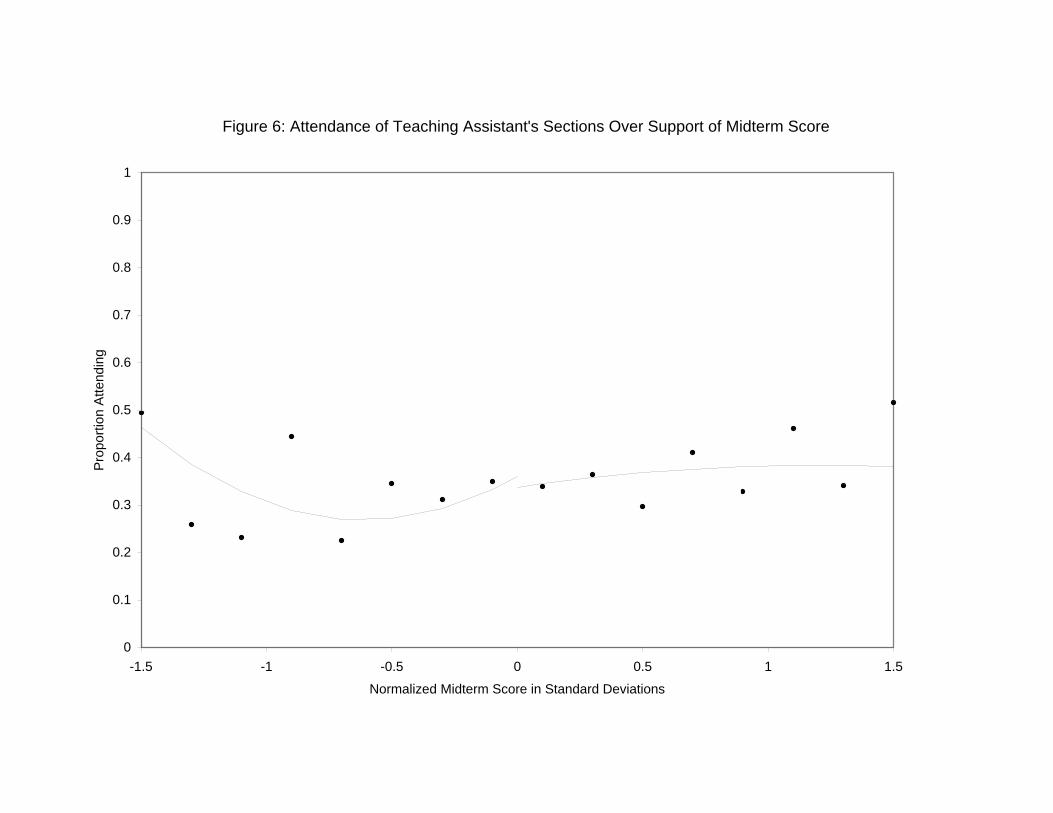
Figure 6: Attendance of Teaching Assistant's Sections Over Support of Midterm Score
0
0.1
0.2
0.3
0.4
0.5
0.6
0.7
0.8
0.9
1
-1.5 -1 -0.5 0 0.5 1 1.5
Normalized Midterm Score in Standard Deviations
Pro
porti
on A
ttend
ing
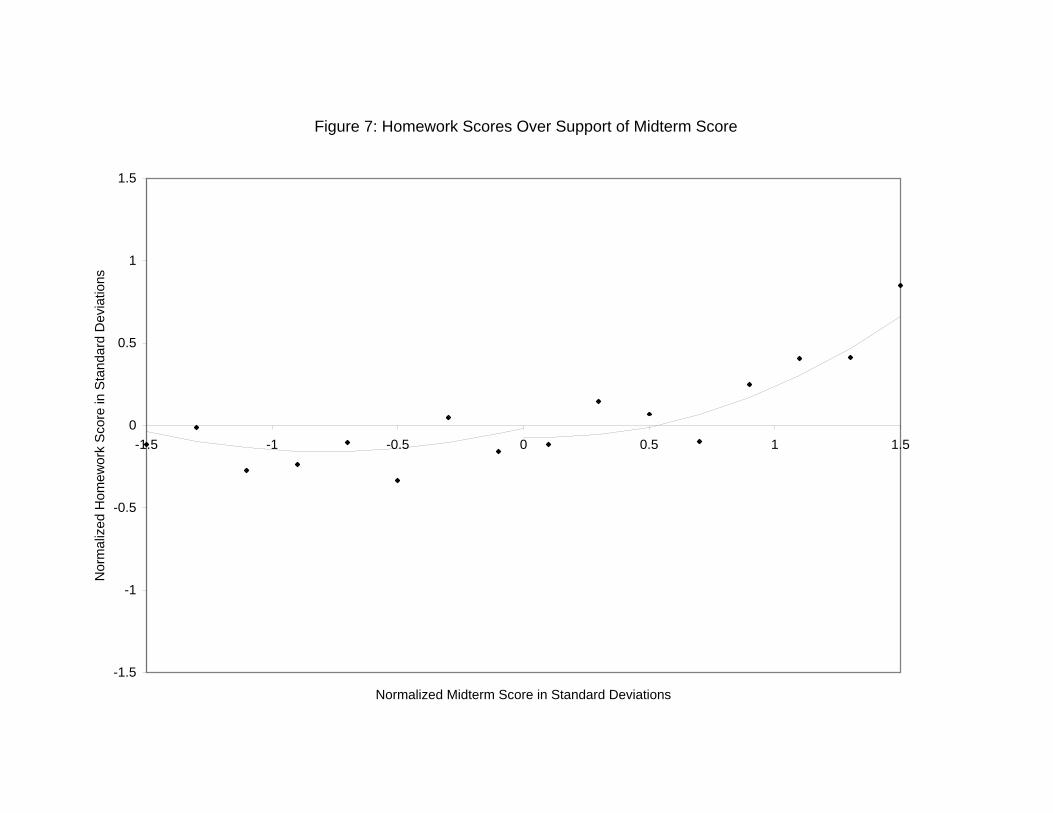
Figure 7: Homework Scores Over Support of Midterm Score
-1.5
-1
-0.5
0
0.5
1
1.5
-1.5 -1 -0.5 0 0.5 1 1.5
Normalized Midterm Score in Standard Deviations
Nor
mal
ized
Hom
ewor
k S
core
in S
tand
ard
Dev
iatio
ns

Note: This figure is based on a survey of all 206 lecture classes with over 50 students enrolled taught at the University of California, Santa Cruz in the Spring Quarter 2006.
Figure 8: Percent of Class in Attendance
0
5
10
15
20
25
30
35
40
'0 5
'5 10
'10 1
5'15
20
'20 2
5'25
30
'30 3
5'35
40
'40 4
5'45
50
'50 5
5'55
60
'60 6
5'65
70
'70 7
5'75
80
'80 8
5'85
90
'90 9
5'95
100
Percent of Class in Attendance
Num
ber o
f cla
sses
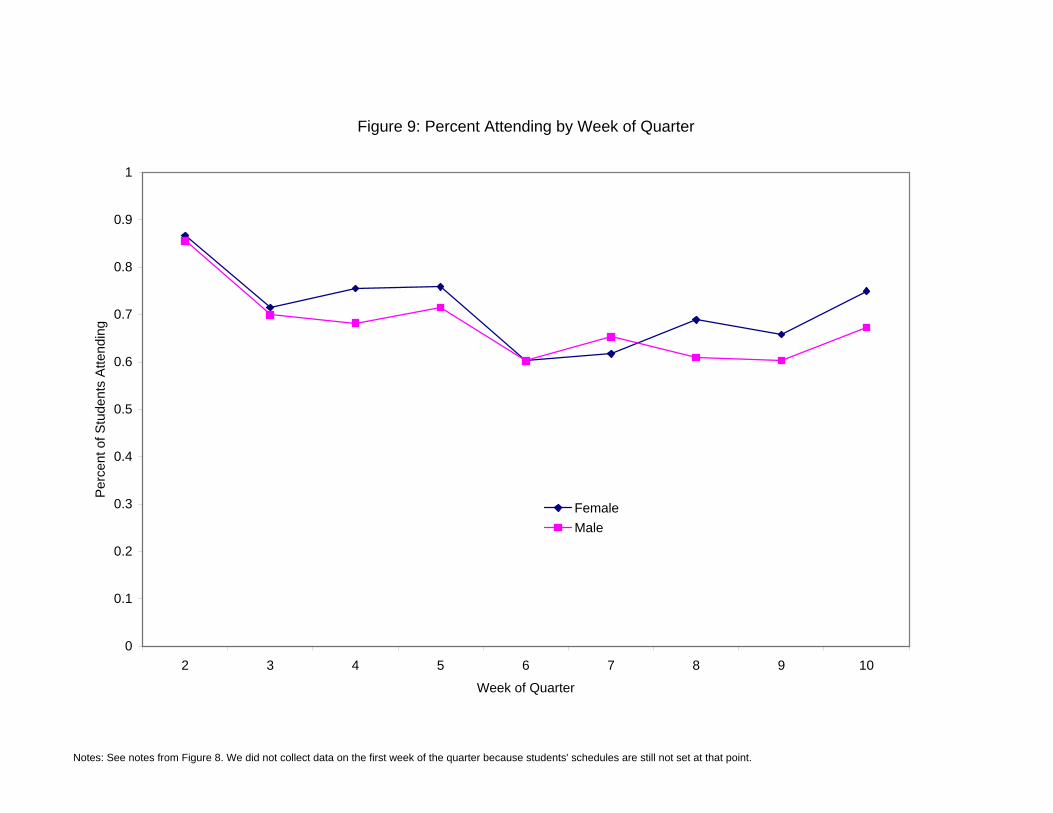
Notes: See notes from Figure 8. We did not collect data on the first week of the quarter because students' schedules are still not set at that point.
Figure 9: Percent Attending by Week of Quarter
0
0.1
0.2
0.3
0.4
0.5
0.6
0.7
0.8
0.9
1
2 3 4 5 6 7 8 9 10
Week of Quarter
Per
cent
of S
tude
nts
Atte
ndin
g
FemaleMale
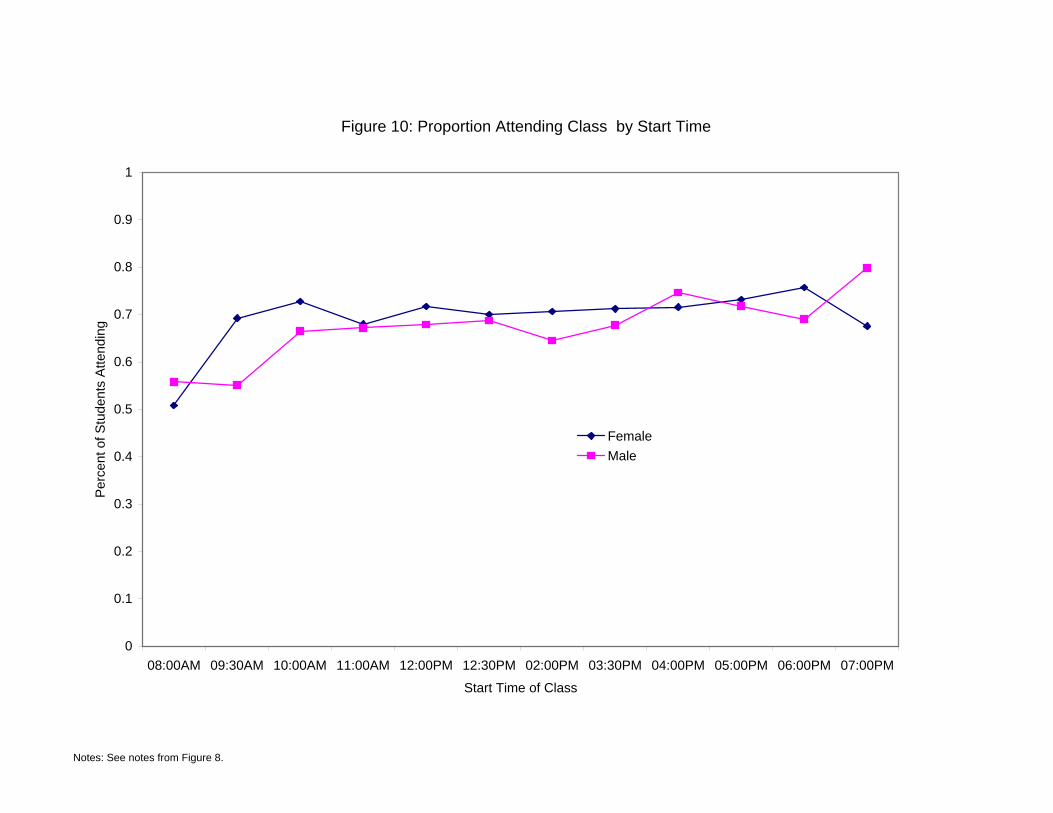
Notes: See notes from Figure 8.
Figure 10: Proportion Attending Class by Start Time
0
0.1
0.2
0.3
0.4
0.5
0.6
0.7
0.8
0.9
1
08:00AM 09:30AM 10:00AM 11:00AM 12:00PM 12:30PM 02:00PM 03:30PM 04:00PM 05:00PM 06:00PM 07:00PM
Start Time of Class
Per
cent
of S
tude
nts
Atte
ndin
g
FemaleMale
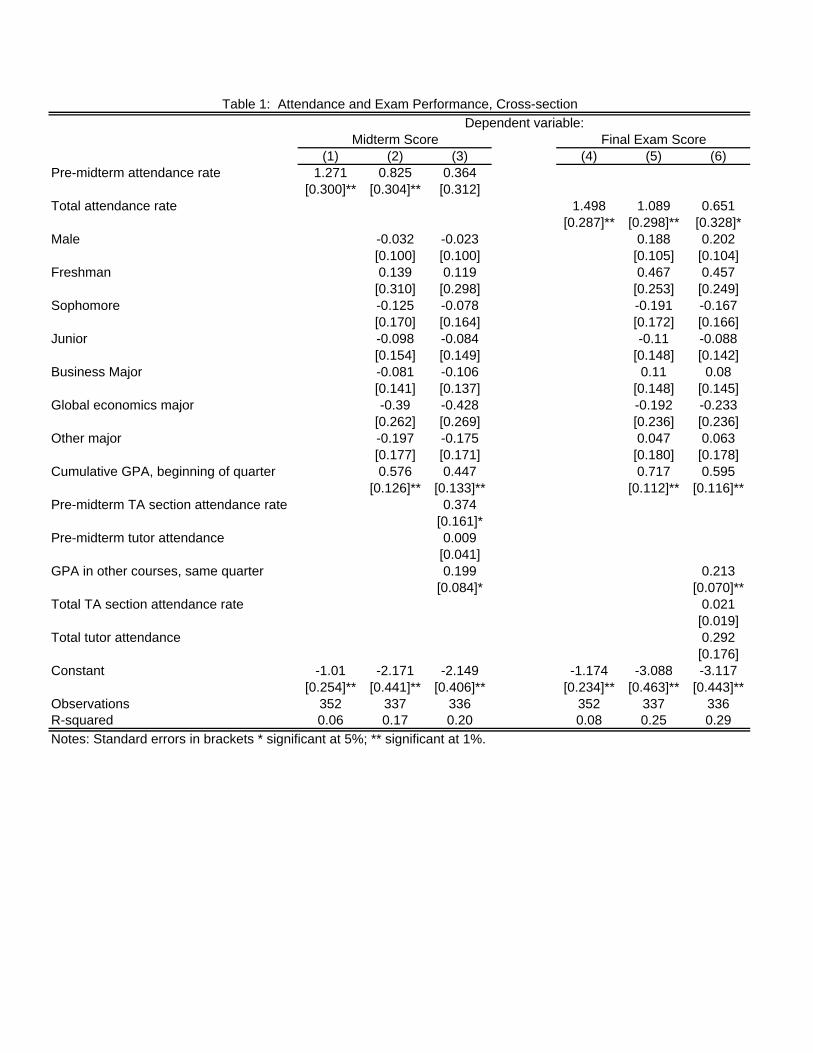
Table 1: Attendance and Exam Performance, Cross-sectionDependent variable:
Midterm Score Final Exam Score(1) (2) (3) (4) (5) (6)
Pre-midterm attendance rate 1.271 0.825 0.364[0.300]** [0.304]** [0.312]
Total attendance rate 1.498 1.089 0.651[0.287]** [0.298]** [0.328]*
Male -0.032 -0.023 0.188 0.202[0.100] [0.100] [0.105] [0.104]
Freshman 0.139 0.119 0.467 0.457[0.310] [0.298] [0.253] [0.249]
Sophomore -0.125 -0.078 -0.191 -0.167[0.170] [0.164] [0.172] [0.166]
Junior -0.098 -0.084 -0.11 -0.088[0.154] [0.149] [0.148] [0.142]
Business Major -0.081 -0.106 0.11 0.08[0.141] [0.137] [0.148] [0.145]
Global economics major -0.39 -0.428 -0.192 -0.233[0.262] [0.269] [0.236] [0.236]
Other major -0.197 -0.175 0.047 0.063[0.177] [0.171] [0.180] [0.178]
Cumulative GPA, beginning of quarter 0.576 0.447 0.717 0.595[0.126]** [0.133]** [0.112]** [0.116]**
Pre-midterm TA section attendance rate 0.374[0.161]*
Pre-midterm tutor attendance 0.009[0.041]
GPA in other courses, same quarter 0.199 0.213[0.084]* [0.070]**
Total TA section attendance rate 0.021[0.019]
Total tutor attendance 0.292[0.176]
Constant -1.01 -2.171 -2.149 -1.174 -3.088 -3.117[0.254]** [0.441]** [0.406]** [0.234]** [0.463]** [0.443]**
Observations 352 337 336 352 337 336R-squared 0.06 0.17 0.20 0.08 0.25 0.29Notes: Standard errors in brackets * significant at 5%; ** significant at 1%.
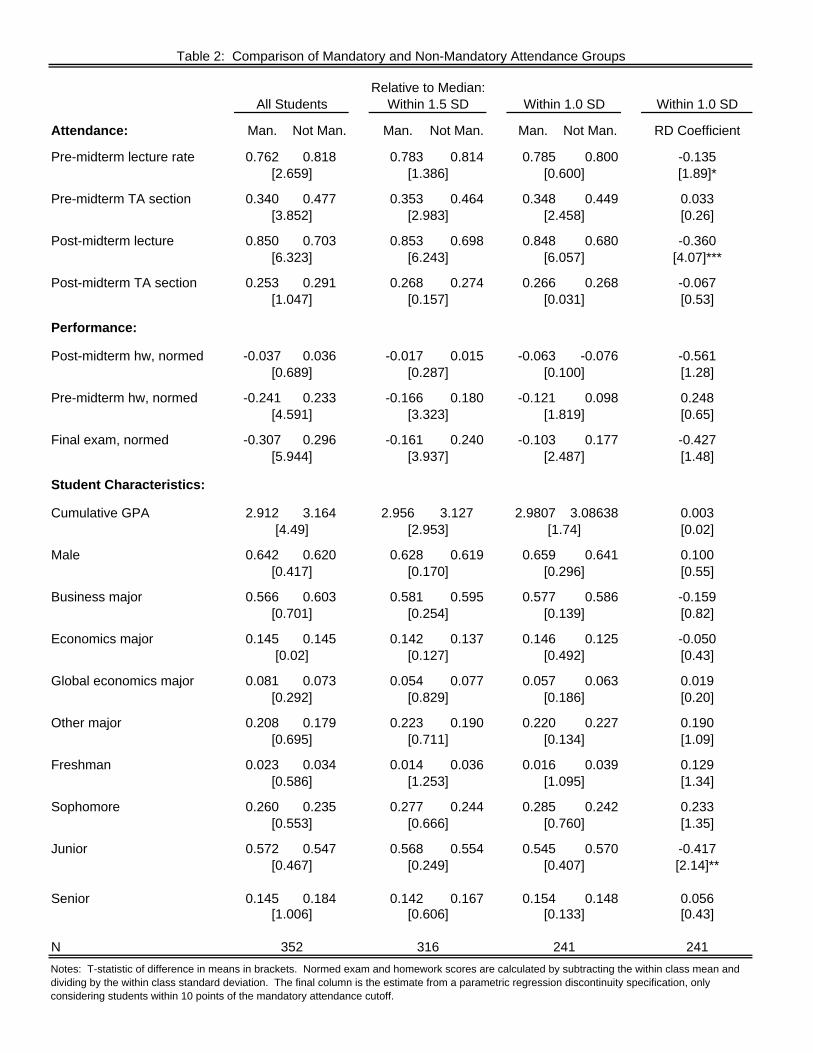
Table 2: Comparison of Mandatory and Non-Mandatory Attendance Groups
Relative to Median:All Students Within 1.5 SD Within 1.0 SD Within 1.0 SD
Attendance: Man. Not Man. Man. Not Man. Man. Not Man. RD Coefficient
Pre-midterm lecture rate 0.762 0.818 0.783 0.814 0.785 0.800 -0.135[2.659] [1.386] [0.600] [1.89]*
Pre-midterm TA section 0.340 0.477 0.353 0.464 0.348 0.449 0.033[3.852] [2.983] [2.458] [0.26]
Post-midterm lecture 0.850 0.703 0.853 0.698 0.848 0.680 -0.360[6.323] [6.243] [6.057] [4.07]***
Post-midterm TA section 0.253 0.291 0.268 0.274 0.266 0.268 -0.067[1.047] [0.157] [0.031] [0.53]
Performance:
Post-midterm hw, normed -0.037 0.036 -0.017 0.015 -0.063 -0.076 -0.561[0.689] [0.287] [0.100] [1.28]
Pre-midterm hw, normed -0.241 0.233 -0.166 0.180 -0.121 0.098 0.248[4.591] [3.323] [1.819] [0.65]
Final exam, normed -0.307 0.296 -0.161 0.240 -0.103 0.177 -0.427[5.944] [3.937] [2.487] [1.48]
Student Characteristics:
Cumulative GPA 2.912 3.164 2.956 3.127 2.9807 3.08638 0.003[4.49] [2.953] [1.74] [0.02]
Male 0.642 0.620 0.628 0.619 0.659 0.641 0.100[0.417] [0.170] [0.296] [0.55]
Business major 0.566 0.603 0.581 0.595 0.577 0.586 -0.159[0.701] [0.254] [0.139] [0.82]
Economics major 0.145 0.145 0.142 0.137 0.146 0.125 -0.050[0.02] [0.127] [0.492] [0.43]
Global economics major 0.081 0.073 0.054 0.077 0.057 0.063 0.019[0.292] [0.829] [0.186] [0.20]
Other major 0.208 0.179 0.223 0.190 0.220 0.227 0.190[0.695] [0.711] [0.134] [1.09]
Freshman 0.023 0.034 0.014 0.036 0.016 0.039 0.129[0.586] [1.253] [1.095] [1.34]
Sophomore 0.260 0.235 0.277 0.244 0.285 0.242 0.233[0.553] [0.666] [0.760] [1.35]
Junior 0.572 0.547 0.568 0.554 0.545 0.570 -0.417[0.467] [0.249] [0.407] [2.14]**
Senior 0.145 0.184 0.142 0.167 0.154 0.148 0.056[1.006] [0.606] [0.133] [0.43]
N 352 316 241 241Notes: T-statistic of difference in means in brackets. Normed exam and homework scores are calculated by subtracting the within class mean and dividing by the within class standard deviation. The final column is the estimate from a parametric regression discontinuity specification, only considering students within 10 points of the mandatory attendance cutoff.

Table 3: First Stage Relationship Between Class Policy and AttendanceDependent Variable: Rate of attendance
All Within 1.5 SD of cutoff Within 1.0 SD of cutoff(1) (2) (3) (4) (5) (6) (7) (8) (9)
Above cutoff -0.140 -0.159 -0.162 -0.181 -0.202 -0.197 -0.245 -0.285 -0.277[0.044]*** [0.042]*** [0.039]*** [0.056]*** [0.054]*** [0.048]*** [0.071]*** [0.068]*** [0.062]***
Diff -0.019 -0.009 -0.029 0.155 0.118 0.043 -0.017 -0.055 -0.124[0.043] [0.044] [0.044] [0.109] [0.110] [0.100] [0.198] [0.191] [0.165]
Diff Squared -0.021 -0.011 -0.01 0.123 0.096 0.046 -0.062 -0.094 -0.152[0.014] [0.014] [0.016] [0.070]* [0.076] [0.071] [0.226] [0.218] [0.185]
Absolute Diff 0.162 0.167 0.181 0.036 0.134 0.189 0.721 0.918 0.919[0.094]* [0.093]* [0.086]** [0.186] [0.183] [0.161] [0.348]** [0.326]*** [0.286]***
Absolute Diff Squared -0.009 -0.046 -0.051 -0.188 -0.221 -0.162 -0.53 -0.656 -0.523[0.041] [0.040] [0.039] [0.120] [0.122]* [0.106] [0.355] [0.329]** [0.286]*
Male -0.045 -0.032 -0.055 -0.04 -0.064 -0.041[0.020]** [0.017]* [0.021]** [0.019]** [0.023]*** [0.021]**
Freshman 0.052 0.031 0.035 0.018 0.054 0.022[0.074] [0.058] [0.076] [0.060] [0.078] [0.062]
Sophomore 0.059 0.061 0.06 0.057 0.093 0.076[0.032]* [0.028]** [0.035]* [0.031]* [0.040]** [0.036]**
Junior 0.012 0.02 0.015 0.018 0.036 0.029[0.029] [0.025] [0.033] [0.028] [0.038] [0.033]
Business major -0.005 -0.024 -0.011 -0.022 -0.015 -0.017[0.029] [0.027] [0.031] [0.028] [0.034] [0.032]
Global economics major -0.063 -0.085 -0.078 -0.094 -0.071 -0.074[0.045] [0.040]** [0.051] [0.046]** [0.054] [0.051]
Other major -0.033 -0.022 -0.042 -0.03 -0.041 -0.021[0.039] [0.035] [0.041] [0.037] [0.044] [0.040]
Cumulative GPA 0.119 0.067 0.119 0.064 0.124 0.071[0.019]*** [0.017]*** [0.022]*** [0.018]*** [0.025]*** [0.021]***
Total MSI attendance 0.007 0.007 0.009[0.003]** [0.004]** [0.004]**
Section attend rate 0.232 0.219 0.224[0.029]*** [0.031]*** [0.034]***
GPA in other courses 0.052 0.062 0.05[0.012]*** [0.013]*** [0.014]***
Constant 0.817 0.482 0.403 0.846 0.516 0.412 0.825 0.467 0.385[0.022]*** [0.078]*** [0.070]*** [0.030]*** [0.087]*** [0.077]*** [0.034]*** [0.100]*** [0.088]***
Observations 352 337 336 316 303 302 251 244 243R-squared 0.06 0.19 0.39 0.05 0.19 0.39 0.07 0.24 0.42Notes: Robust standard errors in brackets. (*,**,***) represents significance at the 10%, 5%, and 1% levels, respectively.
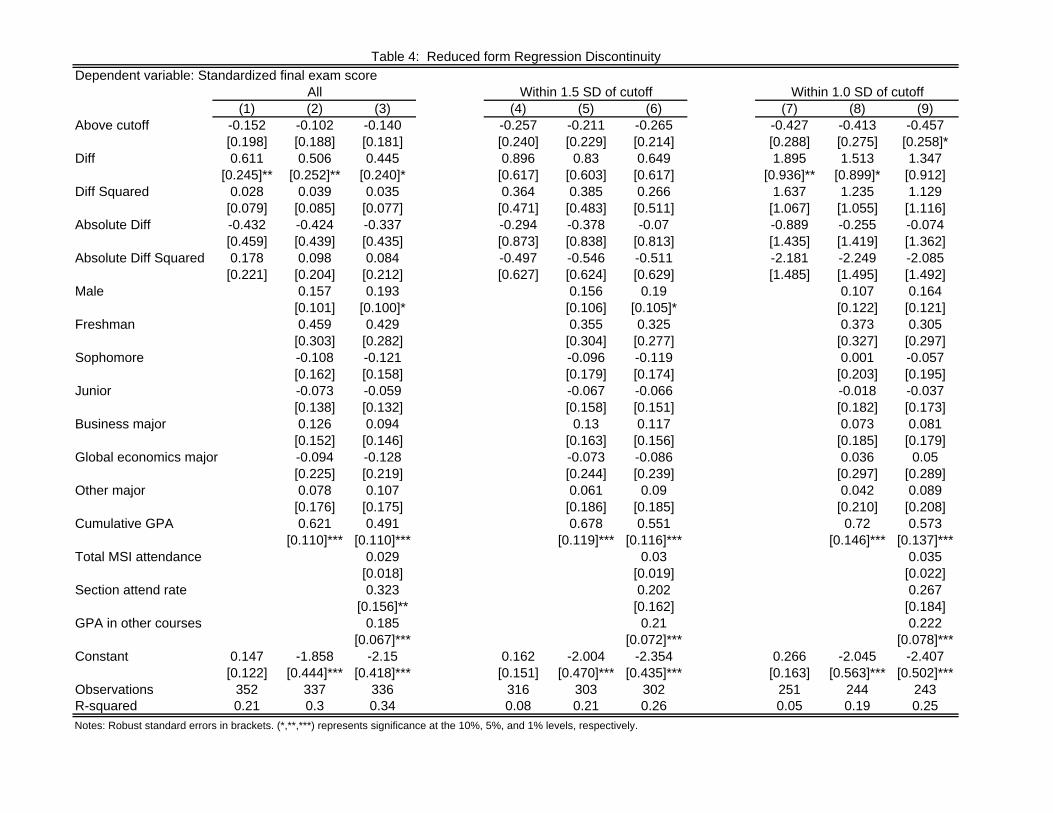
Table 4: Reduced form Regression DiscontinuityDependent variable: Standardized final exam score
All Within 1.5 SD of cutoff Within 1.0 SD of cutoff(1) (2) (3) (4) (5) (6) (7) (8) (9)
Above cutoff -0.152 -0.102 -0.140 -0.257 -0.211 -0.265 -0.427 -0.413 -0.457[0.198] [0.188] [0.181] [0.240] [0.229] [0.214] [0.288] [0.275] [0.258]*
Diff 0.611 0.506 0.445 0.896 0.83 0.649 1.895 1.513 1.347[0.245]** [0.252]** [0.240]* [0.617] [0.603] [0.617] [0.936]** [0.899]* [0.912]
Diff Squared 0.028 0.039 0.035 0.364 0.385 0.266 1.637 1.235 1.129[0.079] [0.085] [0.077] [0.471] [0.483] [0.511] [1.067] [1.055] [1.116]
Absolute Diff -0.432 -0.424 -0.337 -0.294 -0.378 -0.07 -0.889 -0.255 -0.074[0.459] [0.439] [0.435] [0.873] [0.838] [0.813] [1.435] [1.419] [1.362]
Absolute Diff Squared 0.178 0.098 0.084 -0.497 -0.546 -0.511 -2.181 -2.249 -2.085[0.221] [0.204] [0.212] [0.627] [0.624] [0.629] [1.485] [1.495] [1.492]
Male 0.157 0.193 0.156 0.19 0.107 0.164[0.101] [0.100]* [0.106] [0.105]* [0.122] [0.121]
Freshman 0.459 0.429 0.355 0.325 0.373 0.305[0.303] [0.282] [0.304] [0.277] [0.327] [0.297]
Sophomore -0.108 -0.121 -0.096 -0.119 0.001 -0.057[0.162] [0.158] [0.179] [0.174] [0.203] [0.195]
Junior -0.073 -0.059 -0.067 -0.066 -0.018 -0.037[0.138] [0.132] [0.158] [0.151] [0.182] [0.173]
Business major 0.126 0.094 0.13 0.117 0.073 0.081[0.152] [0.146] [0.163] [0.156] [0.185] [0.179]
Global economics major -0.094 -0.128 -0.073 -0.086 0.036 0.05[0.225] [0.219] [0.244] [0.239] [0.297] [0.289]
Other major 0.078 0.107 0.061 0.09 0.042 0.089[0.176] [0.175] [0.186] [0.185] [0.210] [0.208]
Cumulative GPA 0.621 0.491 0.678 0.551 0.72 0.573[0.110]*** [0.110]*** [0.119]*** [0.116]*** [0.146]*** [0.137]***
Total MSI attendance 0.029 0.03 0.035[0.018] [0.019] [0.022]
Section attend rate 0.323 0.202 0.267[0.156]** [0.162] [0.184]
GPA in other courses 0.185 0.21 0.222[0.067]*** [0.072]*** [0.078]***
Constant 0.147 -1.858 -2.15 0.162 -2.004 -2.354 0.266 -2.045 -2.407[0.122] [0.444]*** [0.418]*** [0.151] [0.470]*** [0.435]*** [0.163] [0.563]*** [0.502]***
Observations 352 337 336 316 303 302 251 244 243R-squared 0.21 0.3 0.34 0.08 0.21 0.26 0.05 0.19 0.25Notes: Robust standard errors in brackets. (*,**,***) represents significance at the 10%, 5%, and 1% levels, respectively.
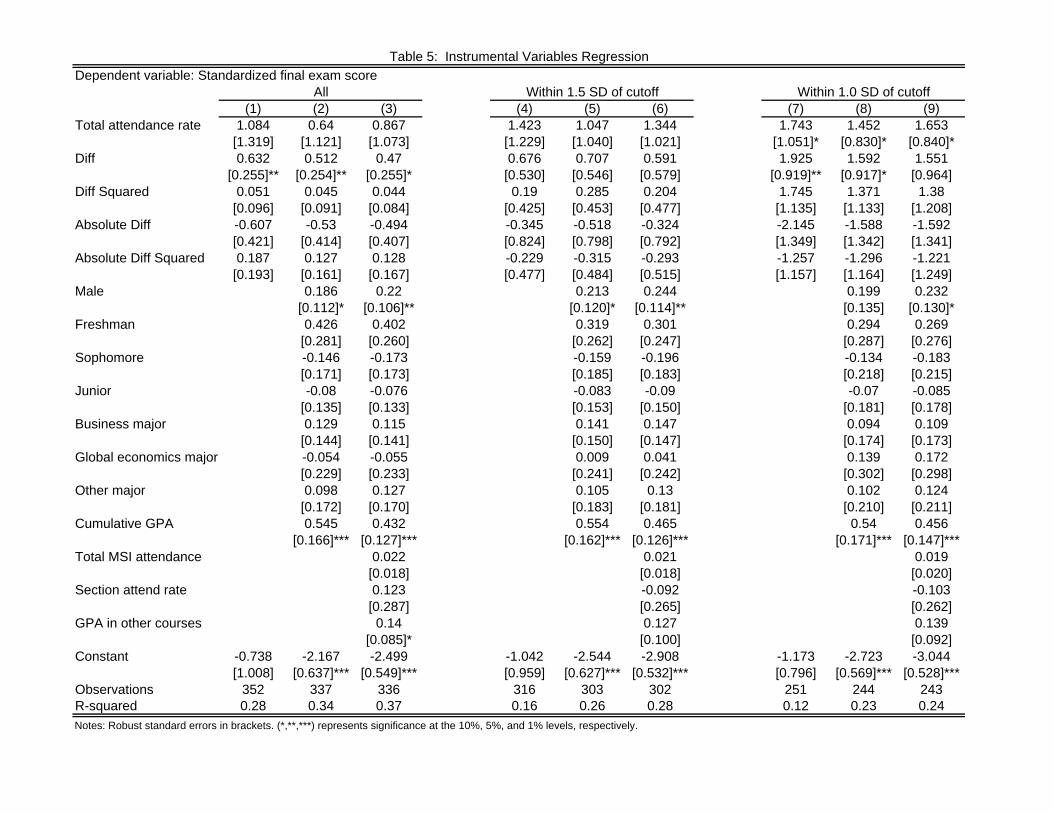
Table 5: Instrumental Variables RegressionDependent variable: Standardized final exam score
All Within 1.5 SD of cutoff Within 1.0 SD of cutoff(1) (2) (3) (4) (5) (6) (7) (8) (9)
Total attendance rate 1.084 0.64 0.867 1.423 1.047 1.344 1.743 1.452 1.653[1.319] [1.121] [1.073] [1.229] [1.040] [1.021] [1.051]* [0.830]* [0.840]*
Diff 0.632 0.512 0.47 0.676 0.707 0.591 1.925 1.592 1.551[0.255]** [0.254]** [0.255]* [0.530] [0.546] [0.579] [0.919]** [0.917]* [0.964]
Diff Squared 0.051 0.045 0.044 0.19 0.285 0.204 1.745 1.371 1.38[0.096] [0.091] [0.084] [0.425] [0.453] [0.477] [1.135] [1.133] [1.208]
Absolute Diff -0.607 -0.53 -0.494 -0.345 -0.518 -0.324 -2.145 -1.588 -1.592[0.421] [0.414] [0.407] [0.824] [0.798] [0.792] [1.349] [1.342] [1.341]
Absolute Diff Squared 0.187 0.127 0.128 -0.229 -0.315 -0.293 -1.257 -1.296 -1.221[0.193] [0.161] [0.167] [0.477] [0.484] [0.515] [1.157] [1.164] [1.249]
Male 0.186 0.22 0.213 0.244 0.199 0.232[0.112]* [0.106]** [0.120]* [0.114]** [0.135] [0.130]*
Freshman 0.426 0.402 0.319 0.301 0.294 0.269[0.281] [0.260] [0.262] [0.247] [0.287] [0.276]
Sophomore -0.146 -0.173 -0.159 -0.196 -0.134 -0.183[0.171] [0.173] [0.185] [0.183] [0.218] [0.215]
Junior -0.08 -0.076 -0.083 -0.09 -0.07 -0.085[0.135] [0.133] [0.153] [0.150] [0.181] [0.178]
Business major 0.129 0.115 0.141 0.147 0.094 0.109[0.144] [0.141] [0.150] [0.147] [0.174] [0.173]
Global economics major -0.054 -0.055 0.009 0.041 0.139 0.172[0.229] [0.233] [0.241] [0.242] [0.302] [0.298]
Other major 0.098 0.127 0.105 0.13 0.102 0.124[0.172] [0.170] [0.183] [0.181] [0.210] [0.211]
Cumulative GPA 0.545 0.432 0.554 0.465 0.54 0.456[0.166]*** [0.127]*** [0.162]*** [0.126]*** [0.171]*** [0.147]***
Total MSI attendance 0.022 0.021 0.019[0.018] [0.018] [0.020]
Section attend rate 0.123 -0.092 -0.103[0.287] [0.265] [0.262]
GPA in other courses 0.14 0.127 0.139[0.085]* [0.100] [0.092]
Constant -0.738 -2.167 -2.499 -1.042 -2.544 -2.908 -1.173 -2.723 -3.044[1.008] [0.637]*** [0.549]*** [0.959] [0.627]*** [0.532]*** [0.796] [0.569]*** [0.528]***
Observations 352 337 336 316 303 302 251 244 243R-squared 0.28 0.34 0.37 0.16 0.26 0.28 0.12 0.23 0.24Notes: Robust standard errors in brackets. (*,**,***) represents significance at the 10%, 5%, and 1% levels, respectively.
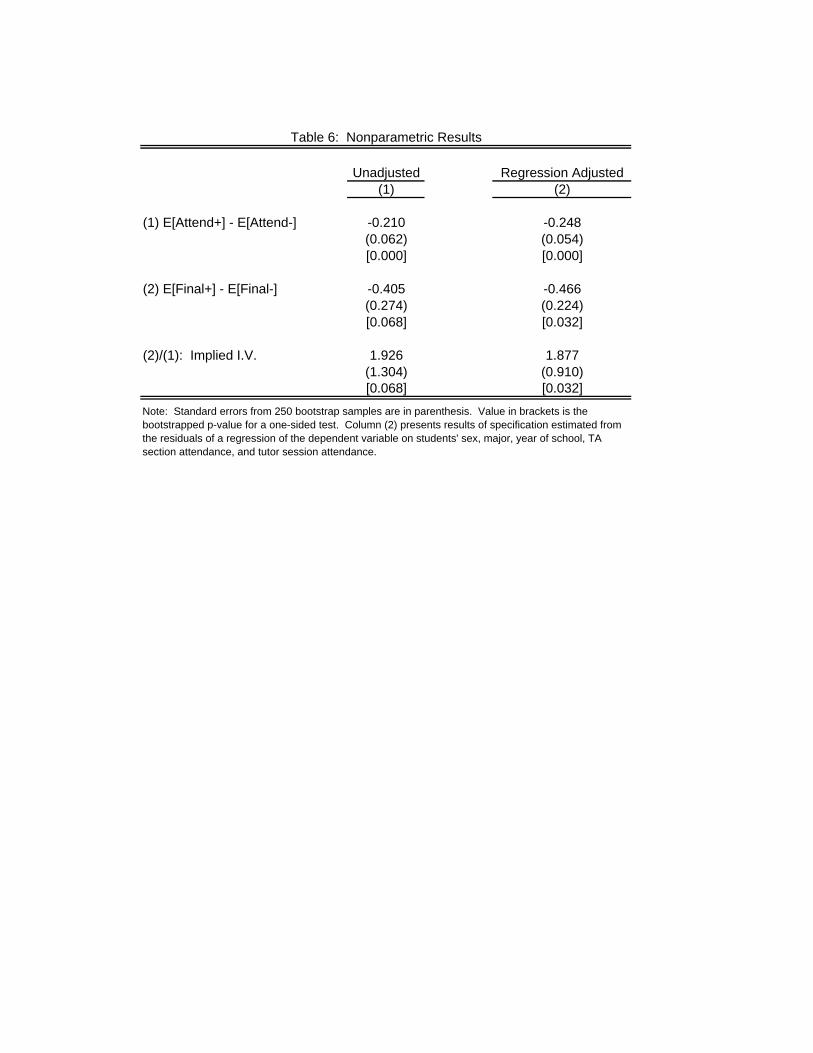
Table 6: Nonparametric Results
Unadjusted Regression Adjusted(1) (2)
(1) E[Attend+] - E[Attend-] -0.210 -0.248(0.062) (0.054)[0.000] [0.000]
(2) E[Final+] - E[Final-] -0.405 -0.466(0.274) (0.224)[0.068] [0.032]
(2)/(1): Implied I.V. 1.926 1.877(1.304) (0.910)[0.068] [0.032]
Note: Standard errors from 250 bootstrap samples are in parenthesis. Value in brackets is the bootstrapped p-value for a one-sided test. Column (2) presents results of specification estimated from the residuals of a regression of the dependent variable on students' sex, major, year of school, TA section attendance, and tutor session attendance.
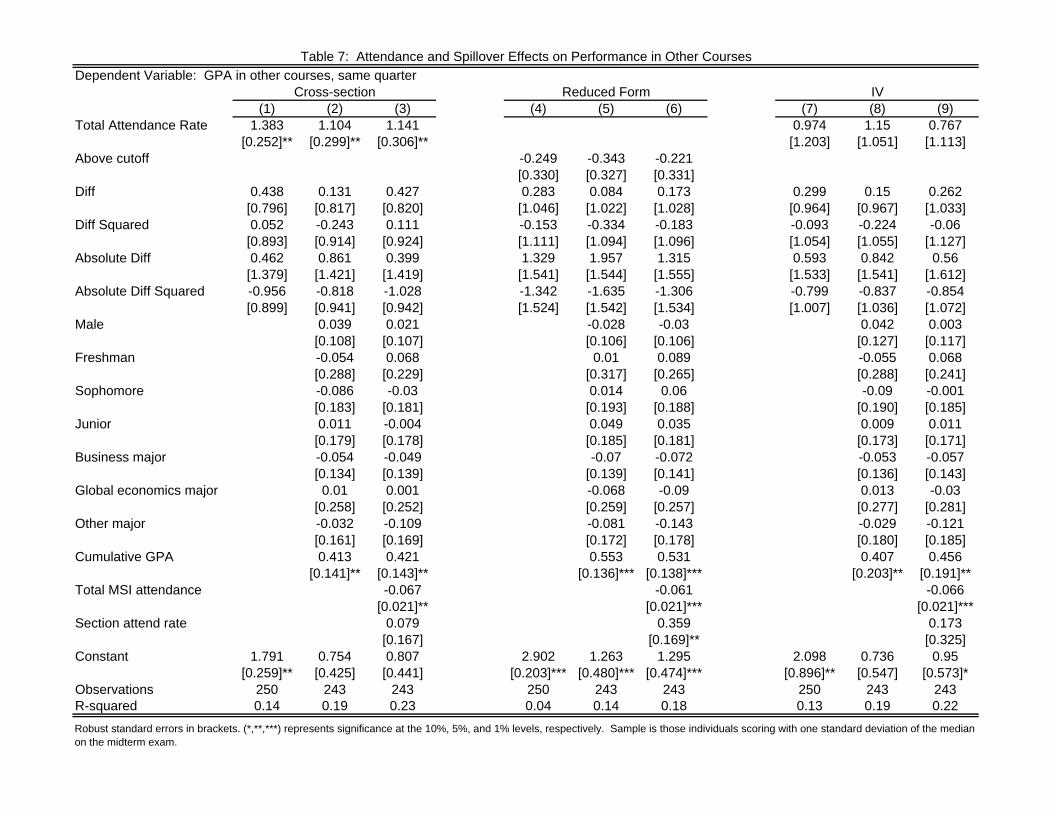
Table 7: Attendance and Spillover Effects on Performance in Other CoursesDependent Variable: GPA in other courses, same quarter
Cross-section Reduced Form IV(1) (2) (3) (4) (5) (6) (7) (8) (9)
Total Attendance Rate 1.383 1.104 1.141 0.974 1.15 0.767[0.252]** [0.299]** [0.306]** [1.203] [1.051] [1.113]
Above cutoff -0.249 -0.343 -0.221[0.330] [0.327] [0.331]
Diff 0.438 0.131 0.427 0.283 0.084 0.173 0.299 0.15 0.262[0.796] [0.817] [0.820] [1.046] [1.022] [1.028] [0.964] [0.967] [1.033]
Diff Squared 0.052 -0.243 0.111 -0.153 -0.334 -0.183 -0.093 -0.224 -0.06[0.893] [0.914] [0.924] [1.111] [1.094] [1.096] [1.054] [1.055] [1.127]
Absolute Diff 0.462 0.861 0.399 1.329 1.957 1.315 0.593 0.842 0.56[1.379] [1.421] [1.419] [1.541] [1.544] [1.555] [1.533] [1.541] [1.612]
Absolute Diff Squared -0.956 -0.818 -1.028 -1.342 -1.635 -1.306 -0.799 -0.837 -0.854[0.899] [0.941] [0.942] [1.524] [1.542] [1.534] [1.007] [1.036] [1.072]
Male 0.039 0.021 -0.028 -0.03 0.042 0.003[0.108] [0.107] [0.106] [0.106] [0.127] [0.117]
Freshman -0.054 0.068 0.01 0.089 -0.055 0.068[0.288] [0.229] [0.317] [0.265] [0.288] [0.241]
Sophomore -0.086 -0.03 0.014 0.06 -0.09 -0.001[0.183] [0.181] [0.193] [0.188] [0.190] [0.185]
Junior 0.011 -0.004 0.049 0.035 0.009 0.011[0.179] [0.178] [0.185] [0.181] [0.173] [0.171]
Business major -0.054 -0.049 -0.07 -0.072 -0.053 -0.057[0.134] [0.139] [0.139] [0.141] [0.136] [0.143]
Global economics major 0.01 0.001 -0.068 -0.09 0.013 -0.03[0.258] [0.252] [0.259] [0.257] [0.277] [0.281]
Other major -0.032 -0.109 -0.081 -0.143 -0.029 -0.121[0.161] [0.169] [0.172] [0.178] [0.180] [0.185]
Cumulative GPA 0.413 0.421 0.553 0.531 0.407 0.456[0.141]** [0.143]** [0.136]*** [0.138]*** [0.203]** [0.191]**
Total MSI attendance -0.067 -0.061 -0.066[0.021]** [0.021]*** [0.021]***
Section attend rate 0.079 0.359 0.173[0.167] [0.169]** [0.325]
Constant 1.791 0.754 0.807 2.902 1.263 1.295 2.098 0.736 0.95[0.259]** [0.425] [0.441] [0.203]*** [0.480]*** [0.474]*** [0.896]** [0.547] [0.573]*
Observations 250 243 243 250 243 243 250 243 243R-squared 0.14 0.19 0.23 0.04 0.14 0.18 0.13 0.19 0.22Robust standard errors in brackets. (*,**,***) represents significance at the 10%, 5%, and 1% levels, respectively. Sample is those individuals scoring with one standard deviation of the median on the midterm exam.

Table 8: Determinants of Attendance Across ClassesDependent variable: Class attendance rateMale -0.018 (0.026) F-value 1.42Instructor age -0.001 (0.001) p-value 0.22Not native english -0.003 (0.027)Instr. appearance 0.026 (0.016)Poor writing -0.028 (0.038)
Call on people in class 0.018 (0.022) F-value 0.53Power point -0.007 (0.029) p-value 0.75Chalk board -0.023 (0.026)Overhead projector 0.011 (0.032)Camera projector -0.042 (0.036)
Lecture available online -0.045 (0.026)* F-value 2.09Lecture follows book -0.028 (0.032) p-value 0.13
Class mandatory 0.071 (0.032)**Attendance monitored 0.115 (0.034)***Week 3 0.003 (0.043)Week 4 -0.008 (0.044)Week 5 -0.062 (0.041)Week 6 -0.073 (0.039)*Week 7 -0.097 (0.040)**Week 8 -0.068 (0.040)*Week 9 -0.120 (0.043)***Quizzes in section -0.131 (0.047)***Quizzes held in class -0.083 (0.048)*Quizzes online -0.167 (0.093)*Class size (X100) -0.035 (0.016)**Upper division -0.026 (0.027)Two meetings/wk 0.015 (0.084)Three meetings/wk 0.038 (0.084)Start time 8-10 0.020 (0.042)Start time 11-5 0.071 (0.041)*Monday 0.137 (0.048)***Tuesday 0.097 (0.059)*Wednesday 0.100 (0.036)***Thursday 0.073 (0.058)Next homework due today 0.017 (0.031)Test in next 7 days 0.084 (0.026)***Quiz next 7 days -0.032 (0.058)Constant 0.554 (0.155)***Observations 211R-squared 0.68
Notes: Standard errors in parentheses. (*,**,***) represents significance at the 10%, 5%, and 1% levels, respectively. Includes major effects
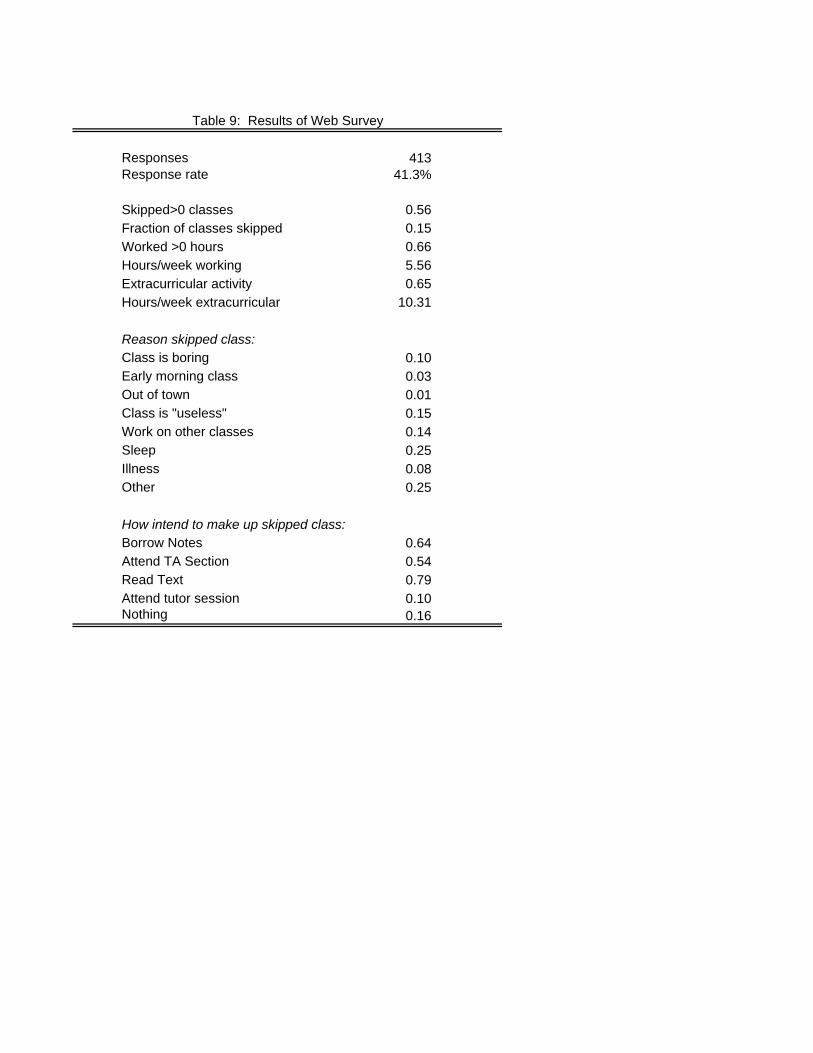
Table 9: Results of Web Survey
Responses 413Response rate 41.3%
Skipped>0 classes 0.56Fraction of classes skipped 0.15Worked >0 hours 0.66Hours/week working 5.56Extracurricular activity 0.65Hours/week extracurricular 10.31
Reason skipped class:Class is boring 0.10Early morning class 0.03Out of town 0.01Class is "useless" 0.15Work on other classes 0.14Sleep 0.25Illness 0.08Other 0.25
How intend to make up skipped class:Borrow Notes 0.64Attend TA Section 0.54Read Text 0.79Attend tutor session 0.10Nothing 0.16
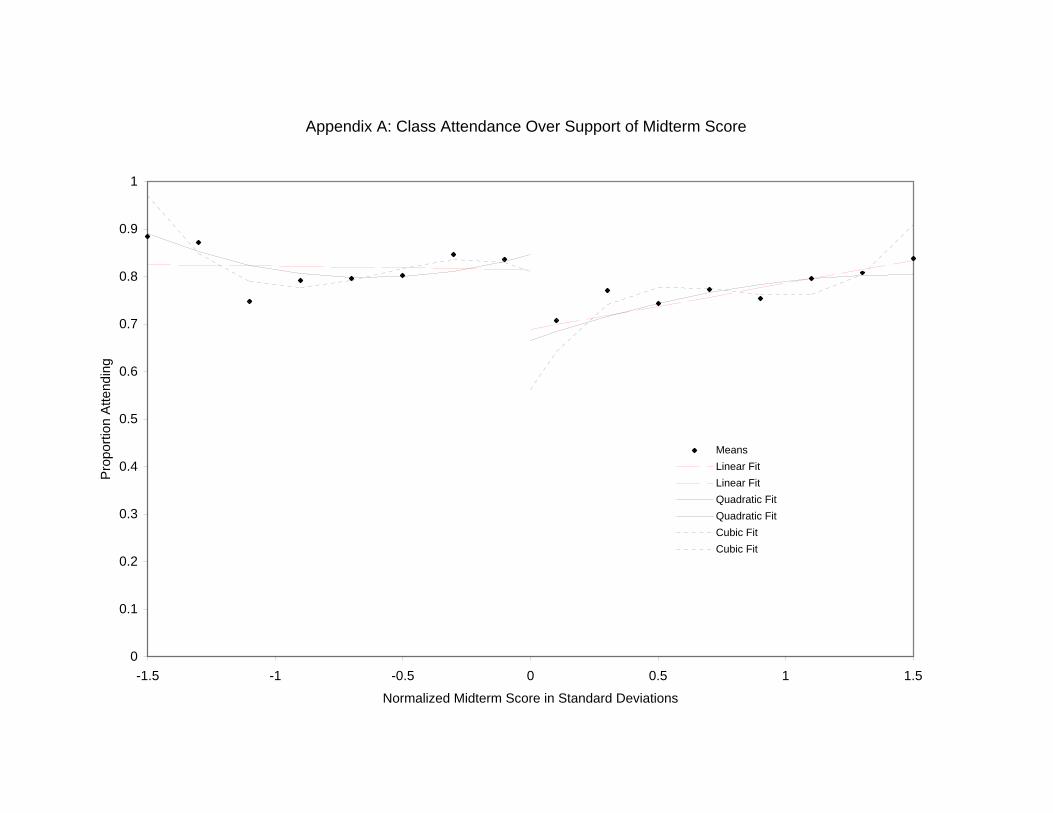
Appendix A: Class Attendance Over Support of Midterm Score
0
0.1
0.2
0.3
0.4
0.5
0.6
0.7
0.8
0.9
1
-1.5 -1 -0.5 0 0.5 1 1.5
Normalized Midterm Score in Standard Deviations
Pro
porti
on A
ttend
ing
MeansLinear FitLinear FitQuadratic FitQuadratic FitCubic FitCubic Fit
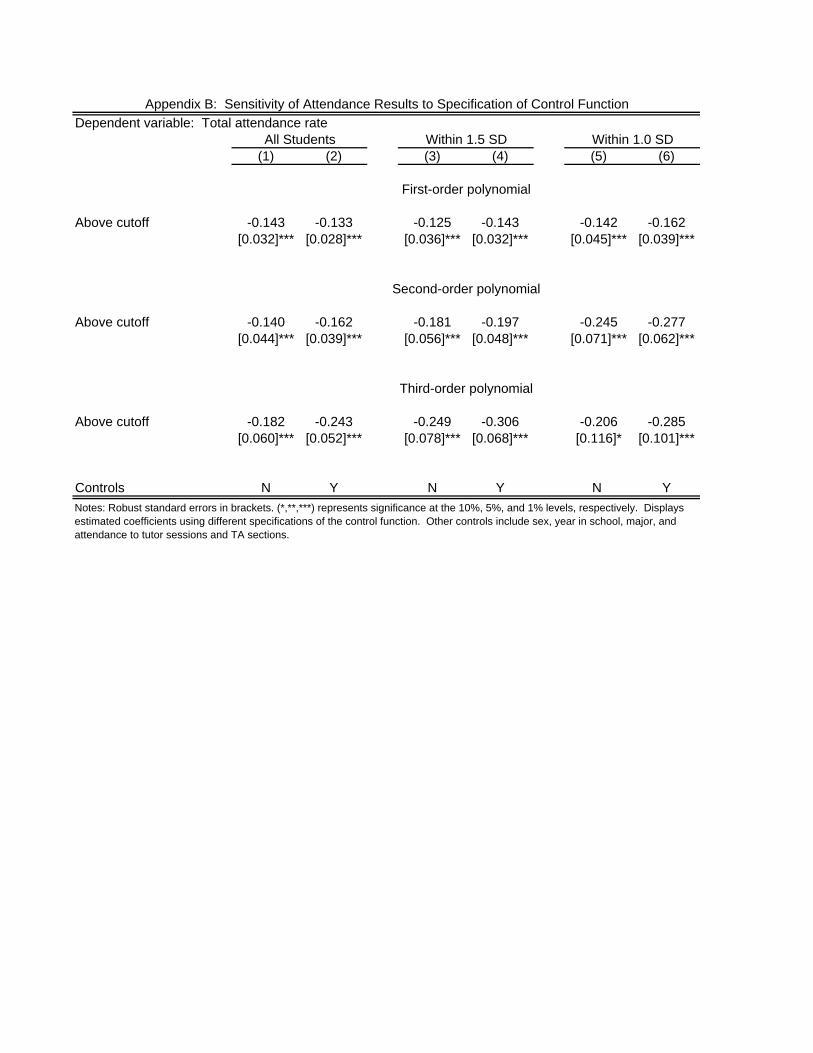
Appendix B: Sensitivity of Attendance Results to Specification of Control FunctionDependent variable: Total attendance rate
All Students Within 1.5 SD Within 1.0 SD(1) (2) (3) (4) (5) (6)
First-order polynomial
Above cutoff -0.143 -0.133 -0.125 -0.143 -0.142 -0.162[0.032]*** [0.028]*** [0.036]*** [0.032]*** [0.045]*** [0.039]***
Second-order polynomial
Above cutoff -0.140 -0.162 -0.181 -0.197 -0.245 -0.277[0.044]*** [0.039]*** [0.056]*** [0.048]*** [0.071]*** [0.062]***
Third-order polynomial
Above cutoff -0.182 -0.243 -0.249 -0.306 -0.206 -0.285[0.060]*** [0.052]*** [0.078]*** [0.068]*** [0.116]* [0.101]***
Controls N Y N Y N YNotes: Robust standard errors in brackets. (*,**,***) represents significance at the 10%, 5%, and 1% levels, respectively. Displays estimated coefficients using different specifications of the control function. Other controls include sex, year in school, major, and attendance to tutor sessions and TA sections.
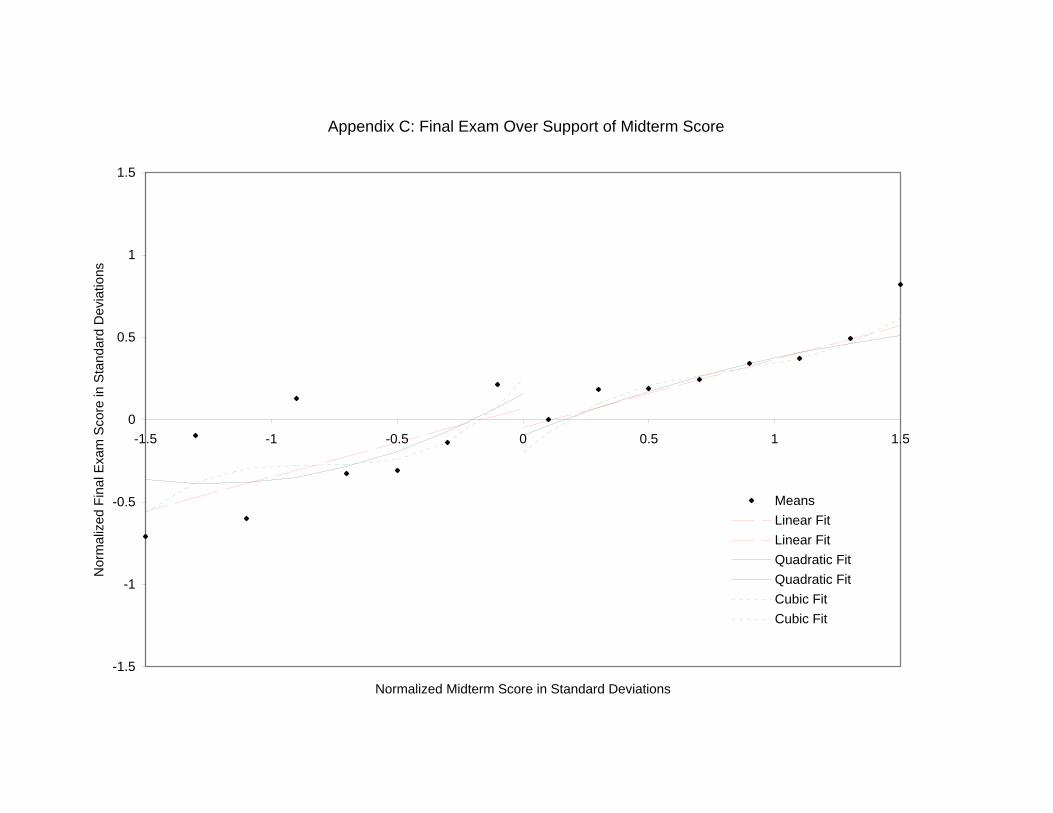
Appendix C: Final Exam Over Support of Midterm Score
-1.5
-1
-0.5
0
0.5
1
1.5
-1.5 -1 -0.5 0 0.5 1 1.5
Normalized Midterm Score in Standard Deviations
Nor
mal
ized
Fin
al E
xam
Sco
re in
Sta
ndar
d D
evia
tions
MeansLinear FitLinear FitQuadratic FitQuadratic FitCubic FitCubic Fit

Appendix D: Sensitivity of Exam Score Results to Specification of Control FunctionDependent variable: Standardized final exam score
All Students Within 1.5 SD Within 1.0 SD(1) (2) (3) (4) (5) (6)
First-order polynomial
Above cutoff -0.250 -0.181 -0.116 -0.110 -0.151 -0.154[0.149]* [0.138] [0.169] [0.155] [0.195] [0.176]
Second-order polynomial
Above cutoff -0.152 -0.140 -0.257 -0.265 -0.427 -0.457[0.198] [0.181] [0.240] [0.214] [0.288] [0.258]*
Third-order polynomial
Above cutoff -0.129 -0.255 -0.450 -0.577 -0.651 -0.787[0.258] [0.234] [0.318] [0.279]** [0.454] [0.396]**
Controls? N Y N Y N YNotes: Robust standard errors in brackets. (*,**,***) represents significance at the 10%, 5%, and 1% levels, respectively. Displays estimated coefficients using different specifications of the control function. Other controls include sex, year in school, major

Appendix E: Class Survey Instrument
Class Number 62041 62033 63717
Class ID ANTH-124-01 AMST-125G-01 ECON-101-01
Class Title Anthro of Religion African American City Life Managerial Economics
Days TuTh TuTh TuTh
Times 10-11:45am 12-1:45pm 10-11:45am
Class Location SS1 110 Oakes Acad 105 Kresge Clrm 321
Credits 5 5 5
Instructors Name XXXX XXXX XXXX
Enrolled as of today 79 155 93
Max Enrolled get from web 70 160 150
Date Supposed to examine class 5/23/06 (Tuesday) 5/23/06 (Tuesday) 5/25/06 (Thursday)
Actual date examining class
Researcher (Your Name)
Ask a student what class this is note the class title here
ASK A STUDENT THE FOLLOWING 4 QUESTIONSWhen is the next test in how many class days 0 = today.In class or in section
When is the next quiz in how many class days 0 = today. In class or in section Are the lecture notes availbale on line? What percent of the lecture do they cover?
Are lectures straight from book?
When is the next homework/assignment due?
Is Class Attendance MandatoryIs Class attendance monitored with either quiz, sign up sheet oor in some other way
Instructor gender (enter Male or Female)
How Old would you guess the Instructor is
Instructors appearance 1-5 scale
How late is lecture enter 0 if it starts on timeDoes the professor speak English Like someone born in the USIs the professor from another English speaking country (England, Australia, Ireland, India ect)How is the professors English on a scale of 1-5 5 being native fluencyHow clear is the teachers writing on a 1-5 scale 5 being perfect
On a scale of 1-5 how organized is the instructorOn a scale of 1-5 how energetic/ Interesting is the instructor
On a scale of 1-5 how Interesting is the class
Number of people talking in class
Number of people not paying attention in class
What is todays weather (Sunny, Rainy, Cloudy)
Does the instructor call on people
Does the instructor interact with the class
Does the instructor use PPT
Does the instructor use the overhead projector
Does the instructor write on the chalk board
Does the instructor use the camera projector?
Students in Class (Count on 15th minute of lecture)
Count Men (Count on 15th minute of lecture)
Count Women (Count on 15th minute of lecture)

Appendix F: Web Based Surve y
UC Santa Cruz: Class Attendance SurveyThank you for participating in this important survey. All your responses are anonymous.
1. How many class meetings per week, excluding section, are on your course schedule per week? 00
2. How many class, excluding section, did you skip in the last week? 00
3. How many hours do you work per week?
4. How many hours do you spend participating in extracurricular activities? (including campus clubs, universityathletics, fraternity/sorority, etc)
5. How do you make up for classes you skipped? (Choose all that apply) Go to TA section Read textbook for class Borrow notes Attend MSI/outside tutoring Borrow notes Nothing
6. Describe the reason you missed the most recent class you skipped?
END OF SURVEY!
Thank you for taking the time to complete this survey. Select Submit Survey now to send your responses to us and register for the raffle.