causes of deforestation of the brazilian amazon - open knowledge
TRANSCRIPT

THE WORLD BANK1818 H Street, NW
Washington, DC 20433 USA
Telephone: 202 473-1000
Internet: www.worldbank.org
E-mail: [email protected]
ISBN 0-8213-5691-7
THE WORLD BANK
Sergio Margulis
W O R L D B A N K W O R K I N G P A P E R N O . 2 2
Cau
ses of Deforestation
of the B
razilian A
mazon
NO
.
22 Causes of Deforestation of the
Brazilian Amazon
Causes of Deforestation of the Brazilian Amazon is part of the World
Bank Working Paper series. These papers are published to communicate
the results of the Bank’s ongoing research and to stimulate public dis-
cussion.
This report suggests that, in contrast to the 1970s and 1980s when occu-
pation of Brazilian Amazonia was largely induced by government poli-
cies and subsidies, recent deforestation in significant parts of the region
is basically caused by medium- and large-scale cattle ranching.
Following a private rationale, the dynamics of the occupation process
gradually became autonomous. Among the causes of the transformation
are technological and managerial changes and the adaptation of cattle
ranching to the geo-ecological conditions of eastern Amazonia which
allowed for productivity gains and cost reductions. The fact that catle
ranching is viable from the private perspective does not mean that the
activity is socially desirable nor environmentally sustainable. Private
gains need to be contrasted with the environmental (social) costs asso-
ciated with cattle ranching and deforestation. It also is legitimate to
argue that the private benefits from large-scale cattle ranching are large-
ly exclusive, having contributed little to alleviate social and economic
inequalities. However, decreases in the price of beef in national markets
and increases in exports caused by the expansion of cattle ranching in
Eastern Amazonia may imply social benefits that go beyond sectoral and
regional boundaries.
The key policy recommendations of the study are: (i) to acknowledge the
private logic of the present occupation process of Brazilian Amazonia; (ii)
to change the focus of policies towards cattle ranchers as the key driv-
ing force of deforestation, recognizing their interests and private eco-
nomic gains; (iii) given the lack of knowledge about environmental costs
and the uncertainties associated with the irreversibility of present deci-
sions, to formulate policies aimed at halting further expansion of the
frontier in those areas which are still unaffected and encourage intensi-
fication of agriculture and cattle ranching in areas undergoing consoli-
dation.
World Bank Working Papers are available individually or by subscription,
both in print and online.
™xHSKIMBy356913zv,:;:':*:"
Pub
lic D
iscl
osur
e A
utho
rized
Pub
lic D
iscl
osur
e A
utho
rized
Pub
lic D
iscl
osur
e A
utho
rized
Pub
lic D
iscl
osur
e A
utho
rized


THE WORLD BANK
Washington, D.C.
Sergio Margulis
W O R L D B A N K W O R K I N G P A P E R N O . 2 2
Causes of Deforestation of theBrazilian Amazon

Copyright © 2004The International Bank for Reconstruction and Development / The World Bank1818 H Street, N.W. Washington, D.C. 20433, U.S.A. All rights reserved Manufactured in the United States of America First printing: December 2003
printed on recycled paper
1 2 3 4 05 04 03
World Bank Working Papers are published to communicate the results of the Bank’s work to thedevelopment community with the least possible delay. The typescript of this paper therefore hasnot been prepared in accordance with the procedures appropriate to journal printed texts, and theWorld Bank accepts no responsibility for errors. Some sources cited in this paper may be informaldocuments that are not readily available.
The findings, interpretations, and conclusions expressed in this paper are entirely those of theauthor(s) and do not necessarily reflect the views of the Board of Executive Directors of the WorldBank or the governments they represent. The World Bank cannot guarantee the accuracy of thedata included in this work. The boundaries, colors, denominations, and other information shownon any map in this work do not imply on the part of the World Bank any judgment of the legalstatus of any territory or the endorsement or acceptance of such boundaries.
The material in this publication is copyrighted. The World Bank encourages dissemination of itswork and normally will grant permission for use.
Permission to photocopy items for internal or personal use, for the internal or personal use ofspecific clients, or for educational classroom use, is granted by the World Bank, provided that theappropriate fee is paid. Please contact the Copyright Clearance Center before photocopying items.
Copyright Clearance Center, Inc.222 Rosewood DriveDanvers, MA 01923, U.S.A.Tel: 978-750-8400 • Fax: 978-750-4470.
For permission to reprint individual articles or chapters, please fax your request with completeinformation to the Republication Department, Copyright Clearance Center, fax 978-750-4470.
All other queries on rights and licenses should be addressed to the World Bank at the addressabove, or faxed to 202-522-2422.
ISBN: 0-8213-5691-7eISBN: 0-8213-5692-5ISSN: 1726-5878
Sergio Margulis is Lead Environmental Economist in the Environment unit of the Latin Americaand Caribbean department at the World Bank.
Library of Congress Cataloging-in-Publication Data
Margulis, Sergio.Causes of deforestation of the Brazilian Amazon/Sergio Margulis.
p. cm. -- (World Bank working paper; no. 22)Includes bibliographical references.ISBN 0-8213-5691-71. Deforestation--Brazil. 2. Deforestation--Amazon River Region. 3.
Ranching--Environmental aspects--Brazil. 4. Ranching--Environmental aspects--AmazonRiver Region. I. Title. II. Series.
SD418.3.B6M27 2003333.75’137’0981--dc22
2003063305

TABLE OF CONTENTS
Foreword vii
Second Foreword ix
Abstract xi
Acknowledgments xiii
Acronyms and Abbreviations xv
Executive Summary xvii1. Motivation for the Study 1
2. Deforestation and Land Use in Amazonia: Evidence of Large Scale Cattle Ranching 5
Temporal Trend of Deforestation 5Spatial Patterns at the Municipal Level 6Evolution of Land Use in Legal Amazonia 9Contribution of Large and Small Deforested Areas to Overall Deforestation 10Evolution of the Cattle Herd 13Socioeconomic Benefits from Deforestation: Early Evidence 14
3. Different Frontiers and Their Economic and Social Dynamics: Determinants of Amazon Occupation 17Expansion of the “Speculative Frontier” and the Deforestation Process 20Determinants of Land Occupation in Amazonia: An Econometric Model 25
4. The Microeconomics of Beef Cattle Ranching in Amazonia 29
The Beef Cattle Economy in Amazonia: Brief Background 30Field Research 32Technical Parameters Adopted 33Production Costs: Pastures 36Net Income per Hectare 37Analysis of Yield 37Mathematical Modeling 39Some Simulations 41Final Considerations and Trends 43
5. Social Costs and Benefits of Deforestation 47
Government Incentives: Subsidies as a Basis for Cattle Ranching and Deforestation? 48Estimate of Economic (Social) Costs of Deforestation in Amazonia 51Sustainable Alternatives: Comparing Costs and Benefits 55
6. Conclusions and Recommendations 59Main Results: Conclusions 59Recommendations 62
Annex: Socioeconomic Development in Brazilian Amazonia 67
References 73
iii

IV TABLE OF CONTENTS
TABLES
Table 1: Evolution of Land Use in Legal Amazonia in Census Years (percent) 9Table 2: Evolution of Land Use in the cerrado 10Table 3: Property Rights in Legal Amazonia, in Census Years
(percent of Geographic Area) 11Table 4: Distribution of the Number and Area Occupied by Establishments
in Legal Amazonia, According to Size, Average for 1970-95 11
Table 5: Average Size of Deforested Plots, 1996-99 (in percentage terms) 12Table 6: Percentage Contribution of Plot Sizes to Deforestation per State,
Average 1997-99 13
Table 7: Evolution of the Cattle Herd (1990-2000) (thousand animals) 13Table 8: Evolution of Per Capita Rural Income in the States of Legal Amazonia,
1970-95 (1995 US dollars) 15Table 9: Evolution of Beef Exports and Per Capita Consumption in Brazil
(1995-2000) 15Table 10: Size of the Properties and Land Use Adopted in the Panels 34
Table 11: Main Animal Production Indices as Indicated by the Panels 35Table 12: Comparison of the Parameters of the Panels with IBGE Data,
Municipality of Paragominas (Pará) 35Table 13: Net Income per Hectare from Cattle (in Reals per year) 37Table 14: Internal Rates of Return (IRR) from Rearing, New-breeding
and Fattening Systems 38Table 15: Internal Rates of Return (IRR) from New-breeding and Fattening System 38
Table 16: Net Returns (in Reals per Hectare) 40
Table 17: Absolute Deviations of Crops over the Past 10 Seasons (in January 2002 Reals per Hectare) 40
Table 18: Results of Deforestation Tax Simulations 42
Table 19: FINAM Fiscal Incentives by Sector (in 2000 US$ million) 45
Table 20: Maximum Herd Numbers Benefiting from FINAM Incentives (a) 50Table 21: Rural Credit for Northern Region (in 2000 US$ million) 50
Table 22: Summary of the Estimates of the Costs of Deforestation 54Table 23: Value of Renting the Land for Grazing in Legal Amazonia, 1998-2001
(US$ per ha/year) 55
Table A1: Evolution of Rural and Urban Populations, GDP and GDP per capita in Legal Amazonia, 1970-95 71
FIGURES
Figure 1: Accumulated Municipal Deforestation up to 2000 7Figure 2: Deforested Area Within Rural Establishments, 1995/96 8
Figure 3: Cattle Densities (heads/km2) in 1975 and 1996 14Figure 4: Evolution of Transport Costs, 1980 and 1995 18
Figure 5: Production Costs: Rearing—New-breeding—Fattening Panels 36

TABLE OF CONTENTS V
Figure 6: Efficient Frontier: Risk and Income Combinations (Paragominas) 41
Figure A1: Accumulated Distribution of Municipal Population in Legal Amazonia According to GDP per capita, 1970-1995 (in constant 1995 US$) 68
Figure A2: Accumulated Distribution of Municipal Population in Legal Amazonia, According to Population with Insufficient Income, 1970-1991 69
Figure A3: Average Life Expectancy in Municipalities of Legal Amazonia, 1970-91 69
Figure A4: Infant Mortality in Municipalities of Legal Amazonia (deaths per 1000 live births) 70
Figure A5: Cumulative Distribution of the Municipal Population of Legal Amazonia,According to Illiteracy Rates, 1970-91 71


vii
FOREWORD
This study is part of a discussion process regarding the causes and dynamics of deforestation inthe Brazilian Amazon. This initiative was launched by the Ministry of Environment in 2000,
and the World Bank has been a partner in this process from the beginning. The objective of thedebate has been to find coherence and a better understanding of the factors associated with theexpansion of deforestation and the public policies attempting to arrest it.
Two underlying observations prompted this initiative: the first, that although the aggregateinformation on the deforestation rates of Legal Amazonia, published every two years by theNational Institute of Spatial Research (INPE), contributed to the understanding of the evolutionof the process, they did not allow for the formulation of short-term policies aiming at immediateinterventions; the second, is that the interruption of fiscal and financial incentives prevailing in the1970s, considered to be one of the determining causes of deforestation expansion, did not pro-duce the expected results. Even in the absence of such incentives, deforestation was still growing.
These observations lead the Secretariat of Coordination of Legal Amazonia to invite specialiststo debate and stimulate research, oriented towards changes in the policies implemented by theMinistry of Environment. It was necessary to disaggregate the data by States and municipalities inorder to understand the dynamics of the different activities expanding in the region, and also toinvestigate the social and political forces acting in specific contexts, particularly those havinggreater influence on the growth of deforestation rates.
This work—“Causes of Deforestation of the Brazilian Amazon”—appears in this context. Thecentral issue which it attempts to study is the role of cattle ranching—its dynamic and profitabili-ty—in the expansion of deforestation. If there are no fiscal incentives, other factors must make theactivity feasible, justifying its continuous expansion in new forest areas. To answer this and otherquestions, the study analyzes the microeconomic behavior of cattle ranching, placing it in thebroader context of the expansion of the logging and agricultural frontiers in one of the mostimportant fronts of economic occupation of the region—Eastern Amazonia. In addition, the studycompares the economic gains with the associated social and environmental costs, incorporating thesocioeconomic dynamics of the social agents on this frontier into the analyses. It must be kept inmind that in the Amazon, agriculture and cattle ranching benefit from indirect gains coming fromweak land titling, land grabbing, irregular labor contracts, and the continuous process of openingup of new forest areas. These are carried out at low cost by posseiros and small farmers, who pre-pare the land for more profitable enterprises which follow them.
Even though it started two years ago, the discussion presented in this study is extremely pres-ent. According to INPE’s projection, between 2001 and 2002, deforestation in the Amazon wentfrom 18,166 square kilometers to 25,476, the second largest increment since 1995. This fact initself makes relevant the reading and discussion of this study, because of its contributions both tothe diagnostic as well as the propositions of public policies. We hope this initiative stimulates newstudies, more field work, and studies looking at feasible solutions, capable of influencing decisionsnot only in the government’s environmental area but, more importantly, regional developmentpolicymakers.
Mary Helena AllegrettiSecretary of Amazon CoordinationMinistry of Environment


SECOND FOREWORD
Brazil’s natural assets are legendary. The country is home to the largest rain forest biome in theworld, the Amazon, containing by far the largest portion of remaining rain forest. The legal
Amazon covers 60 percent of the Brazilian territory, with some 21 million inhabitants, or about12 percent of the population, nearly 70 percent of whom live in cities and towns. Brazil also hasthe largest freshwater reservoir in the world, with the Amazon region alone containing up to one-fifth of the world’s freshwater. Sustainable use of this enormous wealth would not only provideresources for the future, but also be a source of greater equity and poverty reduction since naturalresources constitute a much higher proportion of the assets of the poor (some 80 percent) than ofthe rich.
The interest in sustainability is heightened by the Amazon deforestation rates. Of the originalforest cover, 17 percent has been cleared, although at least a third of that is growing back. Itsglobal value is seen in its rich biodiversity and the possible impact on climate due to its disappear-ance. Provisional data showing 25,400 sq. km. of deforestation in 2002, compared to an averageof 17,340 sq. km. for the preceding ten years, illustrate the rising threat to key ecosystems. Thenear disappearance of Brazil’s unique Atlantic forest earlier brings out the urgency of action. Someexperiences worldwide and in Brazil with sustainable use of natural resources could serve as a basisfor an environmental strategy with social inclusion.
The factors behind unsustainable resource use, however, are complex, and it is important tounderstand these sources if actions are to be effective. The Amazon region is challenged by a widerange of issues, including lack of consensus on development strategies; lack of adequate socialservices, infrastructure, and transportation; property right ambiguities and land use conflicts; rapidurbanization and poor quality of life in cities; inability to control deforestation and fires; role ofindigenous people in development and environmental management; low institutional capacity andweak governance—and unmanaged expansion of cattle ranching and agriculture.
This study is a unique contribution in that it suggests that, in contrast to the 1970s and1980s, when occupation of the Brazilian Amazon forest was largely induced by government poli-cies and subsidies, much recent deforestation seems the result of medium- and large-scale cattleranching, which is increasingly profitable and dominated by powerful agents. It emphasizes that itis essential to understand the strong private interests causing the increasing deforestation, andadopt policies that factor them into actions. It would also be essential to promote alternative andcomplementary business development that is more sustainable and equitable than at present. Con-trolling open access in the interior, while promoting the sustainable use of forested areas, seem keyto avoiding as-yet poorly understood damage that may foreclose future options.
By bridging environmental and social policies, Brazil could in some form protect a sizable partof the existing Amazon forest, and improve the living standards and meet the aspirations of thelocal population. Overall, there is a recognition of the need for better policies and stronger institu-tions to manage natural resources. A growing domestic constituency supports sound environmen-tal policies. Support for all this could be provided through public and private investments at thefederal, state, and municipal governments, as well as policy analysis, knowledge exchanges, consen-sus building and the promotion of partnerships. A major opportunity for guiding World Bankcontributions may be the federal Amazônia Sustentável program, with its linkages to the federalMultiyear Plan, and the Bank's new Country Assistance Strategy.
Vinod ThomasDirector, Brazil Country Management UnitThe World Bank
ix

xi
ABSTRACT
The worldwide concern with deforestation of Brazilian Amazonia is motivated not only by theirreversible loss of this natural wealth, but also by the perception that it is a destructive
process in which the social and economic gains are smaller than the environmental losses. Thisperception also underlies the diagnosis, formulation and evaluation of public policies proposed bygovernment and non-governmental organizations working in the region, including the WorldBank. The present work suggests that a fuller understanding is necessary with regard to the moti-vations and identity of the agents responsible for deforestation, the evaluation of the social andeconomic benefits from the process and the resulting implications of public policies for the region.
The objective of the report is to show that, in contrast to the 1970s and 1980s when occupa-tion of Brazilian Amazonia was largely induced by government policies and subsidies, recentdeforestation in significant parts of the region is basically caused by medium- and large-scale cattleranching. Following a private rationale, the dynamics of the occupation process gradually becameautonomous, as is suggested by the significant increase in deforestation in the 1990s despite thesubstantial reduction of subsidies and incentives by government. Among the causes of the trans-formation are technological and managerial changes and the adaptation of cattle ranching to thegeo-ecological conditions of eastern Amazonia which allowed for productivity gains and costreductions.
The fact that cattle ranching is viable from the private perspective does not mean that theactivity is socially desirable or environmentally sustainable. Private gain needs to be contrastedwith the environmental (social) costs associated with cattle ranching and deforestation.
From the social perspective, it is legitimate to argue that the private benefits from large-scalecattle ranching are largely exclusive, having contributed little to alleviate social and economicinequalities. The study notes, however, that decreases in the price of beef in national markets andincreases in exports caused by the expansion of cattle ranching in Eastern Amazonia may implysocial benefits that go beyond sectoral and regional boundaries.
From an environmental perspective, despite the uncertainties of valuation, the limited evi-dence available suggests that the costs of deforestation may be extremely high and possibly exceedprivate benefits from cattle ranching, particularly when the uncertainties of irreversible losses ofgenetic heritage (not yet fully understood) are incorporated. In this respect, activities such as sus-tainable forest management should be considered environmentally and socially superior. However,new policy instruments, funding mechanisms and monitoring and enforcement structures (that aredifficult to implement) will be needed to make sustainable forest management a feasible alternativeand to make ranchers internalize the environmental costs of their activities.
The key policy recommendations of the study are: (i) to acknowledge the private logic of thepresent occupation process of Brazilian Amazonia; (ii) to change the focus of policies towards cat-tle ranchers as the key driving force of deforestation, recognizing their interests and private eco-nomic gains; (iii) given the lack of knowledge about environmental costs and the uncertaintiesassociated with the irreversiblity of present decisions, to formulate policies aimed at halting furtherexpansion of the frontier in those areas which are still unaffected and encourage intensification ofagriculture and cattle ranching in areas undergoing consolidation.
This study aims to stimulate and provide inputs to the debate on these themes, particularlybetween the government and the main agents of deforestation identified here (especially mediumand large ranchers).


xiii
ACKNOWLEDGMENTS
The attempt to better understand the economic rationale of deforestation of the Brazilian Ama-zonia is part of a process that started almost two decades ago, with the World Bank trying to
help the government to elaborate alternatives for the sustainable development of the region. Fewtopics are so fascinating in the global environmental agenda. Probably because of this, few worksof the Bank have received so many contributions and had such an in-depth review. Many col-leagues were engaged in this process in order to ensure the clarity of the ideas and technicalresults presented here. In this sense, my personal thanks to Robert Schneider (in particular),Eustáquio Reis, Chris Diewald, Ken Chomitz, Joachim von Amsberg, John Redwood, and LuisGabriel Azevedo.
The work was based on five “background papers” developed by teams headed by GeraldoSant’Ana de Camargo Bastos and Sergio de Zen (ESALQ), Eustáquio Reis, Ronaldo Seroa daMotta (IPEA), Pablo Pacheco (IPAM/CIFOR), and Edna Castro (UFPA), whom I must congrat-ulate and thank for the quality of the work.
Besides these, the list of people who I should also thank is too long, and I would never beable to do justice to all individually, or the institutions which they represent. From the Secretariade Coordenação da Amazônia/MMA, with whom I discussed from the beginning the originalmotivation and the relevance of the theme: Mary Allegretti, Vanessa Fleischfresser, MarioMenezes, Katia Costa, and Brent Milikan.
World Bank colleagues under different conditions and circumstances: Adriana Moreira, DanBiller, Claudia Sobrevila, Gregor Wolf, Ricardo Tarifa, Joe Leitmann, Daniel Gross, Robert Davis,Teresa Serra, Gunnar Eskeland, and Vinod Thomas.
From the field visits to Amazonia: Jonas Veiga, Judson Valentim, Alfredo Homma, MarisaBarbosa (EMPBRAPA), Marky Brito, Paulo Barreto, Eugenio Arima, Adalberto Veríssimo (IMA-ZON), Larissa Chermont, Ana Cristina Barros, Anne Alencar, Ricardo Melo, Cassio Pereira, Eriv-elto Lima, José Benatti (IPAM), Merle Faminow (IDRC), Jorge Orsi (SPRN-RO), FredericoMuller, Paulo Leite, Gina Valmorbida (FEMA-MT), and Philip Fearnside (INPA).
Coments, information and general technical data received from Diógenes Alves (INPE), Clau-dio Ferraz, Marcia Pimentel, Ajax Moreira (IPEA), Nilson Ferreira (IBAMA), David Kaimowitz,Sven Wunder (CIFOR), Hans Jansen (IFPRI), Dennis Mahar, Nigel Smith (U.of Florida), JeanTourrand (CIRAD), Fernando Rezende, Gordon Hughes, Cornelis de Haan (consultants), andAlvaro Luchiezi (WWF).
Special thanks to FAO for funding part of the research, particularly to Henning Steinfeld,who also participated in technical discussions.
Thanks also to Lilian Santos, Mírian Felicio, and Karen Ravenelle for their editorial and print-ing support, and to John Penney for the translation.
I would also like to thank the various cattle ranchers, loggers, farmers and administrators whowe interviewed in various cities in the field research, but who would be impossible to list individu-ally—with them I have in fact learned a different perspective of the problem. Many thanks also forthe cordial treatment given to us.
Finally, even though I have received help and constructive comments from so many col-leagues, the results and opinions here presented are the author’s sole responsibility, and do notnecessarily reflect the points of view of the people above, of the institutions for which they work,and in particular of the World Bank.


xv
ACRONYMS AND ABBREVIATIONS
ADA Amazon Development AgencyAML Legal Amazonia ARPA Amazon Region Protected Areas ProjectAU Animal UnitCEPEA Center of Advanced Economic StudiesCGIAR Consultative Group on International Agricultural Research CSR Remote Sensing Center of IBAMAESALQ Agricultural University Luiz de QueirozFAO United Nations Food and Agriculture OrganizationFEMA Environmental Agency of Mato GrossoFINAM Amazon Investment FundFNO Constitutional Fund of the NorthFPE State Participation FundFPM Municipal Participation FundFUNAI National Indigenous FoundationGDP Gross Domestic ProductGEIPOT Brazilian Transport Enterpriseha HectareIBAMA Federal Environmental AgencyIBGE National Geography and Satistics InstituteICMS Value Added TaxIMAZON Man and Environment Institute of AmazoniaINCRA National Institute of Colonization and Agrarian ReformINPE National Space Research InstituteIPAM Amazon Environmental Research InstituteIPEA Applied Economic Research InstituteIRR Internal Rate of Return ITERPA Land Institute of ParáMCA Minimum Comparable AreasMMA Ministry of Environment MT State of Mato GrossoNPV Net Present ValuePA State of ParáPPG7 Pilot Program for the Protection of Brazilian Tropical Rainforests PROARCO Fire Prevention and Control Program of Legal AmazonPROBIO Program for the Conservation and Sustainable Use of Brazilian BiodiverityRO State of RondôniaSFM Sustainable Forest ManagementSIDRA IBGE System of Automatic Data (Agricultural Research)SP State of São Paulo SUDAM Amazon Development AgencyUFPA University of ParáUSP University of São PauloUNCTAD United Nations Conference on Trade and Development


xvii
EXECUTIVE SUMMARY
The World Bank and the Brazilian Government have for many decades discussed projects,strategies and the promotion of sustainable development policies for Amazonia. One of the
fundamental questions raised in the course of this dialogue has been that of understanding theprocess of deforestation in the region. Despite these efforts, there still is no consensus about suchbasic questions as who the main agents of deforestation are and what their real incentives are.Recent studies by the World Bank and others have pointed to the low profitability of cattle ranch-ing in the region—which leaves open the question how to explain the continued advance of theprocess even after fiscal incentives have been reduced or virtually eliminated.
Aside from this lack of knowledge, the process of deforestation in Brazilian Amazonia iswidely regarded as detrimental to the environment, while producing limited economic and socialgains. In addition to uncertainty about the precise extent of the environmental costs and lossescaused by deforestation, perceptions of possible economic and social benefits lack a firm empiricaland analytical basis. This has led to a range of opinions about the actual process of land occupa-tion and deforestation. The following are some of the views commonly heard:
� The agents of deforestation operate with short-term planning horizons, and their activitiesare mainly based on forest nutrient mining;
� Cattle ranching is a low profit activity in Amazonia and only continues because it benefitsfrom government credits and subsidies or because of prospective speculative gains;
� Small producers are important agents in the deforestation process; � Timber extraction is one of the main causes of deforestation in the region;� Roads are also causes of deforestation, and not consequences of the high agricultural and
livestock potential of the region; � Soybean cultivation is increasing rapidly in the cerrado, causing the agricultural frontier to
expand into forest areas; � Environmental costs measured locally, nationally and globally are so high that any activities
which lead to deforestation are irrational;� There are numerous alternative sustainable activities that could substitute cattle ranching
and generate more substantial social, economic and environmental benefits.
The continuity and consistency of deforestation over the last few decades, after governmentincentives were substantially cut, suggest that, contrary to some of the views listed above, eco-nomic rationality does in effect underlie the process. Better understanding for this rationality isthe main objective of the present study.
One of the basic premises of the study is that, although the economic potential of the regionhas not yet been thoroughly assessed, there is a need to seek options for sustainable developmentof the region. However, a strong sense exists that the economic activities that drive much of thecurrent process of land occupation and deforestation—unsustainable logging and large-scale cattleranching—fail to use the natural resource base in a way that maximizes net social benefits. More-over, alternative models concerned with more sustainable and socially desirable uses of availableresources on the scale required are not widely known. Therefore, the major dilemma faced by theGovernment is that while it is keen to exploit the region’s vast potential in a sustainable way, it isnot yet fully aware of the real extent of this potential. As a consequence, decisions that are takennow about the uses of the Amazon forest involve significant risks and uncertainty.

The main questions to be investigated include:
� Who are the principal driving agents and what is the rationale behind deforestation ofBrazilian Amazonia?
� What is the true agricultural and cattle ranching potential of the Brazilian Amazonia andwhat are the natural limits to its expansion?
� What policies are appropriate in view of the uncertainties and risks involved in taking irre-versible steps in ecological terms?
� Would it be possible or even desirable to “close” the frontier and focus on consolidatingthose areas which have already been occupied and expand cattle ranching in areas withgreater potential?
� How to establish an alternative model “based upon the sustainable management of forestresources and its biodiversity” when this model has not yet been worked out on the neces-sary scale and while the “traditional” process of occupation continues at an increasing pace?
� Is the World Bank itself, which in light of its past experience in Amazonia decided to con-centrate largely on protection and conservation of the forest, fulfilling its role as an agentof sustainable development?
The main contribution of the present study is to demonstrate that beef cattle ranching in EasternAmazonia or on the consolidated frontier is highly profitable from the private perspective and that itproduces rates of economic return higher than those obtained from the same activity in the coun-try’s traditional cattle ranching areas. In addition to the availability of cheap land, these higherreturns are the result of surprisingly favorable production conditions—mainly rainfall, tempera-ture, air humidity, and types of available pasture. The direct return on cattle ranching itself(excluding profits from the sale of timber) consistently exceeds ten percent. These are valuespotentially earned by the more professional and better capitalized ranchers operating on the con-solidated frontier of Eastern Amazonia. Similar geo-ecological conditions in Western Amazonia,or in the areas where very dense forest cover predominates, make cattle ranching and agriculturepractically (or totally) unviable there. This corroborates previous Bank studies which indicate thatgeo-ecological conditions are the main determinants of agriculture and cattle ranching in Amazonia.
This study also proposes that the financial viability of the medium and larger capitalized agentsworking in the consolidated frontier is the real motivating force behind the deforestation process inBrazilian Amazonia. The large number of intermediary agents who have lower opportunity costsand precede the larger cattle ranchers are probably directly responsible for much of the deforestation.Their activities are made viable in part by the assurance that they will be able to sell the clearedland at a future date, thereby covering their opportunity costs. Without this assurance of futureland sales, the intermediary agents would have less incentive to deforest—at least on the presentscale. The more professional and productive ranching ends the speculative cycle and the “nutrientmining” activities of the first agents and marks the beginning of the consolidation of the frontier.
Evidence on deforestation and land use in Amazonia presented in the study shows that cattleranching is the main economic activity of the region and that the large and medium size opera-tors are the major agents responsible for deforestation. The smaller agents are generally used toprovide labor or to consolidate landholding by the so-called “warming” process (esquentamento),but these tend to make only a minimum direct contribution to deforestation. Regardless of thedifferent motives, interests and economic strategies of the many social actors operating on thefrontier, the end result of the land occupation process is most frequently the establishment ofranching activities. Cattle ranching enterprises now occupy nearly 75 percent of the deforestedareas of Amazonia.
Agriculture does not compete with cattle ranching in the forest areas. Geo-ecological barriers arein general more restrictive in the case of agriculture—a prime example is the high precipitationlevels in certain areas (above 2000 mm per year). Even in areas with less than this amount, rain-fall is one of the major factors favoring cattle ranching making it predominate.
XVIII EXECUTIVE SUMMARY

EXECUTIVE SUMMARY XIX
The study suggests that the high private profitability of ranching arising from the favorablegeo-ecological conditions induces both deforestation and the building of roads. As long as thegeo-ecological conditions remain favorable, there will be endogenous pressure to open moreroads which will be privately built by cattle ranchers in the absence of government. If ranchingwere not profitable, the existence of roads per se or of a road network built with more geo-politicalaims in mind (“exogenous” roads) would not be the cause of the present level of deforestation orforest conversion. It is evident, however, that trunk roads constructed for geo-political purposesmake ranching viable and therefore increase deforestation.
If cattle ranching is financially viable, the deforestation process does not only generate losses,as was assumed for the 1970s and 1980s. Even if private gains are less than the correspondingsocial and environmental costs, they do nevertheless generate income which is not only substan-tial but sustainable. In designing public policies for the region, it is vital to acknowledge this fact.Cattle ranchers so far have played a minor role in the public debate and have not been taken intoproper account in government policies. The study suggests policymaker’s focus should shift from log-ging activities to ranching, since the latter plays a far more substantial role than the former in theprocess of deforestation.
The financial viability of cattle ranching does not mean that public policies should support it.For such support, a social and environmental analysis of the costs and benefits of cattle ranching anddeforestation should be carried out. There are three basic hypotheses regarding the balance of thesocial benefits and costs:
(A) Private benefits are less than social costs. In this case, deforestation is not defensible froma social standpoint. This is nowadays the generally accepted hypothesis regarding defor-estation in Amazonia.
(B) The second hypothesis is that private and social gains exceed the social and environmentallosses from deforestation. This hypothesis represents tradeoffs between economic activityand protection of the forest.
(C) As in (B) above, the third hypothesis is that social benefits are greater than the correspon-ding costs, but the net benefits are smaller than those obtained from other activities, suchas sustainable forest management. In this case, public policies should not support cattleranching.
In addition to the difficulties of measurement and monetary valuation, any such cost benefitanalysis involves two further complicating factors. The first is that the externalities involved in thedeforestation process in Brazilian Amazonia have a global dimension. Thus, social analyses mustbe made according to the perspectives of local communities, of the Brazilian population as awhole, and also of the international community (the latter being a direct or indirect beneficiary ofthe services of the Amazon forest). Results may vary according to the level of analysis. For exam-ple, would deforestation be acceptable if it were socially desirable for the local populations butnot for the whole Brazilian population? Or would deforestation be defensible if it were in Brazil’sbest interests but not in that of the rest of the world?
The second factor is that Amazonia is an extremely large and diverse region, and resultsobtained from one subregion do not necessarily apply to others. As mentioned above, the rates ofreturn indicated by the present study can be achieved by the more professional cattle ranchers inthe “consolidated frontier” in Eastern Amazonia but not by the less advanced, average size opera-tors throughout the whole Amazon region.
This study seeks to make a contribution in terms of a social evaluation of deforestation inBrazilian Amazonia by, on the one hand, identifying the main agents involved in the process,the economic motives behind their activities and their possible economic returns—a private eval-uation of the process—and, on the other hand, by undertaking a monetary evaluation of theeconomic (social) costs of deforestation while making some comparisons with sustainable forestmanagement—a social analysis. Although a full cost-benefit analysis has not been possible due to

XX EXECUTIVE SUMMARY
the lack of more substantive information, a number of different scenarios are presented and com-pared, allowing a number of policy recommendations for the region to be proposed.
From the social point of view, the potential benefits associated with deforestation can be seenfirst in terms of private profit obtained by the cattle ranchers and secondly in terms of the socio-economic improvements experienced by local populations or even by the Brazilian population as awhole. Since 1970, regional income has risen substantially. Rural income per capita in particulartripled on average—from US$410 in 1970 to US$1,417 in 1995. In the states with the highestdeforestation rates, the increase was even higher: in Mato Grosso it rose from US$424 toUS$4,311, in Pará from US$356 to US$1,436, and in Rondônia from US$712 to US$2,304.
Regional socio-economic indicators—such as literacy, infant mortality and life expectancy—show there has indeed been significant progress but it has been insufficient to reduce the gap inrelation to the rest of the country. Moreover, the largest increase in regional income originated inthe urban as opposed to rural sectors, which suggests that improvements in social conditionsprobably had little direct link with deforestation. In summary, even if the private gains frommedium and large scale cattle ranching were significant, they appear to be largely exclusive,having contributed little to alleviate social and economic inequalities at the local level.
Even if local populations have not greatly benefited from the income generated by cattleproduction (and indirectly by deforestation), at the national level the price of beef has fallen con-tinuously over the past few years, when 100 percent of the increase in cattle herd in Brazil result-ed from the increased production in the main producer states of Amazonia—Pará, Mato Grosso,and Rondônia. Beef exports grew from 350,000 tons in 1999 to about 900,000 tons in 2002,representing approximately US$1 billion in export earnings.
As for the economic (social) costs of deforestation, despite the difficulty of quantifying andputting a monetary value on such costs, the study attempts to estimate costs so that comparisonscan be made with the aforementioned benefits. The social costs of deforestation were estimatedto be around US$100 per hectare per year. This figure is subject to great uncertainties because ofthe limitations of environmental valuation methodologies and data availability. A number of othereffects of deforestation for which no precise data exists have also been omitted. However, thevalue exceeds the potential income to be derived from cattle ranching (about US$75 per ha/year),so that the latter could be compensated.
In spite of this balance, there are no transfer mechanisms to make effective such compensa-tion, which would need to apply internationally since global externalities are involved. This is anextremely important issue. Current experiences in this respect are not encouraging, and there is anopportunity for the World Bank as well as the international donor community to play a role inthis regard.
The study developed simulation models for agricultural activities, showing that producersare averse to risk and prefer to avoid specialization by adopting a combination of crops, pastureand forest where this is possible. The simulations show that producers would be prepared toaccept relatively low sums (R$45 per ha/year—roughly US$15) as compensation for foregoingexpansion of cultivated areas into the forest. These amounts could be as high as R$200 perha/year in cases where risk aversion is regarded to be less pronounced (although in such casesproducers would convert forest to agriculture and not to cattle ranching, under the model’sassumptions). The simulations of imposing a tax on deforestation, instead of paying a compen-sation, suggest that producers would tend first to change the mix of crops, as opposed toreducing the amount of forest clearing. The difference between the two policies is who shouldbear the costs.
As for alternative activities, sustainable forest management is shown to be less economic from theprivate point of view than cattle ranching. It is also a very poorly-disseminated technique that is“sophisticated” in relation to unsustainable logging and cattle ranching, both widely practicedand perceived to involve very little risk. However, from the social point of view the study shows thatforest management is probably better on economic grounds. It can be assumed that it is also betterfrom the social and environmental points of view.
EXECUTIVE SUMMARY XXI
It should be noted that the analyses undertaken in the study must be viewed in context, espe-cially as concerns the private economic viability of ranching which in principle reflects the specificconditions of the sub-regions studied. These conditions include mainly the level of professional-ism of the ranchers, their scale of production and the amount of rainfall. Elsewhere in the region,results may differ from those presented in the study.
RecommendationsThe study proposes the following policy recommendations for the region:
Information and Planning� It would be fundamental to recognize that cattle ranching in parts of Amazonia is a poten-
tially profitable activity for producers and that this profitability is the basic driving forcebehind the deforestation process in these areas. In this respect, the Government, the WorldBank and the PPG7 should adjust the focus of their policies to change the incentives per-ceived by cattle ranchers. Acceptance of this thesis also implies acknowledging that impor-tant tradeoffs exist in the process of deforestation in Brazilian Amazonia.
� Forest protection policies should, as a priority, be aimed at producers on the consolidated frontierwho are at the heart of the process and not at those on the speculative frontier. This doesnot mean that there should be no effort to enforce, fine and ban illegal operations by theagents on the speculative frontier.
� The strategy should be to work with cattle ranchers and not against them. While some ofthese agents may not be prepared or willing to negotiate, there are a number of moreamenable major players interested in coming to some sort of compromise with the govern-ment and society in order to have their activities legalized.
� The authorities responsible for protection of the Amazon forest should also concentrateon loggers but not in terms of deforestation per se but because disorderly, predatory andlargely illegal timber extraction, as currently practiced, rules out the present or future possi-bility of sustainable forest management, an activity which would be better than cattle ranch-ing from an economic, social and environmental point of view.
� Zoning should be encouraged as part of an educational and negotiating process between eco-nomic agents (including cattle ranchers) and the government, leading gradually to landoccupation commitments in areas which are suitable from a social, economic and environmen-tal point of view.
� Since a great deal of misinformation and uncertainty exists about the various factors associat-ed with the deforestation process and expansion of the frontier, the risks involved suggest adopt-ing conservative strategies. With the heritage at risk in Amazonia, irreversible decisionsinvolving potentially high social, economic and environmental costs should be avoided. Inthis sense, conservation initiatives should be encouraged and the World Bank will continueto support such initiatives through the ARPA, PROARCO, PROBIO, and a number ofother projects sponsored by the Pilot Program.
� Among the most important factors analyzed in this study are the forests’ environmentalvalues and services and their associated possible social benefits. It will be important toenhance knowledge about these values and services provided by the region. It is equally impor-tant to analyze more thoroughly the effects of transport costs on deforestation.
Economic Instruments� A system to introduce greater flexibility into the designation of strict conservation areas,
such as tradable development rights, could yield enormous ecological and economic benefits.There is no reason why properties on fertile and productive areas should not be allowed tobenefit from higher percentages of deforestation provided that they compensate this with

additional areas of strict protection (legal reserves) in the ecologically richer areas. Theseareas would be identified by zoning initiatives (some have already been).
� One of the classic economic solutions to the problem would be to tax deforestation to obligeagents to internalize the environmental costs. The taxation simulations made in this studysuggest that high taxes are necessary in order to significantly reduce deforestation. Analternative would be to compensate agents for not deforesting. The simulations made suggestthat established ranchers willingness to accept for foregoing deforestation depends on theirlevel of risk aversion. The choice of the instrument will depend on the decision on whoshould or could actually pay.
� In addition to the national interest, the international community also benefits from theenvironmental services of the forest. Even if the total sum of national and internationalbenefits were potentially higher than the income from cattle ranching, transfer mechanismsdo not yet exist in practice and significant technical and political difficulties impede theirimplementation. The World Bank has a potential role to play in assisting the Brazilian Gov-ernment to examine relevant international initiatives and seek out appropriate partners.
� To date, the search for alternatives has been largely limited to sustainable forest manage-ment and small-scale pilot initiatives. Some of these are socially, environmentally and eco-nomically superior to cattle ranching. These efforts must be continued but they do not yetcompete with cattle ranching on the required scale. Sustainable forest management whichinvolves comparatively sophisticated techniques also has to compete with illegal loggingand has proven difficult to be disseminated, calling for major government support.
� The World Bank should review its largely conservation-oriented approach in relation to Ama-zonia over the past decade and focus more on the promotion of sustainable developmentthrough productive activities with high social and economic benefits and low (or evenzero) environmental impacts, represent alternatives for the future development of theregion. Approval of a project in support of the National Forest Program, presently underdiscussion with the Federal Government, would be an excellent step in this direction.
� The regional fiscal incentives which benefited larger landowners in the past have beenreduced and now tend to be better applied. Social programs such as the preferential FNOand the INCRA settlement projects could bring more substantial ecological and social benefits,particularly for small producers. This marriage of interests between environmental protec-tion and support for traditional local populations is one of the top socio-environmental con-cerns of the new Brazilian government and should be supported.
� Other economic instruments which have been the subject of discussion for some timeamong Ministry of Environment, IPEA and World Bank officials might include: (i) theintroduction of the Ecological Value-Added Tax (ICMS), (ii) the introduction of environ-mental criteria similar to those of the Ecological ICMS in the States and MunicipalitiesParticipation Fund (Fundo de Participação dos Estados e Municípios), (iii) reorientation ofthe criteria governing the award of fiscal or credit subsidies to promote sustainable activi-ties and development of sustainable technologies and scientific research, (iv) strengtheningthe introduction of environmental criteria in the allocation of agricultural credit in theregion, and (v) reviewing and fully eliminating existing subsidized credits for traditionalcattle ranching in Amazonia.
Enforcing the Law� Whatever economic incentives are applied, there is a persisting need for greater surveillance
and enforcement capacity. This will continue to be a major challenge owing to the immensesize of the region and the difficulties of working with the local stakeholders. Regardless ofpolitical determination, it will be difficult to reverse the inertial trend observed over severaldecades. However, recent experience in Mato Grosso demonstrates that this may be possible.
XXII EXECUTIVE SUMMARY
� To ensure more effective action, a strategy of institutional cooperation is fundamental. Agen-cies such as the MMA, IBAMA, ADA, the Ministry of Regional Development (IntegraçãoNacional), the Ministry of Planning, INCRA, FUNAI, and the Federal Police—in addi-tion to state governments—need to work together, agreeing common targets and definingindividual functions.
� Despite the political difficulties, the process of conceding property rights needs to be urgentlyand seriously reviewed and audited. Here, without further analysis, it is difficult to identifythe full network of interests involved. The results of not adequately addressing this issue,however, which are frequently associated with violence and fraud, are well known. Thesecould be reversed if the agencies dealing with land occupation were to perform moreeffectively, bringing order to land use once and for all, protecting and supporting smallproducers and guaranteeing the integrity of public land and the natural and social assets ofthe region. The speculative gains surrounding land transactions in the region are verysignificant and the key government intervention is the legalization of property rights. TheFederal Government working in partnership with the state governments should take deci-sive action on this issue.
EXECUTIVE SUMMARY XXIII


1
CHAPTER 1
MOTIVATION FOR THE STUDY
Brazilian Amazonia has economic potential which is fundamentally based on the richness ofits natural resources. The Government is faced with a significant dilemma: while it is anx-ious to capture this potential, it is unaware of its true extent. The new Minister of the
Environment, in her inaugural speech, made a reference to this dilemma, suggesting that theregion is viewed “… as a territory which almost naturally lends itself to the traditional expansionof the larger economy and less as the depository of an exceptionally wide biodiversity upon whichits future development could actually be based.” The principal questions include the following:What are the natural limits to the expansion of the agricultural frontier? Who are the agents andwhat is the logic of deforestation? Given the risks and uncertainty involved in taking irreversiblesteps in terms of environmental degradation and destruction of an area with a potential that isnot yet entirely understood, what should be done? Would it be possible or desirable to “close”the frontier, consolidating the areas with some occupation and allowing the expansion of agricul-ture and cattle ranching in the areas with greater potential? How to implant an alternative model“based on biodiversity”, when this model still raises doubts regarding its feasibility at the regionalscale and while the “traditional” process of land occupation is progressing at an accelerating pace?Is the World Bank itself—which in light of its past experience in Amazonia put much of its effortsin recent years into forest protection and conservation—optimizing its potential role as a catalystfor sustainable development of the region?
In the search for answers to these questions, the causes and dynamics of deforestation in theBrazilian Amazon have been recurrent themes in a large number of studies over the past twentyyears. These studies produced widely-accepted theses pointing to the key role played by cattleranching as a cause of deforestation. At the same time, these studies also underscored the appar-ent economic irrationality and significant environmental costs of this process, affirming thatdeforestation was the result of activities which yielded low economic returns and depended largelyon speculative gains or government subsidies. Dissatisfaction with the empirical bases of theseconclusions, particularly in the present economic context of Amazonia, provided one of the moti-vations for the present study.

2 WORLD BANK WORKING PAPER
The study is also prompted by the recommendations of two of the most recent pieces ofresearch done by the World Bank on the theme (Schneider et al. 2000 and Chomitz and Thomas2000) as well as by those of an older study (World Bank 1991) which suggest that economicanalysis of ranching in Amazonia is vital.
The present study was carried out in close collaboration with the Ministry of the Environment(MMA). It is in fact the product of a long term dialogue between the Bank and the governmentin search for conservation and sustainable development of the Amazon region. However, thepresent Report is the sole responsibility of the World Bank and its conclusions are not necessarilyendorsed by the MMA.
The concept paper (concluded in September 2001) from which the present study emerged,reviewed critically the conventionally-accepted theses regarding the causes and dynamics of defor-estation in Brazilian Amazonia. This gave rise to questions and alternative hypotheses requiringelucidation in the course of the study. The report contains a summary of the conclusions reachedand outlines the evidence assembled in a number of previous research reports, and seeks answersto specific questions raised by the concept paper.
In this context, the study conducted a critical examination of a number of conventionally-accepted theses about the causes and dynamics of deforestation in Brazilian Amazonia. To a largeextent they reflect a “common vision” about the deforestation process in Amazonia, for example:
� The agents of deforestation operate with short-term planning horizons and their activitiesare mainly based on forest “nutrient mining”;
� Cattle ranching is a low-profit activity in Amazonia and continues only because it benefitsfrom government credits and subsidies or because of prospective speculative gains;
� Small producers are important agents in the deforestation process; � Timber extraction is one of the main causes of deforestation in the region;� Roads are also causes of deforestation, and not consequences of the high agricultural and
livestock potential of the region; � Soybean cultivation is increasing rapidly in the cerrado, causing the agricultural frontier to
expand into forest areas; � Environmental costs measured locally, nationally and globally are so high that any activities
which lead to deforestation are irrational;� Numerous alternative activities could substitute cattle ranching and generate more sub-
stantial and sustainable social, economic and environmental benefits.
The totality of these theses would seem to imply that the deforestation process of Amazonialacks economic rationale. It is seen to be a “lose-lose” process generating environmental destruc-tion, limited economic benefits and trifling social gains. However, the fact that this process hascontinued over decades in most parts of the region, together with the difficulty of reversing it inthe absence of a highly-coordinated and effective set of public policies, suggests that an underly-ing rationality to this process does in fact exist. An attempt to discover the nature of this rational-ity, as its title suggests, is the primary objective of the present study.
The concept paper suggested that the deforestation process in Amazonia does not merelyconsist of the devastation of new frontiers by activities that generate low economic and socialreturns but, on the contrary, the process is driven by an array of economic activities led by cattleranching which generally produce substantial private economic gains.
In our understanding, the private financial analysis demonstrating high rates of return forcattle ranching under different conditions in Amazonia is perhaps the biggest contribution madeby the present study. Of course, the financial viability of ranching does not mean that it should besupported by public policies. A social analysis of the process needs to be carried out, comparingthe social costs and benefits of the activities associated with deforestation. It is important to knowfor example: (i) if the eventual income generated from activities in the wake of deforestation(especially ranching) is significant in terms of producing improvements in the living conditions of

CAUSES OF DEFORESTATION OF THE BRAZILIAN AMAZON 3
local populations (social welfare gains); (ii) whether the process is sustainable in the sense that itcan be maintained over long periods without government subsidies; (iii) what the economic costsof deforestation are, and how they compare with the benefits.
Finally, even in the case that a social benefit-cost analysis showed a positive net marginal ben-efit from deforestation, justifying its adoption, it would still be necessary to compare it with alter-native activities. These activities may prove to be “superior” to cattle ranching, in economic,social and environmental terms, justifying their adoption in place of cattle ranching. The keyquestions thus would be: do alternative activities which are ecologically, socially, and economicallysuperior to cattle ranching exist? Would they substitute or complement cattle ranching? And thesame set of questions regarding the economic justification of cattle ranching should be posed tothem—their costs and benefits, social gains, and sustainability.
This study does not attempt to respond to all these questions and at all levels of analysis (pri-vate and social). Several topics, however, are studied in greater detail. Some of them are based onexisting studies, while others employ the results of research financed as an offshoot of the presentstudy. The main research framework was constructed around the comments and suggestionsmade during the concept paper review meeting. At that meeting, the following topics were iden-tified as requiring further analysis:
� A comprehensive review of the microeconomics of cattle ranching in different parts ofAmazonia, taking into account different production systems, different scales of productionand focusing on the larger ranchers in particular;
� A detailed analysis to obtain a better understanding of the relationships between the pio-neer occupiers and large cattle ranchers—Do contracts exist between them or do theyindirectly build on one another’s actions? Are the ranchers really behind everything?; and
� Statistics summing up deforestation in terms of plot size, location, background and trends,by regions or biomes, or according to some other appropriate regional and geographicmeasure.
A number of other pertinent questions were discussed at the review meeting but were notpursued in this study. However, reference is made to such topics as appropriate. These questionsincluded alternative (sustainable) activities, law enforcement and issues concerned with legaliza-tion of property titles.
In order to verify and examine some of the hypotheses proposed in the concept paper and toattempt to respond to the above questions, five studies were carried out. The first—The BeefCattle Economy and the Land Occupation Process in Amazonia by Geraldo Sant’Ana de CamargoBarros et al. (CEPEA/ESALQ-USP)—sought to produce a more detailed assessment of the(micro) economy of beef cattle ranching in Amazonia, focusing on some of the main productionareas. The second—Deforestation in the Brazilian Amazon: a Review of Estimates at the Munici-pal Level by Pablo Pacheco (CGIAR/IPAM)—had as its main objective to evaluate and compareexisting data on deforestation and analyze the data’s consistency and reliability. The third—Actorsand Social Relationships on the New Frontiers of Amazonia by Edna Castro et al. (UFPA)—basically aims to evaluate the link between agents on the more advanced deforestation fronts, inan attempt to understand the relationships between the larger and smaller agents. The fourthstudy—An Estimate of the Economic Cost of Deforestation in Amazonia by Ronaldo Seroa daMotta (IPEA/RJ)—was concerned with an evaluation of the costs of deforestation in Amazoniain order to compare them with its potential economic benefits. Finally, the fifth study—LandOccupation in Amazonia: Determinants and Trends by Eustáquio Reis and Ajax Moreira(IPEA/RJ)—specified and estimated econometric models which, at the municipal level, attemptto identify the relationship between the dynamic of the deforestation process and the expansionof the beef cattle ranching frontier and its social-economic implications. The five studies (all inPortuguese, except the second one) are available in the World Bank’s Website (www.bancomundial.org.br).

4 WORLD BANK WORKING PAPER
In the course of the research new facts were learned, analyses were reassessed and severaladditional hypotheses emerged—some of which contradicted those originally proposed in theconcept paper.
Objectives of the StudyThe basic objective of this study is to better understand the dynamics and logic of deforestationin Amazonia. The main thesis, put forward in the concept paper, is that cattle ranching in signifi-cant parts of Amazonia, specifically in the more consolidated frontier regions of the Arc of Defor-estation, is quite profitable from a private point of view, and thus comprises a key driving forcebehind this process.
The study also seeks to better understand the dynamic and links between cattle ranchers andother agents participating in the process—including loggers, small producers, local authorities,etc.—in order to understand their respective roles in the overall process.
Once this basic hypothesis regarding the substantial private gain to be obtained from cattleranching is confirmed, the study analyzes other potential benefits from a social perspective as wellas the economic costs involved in deforestation. This provides the basis for a social cost-benefitanalysis of deforestation. While this is not fully achieved due to insufficient data, the numbersproduced permit some insights into the size of the social costs involved and allow a number oftentative policy recommendations to be proposed.
In addition, though alternative sustainable activities that would be better than cattle ranchingfrom a social perspective have not been analyzed, the study also compares the results obtainedwith published information on forest management.
Structure of the StudyThe study is divided into five chapters following this brief introduction. Chapter 2 presents pre-liminary evidence demonstrating the importance of cattle ranching in the dynamic of the defor-estation process. Given that ranching is on the whole predominant and that it continues toexpand despite the elimination of Federal Government subsidies, the main conclusion is that itmust therefore be economically viable from the point of view of private ranchers.
Chapter 3 attempts to distinguish between frontier agents in terms of economic size (value ofassets or size of land) as well as their different economic motivations and strategies, whether spec-ulative or productive. The chapter summarizes the results of one of the field studies which ana-lyzed the social relationships between the agents on the “more advanced” frontier. In the secondsection, the econometric model seeks to identify the relationship between explanatory variables ofthe dynamic of the deforestation process and expansion of the ranching frontier.
Chapter 4 analyzes the microeconomics of beef cattle ranching in Legal Amazonia, summa-rizing the results of one of the research activities contracted under the present study. The findingsof this research point to the private economic viability of beef cattle ranching in the areas studied,which present obvious comparative advantages.
Chapter 5 is an attempt to analyze from a social perspective the effects of the expansion ofthe regional economy in particular that based on cattle ranching. The chapter attempts to place avalue on the economic (social) costs of deforestation. It also seeks to compare some of the costsand benefits of the process.
The final Chapter summarizes the main lessons learned and presents a set of recommenda-tions for policies and actions that could be pursued by the Brazilian Government and the WorldBank.
5
CHAPTER 2
DEFORESTATION AND LANDUSE IN AMAZONIA: EVIDENCE
OF LARGE SCALE CATTLERANCHING
Temporal Trend of Deforestation1
Analysis of spatial patterns and deforestation trends in Brazil’s Amazon region suffers from thelack of a consistent, systematic empirical base. Brazil has however benefited significantly over thepast decade from progress in the areas of remote sensing and satellite image processing. This hasled to vastly improved knowledge of temporal and regional deforestation patterns in Amazonia.The key institutions responsible for primary data collection on deforestation through the employ-ment of remote sensing techniques are INPE, IBAMA, and FEMA-MT. Each of these institutionsapplies the results of its monitoring effort to different purposes. Moreover, differences of inter-pretation of the images and differently defined parameters occasionally lead to substantial dispari-ties between estimates.
Despite the comprehensive nature of the deforestation estimates, they are generally spatiallyaggregated. This makes it difficult to conduct an analysis of deforestation at the municipal orlower scale. More detailed assessments of the changes in vegetation cover over the past few yearsare temporally and regionally fragmented. Apart from remote sensing data, IBGE is the onlysource providing indirect estimates of deforestation on the basis of its land use surveys carried outevery five years (with the exception of 1990) as part of the Agricultural Census.
Estimates even of the original forest cover show fairly wide discrepancies—356 millionhectares according to FAO (1981), 379 million according to IBGE (1988), 409 million accord-ing to Skole and Tucker (1993), and 419 million hectares according to INPE figures (Faminow1998). As for actual annual deforestation, while INPE estimated this to be 1.5 million hectares ayear for the period 1978–1988, Skole and Tucker put this at an annual 2.1 million hectares.
Since 1988, INPE estimates have come to be regarded both at the central government andindividual state level as the officially accepted statistics on deforestation in Brazilian Amazonia.
1. This section and the next are based on Pacheco (2002a), a background paper available at the WorldBank’s Web site (www.bancomundial.org.br).

6 WORLD BANK WORKING PAPER
INPE defines deforestation as “the conversion of areas of primary forest by human activities aim-ing at the development of agriculture/cattle ranching activities, as detected by orbiting satellites”(INPE 2000). On the basis of this definition, areas undergoing regrowth of secondary forests areexcluded from the total gross annual deforestation figures, implying that an area once cleared willbe considered so permanently.2
According to INPE, the total area deforested in Brazilian Amazonia increased from 15.2million hectares in 1978 to 41.5 million hectares in 1990, 58.7 million hectares in 2000, and60.3 million hectares in 2001 (the latter according to linear projections based on a sample ofimages).3
The spatial dynamics are well known. Since the beginning of the 1990s, studies have indicat-ed that deforestation tends to be concentrated in a limited number of areas, with 76 percent ofnew deforestation occurring in only 49 Landsat images, and most of these in the so-called “arc ofdeforestation” (see Chapter 3). In 1998, 76 percent of all deforestation was concentrated in thestates of Pará, Mato Grosso and Rondônia. Moreover, this percentage increased to 85 percent in2000. Chomitz and Thomas (2000) suggested that 75 percent of all deforestation occurs within25 km of municipal, state, or federal roads and 85 percent within 50 km of some of these roads.
Spatial Patterns at the Municipal Level
INPE Data Two estimates made by INPE (Alves et al. 1997 and Alves 2000) suggest that deforestation isconcentrated more intensively in the municipal districts to the south and southeast of Legal Ama-zonia (AML). They also suggest that deforestation is an inertial process in the sense that areasmore likely to be deforested are next to those already cleared. Based on INPE data, Menezes(2001) estimated that in 1997,4 47 out of a total of 227 municipalities accounted for 50 percentof all deforestation in Mato Grosso, Rondônia, and Pará. Also, 139 municipalities covering anarea of 123 million hectares accounted for 90 percent of the entire deforestation in the samethree states, representing 77.4 percent of the total deforestation of Legal Amazonia.
IBAMA DataIBAMA’s main function is to carry out licensing and law enforcement operations. The IBAMAdatabase carries information dating from 1996 referring to plots greater than one hectare. Forestsat an advanced stage of secondary regeneration until 1996 are considered to be forested area.Eighty percent of the municipalities monitored by IBAMA fall within the “arc of deforestation”—the area boldly outlined in Figure 1 below—with the remainder dispersed throughout the statesof Mato Grosso, Rondônia, and Acre. The main drawback of this data is the lack of satelliteimages for certain municipalities in certain years.
IBGE Estimates Based on Census DataEstimates of changes in vegetation cover obtained from IBGE data are based on census surveys ofagricultural establishments carried out at five year intervals since 1970 (except for 1990, when theeconomic censuses were not carried out and the demographic census was postponed until 1991).
2. INPE processes images on a 1:250.000 scale, which only allows for the identification of changes incover greater than 6.25 hectares (corresponding to 1 mm2 on the scale). Each image covers a 184 × 184kilometer square, requiring 229 images to cover the whole of Legal Amazonia. Under cloudy conditions,INPE makes the assumption that the deforestation level is the same in the cloud-covered areas as that in thevisible parts identified in the image (Faminow, 1998).
3. Approximately 44 satellite images, or around 20 percent of the total of 229 that cover the whole ofAmazonia. These critical images are used to generate partial estimates of gross deforestation throughout theregion. Deforestation interpolated for the period 2000-2001 is of the order of 1.7 million hectares (INPE,2002).
4. Reference based on INPE figures, with images superimposed on IBGE map.

CAUSES OF DEFORESTATION OF THE BRAZILIAN AMAZON 7
The 1995/96 Agricultural Census is the most recent census for which data are available.5 Themain advantage of the IBGE census information is that it provides estimates of the deforestedareas in all the municipalities of Legal Amazonia over a long time span (Figure 2).6 The disadvan-tage is the lack of precision of the deforestation estimates in cases where producers fail to make adirect declaration, resulting in estimates having to be obtained indirectly from statements regard-ing land use in the various agricultural/cattle ranching properties. In the following analyses, theareas are defined as the sum of the areas of annual and perennial crops, planted pasture,7 plantedforest, fallow areas and unutilized (but normally productive) land. The IBGE Census includes inprinciple all the agricultural/ranching properties in Legal Amazonia, but fails to give informationrelating to publicly owned or unclaimed land (terra devoluta). Deforestation estimates, therefore,have to rely on hypotheses about the extent of vegetation cover on publicly-owned or unclaimedland, as well as about preexisting vegetation cover on privately-owned properties.
FIGURE 1: ACCUMULATED MUNICIPAL DEFORESTATION UP TO 2000
Source: Pacheco (2002a) based on IBAMA/CSR.
5. In the Census carried out in 1996, IBGE – aiming to avoid providing information about planting andharvesting referring to different periods – changed the reference period from the calendar year (January–December)to the agricultural year (August–July). More importantly, data collection carried out between January andMarch (before the harvest) of the year following the census was assembled for the 1995/96 Census in theperiod between August and December 1996 (in the post-harvest period). This probably generated an under-estimate of the number and area of agricultural/cattle ranching properties as the result of seasonal activitieswhich are pursued by other groups of agents, particularly squatters, sharecroppers and tenant farmers(Eustáquio Reis, personal communication).
6. The map partially distorts the degree of deforestation occurring in the region, since it utilizes the areacovered by agricultural/cattle ranching properties in the denominator in order to normalize the deforesta-tion measurement. This is not entirely appropriate, since the municipal areas present significant variations inthe size of geographical area appropriated or being used within the agricultural/cattle ranching properties.
7. Inclusion or not of natural pastures is a question to which no easy answer exists. On the one hand, itcan be reckoned that they were originally savannah (cerrado), and therefore in the strict sense of the worddo not fall into the deforestation category. On the other hand, it must be taken into account that the INPEestimates, for example, define forests by their physionomic features in the satellite images and therefore thefelling that takes place in the savannah areas can be considered as deforestation. In this respect, the inclusionof natural pastures in the IBGE estimates makes for a better comparison with the INPE estimates.

8 WORLD BANK WORKING PAPER
SummaryReviewing the existing estimates based upon the main sources of deforestation data, INPEappears to overestimate net deforestation and possibly even gross deforestation, as suggested byIBAMA figures. The advantage of the INPE data is nevertheless their methodological consistencyover a relatively long period of time.
The IBAMA data are based on a more detailed visual interpretation of images. This helps toensure a much higher level of reliability. IBAMA’s database however does not cover the whole ofLegal Amazonia and its estimates could in fact be lower than actual deforestation in a number ofmunicipalities because of the definition of forest used to measure accumulated deforestation inthe baseline period, which treats the intermediate and advanced stages of secondary forest as ifthey were actual forest.
The indirect estimates based on IBGE census data provide an excellent source of informationabout deforestation for agriculture and cattle ranching purposes, despite the impossibility of dis-tinguishing cleared areas from other types of vegetation. Analyses based on data from IBGEresult in lower deforestation estimates than those indicated by remote sensing. This is due to thelevel of resolution, and to underestimates of the number of agricultural establishments. It shouldalso be noted that some deforestation takes place outside the occupied areas and is not taken intoaccount by the official censuses.
The data suggest that deforestation has not followed a linear trend. The phenomenon has infact systematically increased since 1996. According to FEMA, there was an “encouraging” reduc-tion in the level of deforestation in the state of Mato Grosso in the two-year period 2000-2001compared with 1998-1999—approximately 32 percent—possibly due to the more aggressivemonitoring, licensing and enforcement policies adopted by that state during the period (Fearnside,2002). INPE data suggest that deforestation in the state of Mato Grosso in fact decreased byonly 9 percent in 1999-2000, while in the two other key states (Pará and Rondônia) a marginalincrease was recorded.
Fearnside (1993) suggests that much of the controversy surrounding deforestation estimatesis caused by the way in which cerrado is differentiated from forests in the estimates. While INPE
FIGURE 2: DEFORESTED AREA WITHIN RURAL ESTABLISHMENTS, 1995/96
Source: Pacheco 2002a, based on 1995/96 IBGE Agricultural Census.
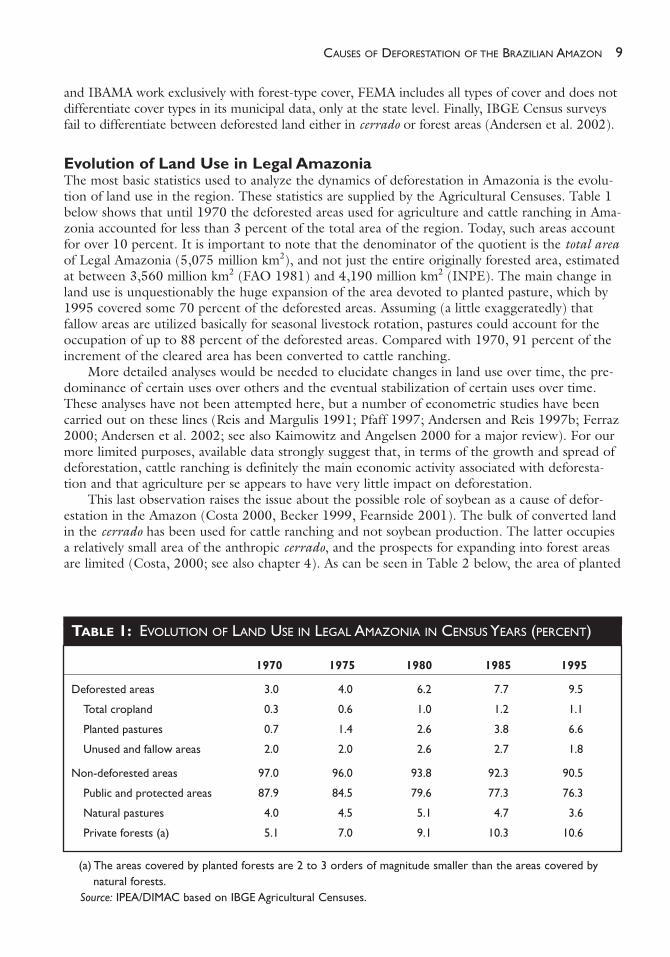
CAUSES OF DEFORESTATION OF THE BRAZILIAN AMAZON 9
and IBAMA work exclusively with forest-type cover, FEMA includes all types of cover and does notdifferentiate cover types in its municipal data, only at the state level. Finally, IBGE Census surveysfail to differentiate between deforested land either in cerrado or forest areas (Andersen et al. 2002).
Evolution of Land Use in Legal Amazonia The most basic statistics used to analyze the dynamics of deforestation in Amazonia is the evolu-tion of land use in the region. These statistics are supplied by the Agricultural Censuses. Table 1below shows that until 1970 the deforested areas used for agriculture and cattle ranching in Ama-zonia accounted for less than 3 percent of the total area of the region. Today, such areas accountfor over 10 percent. It is important to note that the denominator of the quotient is the total areaof Legal Amazonia (5,075 million km2), and not just the entire originally forested area, estimatedat between 3,560 million km2 (FAO 1981) and 4,190 million km2 (INPE). The main change inland use is unquestionably the huge expansion of the area devoted to planted pasture, which by1995 covered some 70 percent of the deforested areas. Assuming (a little exaggeratedly) thatfallow areas are utilized basically for seasonal livestock rotation, pastures could account for theoccupation of up to 88 percent of the deforested areas. Compared with 1970, 91 percent of theincrement of the cleared area has been converted to cattle ranching.
More detailed analyses would be needed to elucidate changes in land use over time, the pre-dominance of certain uses over others and the eventual stabilization of certain uses over time.These analyses have not been attempted here, but a number of econometric studies have beencarried out on these lines (Reis and Margulis 1991; Pfaff 1997; Andersen and Reis 1997b; Ferraz2000; Andersen et al. 2002; see also Kaimowitz and Angelsen 2000 for a major review). For ourmore limited purposes, available data strongly suggest that, in terms of the growth and spread ofdeforestation, cattle ranching is definitely the main economic activity associated with deforesta-tion and that agriculture per se appears to have very little impact on deforestation.
This last observation raises the issue about the possible role of soybean as a cause of defor-estation in the Amazon (Costa 2000, Becker 1999, Fearnside 2001). The bulk of converted landin the cerrado has been used for cattle ranching and not soybean production. The latter occupiesa relatively small area of the anthropic cerrado, and the prospects for expanding into forest areasare limited (Costa, 2000; see also chapter 4). As can be seen in Table 2 below, the area of planted
1970 1975 1980 1985 1995
Deforested areas 3.0 4.0 6.2 7.7 9.5
Total cropland 0.3 0.6 1.0 1.2 1.1
Planted pastures 0.7 1.4 2.6 3.8 6.6
Unused and fallow areas 2.0 2.0 2.6 2.7 1.8
Non-deforested areas 97.0 96.0 93.8 92.3 90.5
Public and protected areas 87.9 84.5 79.6 77.3 76.3
Natural pastures 4.0 4.5 5.1 4.7 3.6
Private forests (a) 5.1 7.0 9.1 10.3 10.6
(a) The areas covered by planted forests are 2 to 3 orders of magnitude smaller than the areas covered bynatural forests.
Source: IPEA/DIMAC based on IBGE Agricultural Censuses.
TABLE 1: EVOLUTION OF LAND USE IN LEGAL AMAZONIA IN CENSUS YEARS (PERCENT)

10 WORLD BANK WORKING PAPER
pasture in the cerrado tripled between 1975 and 1995, while the crop areas increased by only 9percent. Soybean, the most widely-grown crop in the cerrado, accounted for 6.3 million hectaresin 2000, and represented only 10 percent of the converted area and 5 percent of the area in agri-cultural establishments. Soybean is increasingly grown in drier areas such as in parts of MatoGrosso or on abandoned pasture land. Regardless of the possible role of soybean cultivation, itcan be inferred that cattle ranching must be sufficiently profitable and sustainable from a privateperspective to explain much of the continuing growth suggested by these initial land occupationindicators.
With regard to the evolution of land use and land-holding in Amazonia, Table 3 belowshows that there was substantial consolidation of legal property rights in those areas declared ascattle ranching establishments in the IBGE Agricultural Censuses (the percentage of establish-ments declared as “owned” by landowners increased from 70 percent to 95 percent), while theproportion of occupants—tenants, sharecroppers, and squatters—on the areas declined simultane-ously (a reduction from 22 to 4 percent over the same period). As in the remainder of the coun-try, a very pronounced land concentration was observed (Table 4). Both indicators are aggregat-ed for the whole of Amazonia, thereby camouflaging regional variations. In general terms,however, there are no marked differences over time or inter-regionally.
Contribution of Large and Small Deforested Areas to Overall Deforestation Satellite monitoring data provides information on the size of each deforested “plot,” but it doesnot indicate whether each plot corresponds to a single establishment or landholding unit. Inother words, it is possible to gauge from the satellite image the size of an entire deforested area,but it cannot be categorically affirmed that a specific area has been deforested by a single agent or
Area occupied by agricultural 1975 1996 Average annualestablishments, by type of use (1000 ha) (1000 ha) growth (%)
Area occupied by agricultural establishments 110,798 124,314 0.5
Anthropic area (b) 34,695 64,487 3.0
Area occupied by crops 6,889 8,208 0.8
Area with planted pasture 16,053 49,207 5.3
Area of reforestation 586 757 1.2
Fallow area 356 671 7.4
Productive land not in use 10,815 4,643 –3.9
% of area in establishments 57.4 64.4 —
% of anthropic area in establishments 31.3 51.9 —
% of anthropic geographical area 18.0 33.4 —
(a) Based on 1975 data referring to homogeneous micro-regions and micro-regional data for the years1995/96, with a view to securing approximate information about the core of the cerrado. Note it is notrestricted to the Legal Amazonia.
(b) Anthropic area = the sum total of the area occupied by crops, planted pasture, reforested areas, fallowareas, and productive land not in use.
Source: Mueller (2002) based on IBGE Agricultural Censuses for 1975 and 1995/96.
TABLE 2: EVOLUTION OF LAND USE IN THE CERRADO (A)

CAUSES OF DEFORESTATION OF THE BRAZILIAN AMAZON 11
simultaneously by a number of different agents. INPE has been supplying statistics on the plotsdeforested since 1995. However, the resolution of the images does not permit one to discerncleared areas of less than 6.25 hectares. This rules out a precise assessment of the relative partici-pation of the smaller agents in the process. For example, deforestation arising from “coloniza-tion” projects could take place in adjacent plots and therefore appear larger, thus leading to anoverestimate of the relative contribution made by the larger agents. On the other hand, large-and medium-sized landowners could well clear isolated plots on the same property, overestimat-ing participation by smaller producers.
A number of studies indicate the different roles played by the large and smaller agents. Acertain degree of consensus exists regarding the significantly higher participation of the largeragents in the figures calculated for Amazonia as a whole (Cattaneo 2001, Faminow1998, Walkeret al. 2000). Fearnside (1993) in particular suggests that 70 percent of the deforestation is causedby large cattle ranchers, while Homma et al. (1995) suggest that 50 percent of the deforestationis the result of subsistence farming. Chomitz and Thomas (2000) consider that establishmentslarger than 2000 hectares occupy over 50 percent of the converted areas. In any case, as indicatedby Walker et al. (2000), significant subregional variations exist, and the causes and dynamics ofdeforestation differ significantly from one area to another, making it difficult to make generaliza-tions. Nevertheless, as far as Legal Amazonia is concerned, it can be deduced that the larger andmedium agents bear a significantly larger burden of responsibility for deforestation, as the datashown in Table 5 below suggest.
1970 1975 1980 1985 1995
Owner 9.0 12.7 17.3 19.9 22.5
Tenant 0.8 0.5 0.8 0.5 0.2
Sharecropper 0.1 0.0 0.1 0.2 0.1
Squatter 2.8 3.0 3.4 2.1 0.9
Total 12.7 16.2 21.6 22.7 23.7
Source: IBGE, drawn by IPEA
TABLE 3: PROPERTY RIGHTS IN LEGAL AMAZONIA, IN CENSUS YEARS (PERCENT OFGEOGRAPHIC AREA)
Size (hectares) % of number % of Area
< 2 31.9 0.3
2-10 23.6 0.9
10-100 29.9 9.8
100-1,000 13.0 27.9
1,000-10,000 1.5 31.4
> 10,000 0.1 29.6
Source: IBGE, drawn by IPEA
TABLE 4: DISTRIBUTION OF THE NUMBER AND AREA OCCUPIED BY ESTABLISHMENTS INLEGAL AMAZONIA, ACCORDING TO SIZE, AVERAGE FOR 1970-95

12 WORLD BANK WORKING PAPER
The above table indicates that no large variations have occurred in the relative participation ofeach size category over the 1997-99 period, except, perhaps, for the decline of participation of thesmallest agents (under 15 hectares). The discrepancy between INPE and IBAMA data regardingparticipation by each group is worthy of note. INPE data indicates that in 1999, approximatelyone sixth of the total deforestation took place in plots of under 15 hectares, whereas IBAMA fig-ures tell a different story given that its data can identify cleared plots as small as one hectare.According to IBAMA, the contribution of plots of between one and three hectares accounted forabout one percent of measured total deforestation in the 179 municipalities with the highest ratesof deforestation in Legal Amazonia. In 1999, the smaller plots (less than 50 hectares) representedsome 40 percent of total deforestation according to INPE, while IBAMA assessed this at only 25percent. By contrast, INPE data indicate that the larger plots (over 200 hectares) were responsiblefor 33 percent of deforestation, while IBAMA placed this figure at 50 percent.
It is also interesting to discuss the IBGE results. IBGE estimates that the contribution todeforestation by establishments under 10 hectares amounted to 1.4 percent in 1995, while that inestablishments under 50 hectares was 7 percent. Meanwhile, properties of over 1,000 hectareswere responsible for 57.6 percent of the deforestation. These statistics vary significantly from thedata produced by INPE and IBAMA and serve as a better indication of who the agents of defor-estation are: the very large deforested plots may not make a larger contribution to deforestationestimates because they are simply the result of the sequential addition of smaller plots. Deforesta-tion on the properties of over 1,000 hectares accounts for the highest proportion of that in Ama-zonia as a whole. The actual size of the deforested plots within these properties can be smaller.
Looking at the data on a more aggregated level, a variety of sub-regional patterns can beseen. The proportion of deforestation attributable to the smaller agents (measured by size ofdeforested plots) is larger in states such as Rondônia and Acre than in Mato Grosso, for example,where landholdings are much more concentrated (Table 6). The data suggest that even inRondônia, known initially for smallholder land occupation, deforestation of areas under 15hectares accounts for only 16 percent of total deforestation in that state. As confirmation of thesetrends, Fearnside (2002), using FEMA-MT data, suggests that only 2 percent of the areas defor-ested in Mato Grosso between 2000 and 2001 were smaller than 6.5 hectares.
1997 1998 1999
Plot size (ha) Inpe (a) Ibama (b) Inpe Ibama Inpe Ibama
< 15 10.1(c) 7.5 10.9 10.5 14.8 9.8
15-50 23.1(d) 14.9 24.2 16.0 25.1 15.6
50-100 14.1 14.3 14.9 11.9 14.4 12.5
100-200 13.9 16.2 12.7 15.2 12.4 13.7
200-500 15.1 19.0 14.3 18.4 14.0 18.7
500-1000 9.4 14.3 9.5 12.7 8.4 12.4
> 1000 14.3 13.9 13.6 15.6 10.9 17.3
Total 100.0 100.0 100.0 100.0 100.0 100.0
(a) the whole of Legal Amazonia; (b) 170 municipalities for which data exists for all 3 years; (c) smaller than 10hectares; (d) between 10 and 50 hectares.
Source: Adapted from Pacheco (2002a), based on INPE (2000) and IBAMA’s site and IBGE.
TABLE 5: AVERAGE SIZE OF DEFORESTED PLOTS, 1996-99 (IN PERCENTAGE TERMS)

CAUSES OF DEFORESTATION OF THE BRAZILIAN AMAZON 13
Evolution of the Cattle Herd In addition to changes in land use, evidence regarding the expansion of the cattle herd in Amazo-nia corroborates the hypothesis that cattle ranching is a profitable activity in parts of Amazonia.As indicated in Table 7, the increase in the herd in Amazonia accounts for the bulk of the growthof the cattle herd in Brazil, suggesting that the cattle frontier has been pushed progressivelytowards the north. During the 1995-2000 period, for example, the equivalent of the entireincrease in the national herd occurred in the three main producing states in Amazonia—Pará,Mato Grosso, and Rondônia. The remaining states tended to balance one another out in thisrespect, with some states presenting an increase in the herd and others a reduction. The averagepercent growth rates of the cattle population in these three states over the period 1995-2000were 6.0 (Mato Grosso), 5.0 (Pará), and 7.6 (Rondônia), while at the national level the increasewas only 1.1 percent.
The growth of the cattle herd in Amazonia was due partly to land freed up by deforestationand partly to more intensive ranching. Through regression modeling, the relationship between theexpansion of the deforested area and the increase in the cattle herd (in animal units) was analyzed.
(a) Includes the states of Acre,Amazonas,Tocantins and Maranhão.Source: Pacheco (2002a), based on INPE (2002) and IBAMA (www2.ibama.gov.br)
TABLE 6: PERCENTAGE CONTRIBUTION OF PLOT SIZES TO DEFORESTATION PER STATE,AVERAGE 1997-99
Hectares Rondônia Pará Mato Grosso Other (a) Total
< 15 16.1 10.5 5.1 15.3 9.5
15-50 25.4 8.9 10.9 18.7 14.0
50-100 17.6 13.1 11.0 13.7 13.1
100-200 15.7 15.0 14.9 16.1 15.2
200-500 14.3 19.9 21.1 16.1 19.0
500-1000 6.6 11.7 17.8 8.7 13.3
> 1000 4.3 20.9 19.2 11.4 15.9
Total 100.0 100.0 100.0 100.0 100.0
No.of municipalities 52 46 39 42 179
1990 1995 1998 2000
Brazil 147,102 161,227 163,154 169,875
Mato Grosso 9,041 14,153 16,751 18,924
Pará 6,182 8,058 8,337 10,271
Rondônia 1,718 3,928 5,104 5,664
Source: IBGE
TABLE 7: EVOLUTION OF THE CATTLE HERD (1990-2000) (THOUSAND ANIMALS)

14 WORLD BANK WORKING PAPER
The regressions were made on the basis of variations in densities.8 The results show that for theperiod 1970-95, the increase of one animal unit per hectare implied an average increase of 1.2percentage points in the rate of deforestation in the area of a given municipality.9 An interestingresult is obtained by comparing the values between 1985-95 and 1970-85: the coefficient wasreduced to less than half between the first and second periods (from 1.26 to 0.53), strongly sug-gesting intensified ranching. For each animal unit per hectare, the percentage of deforestation inthe municipality associated with it declined from 1.24 to 0.53 percent. Intensified ranching canalso be observed visually when the maps below, showing the geographical density of the cattleherd in Census Years 1970 and 1996, are compared (Figure 3).
Socioeconomic Benefits from Deforestation: Early EvidenceThe data thus far presented demonstrate the dynamism of the rural economy in Amazonia in thelast decades. It would be critical, however, to analyze whether the activities which lead to defor-estation in the region generate more welfare gains than the social, environmental and economiccosts involved and whether these gains benefit in some relevant way the poorer populationgroups.
The annex to this report summarizes statistics which were developed as part of this study withthe specific objective of analyzing the evolution of socioeconomic indicators of Amazonia. Theoriginal objective was to assess the possible social gains associated with the process of land occu-pation and deforestation in the region. However, most of the available socioeconomic indicatorsdo not distinguish between urban and rural groups, making it almost impossible to attribute
8. With the aim of eliminating the effects of spurious correlations, which might result from the differencein the sizes of the municipal areas which would probably tend to slope the angle regression coefficientstowards 1 (unit).
9. Note that it is not the percent variation in the deforestation rate, but rather the percent point variationof that rate (i.e., the rate goes from, say, 8 to 9 percent, as opposed to increasing by 1 percent).
FIGURE 3: CATTLE DENSITIES (HEADS/KM2) IN 1975 AND 1996
Source: IBGE, drawn by IPEA

CAUSES OF DEFORESTATION OF THE BRAZILIAN AMAZON 15
improvements in socioeconomic indicators specifically to rural activities, and indirectly to defor-estation. While the causality is unclear, the indicators presented in the annex demonstrate overallthat there have been significant improvements in the socioeconomic conditions in the region,although these improvements have basically kept pace with the rest of the country, so that thegap in relation to it has not really narrowed.
Despite these caveats, some indicators are available for specific rural groups and can thus bemore easily associated with the deforestation process and the activities which follow it. Two suchindicators are presented here. The first has to do with rural income. Table 8 shows the significantrise of GDP per capita in the rural areas in almost all the states of Amazonia. With the exceptionof the state of Amapá (which started from a very low base), the “development leaders” were pre-cisely the three states with the highest levels of deforestation (Pará, Mato Grosso, and Rondônia).Between 1985 and 1995, the very high growth registered in the state of Mato Grosso could beattributed mainly to the expansion of soybean in the cerrado region of the state. Figures for percapita GDP, of course, do not inform about effective appropriation of income by poorer or localpopulation groups.
The second represents social benefits accruing to the national population. The expansion ofthe cattle herd in Amazonia has been largely responsible for beef prices dropping in real termsrecently (as already indicated in Table 7, it represented nearly 100 percent of the growth of thenational herd since 1995). It has also allowed beef exports to expand significantly. This study didnot make a detailed evaluation of such benefits, but Table 9 illustrates the recent evolution ofbeef exports and the annual per capita beef consumption in the country.
State 1970 1975 1980 1985 1995
Acre 547 492 760 894 1,089
Amapá 294 404 673 817 2,467
Amazonas 488 554 726 1,145 1,280
Maranhão 270 376 434 404 509
Mato Grosso 424 629 1,307 1,202 4,311
Pará 356 473 784 909 1,436
Rondônia 712 755 832 1,139 2,304
Roraima 785 1,126 1,121 1,102 1,202
(a) —except TocantinsSource: IBGE, drawn by IPEA.
TABLE 8: EVOLUTION OF PER CAPITA RURAL INCOME IN THE STATES OF LEGALAMAZONIA,(A) 1970-95 (1995 US DOLLARS)
1995 1996 1997 1998 1999 2000
Exports (1000 t.eq. carcasse) 277.9 274.8 300.6 381.1 560.0 586.8
Annual per capita consumption (kg/yr) 35.6 38.4 36.0 34.4 34.7 35.7
Source: Cepea/Esalq/USP (2003).
TABLE 9: EVOLUTION OF BEEF EXPORTS AND PER CAPITA CONSUMPTION IN BRAZIL(1995-2000)

16 WORLD BANK WORKING PAPER
In value terms, exports grew from less than US$500 million in 1995 to US$1 billion in2000. Per capita consumption of beef did not increase. This does not necessarily mean that theentire increase in production has been exported, since the types of meat exported and consumeddomestically are different. Analysts suggest further that Brazil has a major potential of expandingits share in the global beef markets. While beef exports represent important foreign exchangeearnings, the question is whether these and other benefits justify the social and environmentalcosts of deforestation. These are analyzed in chapter 5.
17
CHAPTER 3
DIFFERENT FRONTIERS ANDTHEIR ECONOMIC AND SOCIAL
DYNAMICS: DETERMINANTSOF AMAZON OCCUPATION
From an economic point of view, the Brazilian Amazonia can be characterized by abundantnatural resources—arable land, mineral deposits, natural forests, etc.—which as yet are farfrom fully explored and much of which remain outside private ownership. The entirety of
these resources has not yet even been quantified. The existence of abundant natural resourceswhich have not come under private ownership can be largely explained by the high transport anddevelopment costs resulting from the unique geo-ecological conditions of the region which, withcurrently available technologies, translate into low profitability and reduced capacity for guaran-teeing the sustainability of agricultural activities.
The combination of these factors meant that for centuries Brazilian Amazonia remained aneconomic, demographic, and geopolitical frontier. However, since the mid-1960s, the dynamicsof land occupation began to assume different features in terms of speed and rationale of theprocess. Lower transport costs resulting from government investment in the region’s road net-work, tax breaks, and availability of credit for private investors—plus the emergence of nearbyurban consumer markets (Brasília, Belém, Manaus, among others)—made it profitable to open upa range of agricultural and cattle ranching activities which were previously unviable in the region.The process of land occupation, as a result, has been one of unprecedented growth over the pastthree decades.
Between 1970 and 2000, for example, the region’s road network doubled with the construc-tion of over 80,000 kilometers of new roads.10 To illustrate the impact of road development inthe region, the maps below show the evolution of the total cost of transport per ton from eachmunicipality of Amazonia to the capital of São Paulo state (proxy for the markets of the Center-South of Brazil) for the years 1980 and 1995.
10. Excluding the states of Maranhão and Tocantins, GEIPOT (2002)

18 WORLD BANK WORKING PAPER
The demographic and economic censuses for the years 1970 to 2000 contain a range of addi-tional data about the dynamics of occupation of Brazil’s Amazonian “frontier” region. In 1970,Brazilian Amazonia was a virtual demographic void, with an average population density of rough-ly 1.5 inhabitants/km2, and less than 1 inhabitant/km2 in the rural areas. A mere 12 percent ofthe region’s territory was under private ownership, and over 80 percent of the area in those prop-erties was not deforested.
In the following decades, the occupation dynamics of the “frontier” region accelerated rapidly.Population growth was mainly the result of migratory flows from other parts of the country. Thepopulation growth amounted to 3.5 percent a year—virtually double the national average for thesame period. Nevertheless, that demographic density remains typical of Brazil’s frontier regions: in2000, the average density was of the order of 4.1 and 1.3 inhabitants/km2 for Amazonia’s totaland rural population, respectively. This indicates the rapid rate of urbanization of the region.
In economic terms, the dynamics of occupation resulted in a doubling of privately-ownedland and the conversion of some 12 percent of the entire Amazonian region to cattle ranching,representing a total of 600,000 square kilometers.
The process of economic and demographic occupation of the Amazonian “frontier” was driv-en by, and dependent on, economic factors emanating from Brazil’s Center-South and govern-ment policy. The low population density and a lack of economic infrastructure in the regionmeant that the price of land was significantly lower than in the rest of the country. This in itselfwas an incentive for integrating the Amazonian economy into the national economic mainstream.Integration took the form of private appropriation of land, with property rights often beingacquired and consolidated by illegal means. It was followed by opening up the new land for agri-cultural and cattle ranching activities. Comparative advantages flowed from the relativeabundance of cheap arable land and favorable climatic conditions.
At the same time, the introduction and expansion of cattle ranching (and other economicactivities) demands and stimulates further immigration, hand in hand with calls for more substan-tial government involvement in terms of provision of basic services and infrastructure, includingtransport. This in turn lead to increased profitability of the livestock sector and underscored therising competitiveness of the region.
FIGURE 4: EVOLUTION OF TRANSPORT COSTS, 1980 AND 1995A
aCost of one ton transported to the city of São Paulo, in 1995 Reals.Source: Based on Castro (2000), drawn by IPEA.
CAUSES OF DEFORESTATION OF THE BRAZILIAN AMAZON 19
Over the long term, however, the deciding factor for the continuing economic sustainabilityof agricultural and ranching activities has always been, and is likely to continue to be, the abilityto adapt technologies to the geo-ecological conditions of the region. These adaptation initiativesare primarily funded by government. Over the past twenty years this has been the hallmark ofboth the soybean and livestock industries.
Geopolitical objectives related to sovereignty over the territory and the government’s abilityto control the economic potential inherent in the natural resources of the region have gone handin hand with the strictly private economic ambitions associated with occupation and deforesta-tion. In addition to the quest for access to markets in countries bordering the Amazonian region,aided by road access to the Pacific Ocean, geopolitical interests continue to be motivated by theexistence of the long shared border with eight other South American countries. This makes moni-toring and military protection of the Amazon region crucial, particularly when taking in toaccount that some of those countries play a major role in the international drug traffic.
Regardless of the importance of geopolitical factors in the expansion of the “frontier,” oncethe cycle of government-led policies—aimed at constructing the main access roads across theregion, attracting investments, and stimulating migration and productive activities—was over, thedynamic of the occupation process have became increasingly endogenous (that is, it has a life ofits own). The economic activities acting as a driving force behind the opening-up of new areas foragricultural and livestock production and deforestation no longer depend on subsidies or govern-ment transfers from the rest of the country, even though the region remains dependent on therest of the country for access to markets and finance.
The dynamics of occupation has not been homogeneous. The variety of geo-ecological con-ditions and the distance to the larger consumer markets, which imply substantial disparitiesbetween the costs of transport and economic exploitation, have resulted in a diversity ofgeographical, economic and social occupation dynamics. Several other non-economic factors alsohelped to bring about intra-regional variations in the actual history of land occupation.
In social terms, the agents of “frontier” occupation are differentiated by their particularmotives, as well as by the resources available to them. Schneider's analytical outline (1995) assertsthat the most distant regions attract only those “pioneering agents” who have lower opportunitycosts. On the “consolidated frontier,” on the other hand, one encounters a preponderance ofmore highly-capitalized agents with higher opportunity costs. These two types of agents actaccording to significantly different strategies.
The pioneers, many of whom are itinerants, base their strategies on speculation, and theireconomic activities largely depend on nutrient mining. Their predominant activities tend to bemineral extraction, logging, small scale agriculture and low intensity ranching, often adopted aspart of a frontier survival strategy. The latter basically endows them with primitive propertyrights. The strategies pursued by these agents also vary in accordance with their perceptionsregarding future prospects for a more “consolidated frontier”—in effect, the future willingness ofthe agents in the consolidated frontier to buy land (land profitability) and on the likelihood ofinfrastructure projects going ahead.
Government “control policies” have little real impact on the activities of such pioneers. Thereasons for this are, on the one hand, the lack of an effective government presence in the frontierregions and the resulting inability to impose its will on the areas. A second reason is the morelimited risk aversion by the pioneering agents who, simply put, are willing to do almost anything.These pioneering agents frequently co-exist, or are occasionally preceded by, small settlers(colonos), migrants, dispossessed farm laborers, etc., but this latter group’s raison d’être is some-what different. They devote themselves to cover their low opportunity costs through small-scalesubsistence farming or by offering themselves as unskilled labor to larger enterprises. For the sakeof convenience, we call the “speculative frontier” that part of the Amazonian region which con-tains such agents and modus operandi. The description is admittedly not entirely satisfactory,given that, even in this case, the process follows an economic logic. Speculative motives in thestrictest sense of the word do not appear to be significant.
20 WORLD BANK WORKING PAPER
By contrast, the agents in the “consolidated” areas are much more geared to more commer-cial agricultural and, in particular, livestock production. Typical ranching production is on a largescale, with an increasing trend towards employment of new technology and improved pasture/animal management. Most of the current deforestation of Amazonia takes place in such areas.Deforestation caused by the larger landowners in these consolidated areas has less to do with thelogic of “frontier occupation.” It is more in keeping with a capitalist desire to invest in continu-ing expansion of business activities. Economic gains are the result of high productivity. Tax incen-tives, subsidies and land speculation are not particularly important for such agents. It is interest-ing to note that such agents regard the logging companies as playing a limited role in financingexpansion of production and in opening new “penetration fronts”. For the sake of convenience,we call that region where such agents and processes are in evidence the “consolidated frontier.”11
Based on a distinction between the different types of frontier area, this study included threesurveys to analyze the dynamics of the process. The first is devoted to an analysis of the micro-economics of cattle ranching in selected areas of the “consolidated frontier”—basically an exami-nation of the strategies and economic motivation behind ranchers’ propensity to occupy and clearforest and the potential profits arising from such activities. Chapter IV summarizes the mainresults of this research.
The second survey seeks to explain the activities of the agents in the “speculative frontier”and the logic behind them. It attempts to identify the main actors, to examine social relationshipsbetween them in those more remote regions, as well as their possible links to the agents operat-ing in the “consolidated frontier.” The next section is largely based on the lessons learned in thecourse of this field work.
The third survey consisted in the development of an econometric model that seeks to analyzethe economic occupation of Amazonia as a systemic process. The model analyses some of thelinkages between the main economic activities (agriculture, cattle ranching, and logging) from atemporal and spatial perspective. The principal results are summarized in the last section of thepresent chapter.
Expansion of the “Speculative Frontier” and the Deforestation Process This part of the study is partly based on field research carried out between February and May2002.12 Its key objective was to better understand the motivations and social strategies of theactors operating on the speculative frontier. A special aim was to shed light on their naturalresource appropriation strategies and to determine lines of succession regarding land occupation.The research sought: (i) to analyze how the principal actors (large and medium sized loggers andcattle ranchers, as well as small rural farmers) succeed in forging alliances; (ii) to obtain theiropinions regarding the forest and its resources; and (iii) to identify the most common patterns ofland appropriation.
The two specific areas researched were: (i) Novo Progresso and Castelo de Sonhos on high-way BR-163 (Cuiabá-Santarém), forming part of the municipalities of Novo Progresso and
11. The terms are used for reasons of convenience. All “frontiers” are in principle speculative and ceaseto be frontiers once the process is complete. At the same time, the “consolidated frontier” is not in the strictsense of the word a “frontier” as such. But, insofar as the activities of the agents located there are expansionist,and in the specific case of Amazonia means that they secure benefit from conversion of forest to agriculturalland, they are regarded as being at the very edge of this frontier. The term “consolidated frontier” is used todifferentiate them from other agents with more speculative intentions. It is worth recalling that both “fron-tiers” and the whole range of processes involved are extremely dynamic—a continual flow of agents andstrategies exists between the two extremes (speculative and consolidated), and the interests pursued thereinare compatible and interdependent.
12. The full report (in Portuguese only)—Atores e Relações Sociais em Novas Fronteiras na Amazônia(Edna Castro et al, 2002) can be found in the World Bank’s Web Site (www.bancomundial.org.br).

CAUSES OF DEFORESTATION OF THE BRAZILIAN AMAZON 21
Altamira (Pará), respectively, and (ii) São Félix de Xingu, in particular the frontier regionstowards the River Iriri and Terra do Meio,13 also in the state of Pará. Expansion of the frontier inSão Félix follows the massive occupation which took place during the 1970s in the area aroundMarabá, which spread outwards towards the south and southeast of Pará, where today municipali-ties such as Xinguara and Redenção exist. On BR-163, two fronts effectively meet—one pointingsouth from Altamira and the other going in a northerly direction from the border with MatoGrosso.
Interaction Between the Agents The process of expansion and consolidation of the frontier in Amazonia does not come about in auniform manner. Two general non-exclusive patterns can be identified: one where small agentsmake a first way in, and a second one where large agents clear and occupy new areas directly. Inthe past, in particular, public lands were mainly appropriated by small agents through coloniza-tion projects or “spontaneous” occupation. Capitalization of agriculture in the Brazilian Southenabled small and medium settlers to sell their land there and purchase, for the same price, prop-erties up to 15 times larger in Amazonia. In due course, these small agents, for a variety of rea-sons, ended up selling their plots to more highly capitalized agents. This first pattern of landoccupation is thus marked by small agents preceding the larger ones.
The second pattern features deforestation and penetration directly by better capitalizedagents—logging, mining and energy companies, large-scale cattle ranchers, etc. The smalleragents are still in evidence, but mainly as unskilled laborers serving their larger counterparts. Asnoted in the preceding chapter, this second group accounted for the bulk of deforestation activityand expansion into pioneering areas.
In this second model, the small agents are present in pioneer areas more closely linked tospaces opened up by logging companies or other large operators. The opening-up of new frontsin the forest is thus due to a marriage of interests between the smaller agents (rural laborers anddispossessed small farmers) and the logging companies. The latter need to make use of the scarcelabor in the more isolated areas where timber is plentiful, where land is ownerless and whereenforcement (of any kind) does not exist. Roads cut into the forest by logging companies provideaccess to timber and at the same time facilitate access by the smaller agents. The larger companiesprovide transport to lift out sick or injured people and account for a rudimentary cash circulation.For their part, workers are occasionally attracted by the promise of some day acquiring their ownplots. They sometimes join teams of experienced loggers or simply decide to establish roots inthese remote areas and devote themselves to subsistence farming based on “nutrient mining” inthe forest. Depending on the degree of consolidation of the frontier and the location of theiroperations, the logging companies are substituted by large-scale ranchers who play a similar role.Similar patterns are followed in the case of mining companies.
A major difference exists between the two frontiers which are the subject of this research.Deforestation and the speed with which access (“penetration”) roads are built are considerablyless in the case of highway BR-163. The whole process in the area is now the purview of loggersand small farmers, with a number of cattle ranchers purchasing land with a view to future produc-tion, laying the basis for consolidating their property rights, speculating on the frontier being“opened up” (in other words, the paving of BR-163) and investing capital in more land to beeventually used for ranching. The arrival of sawmills is the harbinger of a process of major landappropriation devoted to cattle ranching and crop growing, as has already occurred in the statesof Paraná and Mato Grosso. This process is accompanied by experiments with planting of riceand corn, and by the construction of drying facilities and grain silos in certain municipalities.
13. Region between the River Xingu to the east, state of Mato Grosso to the south, BR-163 to the westand BR-130 to the north.

22 WORLD BANK WORKING PAPER
In the case of São Félix, the agents of deforestation are mainly the large cattle ranchers.14
Given the proximity of the cities of southern Pará (Xinguara and Redenção), the existence ofslaughterhouses in those cities and the well-developed road network constructed and maintainedthrough the combined efforts of logging companies, cattle ranchers and the local authorities, thephysical and temporal distance separating the “speculative” and “consolidated” frontiers is sub-stantially less. Land speculators (people specializing in selling land and consolidating titles) figura-tively rub shoulders with rural smallholders, loggers (continually pressing further into the forest)and those agents more interested in production, in particular cattle ranchers with access to capi-tal. In addition to timber extraction, local economies were initially boosted by mining activities(cassiterite and gold) and by jaborandi extraction.
The Land MarketThe development of the land market in Brazilian Amazonia is a direct reflection of the deforesta-tion process. The prospect of capital gain accruing from the purchase and sale of land means a runfor land ownership—and land clearing is the main form of guaranteeing property rights. From theeconomic point of view, this process has its roots in the free-access nature of unoccupied,unclaimed land (whether terra devoluta or not; Almeida and Campari 1993 and Young 1998).
Traditionally, rising land prices in the south of Brazil (relative to the north) constituted anexpulsion factor for migrants. As already mentioned, a small farmer in the south could easily dou-ble the size of his establishment by migrating to the north in 1970s. By the mid-1980s, he couldobtain almost fifteen hectares in the north for one hectare in the south. This made existing land inthe north increasingly inaccessible to poor landless farmers. At the same time, the process meantthat less intensive activities such as cattle ranching were pushed northward to less expensive areas,further increasing pressure on the frontier. The by-product was an increase in deforestation.
An example is São Félix do Xingu. Land prices there are less than half those in the state ofGoiás, from where many people emigrated to buy the initially cheaper land. Land prices in the cho-sen area start at US$3/ha, but eventually reach a level in line with neighboring markets—some-where around US$300/ha. This means that the first occupants can eventually extract a substantialprofit from occupation, clearing, land preparation, planting of pasture, acquisition of title and sale ofthe properties. The end-purchasers are typically medium-size to large landowners who pay equilibri-um market prices for the land as in those adjacent properties. The price paid should thus reflect therental value (arrendamento) of these lands, since they reflect better the true production potential.
The latter is an important consideration. Deforestation is frequently attributed to land pricespeculation. The landowners and cattle ranchers—the end-purchasers—who buy land already withlegal title and ready for productive use, are prepared to pay a price per hectare which is equal to,or less than, the net present value of the activity for which they plan to use the land. Grileiros(land-grabbers) and speculators that invade unclaimed public land (terra devoluta), “tame” theland and accept a resale price at least equal to the marginal costs they have incurred, which aregenerally quite low. These agents, operating on the “speculative frontier,” make decisions on landclearing and preparation on the basis of the certainty that their costs will be more than coveredby the prices that ranchers are willing to pay, in short, that productivity of the land will exceedtheir own cost.
The marriage of interests is obvious, but the viability of the entire process is basically rootedin the cattle ranchers’ willingness to pay. The potential profit to be obtained from cattle ranching isultimately the underlying motivating force, both for the initial agents and the final buyers, behind
14. In the case of the Xingu, common knowledge is that most “felling” is done by landowners. Accord-ing to a local leader “landowners are felling at a scandalous rate. IBAMA is concerned only with the loggers,but these have a different role in the deforestation process, opening up roads into the forest. The landown-ers’ activities are a scandal, since they leave nothing alive on the ground: no trees, no animals. Landownersfell mercilessly and nobody cares to intervene to stop them”.

CAUSES OF DEFORESTATION OF THE BRAZILIAN AMAZON 23
the decision to clear forest and convert it to pasture. The whole sequence is largely dependent onthis consideration. Without the profit incentive, interest in purchasing the cleared areas would belower, resulting in slower rates of deforestation. The risk incurred by the pioneering agents onthe “speculative frontier” is increased by the unpredictability of contestation of land ownership bythe authorities (currently a minimal risk). This factor outweighs any uncertainties regardingfuture sale of the land they occupied and cleared (almost always illegally). While the agents of thespeculative frontier run little risk of having their land confiscated, for the agents of the “consoli-dated frontier” this risk is largely non-existent.
In spite of the lack of accurate data, movements in land prices in the region underscore thesehypotheses. Currently available supporting data apply to land in the consolidated frontier area,where the price trend is unequivocally downward-sloping (with the exception of a peak in 1986),while the rent/land price ratio is rising (Ferraz 2000). Both these indicators undermine thehypothesis that deforestation is driven by speculation. On the contrary, land transactions arebased more on production potential than any other reason, and the price clearly reflects this.Buying “converted” land will tend increasingly to fall into the hands of capitalized agents whoseprimary objective is production. In the field interviews undertaken for the concept paper, this wasthe view expressed by the producers interviewed. The issue of pure speculation was consideredless important. According to Wunder (2000, p.80) “…speculation may be a channel for short-run adjustment…, but it is not a cause of deforestation in its own right.”
Grilagem (Land Grabbing) and Consolidation of Property RightsParticular attention needs to be paid to what happens along the speculative frontier. This is thearea where transformation of unclaimed native forest (terras devolutas) into properly titled andlegalized establishments (in effect, with ensured property rights) for agriculture and ranchingactually takes place. At all stages of this cycle, property rights are only assured through physicaloccupation of the land which has, initially, priority over any document proving ownership. Physi-cal occupation encourages armies of land grabbers (grileiros) and squatters (posseiros) specializingin illegally taking over land and holding it until legal title is eventually established. Their activitiesare often financed by large logging and landowning companies. In this way, a kind of “privaterule of law” is established to fill the vacuum created by frequent absence of the State.
Land grabbing (grilagem) is a key process of forest conversion to pasture. It is noteworthythat the high profits to be obtained from cattle ranching (discussed in the following chapter) areoften due to the originally illegal appropriation of land which is camouflaged in subsequentfinancial returns. Land grabbing is not a new phenomenon. It is a feature of all the new frontsopened for ranching in Amazonia.15 Countless formal complaints and lawsuits have been record-ed by the Public Prosecutor’s Office (Ministério Público) and by the Federal Police and IBAMAconfirming the existence of grilagem in all of the regions studied (Treccani, 2001). A group ofspecialists derives its livelihood from such land transactions. They could be called “speculators”in the strictest sense of the word, but in fact a wide range of social actors is involved in illegallyappropriating land and the many methods subsequently employed to sell it. The highest profitsgo to those who indulge in land grabbing and selling, and in particular to those who buy andsell plots in the more highly capitalized areas. Surprisingly, the landowners interviewed did notpay much heed to the possibility of their properties being confiscated by the State. People whoacquire land in this way tend to establish themselves and build the necessary facilities, and oftenbecome successful entrepreneurs and eventually local and even regional power-brokers. They pay
15. The grilagem system obeys a certain modus operandi: (i) hired gunmen (pistoleiros) occupy and keepwatch over the areas wanted by the cattle ranchers; (ii) the latter acquire false documents; (iii) they subse-quently legalize their occupation of the land with ITERPA, the state land agency, which has been known todonate state land in these expansion areas, including Federal Government land passed on by the AgrarianReform authority INCRA.

24 WORLD BANK WORKING PAPER
little notice to satellite monitoring as they employ new land clearing techniques not easilydetected by remote sensing.16
Attention needs to be drawn to the role of INCRA in the land-grabbing process. Numerouslawsuits have been mounted against its employees. In this respect INCRA’s activities involve aheavy dose of ambiguity. On the one hand, its mandate is to mediate and resolve conflicts. Onthe other, it is suspected of not carrying out its proper function of bringing order to the agrarianreform process. Whether there is truth in the many allegations made against it or not, when oneconsiders the decisions taken about the future of land in the region over the past two decades, itis plausible to conclude that a well-organized land privatization policy, using small producers as alabor force, has been in operation for years.
Pursuit of such “policy” is also evident in the settlement projects undertaken by INCRA.Establishing unstructured settlements in isolated locations with no provision for public services,is the perfect mechanism for alienating the new settlers. Without schools, access to health careand the means to exploit their newly-acquired land, many settlers end up abandoning or sellingtheir plots. In the words of a settler near Central: “… this is a land with no law, much humilia-tion and gangs of hired killers (pistoleiros)… life is worth nothing…murder is rife…justice non-existent.” In all the settlements there are candidates-in-waiting on the edges of the properties.Having sold their plots, settlers head for nearby villages and towns where they buy urban plotsand swell the pool of unskilled labor to be employed in the few economic activities in theregion, or they migrate elsewhere. The outlook in general is one of increasing poverty andconflict.17
Finally, in addition to land grabbing, the conversion of forest to private properties with titlewould not be possible without the “generous” fraudulent awards of title deeds and widespread corrup-tion in the land market. This subject was discussed with prosecutors from a number of State Pub-lic Prosecutors in the region. The officials acknowledged two key points in this respect: (i) thatthe above was a key consideration in the process of land occupation in Amazonia and (ii) that itwas extraordinarily complex and difficult to handle. Public Prosecutors were at a loss as to how toundertake operations which could threaten established practices. Countless legal titles could beobjected to in courts, since the award of title deeds recognized at official land registry offices forunclaimed public land requires a proper examination of previously registered titled ownership ofsuch lands—an exercise which in the vast number of cases has never been carried out by the landregistries.
16. Deforestation is taking place undetected by remote sensing. During the first year of deforestationsmaller trees are felled and grass is planted simultaneously: a laborer distributes seed in areas while themechanical earth movers “clean” the land. A year after the grass has taken root under the trees, cattleare introduced into the area. Thus livestock takes over the forest without, as far as the state isconcerned, the trees being felled. The grass is burned during the second year as part of a secondary“cleaning” of the forest. Medium sized trees are felled, leaving only the larger ones. The grass growsagain (its roots having survived the burning process) and this enables once again the cattle to graze onthe spoiled area. Only in the third year does burning take place which destroys what remains of theinitial forest cover, thus permitting detection by satellite. Following this model of deforestation, anyaction by the state is incapable of reversing the destruction that has already taken place or preventingthe remaining forest from being ruined.
17. According to leaders of settlements in Tucumã and Ourilândia do Norte “without any incentive,the same will occur as always. I have managed to put up with this for 10 to 15 years. But to keep theproducers here there has to be an environmentally-friendly project that should also be self-sustainable.We need technical assistance and financing to produce as a consortium. As far as we are concerned, theonly way forward is to get along with the issue of the environment, because any solution that we try toachieve will have to be self-sustainable in order to avoid the land being abandoned time and timeagain”.

CAUSES OF DEFORESTATION OF THE BRAZILIAN AMAZON 25
Determinants of Land Occupation in Amazonia: An Econometric Model18
This study funded the development of an econometric model which analyzes the economic occu-pation of Amazonia as a systemic process. The aim was to provide an analysis (complementingthose done on a micro level) of decisions affecting economic resource allocation and the relation-ship between the social actors presented in the foregoing section and in the next chapter.
The model analyses with a systemic perspective and on a regional scale the temporal and geo-graphical patterns of the process of land occupation in Brazilian Amazonia by quantifying interac-tive relationships between the principal activities (timber extraction, cattle ranching, and farming)and their effects on the process of deforestation in the region, as well as taking into account theecological and economic aspects which condition those relationships.
These models operate at the municipal level, based on data collected from demographic andeconomic censuses from 1970-1996, supplemented by geo-ecological information, together withdata on transport costs obtained at the same level of geographic aggregation. To evaluate theimportance of geo-ecological factors governing the land process, the municipalities of Legal Ama-zonia were aggregated into different categories according to precipitation, vegetation or relief.
The models employ panel data covering the whole period from 1970 to 1996. Since thenumber, area and geographical boundaries of the municipalities of Brazilian Amazonia underwentsubstantial changes over that period, the 1997 data for the 508 municipalities were aggregatedinto 256 “minimum comparable areas” (MCA) in order to produce consistent inter-temporaldata sets and analyses.
Measurement of economic activities was done alternatively by geographic density of the prod-uct (relationship between the product and the area of the municipality) or by the percentage ofthe area of the municipality employed for the activity. The access conditions and transport costsare specified as exogenous variables (predetermined), based upon estimates of the total cost perton transported from each municipality to the city of São Paulo in the years 1968, 1980 and1995 (Castro, 2002).
The process of spatial interaction of the economic activities was specified in both dynamicand static terms. In the dynamic models, all regressors are predetermined, enabling an estimate tobe made by the least squares estimation method which produced more reliable results. The staticmodels presuppose that the spatial interaction between the municipalities is simultaneous, mean-ing that changes in the ranching activities in a given municipality can affect the others in the sameperiod.
The complexity of the problem of estimating spatial and temporal interactions imposesrestrictions on the number of variables that can be considered jointly. Therefore, three modelswere estimated: (i) the first analyses the spatial and temporal interactions of the densities of prod-ucts in the three activities (cattle, timber and agriculture); (ii) the second does the same for thepercentage of the area of the municipality employed in each of the activities; and, (iii) a mixedmodel analyses the spatial-temporal interactions between product density in cattle-ranching andcrop farming with land use for all types of agricultural purposes (crops, pasture and fallow land).
ResultsThe model represents an original effort on account of its systematic treatment of the IBGE dataat the municipal level and its systemic approach to the process, analyzing the temporal and geo-graphic patterns of the process, bringing together logging, ranching and agricultural activities.This appears to be crucial in the understanding of the dynamics of the process and only very fewstudies to date seem to have succeeded in achieving this in the case of the Amazon (Angelsen etal. 2002). Nonetheless, while IBGE datasets are the only reliable source of information availablefor the proposed objectives, they present major limitations which call into question the empirical
18. This section summarizes the results of one of the studies contracted for this research—Moreira andReis (2002). The complete text is available on the World Bank Website (www.bancomundial.org.br).

26 WORLD BANK WORKING PAPER
results of the models. The data are deficient in a number of ways, notably regarding timber pro-duction (measured only in terms of the agricultural establishments). The level of aggregation(municipal and even worse in the case of the MCA) also leads to imprecision of a number ofmeasurements. In addition, the data give more prominence to the municipalities of Eastern Ama-zonia (Maranhão and Tocantins) than to the Central and Western areas of the region, preciselywhere recent deforestation is most intense. The gaps between censuses (five and even ten years)can also lead to loss of important temporal information.
At the same time, it must be recognized that (i) these are the best data available and (ii) fewalternative models are capable of better representing the spatial-temporal process of deforestationin Amazonia. Since the data are not available in a better format, one must acknowledge that exist-ing alternative analyses carried out at the same level of aggregation suffer from the same kind ofdeficiency. The lack of census tract data for previous years impedes carrying out panel data analy-ses which would be critical to cover the spatial and dynamic dimensions being attempted by themodel. In short, the model would be a major contribution had better data been available; in theirabsence, the model’s results loose credibility and must be interpreted with caution. This reportthus not fully endorses its results, and recommends that a subsequent study be funded to allow itsre-evaluation through the use of a more consistent and appropriate set of data, specifically censustract data for different years.
In spite of these shortcomings, it is worthwhile to present some of the model results. Theobjective is not only to analyze the results per se, but to discuss some of the key issues raised bythe model, particularly the sequencing of activities and the importance of transport costs.
The key and most interesting results suggested by the model are:
� Both temporal and spatial interactions of the land occupation process of Brazilian Amazo-nia are significant, confirming the results of various similar studies (for example, Alves2001, Chomitz and Thomas 2000, Fearnside 1993, Andersen et al. 2002, and Andersenand Reis 1997).
� In terms of precedence and causality, the model suggests that when the process of eco-nomic occupation is characterized by product density, timber extraction neither precedesnor is preceded by any other production indicators. This would suggest that, from a broadregional and long term perspective, logging is an autonomous process relative to the others.Mertens et al. (2001) report similar results.
Although this result is perhaps due to a misspecification of the timber extractionprocess (which should be treated as an exhaustible rather than a renewable resource, suchas agriculture), it is worth discussing it further. No other studies were found which formal-ly demonstrate a dependency between logging and cattle ranching, where both occur, eventhough logging of course precedes ranching. It is a largely acknowledged fact that a longtemporal gap exists between advance of the logging and the cattle frontiers, up to ten oreven more years. No roads resist so many years inside the forest without intense conserva-tion. Ranchers can follow previously explored areas and narrow the temporal gap behindthe logging frontier, but they do not depend on the previous openings or roads. Accord-ing to Westoby (Wunder 2000, p. 78), “… seeing logging as the main cause of deforesta-tion in Brazil is a myth, given currency by those who would like a readily identifiable vil-lain.” Because this is not a crucial finding of this study, it is not important to reachabsolute consensus on this difficult issue. It suffices to recognize that, while it is true thatopening up of roads by loggers may make cattle ranching even more profitable, thus fuel-ing deforestation, logging per se does not lead to major forest losses. As suggested in theconcluding section, what is true is that disproportional attention is being paid to loggersrelative to cattle ranchers: while logging should be closely monitored because it is unsus-tainable and largely illegal, loggers may not be as critical agents of deforestation as cattleranchers, on whom increased attention should be focused;
CAUSES OF DEFORESTATION OF THE BRAZILIAN AMAZON 27
� Rainfall is relevant in all the estimated models and thus would appear to be the principalgeo-ecological conditioning factor in the occupation process. This outcome is widelyaccepted in the literature, and has been corroborated in recent work done by the WorldBank (Schneider et al. 2000; Chomitz and Thomas 2000). The results of the estimatesalso suggest that the type of vegetation cover and relief are not particularly decisive geo-graphical determinants in the occupation process.
� The impact of a reduction in transport costs in the two models suggests that, for three activi-ties (cattle ranching, crop production, and timber extraction), it induces land use intensifica-tion and higher productivity. Increased productivity can lead to more or less deforestationdepending on the price elasticity of demand. The only work that attempts to estimate suchelasticity in the Amazon (Santana 2000) shows a somewhat counter-intuitive result for beefin Pará: demand is price inelastic (a result that can perhaps be explained by the recent inci-dence of foot-and-mouth disease in the region). This would lead to a paradoxical situationwhere a decrease in transport costs would lead to a decrease in deforestation.
This result runs counter to an unanimously accepted finding of the literature whichholds that, while roads promote intensification and higher profits, they increase deforesta-tion, implicitly assuming that the demand is elastic to price (Angelsen and Kaimowitz2001, Cattaneo 2001, Pfaff 1997, Cropper et al. 1997, Andersen and Reis 1997, Lau-rance et al. 2001, Nepstad et al. 2000). The most recent work by Andersen et al. (2002)also runs counter to the usually more accepted finding. This issue remains controversial, butthere is no doubt that penetration roads in virgin forest lead to huge deforestation impacts. Inmore densely occupied and consolidated areas this report remains agnostic.


29
CHAPTER 4
THE MICROECONOMICSOF BEEF CATTLE RANCHING
IN AMAZONIA
As outlined in the Introduction, the observation that cattle ranching occupies virtually 80percent of all the converted lands in Amazonia while appearing at the same time to deliv-er low rates of financial return, provides the main focal point for this study. The present
chapter, perhaps the most important of the study, examines cattle ranching in the consolidatedfrontier, and in particular as practiced by the more “professional” and better capitalized ranchers.The objective is to assess ranching trends in the region, that is, the technical and economic viabil-ity of the activity and its prospects for sustainability as seen from the private producers’ point ofview. The main point at issue is that producers (ranchers) in the consolidated frontier effectivelydictate current land occupation trends in the region: as long as cattle ranching remains competi-tive and economically viable, ranchers are willing to continue purchasing land from the earlieroccupants of the speculative frontier. Regardless of the intermediate process which enables these“first” agents to profit from the whole cycle of occupation, conversion and acquisition of legaltitle to the land, the crucial point is that at the end of this process there is a productive activity(ranching) that can underwrite all the prior costs and expenses involved in its establishment—hence the need to study the microeconomics of cattle ranching in the region.
The aim here is not to analyze the “average” livestock economy in Amazonia, nor to describethe social aspects of the process. The latter will be examined in Chapter 5. It is worth recallingthat the consolidated frontier largely coincides with those areas with intermediate precipitationindices (according to Chomitz and Thomas 2000, Schneider et al. 2000). Precipitation isbetween 1800 mm and 2200 mm per year, which are optimal climatic conditions for cattle pro-duction in Amazonia, according to this study. A far-from-coincidental relationship exists between“consolidation” of the frontier and appropriate climatic conditions for cattle production, whichjustifies the focus of the present research on the consolidated areas. The future expansion of thecattle ranching frontier, as predicted by the present research and based on the economic viabilityof the activity, will likely be restricted to the regions with similar climatic conditions, which rein-forces the conclusions of the aforementioned references concerning the possible limiting roleplayed by geo-ecological factors on the spread of deforestation in Brazilian Amazonia.

30 WORLD BANK WORKING PAPER
The Beef Cattle Economy in Amazonia: Brief BackgroundIn the early 1970s, cattle ranching in the region was regarded as a predatory activity and as theprincipal cause of the spread of desertification. It eventually became a more profitable activity onaccount of the low land prices and subsidies of SUDAM (Amazon Development Agency). Fur-thermore, sales of timber extracted produced sufficient financial resources to cover the cost of theland and of clearing the forest, burning off residues, planting pasture and purchasing the basiccattle stock needed for primary herd development. For a few years after clearing, owners tookadvantage of the fertile soil conditions (resulting from the ash left over after burning) beforeabandoning the land (Tamer 1970). Schneider et al. (2000) draw attention to the fact that untilthe mid-1980s ranching failed to show a satisfactory financial return with traditional methods.Positive returns were only secured if fiscal incentives, speculative gains associated with selling landor favorable ratios of cattle to input prices were also obtained (World Bank 1991). Hecht et al.(1988) reported the same conclusion, and added overgrazing and low interest rates to theexplanatory factors. Some of their simulations indicated that “modern” cattle ranching wouldonly be viable under special conditions. It was postulated that large landowners were not reallyinterested in incentives for cattle ranching per se, but had other considerations in mind—such asexemption from income tax, guarantee of property rights with the presence of cattle. In addition,standing forest was considered to be unproductive for purposes of the land tax and also forexpropriation. Of course, the availability of financial incentives and subsidized credit for cattleranching constituted an additional bonus.
In more recent research, Schneider (2000) draws attention to the low rates of return on cat-tle ranching, but is unable to discover any economic or financial justification for increasing herds.Arima and Uhl (1996) also point to low and even negative yields from beef production. Howev-er, their results also showed internal rates of return of over 20 percent when pasture managementtechniques were utilized. Similar returns had already been reported by Mueller (1977).
In one of the most comprehensive books on the subject, Faminow (1998) claims that manyof the studies are inconsistent with observed practice. According to Faminow, the economic mod-els are based, in general, on fixed technologies—an unsuitable approach to ranching in Amazonia.They almost always fail to take into account the variety of cattle production systems (dairy cattle,beef cattle, and multi-purpose cattle production), each of which involves a separate approach tobreeding, different processing methods, different marketing techniques and a variety of invest-ment, cost and turnover strategies. In addition, a range of factors not directly concerned with theeconomics of the activity or with the microeconomic aspects of livestock production were notincluded in the models which attempted to estimate “theoretical” rates of return. Many of thesefactors were in fact corroborated in the course of the brief field research for the concept paper aswell as by the fieldwork carried out on the speculative frontier (see also Veiga et al. 2001)19:
19. It was clear from the research on the speculative frontier that cattle ranching is viewed by all localranchers as a safe investment, as well as a financially viable one requiring little work. Mr. Alexandre Trevisan(alias Maneca) a rancher in Castelo de Sonhos, claimed that ranching was the “vocation” of the region:“There is less money in ranching compared with logging, but it is much safer. You know where you are with it. Ikeep my feet on the ground and I know what I am doing and what I am capable of doing. Logging is different.If you get mixed up with problems out there (meaning problems with environmentalist movement, Ministry ofthe Environment, IBAMA, etc) or cannot lay your hands on the right documents to cut timber, everything comesto a grinding halt. Ranching is different. With a load of beef cattle you know you can get 10,000 Real for it ormaybe more, you know that you owe your suppliers maybe three thousand, another thousand goes on gasoline, afew notes to pay your workers and you manage the rest. I reckon it’s much safer”. As far as the net return on thecattle frontier is concerned, the ranchers’ representatives claim that this is fairly small, somewhere in theregion of 5 percent. Even so, they see the business as attractive because it is safe, in comparison with invest-ments in the formal financial system andin view of uncertainties regarding the government’s economic poli-cies. All ranchers fear having money confiscated and for them, cattle is a savings mechanism over which theythemselves have control.

CAUSES OF DEFORESTATION OF THE BRAZILIAN AMAZON 31
� cattle ranching is an obvious way of guaranteeing possession of land, one of the absolutetop priorities on the “frontier”;
� compared with agriculture, particularly seasonal crops, the risk inherent in ranching isextremely low in terms of market availability, sales and prices (despite a decreasing trend,meat prices have increased recently in relation to the main agricultural crops), climaticconditions and vulnerability to pests;
� unlike agriculture, cattle ranching calls for smaller upfront investments and provides quickerreturns over a shorter period;
� cattle is an easily convertible, liquid asset;� transport is relatively easy;� ranching is not labor intensive;� ranching is an optimal way of avoiding all types of enforcement (unlike crops);� in the case of small producers, the activity provides indirect benefits. These include oppor-
tunities to produce other animal products, to produce manure for fertilizer and to have astock of draft animals available—in addition to the gains to be made from selling timber(which also applies to larger producers);
� in the case of larger ranchers, the prospect of acquiring political and social status associatedwith being a large landowner/farmer in Brazil.
In an article dating from the same year, Young and Fausto (1998) made similar criticisms ofthe previous models and began to draw attention to the financial viability of cattle ranching inparts of Amazonia. Other studies indicated the feasibility of small-scale milk production (showingreturns of 12 percent) and of beef cattle operations on reclaimed pasture land (returns of 12-21percent).
Some of the criticism of the older literature for its assumption of low financial yields mayhave been due to new trends and practices not being reflected in older research. In fact, eventoday management and production techniques are still being tested and disseminated. Moreover,it could additionally be that the field data may have been collected in areas within the speculativefrontier or elicited from smaller and/or less capitalized producers in the consolidated frontier,which in both cases would generate underestimates of the production potential. Given the ongo-ing expansion of cattle ranching in Amazonia, a whole range of contrasting results tends toemerge. These results need to be treated with even greater care when attempts are made to gen-eralize to the whole of Amazonia on the basis of local surveys.20
In summary, the economic analyses that suggest that cattle ranching has a low profitability inAmazonia or that it is only viable when benefiting from subsidies or speculative gains, are confront-ed by the inexorable advance of deforestation and by the expansion of the area dedicated to cattleranching in the region. These analyses likewise fail to take proper account of the unquestionablereduction or elimination of government subsidies and credit facilities previously available to ranch-ing in Amazonia.
Schneider et al. (2000) acknowledge that “…the increase in the large scale and small-scalecattle and livestock herd continues, although a good empirical economic and financial explanationis lacking. A number of hypotheses, such as capital gains made on increased land values, requireempirical verification.”
20. According to Homma (1993), the expansion of the ranching frontier in Amazonia cannot beexplained by profits to be secured from land speculation, since the risk of it being invaded by posseiros, itsisolation from the main towns and the inexistence of special prices for agricultural products from the regionhave an impact on land prices. It is noteworthy that the price of an arroba (approximately 15kg) of beef inAmazonia is around 20 percent less than that obtained in the South-Southeast of the country.

32 WORLD BANK WORKING PAPER
Field Research21
In order to gain a better understanding of the microeconomics of beef production in Amazonia,field research was undertaken employing methodology proven by ESALQ (responsible for thework). This methodology consisted of an initial survey of data based on official government andregional sources, the drawing up of cost sheets, demarcation of study areas, and panel consulta-tions and discussions with producers (fieldwork proper), followed by the estimation of cash flowsbased on the results of panel consultations and, finally, mathematical modeling.
The data, in addition to that obtained through interviews with the cattle ranchers themselves,was initially collected from SIDRA (IBGE Municipal Livestock Survey). When coupled with themaps of forest areas from PROARCO, it was possible to determine the municipal areas of poten-tial interest for this study. The technical production coefficients were secured from EMBRAPA,INCRA, rural trade associations, consulting firms and retail outlets supplying agriculture/live-stock-related items, as well as from local municipal governments and a number of other officialbodies.
The production cost sheets were put together for the different types of systems pertaining toeach area. They aimed to:
� provide information on production costs and herd yield rates for calculation of gross andnet revenue;
� obtaining and storing numeric information on the usage frequency of inputs with a viewto constructing a databank;
� obtain information on monthly cash flow over a 20 year period;� obtain indices used in project evaluation—Internal Rate of Return [IRR] and Net Present
Value [NPV].
The primary data were obtained on the basis of field research using the aforementioned panelmethodology, in which face-to-face meetings were carried out with local producers. The figuresobtained tended to reflect a consensus of the interviewed group, and mirrored regional realityfairly closely. Moreover, the same methodology was used in all panels by the same researchers,thereby minimizing data collection standardization problems.
Owing to the existence of different types of properties—physical area, size of herd, produc-tion system, level of technology available and different types of ranch management—it was notpossible at a single meeting to secure information from each individual property. For this to bepossible, it would have been necessary to submit individual questionnaires and to evaluate theresults with statistical methods. Therefore, the research group was instructed to choose a singleproperty which best represented others in a particular locality. In general, the properties indicatedby most producers were of medium size and were neither particularly sophisticated nor particular-ly outmoded from a technical point of view. In other words, the properties fell into the “interme-diate” range.
Once the representative properties had been selected, producers were questioned about theiryields, and fixed and variable costs, including establishment costs, of their ranching activity.22 Allparameters were discussed by all producers until the numbers could be defined by consensus.Following field research, a number of parameters arrived at in the panels was compared with datafrom the IBGE Agricultural Census. The figures proved to be reliable and within the rangesobserved in practice.
21. This and the following sections summarize the results of the work undertaken by ESALQ/USP con-tracted to examine the beef ranching sector in Amazonia—Barros et al (2002). The full version of thereport (in Portuguese only) is available in the World Bank’s Web Site (www.bancomundial.org.br).
22. The figures and costs claimed by participants were not related to their specific properties, but to theproperty which was pre-defined as being representative.

CAUSES OF DEFORESTATION OF THE BRAZILIAN AMAZON 33
Selecting the Municipalities Involved in the Study and the PanelsGiven the purpose of this study, the field surveys focused upon the most “consolidated” areas ofthe frontier, about which less information exists. The idea was to demonstrate the potential forcattle ranching in the region. This potential is already evident on those ranches with more experi-ence. Further development is likely, as employment of better technologies by the latter is likely tobe replicated throughout the region, given the need to remain competitive in this particular mar-ket. It needs to be emphasized that this work stopped short of reflecting practices which have todate been adopted throughout the whole region. By combining data about potential for growthin cattle ranching of the principal micro-regions and maps showing the forested areas of the mainstates (Pará, Mato Grosso, and Rondônia), the municipalities of Redenção, Santana do Araguaiaand Paragominas (Pará), Alta Floresta (Mato Grosso), and Ji-Paraná (Rondôna) were selected forthe field survey.
Altogether, eight panels were brought together with participation by 43 rural producers: fourpanels were set up in the state of Pará (Paragominas, 2; Redenção, 1; Santana do Araguaia, 1), onepanel in Rondônia (Ji-Paraná) and a further one in Mato Grosso (Alta Floresta). The remainingtwo panels were assembled in the city of Tupã (state of São Paulo), one of the most importantcattle producing areas in the country, with the aim to provide comparative results with the samemethodology and by the same technical team to those in Amazonia.
Technical Parameters AdoptedIn this and the following sub-section, the principle technical and economic parameters adopted inthe panels are summarized, and a summary explanation of some of the more interesting or con-troversial parameters is presented. Table 10 indicates the size of the standard property and the useto which land was put in the six municipalities.
It can be seen that in Paragominas the properties are generally of large scale, with bettermaintained legal reserve areas. The majority of these reserves are not intact—most of the valuabletimber has already been extracted. Since the Paragominas area has been occupied for a longertime and land ownership is more consolidated, agricultural activities have become more wide-spread, particularly over the past three years. The bulk of pastures was established 20 years agoand large tree trunks left over from clearing have already been burnt several times, or have disin-tegrated on account of the high temperature and humidity. This has led to lower windrowingcosts and therefore larger-scale agricultural development. Moreover, pastures have deteriorateddue to faulty management, overgrazing, soil compaction and low soil fertility in the area—all ofwhich have caused a reduction in plant re-growth and a decline in grass productivity. Togetherwith the flat relief and climatic conditions, these factors have favored the establishment of agricul-ture, particularly the growing of rice, corn and beans (soybean production still encounters diffi-culties at seeding time and during harvest, due to the high rainfall causing problems both at seed-ing time and during the harvest).
In the case of Santana do Araguaia, the area marked for forest reserve is zero, and inRedenção it is 50 percent. A visual inspection of the region reveals that the larger propertiesprobably account for 50 percent of the reserves while smaller properties possess virtually nolegal forest reserves. As in the case of Paragominas, grass productivity is also low, but in contrastto the latter the irregular relief and rocky soil have discouraged agricultural expansion in theregion.
The colonization process in Alta Floresta is just over twenty years old. Government initiativeshave led to easier access to land, resulting in the average property sizes smaller than for those inPará. Legal reserve levels are approximately 50 percent, in keeping with the Forest Code.
Finally, the Ji-Paraná municipality has properties of smaller average size due to the way inwhich colonization was conducted in Rondonia. Plots were distributed along highway BR-364 inan organized but irrational manner, disregarding the limitations imposed by the relief and by thepreponderance of poor soils. Thus, many of the deforested areas were not used to their full

34 WORLD BANK WORKING PAPER
advantage, and some plots have in fact been abandoned. Table 11 below presents the mainindices of animal production as indicated by each of the field research panels.
Comparing the indices, it can be observed that the best performance is reported by the AltaFloresta panel—for the rearing (“cria”), new-breeding (“recria”), and fattening (“engorda”)panels—and by Paragominas (for rearing and fattening). In the Paragominas region, efforts todevelop and improve pasture management and reclamation techniques are noteworthy. The AltaFloresta region, a more recently colonized area, has well maintained pastures. Groups of well-organized ranchers operate in the area, interested in applying pasture management techniques. Asmentioned previously, the technical parameters obtained from the panels were compared withthose from the IBGE censuses. The comparison is summarized in Table 12 below.
Municipality Size of property Land use Land Price (R$/ha)(a)
Paragominas (Pará) Panel 1 50% - Reserve 12,000 hectares 50% - Pasture
Panel 2 60% - Reserve PF-R$ 30015,000 hectares 36% - Pasture PI-R$ 1,250
4% - Agriculture
Redenção (Pará) Panel 3 50% - Reserve PF-R$ 3004,800 hectares 50% - Pasture PI-R$ 1,300
Santana do Araguaia (Pará) Panel 4 100% - Pasture PF-R$ 2503,200 hectares PI-R$ 2,000
Alta Floresta (Mato Grosso) Panel 5 50% - Reserve PF-R$ 2501,200 hectares 50% - Pasture PI-R$ 1,200
Ji-Paraná (Rondônia) Panel 6 50% - Reserve PF-R$ 2001,200 hectares 50% - Pasture PI-R$ 1,200
Ji-Paraná (Rondônia) Panel 6 50% - Reserve PF-R$ 2001,700 hectares 50% - Pasture PI-R$ 1,250
Tupã (São Paulo) Panel 7 20% - Reserve 300 hectares 70% - Pasture
10% - Agriculture PN-R$ 2,500
Panel 8 20% - Reserve PI-R$ 3,300300 hectares 70% - Pasture
10% - Agriculture
(a) PF–Price of one hectare in areas that contain only forest.PI–Price of one hectare in areas that possess a ranch with an established infrastructure for ranching.PN–Price of one hectare of deforested areas and without an infrastructure for livestock (price refers to the
state of São Paulo only, since the state contains no areas containing only forest).Note: Land prices vary substantially, influenced by a number of different factors such as distance from the near-
est cities, type of land, relief, the use to which land is to be put, extent of legally registered areas etc.Theprices shown are approximate values referring to properties within a range of between 30 and 40 kmfrom the nearest cities.
TABLE 10: SIZE OF THE PROPERTIES AND LAND USE ADOPTED IN THE PANELS

CAUSES OF DEFORESTATION OF THE BRAZILIAN AMAZON 35
As regards property sizes, it would not be possible to adjust the spreadsheet to other valuessince there is no way of evaluating the improvements (“benfeitoria”) and machinery of a particu-lar property of different size of that employed during field research. Any proportional reductionwould not however affect income per hectare. With reference to mortality rates, it is relevant tonote that the IBGE data refer to the 1996 Census, so the data were collected around 1994-95The seven to eight years of difference relative to the data collected for this study are vital: mortal-ity rate is one of the key parameters for ranchers, explaining much of the recent productivity gainswith the adoption of techniques such as artificial insemination. Regarding animal units perhectare (AU), the panel data from the four remaining municipalities are almost wholly consistentwith the data obtained from IBGE. In the case of Paragominas, it appears that IBGE data areflawed by a measuring error that overestimates the number of animals per hectare. If this parame-ter were altered, profitability would rise very substantially and would not entirely reflect reality;thus, the field research parameter was kept.
Panel IBGE
Size of Property (ha) 12,000 7,352
Mortality young animals 4% 10.2%
Mortality full-grown animals 2% 0.7%
Pregnancy rates 75% 82.8%
UA per hectare 0.7 3.0
TABLE 12: COMPARISON OF THE PARAMETERS OF THE PANELS WITH IBGE DATA,MUNICIPALITY OF PARAGOMINAS (PARÁ)
Pará M. Grosso Rondônia São PauloIndices Paragominas S.Araguaia Redenção Alta Floresta Ji-Paraná Tupã
System type (a) RBF F RF RBF RBF RBF RBF F
AU (b) per hectare 0.71 1.53 0.86 0.83 1.18 0.91 1.14 1.08
Mortality rate 4% — — 4% 3% 3% 2% —(young animals)
Mortality rate 2% 2% 2% 2% 1% 2% 1% 1%(adult animals)
Interval between 15 — — 16 14 14 17 —births (months)
Pregnancy rates 75% — — 87% 88% 85% 75% —
Daily weight gain in 0.47 0.50 0.42 0.42 0.43 0.45 0.37 0.33kg (annual average)
(a) System types:RBF: Rearing, new breeding and fattening (i.e., the property possesses matrices to rear its own calves as
well as areas devoted to fattening and slaughtering cattle).RF: Property used for in rearing and fattening but needing to purchase calves F: Property solely engaged in fattening, needing to purchase calves or lean cattle
(b) AU = Animal UnitSource: Data derived from field research.
TABLE 11: MAIN ANIMAL PRODUCTION INDICES AS INDICATED BY THE PANELS

36 WORLD BANK WORKING PAPER
ClimateAmong the environmental factors that most affect large-scale cattle ranching is, together withluminosity, the frequency and length of the dry season. These may be the main determinants ofpasture growth and higher productivity.
The dry season is considerably longer, and rainfall is much lower, in the southeast of thecountry than in the areas closer to the Amazon. Together with high temperatures and high rela-tive air humidity, these factors tend to reduce costs in the dry seasons. This would appear to be themajor factor favoring cattle ranching in the area, although it is important to emphasize that grassspecies used in the area are the same as those used in other areas of Brazil. Development of moreappropriate grass species and varieties for this particular area could lead to better prevention of pestsand invasive vegetation and, as a result, stimulate further rises in productivity.
Production Costs: Pastures The analyses begin with the rearing, new-breeding, and fattening system. To facilitate quickgraphic visualization in a limited space, the cash flow over 20 years was divided into five parts,with each amounting to a 48 month period (four years). In addition, the columns were dividedinto seven main items. Since the proportion between the items is not substantially different in thefour municipalities of the Amazon region, only one graph, that for Redenção, is presented belowas an illustration.
Other Costs The cost of purchasing heifers and cows is high only at the time that the ranches are established.The cost of machinery and farm implements is also relevant, but only in the case of Paragominas,where some properties choose to mix cattle ranching with other agricultural activities. As forlivestock breeding, the purchase of mineral salts accounts for the overwhelming bulk of costs(about 75 percent) due to the high cost of road transport.
Other Systems In the new-breeding-fattening system, the cost of acquiring the calves is by far the largest item.In the fattening system, this cost is even higher in view of the need to purchase heavier animals
FIGURE 5: PRODUCTION COSTS: REARING—NEW-BREEDING—FATTENING PANELS
0
500000
1000000
1500000
2000000
2500000
1 to 4 years
5 to 8 years
9 to 12 years
13 to 16 years
17 to 20 years
Others
Breeding/Ranching
Pasture
Labor
Machinery/Implements
Buildings/Equipments
Stock Aquisition
CAUSES OF DEFORESTATION OF THE BRAZILIAN AMAZON 37
exclusively for slaughter. The remaining costs associated with ranching vary, particularly grazingcosts. Other costs tend to be in line with former systems (see Barros et al. 2002 for more details).
Net Income per HectareNet income per hectare is extremely important from the rural producer’s point of view. It is themain factor analyzed at the time decisions are taken regarding which activities and which invest-ments to be made. The research showed surprising financial yields per hectare for virtually the wholerange of activities studied in the Amazon region. Soybean cultivation, still at an early stage, is high-ly profitable, although appropriate marketing structures still remain to be put in place. In the caseof cattle ranching, the high return per hectare is due to the high productivity levels obtained. The dryseason in the area lasts for approximately two months and the “moisture stress” of plants is muchlower than that experienced in other parts of Brazil. Thus, while grazing animals in the cerrado orin the Southeast lose weight over a four-month period, this is not a problem in those parts ofAmazonia studied.
In Mato Grosso, a cerrado area with widespread cattle ranching, productivity is low and thereturn hardly constitutes an incentive for producers. In reality, ranching in Mato Grosso is simply away of occupying areas where landowners reckon that in the future agriculture might be a viablealternative—ranching simply fills a gap in the turnover of companies whose principal business inter-ests revolve around agriculture.
In the state of Pará, and throughout Amazonia in general, very little historical or research dataexist regarding the productive potential of soybean cultivation. During the field surveys, it wasobvious that in Mato Grosso agricultural activity ends in Sinop. In the Alta Floresta region there ispractically no agriculture at all, given the different relief environment (increased declivity).
Table 13 shows the average yields for 20-year long cattle ranching projects. It can be seenthat net income per hectare in all areas of Amazonia is higher than that in Tupã/São Paulo, acattle ranching area typical of Brazil’s Center-South that acts as a kind of reference for assessingthe performance of ranching sector in Brazil.
As far as the locations analyzed in Amazonia are concerned, yields can be regarded as “goodto high.” The price difference between the area under study and other parts of Brazil is remark-able. This is due to the fact that the areas studied in Amazonia, with the exception of Alta Flores-ta, fall within the area of “average risk” in terms of foot and mouth disease, which means thatboned beef from the area is permitted in São Paulo but cannot be exported. In the state of Pará,live animal prices are 15 percent to 20 percent lower than in São Paulo. In Rondônia, the differ-ence is of the order of 25 percent, but the current edaphic circumstances of that area translateinto higher returns since pasture recovery is not required. The same applies to Alta Floresta.
Analysis of YieldFrom the cost and revenue data collected in the panels, monthly cash flows were calculated foreach area under study, which allowed calculating Internal Rates of Return (IRR). Constant prices
Alta Floresta (Mato Grosso—Amazonia) 138.91
Ji-Paraná (Rondônia) 132.87
Paragominas (Pará)—complete cycle 95.39
Paragominas (Pará) 102.98
Redenção (Pará) 65.83
Santana do Araguaia (Pará) 95.80
Tupã (São Paulo) 65.32
TABLE 13: NET INCOME PER HECTARE FROM CATTLE (IN REALS PER YEAR)

38 WORLD BANK WORKING PAPER
of inputs and of the product (beef) were assumed. The price of beef is the cash price paid by localpurchasers on the day that each panel was assembled.
As for land prices, for which data were collected in the course of field research, the followingneeds to be taken into account. If they were added to the investment costs, the total value of theproperty after twenty years would need to be included in the gross revenue of the final year, oncethe project is terminated. The estimate of the future price of land in each area will not be precisesince numerous exogenous factors can affect particular tracts of land over time. In practice, how-ever, it can be assumed that regardless of productivity, the price of land in 20 years will always behigher than land in virgin forest areas. From this, the conclusion can be drawn that inclusion ofthe land price would increase the financial yield on the activity. In the circumstances, it was decid-ed to employ two alternatives: (i) in the first, the price of land is excluded, both in the beginningand at the end of the project period; (ii) in the second, the land price enters in both. In the firstcase, returns forms part of the calculations of both. Case (i) means that yields for beef ranchingalone can be compared for the different regions, excluding the disparities which might arise froma rise or depreciation in the value of the land in question. In all the subsequent analyses, the secondscenario concerning inclusion of land price is disregarded. The results obtained are summarized inthe tables below.
IRR (land price IRR (land price taken Location disregarded) (%) into account) (%) Date of Panel
Paragominas 11.0 16.7 03/22/2002
Redenção 9.1 14.6 03/25/2002
Alta Floresta 14.5 15.2 05/21/2002
Ji-Paraná 11.5 N/A 05/15/2002
Tupã (São Paulo) 6.4 6.4 04/26/2002
Notes: Land prices in Amazonia: uncleared land—R$ 300/ha; cleared land—R$ 1,500/ha Land prices in Tupã/São Paulo: both cleared and uncleared land: R$ 6,000/ha
TABLE 14: INTERNAL RATES OF RETURN (IRR) FROM REARING, NEW-BREEDING ANDFATTENING SYSTEMS
IRR (land price IRR (land price taken Location disregarded) (%) into account) (%) Date of Panel
Paragominas (a) 14.5 17.9 03/21/2002
S. do Araguaia 14.7 16.9 03/26/2002
Tupã (São Paulo) 3.8 3.8 04/26/2002
TABLE 15: INTERNAL RATES OF RETURN (IRR) FROM NEW-BREEDING AND FATTENINGSYSTEMS
(a)—Fattening activities onlyNote: Based on same land values as in Table 14.

CAUSES OF DEFORESTATION OF THE BRAZILIAN AMAZON 39
Due to variations in the beef price, the internal rates of return were also calculated with themonthly averages of the historical prices in the four states involved in this analysis.23 It can beconcluded that the investments made in ranching activities in the Amazon forest region are higher,but generate substantially higher levels of return than those derived from the same type of activity inthe interior of São Paulo.
It should be stressed moreover that the prices received by producers in Amazonia per arrobaof fattened cattle in Amazonia are 20 percent lower on account of foot and mouth disease. As thedisease is brought under control, producer prices can be expected to increase, thereby increasingthe profitability of ranching across the whole region.
Regarding the circumstances under which land prices are taken into account, it should benoted that the price of land reflects the market value as stated by local ranchers themselves. Suchprices reflect the process of land occupation and ownership largely through illegal acquisition, asdiscussed in the preceding chapter. They would therefore not be entirely appropriate in a socialevaluation of cattle ranching.
Mathematical Modeling Analysis of the panel results provides information on the returns to cattle ranching in Amazonia,and allows comparison with the case of São Paulo state. Ranching in the particular Amazonianareas studied competes with ranching in other parts of Brazil, but more importantly, it competesalso with other possible activities within a property. The owner must thus decide whether to usehis land for alternative agricultural activities or to leave it under forest cover until the rightmoment presents itself for clearing it for some activity connected with ranching. In addition tothe question of financial yield, the main factor that influences such decisions is the producers’ percep-tion of risk.
Mathematical programming models permit to choose an optimal combination of economicactivities on agricultural properties, taking into account or not the risks involved, as well aschanges in the level of competing activities under a variety of scenarios.
Results of the Risk-free Model In this model, the combination of activities that maximize profit is examined. This implies that theproducer is indifferent to risk—his objective is to maximize income from the property regardless ofthe possibility of not being able to achieve required production or prices from his endeavors.
The model was developed for the area of Paragominas in Pará, since this was the only area inAmazonia’s “arc of deforestation” where agricultural (crop) production structures is developing.In the other areas, ranching is the prinicipal activity. In Alta Floresta in Mato Grosso—a “transi-tion” area between cerrado and rain forest—the undulating rocky soil is not so suitable for ranch-ing, but has higher precipitation than the cerrado, and hence higher ranching potential.
The representative size of the model property is 15,000 hectare, of which only 4,500hectares have been cleared. Equipment is financed with a credit from the Bank of Amazonia (witha three year grace period) at an interest rate of 8.75 percent. The available capital in the propertyis R$1.7 million. The net returns per hectare from activities carried out on this property, basedon the field research data obtained in Paragominas, are presented in Table 16 below. These arehigh in comparison with other areas of Brazil, due to the production system employed in whichalready high-yielding crops need relatively small inputs. The value for soybean, in particular, issignificantly higher than the one proposed by Costa (2000).
The results of the model indicate that producers would tend to employ the bulk of capital inthe most profitable activity, in view of cash flow conditions. The results obtained indicate that
23. The price series were obtained from the CEPEA/ESALQ databank. A new internal rate of returnwas obtained for each of the existing prices. The set of IRRs regarding each average monthly value of thearroba in each region was represented in frequency histograms.

40 WORLD BANK WORKING PAPER
approximately 1,600 hectares of soybean should be planted while the remainder of the landshould be given over to forest.24 This result does not correspond to the observations of the fieldresearch, suggesting that producers are in fact not indifferent to risk. In effect, producers are alwaysseeking to manage risk through the use of additional sources of income, trading off part of thepotential income for lower risk and diversifying activities on their properties.
Results of the Model Incorporating RiskIn order to incorporate the risk element in the model, deviations of gross revenue from a lineartrend representing rural producers’ expectations are used. In the proposed model, the deviationsare obtained through simple linear regression where the dependent variable is the gross revenueand the explanatory variable is time. The deviations for each of the crops over the past 10 har-vests are presented in Table 17. The values in the table are considered in the model which is nowused with the purpose of minimizing risk, given a forecast income. As the forecast incomedeclines, the deviations follow suit and the efficient frontier is obtained representing the set ofpoints that can be obtained for different combinations of income and risk, given the availableproduction factors.
In Figure 6, results for the property of Paragominas are shown. In Paragominas, agriculturalactivities are already established and a dynamic process of substituting ranching for production ofannual crops is underway. The annual return on the property studied in Paragominas approximates
Rice Corn Soybean Fat cattle
54.4 108.6 −177.5 1.2
50.4 125.9 139.3 −0.9
−25.1 16.5 241.5 −4.0
−45.0 −104.5 −15.8 2.7
−23.9 −111.5 55.4 6.9
−9.6 −65.7 −229.2 1.7
−45.4 −77.0 −97.9 −6.8
−146.0 −144.7 115.9 −4.0
140.9 33.6 −79.4 −1.6
42.9 53.4 47.3 1.8
5.9 165.6 47.0 3.0
TABLE 17: ABSOLUTE DEVIATIONS OF CROPS OVER THE PAST 10 SEASONS (IN JANUARY2002 REALS PER HECTARE)
24. Cash flow restrictions prevent the area from being totally occupied by rice—in principle the mostprofitable crop on a per hectare basis.
Rice 582.00
Beef Cattle 95.39
Soybean 517.21
TABLE 16: NET RETURNS (IN REALS PER HECTARE)

CAUSES OF DEFORESTATION OF THE BRAZILIAN AMAZON 41
R$900,000 on the basis of the following: 238 hectares of rice, 173 hectares of corn, 400 hectaresof soybean, 4,924 hectares of pasture land, and 9,262 hectares of forest. Land allocation to thedifferent agricultural activities, according to the results of the model, closely resembles actualpractice in the field.
The model proved to be sensitive regarding area expansion in the event of price shocks. Asthe result of a price rise of one of the products, a redistribution of the area within the deforestedarea takes place first, and forest clearing may take place later. This can be explained by the factthat an increase in the crop or pasture area is conditional on making a substantial investment toclear forest, an investment which is rarely recouped from returns on the property.
At the point where the utility curve of the producer (red line) touches the efficient frontier,the point of equilibrium for the Amazon property is found. At that point, the producers’resources are allocated to 528 hectares of rice, 547 hectares of corn, 1,124 hectares of pastures,and 1,185 hectares of soybean. The remaining area, 11,613 ha, continues under forest. Suchareas were obtained from the panel interviews—how farmers would allocate land between crops,pasture and forests (in percent terms) under the conditions being analyzed.
The similarity between model results and actual land use indicates that rural producers arenot indifferent to risk. Ranchers or farmers do not have the means to open up large areas withthe returns from current activities on their properties; revenues and cash flows fail to provideenough capital for short-term investments of this nature. This would suggest that any capital forexpanding the cleared area must come from other sources.
Comparing the results obtained with the model and the field data, it is noted that relativelysignificant differences are present only in the case of soybean. Nevertheless, it is important tokeep in mind the fact that soybean cultivation is rapidly rising and historic data regarding priceand production for the state are only available for the period after 1997.
Some Simulations The mathematical model permits simulations to analyze the probable impact of variations in cer-tain parameters on the productive system. Such simulations help in the analysis of policiesdesigned to optimize the system from the social point of view, and are available for this purpose.They are also helpful in understanding the ranchers’ own modus operandi. However, only a limited
FIGURE 6: EFFICIENT FRONTIER: RISK AND INCOME COMBINATIONS (PARAGOMINAS)
0
200000
400000
600000
800000
1000000
1200000
1400000
39000 66000 113000 185000 223000 294000 351000 423000 485000 555000
Re
turn
R$
/ye
ar
Deviation (R$)

42 WORLD BANK WORKING PAPER
range of simulations is presented here. The simulations were all done for the typical propertydescribed above.
The first simulation analyzed the impact of an increase of 10 percent in the net income fromranching, as could arise from an increase in the product price. In this case, the pasture area wouldincrease by about 22 percent or 252 hectares, from 1,124 hectares to 1,376, of which 176 arefrom clearing forest area and the remainder from the agricultural area, with a significant reduc-tion of the area under soybeans (59 hectares, representing about 5 percent of the original area ofthe crop). An increase of 20 percent (instead of 10 percent) in the net income from ranchingdisplaces the agricultural area but does not alter the forest reserve area, because more benefit canbe obtained from reducing the agricultural area in view of the high initial investment needed toclear forest.
With the aim of evaluating the amount of net return on the “forest” activity that would makeit an attractive alternative to the others, simulations were made with different levels of annual netincome from the forest area, starting at a base of R$10 per hectare. The simulation tested twosituations:
� In the first, the producer takes into account not only the profit from the activities but alsothe risk involved. The actual conditions of the Paragominas property were thusreproduced, with a yearly income of some R$900,000 (the point at which the profit curvetouches the efficient frontier). The results indicate that a net return of more than R$45.00per hectare makes it worthwhile for producers to retain forest at the expense of the otheragricultural activities considered;
� In the second case, the producer is indifferent to risk, selecting activities from a profit-maximizing viewpoint. In this case, a net income of around R$200 per hectare would beneeded for the “forest” activity to take priority over the others considered in the study.
These two results show the opportunity costs involved in maintaining a forest reserve on aprivate property, with or without taking risk into account. The low value of the “risk” case issurprising, as producers would be willing to earn a relatively low net return for leaving part oftheir properties under native forest. This gives an idea of the magnitude of the compensationeventually required and the costs of implementation of such policy in the region. We return tothis issue in Chapter 5.
Finally, simulations were made regarding the effect of a tax on deforestation as a way ofobliging ranchers to internalize at least part of the social costs of deforestation. Two taxes wereconsidered: one of US$15 per hectare and another of US$20 per hectare (both based on anexchange rate of R$3.55 to the US dollar). Table 18 below presents the results of simulationswhich apply this hypothetical tax on a typical farm in Paragominas.
Original areas of New areas (ha) New areas (ha)Activity model (ha)(a) with US$20/ha tax with US$15/ha tax
Rice 239 1,055 729
Corn 173 176 267
Soybean 401 476 439
Fat cattle 4,925 2,666 3,329
Forest 9,262 10,627 10,236
TABLE 18: RESULTS OF DEFORESTATION TAX SIMULATIONS
(a) –distribution of the activities of the model based on an annual net income of R$ 900,000
CAUSES OF DEFORESTATION OF THE BRAZILIAN AMAZON 43
The first column shows the types of activity under consideration. The second represents thearea occupied by each of the activities in the original model: a farm property covering 15,000hectares, with R$1.7 million in available capital and with an income of R$900,000 optimized interms of risk and return. The third and fourth columns indicate the new optimal values after theimposition of a deforestation tax.
The tax has the effect of leaving a larger area under forest: about 1,365 hectares larger withthe US$20 tax, or 974 hectares with the US$15 tax. Considering the second case, it is seen thatthe area under pasture is 1,596 hectare less than in the base case, which is 63 percent more thanthe increase in forest area. The remainder of the reduction in pasture (622 = 1,596 less 974) isused in the following way: 490 hectares for rice, 94 hectares for corn, and 38 hectares for soy-bean growing. In other words, in addition to inducing preservation of the forest, the tax led sub-stitution of cattle ranching by cultivation of corn, soybean and especially rice. This in effect meansthat owners would intensify land use, something to be expected if they face higher land prices.25
As indicated earlier many additional simulations would be possible but are beyond the scopeof this study.26 The interested reader is referred to Barros et al. (2002).
Final Considerations and TrendsExperience to date points to the difficulties but also to major advancements of ranching in theregion. Despite the problems, many lessons are being learned in terms of cattle and pasture man-agement technology. Intensification and specialization can bring high returns, but they demand along time span. Cattle ranchers are likely still at a relatively early point on the learning curve, withcurrent figures reflecting no more than short-period trends. They are rapidly becoming “profes-sional” as markets become increasingly competitive, as seen in the ongoing trend towards intensi-fication and increased production efficiency. The experience of the American West would appearto hold lessons for what is occurring in Amazonia—initial economic failure does not impede expan-sion of the “frontier,” but rather speeds up the process of adapting to new managerial and technicalmethods.
The growing perception by local cattle ranchers of the potential economic returns of livestockin Amazonia has at times involved high investment in pasture improvement on reclaimed land:over 600,000 hectares of abandoned land were reclaimed through planting of improved pasturevarieties, at an approximate cost of US$260 per hectare, permitting densities of 1-1.5 heads perhectare and generating returns on investment of up to 13-14 percent. This experience will proba-bly become the norm in the Paragominas area and in others where productivity is beginning todecline.
Generally speaking, the high economic returns to ranching in the area are due to the avail-ability of good pastures as a result of high precipitation (intensity and frequency), high averagetemperatures, high relative air humidity and of the type of grasses used. This suggests that livestock
25. It is interesting to compare the amount of money required as a compensation for farmers not todeforest a marginal hectare of forest (R$ 45 with risk, R$ 200 without risk)—a subsidy—with the value of atax which would make farmers reduce deforestation as presented in the last simulation. In the first case thevalue reflects the opportunity cost of maintaining forests on a private property (it was obtained by calculat-ing the value of forests that would make producers indifferent between such activity and agriculture orranching). The second has been calculated applying a tax on every hectare deforested (an ad hoc increase incosts applied to every hectare deforested). The simulations suggest both a tax and a subsidy of R$ 45/ha(approximately US$ 15/ha) would make the typical producer reduce the deforested area by about 1,000 hain the property analyzed, corresponding roughly to 17 percent of the deforested area. The obvious funda-mental difference between the two policies is who bears the costs.
26. One of these simulations might look at the opportunity cost of capital. The value adopted in themodel’s basic case scenario (8.75 percent) is typical of the more capitalized farming system in Brazil accordingto CEPEA/ESALQ. But cattle ranching is an activity which essentially does not operate with credits in Brazil,so that even the value adopted might be an unrealistic overestimate of the real capital cost faced by ranchers.

44 WORLD BANK WORKING PAPER
and pastures in regions without the same geo-ecological conditions may not reach the same pro-ductivity, as in the case of the high rainfall zones already mentioned.
Looking forward, a number of factors could either foster or militate against profitability andexpansion of cattle ranching in the area (see Veiga and Tourrand, 2001).
Factors that Could Reduce the Performance of Cattle RanchingProblems associated with pasture expansion � Large scale use of B. Brizanta to replace the old colonião pastures. The former adapts very
well to the soils and climate of the Amazon region but may lead to the emergence of con-tiguous areas of monoculture, and thus to the spread of diseases and pests that significant-ly reduce the production of biomass, and to higher maintenance costs.
� The formation of large air corridors due to the lack of natural barriers previously providedby high forest could decrease relative humidity and increase the propensity of the pastureto dry out, reducing its regenerative properties during the dry season.
� An increase of abandoned areas and incorrect pasture management favors the spread ofinvasive plants, which compete with the different varieties of cultivated pasture. The prob-lem is particularly serious in the areas of Redenção and Santana do Araguaia. The use ofherbicides is problematic because the active ingredients killing invasive plants have a dele-terious effect on the cultivated grass.
Problems associated with expansion of the cattle stockThe costs currently involved in fighting diseases and parasitic agents are not particularly signifi-cant today. However the expansion of the areas under pasture and the trend towards establishingadjoining properties facilitates direct contact between the herds on neighboring ranches. This inturn can lead to diseases and parasitic agents affecting a wider area and to increased productioncosts.
EnforcementThe bulk of producers consulted in the course of the field research were aware of the need toretain 80 percent of the original forest cover as specified in current law (Medida Provisória 2166).They also knew of the risks associated with deforestation. Corruption was cited on a number ofoccasions as the key factor which encouraged flouting of the law. Nevertheless, the existence ofthe law and a fear of committing infractions help to curb even wider deforestation.
Factors that can Increase the Performance of Cattle Ranching The growing herd size and local development have led to the setting up of organizations to pro-tect local interests and promote economies of scale. In all areas researched, the existence of munici-pal producer unions and active state organizations was noted. They focused on the control of footand mouth disease, organizing fairs and other events aimed at stimulating trade and on trainingcourses and lectures geared to the improvement of technology and introduction of new ones.27
As the areas develop and foot and mouth disease is brought under better control, it is proba-ble that other investors will be attracted and that industrial meat cooling plants from the southand southeast of Brazil might relocate to the area. This will no doubt lead to price increases andlarger markets for the product.
The latter is one of the potentially more favorable results of expanded cattle ranching inAmazonia: the opportunities offered by domestic and external markets. According to Santana
27. In Alta Floresta, for example, the high costs involved in purchasing mineral salts led producers to setup a company to manufacture this particular input within the municipality in order to reduce costs. Atpresent, the factory is investing in research with a view to improving food supplement products.

CAUSES OF DEFORESTATION OF THE BRAZILIAN AMAZON 45
(2000), this prospect favors development of the beef cattle industry, so long as product quality isa priority. However, development of the export potential for beef is closely linked not only tointernational demand but also to the international price system, a wide range of sanitary restric-tions and to protective measures in the importing countries (Haan et al. 2001).
In the same way in which producer organizations formed rapidly to deal with foot andmouth disease, there is also the prospect of the larger ranches in the area adopting mechanisms totrack and obtain younger stock, without the need to use hormonal products or to confine cattle.
The future of the cattle ranching economy will also largely depend on the future cost oftransport and on the incorporation and consolidation of technologies most suited to the region.It will, of course, also depend on the relationship between ranching, crop production and timberextraction, on changes in markets (particularly urban growth in Amazonia), and on the opportu-nity costs of opening up new areas (as opposed to the option of intensification). Of these, trans-port cost and technology are key factors. New production technologies will certainly arise from acombination of innovations undertaken by ranchers and research results obtained by EMBRAPAand other agencies. Transport costs will depend on government investment in the necessary infra-structure, especially roads—as foreseen in the Avança Brasil Program. The effects of increasedurbanization of the Amazon region on cattle ranching are largely unknown and studies on thesubject are still in short supply.
In conclusion, the key question is the following: will new areas still need to be cleared even ifcattle ranching uses existing land more intensively? Our view is that the trend towards acceleratinggrowth of the cattle stock and of the area under pasture will continue. Pressure for expansion of the“cattle frontier” will result not only from the dynamics of the ranching business itself (increasing-ly consolidated and profitable, with increased opportunities in the local markets as well as those inthe Brazilian south and abroad) but also from pressure on the “agricultural frontier.” Recentstudies undertaken by the Bank in partnership with IMAZON suggest that there are natural bar-riers in the way of expansion of both the “ranching” and “agricultural” frontiers. The frontierfeatures extremely high precipitation levels in the areas close to the “heart” of the dense rainfor-est. Experience of the bragantina area of the state of Pará offers irrefutable evidence that onlyvery few, if any, economic activities are possible in such areas, and that perhaps only logging maymake economic sense. The question is whether lessons have been learned and disseminated, orwhether further deforestation and land use conversion will take place before it is realized thatsuch areas are unviable for ranching. There is thus an evident need to implement effective zoningto bring order to land use. We return to the issue in the final chapter.


47
CHAPTER 5
SOCIAL COSTS AND BENEFITSOF DEFORESTATION
In the preceding chapter, the economic viability of cattle ranching in Amazonia was discussed,based on studies carried out in representative areas of the “consolidated frontier.” The resultssuggest that in some areas relatively high rates of return are possible, although this is not the
case for the whole area. The aim was to demonstrate that a trend towards more “professionaliza-tion” and more widespread use of improved ranching technology is the key to explaining thedynamics of deforestation in Amazonia. The driving force behind the ranching business is the realprospect of profit from the activity. This in turn motivates the decisions made by the chain ofagents involved, from the primary speculators at the beginning of the process to the capitalizedprofessional entrepreneurs on the consolidated frontier. A wide range of intermediaries is alsoinvolved.
The private profit to be obtained from cattle ranching does not ensure that wider social bene-fits necessarily flow from the activity. It is necessary to observe the social and environmentaleffects (in the widest possible sense of the term) of the activity. From the social standpoint, anassessment of cattle ranching must incorporate all the potential social benefits associated with it,whether they are local (such as generation of employment, income growth, better living condi-tions for the population, access to services etc.) or national (such as lower beef prices, higherexports, and increased protein intake by the poorer population). From the sum of social and pri-vate benefits obtained from ranching, some idea of the total potential social gains associated withthe ranching business and deforestation can be obtained.
On the other hand, the negative environmental, social and cultural effects of clearing andranching must also be measured—a range of factors which could be regarded as “social costs.”These costs of the activity can then be compared with the “social gains,” in an effort to arrive at acost-benefit evaluation of cattle ranching and associated deforestation.
The social evaluation must take into account the opportunity costs of cattle ranching. Inother words, even if private gains exceed the respective costs involved, it is necessary to examinealternative activities to ranching which may be able to compete on the same scale as ranching,

48 WORLD BANK WORKING PAPER
such as forest management. In short, it will be necessary to compare the net social benefits of thetwo activities and not accept cattle ranching simply on account of its viability in terms of its poten-tial to generate private profit.
A social evaluation of deforestation must cover at least three different levels: (i) local society(inhabitants of the region), as well as the wider perspectives of the (ii) national and (iii) globalpopulation. Each of these perspectives may lead to differing results in terms of, for example,admissible amounts of deforestation, the locality in which deforestation takes place, etc.
This simplified framework presupposes that risk-free decisions are taken, but this is, of course,is far from being the case in the real world. Any assessment of the social costs of deforestation willalways be susceptible to a fair degree of uncertainty—even if the analyses point to a net socialbenefit it can be argued that the imprecision inherent in analyses of this nature (for example, theintrinsic value arising from the irreversible loss of certain species of flora or fauna, or the possibleeffects of deforestation on micro-climates or on rainfall patterns) call for broader criteria thanstrict economic cost-benefit assessment.
This study does not claim to provide answers to all the questions posed and at all possiblelevels of analysis. This chapter makes a rough assessment of the social costs and benefits linked tothe spread of cattle ranching. Next section briefly examines the role of fiscal incentives in theexpansion of cattle ranching and deforestation. The issue is discussed whether ranching is prof-itable only as the result of government incentives. Section 2 deals with estimates of the economic(environmental) costs of deforestation made for this study. Finally, Section 3 presents some eco-nomic indicators on alternative activities, summarizing the various estimates that might serve as apreliminary basis for a social cost-benefit analysis of deforestation.
As already mentioned in chapter 2, the Annex to this report presents the evolution of somesocioeconomic indicators in Amazonia. They are not included in this chapter because it is notpossible to directly attribute the observed gains to deforestation. This study adopts a conservativeapproach with regard to the possible size of local socioeconomic benefits by not consideringthem as effects of deforestation.
Government Incentives: Subsidies as a Basis for Cattle Ranching and Deforestation?28
The contribution made by government credit and other fiscal incentives to deforestation remainsa controversial issue. Until the 1980s, it was generally accepted that ranching basically served as amechanism to guarantee land ownership, for enjoying the benefits flowing from official credit andsubsidies and as a way of making speculative gains (Hecht 1993, Tardin et al. 1982). From thispoint of view, fiscal incentives played a decisive role in the expansion of cattle ranching in Amazo-nia during the 1970s and 1980s for the simple reason that large-scale ranching was deemed notto be economically viable without fiscal incentives (Hecht 1985, Hecht et al. 1988, Browder1988). Incentives were therefore critical to explain deforestation in the region (Binswanger 1989,Mahar 1989).
Schneider (1995) claims that agriculture in Amazonia received incentives of the order ofUS$3.172 million (1990 Dollars) between 1971 and 1987, representing an average input ofUS$300 million per year. In a seminal article on the role of fiscal incentives in Amazonia,Yokomizo (1989) showed that cattle ranching projects represented 58 percent of the total num-ber of projects approved by SUDAM in 1989. Most of these were in Pará and Mato Grosso—39percent and 25 percent of all agriculture-based projects, respectively. The bulk of these projectswere in the cattle ranching sub-sector. Examining the data on deforestation in these two states forthe same year, it was estimated that FINAM-supported projects were responsible for approximately16 percent of deforestation after 1970 (21 percent in Mato Grosso and 7.5 percent in Pará).
28. This sub-section draws largely on Pacheco (2002b).

CAUSES OF DEFORESTATION OF THE BRAZILIAN AMAZON 49
These estimates assume that the total area benefited by these projects was actually converted toranching purposes. It is worth noting however that in the vast majority of cases this was not thecase (Hecht 1982).
Ranching projects tend to be long-term undertakings, generating little employment (an aver-age of only 36 jobs per project) and showed the lowest rates of financial return compared withother sectors receiving incentives. Given the dearth of information, it is not possible to give amore precise estimate of the area which was actually converted to pasture under the auspices ofeach project. It is also not possible to determine whether the conversion to pasture was in linewith the original officially-approved schemes (SUDAM 1995).
In the early 1990s, subsidized credit—viewed as the driving force behind ranching or defor-estation expansion—was terminated, and the various tax breaks and credit-based incentives weregradually phased out. More rigorous monitoring was also introduced. There are, however, fewsigns of a reduction of deforestation rates over the same period. In fact, areas with medium-sizedproperties actually showed very high rates of deforestation, although they were the beneficiariesof only limited incentives provided by SUDAM. As indicated by a number of economic studies, arange of other factors may be behind this process (Faminow 1988, Schneider 1995). The basicexplanation is that cattle ranching tends to expand in Amazonia for the simple reason that it is alow-risk and profitable enterprise for those involved (private gain) and that ranchers have more incommon with capitalist entrepreneurs whose main objective is to continually expand their busi-nesses in order to maximize profits rather than to await the direct or indirect benefits provided bygovernment or to engage in pure speculation (Margulis 2001).
Table 19 below shows that from 1991 to 1999, projects in the agricultural sector representedthe majority of approved projects, but accounted for only 16 percent of total FINAM funds(US$588 million, or US$64.4 million per year). Since 1996, incentives have primarily been allo-cated to the industrial sector (Arima 2000).
Schneider (1995) makes an estimate of the probable effects of fiscal incentives on the expan-sion of ranching activities in Amazonia for the years 1980 and 1985 (Agricultural Census years)assuming that the available incentives benefited the largest ranchers. He concluded that FINAMincentives accounted for 17 percent of the cattle stock in 1980 and for 25 percent in 1985 (on0.2 percent and 0.4 percent of the properties respectively). He also claims that since the 1980sthe most dynamic sector of the cattle ranching industry is accounted for by properties with fewer
Year Agribusiness Agriculture Industry Services Total
1991 57 41 317 100 514
1992 38 100 249 64 452
1993 4 73 27 6 110
1994 52 12 31 117 213
1995 8 17 44 25 93
1996 47 26 47 56 176
1997 84 92 181 26 384
1998 121 158 443 39 761
1999 146 61 600 6 813
Total 555 580 1,940 439 3,515
No. of projects 125 319 235 54 733
TABLE 19: FINAM FISCAL INCENTIVES BY SECTOR (IN 2000 US$ MILLION)
Source: SUDAM apud.Arima (2000), adapted by Pacheco (2002b).

50 WORLD BANK WORKING PAPER
than 100 animals, and therefore not in receipt of incentives. Using the same methodology,Pacheco (2002b) estimates that in 1996 ranching projects funded by FINAM benefited 0.1 per-cent of the properties and about 7.5 percent of the cattle (Table 20).
Other studies show that the majority of ranchers, particularly those of small and medium size,do not benefit and have not benefited from fiscal incentives (Browder 1988, Arima and Uhl1997). The latter authors suggest that only 4 out of a total of 47 ranchers interviewed receivedany kind of fiscal incentive and none of them claimed that they were operating in Amazonia inthe expectation of obtaining fiscal incentives.
In addition to the incentives provided by FINAM, two other instruments have played animportant role in financing agriculture and cattle ranching Amazonia: rural credit and FNO funds.Table 21 below shows that rural credit allocated to the northern states of Legal Amazonia is onthe increase, although such finance still only accounts for between 2 and 3 percent of the country’stotal rural credit provision (Gasques 2001). The allocation attributed to FNO varied from 35 to70 percent of the total amount of rural credit and the proportion offered by FNO to the ranchingsector has been significant, increasing from 43 percent in 1998 to 68 percent in 2001.
1998 1999 2000 2001
FINAM livestock 158 61 57 47
Total rural credit (a) 114 195 284 327
Total of rural FNO 67 137 197 115
Livestock total 50 83 167 168
FNO livestock 29 62 114 79
Rural FNO/rural total (%) 58.4 70.3 69.4 35.2
FNO livestock/total livestock (%) 58.0 74.1 68.4 47.2
FNO livestock/FNO rural (%) 43.1 45.0 57.9 68.7
TABLE 21: RURAL CREDIT FOR NORTHERN REGION (IN 2000 US$ MILLION)
(a) Credit for the states of Acre,Amapá,Amazonas, Pará, Rondônia and Roraima)Source: Adapted from BCB, Rural Credit Statistical Yearbooks, 1998-2002.
Establishments Herd
1000 units, 1980 54.8 3,989.1
1000 units, 1985 90.2 5,358.7
1000 units, 1995/96 148.9 12,058.5
% with FINAM Incentives, 1980 0.2 16.5
Idem, 1985 0.4 25.4
Idem, 1995/96 0.1 7.5
(a)Includes the states of Acre,Amapá, Rondônia,Amazonas, Pará, and Roraima.
Source: 1980 and 1985 based on Schneider (1995), Pacheco (2000b) using IBGE Agricultural Census for1995/1996 and SUDAM data. See Schneider (1995) for methodology.
TABLE 20: MAXIMUM HERD NUMBERS BENEFITING FROM FINAM INCENTIVES(A)
CAUSES OF DEFORESTATION OF THE BRAZILIAN AMAZON 51
It is difficult to measure the effects of the FNO on the dynamics of cattle expansion in Ama-zonia. However, this has evidently made a modest contribution in terms of the region as a wholeand the FNO certainly played an important role in increasing the herds of small producers withlimited access to investment credit. Cattle purchased with FNO funding (one million heads) rep-resented an increase of 9 percent in the total bought in the years 1990-2001: 35 percent of therural credit under FNO control was allocated to ranching activities over the entire period. Morerecently such participation has been increasing.
The social effects of the FNO contribution were mixed. The preferential credit allocated bythe FNO had a positive influence on expanding the herds of small and medium-sized ranchers,although the main aims of product diversification and increased family income have not been fullyachieved. Many small farmers encountered difficulties in turning to milk production as their mainactivity, in part due to problems with the FNO disbursements procedures (Andrae and Pingel,2001) and due to the farmers’ inability to develop a milk processing and marketing infrastructurewhich would have facilitated contact between producers and the emerging markets for dairyproducts (Veiga et al. 2001). Nevertheless, producers with more experience in cattle managementsucceeded in benefiting substantially from the program.
In short, fiscal incentives played an important indirect role in the past in building up theinfrastructure and production basis for cattle production activities. Moreover, given the generalunfamiliarity with cattle production techniques in Amazonia, it could be claimed that fiscal incen-tives helped considerably in the initial difficult stages of production involving a great deal of trialand error, particularly back in the 1970s (although much of the money made available was not infact actually spent on livestock production). As modern techniques came on stream over theyears, cattle production became competitive and FINAM funding for ranching was drastically cutback. At present, in view of the more rigorous accounting controls over resource allocations,fiscal incentives do not rank high on the list of factors which could explain the observed prof-itability of the sector and deforestation in Amazonia.
Estimate of Economic (Social) Cost of Deforestation in Amazonia29
With the aim of estimating the economic costs of deforestation in Amazonia in monetary termsand to enable a quantified comparison with the benefits, a limited environmental valuation wascarried out. In the case of deforestation, this involved identifying the values from the future stockof forest which ultimately determines the future scarcity of “lost” environmental resources (i.e.,their future value).
In theory, it would be necessary to include dynamic parameters to determine the economiccost curve of deforestation over time rather than using a value for this cost at any particularmoment in time. However, identifying such curve would be a highly unreliable exercise andfuture values would need to be discounted over time—in other words calculated on the basis ofpresent values, requiring the use of a social discount rate. Determining this rate would be difficultsince it implies estimating the rate at which present consumption would need to be exchanged forfuture consumption without the possibility of consulting future generations. Thus, scenarios forthese future economic values and for different discount rates were adopted in order to evaluatethe impact of these unknown quantities. The valuation exercise is an attempt to measure the totaleconomic value related to deforestation in Amazonia, using the year 2000 as a benchmark.
Methodology and EstimatesThe estimates were limited to particular elements for which available ecological information per-mitted conclusions to be drawn regarding the size and monetary value of environmental damage.
29. This section summarizes the results of an exercise contracted for this research with the same title—Seroa da Motta (2002). The complete study can be consulted on the World Bank Website (www.bancomundial.org.br).

52 WORLD BANK WORKING PAPER
No estimates were made of indirect uses such as maintenance of the local climate, erosion con-trol, flooding, water recycling, and anti-fire protection.30 The following elements ere estimated:
� Use values associated with timber extraction, non-timber extractivism and ecotourism;� Indirect use values linked to carbon stocking;� Option values associated with bioprospection; � Existence value associated with biodiversity conservation.
It should be emphasized that the exercise was approached in terms of average rather than margin-al values (as should be the case). Given the lack of information, this was the best result under thecircumstances. In the estimates of foregone output, it was decided to adopt conservative averagevalues or estimates referring only to certain areas but divided by the total area of Legal Amazonia(ecotourism). In the case of the option and existence values, parameters from the literature wereemployed which possibly dealt with marginal valuation.
Timber extractionThe only study available that analyzes the cash flow of forest management—the exploitationmethod on which other forest environmental services are preserved—is that which draws onexperiments in the Paragominas region (Almeida and Uhl 1995). These authors concluded that itshould be possible to generate a net income of US$28 per ha/year with these operations.Because this value related to 1994, it was updated to 2000, increasing to US$28.5 per ha/year.It is fairly plausible that this is an underestimate as far as forecasts of future values are concerned,since markets for Southeast Asian timber appear to be gradually drying up, thereby possiblyresulting in higher prices for Amazon timber, which could include bringing onto the commercialmarket timber species which to date have not been marketed to any great extent. The value iswell within the range presented in the literature review by Schneider et al. (2000).
Non-timber extractivismAssuming that extraction of non-timber products is already practiced on a sustainable basis in theregion, deforestation for cattle ranching will cause a production loss which, divided by the totalarea, will give admittedly very small values when compared with associated activities. Data refer-ring to the municipal value of extractive production was used, based upon the municipal plantextraction figures of IBGE. Net income was assumed equal to gross revenue, considering thatthese are activities of low capital-intensity. Dividing the aggregate of the region by its total area,converted at the average exchange rate for the year 2000, resulted in a value of only US$0.20 perha/year.31 Unlike timber extraction, the future market for non-timber extraction activities ismuch less promising, especially when such activities over the whole of the region’s territory aretaken into account. In these circumstances, a reasonable assumption would be that it is unlikelythat the benefits per hectare will increase substantially in the future.
EcotourismEcotourism in Amazonia is an incipient activity which has not yet been systematically researched, andtherefore little relevant data exist. Given the current size of the preserved area of Amazonia, ecotourismnevertheless has potential for growth even if the forested area were to suffer further reduction.
30. Fire used for opening up ranching areas is not only an agent of deforestation but leads to fire contin-uing under the forest litter (ground fire) thereby increasing the risk of devastating huge areas. The intensiveuse of fire for clearing pastures can accidentally cause damage to installations. The latter damage is regardedas the result of ranching activity and not of deforestation. For an estimate of accidental damage caused byfire, see Seroa da Mota et al (2001).
31. The value is high compared to the one presented in Wunder (2001) of US$ 0.7/ha/year practiced in2-3 million hectares of the Amazon.

CAUSES OF DEFORESTATION OF THE BRAZILIAN AMAZON 53
Estimates considered that the potential for ecotourism in Amazonia would be at most equivalentto the current potential of the same activity in the Pantanal region of Brazil, where a consolidatedecotourism sector exists in a biome which is almost totally preserved, is home to a wealth of bio-diversity and water resources, and thus has great attraction for this type of tourism. It was alsoassumed that the growing demand for ecotourism could lead to growth in both biomes withoutone region affecting the other negatively. Using municipal data on maximum potential for eco-tourism activity in the State of Mato Grosso do Sul, a figure of US$9 per ha/year was arrived at,representing the net loss of revenue that the non-development of ecotourism would incur inAmazonia.
Carbon stockingIt is difficult to quantify the forest carbon stock, above all in the Amazon forest, where a widevariety of different geographical features exist. Estimates for density cover a range between 70and 120 tons of carbon per hectare (Rovere 2000). A density of 100 tons of carbon per hectarehas been adopted here—lower than the figure of 191 tons per hectare used by Fearnside (1997)and than the 150 tons per hectare used by Andersen et al. (2001). This probably better repre-sents the average density of the region, considering that in the transitional areas (with less bio-mass) deforestation is more pronounced.
There is also considerable argument about the actual value of a ton of carbon. The smallerestimate of $3 per ton of carbon suggested by UNCTAD (2001) is used here. The latter isderived from the most recent models which estimate the equilibrium price of carbon based on theKyoto Protocol instruments. The cost control curves for each country show a price range ofbetween US$3 and US$10 per ton.
Taking into account the average carbon density of 100 tons of carbon per hectare and a priceof US$3 per ton, the value of carbon would amount to US$300 per hectare. Since this is a pres-ent value insofar as the opportunity cost of the carbon would be payment for foregoing it in per-petuity, a discount rate of 6 percent was used to annualize it, giving an annual value of US$18per hectare—certainly a conservative estimate.32
BioprospectionThe prospect of the forest biodiversity yielding new drugs and their active principles for medicaluses has been considered as one of the main incentives for preserving the Amazon forest. Howev-er, it is difficult to estimate the value of this potential benefit because it would require knowledgenot only of the biodiversity itself but also of the economics of bioprospection. The few availablestudies that have been carried out differ radically in their estimates—anywhere between US$0.01and US$21 per ha/year (Pearce 1993). It is not intended to present here the different method-ologies used, nor the results. This study adopts the higher value put on it by Pearce (1993) ofUS$23 per ha/year, as the consumer surplus in this case seems to be closer to gains in terms ofwell-being experienced by the population groups benefited. These values have not been adjustedfor the year 2000.
Existence valueEstimates related to the “existence value” associated with preservation (non-use) of tropicalforests show a wide variety of values in the literature. The studies carried out to date tend to bebased upon contingent valuation in rich countries where people appear to be willing to pay for
32. This estimate is much lower than those adopted by Andersen et al (2001) of US$45.00 per hectareper year and Fearnside (1997) of US$70.00 per hectare per year, since both authors adopt higher values fordensity and for the opportunity cost per ton of carbon—values which were accepted at the time that thesestudies were carried out. The estimates presented are closer to the amount of net income foregone on car-bon sales and therefore capable of being absorbed in the local economy in the event of a market emerging.

54 WORLD BANK WORKING PAPER
the costs of preserving natural species and places. Horton et al. (2002) have produced the mostrecent study on the topic. The contingent valuation is applied to the specific case of the willing-ness to maintain conservation units in Amazonia detected among a sample of people in the Unit-ed Kingdom and Italy. Two possible conservation scenarios are presented, based on conservationvalues of 5 percent and 20 percent. The study identifies an annual value in the form of an addi-tional tax in each country and not a single fixed value to be allocated by an international fund.The average value estimated, combining the samples in both countries, was US$50 per ha/yearfor 5 percent of the area of Amazonia and US$67 per ha/year for 20 percent conservation. Whenthe order of the questions was inverted (first 20 percent, followed by 5 percent) the average esti-mates changed to US$36 per ha/year and US$50 per ha/year. This study used the latter, lowervalues.33
The reference suggests however that the estimated value embraces both indirect and “exis-tence” values. Moreover, only part of the forest area is valued, meaning that the measured valuecannot be applied to the deforestation of one hectare. A number of adjustments were thereforemade to these values: (i) estimating their equivalents for the rest of the world population; (ii)isolating the “non-use” value; (iii) extrapolating it to the total forest stock and (iv) aggregating itto apply to the total world population. The final result provides a value of US$31.2 per ha/year.
Summary of Estimates and Conclusions Table 22 summarizes the estimates of the economic cost of deforestation in Amazonia both invalues per hectare per year and as regards their respective present values when discounting at 10percent, 6 percent and 2 percent per annum in perpetuity. The estimate of the total value isUS$108 per ha/year. If this value were accepted by the region’s landowners, it could make sus-tainable use of the greater part of the Amazon region viable. The value is slightly higher than thatfound in the main references on the basis of the same kind of evaluation (Fearnside 1997, Torras2000, Andersen et al. 2002).
Annual Value Present Value in US$/ha
Discount rate US$/ha/yr 10% p.a. 6% p.a. 2% p.a.
Direct use value 37.7 377 628 1,884
Timber products 28.5 285 475 1,425
Non-timber products 0.2 2 3 9
Ecotourism 9.0 90 150 450
Indirect use value 18.0 180 300 900
Carbon stocking 18.0 180 300 900
Option value 21.0 210 350 1,050
Bioprospection 21.0 210 350 1,050
Existence value 31.2 312 520 1,560
Total (≈) 108 1,080 1,800 5,4005
TABLE 22: SUMMARY OF THE ESTIMATES OF THE COSTS OF DEFORESTATION
33. These differences on account of “ordering effects” cannot be analyzed by observing averages onlybut also variance components. In any event, to obtain an estimate of existence value using a decreasingscope valuation is more conservative.
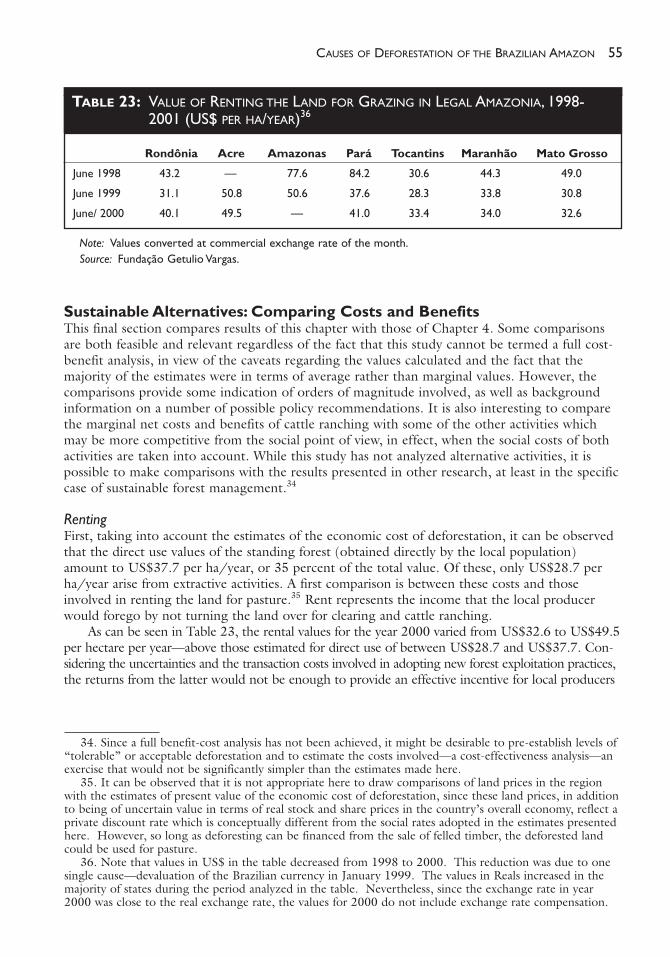
CAUSES OF DEFORESTATION OF THE BRAZILIAN AMAZON 55
Sustainable Alternatives: Comparing Costs and Benefits This final section compares results of this chapter with those of Chapter 4. Some comparisonsare both feasible and relevant regardless of the fact that this study cannot be termed a full cost-benefit analysis, in view of the caveats regarding the values calculated and the fact that themajority of the estimates were in terms of average rather than marginal values. However, thecomparisons provide some indication of orders of magnitude involved, as well as backgroundinformation on a number of possible policy recommendations. It is also interesting to comparethe marginal net costs and benefits of cattle ranching with some of the other activities whichmay be more competitive from the social point of view, in effect, when the social costs of bothactivities are taken into account. While this study has not analyzed alternative activities, it ispossible to make comparisons with the results presented in other research, at least in the specificcase of sustainable forest management.34
RentingFirst, taking into account the estimates of the economic cost of deforestation, it can be observedthat the direct use values of the standing forest (obtained directly by the local population)amount to US$37.7 per ha/year, or 35 percent of the total value. Of these, only US$28.7 perha/year arise from extractive activities. A first comparison is between these costs and thoseinvolved in renting the land for pasture.35 Rent represents the income that the local producerwould forego by not turning the land over for clearing and cattle ranching.
As can be seen in Table 23, the rental values for the year 2000 varied from US$32.6 to US$49.5per hectare per year—above those estimated for direct use of between US$28.7 and US$37.7. Con-sidering the uncertainties and the transaction costs involved in adopting new forest exploitation practices,the returns from the latter would not be enough to provide an effective incentive for local producers
Rondônia Acre Amazonas Pará Tocantins Maranhão Mato Grosso
June 1998 43.2 — 77.6 84.2 30.6 44.3 49.0
June 1999 31.1 50.8 50.6 37.6 28.3 33.8 30.8
June/ 2000 40.1 49.5 — 41.0 33.4 34.0 32.6
TABLE 23: VALUE OF RENTING THE LAND FOR GRAZING IN LEGAL AMAZONIA, 1998-2001 (US$ PER HA/YEAR)36
34. Since a full benefit-cost analysis has not been achieved, it might be desirable to pre-establish levels of“tolerable” or acceptable deforestation and to estimate the costs involved—a cost-effectiveness analysis—anexercise that would not be significantly simpler than the estimates made here.
35. It can be observed that it is not appropriate here to draw comparisons of land prices in the regionwith the estimates of present value of the economic cost of deforestation, since these land prices, in additionto being of uncertain value in terms of real stock and share prices in the country’s overall economy, reflect aprivate discount rate which is conceptually different from the social rates adopted in the estimates presentedhere. However, so long as deforesting can be financed from the sale of felled timber, the deforested landcould be used for pasture.
36. Note that values in US$ in the table decreased from 1998 to 2000. This reduction was due to onesingle cause—devaluation of the Brazilian currency in January 1999. The values in Reals increased in themajority of states during the period analyzed in the table. Nevertheless, since the exchange rate in year2000 was close to the real exchange rate, the values for 2000 do not include exchange rate compensation.
Note: Values converted at commercial exchange rate of the month.Source: Fundação Getulio Vargas.

56 WORLD BANK WORKING PAPER
to adopt them. This result has to be regarded with caution: given the uncertainty of the various esti-mates, the differences between the rent and direct use values are likely not significant.
The previous comparison is restricted to direct use values. If the indirect use value of carbonstocking were also taken into account, it would add a further US$18 per ha/year to the incomeof the local producer, making sustainable use of the forest viable. However, payments for indirectuse have yet to be incorporated into the markets to benefit local producers. The issue is one ofeconomic policy concerned with the establishment of these mechanisms (and their transactioncosts), not of the actual values involved.
The cost estimates involving both direct and indirect uses take into account relative prices andthe current forest stock. As pointed out in previous sections, it can be reasonably surmised that thevalue of timber, as well as that of ecotourism and carbon, will appreciate over time as the sourcesof such goods and services get scarcer. If development policies for the area were to take intoaccount technical training, favorable relative prices and expansion of the market for environmentalservices, the appropriation of these values by local producers (as the result of national and interna-tional initiatives) could generate an additional net annual return of almost US$56/ha of foregonedeforestation and at the same time make sustainable productive activities in the area entirely viable.
Incentives for sustainable forest use would be even greater if option and existence values werealso incorporated. If the estimated values (US$21.0 and US$31.2 per ha/year respectively) wererealistic and if international compensation instruments aimed solely at conserving the Amazonforest were created, significant monetary incentives for controlling the process of deforestationwould be generated. As in the case of indirect costs, the difficulty again revolves around the prac-tical issue of creating workable financial transfer mechanisms.
In short, the estimates presented appear to confirm that important trade-offs exist between cur-rent and sustainable use of forest land. However, to avoid that losses are totally borne by the localcommunity and to focus on such losses as a stimulus for introducing changed land use patterns, newmarket mechanisms or schemes involving international compensation need to be created, addingvalue to the environmental services of the forest that can benefit the world population as a whole.
Cattle Ranching Regarding the results of cattle ranching as practiced in the area, Chapter 4 presented a model oflinear programming focused on risk minimization, based on fieldwork estimates of the net profitsto be obtained from soybean, corn, rice and beef production. On a representative establishmentin the region (15,000 hectares with 30 percent cleared land), the model demonstrates that if therisk of cattle ranching were stochastically incorporated, a payment of at least R$45 per ha/yearwould make it feasible for the farmer to retain the forest area regardless of all other possible agri-cultural activities. In other words, none of these activities would generate an expected profit ofmore than R$45 per ha/year. If risk is ignored, the opportunity cost of forest conservation forranchers increases to as much as R$200 per ha/year, although in this extreme case land would beallocated entirely to soybeans and forests, and not to pasture.
These values need to be compared with the economic costs (excluding direct costs) in orderto evaluate required compensation from an external source and not from income arising fromalternative uses (already analyzed). In this event, the values were estimated to be R$128 perha/year,37 representing forest services for global benefit made available as the result of internationalcompensation mechanisms.38 These are average, deterministic values and should be compared
37. The R$ 128 correspond to the US$ 70.2 presented in the previous section converted to Reals at anexchange rate of US$ 1 = R$ 1.83 in the year 2000. Such conversion should consider an exchange rate risk,although the estimates are made for the year 2000, when a slightly overvalued Real prevailed. Of the R$128, R$ 33 are from carbon, R$ 38 from bioprospection and R$ 57 for “existence” of the forest.
38. Payments for private conservation services to avoid deforestation were not particularly successful inan experiment in Costa Rica, when the value of such compensations did not keep up with the opportunitycosts of cattle ranching (see Segura-Bonilla 2000).

CAUSES OF DEFORESTATION OF THE BRAZILIAN AMAZON 57
therefore with the opportunity cost of the forest in the case that ignores risks (R$200 per ha/year).But as just indicated, in this extreme case farmers would convert the entire area to soybeans andnot to cattle ranching, making comparisons difficult. The result suggests that the sum of the eco-nomic costs of deforestation may or may not cover the opportunity costs of cattle ranchers, dependingon their degree of risk aversion. In practice, such degree of risk depends on the location of theproperty and the type of activity being considered. In the more consolidated areas, with greaterpresence of agriculture, the result would not be encouraging from the point of view of environ-mental conservation. An increase of about 50 percent of the values presented here would becalled for, or the inclusion of other environmental services not valued here (indirect uses) inorder to provide enough social benefits to produce sufficient social (global) benefits to compen-sate for the farmer’s losses (note again that this is a farmer maximizing profits and choosingbetween forests, crops and cattle). In the areas where cattle predominates, the potential forcompensation based on the indirect use values is more than sufficient to cover the opportunitycosts of producers. The figures need to be taken as orders of magnitude. More careful examina-tion suggests that the values put on ranching and deforestation are relatively close. Furtheranalysis, especially regarding environmental costs, is called for in order to arrive at a firmerconclusion.
Forest ManagementRather than pure conservation, landowners might decide to opt for extracting products from thestanding forest. One possible sustainable activity in Amazonia is timber exploitation, based onrotation of cutting areas and low impact management practices. Barreto (2002) estimated thatthe net present value of sustainable timber extraction for 1998 was US$203/ha. This can becompared with the net income from cattle ranching identified in Chapter 4—in the region ofR$100 per ha/year, measured in 2002. Using the same discount rate of 8 percent as that appliedto timber and using an approximate exchange rate of R$2.50 to the US$, net present value forcattle ranching is US$500/ha. This is almost identical to that presented by Barreto for ranch-ing—more than double that to be secured from forest management. It must be emphasized thatBarreto claims that the current net values of unmanaged forest activity are practically the same asfor managed activity. Seen from any angle, forest management, unlike cattle ranching, is not afinancially attractive proposition.
This result reflects what is being observed on the ground—that cattle ranching in Amazoniais quite profitable, and that sustainable alternatives such as forest management are unable to com-pete from a private producer’s point of view. In addition to the forest management not being com-petitive, both the risk factor and the institutional set-up cannot be understated.
From the social point of view, however, since forest management leaves the forest systemlargely unaffected, the social benefits form forest services remain essentially unaltered. Thus, as inthe case of the comparison with ranching, to the net present value of US$203/ha should beadded the value of indirect use, option and existence values (US$70.4 per ha/year) which, usingan 8 percent discount rate produces a present value of US$875/ha. Added to the direct use valueof US$203, an approximate value of US$1,100/ha emerges—double the value of cattle ranching.This indicates that forest management yields larger benefits from the social point of view than cattleranching, even though ranching generates higher private financial returns. This result is crucial tothe policy recommendations put forth in the concluding chapter.
An additional observation needs to be made with regard to the competition and divergencebetween the private and social costs and benefits of cattle ranching, sustainable forest manage-ment (SFM) and unsustainable logging. While there is little contention that SFM produces asocially more desirable outcome, this study suggests that from a private perspective it cannotcompete with cattle ranching, while other studies suggest that it produces roughly the same ratesof return as unsustainable logging. While it is common to have unsustainable logging followed bycattle ranching, SFM is an exclusive activity. Therefore, SFM actually has to compete with the sumof the two activities, so that the gap between the private and social returns on forest land makes it

58 WORLD BANK WORKING PAPER
almost impossible for the socially preferable activity to be implemented without some form of govern-ment intervention.
Lastly, it should be mentioned that all the above analyses should be regarded considering thelimitations imposed by the conditions under which they are made. The proposition that sustain-able forest management is superior to cattle ranching does not mean that all forest outside ofstrict conservation units should be put into sustainable logging, because certain forest regionsmay have low returns on account of the lack of more noble species of trees or their distance frommarkets. On the other hand, the geo-ecological conditions of certain regions may be unsuitablefor cattle ranching and appropriate for sustainable logging, so that even from the private perspec-tive sustainable logging is more viable. The scale and type of ranching are other critical factors.Other production systems on a smaller scale may produce different results (Carpentier et al.1999).

59
CHAPTER 6
CONCLUSIONS ANDRECOMMENDATIONS
This section summarizes the main results and conclusions of the present study and makes anumber of policy suggestions.
Main Results: Conclusions� The basic conclusion of the study is that deforestation in Amazonia is not a classic “lose-
lose” situation characterized only by economic and environmental losses. The processinvolves a series of tradeoffs, with obvious private economic gains.
� Land-use data on Amazonia demonstrates that the main cause of deforestation in theregion is cattle ranching. Expansion of ranching since the early 1970s has been a continu-ous and inertial process.
� Remote sensing data, together with IBGE figures, suggest that the large and mid-sizeagents are primarily responsible for deforestation in the region. The smaller agents areused as labor or for helping to consolidate land holdings and their possession (the so-called “warming” process). They tend to make only a minimum direct contribution todeforestation. Moreover, deforestation by small agents is more acceptable from a socialpoint of view because it probably leads to improvements in living conditions for poorerpopulation groups, which is not the case of deforestation by larger agents.
� In spite of their different motivations, interests and economic strategies, the groups ofsocial actors on the frontier depend on each other. The profits obtained by speculators onthe newer frontiers ultimately depend on the activities of the more capitalized and profes-sional ranchers on the consolidated frontier who are determined to continue expandingtheir businesses.
� Regardless of who the original agents are, the end result of the land occupation process isalmost inevitably the establishment of ranching activities. If this were not financially viable,

60 WORLD BANK WORKING PAPER
forest conversion or deforestation would not occur on the scale on which it is occurringsince the initial agents would hardly be able to recover the costs involved in deforestingand preparing the land.
� On the speculative frontier the State has only a reduced presence. Such public authoritiesas exist are beholden to local elites with speculative interests—aimed primarily at encour-aging the opening up of new areas in order to expand their ranching activities.
� The small local actors in these areas are not particularly interested in protecting the forest.Rather, their main concern is to ensure possession of their land, to protect themselvesfrom rural violence and to confront the monopsonistic conditions that they face whenselling their product.
� The economy of the agents on the speculative frontier is based more on the sale of landthan on the returns to be obtained from ranching. In such areas, the main purpose ofcattle ranching for such people is simply to ensure property rights. As indicated in the fieldwork in the advanced frontier, the rate of return on such activities is below five percent.
� The combination of the potentially high private profitability of cattle ranching with afford-able transport costs (existence of roads) leads to deforestation. So long as geo-ecologicalconditions are favorable, there will always be pressure for road building (endogeneity) tothe point that ranchers will often themselves build the road network. If cattle ranchingwere not privately profitable, the existence of roads per se, or the roads built with moregeo-political objectives (the “exogenous roads”) would not lead to so much deforestationand land conversion. Undoubtedly, however, penetration roads built into areas with littleoccupation clearly lead to increased deforestation.
� Conditions for raising livestock in Amazonia are surprisingly favorable, mainly in thealready occupied regions, largely as a consequence of the precipitation levels, temperature,air humidity, and types of pasture.
� The rates of return on ranching itself (excluding sales of timber for example) calculated atdifferent points on the arc of deforestation, are consistently above ten percent—much high-er than those found in the rest of the country. These are not average values for the regionbut can certainly be achieved by the more professional and better capitalized ranchers.
� The level of professionalism of producers on the consolidated frontier leaves no doubt asto these agents’ concern with the constant need to modernize, expand markets, improveproduction expertise, and to employ pasture and animal management techniques—in otherwords, to stay competitive through greater efficiency.
� There are few doubts as to the sustainability of production (understood only in the senseof the feasibility of maintaining the activity over a long period). However, it would bepremature to be overly optimistic, given the limited time that cattle ranching has beenpracticed in the region. Our study pointed to a number of positive as well as negative fac-tors that could affect productivity over the longer term. Despite the uncertainties it seemsto be a fair assumption that cattle production is increasingly sustainable in the region.
� In the short term, there appears to be no trend pointing towards a decline of the expan-sion of the cattle ranching frontier into native forest—at least in the areas with productionconditions similar to those analyzed in the study. Even without government subsidies, theprofitability of the ranching sector is the driving force behind the inertial process.
� Agriculture cannot compete with cattle ranching in the forest areas. Geo-ecological barriersare in general more restrictive in the case of agriculture. A prime example is the high pre-cipitation in certain areas (above 2000 mm/year). In the areas with less than 2000 mm/yearrainfall, it is one of the factors which most favors ranching, which is precisely why it pre-dominates in such areas.
� In the course of examining representative establishments on the consolidated frontier, thestudy obtained economic and financial information and developed simulation models ofranching activities, demonstrating that the producers are averse to risk and tend to avoid
CAUSES OF DEFORESTATION OF THE BRAZILIAN AMAZON 61
specialization, preferring to work with a combination of crops, pasture and forest wherethey are each possible.
� The simulations show that established producers would be prepared to accept relativelylow sums (R$45 per ha/year) as compensation for foregoing expansion into the forest ofcultivated areas. These amounts could be as high as R$200 per ha/year in cases wherethere is no risk aversion (in which case producers would convert forest to agriculture, andnot to cattle ranching, under the model’s assumptions).
� The simulations made of charging taxes on deforestation suggest that the imposition of aUS$15-20 per ha/year tax would not reduce significantly the deforested areas: producerswould tend first to change the mix of crops, as opposed to reducing the amount of forestclearance. The two policies are equivalent, and differ with respect to who bears the costs.
� Government subsidies and credits for cattle ranching tailed off significantly in the 1990s,but this had virtually no effect on deforestation. Currently, such incentives cannot be con-sidered any more as relevant factors which explain the deforestation process in Amazonia.The preferential FNO remains a social program which, despite the difficulties, has led toimprovements for certain small producer sectors.
� Since 1970, regional income has risen substantially. Rural income per capita in particulartripled on average from US$410 in 1970 to US$1,417 in 1995. In the states with thehighest deforestation rates, the increase was even higher.
� Increased per capita rural income does not necessarily translate into quality of life improve-ments for the poorest local population groups. The social gains observed during the pastthree decades in the region are difficult to interpret from available data. Socio-economicindicators show there has indeed been significant progress but it has been insufficient toreduce the gap in relation to the rest of the country (see annex).
� Moreover, the largest slice of regional income originated in the urban as opposed to ruralsectors, which suggests that improvements in social conditions probably had little directlink with deforestation. When calculating social benefits, therefore, improvements in Ama-zonia cannot be credited predominantly to deforestation. Private benefits from large scalecattle ranching are mostly exclusive, probably having contributed little to alleviate socialand economic inequalities. The available data does not allow for firmer conclusions—thereis indeed a good case for conducting additional research on this specific topic.
� The study notes, however, that there have been social benefits that go beyond the sectoraland regional boundaries. At the national level, cattle ranching in Amazonia has allowedbeef prices to consistently fall in the last 5 years, when 100 percent of the growth of thenational herd took place in the states of Pará, Mato Grosso, and Rondônia—the threechampions of deforestation in the Amazonia. At the same time, beef exports jumped from350,000 tons in 1999 to 900,000 in 2002, representing nearly US$1 billion in foreignexchange earnings.
� The social costs of deforestation were estimated to be around US$100 per ha/year. Thisvalue is open to doubts, arising from the constraints imposed by the methodologies usedin environmental valuation and the limitations of the data available. However, the valueexceeds the potential income to be derived from cattle ranching per hectare and couldform a basis for compensation purposes. Since transfer mechanisms do not exist whichwould make such compensation feasible, the main point at issue is the private profitderived from cattle ranching—which is entirely positive and which, as the study suggests,constitutes the key factor explaining the deforestation process in Brazilian Amazonia.
� In comparison with sustainable forest management (SFM), ranching is more economicallyviable from the private point of view, although we must be cautious with a definite conclusion.It is also a low-risk venture according to the overwhelming evidence from farm interviews.SFM on the other hand is a poorly disseminated and rather “sophisticated” technique thathas to compete with both unsustainable logging as well as cattle ranching (since cattle

62 WORLD BANK WORKING PAPER
ranching can and typically does succeed unsustainable logging, the total return on the landis the sum of the returns of the two activities). SFM excludes other land uses, which makesit even more difficult to compete with the traditional activities. This may largely explainthe ongoing deforestation and the expansion of ranching activities in the region.
� However, from the social point of view the study suggests that a higher economic benefitcan be obtained from SFM. Sustainable forest management can also be assumed to bebetter from an environmental and social standpoint (despite some skepticism with regardto the later by Wunder 2001). An institutional set-up to change such scenario is currentlymissing.
� Finally, the various analyses carried out in the course of the study need to be viewed incontext—mainly as regards the private economic viability of ranching which, in principle,is valid only in the areas studied and under specific conditions. The key conditions are thelevel of professionalism of the ranchers, the amount of rainfall and most importantly thescale of production (size of holdings). This last factor is critical for the viability, and thusfor the expansion of cattle ranching in Amazonia. At the local level, a number of resultscould diverge from those presented in the present study.
RecommendationsThe following recommendations are based on the results of the study. The main objective is tosupport sustainable development policies for the region. Unless otherwise noted, the recommen-dations apply equally to the Brazilian Government and the World Bank, in view of the congruityof their objectives.
Information and PlanningDrawing up and agreeing on sustainable development strategies requires the identification of theprincipal social agents, and of their manifold and conflicting interests and motivations. This studysuggests that a fundamental step in this direction would be to accept the thesis that cattle ranch-ing in Amazonia is a potentially profitable activity for producers and that profitability is the basicdriving force behind the deforestation process in the region. This implies, furthermore, acknowledg-ing that tradeoffs exist in the process of deforestation in Brazilian Amazonia.
Forest protection policies should as a priority perhaps be aimed at producers on the consolidatedfrontier who are the driving force of the process and not merely at those on the speculative frontier.Obviously, this does not mean that there should be no effort to enforce the law and control theillegal operations of the agents on the speculative frontier. But the weak presence of governmentauthorities, together with the low degree of risk aversion of these agents, suggests that the focusof policies should be concentrated upon the more professional agents operating on the consoli-dated frontier.
The strategy should be to work with cattle ranchers and not against them. While a large propor-tion of these agents may not be prepared or willing to negotiate, there are more amenable lead-ers interested in some sort of compromise with the government and society in order to havetheir activities legalized. Because many of those have close links with municipal governments inthe region, the latter could perhaps represent them or at least participate in the negotiatingprocess. This might be a good opportunity for the new federal administration (and possibly alsofor the states).
The authorities responsible for protection of the Amazon forest should increase their focus onranchers as agents of deforestation. Currently, little attention is paid to cattle ranchers in compari-son with loggers. Control over the loggers is fundamental not in terms of deforestation per se butbecause sustainable forest management represents the principal alternative activity to ranching inAmazonia capable of competing on the same scale. Disorderly, predatory and predominantly ille-gal timber extraction as currently practiced should be fought not only on account of its illegalitybut because it excludes the possibility of present or future implantation of an activity which

CAUSES OF DEFORESTATION OF THE BRAZILIAN AMAZON 63
would be better than cattle ranching as being sustainable from an economic, social and environ-mental point of view.
Zoning could be used as a negotiating process between the economic agents (including cattleranchers) and the government, leading gradually to compromised land occupation in regions andareas which are suitable from a social, economic and environmental point of view. The WorldBank has for a number of years supported zoning initiatives throughout the region and shouldcontinue to concentrate on their practical application, continuous updating and revision, and inparticular on the process of negotiation between the participating actors. It should be emphasizedthat the small agents who are identified here as being of lesser importance to explain deforesta-tion in Amazonia, should not be sidelined from this process. On the contrary, because they are themain target for sustainable development, they should also participate in the process of determiningregional development strategies.
Since a great deal of ignorance and uncertainty exists about the various factors and effectsassociated with the deforestation process and the expansion of the frontier, the risks involved sug-gest the adoption of conservative strategies. The heritage at risk in Amazonia should not be endan-gered by irreversible decisions involving high social, economic and environmental costs. Thus,conservation initiatives being implemented should be encouraged. The World Bank continues tosupport such initiatives through the ARPA, PROBIO and PROARCO Projects, and various proj-ects supported by the Pilot Program (Redwood 2002).
Among the most important factors analyzed in this study and on which it will be importantto increase our knowledge are the environmental values and services of the forest (the social costs ofdeforestation), both with regard to technical information on the complex ecological effects aswith regard to environmental valuation. This should include studies of the possible social benefitslinked with them (that is, up to what point can improvements in socio-economic conditions in theregion over the past few decades be directly or indirectly attributed to deforestation).
It is perhaps of equal importance to analyze more thoroughly the effects of transport costs ondeforestation. This is important for evaluating both the possible effects of the Avança Brasil Pro-gram on deforestation, as well as the effects of smaller feeder roads, particularly in the more con-solidated frontier. Such roads may enhance intensification but their final impact in terms of defor-estation is less clear. The study also suggests that local roads should be understood more asendogenous to the deforestation process and not as something decided exogenously to localagents.
Economic InstrumentsCreation of tradable development rights. A more flexible handling of the legal reserve requirementsin private properties could yield enormous ecological and economic rewards. There is no reasonwhy certain areas—typically the most fertile and productive areas—should not be allowed to ben-efit from higher percentages of deforestation provided that this is compensated with additionallegal reserves in the ecologically richer areas. These areas could be indicated by zoning, and inprinciple there should be sufficient flexibility for tradable rights to be applied in other ecosystemsand water basins, provided that certain rules of ecological endemism and other explicit and bind-ing technical parameters are respected. Strict compliance with current law will be very difficult,involve enormous costs and yield doubtful environmental benefits: it would be unrealistic toexpect that the properties in the cerrado of southern Mato Grosso, for example, will totally fulfilltheir legal reserve obligations. As an alternative, it may be of interest to require local producers(possibly acting in consortia) to compensate for reduced legal reserves with even larger areas inother ecosystems on the cerrado. The pilot experiment in Paraná is an example that might also beapplied in Amazonia. It would be a question of perfecting the mechanism in the context of theForest Code.
One of the classic economic solutions to the problem is to tax deforestation so as to force agents tointernalize the environmental costs. The taxation simulations made for this study suggest that hightaxes are necessary to reduce forest clearing significantly, but further studies need to be done to

64 WORLD BANK WORKING PAPER
better evaluate the instrument under conditions different from those analyzed here. Taxes couldbe introduced in the context of the proposal to create an environmental contribution(contribuição ambiental) included in the latest tax reform proposal submitted by the Federal Gov-ernment to the National Congress.
A theoretically equivalent alternative to taxation is to compensate agents for not deforesting(although the political implications of who pays are very different). The simulations suggest thatestablished cattle ranchers would be prepared to accept relatively small sums for foregoing newdeforestation, depending on their level of risk aversion. From a national point of view alone, legalprecedents exist in Brazilian legislation where royalties are paid in the cases of oil extraction andthe flooding of areas for the construction of hydro power dams. The values paid are not calculat-ed on the basis of a rigorous monetary evaluation of the environmental costs, and there is noreason for not introducing the same as a form of compensation for the loss of biodiversity and ofthe innumerable forest environmental services.
In addition to the national interest, the international community also benefits from the envi-ronmental services of the forest. The study showed that the sum of national and internationalbenefits may be higher than the returns from cattle ranching. However, transfer mechanisms donot yet exist in practice and serious technical and political difficulties need to be confronted inorder for them to be implemented. The few experiences in other countries are not particularlyencouraging. In spite of the difficulties, the World Bank probably has a role to play in assistingthe Brazilian government to identify international initiatives and partners which could help todesign the transfer mechanisms just mentioned. This would also be an appropriate role for theinternational donor community, given its concern with deforestation in the region.
The search for sustainable alternatives has been limited to forest management and small scaleone-off initiatives, some of them socially, economically and environmentally superior to cattleranching. These efforts should continue, keeping in mind, however, that while superior, they havenot been able to compete in terms of scale with cattle ranching and have mostly remained at thetrial level. The available scientific and technological resources applied to the region have beeninsufficient for obtaining greater knowledge and disseminating existing experiences. The FederalGovernment and the World Bank, through the Rain Forest Pilot Program, could play a greaterrole as catalyst in the dissemination of information.
The World Bank should review its conservative approach adopted in relation to Amazonia overthe past decade and focus more on the promotion of sustainable development. This does not meanabandoning support to conservation but rather making the two approaches complementary. Pro-moting productive activities with high social and economic benefits could, with low environmen-tal impacts (or even none at all), represent alternatives of major interest for development of theregion. Approval of a project in support of the National Forest Program (under discussion withthe Federal Government) would be an excellent step in this direction.
The fiscal incentives which benefited larger landholders have been reduced and now tend tobe better applied. Social programs such as the preferential FNO and the INCRA settlement projectscould bring higher ecological and social gains, particularly for poorer and less well qualifiedlandowners. The marriage of interests between environmental protection and support for tradi-tional local populations is one of the top socio-environmental concerns of the new federal admin-istration and should be given every support.
Other economic instruments which have been the subject of discussion for some time amongMMA (Environment Ministry), IPEA and World Bank officials include (see Seroa da Motta et al.2000, Haddad and Rezende 2001): (i) the introduction of the ecological value-added tax(ICMS) following its successful implementation in some states (it is in the course of beingimplanted in Rondônia and Mato Grosso)—protection of areas of native forest could be one ofthe criteria for compensating municipalities in the calculation of the municipal value added; (ii)the introduction of environmental criteria similar to those of the ecological ICMS in the Statesand Municipalities Participation Fund (Fundo de Participação dos Estados e Municípios—FPE andFPM); (iii) reorientation of the criteria governing award of fiscal or credit subsidies to promote

CAUSES OF DEFORESTATION OF THE BRAZILIAN AMAZON 65
sustainable activities, development of sustainable technologies and scientific research; (iv) intro-duction of environmental criteria in the concession of agricultural credit in the region; (v) review-ing and eliminating existing subsidized credits for traditional cattle ranching in Amazonia.
Enforcing the LawWhatever the economic incentives, they will certainly call for greater enforcement capacity. This isbound to be a major uphill struggle owing to the immense size of the region and the difficulties ofworking with the local agents. No matter how much political determination exists, it will alwaysbe difficult to stem the inertial trend observed over several decades. The balance between factorsthat in the future could favor even more cattle ranching in Amazonia over those that couldimpede it probably favors the former. However, the combination of market mechanisms and com-mand and control is probably still insufficient to slow down or halt, in the short term, a processwhich has been observed over so many years. This further reinforces the need for negotiatedsolutions which take the cattle ranchers into account.
To ensure more effective action an institutional cooperation strategy is fundamental. Institutionssuch as the MMA, IBAMA, ADA, the Ministry for Regional Development (Integração Nacional),the Ministry of Planning, INCRA, FUNAI, and state governments need to work together, agree-ing on common targets and defining individual functions. A clear and transparent identification ofobjectives and responsibilities is vital for each institution to have the appropriate incentives and tobe accountable for its own performance.
Finally, in spite of the political difficulties, the process of conceding property rights needs to beurgently and seriously reviewed and audited. It is difficult to identify without a closer study thenetwork of interests involved. The results—frequently associated with violence and fraud—arewell known, but could be reverted if the agencies dealing with land occupation and propertyrights were to perform more effectively, bringing order to land use once and for all, protectingand lending support to small producers and guaranteeing the integrity of public land and of thenatural and social heritage of the region. The speculative gains are colossal, and the key stage inthe process is the regularization of property rights. There is no reason why the Federal Govern-ment, working in partnership with the states, could not take energetic action on this issue.


67
ANNEX
SOCIOECONOMIC DEVELOPMENTIN BRAZILIAN AMAZONIA
This Annex analyzes the evolution of selected socioeconomic indicators of BrazilianAmazonia in an effort to assess possible social gains associated with the process ofdeforestation and land occupation and the overall economic development of the
region. Most of these changes result from a combination of factors, some of which could bedirectly or indirectly linked to deforestation and subsequent agriculture and cattle ranchingactivities; others are not connected to them. Because it is too difficult to establish causalitiesmore firmly, it was decided to present these indicators independently and not as potentialbenefits from deforestation.
The analyses were conducted at the municipal level based on IBGE census data. Analyses atthe municipal level may be too aggregated to permit precise evaluation of the social welfareaspects of local populations and to make comparisons of the changes within the municipalitiesand between one municipality and another over time. Nonetheless, the municipal data providedby IBGE is useful basic information, essential for trying better to understand the evolution of thelocal population’s social and economic conditions.
Figure A1 shows the evolution of the percentage distribution of the population of LegalAmazonia, according to municipal income (GDP) per capita for the census years between1970 and 1995, comparing it with per capita income for the whole of Brazil during the sameperiod. The figure demonstrates that there was a significant improvement in income levels ofthe population of Amazonia over the past three decades. In 1970, about 75 percent of thepopulation of Amazonia had a per capita income of less than US$1000. This percentage grad-ually declined over subsequent years, reaching a low point of 30 percent in 1995. Comparedwith the whole country, in 1970, 100 percent of the population of Amazonia lived in munici-palities with an income of less than the national average, whereas the percentage fell back to

68 WORLD BANK WORKING PAPER
90 percent in 1980 and to 80 percent by 1995, representing a not insignificant improvementin income levels.39
From the temporal point of view, the figure shows a substantial improvement in per-capitaincome levels between 1970 and 1980, a period during which the Brazilian economy grew rapid-ly. From 1980 onwards, the economy stagnated and per-capita income improvements in Amazo-nia slowed down (and even receded slightly in some of the poorer municipalities). Nevertheless,over the same period, 80 percent of the region’s population benefited significantly from rises inper-capita income, especially when compared with the almost imperceptible improvements atnational level.
Figure A2 shows the incidence of poverty among the population of Amazonia. This suggeststhat poverty indices improved appreciably in the 1970s and 1980s. As with per capita income, theproportion of the population groups with insufficient income worsens during the 1980s. Thiscould be partly due to the fact that 1980 represented a year of peak growth (due to negative realinterest rates, a civil construction boom, etc.) and 1991 a year of stagnation caused by a declinein economic activity which followed sequestration of assets under the Collor Plan. Because morerecent figures are not available, it is difficult to draw more definitive conclusions regarding pover-ty reduction in the region. The improvements observed in Legal Amazonia were very much areflection of those observed throughout Brazil as a whole.
In addition to income, other socio-economic indicators were studied. Figures A3, A4 and A5show the evolution of three classic indicators (life expectancy, infant mortality, and illiteracy rates).They follow the same format, and the interpretations are roughly similar. Figure A3 suggests, forexample, that in 1970, 60 percent of the local population lived in municipalities where life
FIGURE A1: ACCUMULATED DISTRIBUTION OF MUNICIPAL POPULATION IN LEGAL AMAZONIAACCORDING TO GDP PER CAPITA, 1970-1995 (IN CONSTANT 1995 US$)
0
20
40
60
80
100
1,000
GDP per capita (1995 US$)
% p
op
ula
tio
n o
f A
ML
197198198199Brazil 1970Brazil 1980Brazil 1985Brazil 1995
100,000
Source: IBGE, drawn by IPEA.
39. The figure implies that 15 municipalities in 1995 had a higher income than the national average.These in fact are not municipalities but Minimum Comparable Areas (MCA), as introduced in Chapter 3.Some of the municipalities have much greater weight than others in the same MCA. The 15 MCA with anincome above the national average include 5 state capitals—Belém, Manaus, São Luis, Cuiabá and Rio Bran-co, 5 in the south of Mato Grosso and Tocantins (General Carneiro, Alto Graças, Itiquira, Alto Araguaia,São Miguel do Araguaia), in addition to Paragominas, Santa Isabel, Afuá and Almerim (Pará) and Bacarena(Maranhão).

CAUSES OF DEFORESTATION OF THE BRAZILIAN AMAZON 69
expectancy was 52 years. In 1991, the same 60 percent of the population lived in municipalitieswith a life expectancy of 63 years. The figure also demonstrates that life expectancy increased inthe region at a relatively slower rate than the national average: in 1970 and 1980, 60 percent ofthe municipalities of Amazonia experienced lower life expectancy rates than the national average;this percentage increased to around 75 percent by 1991.40
Infant mortality (Figure A4) declined significantly over the period under study. In 1970, fiftyper cent of the local population inhabited municipalities with 120 infant deaths per 1,000 live
FIGURE A2: ACCUMULATED DISTRIBUTION OF MUNICIPAL POPULATION IN LEGAL AMAZO-NIA, ACCORDING TO POPULATION WITH INSUFFICIENT INCOME, 1970-1991
0
20
40
60
80
100
10 100% of population with insufficient income
% p
op
ula
tio
n o
f A
ML
197019801991Brazil 1970Brazil 1980Brazil 1991
Source: IBGE, drawn by IPEA.
40. One possible explanation for this trend is the fact that the proportion of the rural population in LegalAmazonia exceeds the national average and is moreover highly vulnerable to tropical diseases.
FIGURER A3: AVERAGE LIFE EXPECTANCY IN MUNICIPALITIES OF LEGAL AMAZONIA, 1970-91
0
20
40
60
80
100
40 50 60
Average Life Expectancy in Municipalities (years)
% o
f P
op
ula
tio
n o
f L
egal
Am
azo
nia
197019801991Brazil 1970 Brazil 1980 Brazil 1991
70
Source: IBGE, drawn by IPEA.

70 WORLD BANK WORKING PAPER
births. In 1991 the proportion fell to 50 deaths per 1000 live births. During the 1970s, theregion experienced faster improvement in this respect than Brazil as a whole, although this wasnot the case in 1991. In 1970, 55 percent of the population lived in municipalities with infantmortality rates of less than the national average, whereas the percentage increased to 65 percentin 1980, and declined to just under 50 percent in 1991.
Finally, Figure A5 shows that the evolution of illiteracy rates practically equaled that of thecountry as a whole. Throughout all the periods observed, around 35 percent of the populationlived in municipalities in Amazonia that had illiteracy rates of less than the national average.However, while in 1970 half the population lived in municipalities with illiteracy rates of over 45percent, by 1991 the same proportion of the population lived in municipalities where the ratehad fallen back to 25 percent.
The data in Figures A1-A5 suggest that social and economic conditions improved for thelocal population, although certain caveats apply. The graphs suggest furthermore that the region’simprovements generally reflected the improvements registered in Brazil as a whole and were notsignificant enough to narrow the gap in relation to the rest of the country.
As regards income sources, the above data could in effect mask a possibly more substantialcontribution made by the urban sectors. From 1985 onwards, the GDP of Legal Amazonia beganto reflect a significantly larger contribution of income derived from urban as opposed to ruralareas (see Table A1). The data suggest that the social improvements indicated by the previousgraphs might not be linked to deforestation.
The Table suggests the possibility that recent socio-economic improvements in the region arederived not so much from cattle ranching but from the urban sectors. It is not possible, however,to state conclusively that this is the case on the basis of the data consulted. It could be said, withsome justification, that many of the improvements were also due to the ranching sector.41 Ander-sen et al. (2002) suggest that urbanization in the region was driven, in turn, by the expansion of
FIGURE A4: INFANT MORTALITY IN MUNICIPALITIES OF LEGAL AMAZONIA (DEATHS PER1000 LIVE BIRTHS)
0
20
40
60
80
100
0 25 50 75 100 125 150 175 200 225
Infant Mortality Rate in Municipalities (per 1000 Live Births)
% o
f P
op
ula
tio
n o
f L
egal
Am
azo
nia
197019801991Brazil 1970Brazil 1980
Brazil 1991
Source: IBGE, drawn by IPEA.
41. It is worth noting that despite the precise definition of IBGE, the concept of “urban” in Amazoniamust be analysed with caution: since the minimum size of a city is the same as in the rest of the country, the“cities” in Amazonia have a much stronger link with rural areas and agriculture and cattle ranching activitiesthan the Center-South of the country. Therefore, what is eventually considered as urban population orincome may in fact be rural.

CAUSES OF DEFORESTATION OF THE BRAZILIAN AMAZON 71
the cattle ranching sector. In the case of income from the livestock sector, it would be interestingto make a distinction between income generated by larger ranchers from that earned by smalleroperators—the former no doubt disposed of their earnings in a variety of ways, while in the caseof the small ranchers it is a reasonable assumption that the bulk of their earnings was directedwholly towards improving their own living standards (Haan et al. 2001)—in other words, oppor-tunities for “social mobility.”
The available data also show that the socio-economic improvements were sufficient only tokeep up with improvements recorded in the rest of the country. Changes in relative poverty levelsin the Amazon compared with the south of the country point to a certain degree of progress, inso-far as the inter-regional gap has not widened. However, there is no cause for celebration as theregion continues to lag behind the rest of Brazil in terms of average socioeconomic conditions.
FIGURE A5: CUMULATIVE DISTRIBUTION OF THE MUNICIPAL POPULATION OF LEGALAMAZONIA, ACCORDING TO ILLITERACY RATES, 1970-91
0
20
40
60
80
100
0 10 20 30 40 50 60 70 80 90 100
Illiteracy Rates in Municipalities (% of Adult Population)
% o
f P
op
ula
tio
n o
f A
ML
1970 1980 1991Brazil 1970Brazil 1980Brazil 1991
Source: IBGE, drawn by IPEA.
Population (1000 inhab.) GDP (1995 US$ million) Per capita GDP (1995 US$)
Rural Urban Rural Urban Rural Urban
1970 4,589 2,674 1,606 4,243 349 1,586
1975 5,263 3,631 2,460 7,535 467 2,075
1980 6,092 5,112 4,192 16,561 688 3,239
1985 6,638 6,531 5,215 23,710 785 3,630
1990 NA NA NA NA NA NA
1995 7,000 10,692 9,882 33,948 1,411 3,175
Source: IBGE, drawn by IPEP.
TABLE A1: EVOLUTION OF RURAL AND URBAN POPULATIONS, GDP AND GDP PERCAPITA IN LEGAL AMAZONIA, 1970-95

73
REFERENCES
Almeida, A.L.O. and J.S. Campari. 1993. Sustainable Settlement in the Amazon. Education and Social PolicyDepartment, The World Bank, Washington D.C.
Almeida, O. T. and C. Uhl. 1995. “Identificando os custos de usos alternativos do solo para o planejamentomunicipal da Amazônia: o caso de Paragominas (PA).” In P. May, ed., Economia Ecológica. Rio deJaneiro: Ed. Campus.
Alves, D. 2000. “Distribuição Espacial do Desflorestamento na Amazônia Legal.” Prepared for Secretaria deCoordenação da Amazônia do Ministério do Meio Ambiente, São José dos Campos.
Alves, D. 2001. “Space-Time Dynamics of Deforestation in Brazilian Amazônia.” Draft, INPE, São Paulo.
Alves, D., W.M. Costa, M.I.S. Escada, E.S.S. Lopes, R.C.M. Souza, and J.D. Ortiz. 1997. “Análise dasTaxas de Desflorestamento dos Municípios da Amazônia Legal nos períodos 1991-1992 e 1992-1994.”Relatório Técnico AMZ-R02/97. Ministério da Ciência e Tecnologia, Ministério do Médio Ambiente,dos Recursos Hídricos e da Amazônia Legal. Brasília.
Andersen, L.E. 1997. “A Cost-Benefit Analysis of Deforestation in the Brazilian Amazon.” IPEA, TextoPara Discussão No. 455, Rio de Janeiro.
Andersen, L.E. and E.J. Reis. 1997. “Deforestation, Development, and Government Policy in the BrazilianAmazon: an Econometric Analysis.” Texto Para Discussão No.513, Rio de Janeiro.
Andersen, L.E., C.W.J. Granger, E.J. Reis, D. Weinhold, and S. Wunder. 2002. The Dynamics of Deforesta-tion and Economic Growth in the Brazilian Amazon. London: Cambridge University Press.
Andrae, S. and K. Pingel. 2001. “Rain Forest Financial System: the Directed Credit Paradigm in the Brazil-ian Amazon and its Alternative.” Mimeo, Institute of Latin American Studies, University of Berlin.
Angelsen, A. and D. Kaimowitz. 2001. Agricultural Technologies and Tropical Deforestation. Cabi Publishing(UK) and CIFOR (Indonesia).
Arima, E. 2000. Incentivos Fiscais e de Crédito para Pecuária na Amazônia Legal. Instituto do Homem eMeio Ambiente na Amazônia, Belém, Pará.

74 WORLD BANK WORKING PAPER
Arima, E. and C. Uhl. 1996. Pecuária na Amazônia Oriental: Desempenho Atual e Perspectivas Futuras.IMAZON, Série Amazônia No.1, Belém, Pará.
Arima, E. and C. Uhl. 1997. “Ranching in the Brazilian Amazon in a National Context: Economics, Policy,and Practice.” Society and Natural Resources 10(5): 451-433.
Barros, G.S.C., S. Zen, M.R.P. Bacchi, S.M. Ichihara, M.Osaki, and L.A. Ponchio. 2002. Economia daPecuária de Corte na Região Norte do Brasil. CEPEA/ESALQ-USP, Piracicaba, São Paulo.
Barreto, P. 2002. “Estudos sobre manejo florestal na Amazônia Brasileira.” Relatório Técnico, BancoMundial, Brasília.
Becker, B. 1999. “Cenários de Curto Prazo para o Desenvolvimento da Amazônia.” Cadernos do NAPIAm,No.6, Brasília.
Binswanger, H.P. 1991. “Brazilian Policies that Encourage Deforestation in the Amazon.” World Develop-ment 19(7): 821-829.
Browder, J.O. 1988. “Public Policy and Deforestation in the Brazilian Amazon.” In R. Repetto and M.Gillis, eds., Public Policy and the Misuse of Forest Resources. Cambridge University Press.
Carpentier, C.L., J. Witcover, and S.A. Vosti. 1999. “Smallholder Deforestation and Land Use: A Baseline.”Draft Technical Note, OED, World Bank, Washington, D.C.
Castro, E.R., R. Monteiro, and C. P. Castro. 2002. “Atores e Relações Sociais em Novas Fronteiras naAmazônia: Novo Progresso, Castelo de Sonhos e São Félix do Xingú.” Background paper to the presentreport. Belém.
Castro, N.R. 2002. “Um Programa de Cálculo dos Custos de Transporte no Brasil.” Database unpublishedobtained directly from the author.
Cattaneo, A. 2001. “A General Equilibrium Analysis of Technology, Migration and Deforestation in theBrazilian Amazon.” In A. Angelsen and D. Kaimowitz, eds. Agricultural Technologies and Tropical Defor-estation. CIFOR, CABI Publishers.
CEPEA/ESALQ/USP 2003. “Cadeia Agroindustrial de Carne Bovina.” In Indicadores CEPEA (CEPEAwebsite: http://cepea.esalq.usp.br).
Chomitz, K. and T.S. Thomas. 2000. “Geographic Patterns of Land Use and Land Intensity.” World Bank,Development Research Group, Draft Paper, Washington, D.C.
Costa, F.G. 2000. “Avaliação do Potencial de Expansão da Soja na Amazônia Legal: uma Aplicação doModelo de Von Thünen.” Dissertação de Tese de Mestrado, Escola Superior de Agricultura Luiz deQueiroz (ESALQ), Universidade de São Paulo, Piracicaba.
Cropper, M., C. Griffith, and M. Muthukumara. 1997. “Roads, Population Pressures and Deforestation inThailand, 1976-89.” Policy Research Working Paper 1726, World Bank, Washington, D.C.
Diewald, C. 2002. “Notas sobre Políticas Públicas para o Brasil: Opções de Desenvolvimento e Conservaçãopara as Florestas do Brasil.” Banco Mundial, Brasília.
Faminow, M.D. 1998. Cattle, Deforestation, and Development in the Amazon: an Economic, Agronomic andEnvironmental Perspective. Oxford University Press.
Faminow, M.D. and C. Dahl. 1999. Smallholders, Cattle and the Internal Drivers of Deforestation in theWestern Brazilian Amazon. Department of Agricultural Economics, University of Manitoba, Winnipeg,Canada.
Fearnside, P.M. 1993. “Deforestation in the Brazilian Amazonia: The Effect of Population and LandTenure.” Ambio 22(8):537-45.
Fearnside, P. 1997. “Environmental Services as a Strategy for Sustainable Development in Rural Amazônia.”Ecological Economics 20:53-70.
Fearnside, P.M. 2001. “O cultivo da Soja como Ameaça para o Meio Ambiente na Amazônia Brasileira.” InL. Forline and R. Murrieta, eds. Amazônia 500 Anos: o V Centenário e o Novo Milênio: Lições de Históriae Reflexões para uma Nova Era. Museu Paraense Emílio Goeldi, Belém.

CAUSES OF DEFORESTATION OF THE BRAZILIAN AMAZON 75
Fearnside, P.M. 2002. “Controle de Desmatamento no Mato Grosso: um Novo Modelo para Reduzir aVelocidade da Perda de Floresta Amazônica.” Paper presented in the Seminar “Aplicações do Sensoria-mento Remoto e de Sistemas de Informação Geográfica no Monitoramento e Controle do Desmatamen-to na Amazônia Brasileira.” Ministry of Environment, Brasília.
Ferraz, C. 2001. “Explaining Agriculture Expansion and Deforestation: Evidence from the Brazilian Ama-zon—1980/98.” Texto Para Discussão No.282, IPEA, Rio de Janeiro.
Food and Agricultural Organization of the United Nations (FAO). 1981. “Los Recursos Forestales de laAmérica Tropical.” 32/6. Technical Report No. 1, Rome.
Fundação Getúlio Vargas. 1999. Desenvolvimento e Implantação de Projetos Relacionados ao Programa deAções Estratégicas da SUDAM – 1998/1999. Rio de Janeiro.
Gasques, J.G. 2001. “Gastos Públicos na Agricultura.” Texto para Discussão 782, IPEA, Brasília.
GEIPOT. 2002. Web Site www.transportes.gov.br/bit/trodo/estatistica.
Haan, Cornelis de, et al. 2001. Livestock Development: Implications for Rural Poverty, the Environment, andGlobal Food Security. Washington D.C.: World Bank.
Haddad, P. and F.A. Rezende. 2001. Instrumentos Econômicos para o Desenvolvimento Sustentável da Amazô-nia. Ministério do Meio Ambiente, Secretaria de Coordenação da Amazônia, Brasília.
Hecht, S. 1982. “Cattle Ranching Development in the Eastern Amazon: Evaluation of Development Strate-gy.” Ph.D. Dissertation. Berkeley, University of California.
Hecht, S. 1993. “The Logic of Livestock and Deforestation in Amazonia.” Bioscience 43:687-695.
Hecht, S.B., R. Norgaard, and G. Possio. 1988. “The Economics of Cattle Ranching in Eastern Amazonia.”Interciencia 13:233-240.
Homma, A.K.O. 1993. “Expansão da Fronteira Agrícola na Amazônia: Lucros Decorrem da Especulação oudo Processo Produtivo?” In Extrativismo Vegetal na Amazônia: limites e oportunidades. Belém: EMBRA-PA-Amazônia Oriental; Brasília: EMBRAPA-SPI.
Homma, A.K.O., R.T. Walker, F.N. Scatena, A.J. Conto, R.A. Carvalho, C.A.P. Ferreira, and A.I.M. Santos.1995. “Reducão dos Desmatamentos na Amazõnia: Política Agrícola ou Ambiental?” Paper presented atthe XXXIII Congresso Brasileiro de Economia e Sociologia Rural. Curitiba, Paraná.
Horton, B. et al. 2002. “Evaluating Non-users Willingness to Pay for the Implementation of a ProposedNational Parks Program in Amazonia.” A UK/Italian Contingent Valuation Study by CSERGE WPECM 02-01.
Instituto Brasileiro de Geografia e Estatística (IBGE). Various years. Yearbooks, Agricultural Censuses.
Instituto Nacional de Pesquisas Espaciais (INPE). Various years. Monitoramento da Floresta AmazônicaBrasileira. São Paulo.
Instituto Nacional de Pesquisas Espaciais (INPE). 2002. Monitoring of the Brazilian Amazon Forest by Satel-lite 2000-2001. Brasília, INPE, FUNCATE.
Kaimowitz, D. and A. Angelsen. 1998. Economic Models of Tropical Deforestation—A Review. Center forInternational Forestry Research (CIFOR), Indonesia.
Laurance, W.F., M.A. Cochrane, S. Bergen, P.M. Fearnside, P. Delamônica, C. Barber, S. D’Angelo, and T.Fernandes. 2001. “The Future of the Brazilian Amazon.” Science 291 : 438-439.
Mahar, D. 1989. Government Policies and Deforestation in Brazil’s Amazon Region. Washington, D.C.:World Bank.
Margulis, S. 2000. “Who are the Agents of Deforestation in the Amazon and Why do They Deforest?”Concept Paper, World Bank, Brasília, 2000.
Menezes, M.A. 2001. “O Controle Qualificado do Desmatamento e o Ordenamento Territorial na RegiãoAmazônica.” In Causas e Dinâmica do Desmatamento na Amazônia. Ministério do Meio Ambiente.Brasília.

76 WORLD BANK WORKING PAPER
Mertens, B., R. Poccard-Chapuis, M.-G. Piketty, A.-E. Lacques, and A. Venturieri. 2002. “Crossing SpacialAnalyses and Livestock Economics to Understand Deforestation in the Brazilian Amazon: the Case ofSão Félix do Xingú in South Pará.” Agricultural Economics, 27: 269-294.
Moreira, A. and E.J. Reis. 2002. “Determinantes e Tendências da Ocupação da Amazônia: um ModeloEconométrico.” Background paper to the present study. Rio de Janeiro.
Mueller, C. 2002. Working Paper prepared for World Bank on Cerrado.
Mueller, C.C. 1977. “Pecuária de Corte no Brasil Central—Resultado das simulações com modelos de pro-gramação linear.” In Revista de Economia Rural, SOBER. São Paulo, v.2.
Nepstad, D.C., A.G. Moreira, and A.A. Alencar. 1999. “Flames in the Rainforest: Origins, Impacts andAlternatives to Amazonian Fire.” Pilot Program to Conserve the Brazilian Rainforest. Brasília.
Nepstad, D., J.P. Capobianco, A.C. Barros, G. Carvalho, G. Murtinho, U. Lopes, and P. Lefebvre. 2000.Avança Brasil: os Custos Ambientais para a Amazônia. Belém.
Pacheco, P. 2002a. “Deforestation in the Brazilian Amazon: A Review of Estimates at the Municipal Level.”Background paper to the present study. Belém.
Pacheco, P. 2002b. “Revisiting the Role of Fiscal Incentives on Driving Livestock Expansion in the BrazilianAmazon.” Draft for Discussion, IPAM/CGIAR, Belém.
Pearce, D. W. 1991. “An Economic Approach to Saving the Tropical Forests.” In D. Helm, ed. EconomicPolicy Towards the Environment. Oxford: Blackwell.
Pearce, D.W. 1993. Economic Values and the Natural World. London: Earthscan Publications Limited.
Pfaff, A.S. 1997. “What Drives Deforestation in the Brazilian Amazon: Evidence from Satellite and Socio-economic Data.” Journal of Environmental Economics and Management 37:26-43.
Redwood, J. 2002. “World Bank Approaches to the Brazilian Amazon: the Bumpy Road Towards Sustain-able Development.” Sustainable Development Working Paper 13, Latin America and Caribbean Region,World Bank, Washington, D.C.
Reis, E.J. and S. Margulis. 1991. “Options for Slowing Amazon Jungle Clearing.” In, Rudiger Dornbuschand James M. Poterba, eds. Global Warming: Economic Policy Responses. Cambridge, MIT Press.
Santana, A.C. 2000. Agregação de Valor na Cadeia Produtiva da Pecuária de Corte no Estado do Pará.FCAP, Belém.
Schneider, R. 1991. “An Analysis of Environmental Problems in the Amazon.” Report No. 9104-BR, WorldBank, Washington, D.C.
Schneider, R. 1995. “Government and the Economy on the Amazon Frontier.” World Bank EnvironmentPaper Number 11, Washington, D.C.
Schneider, R., E. Arima, A. Veríssimo, P. Barreto, and C. Souxa, Jr. 2000. Amazônia Sustentável: Limitantes eOportunidades para o Desenvolvimento Rural. Séries Parcerias Banco Mundial – Brasil, and IMAZON.
Segura-Bonilla, O. 2000. “Forestry Policy in Costa Rica.” In M. Dore, and R. Guevara, eds. SustainableForest Management and Global Climate Change: Selected Case Studies form the Americas. Edward ElgarPublishing, Cheltenham.
Seroa da Motta, R.S. 2002. “Estimativa do Custo Econômico do Desmatamento na Amazônia.”Background paper to the present study. Rio de Janeiro.
Seroa da Motta, R., D. Nepstad, and M.J.C. Mendonça. 2001. “Custo Econômico do Uso do Fogo naAmazônia.” Mimeo. Rio de Janeiro: IPEA/Ipam.
Seroa da Motta, R., J.M.D. Oliveira, and S. Margulis. 2000. “Proposta de Tributação Ambiental na AtualReforma Tributária Brasileira.” Texto para Discussão No.738, Rio de Janeiro.
Skole, D. and C. Tucker. 1993. “Tropical deforestation and Habitat Fragmentation in the Amazon: SatelliteData from 1978 to 1988.” Science 260:1905-1910.
Superintendência do Desenvolvimento da Amazônia (SUDAM). 1995. Avaliação da Política de Incentivos

CAUSES OF DEFORESTATION OF THE BRAZILIAN AMAZON 77
Fiscais ao Desenvolvimento Regional na Área da SUDAM. Ministério do Planejamento e Orçamento.Belém.
Tardin, et al. 1982. Relatório de Desmatamento. Instituto Nacional de Pesquisas Espaciais. São Jose dos Cam-pos, Brasil.
Torras, M., 2000. “The Total Economic Value of Amazonian Deforestation, 1978-1993.” Ecological Eco-nomics 33:283-297.
Treccani, G.D. 2001. Violência e Grilagem: Instrumentos de Aquisição da Propriedade da Terra no Pará.Centro de Ciências Jurídicas, Universidade Federal do Pará e Instituto de Terras do Pará, Belém.
UNCTAD, 2001. Greenhouse Gas Market Perspectives. United Nations Foundation, New York and Geneva.
Veiga, J.B. and J-F. Tourrand. 2001. “Pastagens Cultivadas na Amazônia Brasileira: Situação Atual e Per-spectivas.” Documentos No.83, Série Embrapa-CPATU, Belém, Pará.
Veiga, J.B., R. Poccard-Chapuis, A.M. Alves, M.G. Piketty, M.C. Thales, J. Grijalva, F. Valencia, J. Rios, andJ.F. Tourrand. 2001. “A Amazônia Pode Virar uma Grande Região de Pecuária Bovinas?” Draft, Embra-pa/CPATU, Belém.
Walker, R., E. Moran, and L. Anselin. 2000. “Deforestation and Cattle Ranching in the Brazilian Amazon:External Capital and Household Processes.” In World Development 28 (4):683-699.
World Bank. 1991. “Brazil: Key Policy Issues in the Livestock Sector—Towards a Framework for Efficientand Sustainable Growth.” Agriculture Operations Division, Report No. 8570-BR, Washington, D.C.
Wunder, S. 2000. The Economics of Deforestation: the Example of Ecuador. New York: St. Martin’s Press.
Wunder, S. 2001. “Poverty Alleviation and Tropical Forests—What Scope for Synergies?” World Develop-ment 29(11).
Yokomizo, C. 1989. “Incentivos Financeiros e Fiscais na Pecuarização da Amazônia.” IPEA, Texto paraDiscussão No.22, Brasília.
Young, C.E.F. 1998. “Public Policies and Deforestation in the Brazilian Amazon.” Planejamento e PolíticasPúblicas 18:201-222.
Young, C.E.F. and J.R.B. Fausto. 1998. “Valoração de Recursos Naturais como Instrumento de Análise daExpansão da Fronteira Agrícola.” In A Economia Brasileira em Perspectiva, IPEA, Rio de Janeiro.


THE WORLD BANK1818 H Street, NW
Washington, DC 20433 USA
Telephone: 202 473-1000
Internet: www.worldbank.org
E-mail: [email protected]
ISBN 0-8213-5691-7
THE WORLD BANK
Sergio Margulis
W O R L D B A N K W O R K I N G P A P E R N O . 2 2
Cau
ses of Deforestation
of the B
razilian A
mazon
NO
.
22 Causes of Deforestation of the
Brazilian Amazon
Causes of Deforestation of the Brazilian Amazon is part of the World
Bank Working Paper series. These papers are published to communicate
the results of the Bank’s ongoing research and to stimulate public dis-
cussion.
This report suggests that, in contrast to the 1970s and 1980s when occu-
pation of Brazilian Amazonia was largely induced by government poli-
cies and subsidies, recent deforestation in significant parts of the region
is basically caused by medium- and large-scale cattle ranching.
Following a private rationale, the dynamics of the occupation process
gradually became autonomous. Among the causes of the transformation
are technological and managerial changes and the adaptation of cattle
ranching to the geo-ecological conditions of eastern Amazonia which
allowed for productivity gains and cost reductions. The fact that catle
ranching is viable from the private perspective does not mean that the
activity is socially desirable nor environmentally sustainable. Private
gains need to be contrasted with the environmental (social) costs asso-
ciated with cattle ranching and deforestation. It also is legitimate to
argue that the private benefits from large-scale cattle ranching are large-
ly exclusive, having contributed little to alleviate social and economic
inequalities. However, decreases in the price of beef in national markets
and increases in exports caused by the expansion of cattle ranching in
Eastern Amazonia may imply social benefits that go beyond sectoral and
regional boundaries.
The key policy recommendations of the study are: (i) to acknowledge the
private logic of the present occupation process of Brazilian Amazonia; (ii)
to change the focus of policies towards cattle ranchers as the key driv-
ing force of deforestation, recognizing their interests and private eco-
nomic gains; (iii) given the lack of knowledge about environmental costs
and the uncertainties associated with the irreversibility of present deci-
sions, to formulate policies aimed at halting further expansion of the
frontier in those areas which are still unaffected and encourage intensi-
fication of agriculture and cattle ranching in areas undergoing consoli-
dation.
World Bank Working Papers are available individually or by subscription,
both in print and online.
™xHSKIMBy356913zv,:;:':*:"