cbn journal of applied statistics vol.3 no.2 17 on the ... jas volume 3 number 2... · on the...
TRANSCRIPT

CBN Journal of Applied Statistics Vol.3 No.2 17
On the Development of Residential Property
Price Indices for Nigeria1
2Olorunsola E. Olowofeso, Abiodun S. Bada, Mohammed A. Bamanga,
Kufre J. Bassey and Kumafan S. Dzaan This work focuses on the development of house price indices for Nigeria, and the
estimates of the Nigerian Residential Property Price Indices on housing
characteristics are presented. Four main methods of index construction were
considered, these are hedonic regression, repeat-sales, stratification and central
price tendency methods. It was discovered that econometric methods like hedonic
and repeat sales were constraints in constructing residential property price indices
for Nigeria by the nature of the data available. Hence, the central price tendency and
the sale-based stratification methods which are internationally used measures were
applied to the available zonal-level dataset from a survey of selected urban cities
from the six geopolitical zones of the country. While the central price tendency was
used to track changes in the price of the median residential dwelling sold from one
period to another and the zonal shares of residential property prices, the sale-based
approach was used to estimate the trends in the year-on-year growth rate of
residential property price indices and the zone-wise price indices. On the whole, the
results show a reflection of changes in the composition of residential dwellings sold
in Nigeria from 2010 to 2012. The need for housing policy that will empower a
comprehensive documentation of all attributes of price determinants for evaluation of
residential property in Nigeria was emphasized.
Keywords: Central price tendency; Growth rate; Real estate market;
Residential property price index; Sale-based stratification method.
JEL Classification: C43, C81, D11, E31
1.0 Introduction
Real estate has continued to play a substantial role in man’s development. In
recent time, investors in Nigeria have begun to explore strongly into real
estate marketing and investments which often represents the single largest
investment according to Davis and Palumbo (2008), and accounts for the
1 The study was financed by the Central Bank of Nigeria (CBN). The views expressed in this
paper are that of the authors and do not reflect the position of the CBN. The authors
appreciate the inputs of S.I. Doguwa of Statistics Department and the comments of the
anonymous referees.
2 Statistics Department, Central Bank of Nigeria, Abuja – Nigeria.

18 On the Development of Residential Property Price
Indices for Nigeria Olowofeso et al.
largest share of wealth in most nations’ balance sheets, according to Baldwin
et al. (2010). In what follows, analysts, policymakers, and financial
institutions have developed keen interest in following the trends in house
prices to expand their understanding of real estate and credit market
conditions, as well as to monitor the impact on economic activity, and
financial stability and soundness, as mortgage lenders used information on
house price inflation to gauge default risk (see, for example, Alterman et al.,
1999; Bostic et al., 2009; Campbell and Cocco , 2007; Carare and Stone,
2003). In other words, understanding the pattern and nature of residential
property price dynamics has become an important element in assessing the
macroeconomic situation and outlook of the country, especially as the
bursting of housing bubbles in a number of euro area countries and the United
States has been a key contributing factor to the recent global financial crisis.
In an ideal world, a residential property price index (RPPI) would be
constructed by reference to the current and historical market prices of the
entire stock of residential dwellings, but in practice, market prices for any
particular period are only available for those dwellings that are actually traded
(sold/purchased) in the period. Such sales account form only a very small
proportion of the total housing stock in any quarter and are therefore
necessary to draw inferences about the price behaviour of the whole stock
from these small samples. The assumption behind this procedure is that the
median sales price of the houses traded each quarter is indicative of the
median price of all houses, and the standard procedure for constructing price
indices is to select a sample of representative items and to re-price the
identical items over time.
Nigeria is among the countries in the world that are yet to have a
comprehensive housing database. This, of course, has a negative effect in
constructing its monthly or quarterly house price indices, which are needed for
National Accounts compilation, and for the construction of a robust consumer
price index especially now that governments around the world are cautious
and also structuring policies in a way to tackle a crisis that might be caused
due to real estate bubbles, as well as understanding the timing and causes of
the bubbles (Velpuri and Pinna, 2012).
The intent of this paper therefore is to construct preliminary estimates of
Nigerian residential property price indices as a critical first step in monitoring
price volatility in the residential property market given that housing bubbles
CBN Journal of Applied Statistics Vol.3 No.2 19
may decrease growth returns in investments and put government policies
under severe scrutiny.
Looking from the perspective of the Central Bank of Nigeria macro prudential
regulation policy for financial stability or soundness, it also follows that the
regulatory policy allows for a wide variety of surveillance techniques to
become part of the instrumentation against banking crises, which implies both
qualitative and quantitative aspects of the financial system being monitored so
that tools such as early warning signals will form a component of the
surveillance regime. This surveillance could be distinguished at a micro bank
level as monitoring of variables relating to bank balance sheet health as well
as measures of their income and expenditures, or at a systemic level as
monitoring and tracking aggregate variables such as non-financial sector debt,
interest rates and asset prices. Two crucial alternatives are available to policy
makers in this respect: first, the central banks only responds to asset price
misalignments if they alter the path of central bank targets (inflation and the
output gap); and second, in recognition of the social costs of asset price
corrections, central banks should counteract the accumulation of asset price
imbalances irrespective of whether they are likely to impact on the short-term
paths of inflation and output. The second alternative, which requires central
banks to “lean against the wind” of asset price bubbles still remains an open
problem in Nigeria.
Moreover, since the global financial and debt crisis has drawn increased
attention towards modern banking regulation and surveillance during asset
management, the need for a comprehensive real estate indices that will
provide a full picture of the changes in the real estate market and the house
prices during real estate management as highlighted in this paper could not be
over emphasized. Section two of the focused on related literature on
residential property price index construction, while subsequent sections
include the methodology used in this study, the possible results obtained, the
implication of developing residential property price indices for Nigeria and
the concluding remarks.
2.0 Literature Review
The issue of housing bubbles, banking crises and monetary policy returned to
the fore with the subprime crisis, where the financial crisis in countries such
as the U.S was triggered by the collapse of house prices, operating
domestically via losses on banks’ balance sheet and globally via securitized

20 On the Development of Residential Property Price
Indices for Nigeria Olowofeso et al.
housing loans (Davis et al., 2011). A report by the U.S. Congressional Budget
Office (2007) showed that during the house prices surge of the 1990s and
2000s, consumer spending grew faster than incomes. Thus, household wealth
effects generally lead to increases in spending by consumers on home
renovations and repairs in addition to increased spending on other goods and
services. The connection between the house prices and banking crises was
first established in the seminal work of Kaminsky and Reinhart (1999). Since
then, specific linkages between house price dynamics and banking crises have
been discussed inter alia by Reinhart and Rogoff (2008), and empirically
quantified by Barrell et al. (2010a).
As a case in point, there have been recommendations by financial regulators
to focus on housing indicators from an early stage in the development of
macro prudential surveillance (Davis et al., 2011). Such recommendations
include the monitoring of residential house prices down to a sectoral level due
to the high concentration of banks’ asset portfolios in this market and their
exposure to boom and bust cycles which motivated the need for this study as a
critical first step to accomplish this task.
The October 2009 Report to the G-20 Finance Ministers and Central Bank
Governors on the Financial Crisis and Information Gaps described data on
residential dwellings and their associated price changes as critical ingredients
for financial stability policy analysis (IMF, 2009). This is because central
banks often relied on movement in house price indices to monitor households’
borrowing capacity and debt burden, and their effects on aggregate
consumption, for monetary policy formulation (Diewert, 2009a; Finocchiaro
and Queijo, 2007).
There are many areas of society where individuals or organizations used
residential property price indices (RPPIs) directly or indirectly either to
influence practical decision making or to inform the formulation and conduct
of economic policy (Gudnason and Jónsdóttir, 2009; Gelfand et al., 2004).
But the idea of a more detailed research on property price indices dates back
to a workshop organized by the Organization for Economic Cooperation and
Development (OECD) and the IMF on Real Estate Price Indexes in Paris,
November 2006 (Diewert, 2009b).
Reports from IMF (2006) and Australian Bureau of Statistics (2006) showed
that the national central bank of Austria worked jointly with the Vienna

CBN Journal of Applied Statistics Vol.3 No.2 21
University of Technology to develop and compile residential property price
indices that were based on broadly harmonized statistical approaches, thereby
pioneering the research towards internationally comparable house price
indices.
In describing the development of a house price index that was introduced in
May 2005 in the Netherlands, Jansen et al. (2008) gave an insight on how a
monthly index, called Woningwaarde Index Kadaster (House Price Index
Kadaster), was designed to detect changes in the price of the overall stock of
owner-occupied homes. Fifty-five indices were calculated: one overall index,
four regional indices, 12 provincial indices and 38 indices based on
combinations of region/province and dwelling type.
Recognizing the need to develop a reliable database on the actual price trends
in the real estate sector, the National Housing Bank of India constituted a
technical advisory group to deliberate on all aspects of constructing a
representative housing price index (HPI). Initially, a pilot study of Bangalore,
Bhopal, Delhi, Kolkata and Mumbai was undertaken, taking into account the
actual transaction prices of residential properties for 2001-05, with 2001 as the
base year. This complex exercise, which factored in such challenges as
localities, covered area, community facilities, individual layouts, data
distortions caused by transactions costs, etc., led to the launch of National
Housing Bank (NHB) RESIDEX in July 2007 (NHB, 2009).
In another development, analysis of the residential property market, according
to Nhleko and Tlatsana (2009), formed part of the South African monthly
Monetary Policy Committee (MPC) dossier. The MPC read important
information from house price graphs, using it to help track household wealth
and informed its views on the main expenditure components, and shaped the
committee’s views on the effect of changes in the monetary policy stance on
asset prices.
In Malaysia, the Malaysia House Price Index was initiated in 1993 and
officially launched in 1997. The objective was to establish a national price
index that could be able to monitor the movement of house prices in Malaysia
and assist the policymakers in formulating national economic policy with
respect to housing and property development. This index represented the
overall housing markets and disaggregated according to region and house type
with individual indices for key markets and house type (Dzurlkarnain et al.,
1996; Wan Zahari and Nasir, 2002; VPSD, 1997; Hussain et al., 2012).

22 On the Development of Residential Property Price
Indices for Nigeria Olowofeso et al.
Jeni (2010) reported the bubble in residential property market which existed
only when there was an excessive bank-lending and low-borrowing cost. This
unsustainable property price increment and shortage of capital by the banking
institutions were noted as reasons for positive non-performing loans in
Malaysia. In order to prevent the asset bubbles, a continuous monitoring by
the Central Bank of Malaysia (CBM) on the property price trends and the
introduction of appropriate measurements, such as the introduction of “My
First Home Scheme” on 8 March 2011 to curb the real estate speculation
activities and to support, stabilize and sustain the future of Malaysia’s
Residential property market was initiated (Azhar, 2011).
Moreover, given the changing nature of financial intermediation within
increasingly competitive banking systems and structural shifts in
demographics, migration and building regulations, according to Davis et al.
(2011), the modeling of house prices has become important in its own right.
One important conclusion of Davis et al. (2011) was that more resources must
be devoted to collecting and disseminating data on house prices and related
variables such as loan to value ratios since accurate house price modeling
requires such information.
Subsequently, he argued that an understanding of deviations from equilibrium
prices in housing markets requires reliability and for international
comparisons (Silver, 2012)
Consequently, Eurostat (2012) published a Macroeconomic Imbalance
Procedure (MIP) scoreboard for the surveillance of macroeconomic
imbalances. The scoreboard consisted of a set of ten indicators that included
house price indices (HPIs) taken from the experimental HPI for which data
were publicly available in the Eurostat HPI released.
3.0 Methodology for Computing RPPI
House price transactions, according to Silver (2012), are infrequent and apply
to a highly heterogeneous item; hence, comparing the prices of like with like
on a regular basis is highly problematic. More so, secondary source data are
generally used for house price indices (HPIs), and their nature depends on the
institutional arrangements in a country for selling, financing, taxing, and
registering the sale of a residential property. This gives rise to the potential for

CBN Journal of Applied Statistics Vol.3 No.2 23
quite significant methodological and coverage differences in HPI
measurement, (see, for example, Carless, 2011).
Recent research by Eurosat (2011) showed that the approaches adopted by
Statistical Agencies to construct RPPIs varied among countries and were
dictated in large part by the availability of data generated by the processes
involved in buying and selling a property. Hence, the challenges of compiling
constant-quality residential price indices can be summarized by the following
three factors:
(i) Residential properties are notoriously heterogeneous. No two properties
are identical.
(ii) Prices are often negotiated. The (asking) price of a property is not fixed
and can change throughout the transaction process until the sales is
finalized. This means that, a property’s market value can only be known
with certainty after it has been sold.
(iii) Property sales are infrequent. In many countries, less than ten percent of
the housing stock changes hands every year - this means that, a given
house is likely to have a confirmed value not more than every ten years.
The four types of econometric methods considered include the hedonic
regression, the repeat sales, the central price tendency, and the sales-based
methods.
3.1 The Hedonic Regression Method
The application of hedonic techniques for the quality adjustment of prices and
for computing price indices has made a significant contribution to the
methodological development of price indices in recent years and is rapidly
becoming a preferred method for compiling quality residential property price
indices. However, there is no uniformity in the practical application of
hedonics or agreement on what is the best practice (Eurosat, 2011). In
practice, there are two alternative methods of application of hedonics to
residential property, namely: the Time Dummy Variables Approach- which
has the benefit of simplicity but with a major drawback which involves raising
the issue of “revisability” of the index because it must be updated each time
the regression is run; and the Predicted Prices or Hedonic Imputation
Approach- in which a separate regression must be performed for each time
period and the index be constructed by applying the estimated implicit prices
to the relevant set of characteristics relating to residential properties.
24 On the Development of Residential Property Price
Indices for Nigeria Olowofeso et al.
Application of hedonic method potentially suffered from lack of some
important house price determining characteristics in this paper.
3.2 The Repeat-Sales Method
The repeat sales method observes the price development of a specific house
over a period of time by reference to the selling price each time it is sold. The
price development of a “representative” selection of houses during
overlapping time periods can then be observed to obtain a measure of the
general trend in residential property prices. Measuring the average price
changes in repeat sales on the same properties ensure a like for like
comparison. In its standard form, it requires no information on characteristics
of the dwelling units other than the addresses of the properties that are traded
and source data could often be available from administrative records.
However, its applicability in this work suffered a setback given that a house
must be sold at least twice in a repeat sales index, and as such new residential
constructions must be excluded from such an index. There was no adequate
data to satisfy this necessary condition, which, in practice, is also sufficient to
rule out the application of repeat sales method in residential property price
index construction.
3.3 Central Price Tendency Approach
This approach is among the least data intensive of all the methods currently
available to statistical agencies. The basic mean or median methods only need
the selling prices of the properties in a given location to build a price index.
Since the presence of outliers could be mitigated when the median price of
properties in the sample is used instead of the mean price, the median
approach was applied. Thus, in constructing the Nigerian residential property
price index (NRPPI), location information was utilized. In addition, it was
usual to stratify by the type of dwelling unit; hence, we modified the basic
median method such that information on the type of dwelling was also
utilized. In order to improve the reliability of the indicator, geographical
stratification which has the advantage of reducing the effects of period-to-
period compositional shifts in the housing units that characterize the simple
mean and median methods was also introduced into the analysis.
3.4 Sales-based Approach
This approach defines a number of strata (cells), allocates the price
observations to the cells, and computes a sales-based RPPI by a suitable index
formula. The strata were defined by house characteristics, like type and
region; hence, the RPPI was a reasonably good measure of the trend in house
prices in Nigeria. The procedure for the sales-based RPPI is as follows:
CBN Journal of Applied Statistics Vol.3 No.2 25
a) Select a time period (month, quarter, year) that is to serve as unit of
measurement, dependent on user requirements and data availability.
b) Collect transaction prices during each period.
c) Ensure that such prices reflect the values of the underlying properties
(ideally, on a free market). This could imply deleting all transaction prices
that are deemed unrealistic because they are too low, too high, or in some
way fraudulent. There is evidence that people under time pressure tend to
sell their houses for prices which are not precisely mirroring their values.
d) Check the representativity of the set (also called sample) of prices. Does
the set contain all the transaction prices of the entire country during the
time unit chosen? Or only the transactions in some capital city? Or only
the transactions via some kind of real estate agencies? Or only the
transactions of some specific kind of properties?
e) Define strata (cells) dependent on user requirements and data availability.
Users could for instance want to distinguish between house types, age
classes, regions, square meters, number of rooms, etcetera. Ideally the
classification should be chosen such that in each time period there are
sufficient observations to fill all the cells. Alternatively, and less
demanding, is the requirement that for any comparison of two time periods
there is a sufficient number of non-empty cells that match.
f) Let the cells be denoted by . Let for each time period, , and cell, ,
the sample of properties for which prices are observed be denoted by
. Let the size of the sample be denoted by . For some
time periods and cells this size could be equal to zero.
g) For each cell an appropriate location measure for the period, t, distribution
of prices should be chosen; that is, a measure that can serve as center of
this distribution. This is called a mean. Usually this is the arithmetic mean
⁄ ∑
, (1)
where Pht denotes the transaction price of property, h, in period, t. But one
could also opt for the geometric mean. This mean is less prone to outliers
and can easily be calculated by exponentiating the arithmetic mean of the
logarithms of prices. The third option is to use the median.
h) Though the choice of location measure might differ over the cells, the
same measure should be used through time.
i) For each cell the (aggregate) price change between periods, t, and, s, can be

26 On the Development of Residential Property Price
Indices for Nigeria Olowofeso et al.
presented as an index number or as percentage.
j) The overall price change between periods, can be represented by a
Laspeyre’s and/or Paasche’s index number. But to avoid one-sidedness,
the Fisher’s index number could be used3.
3.5 Data Collection
Residential property in Nigeria encompasses the land areas and the
development thereof, building or housing projects, either for individual or
condominium ownership, and other similar nature. This study focused only on
building or housing projects, but given the extensive coverage of building or
housing projects in the country, it considers only the state capital of the most
popular states in each of the six geo-political zones of Nigeria. A
questionnaire was designed to capture the relevant characteristics of
residential properties that can influence prices like the type of structure,
region/location, age, land plots, built-up area, number of bedrooms, quality of
finishing, availability of basic amenities, among others. The distribution of the
questionnaire was carried out based on expert judgment and the data obtained
from the Nigerian Federal Housing Authority, State Ministries of Land and
Housing, as well as registered Property Managers, Estates Surveyors and
Valuers among others. However, the data were constraint by information on
most of the price determining characteristics required to construct the indices
using econometric methods like hedonic regression and repeat sales.
However, the data contained information on some of the characteristics like
the type of structure and the region. The type of structures include self-
contained apartment (SCA), detached bungalow (DB), semi-detached
bungalow (SDB), block of flat (BF), detached duplex (DD), semi-detached
duplex (SDD) and terrace duplex apartment (TDA). The whole database from
the six geopolitical zones: North East (NE), North West (NW), North Central
(NC), South East (SE), South West (SW), and South-South (SS), contained
approximately 1,500 trades observed between 2010 and 2012 after a cleaning
process of the data and removing outliers or trades with no price information.
3 Remark: It is imperative to emphasize here that users are generally interested in short term
developments; that is, in comparisons of prices between periods .
CBN Journal of Applied Statistics Vol.3 No.2 27
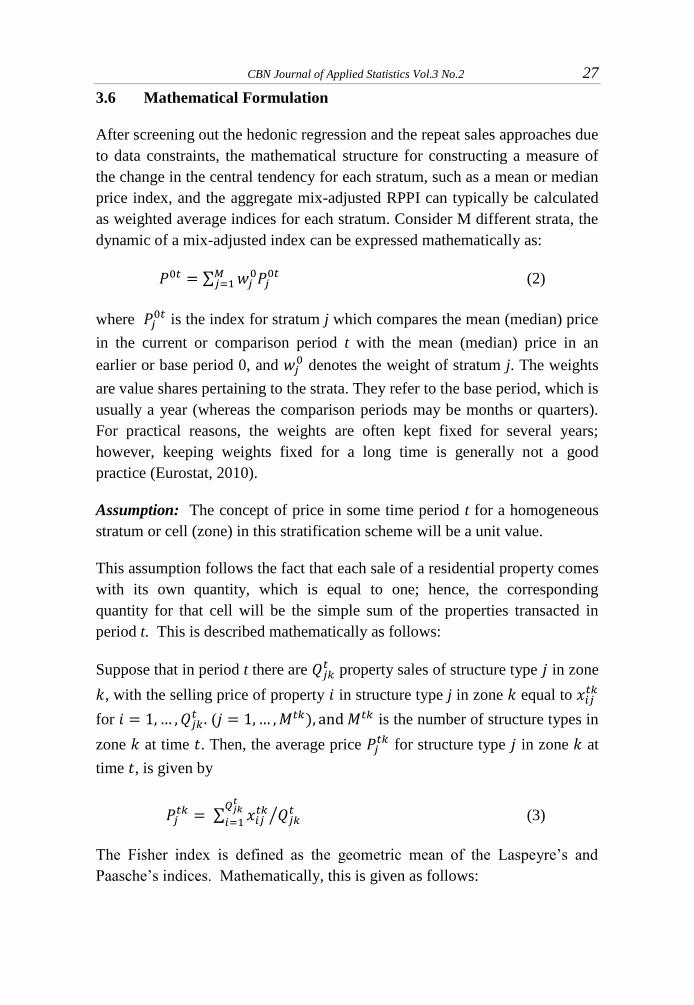
3.6 Mathematical Formulation
After screening out the hedonic regression and the repeat sales approaches due
to data constraints, the mathematical structure for constructing a measure of
the change in the central tendency for each stratum, such as a mean or median
price index, and the aggregate mix-adjusted RPPI can typically be calculated
as weighted average indices for each stratum. Consider M different strata, the
dynamic of a mix-adjusted index can be expressed mathematically as:
∑
(2)
where is the index for stratum j which compares the mean (median) price
in the current or comparison period t with the mean (median) price in an
earlier or base period 0, and denotes the weight of stratum j. The weights
are value shares pertaining to the strata. They refer to the base period, which is
usually a year (whereas the comparison periods may be months or quarters).
For practical reasons, the weights are often kept fixed for several years;
however, keeping weights fixed for a long time is generally not a good
practice (Eurostat, 2010).
Assumption: The concept of price in some time period t for a homogeneous
stratum or cell (zone) in this stratification scheme will be a unit value.
This assumption follows the fact that each sale of a residential property comes
with its own quantity, which is equal to one; hence, the corresponding
quantity for that cell will be the simple sum of the properties transacted in
period t. This is described mathematically as follows:
Suppose that in period t there are property sales of structure type in zone
, with the selling price of property in structure type j in zone equal to
for ( is the number of structure types in
zone at time . Then, the average price for structure type in zone at
time , is given by
∑
⁄
(3)
The Fisher index is defined as the geometric mean of the Laspeyre’s and
Paasche’s indices. Mathematically, this is given as follows:

28 On the Development of Residential Property Price
Indices for Nigeria Olowofeso et al.
Let
and
denote the period vectors cell
prices and quantities. Then, the Laspeyre’s price index, going from (the
base) period 0 to (the comparison) period t could be modeled as:
∑
∑
(4)
Equation (4) can be written in the form of (2) with cell price indices,
⁄ and value shares,
∑
⁄ . Whereas, the Paasche price
index going from period to could be written as:
∑
∑
(5)
Hence, the Fisher ideal price index for period t relative to period 0, , could
then be computed as the geometric mean of (4) and (5):
√(
∑
∑
)(∑
∑
) (6)
The overall Fisher ideal price index is given by
√(
∑ ∑
∑ ∑
)(∑ ∑
∑ ∑
) (7)
Suppose that in period t and zone k, there are property sales of all structure
types with the selling price of property in zone k equal to for
. Then, the median price
, and total sales , for all structure types
in zone and period , are given by
{
} (8)
and
∑
(9)
CBN Journal of Applied Statistics Vol.3 No.2 29
respectively. Then, by adopting the quality constant price concept, the implied
quantity of sales of all property types in zone at time is given as
(10)
Let the period share of sales of all property types in zone , , (where
) be given by
∑
. (11)
The zonal Törnqvist-Theil index is given by
{
}
{
[
]}
. (12)
The share weighted average of the zonal indices forms an overall Törnqvist-
Theil index for Nigeria , which is given by
{∑ {
} {
}
} (13)
4.0 Empirical Investigation
Based on the survey sample data from the six geopolitical zones of Nigeria,
the median prices of residential property sales were obtained. The
constructions of the stratum price indices that are then aggregated to the
overall national index of interest often use median prices in practice. Thus, in
constructing a mixed-adjusted price index, we first defined the stratum.
Thereafter, we calculate the median price for the residential properties
transacted within the stratum for the period in question. Finally, the median
prices for all stratums were weighted together into an aggregate price measure
for the market under study, which represent each zones and the country as a
whole.
The computational procedure used in this study is as follows:
Step 1: Define the stratum. In this work, the stratum is a geographical
subdivision zone of the country such as the North-East (NE), North-West
(NW), North-Central (NC), South-East (SE), South-West (SW), and South-
South (SS).
30 On the Development of Residential Property Price
Indices for Nigeria Olowofeso et al.
Step 2: Calculate the median price for a stratum such as a zone for the
relevant period (year). It is assumed that the median is the representative
price of all sales in that stratum. However, the mean price could alternatively
be used. Repeat this step for future periods.
Step 3: Estimate the “average” price of the residential houses sold for a
given period by calculating a sales weighted median of the zone or stratum
prices. Since it is desirable to have price multiplied by volume to equal
expenditure in each period for each zone, using the median price in each
zone as a constant quality price for each time period leads to the data on
expenditures ( , prices and implied quantities in each zone..
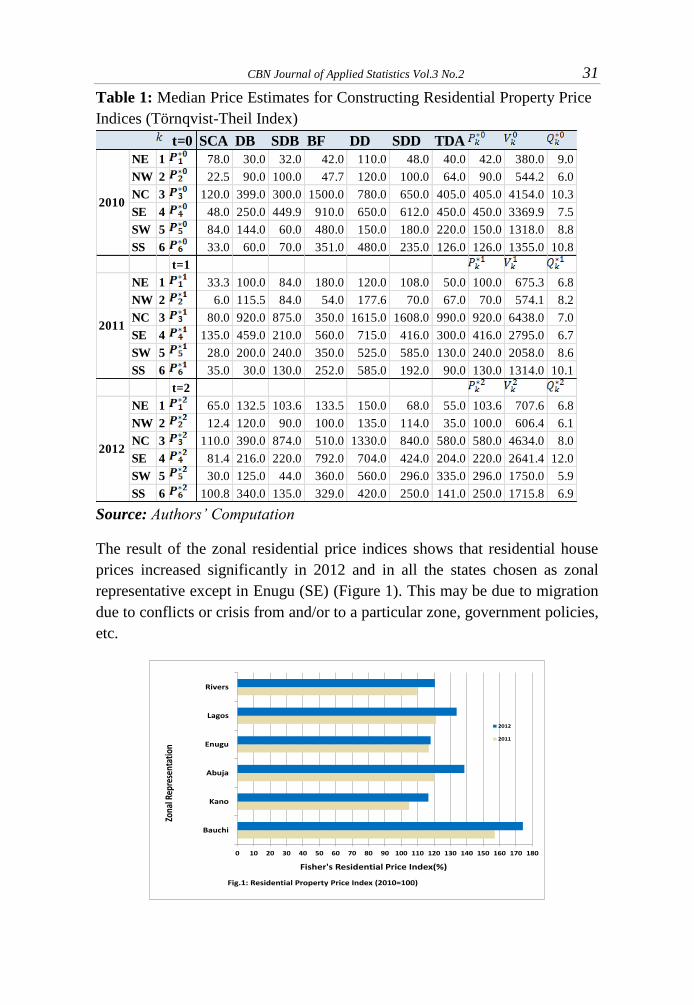
5.0 Results and Discussion
The geographical subdivision (zone) of the country was defined as (Table
1), so that denotes the North-East (NE), denotes the North-West
(NW), denotes the North-Central (NC), denotes the South-East
(SE), denotes the South-West (SW), and denotes the South-
South (SS). The median price estimates for each zone was obtained from
period representing year 2010 to period representing year 2012.
By adopting the quality constant price concept, the implied quantity of
sales of all property types in zone at time was also obtained. It was shown
that at period , decreased significantly in from 9.0 to 6.8
which may be attributed to increase in price movement; for , it increased
significantly from 6.1 to 8.2, which may also be attributed to a decresed in
price movement (in particular, this might be due to speculations with respect
to the Lagos State housing law) and then decreased to 6.1; for , it
decreased from 10.3 to 7.0 and later increased to 8.0; for It decreased
from 7.5 to 6.7 and then increased to 12.0; at , It decreased slightly from
8.8 to 8.6 and significantly to 5.9; and at , it decreased slightly from
10.8 to 10.1 and significantly to 6.9 (Table 1).
Also, since it is desirable to have price multiplied by volume to equal
expenditure in each period for each zone, using the median price computed in
Table 1 for each zone as a constant quality price for each time period leads to
the aggregate (National) results for the median price , the total sales
,
for all structure types in zone and period and the implied quantity of
sales of all property types in zone at time as shown in Table 2.
CBN Journal of Applied Statistics Vol.3 No.2 31
Table 1: Median Price Estimates for Constructing Residential Property Price
Indices (Törnqvist-Theil Index)
Source: Authors’ Computation
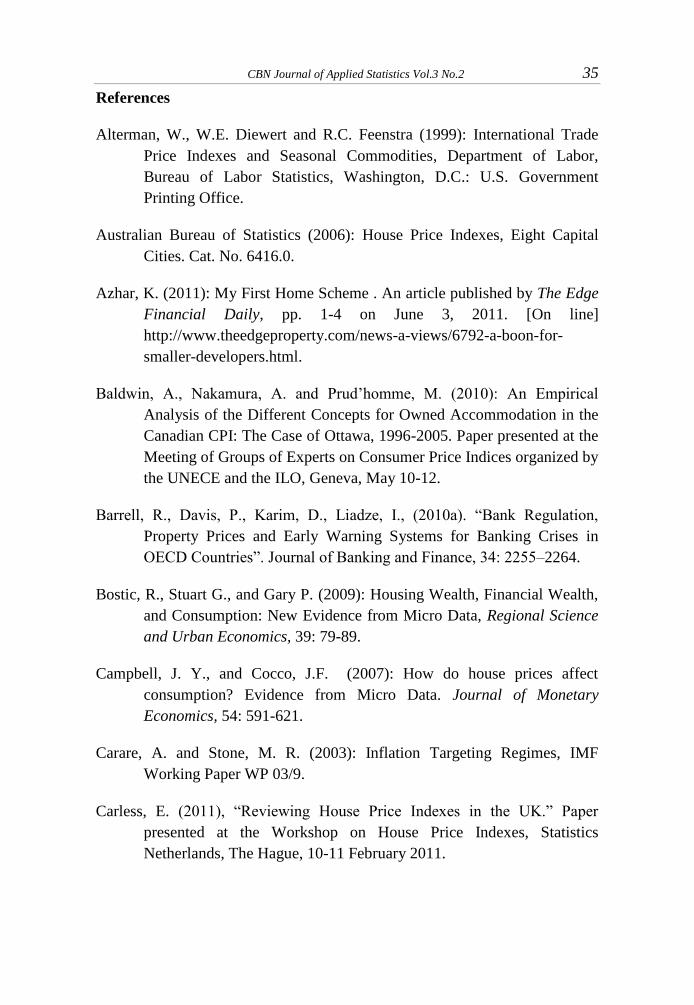
The result of the zonal residential price indices shows that residential house
prices increased significantly in 2012 and in all the states chosen as zonal
representative except in Enugu (SE) (Figure 1). This may be due to migration
due to conflicts or crisis from and/or to a particular zone, government policies,
etc.
t=0 SCA DB SDB BF DD SDD TDA
NE 1 78.0 30.0 32.0 42.0 110.0 48.0 40.0 42.0 380.0 9.0
NW 2 22.5 90.0 100.0 47.7 120.0 100.0 64.0 90.0 544.2 6.0
NC 3 120.0 399.0 300.0 1500.0 780.0 650.0 405.0 405.0 4154.0 10.3
SE 4 48.0 250.0 449.9 910.0 650.0 612.0 450.0 450.0 3369.9 7.5
SW 5 84.0 144.0 60.0 480.0 150.0 180.0 220.0 150.0 1318.0 8.8
SS 6 33.0 60.0 70.0 351.0 480.0 235.0 126.0 126.0 1355.0 10.8
t=1
NE 1 33.3 100.0 84.0 180.0 120.0 108.0 50.0 100.0 675.3 6.8
NW 2 6.0 115.5 84.0 54.0 177.6 70.0 67.0 70.0 574.1 8.2
NC 3 80.0 920.0 875.0 350.0 1615.0 1608.0 990.0 920.0 6438.0 7.0
SE 4 135.0 459.0 210.0 560.0 715.0 416.0 300.0 416.0 2795.0 6.7
SW 5 28.0 200.0 240.0 350.0 525.0 585.0 130.0 240.0 2058.0 8.6
SS 6 35.0 30.0 130.0 252.0 585.0 192.0 90.0 130.0 1314.0 10.1
t=2
NE 1 65.0 132.5 103.6 133.5 150.0 68.0 55.0 103.6 707.6 6.8
NW 2 12.4 120.0 90.0 100.0 135.0 114.0 35.0 100.0 606.4 6.1
NC 3 110.0 390.0 874.0 510.0 1330.0 840.0 580.0 580.0 4634.0 8.0
SE 4 81.4 216.0 220.0 792.0 704.0 424.0 204.0 220.0 2641.4 12.0
SW 5 30.0 125.0 44.0 360.0 560.0 296.0 335.0 296.0 1750.0 5.9
SS 6 100.8 340.0 135.0 329.0 420.0 250.0 141.0 250.0 1715.8 6.9
2010
2011
2012
0 10 20 30 40 50 60 70 80 90 100 110 120 130 140 150 160 170 180
Bauchi
Kano
Abuja
Enugu
Lagos
Rivers
Fisher's Residential Price Index(%)
Zona
l Rep
rese
ntat
ion
Fig.1: Residential Property Price Index (2010=100)
2012
2011

32 On the Development of Residential Property Price
Indices for Nigeria Olowofeso et al.
Table 2: Zonal Expenditures, Prices and Implicit Quantities Using Median
Prices as the Zonal Prices
Source: Authors’ Computation
After aggregating up the zonal price movements into an overall house price
inflation rate, the Fisher ideal index was estimated as 1.2162 and 1.3360 in
2011 and 2012, respectively, while the Törnqvist-Theil ideal index PT, was
estimated as 1.5586 in 2011 and 1.2771 in 2012, respectively (Figure 2).
Variables 2010 2011 2012
974.1 675.3 707.6
834.1 574.1 540.4
6464.0 6438.0 4634.0
3454.7 2795.0 2641.4
2636.9 2058.0 1750.0
2358.8 1314.0 1715.8
42.0 100.0 103.6
90.0 70.0 100.0
405.0 920.0 580.0
450.0 416.0 220.0
150.0 240.0 296.0
126.0 130.0 250.0
23.2 6.8 6.8
9.3 8.2 5.4
16.0 7.0 8.0
7.7 6.7 12.0
17.6 8.6 5.9
18.7 10.1 6.9
0 20 40 60 80 100 120 140 160
2011
2012
Index (%)
Year
Fig.2: National Residential Property Price Indices (2010=100)
National Törnqvist-Theil
National Fisher

CBN Journal of Applied Statistics Vol.3 No.2 33
5.1 Implications of the Development
The sharp increases in house prices have spurred the concern of both
government and other stakeholders as to their causes, their implications, and
the prospects for the future. Thus, understanding the pattern and nature of
residential property price dynamics could be seen as an important element in
assessing the macroeconomic situation and outlook of any country, especially
as the bursting of housing bubbles in a number of euro area countries and the
United States has been a key contributing factor to the recent global financial
crisis.
In particular, residential property price monitoring will provide a consistent
measure of price movements over time and facilitate monitoring of its key
determinants. In Nigeria, it will impact significantly on stock holdings in the
National Accounts compilation, construction of consumer price index,
measuring of Nigerian macro-economic growth. It may also influence Central
Bank of Nigeria macro prudential regulation policy for financial stability or
soundness, individual citizen’s decision making on whether to buy (or sell) a
residential property, wage bargaining and indexation purposes, as well as
acting as a guide in making inter-area and international property price
comparisons.
From the above expedition, it is evident therefore, that developing residential
property price indices for Nigeria is of utmost important for many institutions,
especially the Central Bank of Nigeria which have the statutory regulatory
policy for financial stability and soundness, as well as other stakeholders in
the economy.
6.0 Concluding Remarks
The development of residential property price indices constitutes an elaborate
process both from a practical and from an analytical perspective.
Consequently, it is very unlikely that different price indices will record the
same numerical results (Figure 2), particularly in the case were the
methodologies and/or the database used differ, even though one should expect
that these follow the same trend. Nevertheless, the availability of a range of
alternative residential property price indices is of importance given that no
price index alone can encompass all possible advantages or exclude all
possible disadvantages.

34 On the Development of Residential Property Price
Indices for Nigeria Olowofeso et al.
Although Comparing the available indices is complicated, some conclusions
can be drawn from an analysis of the methods and data sets used. Hence, the
NRPPI for year 2011 and 2012 with 2010 base year stands at 1.22 and 1.34,
respectively (Fisher’s), as well as 1.56 and 1.28, respectively (Törnqvist-
Theil). These give estimates of the residential property price volatility of 22%
in 2011 and 34 % in 2012 by using Fisher Ideal Price Index or 56% in 2011
and 28% in 2012 by using Törnqvist-Theil Ideal Price Index. This implies that
residential property price index is a key example of an ancillary statistic (or
indicator), that could often be consulted when analyzing the state of the
economy generally, and inflation in particular. That is to say, it is a
macroeconomic indicator which is viewed by some as being just as important
for tracking the economy as, for example, GDP or estimates of industrial
production, and in consequence, deserves its own place among other
indicators. It could be an indirect contributor to the CPI, depending on the
national statistical institute’s choice about the conceptual treatment of owner-
occupier housing costs in the CPI, and could therefore have a determining role
in the measured rate of inflation.
The need for further studies using other methods (where data is available) and
investigating the determinants of the significant increase in residential house
prices in Abuja, Lagos, Rivers, Bauchi and Kano, as well as the insignificant
change in Enugu is emphasizedd. This is because a study to document the
relationship between house prices and locations, age of structure, and other
properties in a residential real estate can result from monitoring the price trend
in different parts of the country and working with investors and financial
institutions to invest within these areas. Thus, since financial institutions also
need accurate appraisal of homes on which they make loans, the National
Bureau of Statistics in collaboration with the Central Bank of Nigeria and all
relevance agencies are also strongly advised to conduct a housing survey that
will have a complete attributes of price determinants for evaluation of the
property, independent of the potential sale price, which is worthwhile and
valuable. Such efforts will also improve the efficiency of mortgage process
and consumer price index.
CBN Journal of Applied Statistics Vol.3 No.2 35
References
Alterman, W., W.E. Diewert and R.C. Feenstra (1999): International Trade
Price Indexes and Seasonal Commodities, Department of Labor,
Bureau of Labor Statistics, Washington, D.C.: U.S. Government
Printing Office.
Australian Bureau of Statistics (2006): House Price Indexes, Eight Capital
Cities. Cat. No. 6416.0.
Azhar, K. (2011): My First Home Scheme . An article published by The Edge
Financial Daily, pp. 1-4 on June 3, 2011. [On line]
http://www.theedgeproperty.com/news-a-views/6792-a-boon-for-
smaller-developers.html.
Baldwin, A., Nakamura, A. and Prud’homme, M. (2010): An Empirical
Analysis of the Different Concepts for Owned Accommodation in the
Canadian CPI: The Case of Ottawa, 1996-2005. Paper presented at the
Meeting of Groups of Experts on Consumer Price Indices organized by
the UNECE and the ILO, Geneva, May 10-12.
Barrell, R., Davis, P., Karim, D., Liadze, I., (2010a). “Bank Regulation,
Property Prices and Early Warning Systems for Banking Crises in
OECD Countries”. Journal of Banking and Finance, 34: 2255–2264.
Bostic, R., Stuart G., and Gary P. (2009): Housing Wealth, Financial Wealth,
and Consumption: New Evidence from Micro Data, Regional Science
and Urban Economics, 39: 79-89.
Campbell, J. Y., and Cocco, J.F. (2007): How do house prices affect
consumption? Evidence from Micro Data. Journal of Monetary
Economics, 54: 591-621.
Carare, A. and Stone, M. R. (2003): Inflation Targeting Regimes, IMF
Working Paper WP 03/9.
Carless, E. (2011), “Reviewing House Price Indexes in the UK.” Paper
presented at the Workshop on House Price Indexes, Statistics
Netherlands, The Hague, 10-11 February 2011.

36 On the Development of Residential Property Price
Indices for Nigeria Olowofeso et al.
Congressional Budget Office (2007): Housing Wealth and Consumer
Spending, Background paper, January. Available at
http://www.cbo.gov.
Davis, E.P. , Fic, T.M. and Karim, D. (2011): Housing Market Dynamics and
Macroprudential Tools. Working Paper No. 11-07.
Davis, M.A. and M.G. Palumbo (2008): The Price of Residential Land in
Large US Cities. Journal of Urban Economics 63, 352-384.
Diewert, W.E. (2009a): Durables and Owner Occupied Housing in a
Consumer Price Index, pp. 445-500. In: Price Index Concepts and
Measurement, W.E. Diewert, J. Greenlees and C. Hulten (eds.),
Studies in Income and Wealth, Volume 70, Chicago: The University of
Chicago Press.
Diewert, W.E. (2009b): The Paris OECD-IMF Workshop on Real Estate Price
Indexes: Conclusions and Future Directions, pp. 87-116. In: Price and
Productivity Measurement: Volume 1—Housing, Trafford Press and
www.indexmeasures.com.
Dzurlkarnain, D., Thiruselvam, A. and Ibrahim, S. (1996): Development of
Mass Appraisal Valuation Model using Multiple Regression
Technique in Rating Valuation. Johor Bahru.
Eurostat (2010): Technical Manual on Owner-Occupied Housing for
Harmonised Index of Consumer Prices, Draft, February 2010.
Eurostat, (2012): European Commission, Directorate G: Business Statistics,
Unit G-6: Price statistics; Purchasing Power Parities, “Experimental
house price indices in the Euro area and the European Union in the
third quarter of 2011, 24 January, 2012,
http://epp.eurostat.ec.europa.eu.
Finocchiaro, D. and V. Queijo von H. (2007): Do Central Banks React to
House Prices? Working Paper Series 217, Sveriges Riksbank (Central
Bank of Sweden).

CBN Journal of Applied Statistics Vol.3 No.2 37
Gelfand, A.E., M.D. Ecker, J.R. Knight and C.F. Sirmans (2004): The
Dynamics of Location in Home Price. Journal of Real Estate Finance
and Economics 29(2): 149-166.
Gudnason, R. and G.R. Jónsdóttir (2009): Owner Occupied Housing in the
Icelandic CPI, pp. 85-88. In: Price and Productivity Measurement,
Volume 1: Housing, W.E. Diewert, B.M. Balk, D. Fixler, K.J. Fox and
A.O. Nakamura (eds.), Trafford Press and www.indexmeasures.com.
Hussain, M. Y, Rahman, R. A, Husain, F. N. M., Lyndon N. and Ibrahin, N.
N. (2012): Housing Bubbles Assessment 2005-2010 : Experiences in
Klang Valley, Malaysia. Advances in Natural and Applied Sciences,
6(1): 33-41.
IMF (2006), Compilation Guide on Financial Soundness Indicators,
Washington DC: IMF.
IMF (2009): The Financial Crisis and Information Gaps: Report to the G-20
Finance Ministers and Central Bank Governors.
http://www.imf.org/external/np/g20/pdf/102909.pdf.
Jansen, S. J. T., de Vries, P., Coolen, H. C. C. H., Lamain, C. J. M., and
Boelhouwer, P. J. (2008): Developing a House Price Index for The
Netherlands: A Practical Application of Weighted Repeat Sales.
Journal of Real Estate Finance and Economics, 37:163–186.
Jeni (2010): Property Bubbles- in Malaysia? An article published in Estate
123: Commersial. [on line]
http://www.estate123.com/reviews_articles/article_review_detail.aspx
?a_id=557.
Kaminsky, G.L. and Reinhart, C.M. (1999): The Twin Crises: The Causes of
Banking and Balance-of-Payments Problems, Vol. 89, No. 3:
http://www.econ.uchile.cl.
National Housing Bank (NHB) (2009): Prices and Monetary Management.
http://indiabudget.nic.in.
Nhleko, Z. and Tlatsana, G. (2009): A South African Perspective on the use
of House Price Indices for Monetary Policy Purposes. Eurostat-IAOS-
38 On the Development of Residential Property Price
Indices for Nigeria Olowofeso et al.
IFC Conference on Residential Property Price Indices held in Basel,
Switzerland from 11 to 12.
Reinhart, C.M. and Rogoff, K.S. (2008): The Aftermath of Financial Crises.
http://www.economics.harvard.edu/files/faculty/51_Aftermath.pdf.
Silver, M. (2012): Why House Price Indexes Differ: Measurement and
Analysis. IMF Working Paper, May 2012.
Velpuri, M. and Pinna, F. (2012): Real Estate Indices as a Barometer of Stable
Real Estate Returns and Predictor of Real Estate Risks during Real
Estate Boom or Burst Cycles. FIG Working Paper, Rome, Italy, 6-10
May 2012.
VPSD (1997): Malaysia House Price Index. Kuala Lumpur, Valuation and
Property Services Department.
Wan Zahari, W.Y. and Nasir, M.D. (2002): House Price Dynamics: Evidence
from a Malaysia Case Study. International Real Estate Research
Symposium. Kuala Lumpur: 297-310.