cbs news 2016 battleground tracker: indiana, april 24, 2016
DESCRIPTION
http://www.cbsnews.com/news/poll-donald-trump-hillary-clinton-party-front-runners-lead-in-pennsylvania-indiana/TRANSCRIPT
CBS News 2016 Battleground Tracker
Indiana
Sample 1084 Registered VotersConducted April 20-22, 2016Margin of Error ±4.6%
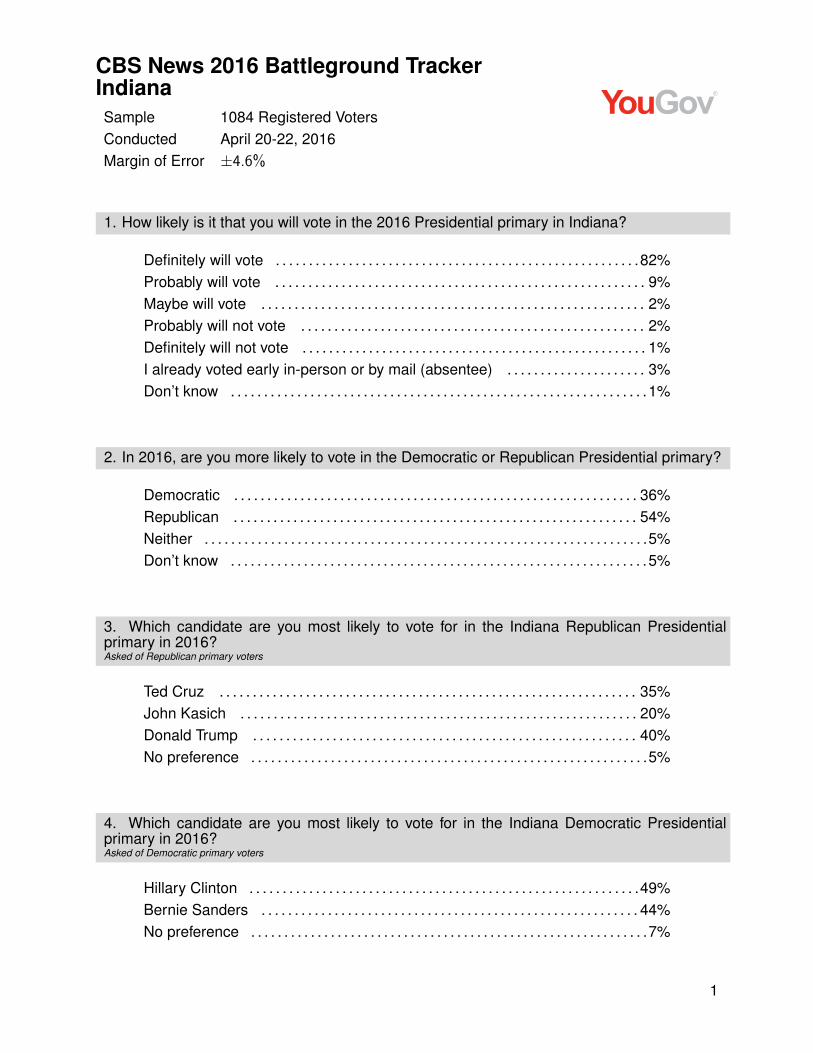
1. How likely is it that you will vote in the 2016 Presidential primary in Indiana?
Definitely will vote . . . . . . . . . . . . . . . . . . . . . . . . . . . . . . . . . . . . . . . . . . . . . . . . . . . . . . .82%Probably will vote . . . . . . . . . . . . . . . . . . . . . . . . . . . . . . . . . . . . . . . . . . . . . . . . . . . . . . . . 9%Maybe will vote . . . . . . . . . . . . . . . . . . . . . . . . . . . . . . . . . . . . . . . . . . . . . . . . . . . . . . . . . . 2%Probably will not vote . . . . . . . . . . . . . . . . . . . . . . . . . . . . . . . . . . . . . . . . . . . . . . . . . . . . 2%Definitely will not vote . . . . . . . . . . . . . . . . . . . . . . . . . . . . . . . . . . . . . . . . . . . . . . . . . . . . 1%I already voted early in-person or by mail (absentee) . . . . . . . . . . . . . . . . . . . . . 3%Don’t know . . . . . . . . . . . . . . . . . . . . . . . . . . . . . . . . . . . . . . . . . . . . . . . . . . . . . . . . . . . . . . .1%
2. In 2016, are you more likely to vote in the Democratic or Republican Presidential primary?
Democratic . . . . . . . . . . . . . . . . . . . . . . . . . . . . . . . . . . . . . . . . . . . . . . . . . . . . . . . . . . . . . 36%Republican . . . . . . . . . . . . . . . . . . . . . . . . . . . . . . . . . . . . . . . . . . . . . . . . . . . . . . . . . . . . . 54%Neither . . . . . . . . . . . . . . . . . . . . . . . . . . . . . . . . . . . . . . . . . . . . . . . . . . . . . . . . . . . . . . . . . . .5%Don’t know . . . . . . . . . . . . . . . . . . . . . . . . . . . . . . . . . . . . . . . . . . . . . . . . . . . . . . . . . . . . . . .5%
3. Which candidate are you most likely to vote for in the Indiana Republican Presidentialprimary in 2016?Asked of Republican primary voters
Ted Cruz . . . . . . . . . . . . . . . . . . . . . . . . . . . . . . . . . . . . . . . . . . . . . . . . . . . . . . . . . . . . . . . 35%John Kasich . . . . . . . . . . . . . . . . . . . . . . . . . . . . . . . . . . . . . . . . . . . . . . . . . . . . . . . . . . . . 20%Donald Trump . . . . . . . . . . . . . . . . . . . . . . . . . . . . . . . . . . . . . . . . . . . . . . . . . . . . . . . . . . 40%No preference . . . . . . . . . . . . . . . . . . . . . . . . . . . . . . . . . . . . . . . . . . . . . . . . . . . . . . . . . . . .5%
4. Which candidate are you most likely to vote for in the Indiana Democratic Presidentialprimary in 2016?Asked of Democratic primary voters
Hillary Clinton . . . . . . . . . . . . . . . . . . . . . . . . . . . . . . . . . . . . . . . . . . . . . . . . . . . . . . . . . . .49%Bernie Sanders . . . . . . . . . . . . . . . . . . . . . . . . . . . . . . . . . . . . . . . . . . . . . . . . . . . . . . . . . 44%No preference . . . . . . . . . . . . . . . . . . . . . . . . . . . . . . . . . . . . . . . . . . . . . . . . . . . . . . . . . . . .7%
1

CBS News 2016 Battleground Tracker
Indiana
5. Which best describes your support for [First Choice Candidate Name] right now?Asked of Republican primary voters
Very strong – I’ve decided . . . . . . . . . . . . . . . . . . . . . . . . . . . . . . . . . . . . . . . . . . . . . . 47%Strong – I probably won’t change . . . . . . . . . . . . . . . . . . . . . . . . . . . . . . . . . . . . . . . 33%Somewhat strong – I might still change . . . . . . . . . . . . . . . . . . . . . . . . . . . . . . . . . .16%Not too strong – I’ll probably keep looking . . . . . . . . . . . . . . . . . . . . . . . . . . . . . . . . 4%
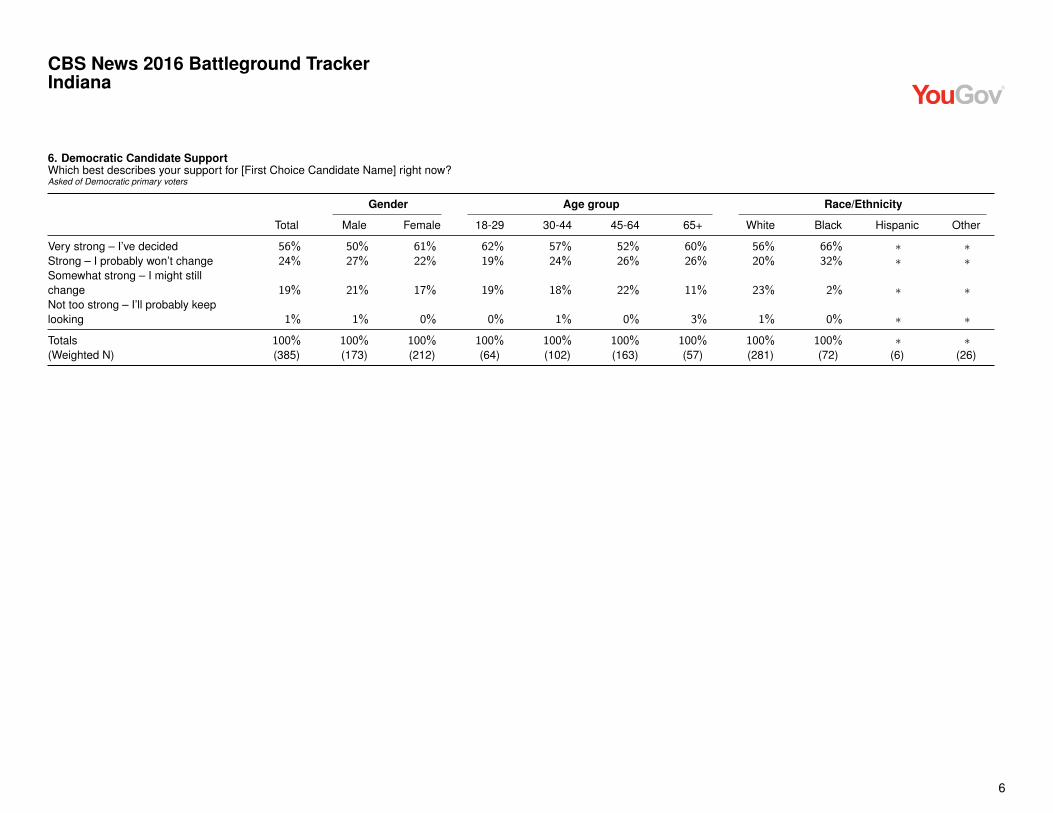
6. Which best describes your support for [First Choice Candidate Name] right now?Asked of Democratic primary voters
Very strong – I’ve decided . . . . . . . . . . . . . . . . . . . . . . . . . . . . . . . . . . . . . . . . . . . . . . 56%Strong – I probably won’t change . . . . . . . . . . . . . . . . . . . . . . . . . . . . . . . . . . . . . . . 24%Somewhat strong – I might still change . . . . . . . . . . . . . . . . . . . . . . . . . . . . . . . . . .19%Not too strong – I’ll probably keep looking . . . . . . . . . . . . . . . . . . . . . . . . . . . . . . . . 1%
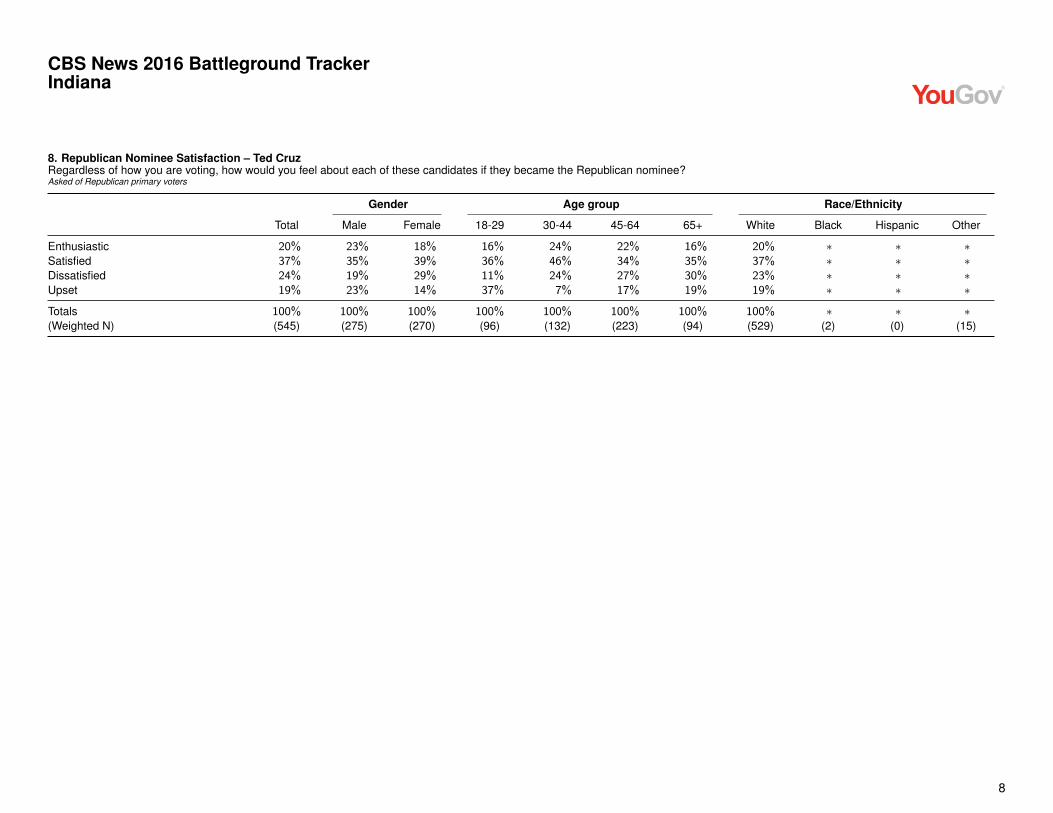
7. Regardless of how you are voting, how would you feel about each of these candidates ifthey became the Republican nominee?Asked of Republican primary voters
Enthusiastic Satisfied Dissatisfied UpsetDonald Trump 30% 32% 17% 21%Ted Cruz 20% 37% 24% 19%John Kasich 11% 47% 31% 11%
8. In recent weeks, has your view of each of these candidates...?Asked of Republican primary voters
Gotten better Gotten worseStayed the
sameDonald Trump 25% 28% 46%Ted Cruz 18% 28% 54%John Kasich 16% 17% 67%
2

CBS News 2016 Battleground Tracker
Indiana
9. Which best describes your vote for [First Choice Candidate Name]? Is it mainly because...?Asked of Republican primary voters who support Kasich or Cruz
You like [First Choice Candidate Name] as the nominee, no matter who theopposition is . . . . . . . . . . . . . . . . . . . . . . . . . . . . . . . . . . . . . . . . . . . . . . . . . . . . . . . . . . . . 50%You’d like to stop Donald Trump from becoming the nominee . . . . . . . . . . . . 23%Both . . . . . . . . . . . . . . . . . . . . . . . . . . . . . . . . . . . . . . . . . . . . . . . . . . . . . . . . . . . . . . . . . . . . 27%
10. Which best describes your vote for [First Choice Candidate Name]? Is it mainly because...?Asked of Republican primary voters who support Trump
You like [First Choice Candidate Name] as the nominee, no matter who theopposition is . . . . . . . . . . . . . . . . . . . . . . . . . . . . . . . . . . . . . . . . . . . . . . . . . . . . . . . . . . . . 65%You’d like to stop Ted Cruz or John Kasich from becoming the nominee . . . 8%Both . . . . . . . . . . . . . . . . . . . . . . . . . . . . . . . . . . . . . . . . . . . . . . . . . . . . . . . . . . . . . . . . . . . . 27%
11. Regardless of your own vote, do you think each candidate’s chances of becoming thenominee are...?Asked of Republican primary voters
Very Likely Somewhat likely Not too likelyDonald Trump 64% 30% 6%Ted Cruz 9% 63% 28%John Kasich 2% 16% 82%
12. What’s more important to you right now?Asked of Republican primary voters
The Republican party nominates someone I can fully support, whether or notthey win the Presidency . . . . . . . . . . . . . . . . . . . . . . . . . . . . . . . . . . . . . . . . . . . . . . . . .44%The Republican party wins the Presidency, even if I don’t entirely like thecandidate . . . . . . . . . . . . . . . . . . . . . . . . . . . . . . . . . . . . . . . . . . . . . . . . . . . . . . . . . . . . . . . 56%
13. To fix the nation’s economy, would you prefer a President’s approach be...?Asked of Republican primary voters
Do whatever it takes, whether that is the most conservative policy choice or not. . . . . . . . . . . . . . . . . . . . . . . . . . . . . . . . . . . . . . . . . . . . . . . . . . . . . . . . . . . . . . . . . . . . . . . . . 67%
Do whatever is most conservative . . . . . . . . . . . . . . . . . . . . . . . . . . . . . . . . . . . . . . . 33%
3

CBS News 2016 Battleground Tracker
Indiana
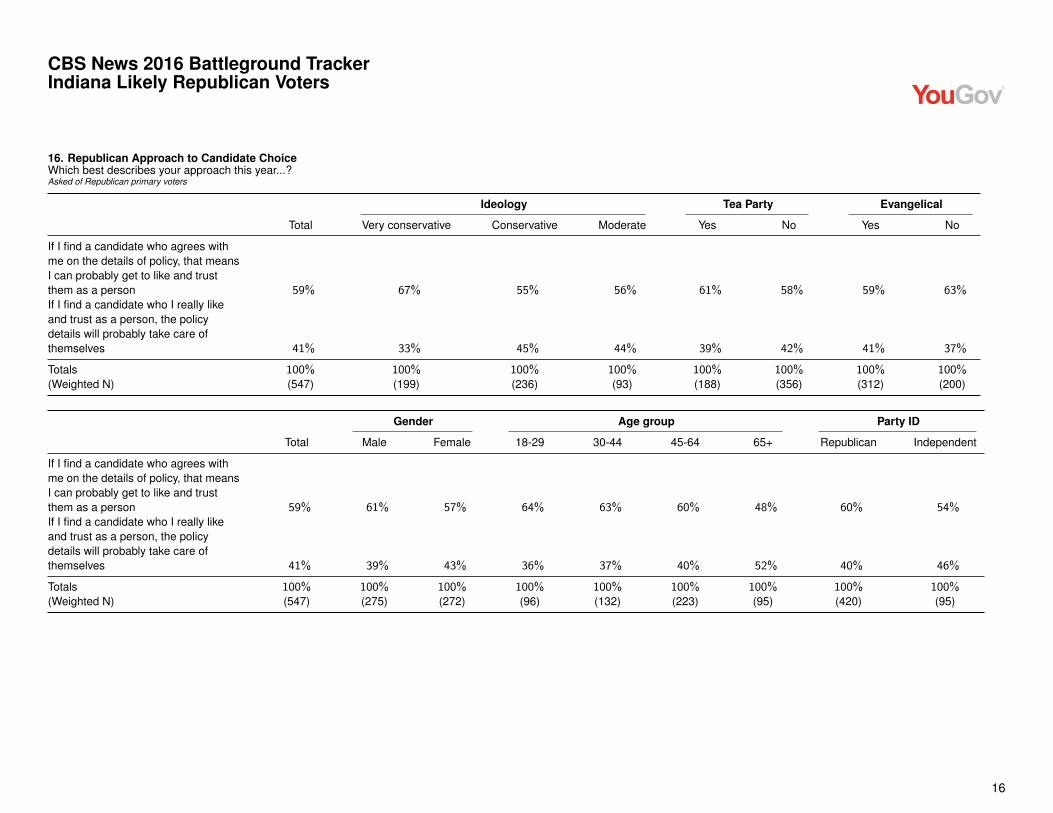
14. Which best describes your approach this year...?Asked of Republican primary voters
If I find a candidate who agrees with me on the details of policy, that means Ican probably get to like and trust them as a person . . . . . . . . . . . . . . . . . . . . . .59%If I find a candidate who I really like and trust as a person, the policy details willprobably take care of themselves . . . . . . . . . . . . . . . . . . . . . . . . . . . . . . . . . . . . . . . 41%
15. Overall, do you feel the Republicans’ process for selecting a nominee in 2016 has generallybeen fair or not fair so far?Asked of Republican primary voters
It has been fair . . . . . . . . . . . . . . . . . . . . . . . . . . . . . . . . . . . . . . . . . . . . . . . . . . . . . . . . . .53%It has NOT been fair . . . . . . . . . . . . . . . . . . . . . . . . . . . . . . . . . . . . . . . . . . . . . . . . . . . . 47%
16. As you may know, the Republican party requires a nominee to get 1,237 delegates inthe primaries for the nomination. If Donald Trump does not get 1,237 but Trump still has moredelegates than Ted Cruz, and more delegates than John Kasich, what do you feel Republicansshould do at the convention this summer?Asked of Republican primary voters
Select Trump, because he’ll still have more delegates than any other candidate. . . . . . . . . . . . . . . . . . . . . . . . . . . . . . . . . . . . . . . . . . . . . . . . . . . . . . . . . . . . . . . . . . . . . . . . . 47%
Let Trump, Cruz and Kasich fight for delegate support at the convention todecide the winner . . . . . . . . . . . . . . . . . . . . . . . . . . . . . . . . . . . . . . . . . . . . . . . . . . . . . . . 45%Turn to someone new who isn’t running right now . . . . . . . . . . . . . . . . . . . . . . . . .8%
17. If Donald Trump becomes the Republican nominee, how do you think he will approach theGeneral election campaign this fall?Asked of Republican primary voters
He will continue to be as outspoken as he is now . . . . . . . . . . . . . . . . . . . . . . . .65%He will be less outspoken than he is now . . . . . . . . . . . . . . . . . . . . . . . . . . . . . . . . 17%He will become more outspoken than he is now . . . . . . . . . . . . . . . . . . . . . . . . . 18%
4

CBS News 2016 Battleground Tracker
Indiana
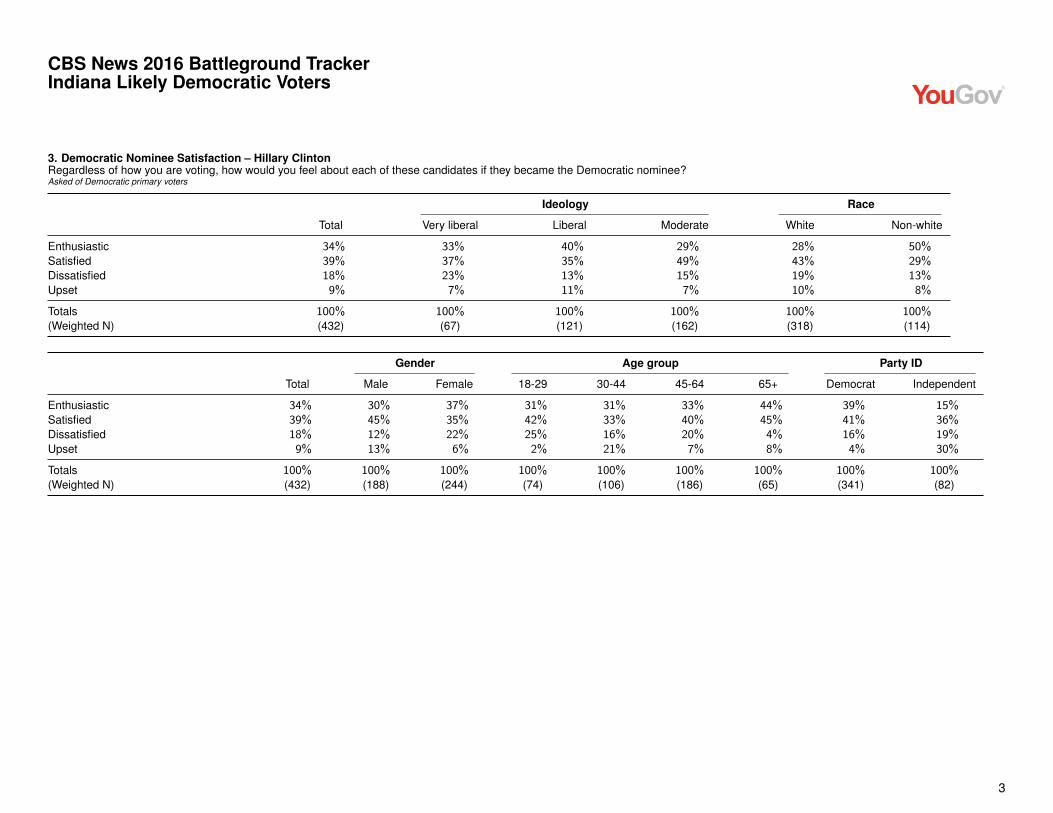
18. Regardless of how you are voting, how would you feel about each of these candidates ifthey became the Democratic nominee?Asked of Democratic primary voters
Enthusiastic Satisfied Dissatisfied UpsetHillary Clinton 34% 39% 18% 9%Bernie Sanders 39% 37% 21% 3%
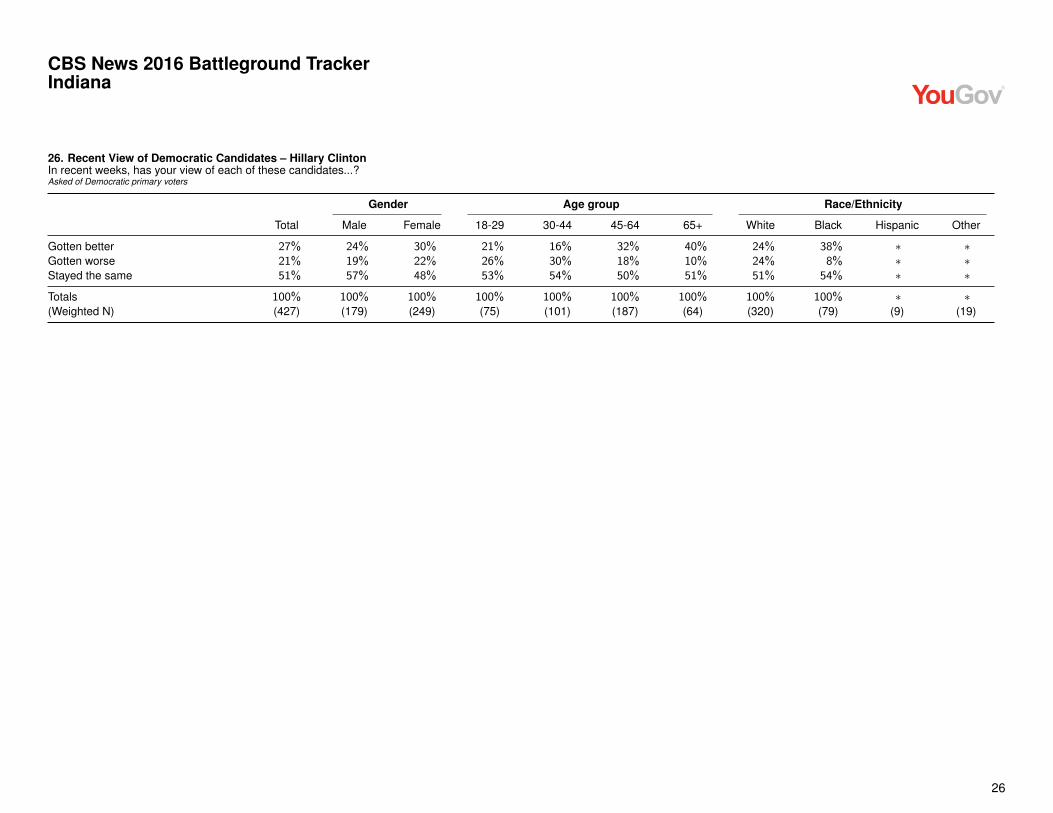
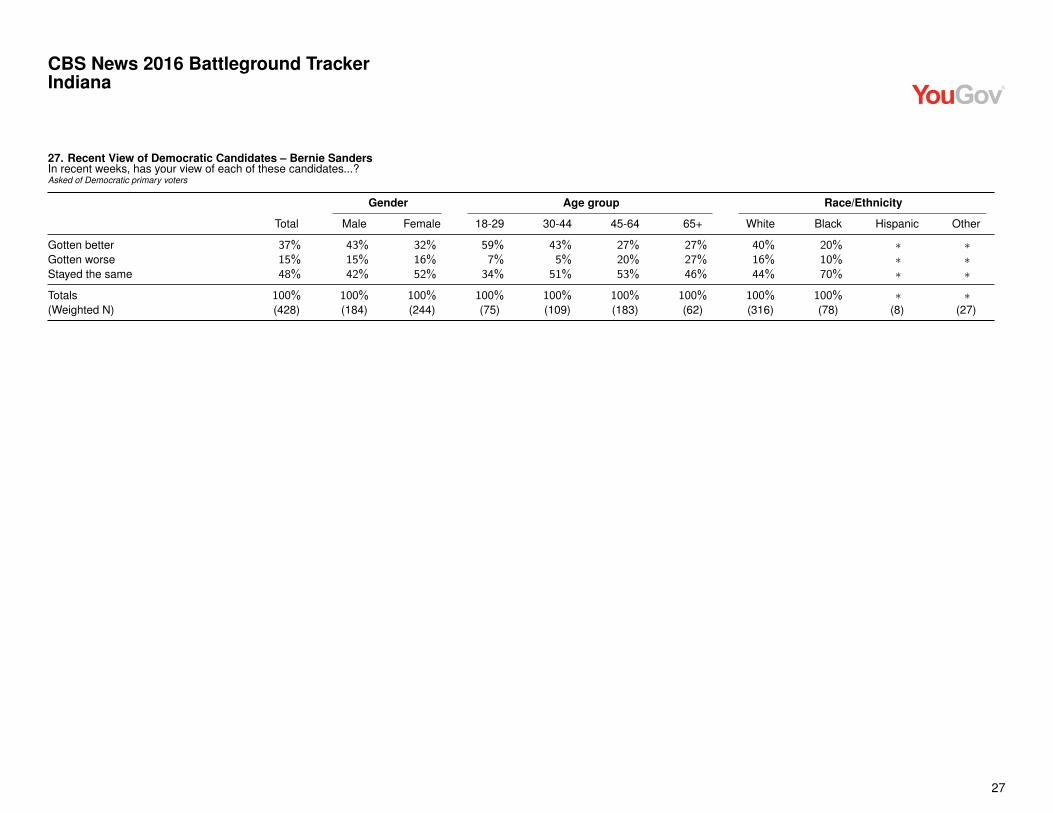
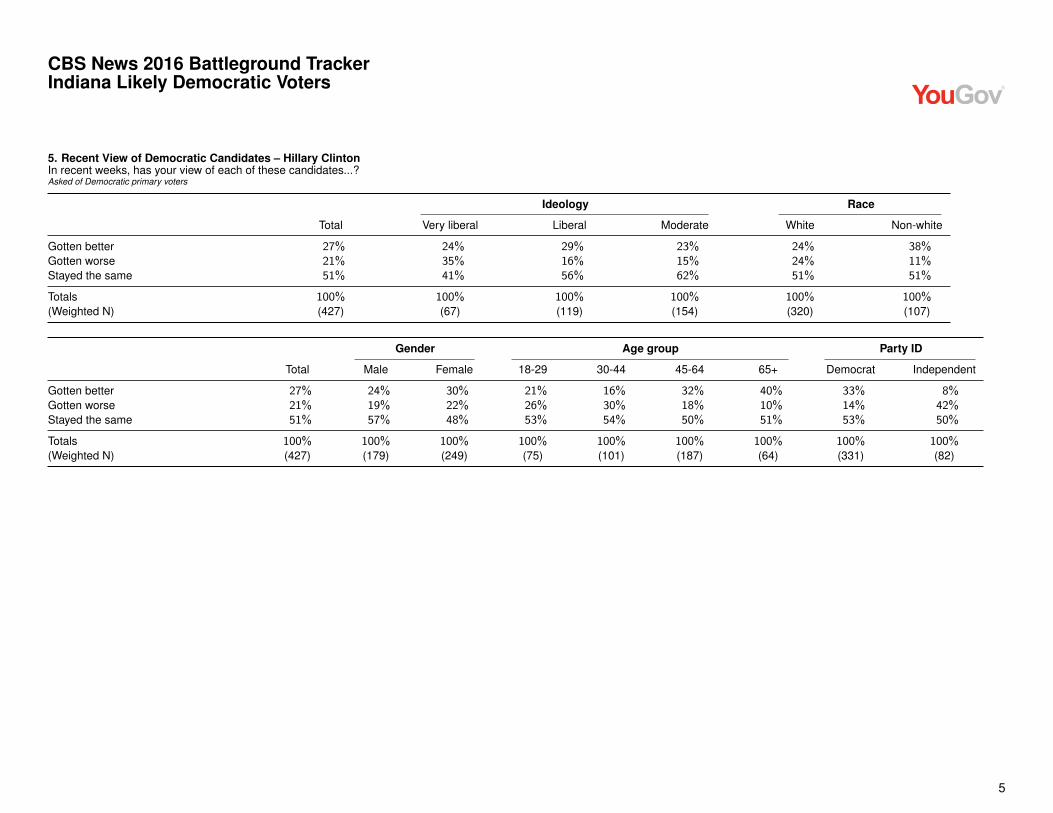
19. In recent weeks, has your view of each of these candidates...?Asked of Democratic primary voters
Gotten better Gotten worseStayed the
sameHillary Clinton 27% 21% 51%Bernie Sanders 37% 15% 48%
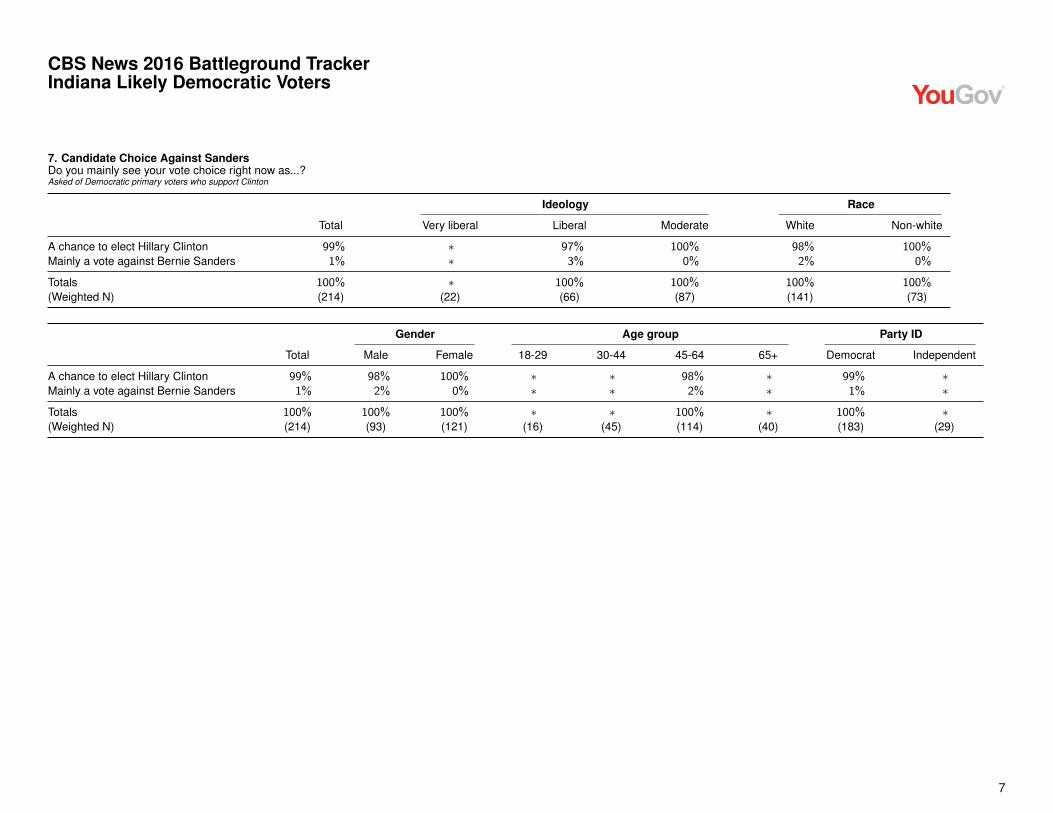
20. Do you mainly see your vote choice right now as...?Asked of Democratic primary voters who support Clinton
A chance to elect Hillary Clinton . . . . . . . . . . . . . . . . . . . . . . . . . . . . . . . . . . . . . . . . 99%Mainly a vote against Bernie Sanders . . . . . . . . . . . . . . . . . . . . . . . . . . . . . . . . . . . . 1%
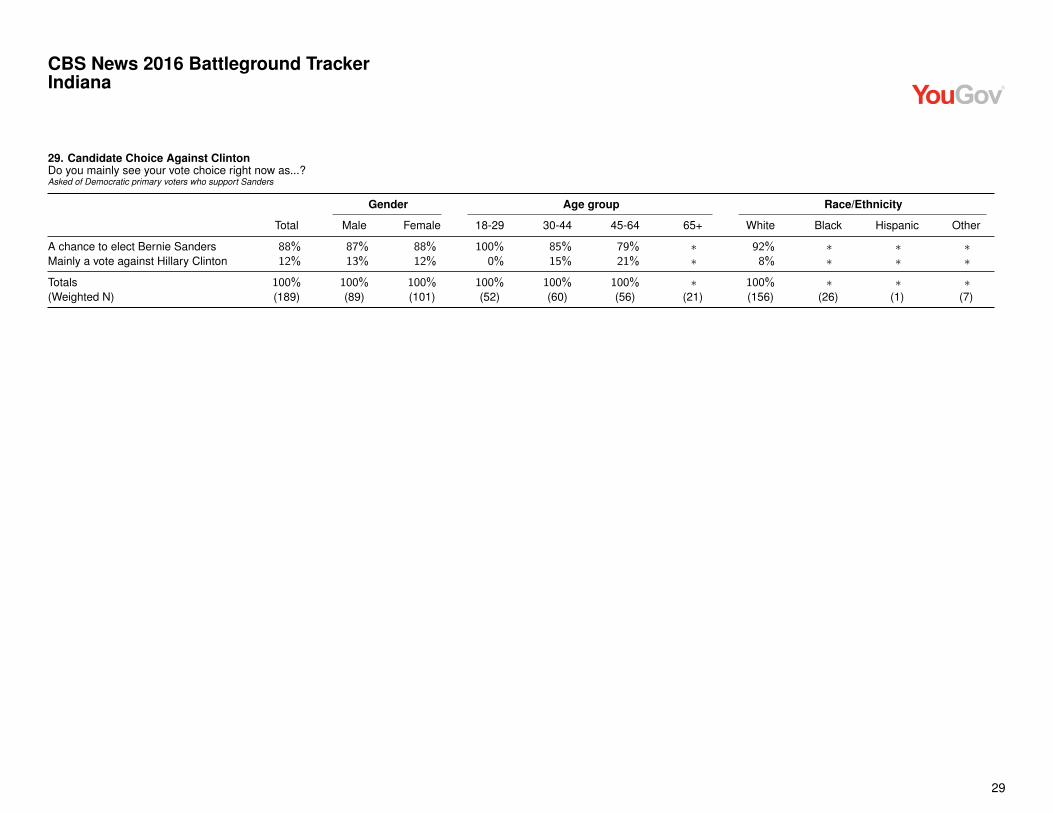
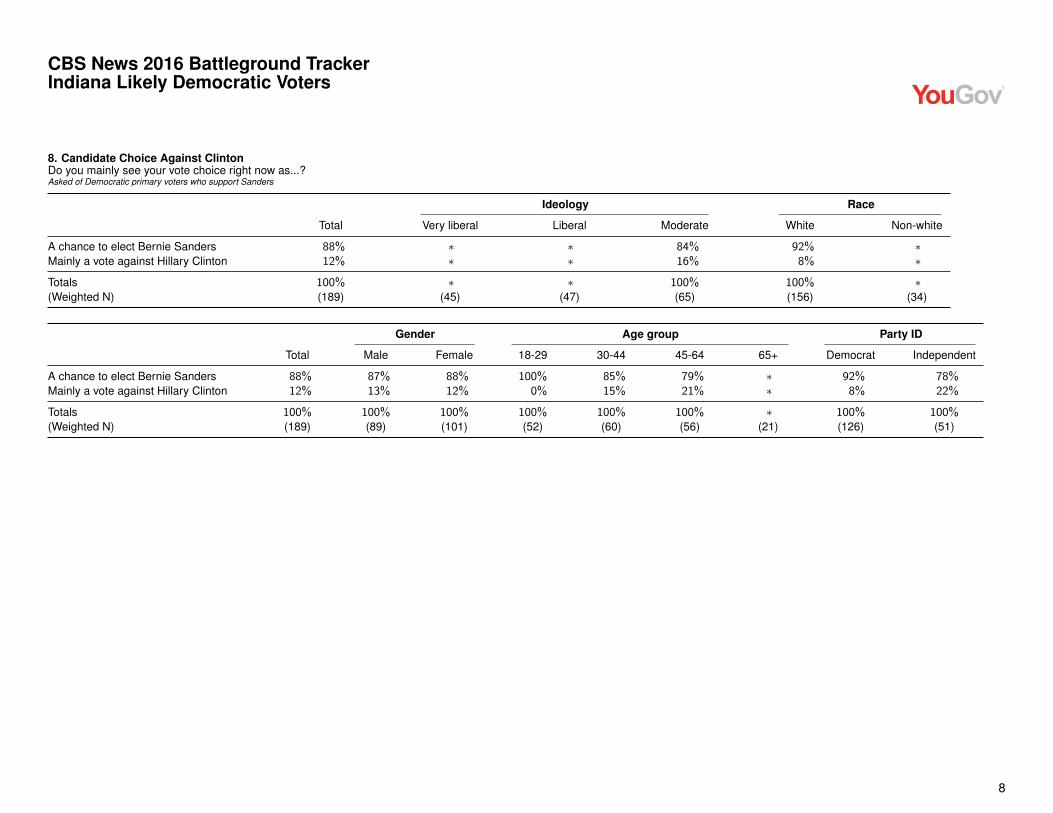
21. Do you mainly see your vote choice right now as...?Asked of Democratic primary voters who support Sanders
A chance to elect Bernie Sanders . . . . . . . . . . . . . . . . . . . . . . . . . . . . . . . . . . . . . . . 88%Mainly a vote against Hillary Clinton . . . . . . . . . . . . . . . . . . . . . . . . . . . . . . . . . . . . .12%
22. Regardless of your own vote, do you think each candidate’s chances of becoming thenominee are...?Asked of Democratic primary voters
Very Likely Somewhat likely Not too likelyHillary Clinton 78% 17% 5%Bernie Sanders 14% 45% 41%
5

CBS News 2016 Battleground Tracker
Indiana
23. To fix the nation’s economy, would you prefer a President’s approach be...?Asked of Democratic primary voters
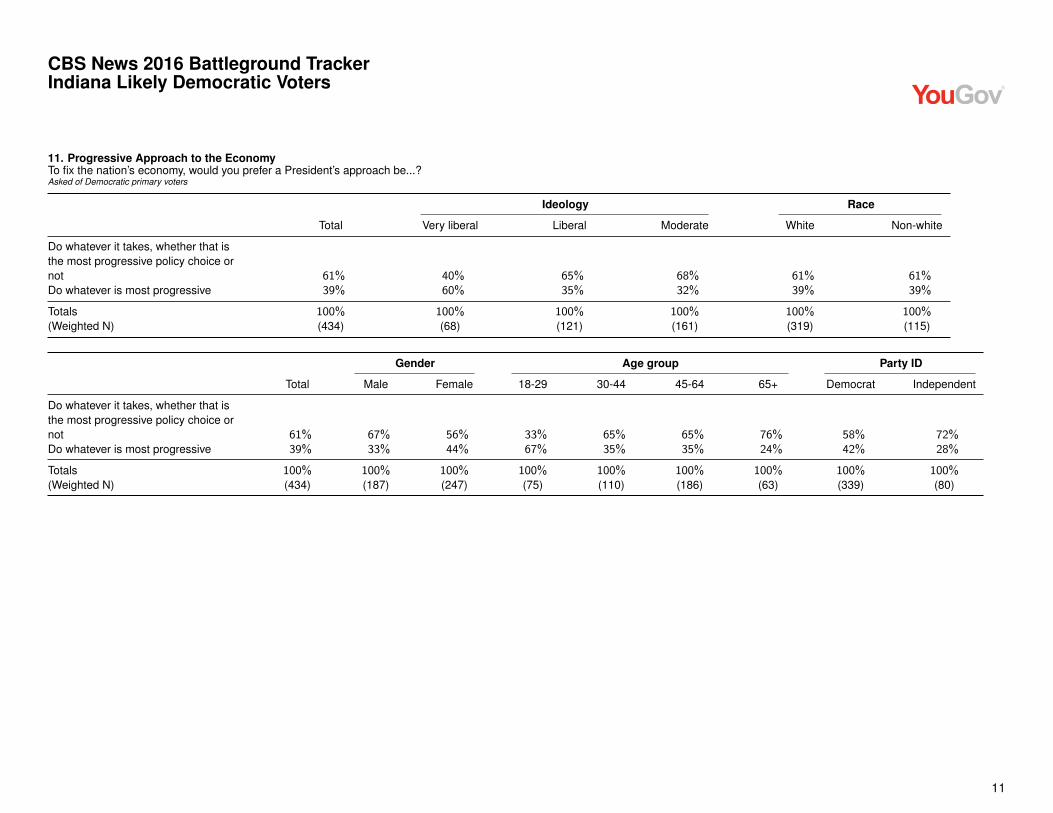
Do whatever it takes, whether that is the most progressive policy choice or not. . . . . . . . . . . . . . . . . . . . . . . . . . . . . . . . . . . . . . . . . . . . . . . . . . . . . . . . . . . . . . . . . . . . . . . . . 61%
Do whatever is most progressive . . . . . . . . . . . . . . . . . . . . . . . . . . . . . . . . . . . . . . . . 39%
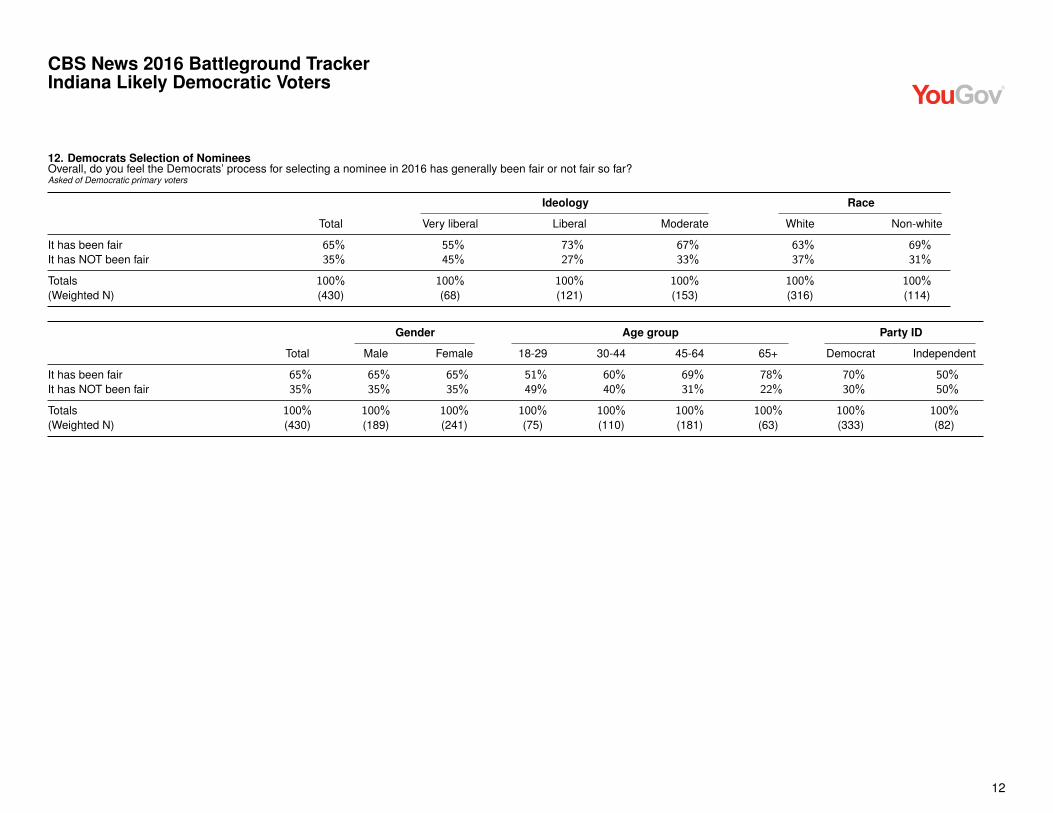
24. Overall, do you feel the Democrats’ process for selecting a nominee in 2016 has generallybeen fair or not fair so far?Asked of Democratic primary voters
It has been fair . . . . . . . . . . . . . . . . . . . . . . . . . . . . . . . . . . . . . . . . . . . . . . . . . . . . . . . . . .65%It has NOT been fair . . . . . . . . . . . . . . . . . . . . . . . . . . . . . . . . . . . . . . . . . . . . . . . . . . . . 35%
25. Which of the candidates do you feel is the most...?Asked of Democratic primary voters
Hillary Clinton Bernie SandersElectable inNovember 62% 38%Understanding ofpeople like you 42% 58%Effective at gettingthings done 64% 36%Authentic 33% 67%Specific about theirpolicy ideas 50% 50%Honest andtrustworthy 34% 66%
26. If Hillary Clinton does become the Democratic nominee, do you think the influence ofBernie Sanders’s campaign will have been...?Asked of Democratic primary voters
Positive, by making her adopt even more progressive views . . . . . . . . . . . . . 44%Negative, by making too many criticisms of her . . . . . . . . . . . . . . . . . . . . . . . . . . 12%Neither positive nor negative, it’s just politics . . . . . . . . . . . . . . . . . . . . . . . . . . . . 39%I don’t think she will become the nominee . . . . . . . . . . . . . . . . . . . . . . . . . . . . . . . . 5%
6
CBS News 2016 Battleground Tracker
Indiana
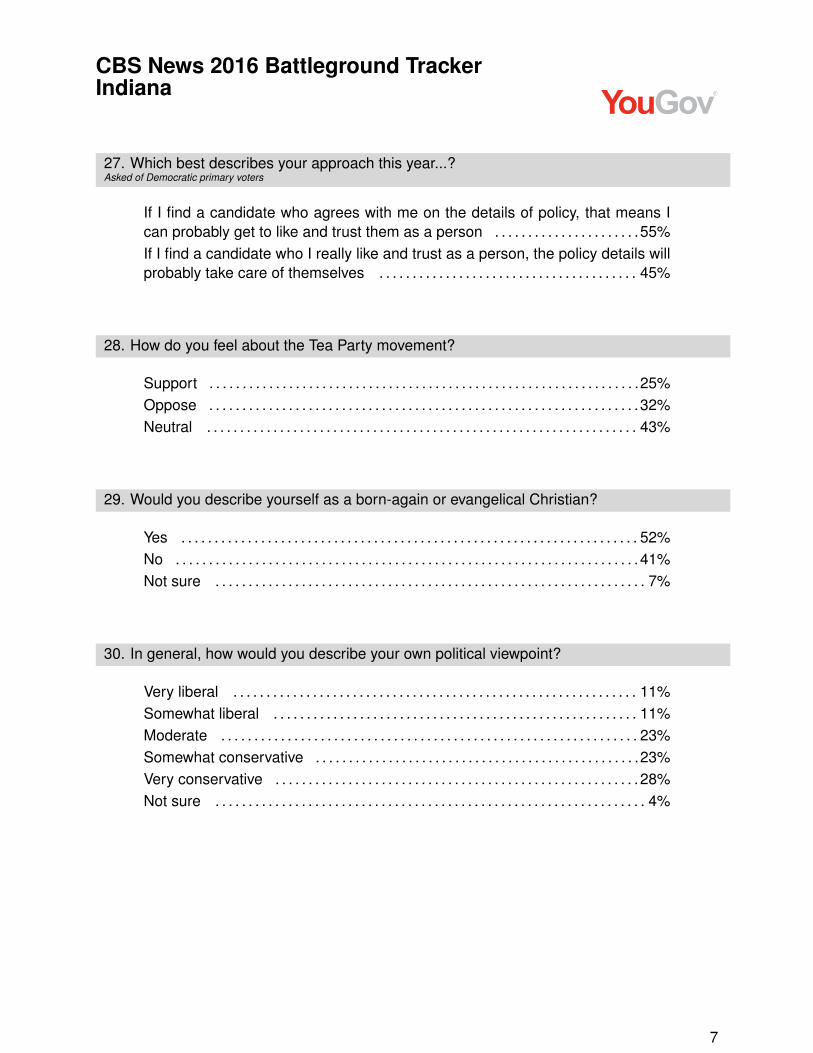
27. Which best describes your approach this year...?Asked of Democratic primary voters
If I find a candidate who agrees with me on the details of policy, that means Ican probably get to like and trust them as a person . . . . . . . . . . . . . . . . . . . . . .55%If I find a candidate who I really like and trust as a person, the policy details willprobably take care of themselves . . . . . . . . . . . . . . . . . . . . . . . . . . . . . . . . . . . . . . . 45%
28. How do you feel about the Tea Party movement?
Support . . . . . . . . . . . . . . . . . . . . . . . . . . . . . . . . . . . . . . . . . . . . . . . . . . . . . . . . . . . . . . . . .25%Oppose . . . . . . . . . . . . . . . . . . . . . . . . . . . . . . . . . . . . . . . . . . . . . . . . . . . . . . . . . . . . . . . . .32%Neutral . . . . . . . . . . . . . . . . . . . . . . . . . . . . . . . . . . . . . . . . . . . . . . . . . . . . . . . . . . . . . . . . . 43%
29. Would you describe yourself as a born-again or evangelical Christian?
Yes . . . . . . . . . . . . . . . . . . . . . . . . . . . . . . . . . . . . . . . . . . . . . . . . . . . . . . . . . . . . . . . . . . . . . 52%No . . . . . . . . . . . . . . . . . . . . . . . . . . . . . . . . . . . . . . . . . . . . . . . . . . . . . . . . . . . . . . . . . . . . . .41%Not sure . . . . . . . . . . . . . . . . . . . . . . . . . . . . . . . . . . . . . . . . . . . . . . . . . . . . . . . . . . . . . . . . . 7%
30. In general, how would you describe your own political viewpoint?
Very liberal . . . . . . . . . . . . . . . . . . . . . . . . . . . . . . . . . . . . . . . . . . . . . . . . . . . . . . . . . . . . . 11%Somewhat liberal . . . . . . . . . . . . . . . . . . . . . . . . . . . . . . . . . . . . . . . . . . . . . . . . . . . . . . . 11%Moderate . . . . . . . . . . . . . . . . . . . . . . . . . . . . . . . . . . . . . . . . . . . . . . . . . . . . . . . . . . . . . . . 23%Somewhat conservative . . . . . . . . . . . . . . . . . . . . . . . . . . . . . . . . . . . . . . . . . . . . . . . . .23%Very conservative . . . . . . . . . . . . . . . . . . . . . . . . . . . . . . . . . . . . . . . . . . . . . . . . . . . . . . .28%Not sure . . . . . . . . . . . . . . . . . . . . . . . . . . . . . . . . . . . . . . . . . . . . . . . . . . . . . . . . . . . . . . . . . 4%
7

CBS News 2016 Battleground Tracker
Indiana
31. Generally speaking, do you think of yourself as a...?
Strong Democrat . . . . . . . . . . . . . . . . . . . . . . . . . . . . . . . . . . . . . . . . . . . . . . . . . . . . . . . 23%Not very strong Democrat . . . . . . . . . . . . . . . . . . . . . . . . . . . . . . . . . . . . . . . . . . . . . . . . 7%Lean Democrat . . . . . . . . . . . . . . . . . . . . . . . . . . . . . . . . . . . . . . . . . . . . . . . . . . . . . . . . . . 8%Independent . . . . . . . . . . . . . . . . . . . . . . . . . . . . . . . . . . . . . . . . . . . . . . . . . . . . . . . . . . . . 11%Lean Republican . . . . . . . . . . . . . . . . . . . . . . . . . . . . . . . . . . . . . . . . . . . . . . . . . . . . . . . .11%Not very strong Republican . . . . . . . . . . . . . . . . . . . . . . . . . . . . . . . . . . . . . . . . . . . . . 11%Strong Republican . . . . . . . . . . . . . . . . . . . . . . . . . . . . . . . . . . . . . . . . . . . . . . . . . . . . . . 26%Not sure . . . . . . . . . . . . . . . . . . . . . . . . . . . . . . . . . . . . . . . . . . . . . . . . . . . . . . . . . . . . . . . . . 3%
32. Are you male or female?
Male . . . . . . . . . . . . . . . . . . . . . . . . . . . . . . . . . . . . . . . . . . . . . . . . . . . . . . . . . . . . . . . . . . . .46%Female . . . . . . . . . . . . . . . . . . . . . . . . . . . . . . . . . . . . . . . . . . . . . . . . . . . . . . . . . . . . . . . . . 54%
33. In what year were you born? [Age recoded from birth year]
18-29 . . . . . . . . . . . . . . . . . . . . . . . . . . . . . . . . . . . . . . . . . . . . . . . . . . . . . . . . . . . . . . . . . . . 15%30-44 . . . . . . . . . . . . . . . . . . . . . . . . . . . . . . . . . . . . . . . . . . . . . . . . . . . . . . . . . . . . . . . . . . . 20%45-64 . . . . . . . . . . . . . . . . . . . . . . . . . . . . . . . . . . . . . . . . . . . . . . . . . . . . . . . . . . . . . . . . . . . 44%65+ . . . . . . . . . . . . . . . . . . . . . . . . . . . . . . . . . . . . . . . . . . . . . . . . . . . . . . . . . . . . . . . . . . . . . 21%
34. What racial or ethnic group best describes you?
White . . . . . . . . . . . . . . . . . . . . . . . . . . . . . . . . . . . . . . . . . . . . . . . . . . . . . . . . . . . . . . . . . . . 84%Black . . . . . . . . . . . . . . . . . . . . . . . . . . . . . . . . . . . . . . . . . . . . . . . . . . . . . . . . . . . . . . . . . . . 10%Hispanic . . . . . . . . . . . . . . . . . . . . . . . . . . . . . . . . . . . . . . . . . . . . . . . . . . . . . . . . . . . . . . . . . 1%Other . . . . . . . . . . . . . . . . . . . . . . . . . . . . . . . . . . . . . . . . . . . . . . . . . . . . . . . . . . . . . . . . . . . . 5%
35. What is the highest level of education you have completed?
HS or less . . . . . . . . . . . . . . . . . . . . . . . . . . . . . . . . . . . . . . . . . . . . . . . . . . . . . . . . . . . . . . 38%Some college . . . . . . . . . . . . . . . . . . . . . . . . . . . . . . . . . . . . . . . . . . . . . . . . . . . . . . . . . . . 36%College grad . . . . . . . . . . . . . . . . . . . . . . . . . . . . . . . . . . . . . . . . . . . . . . . . . . . . . . . . . . . . 14%Post grad . . . . . . . . . . . . . . . . . . . . . . . . . . . . . . . . . . . . . . . . . . . . . . . . . . . . . . . . . . . . . . . 12%
8

CBS News 2016 Battleground TrackerIndiana
1. Likelihood of VotingHow likely is it that you will vote in the 2016 Presidential primary in Indiana?
Gender Age group Race/Ethnicity
Total Male Female 18-29 30-44 45-64 65+ White Black Hispanic Other
Definitely will vote 82% 80% 83% 72% 84% 82% 87% 81% 92% ⇤ ⇤Probably will vote 9% 11% 7% 16% 7% 8% 5% 9% 4% ⇤ ⇤Maybe will vote 2% 2% 3% 4% 4% 2% 1% 2% 4% ⇤ ⇤Probably will not vote 2% 2% 2% 2% 3% 2% 1% 2% 0% ⇤ ⇤Definitely will not vote 1% 1% 0% 0% 0% 1% 1% 1% 0% ⇤ ⇤Already voted early or absentee 3% 3% 3% 5% 0% 3% 4% 3% 0% ⇤ ⇤Don’t know 1% 1% 2% 1% 2% 2% 1% 2% 0% ⇤ ⇤
Totals 100% 100% 100% 100% 100% 100% 100% 100% 100% ⇤ ⇤(Weighted N) (1,084) (500) (584) (166) (213) (475) (230) (914) (105) (16) (50)
1
CBS News 2016 Battleground TrackerIndiana
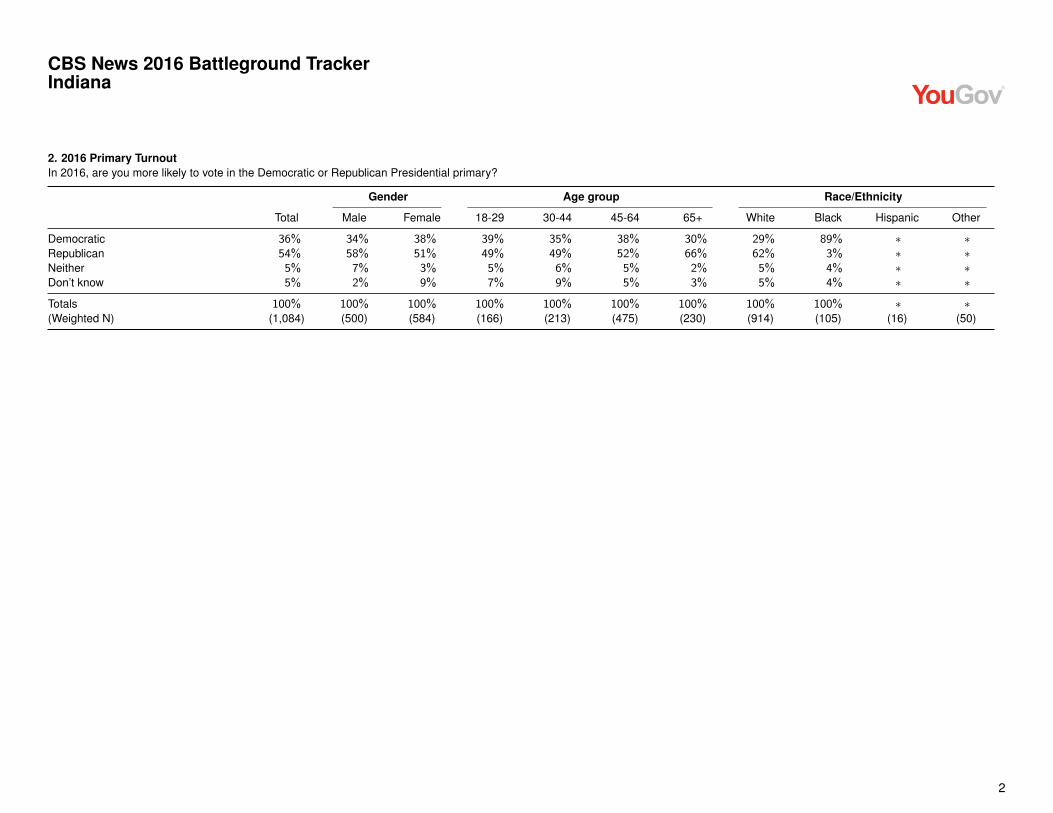
2. 2016 Primary TurnoutIn 2016, are you more likely to vote in the Democratic or Republican Presidential primary?
Gender Age group Race/Ethnicity
Total Male Female 18-29 30-44 45-64 65+ White Black Hispanic Other
Democratic 36% 34% 38% 39% 35% 38% 30% 29% 89% ⇤ ⇤Republican 54% 58% 51% 49% 49% 52% 66% 62% 3% ⇤ ⇤Neither 5% 7% 3% 5% 6% 5% 2% 5% 4% ⇤ ⇤Don’t know 5% 2% 9% 7% 9% 5% 3% 5% 4% ⇤ ⇤
Totals 100% 100% 100% 100% 100% 100% 100% 100% 100% ⇤ ⇤(Weighted N) (1,084) (500) (584) (166) (213) (475) (230) (914) (105) (16) (50)
2

CBS News 2016 Battleground TrackerIndiana
3. First Choice Republican CandidateWhich candidate are you most likely to vote for in the Indiana Republican Presidential primary in 2016?Asked of Republican primary voters
Gender Age group Race/Ethnicity
Total Male Female 18-29 30-44 45-64 65+ White Black Hispanic Other
Ted Cruz 35% 36% 34% 36% 47% 34% 21% 35% ⇤ ⇤ ⇤John Kasich 20% 20% 20% 38% 17% 15% 17% 20% ⇤ ⇤ ⇤Donald Trump 40% 42% 39% 21% 32% 47% 57% 40% ⇤ ⇤ ⇤No preference 5% 3% 7% 6% 5% 4% 6% 5% ⇤ ⇤ ⇤
Totals 100% 100% 100% 100% 100% 100% 100% 100% ⇤ ⇤ ⇤(Weighted N) (547) (276) (271) (96) (132) (224) (94) (530) (2) (0) (15)
3
CBS News 2016 Battleground TrackerIndiana
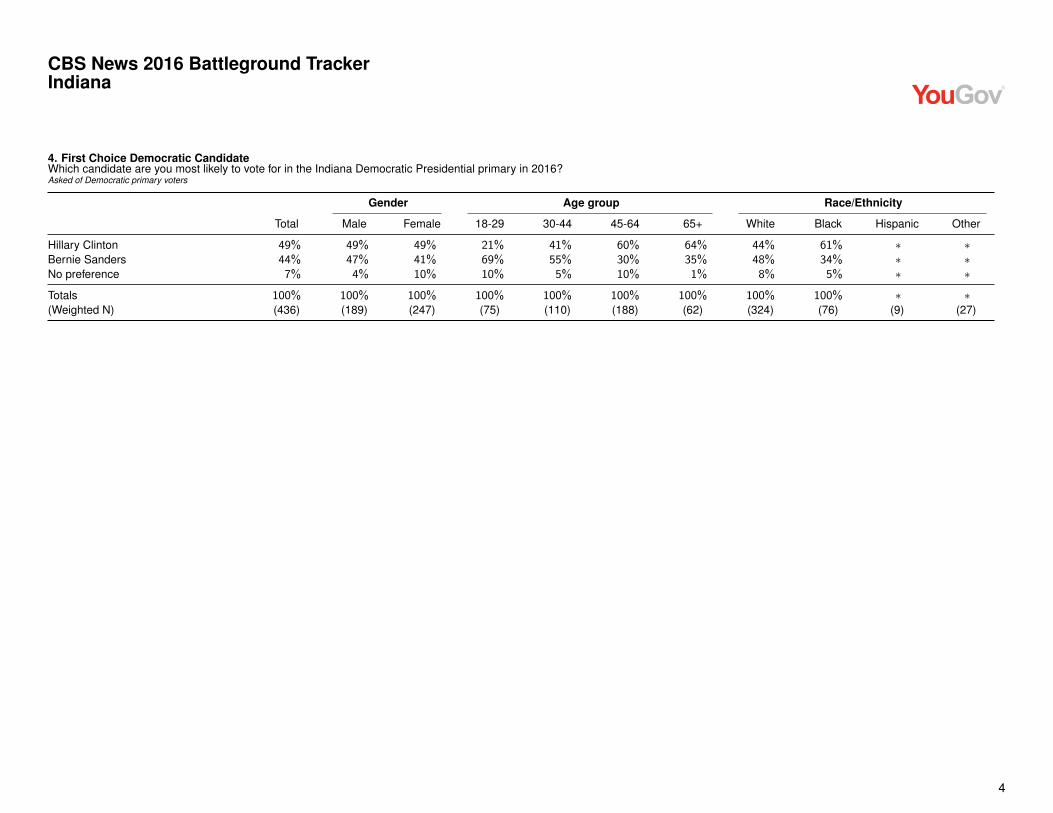
4. First Choice Democratic CandidateWhich candidate are you most likely to vote for in the Indiana Democratic Presidential primary in 2016?Asked of Democratic primary voters
Gender Age group Race/Ethnicity
Total Male Female 18-29 30-44 45-64 65+ White Black Hispanic Other
Hillary Clinton 49% 49% 49% 21% 41% 60% 64% 44% 61% ⇤ ⇤Bernie Sanders 44% 47% 41% 69% 55% 30% 35% 48% 34% ⇤ ⇤No preference 7% 4% 10% 10% 5% 10% 1% 8% 5% ⇤ ⇤
Totals 100% 100% 100% 100% 100% 100% 100% 100% 100% ⇤ ⇤(Weighted N) (436) (189) (247) (75) (110) (188) (62) (324) (76) (9) (27)
4

CBS News 2016 Battleground TrackerIndiana
5. Republican Candidate SupportWhich best describes your support for [First Choice Candidate Name] right now?Asked of Republican primary voters
Gender Age group Race/Ethnicity
Total Male Female 18-29 30-44 45-64 65+ White Black Hispanic Other
Very strong 47% 51% 42% 30% 45% 51% 57% 47% ⇤ ⇤ ⇤Strong 33% 31% 35% 53% 28% 28% 28% 33% ⇤ ⇤ ⇤Somewhat strong 16% 14% 18% 17% 20% 14% 13% 15% ⇤ ⇤ ⇤Not too strong 4% 5% 6% 0% 8% 7% 2% 5% ⇤ ⇤ ⇤
Totals 100% 100% 100% 100% 100% 100% 100% 100% ⇤ ⇤ ⇤(Weighted N) (513) (262) (251) (91) (125) (211) (85) (497) (2) (0) (14)
5
CBS News 2016 Battleground TrackerIndiana
6. Democratic Candidate SupportWhich best describes your support for [First Choice Candidate Name] right now?Asked of Democratic primary voters
Gender Age group Race/Ethnicity
Total Male Female 18-29 30-44 45-64 65+ White Black Hispanic Other
Very strong – I’ve decided 56% 50% 61% 62% 57% 52% 60% 56% 66% ⇤ ⇤Strong – I probably won’t change 24% 27% 22% 19% 24% 26% 26% 20% 32% ⇤ ⇤Somewhat strong – I might stillchange 19% 21% 17% 19% 18% 22% 11% 23% 2% ⇤ ⇤Not too strong – I’ll probably keeplooking 1% 1% 0% 0% 1% 0% 3% 1% 0% ⇤ ⇤
Totals 100% 100% 100% 100% 100% 100% 100% 100% 100% ⇤ ⇤(Weighted N) (385) (173) (212) (64) (102) (163) (57) (281) (72) (6) (26)
6

CBS News 2016 Battleground TrackerIndiana
7. Republican Nominee Satisfaction – Donald TrumpRegardless of how you are voting, how would you feel about each of these candidates if they became the Republican nominee?Asked of Republican primary voters
Gender Age group Race/Ethnicity
Total Male Female 18-29 30-44 45-64 65+ White Black Hispanic Other
Enthusiastic 30% 27% 32% 17% 19% 34% 47% 29% ⇤ ⇤ ⇤Satisfied 32% 41% 23% 31% 37% 33% 25% 33% ⇤ ⇤ ⇤Dissatisfied 17% 12% 21% 10% 22% 17% 16% 17% ⇤ ⇤ ⇤Upset 21% 19% 24% 42% 22% 16% 12% 21% ⇤ ⇤ ⇤
Totals 100% 100% 100% 100% 100% 100% 100% 100% ⇤ ⇤ ⇤(Weighted N) (546) (275) (270) (96) (132) (224) (94) (530) (2) (0) (14)
7
CBS News 2016 Battleground TrackerIndiana
8. Republican Nominee Satisfaction – Ted CruzRegardless of how you are voting, how would you feel about each of these candidates if they became the Republican nominee?Asked of Republican primary voters
Gender Age group Race/Ethnicity
Total Male Female 18-29 30-44 45-64 65+ White Black Hispanic Other
Enthusiastic 20% 23% 18% 16% 24% 22% 16% 20% ⇤ ⇤ ⇤Satisfied 37% 35% 39% 36% 46% 34% 35% 37% ⇤ ⇤ ⇤Dissatisfied 24% 19% 29% 11% 24% 27% 30% 23% ⇤ ⇤ ⇤Upset 19% 23% 14% 37% 7% 17% 19% 19% ⇤ ⇤ ⇤
Totals 100% 100% 100% 100% 100% 100% 100% 100% ⇤ ⇤ ⇤(Weighted N) (545) (275) (270) (96) (132) (223) (94) (529) (2) (0) (15)
8

CBS News 2016 Battleground TrackerIndiana
9. Republican Nominee Satisfaction – John KasichRegardless of how you are voting, how would you feel about each of these candidates if they became the Republican nominee?Asked of Republican primary voters
Gender Age group Race/Ethnicity
Total Male Female 18-29 30-44 45-64 65+ White Black Hispanic Other
Enthusiastic 11% 11% 10% 16% 4% 10% 16% 11% ⇤ ⇤ ⇤Satisfied 47% 51% 43% 55% 52% 44% 40% 47% ⇤ ⇤ ⇤Dissatisfied 31% 25% 37% 22% 35% 33% 28% 31% ⇤ ⇤ ⇤Upset 11% 13% 10% 7% 9% 13% 16% 11% ⇤ ⇤ ⇤
Totals 100% 100% 100% 100% 100% 100% 100% 100% ⇤ ⇤ ⇤(Weighted N) (545) (275) (270) (96) (132) (223) (94) (530) (2) (0) (14)
9

CBS News 2016 Battleground TrackerIndiana
10. Recent View of Republican Candidates – Donald TrumpIn recent weeks, has your view of each of these candidates...?Asked of Republican primary voters
Gender Age group Race/Ethnicity
Total Male Female 18-29 30-44 45-64 65+ White Black Hispanic Other
Gotten better 25% 29% 22% 12% 17% 31% 38% 25% ⇤ ⇤ ⇤Gotten worse 28% 25% 32% 49% 25% 25% 18% 28% ⇤ ⇤ ⇤Stayed the same 46% 47% 46% 40% 58% 43% 44% 47% ⇤ ⇤ ⇤
Totals 100% 100% 100% 100% 100% 100% 100% 100% ⇤ ⇤ ⇤(Weighted N) (536) (269) (267) (95) (130) (217) (94) (519) (2) (0) (15)
10

CBS News 2016 Battleground TrackerIndiana
11. Recent View of Republican Candidates – Ted CruzIn recent weeks, has your view of each of these candidates...?Asked of Republican primary voters
Gender Age group Race/Ethnicity
Total Male Female 18-29 30-44 45-64 65+ White Black Hispanic Other
Gotten better 18% 21% 16% 15% 20% 20% 16% 18% ⇤ ⇤ ⇤Gotten worse 28% 27% 29% 23% 19% 31% 37% 28% ⇤ ⇤ ⇤Stayed the same 54% 52% 56% 62% 60% 49% 47% 54% ⇤ ⇤ ⇤
Totals 100% 100% 100% 100% 100% 100% 100% 100% ⇤ ⇤ ⇤(Weighted N) (536) (268) (268) (96) (130) (217) (93) (521) (2) (0) (14)
11

CBS News 2016 Battleground TrackerIndiana
12. Recent View of Republican Candidates – John KasichIn recent weeks, has your view of each of these candidates...?Asked of Republican primary voters
Gender Age group Race/Ethnicity
Total Male Female 18-29 30-44 45-64 65+ White Black Hispanic Other
Gotten better 16% 17% 15% 3% 10% 21% 27% 16% ⇤ ⇤ ⇤Gotten worse 17% 22% 12% 13% 15% 17% 22% 16% ⇤ ⇤ ⇤Stayed the same 67% 61% 72% 84% 75% 61% 51% 67% ⇤ ⇤ ⇤
Totals 100% 100% 100% 100% 100% 100% 100% 100% ⇤ ⇤ ⇤(Weighted N) (537) (268) (268) (96) (130) (217) (93) (520) (2) (0) (15)
12

CBS News 2016 Battleground TrackerIndiana
13. Candidate Choice Against TrumpWhich best describes your vote for [First Choice Candidate Name]? Is it mainly because...?Asked of Republican primary voters who support Kasich or Cruz
Gender Age group Race/Ethnicity
Total Male Female 18-29 30-44 45-64 65+ White Black Hispanic Other
You like [First Choice CandidateName] as the nominee, no matter whothe opposition is 50% 59% 40% 27% 45% 65% ⇤ 50% ⇤ ⇤ ⇤You’d like to stop Donald Trump frombecoming the nominee 23% 10% 37% 26% 38% 14% ⇤ 23% ⇤ ⇤ ⇤Both 27% 32% 22% 46% 16% 22% ⇤ 27% ⇤ ⇤ ⇤
Totals 100% 100% 100% 100% 100% 100% ⇤ 100% ⇤ ⇤ ⇤(Weighted N) (299) (153) (146) (71) (83) (110) (35) (291) (0) (0) (7)
13

CBS News 2016 Battleground TrackerIndiana
14. Candidate Choice Against Cruz or KasichWhich best describes your vote for [First Choice Candidate Name]? Is it mainly because...?Asked of Republican primary voters who support Trump
Gender Age group Race/Ethnicity
Total Male Female 18-29 30-44 45-64 65+ White Black Hispanic Other
You like [First Choice CandidateName] as the nominee, no matter whothe opposition is 65% 67% 63% ⇤ ⇤ 63% 61% 65% ⇤ ⇤ ⇤You’d like to stop Ted Cruz or JohnKasich from becoming the nominee 8% 11% 6% ⇤ ⇤ 8% 7% 8% ⇤ ⇤ ⇤Both 27% 22% 31% ⇤ ⇤ 29% 32% 27% ⇤ ⇤ ⇤
Totals 100% 100% 100% ⇤ ⇤ 100% 100% 100% ⇤ ⇤ ⇤(Weighted N) (220) (114) (106) (20) (42) (105) (53) (211) (2) (0) (7)
14

CBS News 2016 Battleground TrackerIndiana
15. Likely Republican Nominee – Donald TrumpRegardless of your own vote, do you think each candidate’s chances of becoming the nominee are...?Asked of Republican primary voters
Gender Age group Race/Ethnicity
Total Male Female 18-29 30-44 45-64 65+ White Black Hispanic Other
Very Likely 64% 66% 62% 47% 63% 67% 75% 64% ⇤ ⇤ ⇤Somewhat likely 30% 29% 32% 43% 37% 25% 21% 30% ⇤ ⇤ ⇤Not too likely 6% 6% 6% 10% 0% 8% 3% 6% ⇤ ⇤ ⇤
Totals 100% 100% 100% 100% 100% 100% 100% 100% ⇤ ⇤ ⇤(Weighted N) (546) (275) (271) (96) (132) (224) (94) (530) (2) (0) (15)
15

CBS News 2016 Battleground TrackerIndiana
16. Likely Republican Nominee – Ted CruzRegardless of your own vote, do you think each candidate’s chances of becoming the nominee are...?Asked of Republican primary voters
Gender Age group Race/Ethnicity
Total Male Female 18-29 30-44 45-64 65+ White Black Hispanic Other
Very Likely 9% 8% 9% 4% 9% 12% 6% 9% ⇤ ⇤ ⇤Somewhat likely 63% 61% 64% 66% 63% 61% 64% 63% ⇤ ⇤ ⇤Not too likely 28% 30% 27% 31% 29% 27% 30% 28% ⇤ ⇤ ⇤
Totals 100% 100% 100% 100% 100% 100% 100% 100% ⇤ ⇤ ⇤(Weighted N) (547) (276) (272) (96) (132) (225) (94) (531) (2) (0) (15)
16

CBS News 2016 Battleground TrackerIndiana
17. Likely Republican Nominee – John KasichRegardless of your own vote, do you think each candidate’s chances of becoming the nominee are...?Asked of Republican primary voters
Gender Age group Race/Ethnicity
Total Male Female 18-29 30-44 45-64 65+ White Black Hispanic Other
Very Likely 2% 3% 1% 0% 5% 0% 2% 2% ⇤ ⇤ ⇤Somewhat likely 16% 14% 18% 26% 13% 14% 15% 16% ⇤ ⇤ ⇤Not too likely 82% 83% 81% 74% 81% 86% 83% 83% ⇤ ⇤ ⇤
Totals 100% 100% 100% 100% 100% 100% 100% 100% ⇤ ⇤ ⇤(Weighted N) (547) (276) (271) (96) (132) (224) (94) (530) (2) (0) (15)
17

CBS News 2016 Battleground TrackerIndiana
18. Importance of Winning GeneralWhat’s more important to you right now?Asked of Republican primary voters
Gender Age group Race/Ethnicity
Total Male Female 18-29 30-44 45-64 65+ White Black Hispanic Other
The Republican party nominatessomeone I can fully support, whetheror not they win the Presidency 44% 41% 47% 61% 56% 37% 27% 44% ⇤ ⇤ ⇤The Republican party wins thePresidency, even if I don’t entirely likethe candidate 56% 59% 53% 39% 44% 63% 73% 56% ⇤ ⇤ ⇤
Totals 100% 100% 100% 100% 100% 100% 100% 100% ⇤ ⇤ ⇤(Weighted N) (544) (274) (271) (96) (132) (222) (95) (528) (2) (0) (14)
18

CBS News 2016 Battleground TrackerIndiana
19. Conservative Approach to the EconomyTo fix the nation’s economy, would you prefer a President’s approach be...?Asked of Republican primary voters
Gender Age group Race/Ethnicity
Total Male Female 18-29 30-44 45-64 65+ White Black Hispanic Other
Do whatever it takes, whether that isthe most conservative policy choice ornot 67% 68% 66% 79% 55% 65% 76% 67% ⇤ ⇤ ⇤Do whatever is most conservative 33% 32% 34% 21% 45% 35% 24% 33% ⇤ ⇤ ⇤
Totals 100% 100% 100% 100% 100% 100% 100% 100% ⇤ ⇤ ⇤(Weighted N) (547) (276) (271) (96) (132) (224) (95) (530) (2) (0) (15)
19

CBS News 2016 Battleground TrackerIndiana
20. Republican Approach to Candidate ChoiceWhich best describes your approach this year...?Asked of Republican primary voters
Gender Age group Race/Ethnicity
Total Male Female 18-29 30-44 45-64 65+ White Black Hispanic Other
If I find a candidate who agrees withme on the details of policy, that meansI can probably get to like and trustthem as a person 59% 61% 57% 64% 63% 60% 48% 58% ⇤ ⇤ ⇤If I find a candidate who I really likeand trust as a person, the policydetails will probably take care ofthemselves 41% 39% 43% 36% 37% 40% 52% 42% ⇤ ⇤ ⇤
Totals 100% 100% 100% 100% 100% 100% 100% 100% ⇤ ⇤ ⇤(Weighted N) (547) (275) (272) (96) (132) (223) (95) (530) (2) (0) (14)
20

CBS News 2016 Battleground TrackerIndiana
21. Republican Selection of NomineesOverall, do you feel the Republicans’ process for selecting a nominee in 2016 has generally been fair or not fair so far?Asked of Republican primary voters
Gender Age group Race/Ethnicity
Total Male Female 18-29 30-44 45-64 65+ White Black Hispanic Other
It has been fair 53% 58% 48% 53% 65% 49% 47% 54% ⇤ ⇤ ⇤It has NOT been fair 47% 42% 52% 47% 35% 51% 53% 46% ⇤ ⇤ ⇤
Totals 100% 100% 100% 100% 100% 100% 100% 100% ⇤ ⇤ ⇤(Weighted N) (536) (269) (266) (94) (132) (216) (94) (519) (2) (0) (15)
21

CBS News 2016 Battleground TrackerIndiana
22. Republican ConventionAs you may know, the Republican party requires a nominee to get 1,237 delegates in the primaries for the nomination. If Donald Trump does not get 1,237 butTrump still has more delegates than Ted Cruz, and more delegates than John Kasich, what do you feel Republicans should do at the convention this summer?Asked of Republican primary voters
Gender Age group Race/Ethnicity
Total Male Female 18-29 30-44 45-64 65+ White Black Hispanic Other
Select Trump, because he’ll still havemore delegates than any othercandidate 47% 50% 44% 29% 44% 52% 59% 47% ⇤ ⇤ ⇤Let Trump, Cruz and Kasich fight fordelegate support at the convention todecide the winner 45% 45% 45% 62% 47% 41% 33% 45% ⇤ ⇤ ⇤Turn to someone new who isn’trunning right now 8% 5% 11% 9% 9% 7% 8% 8% ⇤ ⇤ ⇤
Totals 100% 100% 100% 100% 100% 100% 100% 100% ⇤ ⇤ ⇤(Weighted N) (548) (276) (271) (96) (132) (225) (95) (531) (2) (0) (14)
22

CBS News 2016 Battleground TrackerIndiana
23. Trump General ElectionIf Donald Trump becomes the Republican nominee, how do you think he will approach the General election campaign this fall?Asked of Republican primary voters
Gender Age group Race/Ethnicity
Total Male Female 18-29 30-44 45-64 65+ White Black Hispanic Other
He will continue to be as outspokenas he is now 65% 63% 67% 56% 72% 64% 67% 65% ⇤ ⇤ ⇤He will be less outspoken than he isnow 17% 24% 9% 22% 11% 18% 18% 17% ⇤ ⇤ ⇤He will become more outspoken thanhe is now 18% 13% 23% 21% 18% 18% 14% 18% ⇤ ⇤ ⇤
Totals 100% 100% 100% 100% 100% 100% 100% 100% ⇤ ⇤ ⇤(Weighted N) (547) (276) (270) (96) (132) (224) (95) (530) (2) (0) (15)
23

CBS News 2016 Battleground TrackerIndiana
24. Democratic Nominee Satisfaction – Hillary ClintonRegardless of how you are voting, how would you feel about each of these candidates if they became the Democratic nominee?Asked of Democratic primary voters
Gender Age group Race/Ethnicity
Total Male Female 18-29 30-44 45-64 65+ White Black Hispanic Other
Enthusiastic 34% 30% 37% 31% 31% 33% 44% 28% 47% ⇤ ⇤Satisfied 39% 45% 35% 42% 33% 40% 45% 43% 34% ⇤ ⇤Dissatisfied 18% 12% 22% 25% 16% 20% 4% 19% 12% ⇤ ⇤Upset 9% 13% 6% 2% 21% 7% 8% 10% 7% ⇤ ⇤
Totals 100% 100% 100% 100% 100% 100% 100% 100% 100% ⇤ ⇤(Weighted N) (432) (188) (244) (74) (106) (186) (65) (318) (78) (9) (27)
24

CBS News 2016 Battleground TrackerIndiana
25. Democratic Nominee Satisfaction – Bernie SandersRegardless of how you are voting, how would you feel about each of these candidates if they became the Democratic nominee?Asked of Democratic primary voters
Gender Age group Race/Ethnicity
Total Male Female 18-29 30-44 45-64 65+ White Black Hispanic Other
Enthusiastic 39% 38% 40% 71% 34% 30% 36% 41% 35% ⇤ ⇤Satisfied 37% 44% 32% 20% 54% 34% 39% 37% 40% ⇤ ⇤Dissatisfied 21% 15% 26% 10% 11% 33% 17% 20% 25% ⇤ ⇤Upset 3% 3% 2% 0% 0% 3% 9% 3% 1% ⇤ ⇤
Totals 100% 100% 100% 100% 100% 100% 100% 100% 100% ⇤ ⇤(Weighted N) (419) (177) (241) (74) (99) (185) (60) (314) (78) (8) (19)
25
CBS News 2016 Battleground TrackerIndiana
26. Recent View of Democratic Candidates – Hillary ClintonIn recent weeks, has your view of each of these candidates...?Asked of Democratic primary voters
Gender Age group Race/Ethnicity
Total Male Female 18-29 30-44 45-64 65+ White Black Hispanic Other
Gotten better 27% 24% 30% 21% 16% 32% 40% 24% 38% ⇤ ⇤Gotten worse 21% 19% 22% 26% 30% 18% 10% 24% 8% ⇤ ⇤Stayed the same 51% 57% 48% 53% 54% 50% 51% 51% 54% ⇤ ⇤
Totals 100% 100% 100% 100% 100% 100% 100% 100% 100% ⇤ ⇤(Weighted N) (427) (179) (249) (75) (101) (187) (64) (320) (79) (9) (19)
26
CBS News 2016 Battleground TrackerIndiana
27. Recent View of Democratic Candidates – Bernie SandersIn recent weeks, has your view of each of these candidates...?Asked of Democratic primary voters
Gender Age group Race/Ethnicity
Total Male Female 18-29 30-44 45-64 65+ White Black Hispanic Other
Gotten better 37% 43% 32% 59% 43% 27% 27% 40% 20% ⇤ ⇤Gotten worse 15% 15% 16% 7% 5% 20% 27% 16% 10% ⇤ ⇤Stayed the same 48% 42% 52% 34% 51% 53% 46% 44% 70% ⇤ ⇤
Totals 100% 100% 100% 100% 100% 100% 100% 100% 100% ⇤ ⇤(Weighted N) (428) (184) (244) (75) (109) (183) (62) (316) (78) (8) (27)
27

CBS News 2016 Battleground TrackerIndiana
28. Candidate Choice Against SandersDo you mainly see your vote choice right now as...?Asked of Democratic primary voters who support Clinton
Gender Age group Race/Ethnicity
Total Male Female 18-29 30-44 45-64 65+ White Black Hispanic Other
A chance to elect Hillary Clinton 99% 98% 100% ⇤ ⇤ 98% ⇤ 98% ⇤ ⇤ ⇤Mainly a vote against Bernie Sanders 1% 2% 0% ⇤ ⇤ 2% ⇤ 2% ⇤ ⇤ ⇤
Totals 100% 100% 100% ⇤ ⇤ 100% ⇤ 100% ⇤ ⇤ ⇤(Weighted N) (214) (93) (121) (16) (45) (114) (40) (141) (46) (8) (19)
28
CBS News 2016 Battleground TrackerIndiana
29. Candidate Choice Against ClintonDo you mainly see your vote choice right now as...?Asked of Democratic primary voters who support Sanders
Gender Age group Race/Ethnicity
Total Male Female 18-29 30-44 45-64 65+ White Black Hispanic Other
A chance to elect Bernie Sanders 88% 87% 88% 100% 85% 79% ⇤ 92% ⇤ ⇤ ⇤Mainly a vote against Hillary Clinton 12% 13% 12% 0% 15% 21% ⇤ 8% ⇤ ⇤ ⇤
Totals 100% 100% 100% 100% 100% 100% ⇤ 100% ⇤ ⇤ ⇤(Weighted N) (189) (89) (101) (52) (60) (56) (21) (156) (26) (1) (7)
29

CBS News 2016 Battleground TrackerIndiana
30. Likely Democratic Nominee – Hillary ClintonRegardless of your own vote, do you think each candidate’s chances of becoming the nominee are...?Asked of Democratic primary voters
Gender Age group Race/Ethnicity
Total Male Female 18-29 30-44 45-64 65+ White Black Hispanic Other
Very Likely 78% 87% 71% 57% 73% 83% 96% 75% 82% ⇤ ⇤Somewhat likely 17% 13% 20% 38% 23% 10% 3% 20% 11% ⇤ ⇤Not too likely 5% 0% 9% 5% 4% 7% 1% 5% 6% ⇤ ⇤
Totals 100% 100% 100% 100% 100% 100% 100% 100% 100% ⇤ ⇤(Weighted N) (435) (186) (249) (75) (110) (188) (63) (321) (79) (9) (27)
30
CBS News 2016 Battleground TrackerIndiana
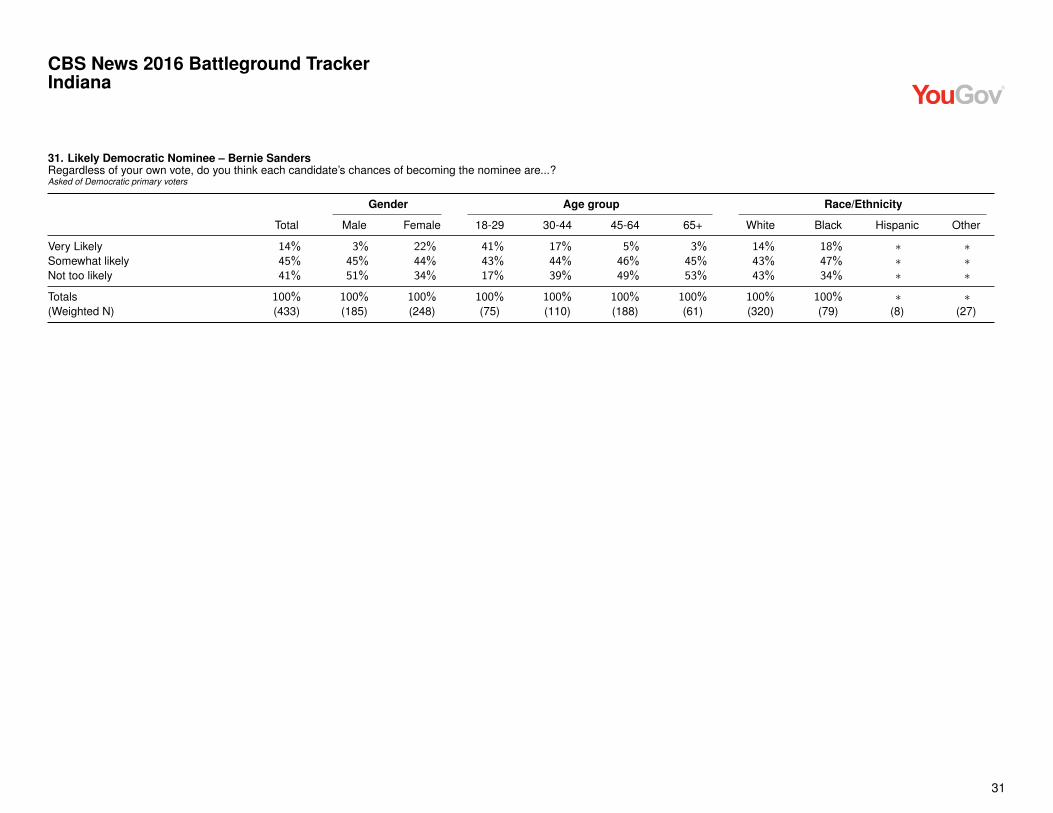
31. Likely Democratic Nominee – Bernie SandersRegardless of your own vote, do you think each candidate’s chances of becoming the nominee are...?Asked of Democratic primary voters
Gender Age group Race/Ethnicity
Total Male Female 18-29 30-44 45-64 65+ White Black Hispanic Other
Very Likely 14% 3% 22% 41% 17% 5% 3% 14% 18% ⇤ ⇤Somewhat likely 45% 45% 44% 43% 44% 46% 45% 43% 47% ⇤ ⇤Not too likely 41% 51% 34% 17% 39% 49% 53% 43% 34% ⇤ ⇤
Totals 100% 100% 100% 100% 100% 100% 100% 100% 100% ⇤ ⇤(Weighted N) (433) (185) (248) (75) (110) (188) (61) (320) (79) (8) (27)
31

CBS News 2016 Battleground TrackerIndiana
32. Progressive Approach to the EconomyTo fix the nation’s economy, would you prefer a President’s approach be...?Asked of Democratic primary voters
Gender Age group Race/Ethnicity
Total Male Female 18-29 30-44 45-64 65+ White Black Hispanic Other
Do whatever it takes, whether that isthe most progressive policy choice ornot 61% 67% 56% 33% 65% 65% 76% 61% 65% ⇤ ⇤Do whatever is most progressive 39% 33% 44% 67% 35% 35% 24% 39% 35% ⇤ ⇤
Totals 100% 100% 100% 100% 100% 100% 100% 100% 100% ⇤ ⇤(Weighted N) (434) (187) (247) (75) (110) (186) (63) (319) (79) (9) (27)
32

CBS News 2016 Battleground TrackerIndiana
33. Democrats Selection of NomineesOverall, do you feel the Democrats’ process for selecting a nominee in 2016 has generally been fair or not fair so far?Asked of Democratic primary voters
Gender Age group Race/Ethnicity
Total Male Female 18-29 30-44 45-64 65+ White Black Hispanic Other
It has been fair 65% 65% 65% 51% 60% 69% 78% 63% 68% ⇤ ⇤It has NOT been fair 35% 35% 35% 49% 40% 31% 22% 37% 32% ⇤ ⇤
Totals 100% 100% 100% 100% 100% 100% 100% 100% 100% ⇤ ⇤(Weighted N) (430) (189) (241) (75) (110) (181) (63) (316) (77) (9) (27)
33

CBS News 2016 Battleground TrackerIndiana
34. Democratic Candidate Traits – Electable in NovemberWhich of the candidates do you feel is the most...?Asked of Democratic primary voters
Gender Age group Race/Ethnicity
Total Male Female 18-29 30-44 45-64 65+ White Black Hispanic Other
Hillary Clinton 62% 66% 60% 41% 50% 71% 83% 60% 65% ⇤ ⇤Bernie Sanders 38% 34% 40% 59% 50% 29% 17% 40% 35% ⇤ ⇤
Totals 100% 100% 100% 100% 100% 100% 100% 100% 100% ⇤ ⇤(Weighted N) (430) (187) (243) (75) (107) (185) (63) (315) (79) (9) (27)
34

CBS News 2016 Battleground TrackerIndiana
35. Democratic Candidate Traits – Understanding of people like youWhich of the candidates do you feel is the most...?Asked of Democratic primary voters
Gender Age group Race/Ethnicity
Total Male Female 18-29 30-44 45-64 65+ White Black Hispanic Other
Hillary Clinton 42% 40% 44% 18% 36% 52% 52% 33% 68% ⇤ ⇤Bernie Sanders 58% 60% 56% 82% 64% 48% 48% 67% 32% ⇤ ⇤
Totals 100% 100% 100% 100% 100% 100% 100% 100% 100% ⇤ ⇤(Weighted N) (418) (184) (234) (75) (106) (175) (63) (305) (77) (9) (27)
35

CBS News 2016 Battleground TrackerIndiana
36. Democratic Candidate Traits – Effective at getting things doneWhich of the candidates do you feel is the most...?Asked of Democratic primary voters
Gender Age group Race/Ethnicity
Total Male Female 18-29 30-44 45-64 65+ White Black Hispanic Other
Hillary Clinton 64% 68% 62% 42% 54% 73% 83% 60% 77% ⇤ ⇤Bernie Sanders 36% 32% 38% 58% 46% 27% 17% 40% 23% ⇤ ⇤
Totals 100% 100% 100% 100% 100% 100% 100% 100% 100% ⇤ ⇤(Weighted N) (420) (186) (234) (75) (106) (176) (63) (304) (79) (9) (27)
36
CBS News 2016 Battleground TrackerIndiana
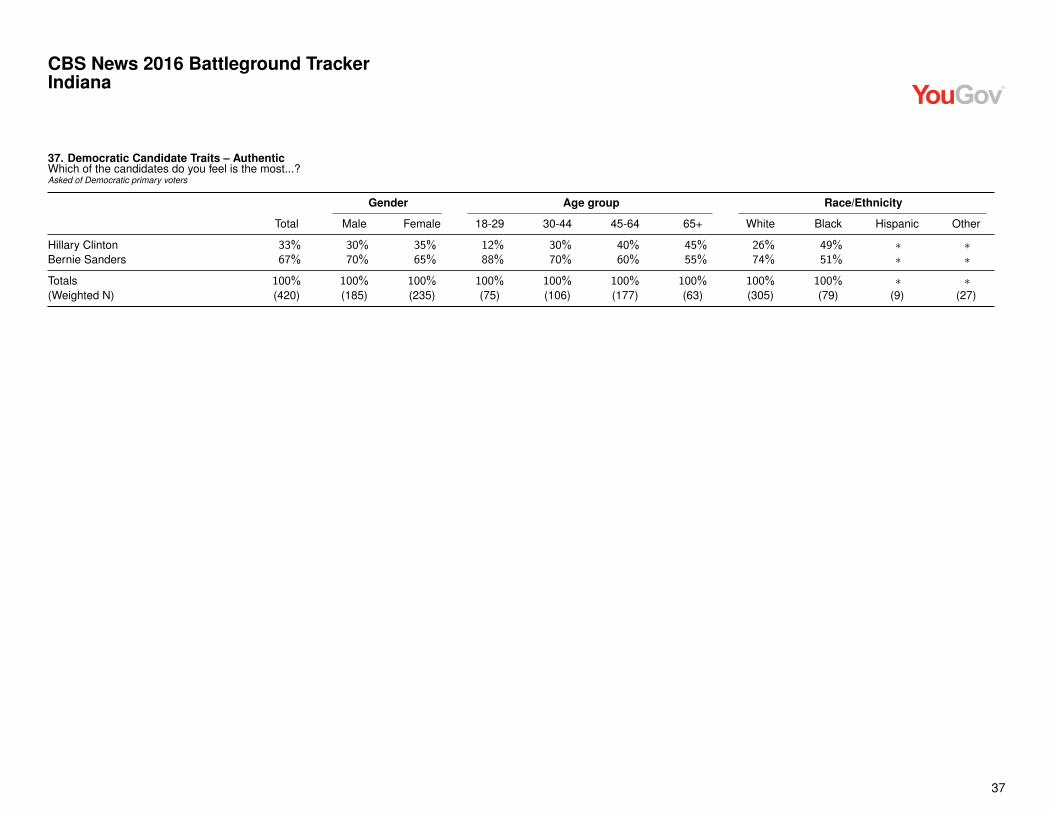
37. Democratic Candidate Traits – AuthenticWhich of the candidates do you feel is the most...?Asked of Democratic primary voters
Gender Age group Race/Ethnicity
Total Male Female 18-29 30-44 45-64 65+ White Black Hispanic Other
Hillary Clinton 33% 30% 35% 12% 30% 40% 45% 26% 49% ⇤ ⇤Bernie Sanders 67% 70% 65% 88% 70% 60% 55% 74% 51% ⇤ ⇤
Totals 100% 100% 100% 100% 100% 100% 100% 100% 100% ⇤ ⇤(Weighted N) (420) (185) (235) (75) (106) (177) (63) (305) (79) (9) (27)
37
CBS News 2016 Battleground TrackerIndiana
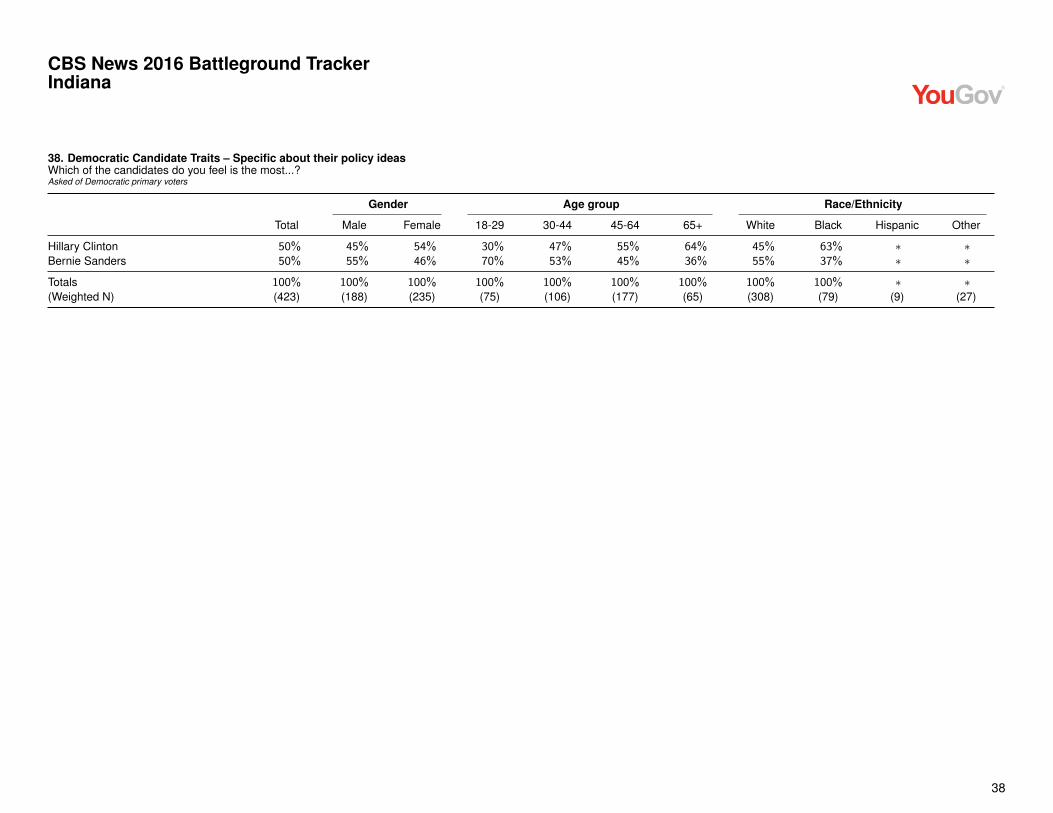
38. Democratic Candidate Traits – Specific about their policy ideasWhich of the candidates do you feel is the most...?Asked of Democratic primary voters
Gender Age group Race/Ethnicity
Total Male Female 18-29 30-44 45-64 65+ White Black Hispanic Other
Hillary Clinton 50% 45% 54% 30% 47% 55% 64% 45% 63% ⇤ ⇤Bernie Sanders 50% 55% 46% 70% 53% 45% 36% 55% 37% ⇤ ⇤
Totals 100% 100% 100% 100% 100% 100% 100% 100% 100% ⇤ ⇤(Weighted N) (423) (188) (235) (75) (106) (177) (65) (308) (79) (9) (27)
38
CBS News 2016 Battleground TrackerIndiana
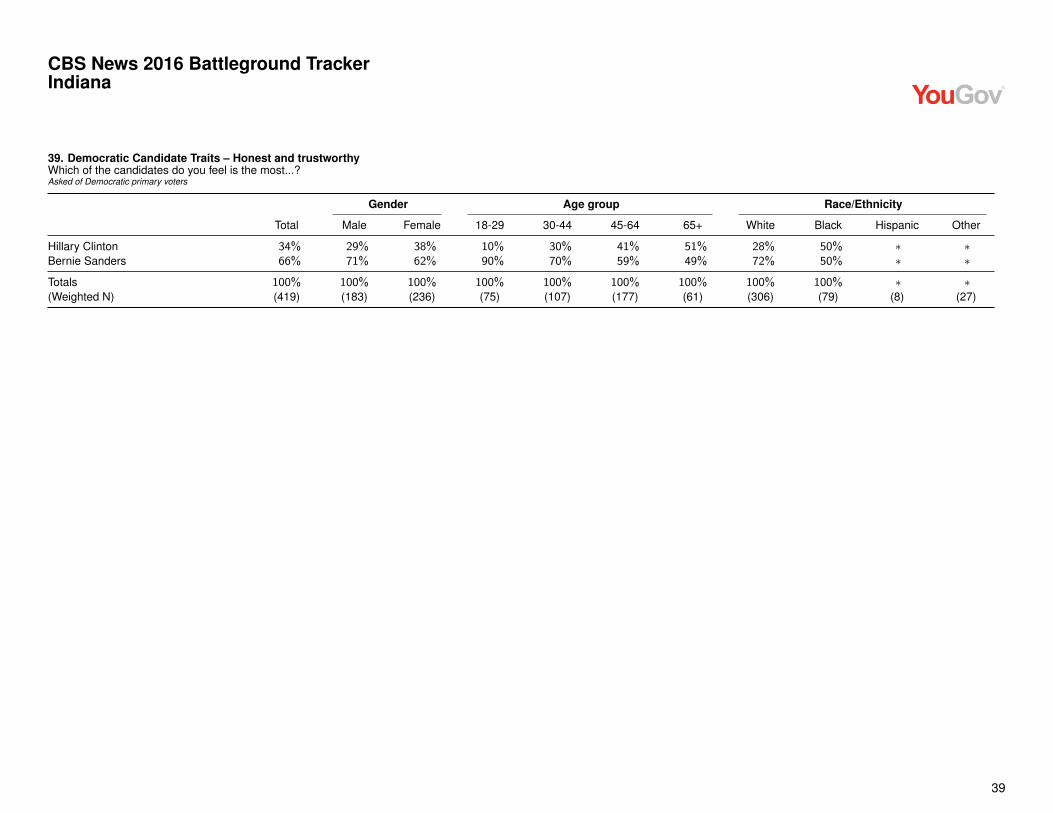
39. Democratic Candidate Traits – Honest and trustworthyWhich of the candidates do you feel is the most...?Asked of Democratic primary voters
Gender Age group Race/Ethnicity
Total Male Female 18-29 30-44 45-64 65+ White Black Hispanic Other
Hillary Clinton 34% 29% 38% 10% 30% 41% 51% 28% 50% ⇤ ⇤Bernie Sanders 66% 71% 62% 90% 70% 59% 49% 72% 50% ⇤ ⇤
Totals 100% 100% 100% 100% 100% 100% 100% 100% 100% ⇤ ⇤(Weighted N) (419) (183) (236) (75) (107) (177) (61) (306) (79) (8) (27)
39

CBS News 2016 Battleground TrackerIndiana
40. Influence of Sanders on Clinton CampaignIf Hillary Clinton does become the Democratic nominee, do you think the influence of Bernie Sanders’s campaign will have been...?Asked of Democratic primary voters
Gender Age group Race/Ethnicity
Total Male Female 18-29 30-44 45-64 65+ White Black Hispanic Other
Positive, by making her adopt evenmore progressive views 44% 51% 39% 39% 33% 51% 49% 47% 41% ⇤ ⇤Negative, by making too manycriticisms of her 12% 17% 8% 9% 22% 5% 17% 10% 9% ⇤ ⇤Neither positive nor negative, it’s justpolitics 39% 30% 46% 34% 43% 42% 31% 37% 48% ⇤ ⇤I don’t think she will become thenominee 5% 2% 7% 17% 2% 2% 3% 6% 3% ⇤ ⇤
Totals 100% 100% 100% 100% 100% 100% 100% 100% 100% ⇤ ⇤(Weighted N) (435) (189) (246) (75) (107) (188) (65) (320) (79) (9) (27)
40

CBS News 2016 Battleground TrackerIndiana
41. Democratic Approach to Candidate ChoiceWhich best describes your approach this year...?Asked of Democratic primary voters
Gender Age group Race/Ethnicity
Total Male Female 18-29 30-44 45-64 65+ White Black Hispanic Other
If I find a candidate who agrees withme on the details of policy, that meansI can probably get to like and trustthem as a person 55% 67% 46% 62% 58% 53% 48% 52% 61% ⇤ ⇤If I find a candidate who I really likeand trust as a person, the policydetails will probably take care ofthemselves 45% 33% 54% 38% 42% 47% 52% 48% 39% ⇤ ⇤
Totals 100% 100% 100% 100% 100% 100% 100% 100% 100% ⇤ ⇤(Weighted N) (426) (188) (237) (75) (103) (183) (65) (316) (76) (7) (27)
41

CBS News 2016 Battleground Tracker
Indiana Likely Republican Voters
Sample 548 Likely Republican Primary VotersConducted April 20-22, 2016Margin of Error ±6.6%
1. First Choice Republican Candidate
Which candidate are you most likely to vote for in the Indiana Republican Presidential primary in 2016?Asked of Republican primary voters
Ideology Tea Party Evangelical
Total Very conservative Conservative Moderate Yes No Yes No
Ted Cruz 35% 56% 28% 11% 48% 28% 42% 26%John Kasich 20% 6% 23% 39% 4% 28% 15% 27%Donald Trump 40% 35% 42% 45% 42% 40% 37% 42%No preference 5% 2% 6% 5% 6% 4% 6% 5%
Totals 100% 100% 100% 100% 100% 100% 100% 100%(Weighted N) (547) (198) (238) (93) (189) (355) (312) (200)
Gender Age group Party ID
Total Male Female 18-29 30-44 45-64 65+ Republican Independent
Ted Cruz 35% 36% 34% 36% 47% 34% 21% 39% 21%John Kasich 20% 20% 20% 38% 17% 15% 17% 20% 23%Donald Trump 40% 42% 39% 21% 32% 47% 57% 38% 48%No preference 5% 3% 7% 6% 5% 4% 6% 3% 8%
Totals 100% 100% 100% 100% 100% 100% 100% 100% 100%(Weighted N) (547) (276) (271) (96) (132) (224) (94) (419) (96)
1

CBS News 2016 Battleground Tracker
Indiana Likely Republican Voters
2. Republican Candidate Support
Which best describes your support for [First Choice Candidate Name] right now?Asked of Republican primary voters
Ideology Tea Party Evangelical
Total Very conservative Conservative Moderate Yes No Yes No
Very strong 47% 50% 44% 44% 57% 41% 42% 51%Strong 33% 31% 32% 38% 29% 34% 34% 31%Somewhat strong 16% 16% 16% 14% 11% 18% 16% 16%Not too strong 4% 3% 8% 4% 2% 6% 8% 1%
Totals 100% 100% 100% 100% 100% 100% 100% 100%(Weighted N) (513) (192) (220) (87) (176) (335) (293) (188)
Gender Age group Party ID
Total Male Female 18-29 30-44 45-64 65+ Republican Independent
Very strong 47% 51% 42% 30% 45% 51% 57% 46% 50%Strong 33% 31% 35% 53% 28% 28% 28% 32% 31%Somewhat strong 16% 14% 18% 17% 20% 14% 13% 17% 13%Not too strong 4% 5% 6% 0% 8% 7% 2% 5% 7%
Totals 100% 100% 100% 100% 100% 100% 100% 100% 100%(Weighted N) (513) (262) (251) (91) (125) (211) (85) (399) (88)
2

CBS News 2016 Battleground Tracker
Indiana Likely Republican Voters
3. Republican Nominee Satisfaction – Donald Trump
Regardless of how you are voting, how would you feel about each of these candidates if they became the Republican nominee?Asked of Republican primary voters
Ideology Tea Party Evangelical
Total Very conservative Conservative Moderate Yes No Yes No
Enthusiastic 30% 30% 29% 28% 33% 28% 27% 29%Satisfied 32% 37% 27% 35% 39% 29% 29% 38%Dissatisfied 17% 17% 22% 5% 13% 18% 19% 15%Upset 21% 16% 21% 32% 15% 25% 24% 18%
Totals 100% 100% 100% 100% 100% 100% 100% 100%(Weighted N) (546) (198) (237) (93) (188) (356) (312) (200)
Gender Age group Party ID
Total Male Female 18-29 30-44 45-64 65+ Republican Independent
Enthusiastic 30% 27% 32% 17% 19% 34% 47% 29% 32%Satisfied 32% 41% 23% 31% 37% 33% 25% 32% 33%Dissatisfied 17% 12% 21% 10% 22% 17% 16% 19% 12%Upset 21% 19% 24% 42% 22% 16% 12% 20% 23%
Totals 100% 100% 100% 100% 100% 100% 100% 100% 100%(Weighted N) (546) (275) (270) (96) (132) (224) (94) (419) (95)
3
CBS News 2016 Battleground Tracker
Indiana Likely Republican Voters
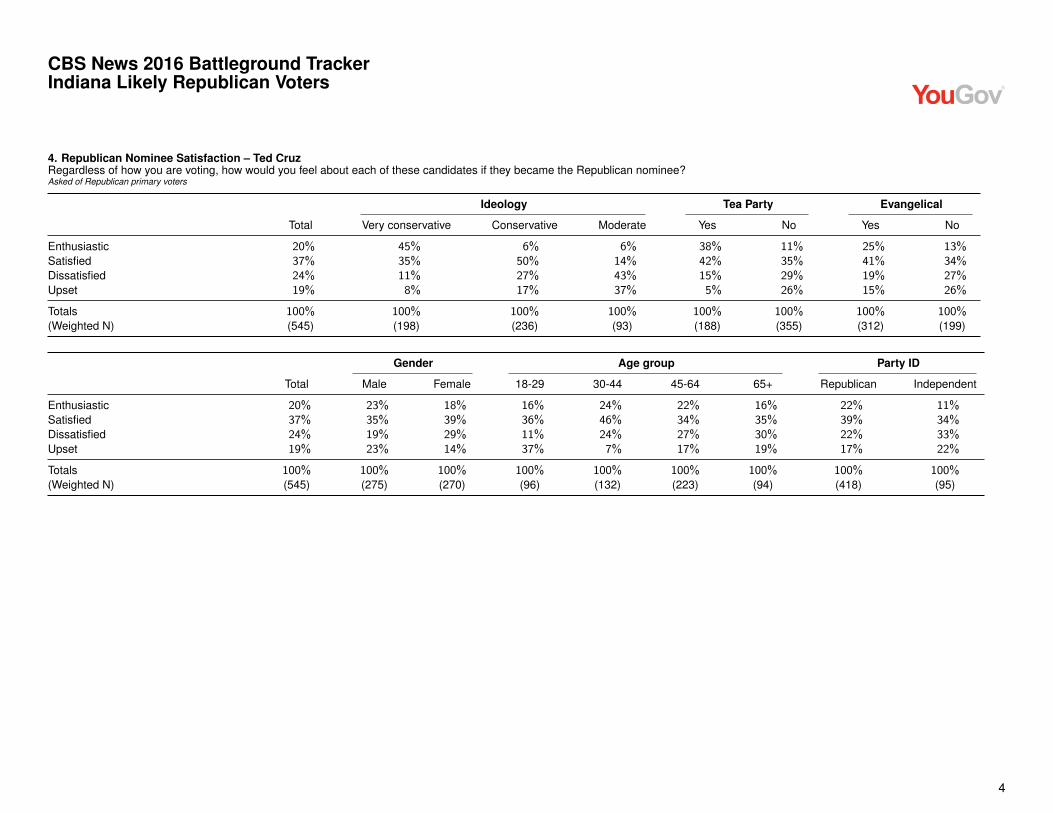
4. Republican Nominee Satisfaction – Ted Cruz
Regardless of how you are voting, how would you feel about each of these candidates if they became the Republican nominee?Asked of Republican primary voters
Ideology Tea Party Evangelical
Total Very conservative Conservative Moderate Yes No Yes No
Enthusiastic 20% 45% 6% 6% 38% 11% 25% 13%Satisfied 37% 35% 50% 14% 42% 35% 41% 34%Dissatisfied 24% 11% 27% 43% 15% 29% 19% 27%Upset 19% 8% 17% 37% 5% 26% 15% 26%
Totals 100% 100% 100% 100% 100% 100% 100% 100%(Weighted N) (545) (198) (236) (93) (188) (355) (312) (199)
Gender Age group Party ID
Total Male Female 18-29 30-44 45-64 65+ Republican Independent
Enthusiastic 20% 23% 18% 16% 24% 22% 16% 22% 11%Satisfied 37% 35% 39% 36% 46% 34% 35% 39% 34%Dissatisfied 24% 19% 29% 11% 24% 27% 30% 22% 33%Upset 19% 23% 14% 37% 7% 17% 19% 17% 22%
Totals 100% 100% 100% 100% 100% 100% 100% 100% 100%(Weighted N) (545) (275) (270) (96) (132) (223) (94) (418) (95)
4

CBS News 2016 Battleground Tracker
Indiana Likely Republican Voters
5. Republican Nominee Satisfaction – John Kasich
Regardless of how you are voting, how would you feel about each of these candidates if they became the Republican nominee?Asked of Republican primary voters
Ideology Tea Party Evangelical
Total Very conservative Conservative Moderate Yes No Yes No
Enthusiastic 11% 12% 8% 15% 8% 12% 12% 9%Satisfied 47% 38% 53% 53% 36% 53% 43% 52%Dissatisfied 31% 37% 27% 28% 33% 29% 33% 28%Upset 11% 13% 13% 5% 22% 5% 12% 11%
Totals 100% 100% 100% 100% 100% 100% 100% 100%(Weighted N) (545) (198) (236) (93) (187) (356) (312) (199)
Gender Age group Party ID
Total Male Female 18-29 30-44 45-64 65+ Republican Independent
Enthusiastic 11% 11% 10% 16% 4% 10% 16% 10% 10%Satisfied 47% 51% 43% 55% 52% 44% 40% 50% 38%Dissatisfied 31% 25% 37% 22% 35% 33% 28% 32% 32%Upset 11% 13% 10% 7% 9% 13% 16% 8% 19%
Totals 100% 100% 100% 100% 100% 100% 100% 100% 100%(Weighted N) (545) (275) (270) (96) (132) (223) (94) (418) (96)
5

CBS News 2016 Battleground Tracker
Indiana Likely Republican Voters
6. Recent View of Republican Candidates – Donald Trump
In recent weeks, has your view of each of these candidates...?Asked of Republican primary voters
Ideology Tea Party Evangelical
Total Very conservative Conservative Moderate Yes No Yes No
Gotten better 25% 23% 26% 29% 28% 24% 23% 27%Gotten worse 28% 29% 26% 34% 25% 30% 30% 27%Stayed the same 46% 49% 49% 36% 47% 46% 47% 46%
Totals 100% 100% 100% 100% 100% 100% 100% 100%(Weighted N) (536) (197) (231) (92) (187) (347) (303) (198)
Gender Age group Party ID
Total Male Female 18-29 30-44 45-64 65+ Republican Independent
Gotten better 25% 29% 22% 12% 17% 31% 38% 23% 31%Gotten worse 28% 25% 32% 49% 25% 25% 18% 30% 25%Stayed the same 46% 47% 46% 40% 58% 43% 44% 47% 44%
Totals 100% 100% 100% 100% 100% 100% 100% 100% 100%(Weighted N) (536) (269) (267) (95) (130) (217) (94) (410) (95)
6

CBS News 2016 Battleground Tracker
Indiana Likely Republican Voters
7. Recent View of Republican Candidates – Ted Cruz
In recent weeks, has your view of each of these candidates...?Asked of Republican primary voters
Ideology Tea Party Evangelical
Total Very conservative Conservative Moderate Yes No Yes No
Gotten better 18% 28% 17% 6% 26% 14% 22% 13%Gotten worse 28% 19% 29% 42% 23% 31% 25% 33%Stayed the same 54% 53% 55% 53% 51% 55% 54% 55%
Totals 100% 100% 100% 100% 100% 100% 100% 100%(Weighted N) (536) (196) (232) (92) (187) (347) (304) (198)
Gender Age group Party ID
Total Male Female 18-29 30-44 45-64 65+ Republican Independent
Gotten better 18% 21% 16% 15% 20% 20% 16% 20% 13%Gotten worse 28% 27% 29% 23% 19% 31% 37% 25% 37%Stayed the same 54% 52% 56% 62% 60% 49% 47% 54% 50%
Totals 100% 100% 100% 100% 100% 100% 100% 100% 100%(Weighted N) (536) (268) (268) (96) (130) (217) (93) (409) (95)
7
CBS News 2016 Battleground Tracker
Indiana Likely Republican Voters
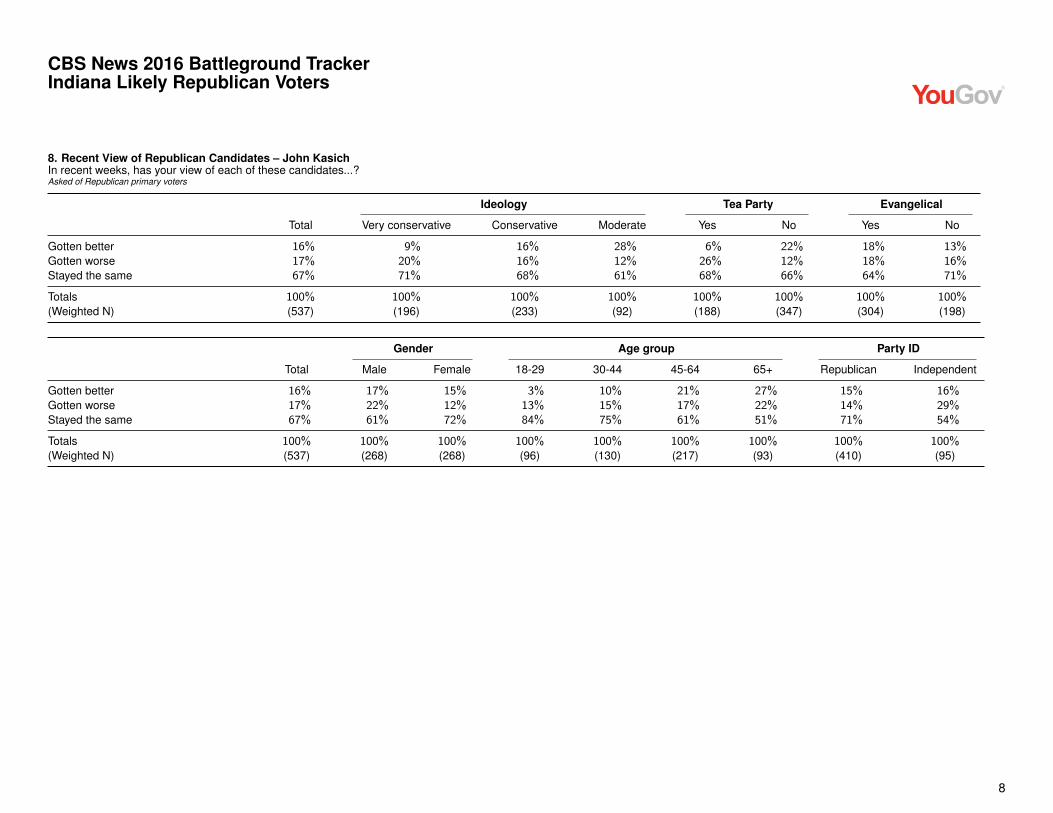
8. Recent View of Republican Candidates – John Kasich
In recent weeks, has your view of each of these candidates...?Asked of Republican primary voters
Ideology Tea Party Evangelical
Total Very conservative Conservative Moderate Yes No Yes No
Gotten better 16% 9% 16% 28% 6% 22% 18% 13%Gotten worse 17% 20% 16% 12% 26% 12% 18% 16%Stayed the same 67% 71% 68% 61% 68% 66% 64% 71%
Totals 100% 100% 100% 100% 100% 100% 100% 100%(Weighted N) (537) (196) (233) (92) (188) (347) (304) (198)
Gender Age group Party ID
Total Male Female 18-29 30-44 45-64 65+ Republican Independent
Gotten better 16% 17% 15% 3% 10% 21% 27% 15% 16%Gotten worse 17% 22% 12% 13% 15% 17% 22% 14% 29%Stayed the same 67% 61% 72% 84% 75% 61% 51% 71% 54%
Totals 100% 100% 100% 100% 100% 100% 100% 100% 100%(Weighted N) (537) (268) (268) (96) (130) (217) (93) (410) (95)
8

CBS News 2016 Battleground Tracker
Indiana Likely Republican Voters
9. Candidate Choice Against Trump
Which best describes your vote for [First Choice Candidate Name]? Is it mainly because...?Asked of Republican primary voters who support Kasich or Cruz
Ideology Tea Party Evangelical
Total Very conservative Conservative Moderate Yes No Yes No
You like [First Choice CandidateName] as the nominee, no matter whothe opposition is 50% 70% 34% ⇤ 78% 35% 52% 46%You’d like to stop Donald Trump frombecoming the nominee 23% 10% 38% ⇤ 8% 30% 27% 19%Both 27% 20% 28% ⇤ 13% 34% 21% 35%
Totals 100% 100% 100% ⇤ 100% 100% 100% 100%(Weighted N) (299) (124) (123) (46) (98) (199) (179) (106)
Gender Age group Party ID
Total Male Female 18-29 30-44 45-64 65+ Republican Independent
You like [First Choice CandidateName] as the nominee, no matter whothe opposition is 50% 59% 40% 27% 45% 65% ⇤ 51% ⇤You’d like to stop Donald Trump frombecoming the nominee 23% 10% 37% 26% 38% 14% ⇤ 24% ⇤Both 27% 32% 22% 46% 16% 22% ⇤ 25% ⇤
Totals 100% 100% 100% 100% 100% 100% ⇤ 100% ⇤(Weighted N) (299) (153) (146) (71) (83) (110) (35) (246) (42)
9

CBS News 2016 Battleground Tracker
Indiana Likely Republican Voters
10. Candidate Choice Against Cruz or Kasich
Which best describes your vote for [First Choice Candidate Name]? Is it mainly because...?Asked of Republican primary voters who support Trump
Ideology Tea Party Evangelical
Total Very conservative Conservative Moderate Yes No Yes No
You like [First Choice CandidateName] as the nominee, no matter whothe opposition is 65% 69% 67% ⇤ 71% 62% 62% 72%You’d like to stop Ted Cruz or JohnKasich from becoming the nominee 8% 2% 7% ⇤ 3% 11% 10% 6%Both 27% 28% 27% ⇤ 26% 27% 28% 22%
Totals 100% 100% 100% ⇤ 100% 100% 100% 100%(Weighted N) (220) (70) (100) (42) (80) (140) (115) (84)
Gender Age group Party ID
Total Male Female 18-29 30-44 45-64 65+ Republican Independent
You like [First Choice CandidateName] as the nominee, no matter whothe opposition is 65% 67% 63% ⇤ ⇤ 63% 61% 64% ⇤You’d like to stop Ted Cruz or JohnKasich from becoming the nominee 8% 11% 6% ⇤ ⇤ 8% 7% 8% ⇤Both 27% 22% 31% ⇤ ⇤ 29% 32% 28% ⇤
Totals 100% 100% 100% ⇤ ⇤ 100% 100% 100% ⇤(Weighted N) (220) (114) (106) (20) (42) (105) (53) (158) (46)
10

CBS News 2016 Battleground Tracker
Indiana Likely Republican Voters
11. Likely Republican Nominee – Donald Trump
Regardless of your own vote, do you think each candidate’s chances of becoming the nominee are...?Asked of Republican primary voters
Ideology Tea Party Evangelical
Total Very conservative Conservative Moderate Yes No Yes No
Very Likely 64% 64% 65% 62% 66% 63% 65% 61%Somewhat likely 30% 32% 30% 30% 32% 30% 28% 36%Not too likely 6% 4% 5% 8% 2% 7% 7% 3%
Totals 100% 100% 100% 100% 100% 100% 100% 100%(Weighted N) (546) (198) (238) (93) (189) (356) (312) (200)
Gender Age group Party ID
Total Male Female 18-29 30-44 45-64 65+ Republican Independent
Very Likely 64% 66% 62% 47% 63% 67% 75% 64% 66%Somewhat likely 30% 29% 32% 43% 37% 25% 21% 30% 31%Not too likely 6% 6% 6% 10% 0% 8% 3% 6% 3%
Totals 100% 100% 100% 100% 100% 100% 100% 100% 100%(Weighted N) (546) (275) (271) (96) (132) (224) (94) (420) (95)
11

CBS News 2016 Battleground Tracker
Indiana Likely Republican Voters
12. Likely Republican Nominee – Ted Cruz
Regardless of your own vote, do you think each candidate’s chances of becoming the nominee are...?Asked of Republican primary voters
Ideology Tea Party Evangelical
Total Very conservative Conservative Moderate Yes No Yes No
Very Likely 9% 15% 5% 4% 14% 5% 11% 4%Somewhat likely 63% 64% 69% 48% 63% 63% 65% 62%Not too likely 28% 21% 27% 48% 23% 32% 25% 34%
Totals 100% 100% 100% 100% 100% 100% 100% 100%(Weighted N) (547) (198) (238) (93) (189) (356) (313) (201)
Gender Age group Party ID
Total Male Female 18-29 30-44 45-64 65+ Republican Independent
Very Likely 9% 8% 9% 4% 9% 12% 6% 9% 5%Somewhat likely 63% 61% 64% 66% 63% 61% 64% 61% 73%Not too likely 28% 30% 27% 31% 29% 27% 30% 30% 22%
Totals 100% 100% 100% 100% 100% 100% 100% 100% 100%(Weighted N) (547) (276) (272) (96) (132) (225) (94) (420) (96)
12

CBS News 2016 Battleground Tracker
Indiana Likely Republican Voters
13. Likely Republican Nominee – John Kasich
Regardless of your own vote, do you think each candidate’s chances of becoming the nominee are...?Asked of Republican primary voters
Ideology Tea Party Evangelical
Total Very conservative Conservative Moderate Yes No Yes No
Very Likely 2% 4% 1% 0% 1% 2% 3% 0%Somewhat likely 16% 11% 14% 32% 5% 22% 11% 22%Not too likely 82% 86% 85% 68% 94% 76% 86% 77%
Totals 100% 100% 100% 100% 100% 100% 100% 100%(Weighted N) (547) (198) (238) (93) (189) (356) (313) (200)
Gender Age group Party ID
Total Male Female 18-29 30-44 45-64 65+ Republican Independent
Very Likely 2% 3% 1% 0% 5% 0% 2% 2% 0%Somewhat likely 16% 14% 18% 26% 13% 14% 15% 15% 23%Not too likely 82% 83% 81% 74% 81% 86% 83% 83% 77%
Totals 100% 100% 100% 100% 100% 100% 100% 100% 100%(Weighted N) (547) (276) (271) (96) (132) (224) (94) (420) (96)
13
CBS News 2016 Battleground Tracker
Indiana Likely Republican Voters
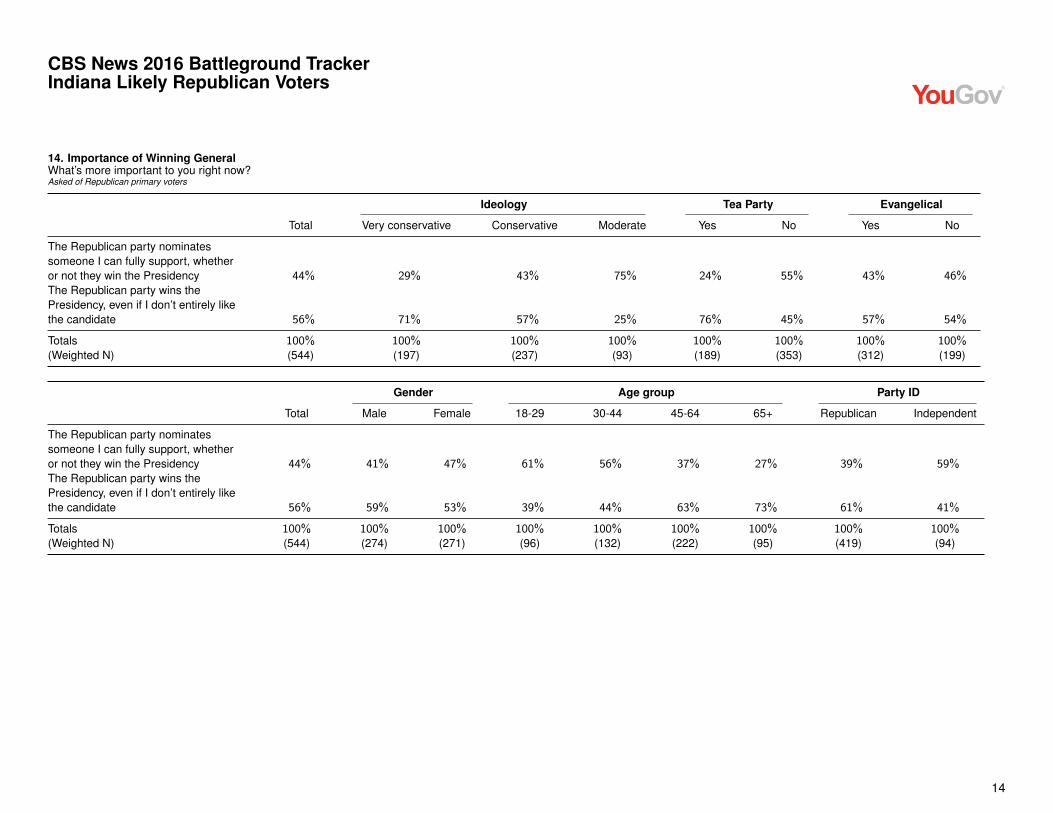
14. Importance of Winning General
What’s more important to you right now?Asked of Republican primary voters
Ideology Tea Party Evangelical
Total Very conservative Conservative Moderate Yes No Yes No
The Republican party nominatessomeone I can fully support, whetheror not they win the Presidency 44% 29% 43% 75% 24% 55% 43% 46%The Republican party wins thePresidency, even if I don’t entirely likethe candidate 56% 71% 57% 25% 76% 45% 57% 54%
Totals 100% 100% 100% 100% 100% 100% 100% 100%(Weighted N) (544) (197) (237) (93) (189) (353) (312) (199)
Gender Age group Party ID
Total Male Female 18-29 30-44 45-64 65+ Republican Independent
The Republican party nominatessomeone I can fully support, whetheror not they win the Presidency 44% 41% 47% 61% 56% 37% 27% 39% 59%The Republican party wins thePresidency, even if I don’t entirely likethe candidate 56% 59% 53% 39% 44% 63% 73% 61% 41%
Totals 100% 100% 100% 100% 100% 100% 100% 100% 100%(Weighted N) (544) (274) (271) (96) (132) (222) (95) (419) (94)
14

CBS News 2016 Battleground Tracker
Indiana Likely Republican Voters
15. Conservative Approach to the Economy
To fix the nation’s economy, would you prefer a President’s approach be...?Asked of Republican primary voters
Ideology Tea Party Evangelical
Total Very conservative Conservative Moderate Yes No Yes No
Do whatever it takes, whether that isthe most conservative policy choice ornot 67% 44% 79% 79% 51% 75% 61% 75%Do whatever is most conservative 33% 56% 21% 21% 49% 25% 39% 25%
Totals 100% 100% 100% 100% 100% 100% 100% 100%(Weighted N) (547) (199) (238) (92) (189) (355) (313) (199)
Gender Age group Party ID
Total Male Female 18-29 30-44 45-64 65+ Republican Independent
Do whatever it takes, whether that isthe most conservative policy choice ornot 67% 68% 66% 79% 55% 65% 76% 65% 72%Do whatever is most conservative 33% 32% 34% 21% 45% 35% 24% 35% 28%
Totals 100% 100% 100% 100% 100% 100% 100% 100% 100%(Weighted N) (547) (276) (271) (96) (132) (224) (95) (419) (96)
15
CBS News 2016 Battleground Tracker
Indiana Likely Republican Voters
16. Republican Approach to Candidate Choice
Which best describes your approach this year...?Asked of Republican primary voters
Ideology Tea Party Evangelical
Total Very conservative Conservative Moderate Yes No Yes No
If I find a candidate who agrees withme on the details of policy, that meansI can probably get to like and trustthem as a person 59% 67% 55% 56% 61% 58% 59% 63%If I find a candidate who I really likeand trust as a person, the policydetails will probably take care ofthemselves 41% 33% 45% 44% 39% 42% 41% 37%
Totals 100% 100% 100% 100% 100% 100% 100% 100%(Weighted N) (547) (199) (236) (93) (188) (356) (312) (200)
Gender Age group Party ID
Total Male Female 18-29 30-44 45-64 65+ Republican Independent
If I find a candidate who agrees withme on the details of policy, that meansI can probably get to like and trustthem as a person 59% 61% 57% 64% 63% 60% 48% 60% 54%If I find a candidate who I really likeand trust as a person, the policydetails will probably take care ofthemselves 41% 39% 43% 36% 37% 40% 52% 40% 46%
Totals 100% 100% 100% 100% 100% 100% 100% 100% 100%(Weighted N) (547) (275) (272) (96) (132) (223) (95) (420) (95)
16

CBS News 2016 Battleground Tracker
Indiana Likely Republican Voters
17. Republican Selection of Nominees
Overall, do you feel the Republicans’ process for selecting a nominee in 2016 has generally been fair or not fair so far?Asked of Republican primary voters
Ideology Tea Party Evangelical
Total Very conservative Conservative Moderate Yes No Yes No
It has been fair 53% 61% 47% 52% 64% 47% 54% 50%It has NOT been fair 47% 39% 53% 48% 36% 53% 46% 50%
Totals 100% 100% 100% 100% 100% 100% 100% 100%(Weighted N) (536) (196) (234) (87) (189) (345) (302) (199)
Gender Age group Party ID
Total Male Female 18-29 30-44 45-64 65+ Republican Independent
It has been fair 53% 58% 48% 53% 65% 49% 47% 55% 42%It has NOT been fair 47% 42% 52% 47% 35% 51% 53% 45% 58%
Totals 100% 100% 100% 100% 100% 100% 100% 100% 100%(Weighted N) (536) (269) (266) (94) (132) (216) (94) (410) (94)
17

CBS News 2016 Battleground Tracker
Indiana Likely Republican Voters
18. Republican Convention
As you may know, the Republican party requires a nominee to get 1,237 delegates in the primaries for the nomination. If Donald Trump does not get 1,237 butTrump still has more delegates than Ted Cruz, and more delegates than John Kasich, what do you feel Republicans should do at the convention this summer?Asked of Republican primary voters
Ideology Tea Party Evangelical
Total Very conservative Conservative Moderate Yes No Yes No
Select Trump, because he’ll still havemore delegates than any othercandidate 47% 41% 50% 51% 45% 48% 43% 51%Let Trump, Cruz and Kasich fight fordelegate support at the convention todecide the winner 45% 52% 42% 38% 48% 43% 48% 41%Turn to someone new who isn’trunning right now 8% 6% 8% 10% 7% 9% 9% 8%
Totals 100% 100% 100% 100% 100% 100% 100% 100%(Weighted N) (548) (199) (238) (93) (189) (356) (313) (200)
Gender Age group Party ID
Total Male Female 18-29 30-44 45-64 65+ Republican Independent
Select Trump, because he’ll still havemore delegates than any othercandidate 47% 50% 44% 29% 44% 52% 59% 45% 51%Let Trump, Cruz and Kasich fight fordelegate support at the convention todecide the winner 45% 45% 45% 62% 47% 41% 33% 48% 39%Turn to someone new who isn’trunning right now 8% 5% 11% 9% 9% 7% 8% 7% 10%
Totals 100% 100% 100% 100% 100% 100% 100% 100% 100%(Weighted N) (548) (276) (271) (96) (132) (225) (95) (420) (95)
18

CBS News 2016 Battleground Tracker
Indiana Likely Republican Voters
19. Trump General Election
If Donald Trump becomes the Republican nominee, how do you think he will approach the General election campaign this fall?Asked of Republican primary voters
Ideology Tea Party Evangelical
Total Very conservative Conservative Moderate Yes No Yes No
He will continue to be as outspokenas he is now 65% 74% 57% 65% 65% 65% 64% 65%He will be less outspoken than he isnow 17% 13% 23% 12% 15% 18% 19% 14%He will become more outspoken thanhe is now 18% 13% 20% 24% 20% 17% 17% 21%
Totals 100% 100% 100% 100% 100% 100% 100% 100%(Weighted N) (547) (198) (237) (93) (189) (355) (313) (200)
Gender Age group Party ID
Total Male Female 18-29 30-44 45-64 65+ Republican Independent
He will continue to be as outspokenas he is now 65% 63% 67% 56% 72% 64% 67% 65% 56%He will be less outspoken than he isnow 17% 24% 9% 22% 11% 18% 18% 17% 23%He will become more outspoken thanhe is now 18% 13% 23% 21% 18% 18% 14% 18% 22%
Totals 100% 100% 100% 100% 100% 100% 100% 100% 100%(Weighted N) (547) (276) (270) (96) (132) (224) (95) (419) (96)
19

CBS News 2016 Battleground TrackerIndiana Likely Democratic Voters
Sample 439 Likely Democratic Primary VotersConducted April 20-22, 2016Margin of Error ±8.2%
1. First Choice Democratic CandidateWhich candidate are you most likely to vote for in the Indiana Democratic Presidential primary in 2016?Asked of Democratic primary voters
Ideology Race
Total Very liberal Liberal Moderate White Non-white
Hillary Clinton 49% 32% 55% 55% 44% 65%Bernie Sanders 44% 66% 38% 41% 48% 30%No preference 7% 2% 7% 4% 8% 5%
Totals 100% 100% 100% 100% 100% 100%(Weighted N) (436) (68) (121) (159) (324) (112)
Gender Age group Party ID
Total Male Female 18-29 30-44 45-64 65+ Democrat Independent
Hillary Clinton 49% 49% 49% 21% 41% 60% 64% 54% 35%Bernie Sanders 44% 47% 41% 69% 55% 30% 35% 37% 62%No preference 7% 4% 10% 10% 5% 10% 1% 9% 3%
Totals 100% 100% 100% 100% 100% 100% 100% 100% 100%(Weighted N) (436) (189) (247) (75) (110) (188) (62) (339) (82)
1

CBS News 2016 Battleground TrackerIndiana Likely Democratic Voters
2. Democratic Candidate SupportWhich best describes your support for [First Choice Candidate Name] right now?Asked of Democratic primary voters
Ideology Race
Total Very liberal Liberal Moderate White Non-white
Very strong – I’ve decided 56% 78% 66% 36% 56% 58%Strong – I probably won’t change 24% 17% 24% 24% 20% 36%Somewhat strong – I might stillchange 19% 4% 10% 39% 23% 7%Not too strong – I’ll probably keeplooking 1% 0% 0% 1% 1% 0%
Totals 100% 100% 100% 100% 100% 100%(Weighted N) (385) (60) (110) (145) (281) (104)
Gender Age group Party ID
Total Male Female 18-29 30-44 45-64 65+ Democrat Independent
Very strong – I’ve decided 56% 50% 61% 62% 57% 52% 60% 54% 59%Strong – I probably won’t change 24% 27% 22% 19% 24% 26% 26% 27% 15%Somewhat strong – I might stillchange 19% 21% 17% 19% 18% 22% 11% 18% 23%Not too strong – I’ll probably keeplooking 1% 1% 0% 0% 1% 0% 3% 0% 2%
Totals 100% 100% 100% 100% 100% 100% 100% 100% 100%(Weighted N) (385) (173) (212) (64) (102) (163) (57) (296) (78)
2
CBS News 2016 Battleground TrackerIndiana Likely Democratic Voters
3. Democratic Nominee Satisfaction – Hillary ClintonRegardless of how you are voting, how would you feel about each of these candidates if they became the Democratic nominee?Asked of Democratic primary voters
Ideology Race
Total Very liberal Liberal Moderate White Non-white
Enthusiastic 34% 33% 40% 29% 28% 50%Satisfied 39% 37% 35% 49% 43% 29%Dissatisfied 18% 23% 13% 15% 19% 13%Upset 9% 7% 11% 7% 10% 8%
Totals 100% 100% 100% 100% 100% 100%(Weighted N) (432) (67) (121) (162) (318) (114)
Gender Age group Party ID
Total Male Female 18-29 30-44 45-64 65+ Democrat Independent
Enthusiastic 34% 30% 37% 31% 31% 33% 44% 39% 15%Satisfied 39% 45% 35% 42% 33% 40% 45% 41% 36%Dissatisfied 18% 12% 22% 25% 16% 20% 4% 16% 19%Upset 9% 13% 6% 2% 21% 7% 8% 4% 30%
Totals 100% 100% 100% 100% 100% 100% 100% 100% 100%(Weighted N) (432) (188) (244) (74) (106) (186) (65) (341) (82)
3

CBS News 2016 Battleground TrackerIndiana Likely Democratic Voters
4. Democratic Nominee Satisfaction – Bernie SandersRegardless of how you are voting, how would you feel about each of these candidates if they became the Democratic nominee?Asked of Democratic primary voters
Ideology Race
Total Very liberal Liberal Moderate White Non-white
Enthusiastic 39% 76% 48% 23% 41% 34%Satisfied 37% 14% 32% 53% 37% 38%Dissatisfied 21% 7% 20% 22% 20% 26%Upset 3% 2% 0% 2% 3% 3%
Totals 100% 100% 100% 100% 100% 100%(Weighted N) (419) (66) (117) (152) (314) (105)
Gender Age group Party ID
Total Male Female 18-29 30-44 45-64 65+ Democrat Independent
Enthusiastic 39% 38% 40% 71% 34% 30% 36% 34% 51%Satisfied 37% 44% 32% 20% 54% 34% 39% 41% 27%Dissatisfied 21% 15% 26% 10% 11% 33% 17% 23% 16%Upset 3% 3% 2% 0% 0% 3% 9% 2% 6%
Totals 100% 100% 100% 100% 100% 100% 100% 100% 100%(Weighted N) (419) (177) (241) (74) (99) (185) (60) (327) (81)
4
CBS News 2016 Battleground TrackerIndiana Likely Democratic Voters
5. Recent View of Democratic Candidates – Hillary ClintonIn recent weeks, has your view of each of these candidates...?Asked of Democratic primary voters
Ideology Race
Total Very liberal Liberal Moderate White Non-white
Gotten better 27% 24% 29% 23% 24% 38%Gotten worse 21% 35% 16% 15% 24% 11%Stayed the same 51% 41% 56% 62% 51% 51%
Totals 100% 100% 100% 100% 100% 100%(Weighted N) (427) (67) (119) (154) (320) (107)
Gender Age group Party ID
Total Male Female 18-29 30-44 45-64 65+ Democrat Independent
Gotten better 27% 24% 30% 21% 16% 32% 40% 33% 8%Gotten worse 21% 19% 22% 26% 30% 18% 10% 14% 42%Stayed the same 51% 57% 48% 53% 54% 50% 51% 53% 50%
Totals 100% 100% 100% 100% 100% 100% 100% 100% 100%(Weighted N) (427) (179) (249) (75) (101) (187) (64) (331) (82)
5

CBS News 2016 Battleground TrackerIndiana Likely Democratic Voters
6. Recent View of Democratic Candidates – Bernie SandersIn recent weeks, has your view of each of these candidates...?Asked of Democratic primary voters
Ideology Race
Total Very liberal Liberal Moderate White Non-white
Gotten better 37% 42% 39% 40% 40% 28%Gotten worse 15% 11% 18% 14% 16% 13%Stayed the same 48% 47% 43% 46% 44% 59%
Totals 100% 100% 100% 100% 100% 100%(Weighted N) (428) (67) (116) (160) (316) (113)
Gender Age group Party ID
Total Male Female 18-29 30-44 45-64 65+ Democrat Independent
Gotten better 37% 43% 32% 59% 43% 27% 27% 36% 35%Gotten worse 15% 15% 16% 7% 5% 20% 27% 15% 20%Stayed the same 48% 42% 52% 34% 51% 53% 46% 49% 45%
Totals 100% 100% 100% 100% 100% 100% 100% 100% 100%(Weighted N) (428) (184) (244) (75) (109) (183) (62) (333) (82)
6
CBS News 2016 Battleground TrackerIndiana Likely Democratic Voters
7. Candidate Choice Against SandersDo you mainly see your vote choice right now as...?Asked of Democratic primary voters who support Clinton
Ideology Race
Total Very liberal Liberal Moderate White Non-white
A chance to elect Hillary Clinton 99% ⇤ 97% 100% 98% 100%Mainly a vote against Bernie Sanders 1% ⇤ 3% 0% 2% 0%
Totals 100% ⇤ 100% 100% 100% 100%(Weighted N) (214) (22) (66) (87) (141) (73)
Gender Age group Party ID
Total Male Female 18-29 30-44 45-64 65+ Democrat Independent
A chance to elect Hillary Clinton 99% 98% 100% ⇤ ⇤ 98% ⇤ 99% ⇤Mainly a vote against Bernie Sanders 1% 2% 0% ⇤ ⇤ 2% ⇤ 1% ⇤
Totals 100% 100% 100% ⇤ ⇤ 100% ⇤ 100% ⇤(Weighted N) (214) (93) (121) (16) (45) (114) (40) (183) (29)
7
CBS News 2016 Battleground TrackerIndiana Likely Democratic Voters
8. Candidate Choice Against ClintonDo you mainly see your vote choice right now as...?Asked of Democratic primary voters who support Sanders
Ideology Race
Total Very liberal Liberal Moderate White Non-white
A chance to elect Bernie Sanders 88% ⇤ ⇤ 84% 92% ⇤Mainly a vote against Hillary Clinton 12% ⇤ ⇤ 16% 8% ⇤
Totals 100% ⇤ ⇤ 100% 100% ⇤(Weighted N) (189) (45) (47) (65) (156) (34)
Gender Age group Party ID
Total Male Female 18-29 30-44 45-64 65+ Democrat Independent
A chance to elect Bernie Sanders 88% 87% 88% 100% 85% 79% ⇤ 92% 78%Mainly a vote against Hillary Clinton 12% 13% 12% 0% 15% 21% ⇤ 8% 22%
Totals 100% 100% 100% 100% 100% 100% ⇤ 100% 100%(Weighted N) (189) (89) (101) (52) (60) (56) (21) (126) (51)
8

CBS News 2016 Battleground TrackerIndiana Likely Democratic Voters
9. Likely Democratic Nominee – Hillary ClintonRegardless of your own vote, do you think each candidate’s chances of becoming the nominee are...?Asked of Democratic primary voters
Ideology Race
Total Very liberal Liberal Moderate White Non-white
Very Likely 78% 68% 83% 87% 75% 86%Somewhat likely 17% 24% 17% 12% 20% 10%Not too likely 5% 8% 1% 0% 5% 4%
Totals 100% 100% 100% 100% 100% 100%(Weighted N) (435) (68) (121) (162) (321) (115)
Gender Age group Party ID
Total Male Female 18-29 30-44 45-64 65+ Democrat Independent
Very Likely 78% 87% 71% 57% 73% 83% 96% 82% 66%Somewhat likely 17% 13% 20% 38% 23% 10% 3% 13% 33%Not too likely 5% 0% 9% 5% 4% 7% 1% 5% 1%
Totals 100% 100% 100% 100% 100% 100% 100% 100% 100%(Weighted N) (435) (186) (249) (75) (110) (188) (63) (341) (80)
9

CBS News 2016 Battleground TrackerIndiana Likely Democratic Voters
10. Likely Democratic Nominee – Bernie SandersRegardless of your own vote, do you think each candidate’s chances of becoming the nominee are...?Asked of Democratic primary voters
Ideology Race
Total Very liberal Liberal Moderate White Non-white
Very Likely 14% 27% 18% 6% 14% 14%Somewhat likely 45% 39% 45% 50% 43% 49%Not too likely 41% 35% 37% 44% 43% 37%
Totals 100% 100% 100% 100% 100% 100%(Weighted N) (433) (68) (119) (159) (320) (113)
Gender Age group Party ID
Total Male Female 18-29 30-44 45-64 65+ Democrat Independent
Very Likely 14% 3% 22% 41% 17% 5% 3% 13% 19%Somewhat likely 45% 45% 44% 43% 44% 46% 45% 45% 38%Not too likely 41% 51% 34% 17% 39% 49% 53% 42% 43%
Totals 100% 100% 100% 100% 100% 100% 100% 100% 100%(Weighted N) (433) (185) (248) (75) (110) (188) (61) (338) (81)
10
CBS News 2016 Battleground TrackerIndiana Likely Democratic Voters
11. Progressive Approach to the EconomyTo fix the nation’s economy, would you prefer a President’s approach be...?Asked of Democratic primary voters
Ideology Race
Total Very liberal Liberal Moderate White Non-white
Do whatever it takes, whether that isthe most progressive policy choice ornot 61% 40% 65% 68% 61% 61%Do whatever is most progressive 39% 60% 35% 32% 39% 39%
Totals 100% 100% 100% 100% 100% 100%(Weighted N) (434) (68) (121) (161) (319) (115)
Gender Age group Party ID
Total Male Female 18-29 30-44 45-64 65+ Democrat Independent
Do whatever it takes, whether that isthe most progressive policy choice ornot 61% 67% 56% 33% 65% 65% 76% 58% 72%Do whatever is most progressive 39% 33% 44% 67% 35% 35% 24% 42% 28%
Totals 100% 100% 100% 100% 100% 100% 100% 100% 100%(Weighted N) (434) (187) (247) (75) (110) (186) (63) (339) (80)
11
CBS News 2016 Battleground TrackerIndiana Likely Democratic Voters
12. Democrats Selection of NomineesOverall, do you feel the Democrats’ process for selecting a nominee in 2016 has generally been fair or not fair so far?Asked of Democratic primary voters
Ideology Race
Total Very liberal Liberal Moderate White Non-white
It has been fair 65% 55% 73% 67% 63% 69%It has NOT been fair 35% 45% 27% 33% 37% 31%
Totals 100% 100% 100% 100% 100% 100%(Weighted N) (430) (68) (121) (153) (316) (114)
Gender Age group Party ID
Total Male Female 18-29 30-44 45-64 65+ Democrat Independent
It has been fair 65% 65% 65% 51% 60% 69% 78% 70% 50%It has NOT been fair 35% 35% 35% 49% 40% 31% 22% 30% 50%
Totals 100% 100% 100% 100% 100% 100% 100% 100% 100%(Weighted N) (430) (189) (241) (75) (110) (181) (63) (333) (82)
12

CBS News 2016 Battleground TrackerIndiana Likely Democratic Voters
13. Democratic Candidate Traits – Electable in NovemberWhich of the candidates do you feel is the most...?Asked of Democratic primary voters
Ideology Race
Total Very liberal Liberal Moderate White Non-white
Hillary Clinton 62% 49% 73% 66% 60% 69%Bernie Sanders 38% 51% 27% 34% 40% 31%
Totals 100% 100% 100% 100% 100% 100%(Weighted N) (430) (68) (121) (162) (315) (115)
Gender Age group Party ID
Total Male Female 18-29 30-44 45-64 65+ Democrat Independent
Hillary Clinton 62% 66% 60% 41% 50% 71% 83% 67% 49%Bernie Sanders 38% 34% 40% 59% 50% 29% 17% 33% 51%
Totals 100% 100% 100% 100% 100% 100% 100% 100% 100%(Weighted N) (430) (187) (243) (75) (107) (185) (63) (335) (80)
13

CBS News 2016 Battleground TrackerIndiana Likely Democratic Voters
14. Democratic Candidate Traits – Understanding of people like youWhich of the candidates do you feel is the most...?Asked of Democratic primary voters
Ideology Race
Total Very liberal Liberal Moderate White Non-white
Hillary Clinton 42% 29% 44% 41% 33% 66%Bernie Sanders 58% 71% 56% 59% 67% 34%
Totals 100% 100% 100% 100% 100% 100%(Weighted N) (418) (68) (120) (152) (305) (113)
Gender Age group Party ID
Total Male Female 18-29 30-44 45-64 65+ Democrat Independent
Hillary Clinton 42% 40% 44% 18% 36% 52% 52% 46% 28%Bernie Sanders 58% 60% 56% 82% 64% 48% 48% 54% 72%
Totals 100% 100% 100% 100% 100% 100% 100% 100% 100%(Weighted N) (418) (184) (234) (75) (106) (175) (63) (326) (78)
14

CBS News 2016 Battleground TrackerIndiana Likely Democratic Voters
15. Democratic Candidate Traits – Effective at getting things doneWhich of the candidates do you feel is the most...?Asked of Democratic primary voters
Ideology Race
Total Very liberal Liberal Moderate White Non-white
Hillary Clinton 64% 52% 74% 67% 60% 76%Bernie Sanders 36% 48% 26% 33% 40% 24%
Totals 100% 100% 100% 100% 100% 100%(Weighted N) (420) (67) (119) (154) (304) (115)
Gender Age group Party ID
Total Male Female 18-29 30-44 45-64 65+ Democrat Independent
Hillary Clinton 64% 68% 62% 42% 54% 73% 83% 69% 48%Bernie Sanders 36% 32% 38% 58% 46% 27% 17% 31% 52%
Totals 100% 100% 100% 100% 100% 100% 100% 100% 100%(Weighted N) (420) (186) (234) (75) (106) (176) (63) (328) (77)
15

CBS News 2016 Battleground TrackerIndiana Likely Democratic Voters
16. Democratic Candidate Traits – AuthenticWhich of the candidates do you feel is the most...?Asked of Democratic primary voters
Ideology Race
Total Very liberal Liberal Moderate White Non-white
Hillary Clinton 33% 24% 25% 38% 26% 51%Bernie Sanders 67% 76% 75% 62% 74% 49%
Totals 100% 100% 100% 100% 100% 100%(Weighted N) (420) (67) (121) (154) (305) (115)
Gender Age group Party ID
Total Male Female 18-29 30-44 45-64 65+ Democrat Independent
Hillary Clinton 33% 30% 35% 12% 30% 40% 45% 36% 24%Bernie Sanders 67% 70% 65% 88% 70% 60% 55% 64% 76%
Totals 100% 100% 100% 100% 100% 100% 100% 100% 100%(Weighted N) (420) (185) (235) (75) (106) (177) (63) (327) (79)
16

CBS News 2016 Battleground TrackerIndiana Likely Democratic Voters
17. Democratic Candidate Traits – Specific about their policy ideasWhich of the candidates do you feel is the most...?Asked of Democratic primary voters
Ideology Race
Total Very liberal Liberal Moderate White Non-white
Hillary Clinton 50% 43% 64% 46% 45% 63%Bernie Sanders 50% 57% 36% 54% 55% 37%
Totals 100% 100% 100% 100% 100% 100%(Weighted N) (423) (67) (120) (154) (308) (115)
Gender Age group Party ID
Total Male Female 18-29 30-44 45-64 65+ Democrat Independent
Hillary Clinton 50% 45% 54% 30% 47% 55% 64% 56% 31%Bernie Sanders 50% 55% 46% 70% 53% 45% 36% 44% 69%
Totals 100% 100% 100% 100% 100% 100% 100% 100% 100%(Weighted N) (423) (188) (235) (75) (106) (177) (65) (327) (81)
17
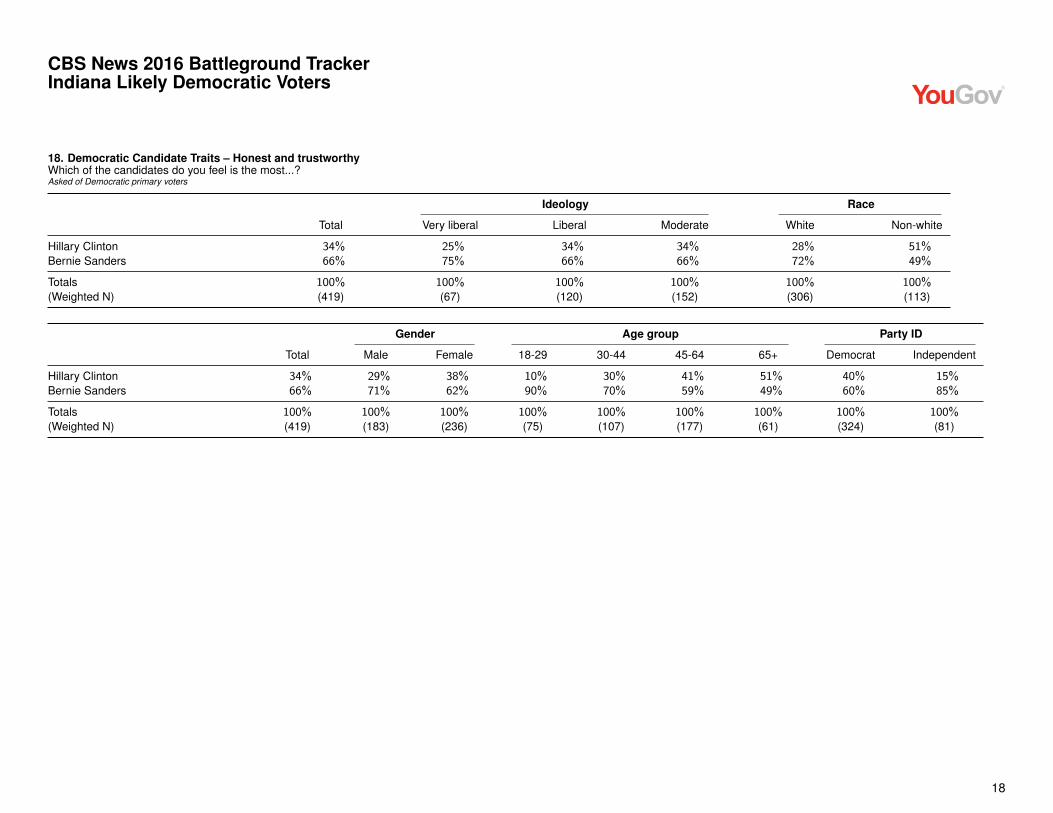
CBS News 2016 Battleground TrackerIndiana Likely Democratic Voters
18. Democratic Candidate Traits – Honest and trustworthyWhich of the candidates do you feel is the most...?Asked of Democratic primary voters
Ideology Race
Total Very liberal Liberal Moderate White Non-white
Hillary Clinton 34% 25% 34% 34% 28% 51%Bernie Sanders 66% 75% 66% 66% 72% 49%
Totals 100% 100% 100% 100% 100% 100%(Weighted N) (419) (67) (120) (152) (306) (113)
Gender Age group Party ID
Total Male Female 18-29 30-44 45-64 65+ Democrat Independent
Hillary Clinton 34% 29% 38% 10% 30% 41% 51% 40% 15%Bernie Sanders 66% 71% 62% 90% 70% 59% 49% 60% 85%
Totals 100% 100% 100% 100% 100% 100% 100% 100% 100%(Weighted N) (419) (183) (236) (75) (107) (177) (61) (324) (81)
18

CBS News 2016 Battleground TrackerIndiana Likely Democratic Voters
19. Influence of Sanders on Clinton CampaignIf Hillary Clinton does become the Democratic nominee, do you think the influence of Bernie Sanders’s campaign will have been...?Asked of Democratic primary voters
Ideology Race
Total Very liberal Liberal Moderate White Non-white
Positive, by making her adopt evenmore progressive views 44% 59% 54% 36% 47% 37%Negative, by making too manycriticisms of her 12% 8% 16% 13% 10% 17%Neither positive nor negative, it’s justpolitics 39% 22% 29% 49% 37% 45%I don’t think she will become thenominee 5% 11% 0% 2% 6% 2%
Totals 100% 100% 100% 100% 100% 100%(Weighted N) (435) (68) (121) (162) (320) (115)
Gender Age group Party ID
Total Male Female 18-29 30-44 45-64 65+ Democrat Independent
Positive, by making her adopt evenmore progressive views 44% 51% 39% 39% 33% 51% 49% 45% 40%Negative, by making too manycriticisms of her 12% 17% 8% 9% 22% 5% 17% 10% 20%Neither positive nor negative, it’s justpolitics 39% 30% 46% 34% 43% 42% 31% 40% 35%I don’t think she will become thenominee 5% 2% 7% 17% 2% 2% 3% 5% 4%
Totals 100% 100% 100% 100% 100% 100% 100% 100% 100%(Weighted N) (435) (189) (246) (75) (107) (188) (65) (338) (82)
19

CBS News 2016 Battleground TrackerIndiana Likely Democratic Voters
20. Democratic Approach to Candidate ChoiceWhich best describes your approach this year...?Asked of Democratic primary voters
Ideology Race
Total Very liberal Liberal Moderate White Non-white
If I find a candidate who agrees withme on the details of policy, that meansI can probably get to like and trustthem as a person 55% 61% 56% 57% 52% 65%If I find a candidate who I really likeand trust as a person, the policydetails will probably take care ofthemselves 45% 39% 44% 43% 48% 35%
Totals 100% 100% 100% 100% 100% 100%(Weighted N) (426) (68) (115) (162) (316) (110)
Gender Age group Party ID
Total Male Female 18-29 30-44 45-64 65+ Democrat Independent
If I find a candidate who agrees withme on the details of policy, that meansI can probably get to like and trustthem as a person 55% 67% 46% 62% 58% 53% 48% 54% 62%If I find a candidate who I really likeand trust as a person, the policydetails will probably take care ofthemselves 45% 33% 54% 38% 42% 47% 52% 46% 38%
Totals 100% 100% 100% 100% 100% 100% 100% 100% 100%(Weighted N) (426) (188) (237) (75) (103) (183) (65) (329) (82)
20