cbs news' battleground tracker, new hampshire, october 25, 2015
DESCRIPTION
CBS News' Battleground Tracker, New Hampshire, October 25, 2015TRANSCRIPT

CBS News 2016 Battleground TrackerNew HampshireSample 1148 Registered VotersConducted October 15-22, 2015Margin of Error ±5.6%
1. How would you rate the condition of the economy in New Hampshire today?
Very good . . . . . . . . . . . . . . . . . . . . . . . . . . . . . . . . . . . . . . . . . . . . . . . . . . . . . . . . . . . . . . . .6%Fairly good . . . . . . . . . . . . . . . . . . . . . . . . . . . . . . . . . . . . . . . . . . . . . . . . . . . . . . . . . . . . . 52%Fairly bad . . . . . . . . . . . . . . . . . . . . . . . . . . . . . . . . . . . . . . . . . . . . . . . . . . . . . . . . . . . . . . .32%Very bad . . . . . . . . . . . . . . . . . . . . . . . . . . . . . . . . . . . . . . . . . . . . . . . . . . . . . . . . . . . . . . . . . 7%Not sure . . . . . . . . . . . . . . . . . . . . . . . . . . . . . . . . . . . . . . . . . . . . . . . . . . . . . . . . . . . . . . . . . 3%
2. How likely is it that you will vote in the 2016 Presidential primary in New Hampshire?
Definitely will vote . . . . . . . . . . . . . . . . . . . . . . . . . . . . . . . . . . . . . . . . . . . . . . . . . . . . . . .80%Probably will vote . . . . . . . . . . . . . . . . . . . . . . . . . . . . . . . . . . . . . . . . . . . . . . . . . . . . . . . 11%Maybe will vote . . . . . . . . . . . . . . . . . . . . . . . . . . . . . . . . . . . . . . . . . . . . . . . . . . . . . . . . . . 6%Probably will not vote . . . . . . . . . . . . . . . . . . . . . . . . . . . . . . . . . . . . . . . . . . . . . . . . . . . . 0%Definitely will not vote . . . . . . . . . . . . . . . . . . . . . . . . . . . . . . . . . . . . . . . . . . . . . . . . . . . . 2%Don’t know . . . . . . . . . . . . . . . . . . . . . . . . . . . . . . . . . . . . . . . . . . . . . . . . . . . . . . . . . . . . . . .1%
3. In 2016, are you more likely to vote in the Democratic or Republican Presidential primary?
Democratic . . . . . . . . . . . . . . . . . . . . . . . . . . . . . . . . . . . . . . . . . . . . . . . . . . . . . . . . . . . . . 32%Republican . . . . . . . . . . . . . . . . . . . . . . . . . . . . . . . . . . . . . . . . . . . . . . . . . . . . . . . . . . . . . 35%Neither . . . . . . . . . . . . . . . . . . . . . . . . . . . . . . . . . . . . . . . . . . . . . . . . . . . . . . . . . . . . . . . . . 14%Don’t know . . . . . . . . . . . . . . . . . . . . . . . . . . . . . . . . . . . . . . . . . . . . . . . . . . . . . . . . . . . . . 19%
1

CBS News 2016 Battleground TrackerNew Hampshire
4. Which candidate are you most likely to vote for in the New Hampshire RepublicanPresidential primary in 2016?Asked of Republican primary voters
Jeb Bush . . . . . . . . . . . . . . . . . . . . . . . . . . . . . . . . . . . . . . . . . . . . . . . . . . . . . . . . . . . . . . . . 8%Ben Carson . . . . . . . . . . . . . . . . . . . . . . . . . . . . . . . . . . . . . . . . . . . . . . . . . . . . . . . . . . . . .12%Chris Christie . . . . . . . . . . . . . . . . . . . . . . . . . . . . . . . . . . . . . . . . . . . . . . . . . . . . . . . . . . . . 2%Ted Cruz . . . . . . . . . . . . . . . . . . . . . . . . . . . . . . . . . . . . . . . . . . . . . . . . . . . . . . . . . . . . . . . . . 5%Carly Fiorina . . . . . . . . . . . . . . . . . . . . . . . . . . . . . . . . . . . . . . . . . . . . . . . . . . . . . . . . . . . . . 7%Jim Gilmore . . . . . . . . . . . . . . . . . . . . . . . . . . . . . . . . . . . . . . . . . . . . . . . . . . . . . . . . . . . . . . 0%Lindsey Graham . . . . . . . . . . . . . . . . . . . . . . . . . . . . . . . . . . . . . . . . . . . . . . . . . . . . . . . . . 1%Mike Huckabee . . . . . . . . . . . . . . . . . . . . . . . . . . . . . . . . . . . . . . . . . . . . . . . . . . . . . . . . . . 0%Bobby Jindal . . . . . . . . . . . . . . . . . . . . . . . . . . . . . . . . . . . . . . . . . . . . . . . . . . . . . . . . . . . . . 0%John Kasich . . . . . . . . . . . . . . . . . . . . . . . . . . . . . . . . . . . . . . . . . . . . . . . . . . . . . . . . . . . . . 5%George Pataki . . . . . . . . . . . . . . . . . . . . . . . . . . . . . . . . . . . . . . . . . . . . . . . . . . . . . . . . . . . 0%Rand Paul . . . . . . . . . . . . . . . . . . . . . . . . . . . . . . . . . . . . . . . . . . . . . . . . . . . . . . . . . . . . . . . 4%Marco Rubio . . . . . . . . . . . . . . . . . . . . . . . . . . . . . . . . . . . . . . . . . . . . . . . . . . . . . . . . . . . . . 7%Rick Santorum . . . . . . . . . . . . . . . . . . . . . . . . . . . . . . . . . . . . . . . . . . . . . . . . . . . . . . . . . . . 1%Donald Trump . . . . . . . . . . . . . . . . . . . . . . . . . . . . . . . . . . . . . . . . . . . . . . . . . . . . . . . . . . 38%No preference . . . . . . . . . . . . . . . . . . . . . . . . . . . . . . . . . . . . . . . . . . . . . . . . . . . . . . . . . . . .8%
5. Which candidate are you most likely to vote for in the New Hampshire DemocraticPresidential primary in 2016?Asked of Democratic primary voters
Joe Biden . . . . . . . . . . . . . . . . . . . . . . . . . . . . . . . . . . . . . . . . . . . . . . . . . . . . . . . . . . . . . . . . 7%Lincoln Chafee . . . . . . . . . . . . . . . . . . . . . . . . . . . . . . . . . . . . . . . . . . . . . . . . . . . . . . . . . . . 0%Hillary Clinton . . . . . . . . . . . . . . . . . . . . . . . . . . . . . . . . . . . . . . . . . . . . . . . . . . . . . . . . . . .36%Lawrence Lessig . . . . . . . . . . . . . . . . . . . . . . . . . . . . . . . . . . . . . . . . . . . . . . . . . . . . . . . . . 0%Martin O’Malley . . . . . . . . . . . . . . . . . . . . . . . . . . . . . . . . . . . . . . . . . . . . . . . . . . . . . . . . . . 2%Bernie Sanders . . . . . . . . . . . . . . . . . . . . . . . . . . . . . . . . . . . . . . . . . . . . . . . . . . . . . . . . . 51%Jim Webb . . . . . . . . . . . . . . . . . . . . . . . . . . . . . . . . . . . . . . . . . . . . . . . . . . . . . . . . . . . . . . . . 0%No preference . . . . . . . . . . . . . . . . . . . . . . . . . . . . . . . . . . . . . . . . . . . . . . . . . . . . . . . . . . . .3%
2
CBS News 2016 Battleground TrackerNew Hampshire
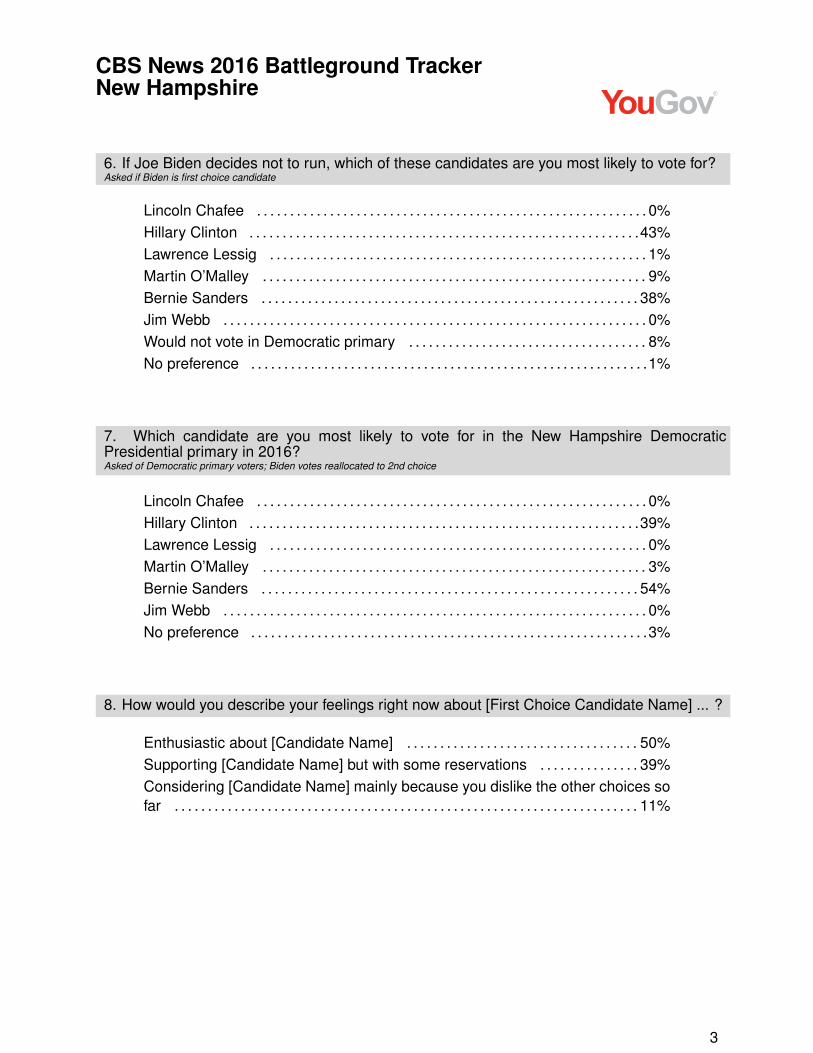
6. If Joe Biden decides not to run, which of these candidates are you most likely to vote for?Asked if Biden is first choice candidate
Lincoln Chafee . . . . . . . . . . . . . . . . . . . . . . . . . . . . . . . . . . . . . . . . . . . . . . . . . . . . . . . . . . . 0%Hillary Clinton . . . . . . . . . . . . . . . . . . . . . . . . . . . . . . . . . . . . . . . . . . . . . . . . . . . . . . . . . . .43%Lawrence Lessig . . . . . . . . . . . . . . . . . . . . . . . . . . . . . . . . . . . . . . . . . . . . . . . . . . . . . . . . . 1%Martin O’Malley . . . . . . . . . . . . . . . . . . . . . . . . . . . . . . . . . . . . . . . . . . . . . . . . . . . . . . . . . . 9%Bernie Sanders . . . . . . . . . . . . . . . . . . . . . . . . . . . . . . . . . . . . . . . . . . . . . . . . . . . . . . . . . 38%Jim Webb . . . . . . . . . . . . . . . . . . . . . . . . . . . . . . . . . . . . . . . . . . . . . . . . . . . . . . . . . . . . . . . . 0%Would not vote in Democratic primary . . . . . . . . . . . . . . . . . . . . . . . . . . . . . . . . . . . . 8%No preference . . . . . . . . . . . . . . . . . . . . . . . . . . . . . . . . . . . . . . . . . . . . . . . . . . . . . . . . . . . .1%
7. Which candidate are you most likely to vote for in the New Hampshire DemocraticPresidential primary in 2016?Asked of Democratic primary voters; Biden votes reallocated to 2nd choice
Lincoln Chafee . . . . . . . . . . . . . . . . . . . . . . . . . . . . . . . . . . . . . . . . . . . . . . . . . . . . . . . . . . . 0%Hillary Clinton . . . . . . . . . . . . . . . . . . . . . . . . . . . . . . . . . . . . . . . . . . . . . . . . . . . . . . . . . . .39%Lawrence Lessig . . . . . . . . . . . . . . . . . . . . . . . . . . . . . . . . . . . . . . . . . . . . . . . . . . . . . . . . . 0%Martin O’Malley . . . . . . . . . . . . . . . . . . . . . . . . . . . . . . . . . . . . . . . . . . . . . . . . . . . . . . . . . . 3%Bernie Sanders . . . . . . . . . . . . . . . . . . . . . . . . . . . . . . . . . . . . . . . . . . . . . . . . . . . . . . . . . 54%Jim Webb . . . . . . . . . . . . . . . . . . . . . . . . . . . . . . . . . . . . . . . . . . . . . . . . . . . . . . . . . . . . . . . . 0%No preference . . . . . . . . . . . . . . . . . . . . . . . . . . . . . . . . . . . . . . . . . . . . . . . . . . . . . . . . . . . .3%
8. How would you describe your feelings right now about [First Choice Candidate Name] ... ?
Enthusiastic about [Candidate Name] . . . . . . . . . . . . . . . . . . . . . . . . . . . . . . . . . . . 50%Supporting [Candidate Name] but with some reservations . . . . . . . . . . . . . . . 39%Considering [Candidate Name] mainly because you dislike the other choices sofar . . . . . . . . . . . . . . . . . . . . . . . . . . . . . . . . . . . . . . . . . . . . . . . . . . . . . . . . . . . . . . . . . . . . . . 11%
3

CBS News 2016 Battleground TrackerNew Hampshire
9. Although you are not voting for them right now, would you be satisfied or dissatisfied if theRepublican party eventually nominates...Asked of Republican primary voters not supporting the candidate
Satisfied Not satisifed Not sure yetJeb Bush 29% 55% 17%Ben Carson 40% 39% 21%Chris Christie 29% 50% 20%Ted Cruz 30% 49% 21%Carly Fiorina 37% 35% 28%Mike Huckabee 13% 69% 18%John Kasich 28% 43% 29%Rand Paul 18% 64% 18%Marco Rubio 36% 41% 23%Donald Trump 22% 57% 21%
10. Although you are not voting for them right now, would you be satisfied or dissatisfied if theDemocratic party eventually nominates...Asked of Democratic primary voters not supporting the candidate
Satisfied Not satisifed Not sure yetJoe Biden 47% 29% 24%Hillary Clinton 38% 45% 17%Bernie Sanders 41% 30% 28%
11. How much do you use Twitter to follow what’s going on with the 2016 campaign?
A lot . . . . . . . . . . . . . . . . . . . . . . . . . . . . . . . . . . . . . . . . . . . . . . . . . . . . . . . . . . . . . . . . . . . . . 5%Sometimes . . . . . . . . . . . . . . . . . . . . . . . . . . . . . . . . . . . . . . . . . . . . . . . . . . . . . . . . . . . . . 11%Not too much . . . . . . . . . . . . . . . . . . . . . . . . . . . . . . . . . . . . . . . . . . . . . . . . . . . . . . . . . . . 12%None . . . . . . . . . . . . . . . . . . . . . . . . . . . . . . . . . . . . . . . . . . . . . . . . . . . . . . . . . . . . . . . . . . . 72%
12. How much do you use Facebook to follow what’s going on with the 2016 campaign?
A lot . . . . . . . . . . . . . . . . . . . . . . . . . . . . . . . . . . . . . . . . . . . . . . . . . . . . . . . . . . . . . . . . . . . . 15%Sometimes . . . . . . . . . . . . . . . . . . . . . . . . . . . . . . . . . . . . . . . . . . . . . . . . . . . . . . . . . . . . . 25%Not too much . . . . . . . . . . . . . . . . . . . . . . . . . . . . . . . . . . . . . . . . . . . . . . . . . . . . . . . . . . . 17%None . . . . . . . . . . . . . . . . . . . . . . . . . . . . . . . . . . . . . . . . . . . . . . . . . . . . . . . . . . . . . . . . . . . 43%
4
CBS News 2016 Battleground TrackerNew Hampshire
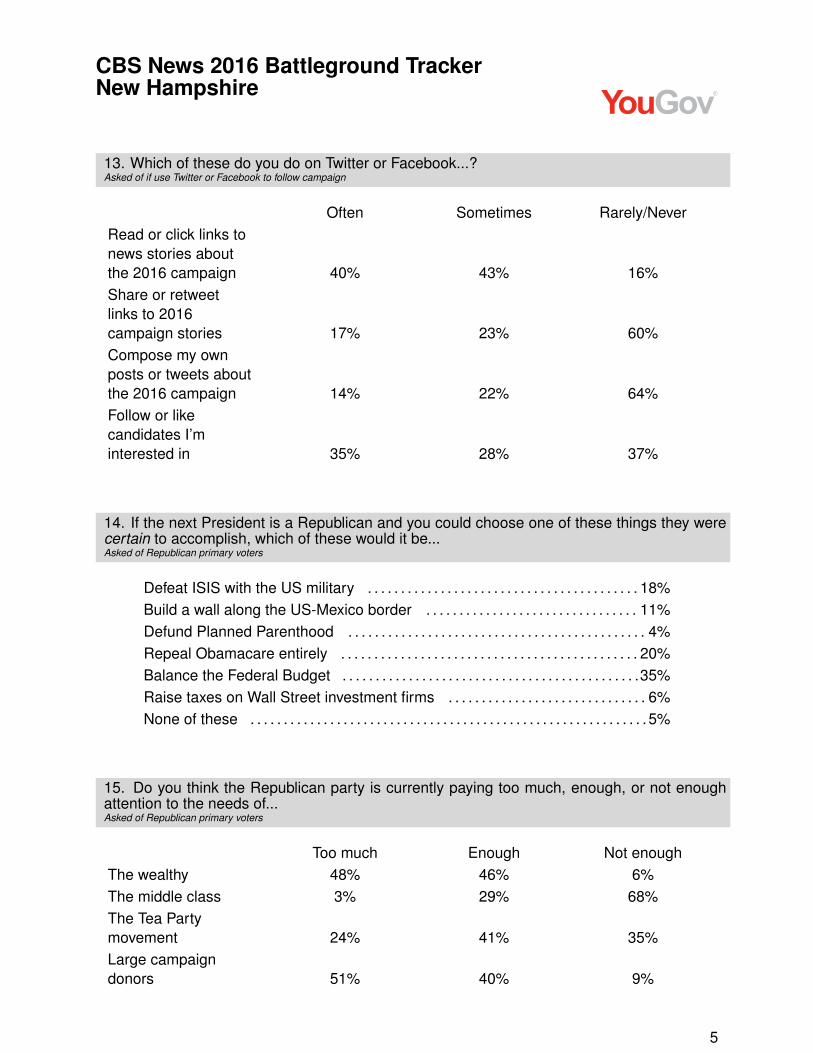
13. Which of these do you do on Twitter or Facebook...?Asked of if use Twitter or Facebook to follow campaign
Often Sometimes Rarely/NeverRead or click links tonews stories aboutthe 2016 campaign 40% 43% 16%Share or retweetlinks to 2016campaign stories 17% 23% 60%Compose my ownposts or tweets aboutthe 2016 campaign 14% 22% 64%Follow or likecandidates I’minterested in 35% 28% 37%
14. If the next President is a Republican and you could choose one of these things they werecertain to accomplish, which of these would it be...Asked of Republican primary voters
Defeat ISIS with the US military . . . . . . . . . . . . . . . . . . . . . . . . . . . . . . . . . . . . . . . . . 18%Build a wall along the US-Mexico border . . . . . . . . . . . . . . . . . . . . . . . . . . . . . . . . 11%Defund Planned Parenthood . . . . . . . . . . . . . . . . . . . . . . . . . . . . . . . . . . . . . . . . . . . . . 4%Repeal Obamacare entirely . . . . . . . . . . . . . . . . . . . . . . . . . . . . . . . . . . . . . . . . . . . . . 20%Balance the Federal Budget . . . . . . . . . . . . . . . . . . . . . . . . . . . . . . . . . . . . . . . . . . . . .35%Raise taxes on Wall Street investment firms . . . . . . . . . . . . . . . . . . . . . . . . . . . . . . 6%None of these . . . . . . . . . . . . . . . . . . . . . . . . . . . . . . . . . . . . . . . . . . . . . . . . . . . . . . . . . . . . 5%
15. Do you think the Republican party is currently paying too much, enough, or not enoughattention to the needs of...Asked of Republican primary voters
Too much Enough Not enoughThe wealthy 48% 46% 6%The middle class 3% 29% 68%The Tea Partymovement 24% 41% 35%Large campaigndonors 51% 40% 9%
5

CBS News 2016 Battleground TrackerNew Hampshire
16. Who do you think won the recent Democratic debate?Asked of Democratic primary voters
Lincoln Chafee . . . . . . . . . . . . . . . . . . . . . . . . . . . . . . . . . . . . . . . . . . . . . . . . . . . . . . . . . . . 0%Hillary Clinton . . . . . . . . . . . . . . . . . . . . . . . . . . . . . . . . . . . . . . . . . . . . . . . . . . . . . . . . . . .39%Martin O’Malley . . . . . . . . . . . . . . . . . . . . . . . . . . . . . . . . . . . . . . . . . . . . . . . . . . . . . . . . . . 1%Bernie Sanders . . . . . . . . . . . . . . . . . . . . . . . . . . . . . . . . . . . . . . . . . . . . . . . . . . . . . . . . . 38%Jim Webb . . . . . . . . . . . . . . . . . . . . . . . . . . . . . . . . . . . . . . . . . . . . . . . . . . . . . . . . . . . . . . . . 0%Not sure . . . . . . . . . . . . . . . . . . . . . . . . . . . . . . . . . . . . . . . . . . . . . . . . . . . . . . . . . . . . . . . . . 5%Have not heard or seen enough to say . . . . . . . . . . . . . . . . . . . . . . . . . . . . . . . . . . 17%
17. Of these, which is the most important reason you are supporting Hillary Clinton?Asked if Clinton is first choice candidate
It’s time for a woman president . . . . . . . . . . . . . . . . . . . . . . . . . . . . . . . . . . . . . . . . . . 19%She has the right experience . . . . . . . . . . . . . . . . . . . . . . . . . . . . . . . . . . . . . . . . . . . .51%She could change Washington and the political system . . . . . . . . . . . . . . . . . . . 9%She can win the General Election . . . . . . . . . . . . . . . . . . . . . . . . . . . . . . . . . . . . . . . 10%She cares about people like me . . . . . . . . . . . . . . . . . . . . . . . . . . . . . . . . . . . . . . . . . 10%
18. Of these, which is the most important reason you are supporting Bernie Sanders?Asked if Sanders is first choice candidate
His policies on income inequality . . . . . . . . . . . . . . . . . . . . . . . . . . . . . . . . . . . . . . . . 30%He says what he believes . . . . . . . . . . . . . . . . . . . . . . . . . . . . . . . . . . . . . . . . . . . . . . . 26%He could change Washington and the political system . . . . . . . . . . . . . . . . . . . 32%He can win the General Election . . . . . . . . . . . . . . . . . . . . . . . . . . . . . . . . . . . . . . . . . 1%He cares about people like me . . . . . . . . . . . . . . . . . . . . . . . . . . . . . . . . . . . . . . . . . . 12%
6

CBS News 2016 Battleground TrackerNew Hampshire
19. If the next President is a Democrat and you could choose one of these things they werecertain to accomplish, which of these would it be...Asked of Democratic primary voters
Defeat ISIS with the US military . . . . . . . . . . . . . . . . . . . . . . . . . . . . . . . . . . . . . . . . . . 7%Raise the minimum wage . . . . . . . . . . . . . . . . . . . . . . . . . . . . . . . . . . . . . . . . . . . . . . . 20%Raise taxes on Wall Street investment firms . . . . . . . . . . . . . . . . . . . . . . . . . . . . . 18%Put more restrictions on guns . . . . . . . . . . . . . . . . . . . . . . . . . . . . . . . . . . . . . . . . . . . 13%Reform the campaign finance system . . . . . . . . . . . . . . . . . . . . . . . . . . . . . . . . . . . 29%Make public college free . . . . . . . . . . . . . . . . . . . . . . . . . . . . . . . . . . . . . . . . . . . . . . . . . 9%None of these . . . . . . . . . . . . . . . . . . . . . . . . . . . . . . . . . . . . . . . . . . . . . . . . . . . . . . . . . . . . 4%
20. How do you feel about the Tea Party movement?⇤
Support . . . . . . . . . . . . . . . . . . . . . . . . . . . . . . . . . . . . . . . . . . . . . . . . . . . . . . . . . . . . . . . . .16%Oppose . . . . . . . . . . . . . . . . . . . . . . . . . . . . . . . . . . . . . . . . . . . . . . . . . . . . . . . . . . . . . . . . .42%Neutral . . . . . . . . . . . . . . . . . . . . . . . . . . . . . . . . . . . . . . . . . . . . . . . . . . . . . . . . . . . . . . . . . 42%
21. Would you describe yourself as a born-again or evangelical Christian?*
Yes . . . . . . . . . . . . . . . . . . . . . . . . . . . . . . . . . . . . . . . . . . . . . . . . . . . . . . . . . . . . . . . . . . . . . 25%No . . . . . . . . . . . . . . . . . . . . . . . . . . . . . . . . . . . . . . . . . . . . . . . . . . . . . . . . . . . . . . . . . . . . . .72%Not sure . . . . . . . . . . . . . . . . . . . . . . . . . . . . . . . . . . . . . . . . . . . . . . . . . . . . . . . . . . . . . . . . . 3%
22. Thinking about politics these days, how would you describe your own political viewpoint?*
Very liberal . . . . . . . . . . . . . . . . . . . . . . . . . . . . . . . . . . . . . . . . . . . . . . . . . . . . . . . . . . . . . 12%Liberal . . . . . . . . . . . . . . . . . . . . . . . . . . . . . . . . . . . . . . . . . . . . . . . . . . . . . . . . . . . . . . . . . . 13%Moderate . . . . . . . . . . . . . . . . . . . . . . . . . . . . . . . . . . . . . . . . . . . . . . . . . . . . . . . . . . . . . . . 36%Conservative . . . . . . . . . . . . . . . . . . . . . . . . . . . . . . . . . . . . . . . . . . . . . . . . . . . . . . . . . . . 26%Very Conservative . . . . . . . . . . . . . . . . . . . . . . . . . . . . . . . . . . . . . . . . . . . . . . . . . . . . . . . 7%Not sure . . . . . . . . . . . . . . . . . . . . . . . . . . . . . . . . . . . . . . . . . . . . . . . . . . . . . . . . . . . . . . . . . 6%
⇤Questions marked with an asterisk are only asked for respondents who had not answered in previous waves.Earlier responses were used where available.
7

CBS News 2016 Battleground TrackerNew Hampshire
23. Generally speaking, do you think of yourself as a ...?
Strong Democrat . . . . . . . . . . . . . . . . . . . . . . . . . . . . . . . . . . . . . . . . . . . . . . . . . . . . . . . 14%Not very strong Democrat . . . . . . . . . . . . . . . . . . . . . . . . . . . . . . . . . . . . . . . . . . . . . . . . 5%Lean Democrat . . . . . . . . . . . . . . . . . . . . . . . . . . . . . . . . . . . . . . . . . . . . . . . . . . . . . . . . . 18%Independent . . . . . . . . . . . . . . . . . . . . . . . . . . . . . . . . . . . . . . . . . . . . . . . . . . . . . . . . . . . . 24%Lean Republican . . . . . . . . . . . . . . . . . . . . . . . . . . . . . . . . . . . . . . . . . . . . . . . . . . . . . . . .14%Not very strong Republican . . . . . . . . . . . . . . . . . . . . . . . . . . . . . . . . . . . . . . . . . . . . . . 6%Strong Republican . . . . . . . . . . . . . . . . . . . . . . . . . . . . . . . . . . . . . . . . . . . . . . . . . . . . . . 13%Not sure . . . . . . . . . . . . . . . . . . . . . . . . . . . . . . . . . . . . . . . . . . . . . . . . . . . . . . . . . . . . . . . . . 5%
24. Are you male or female?
Male . . . . . . . . . . . . . . . . . . . . . . . . . . . . . . . . . . . . . . . . . . . . . . . . . . . . . . . . . . . . . . . . . . . .46%Female . . . . . . . . . . . . . . . . . . . . . . . . . . . . . . . . . . . . . . . . . . . . . . . . . . . . . . . . . . . . . . . . . 54%
25. In what year were you born? [Age recoded from birth year]
18-29 . . . . . . . . . . . . . . . . . . . . . . . . . . . . . . . . . . . . . . . . . . . . . . . . . . . . . . . . . . . . . . . . . . . 14%30-44 . . . . . . . . . . . . . . . . . . . . . . . . . . . . . . . . . . . . . . . . . . . . . . . . . . . . . . . . . . . . . . . . . . . 23%45-64 . . . . . . . . . . . . . . . . . . . . . . . . . . . . . . . . . . . . . . . . . . . . . . . . . . . . . . . . . . . . . . . . . . . 47%65+ . . . . . . . . . . . . . . . . . . . . . . . . . . . . . . . . . . . . . . . . . . . . . . . . . . . . . . . . . . . . . . . . . . . . . 16%
26. What racial or ethnic group best describes you?
White . . . . . . . . . . . . . . . . . . . . . . . . . . . . . . . . . . . . . . . . . . . . . . . . . . . . . . . . . . . . . . . . . . . 94%Black . . . . . . . . . . . . . . . . . . . . . . . . . . . . . . . . . . . . . . . . . . . . . . . . . . . . . . . . . . . . . . . . . . . . 1%Hispanic . . . . . . . . . . . . . . . . . . . . . . . . . . . . . . . . . . . . . . . . . . . . . . . . . . . . . . . . . . . . . . . . . 1%Other . . . . . . . . . . . . . . . . . . . . . . . . . . . . . . . . . . . . . . . . . . . . . . . . . . . . . . . . . . . . . . . . . . . . 5%
27. What is the highest level of education you have completed?
HS or less . . . . . . . . . . . . . . . . . . . . . . . . . . . . . . . . . . . . . . . . . . . . . . . . . . . . . . . . . . . . . . 28%Some college . . . . . . . . . . . . . . . . . . . . . . . . . . . . . . . . . . . . . . . . . . . . . . . . . . . . . . . . . . . 35%College grad . . . . . . . . . . . . . . . . . . . . . . . . . . . . . . . . . . . . . . . . . . . . . . . . . . . . . . . . . . . . 21%Post grad . . . . . . . . . . . . . . . . . . . . . . . . . . . . . . . . . . . . . . . . . . . . . . . . . . . . . . . . . . . . . . . 15%
8

CBS News 2016 Battleground TrackerNew Hampshire
1. Economy in StateHow would you rate the condition of the economy in New Hampshire today?
Gender Age group Race/Ethnicity
Total Male Female 18-29 30-44 45-64 65+ White Black Hispanic Other
Very good 6% 11% 2% 9% 2% 8% 7% 6% ⇤ ⇤ 14%Fairly good 52% 47% 55% 65% 42% 55% 44% 53% ⇤ ⇤ 27%Fairly bad 32% 31% 32% 16% 43% 27% 44% 31% ⇤ ⇤ 38%Very bad 7% 7% 7% 3% 9% 9% 3% 7% ⇤ ⇤ 12%Not sure 3% 3% 4% 7% 4% 2% 2% 3% ⇤ ⇤ 9%
Totals 100% 100% 100% 100% 100% 100% 100% 100% ⇤ ⇤ 100%(Weighted N) (1,146) (530) (616) (159) (265) (537) (185) (1,073) (11) (6) (54)
1

CBS News 2016 Battleground TrackerNew Hampshire
2. Likelihood of VotingHow likely is it that you will vote in the 2016 Presidential primary in New Hampshire?
Gender Age group Race/Ethnicity
Total Male Female 18-29 30-44 45-64 65+ White Black Hispanic Other
Definitely will vote 80% 88% 73% 62% 83% 82% 84% 79% ⇤ ⇤ 93%Probably will vote 11% 6% 16% 12% 13% 12% 8% 12% ⇤ ⇤ 3%Maybe will vote 6% 4% 7% 21% 0% 4% 7% 6% ⇤ ⇤ 0%Probably will not vote 0% 0% 0% 0% 0% 0% 1% 0% ⇤ ⇤ 0%Definitely will not vote 2% 1% 2% 5% 2% 1% 0% 1% ⇤ ⇤ 1%Don’t know 1% 1% 1% 0% 2% 1% 0% 1% ⇤ ⇤ 4%
Totals 100% 100% 100% 100% 100% 100% 100% 100% ⇤ ⇤ 100%(Weighted N) (1,148) (530) (618) (161) (265) (537) (184) (1,075) (11) (6) (54)
2
CBS News 2016 Battleground TrackerNew Hampshire
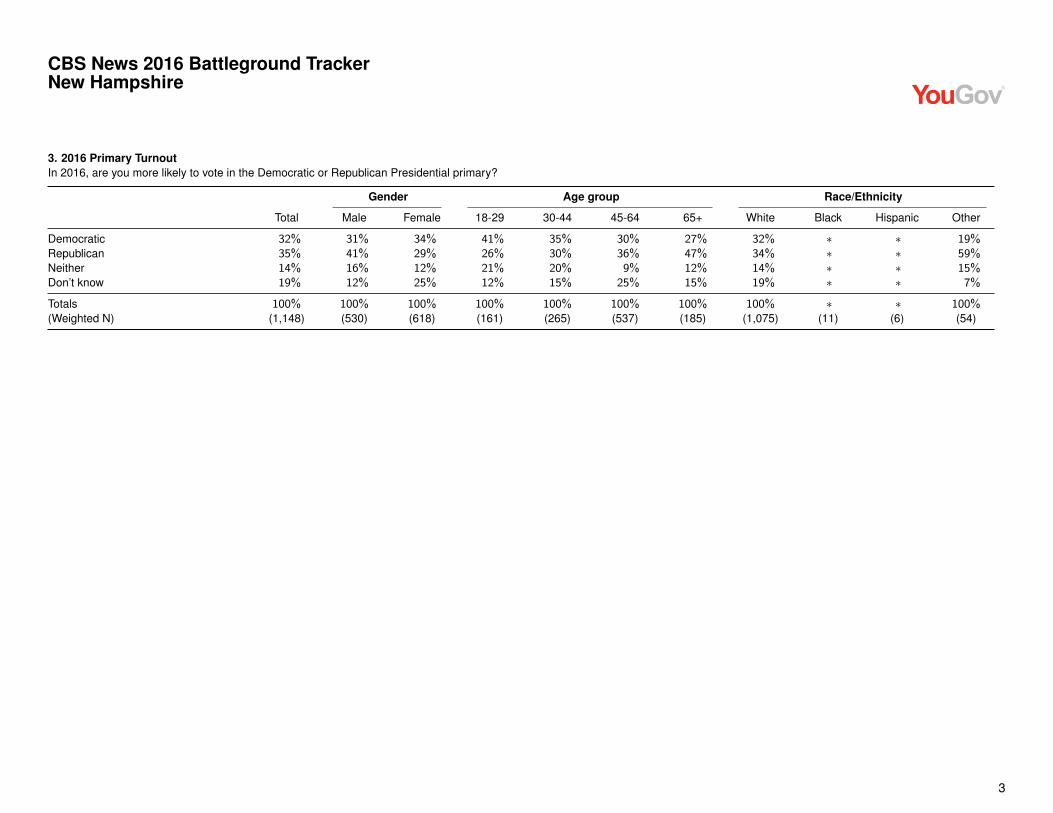
3. 2016 Primary TurnoutIn 2016, are you more likely to vote in the Democratic or Republican Presidential primary?
Gender Age group Race/Ethnicity
Total Male Female 18-29 30-44 45-64 65+ White Black Hispanic Other
Democratic 32% 31% 34% 41% 35% 30% 27% 32% ⇤ ⇤ 19%Republican 35% 41% 29% 26% 30% 36% 47% 34% ⇤ ⇤ 59%Neither 14% 16% 12% 21% 20% 9% 12% 14% ⇤ ⇤ 15%Don’t know 19% 12% 25% 12% 15% 25% 15% 19% ⇤ ⇤ 7%
Totals 100% 100% 100% 100% 100% 100% 100% 100% ⇤ ⇤ 100%(Weighted N) (1,148) (530) (618) (161) (265) (537) (185) (1,075) (11) (6) (54)
3

CBS News 2016 Battleground TrackerNew Hampshire
4. First Choice Republican CandidateWhich candidate are you most likely to vote for in the New Hampshire Republican Presidential primary in 2016?Asked of Republican primary voters
Gender Age group Race/Ethnicity
Total Male Female 18-29 30-44 45-64 65+ White Black Hispanic Other
Jeb Bush 8% 5% 11% 18% 4% 6% 10% 8% ⇤ ⇤ ⇤Ben Carson 12% 10% 15% 6% 16% 10% 18% 12% ⇤ ⇤ ⇤Chris Christie 2% 3% 1% 0% 4% 2% 1% 2% ⇤ ⇤ ⇤Ted Cruz 5% 5% 6% 0% 2% 8% 6% 5% ⇤ ⇤ ⇤Carly Fiorina 7% 8% 6% 5% 2% 8% 10% 7% ⇤ ⇤ ⇤Jim Gilmore 0% 0% 0% 0% 0% 0% 0% 0% ⇤ ⇤ ⇤Lindsey Graham 1% 2% 1% 6% 1% 1% 1% 1% ⇤ ⇤ ⇤Mike Huckabee 0% 0% 0% 0% 0% 0% 0% 0% ⇤ ⇤ ⇤Bobby Jindal 0% 1% 0% 0% 2% 0% 0% 0% ⇤ ⇤ ⇤John Kasich 5% 6% 5% 6% 0% 6% 10% 6% ⇤ ⇤ ⇤George Pataki 0% 0% 0% 0% 0% 0% 0% 0% ⇤ ⇤ ⇤Rand Paul 4% 6% 1% 8% 8% 2% 0% 3% ⇤ ⇤ ⇤Marco Rubio 7% 8% 6% 15% 1% 8% 9% 7% ⇤ ⇤ ⇤Rick Santorum 1% 1% 1% 0% 2% 1% 0% 1% ⇤ ⇤ ⇤Donald Trump 38% 41% 34% 27% 45% 41% 30% 38% ⇤ ⇤ ⇤No preference 8% 4% 13% 8% 12% 8% 4% 8% ⇤ ⇤ ⇤
Totals 100% 100% 100% 100% 100% 100% 100% 100% ⇤ ⇤ ⇤(Weighted N) (496) (269) (227) (52) (96) (242) (105) (454) (2) (0) (39)
4

CBS News 2016 Battleground TrackerNew Hampshire
5. First Choice Democratic CandidateWhich candidate are you most likely to vote for in the New Hampshire Democratic Presidential primary in 2016?Asked of Democratic primary voters
Gender Age group Race/Ethnicity
Total Male Female 18-29 30-44 45-64 65+ White Black Hispanic Other
Joe Biden 7% 5% 9% 2% 7% 9% 6% 7% ⇤ ⇤ ⇤Lincoln Chafee 0% 0% 0% 0% 0% 0% 0% 0% ⇤ ⇤ ⇤Hillary Clinton 36% 26% 43% 7% 33% 49% 38% 35% ⇤ ⇤ ⇤Lawrence Lessig 0% 1% 0% 0% 0% 1% 0% 0% ⇤ ⇤ ⇤Martin O’Malley 2% 3% 2% 6% 2% 1% 1% 2% ⇤ ⇤ ⇤Bernie Sanders 51% 64% 42% 77% 55% 38% 51% 52% ⇤ ⇤ ⇤Jim Webb 0% 0% 0% 0% 0% 0% 1% 0% ⇤ ⇤ ⇤No preference 3% 1% 5% 8% 3% 2% 3% 3% ⇤ ⇤ ⇤
Totals 100% 100% 100% 100% 100% 100% 100% 100% ⇤ ⇤ ⇤(Weighted N) (499) (198) (301) (82) (131) (221) (65) (470) (8) (4) (16)
6. 2nd Choice after BidenIf Joe Biden decides not to run, which of these candidates are you most likely to vote for?Asked if Biden is first choice candidate
Question not listed due to small sample size.
5

CBS News 2016 Battleground TrackerNew Hampshire
7. First Choice Democratic CandidateWhich candidate are you most likely to vote for in the New Hampshire Democratic Presidential primary in 2016?Asked of Democratic primary voters; Biden votes reallocated to 2nd choice
Gender Age group Race/Ethnicity
Total Male Female 18-29 30-44 45-64 65+ White Black Hispanic Other
Lincoln Chafee 0% 0% 0% 0% 0% 0% 0% 0% ⇤ ⇤ ⇤Hillary Clinton 39% 27% 47% 7% 33% 55% 40% 39% ⇤ ⇤ ⇤Lawrence Lessig 0% 1% 0% 0% 0% 1% 0% 0% ⇤ ⇤ ⇤Martin O’Malley 3% 4% 2% 6% 2% 3% 2% 3% ⇤ ⇤ ⇤Bernie Sanders 54% 67% 45% 79% 62% 40% 54% 54% ⇤ ⇤ ⇤Jim Webb 0% 0% 0% 0% 0% 0% 1% 0% ⇤ ⇤ ⇤No preference 3% 1% 5% 8% 3% 2% 3% 4% ⇤ ⇤ ⇤
Totals 100% 100% 100% 100% 100% 100% 100% 100% ⇤ ⇤ ⇤(Weighted N) (499) (198) (301) (83) (130) (222) (65) (469) (8) (5) (16)
6

CBS News 2016 Battleground TrackerNew Hampshire
8. Enthusiasm for First ChoiceHow would you describe your feelings right now about [First Choice Candidate Name] ... ?
Gender Age group Race/Ethnicity
Total Male Female 18-29 30-44 45-64 65+ White Black Hispanic Other
Enthusiastic 50% 52% 48% 36% 55% 53% 45% 50% ⇤ ⇤ ⇤Supporting with reservations 39% 35% 44% 45% 37% 36% 47% 40% ⇤ ⇤ ⇤Considering as best alternative 11% 14% 8% 19% 8% 11% 8% 10% ⇤ ⇤ ⇤
Totals 100% 100% 100% 100% 100% 100% 100% 100% ⇤ ⇤ ⇤(Weighted N) (971) (487) (484) (144) (208) (447) (171) (910) (7) (6) (46)
7

CBS News 2016 Battleground TrackerNew Hampshire
9. Satisfied with Republican Candidates – Jeb BushAlthough you are not voting for them right now, would you be satisfied or dissatisfied if the Republican party eventually nominates...Asked of Republican primary voters not supporting the candidate
Gender Age group Race/Ethnicity
Total Male Female 18-29 30-44 45-64 65+ White Black Hispanic Other
Satisfied 29% 31% 26% ⇤ 26% 25% 34% 30% ⇤ ⇤ ⇤Not satisifed 55% 54% 56% ⇤ 58% 60% 46% 54% ⇤ ⇤ ⇤Not sure yet 17% 16% 18% ⇤ 15% 15% 20% 16% ⇤ ⇤ ⇤
Totals 100% 100% 100% ⇤ 100% 100% 100% 100% ⇤ ⇤ ⇤(Weighted N) (452) (253) (199) (42) (92) (224) (93) (411) (2) (0) (38)
8

CBS News 2016 Battleground TrackerNew Hampshire
10. Satisfied with Republican Candidates – Ben CarsonAlthough you are not voting for them right now, would you be satisfied or dissatisfied if the Republican party eventually nominates...Asked of Republican primary voters not supporting the candidate
Gender Age group Race/Ethnicity
Total Male Female 18-29 30-44 45-64 65+ White Black Hispanic Other
Satisfied 40% 37% 43% ⇤ 24% 44% 62% 41% ⇤ ⇤ ⇤Not satisifed 39% 43% 34% ⇤ 51% 40% 29% 38% ⇤ ⇤ ⇤Not sure yet 21% 20% 23% ⇤ 25% 16% 9% 20% ⇤ ⇤ ⇤
Totals 100% 100% 100% ⇤ 100% 100% 100% 100% ⇤ ⇤ ⇤(Weighted N) (423) (234) (189) (48) (75) (214) (85) (387) (0) (0) (36)
9
CBS News 2016 Battleground TrackerNew Hampshire
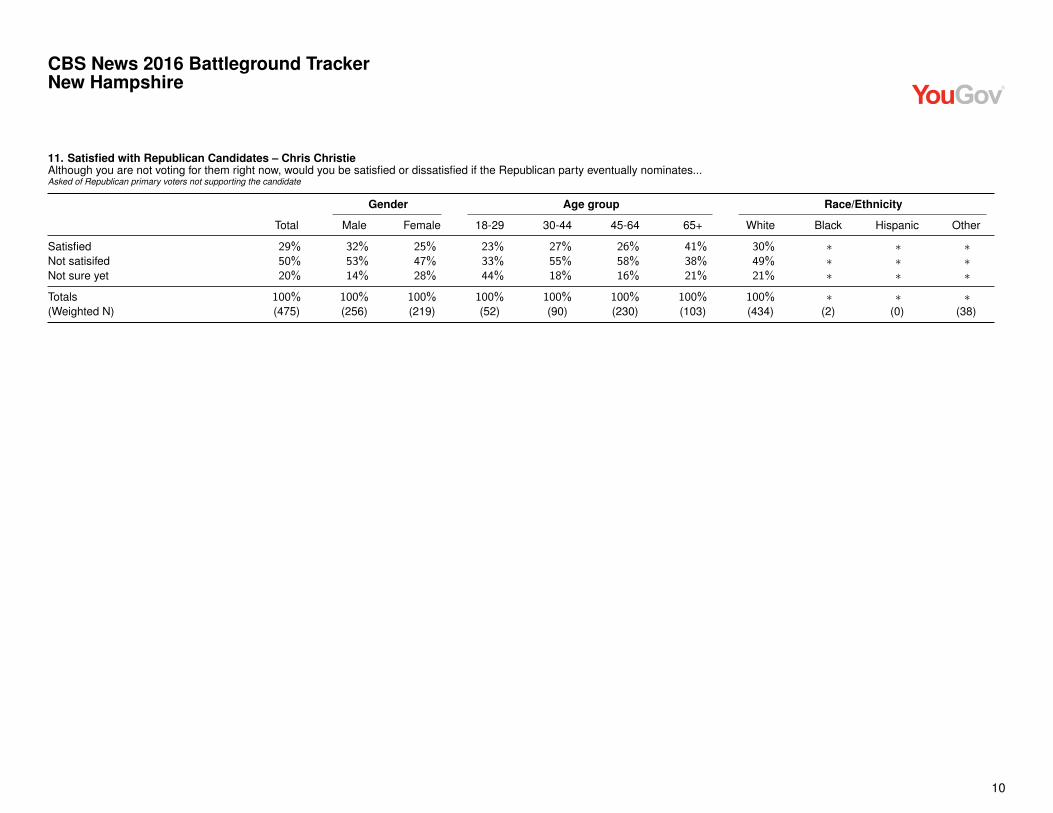
11. Satisfied with Republican Candidates – Chris ChristieAlthough you are not voting for them right now, would you be satisfied or dissatisfied if the Republican party eventually nominates...Asked of Republican primary voters not supporting the candidate
Gender Age group Race/Ethnicity
Total Male Female 18-29 30-44 45-64 65+ White Black Hispanic Other
Satisfied 29% 32% 25% 23% 27% 26% 41% 30% ⇤ ⇤ ⇤Not satisifed 50% 53% 47% 33% 55% 58% 38% 49% ⇤ ⇤ ⇤Not sure yet 20% 14% 28% 44% 18% 16% 21% 21% ⇤ ⇤ ⇤
Totals 100% 100% 100% 100% 100% 100% 100% 100% ⇤ ⇤ ⇤(Weighted N) (475) (256) (219) (52) (90) (230) (103) (434) (2) (0) (38)
10

CBS News 2016 Battleground TrackerNew Hampshire
12. Satisfied with Republican Candidates – Ted CruzAlthough you are not voting for them right now, would you be satisfied or dissatisfied if the Republican party eventually nominates...Asked of Republican primary voters not supporting the candidate
Gender Age group Race/Ethnicity
Total Male Female 18-29 30-44 45-64 65+ White Black Hispanic Other
Satisfied 30% 31% 28% 25% 27% 29% 36% 30% ⇤ ⇤ ⇤Not satisifed 49% 52% 45% 44% 53% 51% 44% 49% ⇤ ⇤ ⇤Not sure yet 21% 17% 27% 31% 20% 20% 20% 22% ⇤ ⇤ ⇤
Totals 100% 100% 100% 100% 100% 100% 100% 100% ⇤ ⇤ ⇤(Weighted N) (456) (249) (207) (52) (89) (218) (98) (418) (2) (0) (36)
11

CBS News 2016 Battleground TrackerNew Hampshire
13. Satisfied with Republican Candidates – Carly FiorinaAlthough you are not voting for them right now, would you be satisfied or dissatisfied if the Republican party eventually nominates...Asked of Republican primary voters not supporting the candidate
Gender Age group Race/Ethnicity
Total Male Female 18-29 30-44 45-64 65+ White Black Hispanic Other
Satisfied 37% 39% 35% ⇤ 40% 37% 52% 38% ⇤ ⇤ ⇤Not satisifed 35% 38% 32% ⇤ 38% 39% 26% 34% ⇤ ⇤ ⇤Not sure yet 28% 23% 33% ⇤ 22% 24% 22% 28% ⇤ ⇤ ⇤
Totals 100% 100% 100% ⇤ 100% 100% 100% 100% ⇤ ⇤ ⇤(Weighted N) (451) (243) (208) (49) (92) (216) (94) (414) (2) (0) (34)
12

CBS News 2016 Battleground TrackerNew Hampshire
14. Satisfied with Republican Candidates – Mike HuckabeeAlthough you are not voting for them right now, would you be satisfied or dissatisfied if the Republican party eventually nominates...Asked of Republican primary voters not supporting the candidate
Gender Age group Race/Ethnicity
Total Male Female 18-29 30-44 45-64 65+ White Black Hispanic Other
Satisfied 13% 11% 15% 1% 6% 14% 23% 14% ⇤ ⇤ ⇤Not satisifed 69% 73% 64% 78% 80% 68% 58% 69% ⇤ ⇤ ⇤Not sure yet 18% 15% 22% 21% 14% 19% 20% 17% ⇤ ⇤ ⇤
Totals 100% 100% 100% 100% 100% 100% 100% 100% ⇤ ⇤ ⇤(Weighted N) (482) (262) (221) (52) (90) (236) (104) (441) (2) (0) (38)
13

CBS News 2016 Battleground TrackerNew Hampshire
15. Satisfied with Republican Candidates – John KasichAlthough you are not voting for them right now, would you be satisfied or dissatisfied if the Republican party eventually nominates...Asked of Republican primary voters not supporting the candidate
Gender Age group Race/Ethnicity
Total Male Female 18-29 30-44 45-64 65+ White Black Hispanic Other
Satisfied 28% 32% 23% ⇤ 18% 25% 46% 29% ⇤ ⇤ ⇤Not satisifed 43% 44% 41% ⇤ 43% 52% 27% 42% ⇤ ⇤ ⇤Not sure yet 29% 24% 36% ⇤ 39% 23% 27% 30% ⇤ ⇤ ⇤
Totals 100% 100% 100% ⇤ 100% 100% 100% 100% ⇤ ⇤ ⇤(Weighted N) (456) (246) (210) (48) (90) (223) (94) (416) (2) (0) (38)
14

CBS News 2016 Battleground TrackerNew Hampshire
16. Satisfied with Republican Candidates – Rand PaulAlthough you are not voting for them right now, would you be satisfied or dissatisfied if the Republican party eventually nominates...Asked of Republican primary voters not supporting the candidate
Gender Age group Race/Ethnicity
Total Male Female 18-29 30-44 45-64 65+ White Black Hispanic Other
Satisfied 18% 21% 14% ⇤ 19% 19% 10% 18% ⇤ ⇤ ⇤Not satisifed 64% 65% 63% ⇤ 61% 69% 71% 64% ⇤ ⇤ ⇤Not sure yet 18% 14% 23% ⇤ 20% 12% 19% 18% ⇤ ⇤ ⇤
Totals 100% 100% 100% ⇤ 100% 100% 100% 100% ⇤ ⇤ ⇤(Weighted N) (463) (245) (218) (47) (86) (229) (101) (428) (2) (0) (32)
15

CBS News 2016 Battleground TrackerNew Hampshire
17. Satisfied with Republican Candidates – Marco RubioAlthough you are not voting for them right now, would you be satisfied or dissatisfied if the Republican party eventually nominates...Asked of Republican primary voters not supporting the candidate
Gender Age group Race/Ethnicity
Total Male Female 18-29 30-44 45-64 65+ White Black Hispanic Other
Satisfied 36% 40% 33% ⇤ 31% 34% 54% 36% ⇤ ⇤ ⇤Not satisifed 41% 37% 45% ⇤ 45% 48% 26% 41% ⇤ ⇤ ⇤Not sure yet 23% 24% 22% ⇤ 24% 19% 20% 23% ⇤ ⇤ ⇤
Totals 100% 100% 100% ⇤ 100% 100% 100% 100% ⇤ ⇤ ⇤(Weighted N) (444) (239) (205) (44) (89) (216) (94) (405) (2) (0) (37)
16

CBS News 2016 Battleground TrackerNew Hampshire
18. Satisfied with Republican Candidates – Donald TrumpAlthough you are not voting for them right now, would you be satisfied or dissatisfied if the Republican party eventually nominates...Asked of Republican primary voters not supporting the candidate
Gender Age group Race/Ethnicity
Total Male Female 18-29 30-44 45-64 65+ White Black Hispanic Other
Satisfied 22% 25% 18% ⇤ 21% 23% 27% 22% ⇤ ⇤ ⇤Not satisifed 57% 63% 52% ⇤ 68% 56% 44% 57% ⇤ ⇤ ⇤Not sure yet 21% 12% 30% ⇤ 11% 21% 29% 21% ⇤ ⇤ ⇤
Totals 100% 100% 100% ⇤ 100% 100% 100% 100% ⇤ ⇤ ⇤(Weighted N) (305) (158) (147) (38) (53) (141) (73) (279) (2) (0) (24)
17

CBS News 2016 Battleground TrackerNew Hampshire
19. Satisfied with Democratic Candidates – Joe BidenAlthough you are not voting for them right now, would you be satisfied or dissatisfied if the Democratic party eventually nominates...Asked of Democratic primary voters not supporting the candidate
Gender Age group Race/Ethnicity
Total Male Female 18-29 30-44 45-64 65+ White Black Hispanic Other
Satisfied 47% 51% 44% 41% 40% 51% 59% 47% ⇤ ⇤ ⇤Not satisifed 29% 29% 29% 16% 38% 29% 26% 29% ⇤ ⇤ ⇤Not sure yet 24% 20% 27% 43% 22% 20% 15% 24% ⇤ ⇤ ⇤
Totals 100% 100% 100% 100% 100% 100% 100% 100% ⇤ ⇤ ⇤(Weighted N) (461) (188) (273) (81) (122) (200) (58) (435) (8) (5) (13)
18

CBS News 2016 Battleground TrackerNew Hampshire
20. Satisfied with Democratic Candidates – Hillary ClintonAlthough you are not voting for them right now, would you be satisfied or dissatisfied if the Democratic party eventually nominates...Asked of Democratic primary voters not supporting the candidate
Gender Age group Race/Ethnicity
Total Male Female 18-29 30-44 45-64 65+ White Black Hispanic Other
Satisfied 38% 34% 41% 36% 31% 40% ⇤ 38% ⇤ ⇤ ⇤Not satisifed 45% 51% 40% 47% 55% 37% ⇤ 45% ⇤ ⇤ ⇤Not sure yet 17% 15% 19% 16% 14% 22% ⇤ 16% ⇤ ⇤ ⇤
Totals 100% 100% 100% 100% 100% 100% ⇤ 100% ⇤ ⇤ ⇤(Weighted N) (317) (148) (169) (77) (88) (112) (40) (302) (1) (1) (13)
19

CBS News 2016 Battleground TrackerNew Hampshire
21. Satisfied with Democratic Candidates – Bernie SandersAlthough you are not voting for them right now, would you be satisfied or dissatisfied if the Democratic party eventually nominates...Asked of Democratic primary voters not supporting the candidate
Gender Age group Race/Ethnicity
Total Male Female 18-29 30-44 45-64 65+ White Black Hispanic Other
Satisfied 41% 50% 38% ⇤ 47% 39% ⇤ 40% ⇤ ⇤ ⇤Not satisifed 30% 39% 27% ⇤ 26% 28% ⇤ 33% ⇤ ⇤ ⇤Not sure yet 28% 11% 35% ⇤ 27% 34% ⇤ 27% ⇤ ⇤ ⇤
Totals 100% 100% 100% ⇤ 100% 100% ⇤ 100% ⇤ ⇤ ⇤(Weighted N) (242) (70) (172) (19) (59) (134) (31) (224) (8) (4) (6)
20

CBS News 2016 Battleground TrackerNew Hampshire
22. Twitter for 2016 CampaignHow much do you use Twitter to follow what’s going on with the 2016 campaign?
Gender Age group Race/Ethnicity
Total Male Female 18-29 30-44 45-64 65+ White Black Hispanic Other
A lot 5% 5% 4% 10% 8% 3% 0% 4% ⇤ ⇤ 0%Sometimes 11% 14% 9% 19% 21% 6% 7% 11% ⇤ ⇤ 27%Not too much 12% 10% 13% 18% 15% 11% 5% 11% ⇤ ⇤ 14%None 72% 70% 74% 54% 56% 80% 88% 73% ⇤ ⇤ 59%
Totals 100% 100% 100% 100% 100% 100% 100% 100% ⇤ ⇤ 100%(Weighted N) (1,145) (527) (618) (161) (265) (534) (185) (1,072) (11) (6) (54)
21

CBS News 2016 Battleground TrackerNew Hampshire
23. Facebook for 2016 CampaignHow much do you use Facebook to follow what’s going on with the 2016 campaign?
Gender Age group Race/Ethnicity
Total Male Female 18-29 30-44 45-64 65+ White Black Hispanic Other
A lot 15% 15% 16% 16% 25% 12% 12% 16% ⇤ ⇤ 7%Sometimes 25% 29% 21% 38% 27% 22% 15% 24% ⇤ ⇤ 37%Not too much 17% 13% 21% 25% 20% 14% 15% 16% ⇤ ⇤ 17%None 43% 43% 42% 21% 28% 52% 58% 44% ⇤ ⇤ 38%
Totals 100% 100% 100% 100% 100% 100% 100% 100% ⇤ ⇤ 100%(Weighted N) (1,144) (527) (617) (161) (265) (535) (182) (1,071) (11) (6) (54)
22

CBS News 2016 Battleground TrackerNew Hampshire
24. Social Media for 2016 Campaign – Read or click links to news stories about the 2016 campaignWhich of these do you do on Twitter or Facebook...?Asked of if use Twitter or Facebook to follow campaign
Gender Age group Race/Ethnicity
Total Male Female 18-29 30-44 45-64 65+ White Black Hispanic Other
Often 40% 45% 36% 36% 46% 40% 36% 40% ⇤ ⇤ ⇤Sometimes 43% 39% 47% 57% 43% 38% 39% 43% ⇤ ⇤ ⇤Rarely/Never 16% 16% 17% 7% 12% 22% 25% 17% ⇤ ⇤ ⇤
Totals 100% 100% 100% 100% 100% 100% 100% 100% ⇤ ⇤ ⇤(Weighted N) (679) (308) (370) (131) (197) (274) (77) (623) (10) (6) (38)
23
CBS News 2016 Battleground TrackerNew Hampshire
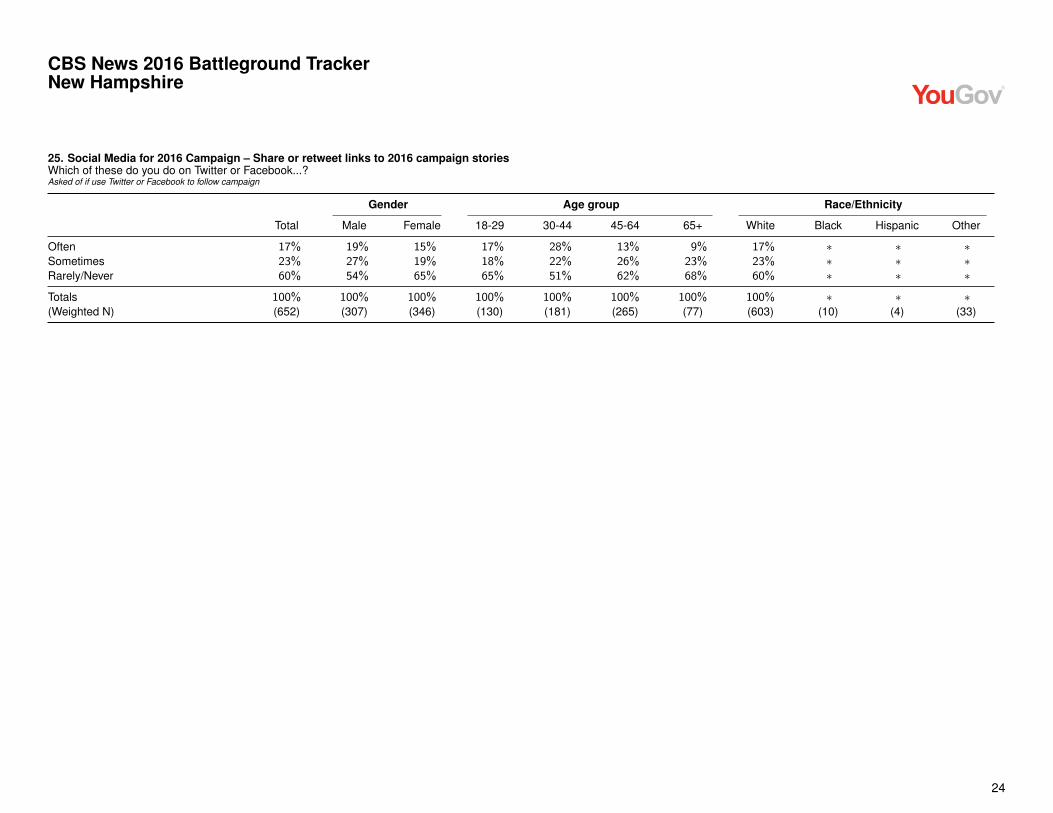
25. Social Media for 2016 Campaign – Share or retweet links to 2016 campaign storiesWhich of these do you do on Twitter or Facebook...?Asked of if use Twitter or Facebook to follow campaign
Gender Age group Race/Ethnicity
Total Male Female 18-29 30-44 45-64 65+ White Black Hispanic Other
Often 17% 19% 15% 17% 28% 13% 9% 17% ⇤ ⇤ ⇤Sometimes 23% 27% 19% 18% 22% 26% 23% 23% ⇤ ⇤ ⇤Rarely/Never 60% 54% 65% 65% 51% 62% 68% 60% ⇤ ⇤ ⇤
Totals 100% 100% 100% 100% 100% 100% 100% 100% ⇤ ⇤ ⇤(Weighted N) (652) (307) (346) (130) (181) (265) (77) (603) (10) (4) (33)
24

CBS News 2016 Battleground TrackerNew Hampshire
26. Social Media for 2016 Campaign – Compose my own posts or tweets about the 2016 campaignWhich of these do you do on Twitter or Facebook...?Asked of if use Twitter or Facebook to follow campaign
Gender Age group Race/Ethnicity
Total Male Female 18-29 30-44 45-64 65+ White Black Hispanic Other
Often 14% 18% 11% 11% 29% 8% 4% 14% ⇤ ⇤ ⇤Sometimes 22% 23% 20% 28% 26% 16% 18% 23% ⇤ ⇤ ⇤Rarely/Never 64% 59% 69% 61% 44% 76% 78% 64% ⇤ ⇤ ⇤
Totals 100% 100% 100% 100% 100% 100% 100% 100% ⇤ ⇤ ⇤(Weighted N) (667) (306) (361) (130) (192) (269) (75) (615) (10) (6) (33)
25

CBS News 2016 Battleground TrackerNew Hampshire
27. Social Media for 2016 Campaign – Follow or like candidates I’m interested inWhich of these do you do on Twitter or Facebook...?Asked of if use Twitter or Facebook to follow campaign
Gender Age group Race/Ethnicity
Total Male Female 18-29 30-44 45-64 65+ White Black Hispanic Other
Often 35% 40% 31% 34% 46% 28% 39% 36% ⇤ ⇤ ⇤Sometimes 28% 31% 26% 33% 19% 34% 22% 27% ⇤ ⇤ ⇤Rarely/Never 37% 29% 44% 34% 35% 39% 40% 37% ⇤ ⇤ ⇤
Totals 100% 100% 100% 100% 100% 100% 100% 100% ⇤ ⇤ ⇤(Weighted N) (663) (309) (354) (130) (183) (273) (77) (612) (10) (6) (33)
26

CBS News 2016 Battleground TrackerNew Hampshire
28. Republican President Policy GoalIf the next President is a Republican and you could choose one of these things they were certain to accomplish, which of these would it be...Asked of Republican primary voters
Gender Age group Race/Ethnicity
Total Male Female 18-29 30-44 45-64 65+ White Black Hispanic Other
Defeat ISIS with the US military 18% 11% 25% 25% 15% 15% 24% 19% ⇤ ⇤ ⇤Build a wall along the US-Mexicoborder 11% 12% 11% 0% 8% 15% 12% 11% ⇤ ⇤ ⇤Defund Planned Parenthood 4% 3% 4% 0% 4% 4% 5% 4% ⇤ ⇤ ⇤Repeal Obamacare entirely 20% 17% 24% 8% 26% 21% 18% 21% ⇤ ⇤ ⇤Balance the Federal Budget 35% 46% 23% 56% 43% 31% 28% 35% ⇤ ⇤ ⇤Raise taxes on Wall Street investmentfirms 6% 7% 6% 0% 5% 7% 7% 5% ⇤ ⇤ ⇤None of these 5% 4% 7% 11% 0% 6% 5% 5% ⇤ ⇤ ⇤
Totals 100% 100% 100% 100% 100% 100% 100% 100% ⇤ ⇤ ⇤(Weighted N) (496) (269) (227) (52) (96) (242) (105) (454) (2) (0) (39)
27

CBS News 2016 Battleground TrackerNew Hampshire
29. Republican Party Attention – The wealthyDo you think the Republican party is currently paying too much, enough, or not enough attention to the needs of...Asked of Republican primary voters
Gender Age group Race/Ethnicity
Total Male Female 18-29 30-44 45-64 65+ White Black Hispanic Other
Too much 48% 43% 55% 46% 52% 49% 44% 48% ⇤ ⇤ ⇤Enough 46% 50% 40% 39% 38% 49% 49% 46% ⇤ ⇤ ⇤Not enough 6% 7% 5% 16% 10% 2% 7% 6% ⇤ ⇤ ⇤
Totals 100% 100% 100% 100% 100% 100% 100% 100% ⇤ ⇤ ⇤(Weighted N) (489) (266) (223) (52) (96) (235) (105) (447) (2) (0) (39)
28

CBS News 2016 Battleground TrackerNew Hampshire
30. Republican Party Attention – The middle classDo you think the Republican party is currently paying too much, enough, or not enough attention to the needs of...Asked of Republican primary voters
Gender Age group Race/Ethnicity
Total Male Female 18-29 30-44 45-64 65+ White Black Hispanic Other
Too much 3% 4% 2% 8% 7% 1% 0% 3% ⇤ ⇤ ⇤Enough 29% 31% 28% 48% 29% 28% 23% 31% ⇤ ⇤ ⇤Not enough 68% 66% 70% 44% 63% 71% 77% 66% ⇤ ⇤ ⇤
Totals 100% 100% 100% 100% 100% 100% 100% 100% ⇤ ⇤ ⇤(Weighted N) (489) (265) (225) (52) (96) (236) (105) (448) (2) (0) (39)
29

CBS News 2016 Battleground TrackerNew Hampshire
31. Republican Party Attention – The Tea Party movementDo you think the Republican party is currently paying too much, enough, or not enough attention to the needs of...Asked of Republican primary voters
Gender Age group Race/Ethnicity
Total Male Female 18-29 30-44 45-64 65+ White Black Hispanic Other
Too much 24% 28% 19% 39% 17% 23% 23% 25% ⇤ ⇤ ⇤Enough 41% 32% 52% 33% 41% 40% 47% 43% ⇤ ⇤ ⇤Not enough 35% 41% 29% 29% 42% 37% 30% 32% ⇤ ⇤ ⇤
Totals 100% 100% 100% 100% 100% 100% 100% 100% ⇤ ⇤ ⇤(Weighted N) (485) (263) (222) (52) (93) (236) (105) (443) (2) (0) (39)
30

CBS News 2016 Battleground TrackerNew Hampshire
32. Republican Party Attention – Large campaign donorsDo you think the Republican party is currently paying too much, enough, or not enough attention to the needs of...Asked of Republican primary voters
Gender Age group Race/Ethnicity
Total Male Female 18-29 30-44 45-64 65+ White Black Hispanic Other
Too much 51% 53% 48% 72% 36% 53% 50% 51% ⇤ ⇤ ⇤Enough 40% 37% 42% 15% 47% 41% 42% 41% ⇤ ⇤ ⇤Not enough 9% 9% 9% 13% 17% 6% 8% 8% ⇤ ⇤ ⇤
Totals 100% 100% 100% 100% 100% 100% 100% 100% ⇤ ⇤ ⇤(Weighted N) (482) (261) (221) (52) (93) (233) (104) (440) (2) (0) (39)
31

CBS News 2016 Battleground TrackerNew Hampshire
33. Who Won the DebateWho do you think won the recent Democratic debate?Asked of Democratic primary voters
Gender Age group Race/Ethnicity
Total Male Female 18-29 30-44 45-64 65+ White Black Hispanic Other
Lincoln Chafee 0% 0% 0% 0% 0% 0% 0% 0% ⇤ ⇤ ⇤Hillary Clinton 39% 31% 43% 20% 21% 52% 52% 38% ⇤ ⇤ ⇤Martin O’Malley 1% 2% 0% 0% 2% 1% 0% 1% ⇤ ⇤ ⇤Bernie Sanders 38% 48% 32% 60% 53% 23% 35% 38% ⇤ ⇤ ⇤Jim Webb 0% 0% 0% 0% 0% 0% 0% 0% ⇤ ⇤ ⇤Not sure 5% 5% 4% 5% 2% 6% 5% 5% ⇤ ⇤ ⇤Have not heard or seen enough to say 17% 14% 20% 16% 23% 18% 9% 18% ⇤ ⇤ ⇤
Totals 100% 100% 100% 100% 100% 100% 100% 100% ⇤ ⇤ ⇤(Weighted N) (499) (198) (301) (82) (131) (221) (65) (470) (8) (4) (16)
32

CBS News 2016 Battleground TrackerNew Hampshire
34. Reason for Supporting ClintonOf these, which is the most important reason you are supporting Hillary Clinton?Asked if Clinton is first choice candidate
Gender Age group Race/Ethnicity
Total Male Female 18-29 30-44 45-64 65+ White Black Hispanic Other
It’s time for a woman president 19% 6% 25% ⇤ ⇤ 22% ⇤ 21% ⇤ ⇤ ⇤She has the right experience 51% 52% 51% ⇤ ⇤ 57% ⇤ 51% ⇤ ⇤ ⇤She could change Washington andthe political system 9% 11% 8% ⇤ ⇤ 5% ⇤ 9% ⇤ ⇤ ⇤She can win the General Election 10% 20% 7% ⇤ ⇤ 8% ⇤ 10% ⇤ ⇤ ⇤She cares about people like me 10% 12% 10% ⇤ ⇤ 8% ⇤ 9% ⇤ ⇤ ⇤
Totals 100% 100% 100% ⇤ ⇤ 100% ⇤ 100% ⇤ ⇤ ⇤(Weighted N) (182) (51) (130) (5) (43) (108) (25) (167) (8) (4) (3)
33

CBS News 2016 Battleground TrackerNew Hampshire
35. Reason for Supporting SandersOf these, which is the most important reason you are supporting Bernie Sanders?Asked if Sanders is first choice candidate
Gender Age group Race/Ethnicity
Total Male Female 18-29 30-44 45-64 65+ White Black Hispanic Other
His policies on income inequality 30% 38% 21% 30% 29% 35% ⇤ 29% ⇤ ⇤ ⇤He says what he believes 26% 22% 29% 17% 23% 30% ⇤ 27% ⇤ ⇤ ⇤He could change Washington and thepolitical system 32% 30% 35% 45% 38% 25% ⇤ 32% ⇤ ⇤ ⇤He can win the General Election 1% 1% 0% 0% 0% 1% ⇤ 1% ⇤ ⇤ ⇤He cares about people like me 12% 9% 14% 9% 11% 8% ⇤ 12% ⇤ ⇤ ⇤
Totals 100% 100% 100% 100% 100% 100% ⇤ 100% ⇤ ⇤ ⇤(Weighted N) (254) (129) (126) (64) (72) (85) (33) (243) (1) (1) (10)
34

CBS News 2016 Battleground TrackerNew Hampshire
36. Democratic President Policy GoalIf the next President is a Democrat and you could choose one of these things they were certain to accomplish, which of these would it be...Asked of Democratic primary voters
Gender Age group Race/Ethnicity
Total Male Female 18-29 30-44 45-64 65+ White Black Hispanic Other
Defeat ISIS with the US military 7% 4% 9% 2% 13% 7% 3% 7% ⇤ ⇤ ⇤Raise the minimum wage 20% 17% 22% 29% 22% 20% 4% 19% ⇤ ⇤ ⇤Raise taxes on Wall Street investmentfirms 18% 22% 15% 4% 21% 20% 21% 19% ⇤ ⇤ ⇤Put more restrictions on guns 13% 6% 17% 14% 10% 13% 17% 13% ⇤ ⇤ ⇤Reform the campaign finance system 29% 36% 25% 42% 16% 29% 44% 28% ⇤ ⇤ ⇤Make public college free 9% 10% 8% 4% 16% 8% 1% 9% ⇤ ⇤ ⇤None of these 4% 5% 4% 5% 2% 4% 10% 4% ⇤ ⇤ ⇤
Totals 100% 100% 100% 100% 100% 100% 100% 100% ⇤ ⇤ ⇤(Weighted N) (499) (198) (301) (82) (131) (221) (65) (470) (8) (4) (16)
35

CBS News 2016 Battleground TrackerNew Hampshire
Sample 496 Likely Republican Primary VotersConducted October 15-22, 2015Margin of Error ±6.6%
1. First Choice Republican CandidateWhich candidate are you most likely to vote for in the New Hampshire Republican Presidential primary in 2016?Asked of Republican primary voters
Ideology Tea Party Evangelical
Total Very conservative Conservative Moderate Yes No Yes No
Jeb Bush 8% 2% 8% 6% 2% 10% 11% 7%Ben Carson 12% 19% 14% 7% 17% 10% 22% 9%Chris Christie 2% 0% 3% 2% 1% 3% 0% 3%Ted Cruz 5% 15% 9% 2% 10% 3% 1% 7%Carly Fiorina 7% 10% 11% 6% 7% 7% 7% 7%Jim Gilmore 0% 0% 0% 0% 0% 0% 0% 0%Lindsey Graham 1% 0% 3% 2% 0% 2% 1% 1%Mike Huckabee 0% 0% 0% 0% 0% 0% 0% 0%Bobby Jindal 0% 3% 0% 0% 1% 0% 0% 1%John Kasich 5% 1% 3% 14% 3% 7% 1% 7%George Pataki 0% 0% 0% 0% 0% 0% 0% 0%Rand Paul 4% 9% 2% 7% 8% 2% 6% 3%Marco Rubio 7% 4% 7% 11% 5% 9% 7% 8%Rick Santorum 1% 0% 3% 0% 0% 2% 2% 1%Donald Trump 38% 35% 32% 39% 41% 36% 30% 39%No preference 8% 2% 6% 4% 6% 9% 11% 7%
Totals 100% 100% 100% 100% 100% 100% 100% 100%(Weighted N) (496) (67) (166) (126) (162) (334) (111) (374)
Gender Age group Party ID
Total Male Female 18-29 30-44 45-64 65+ Republican Independent
Jeb Bush 8% 5% 11% 18% 4% 6% 10% 8% 6%Ben Carson 12% 10% 15% 6% 16% 10% 18% 15% 10%Chris Christie 2% 3% 1% 0% 4% 2% 1% 3% 2%Ted Cruz 5% 5% 6% 0% 2% 8% 6% 3% 9%Carly Fiorina 7% 8% 6% 5% 2% 8% 10% 6% 9%Jim Gilmore 0% 0% 0% 0% 0% 0% 0% 0% 0%
continued on the next page . . .
1

CBS News 2016 Battleground TrackerNew Hampshire
continued from previous pageGender Age group Party ID
Total Male Female 18-29 30-44 45-64 65+ Republican Independent
Lindsey Graham 1% 2% 1% 6% 1% 1% 1% 2% 1%Mike Huckabee 0% 0% 0% 0% 0% 0% 0% 0% 0%Bobby Jindal 0% 1% 0% 0% 2% 0% 0% 1% 0%John Kasich 5% 6% 5% 6% 0% 6% 10% 7% 5%George Pataki 0% 0% 0% 0% 0% 0% 0% 0% 0%Rand Paul 4% 6% 1% 8% 8% 2% 0% 3% 4%Marco Rubio 7% 8% 6% 15% 1% 8% 9% 10% 5%Rick Santorum 1% 1% 1% 0% 2% 1% 0% 1% 1%Donald Trump 38% 41% 34% 27% 45% 41% 30% 36% 38%No preference 8% 4% 13% 8% 12% 8% 4% 5% 12%
Totals 100% 100% 100% 100% 100% 100% 100% 100% 100%(Weighted N) (496) (269) (227) (52) (96) (242) (105) (241) (230)
2
CBS News 2016 Battleground TrackerNew Hampshire
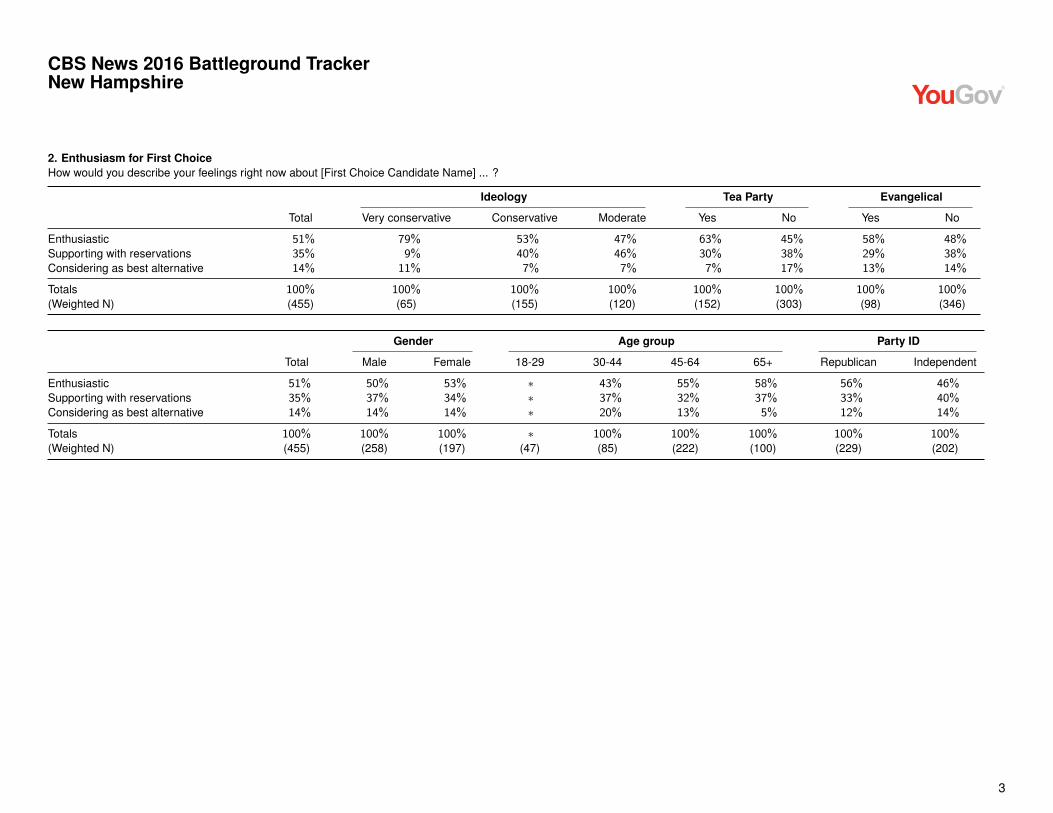
2. Enthusiasm for First ChoiceHow would you describe your feelings right now about [First Choice Candidate Name] ... ?
Ideology Tea Party Evangelical
Total Very conservative Conservative Moderate Yes No Yes No
Enthusiastic 51% 79% 53% 47% 63% 45% 58% 48%Supporting with reservations 35% 9% 40% 46% 30% 38% 29% 38%Considering as best alternative 14% 11% 7% 7% 7% 17% 13% 14%
Totals 100% 100% 100% 100% 100% 100% 100% 100%(Weighted N) (455) (65) (155) (120) (152) (303) (98) (346)
Gender Age group Party ID
Total Male Female 18-29 30-44 45-64 65+ Republican Independent
Enthusiastic 51% 50% 53% ⇤ 43% 55% 58% 56% 46%Supporting with reservations 35% 37% 34% ⇤ 37% 32% 37% 33% 40%Considering as best alternative 14% 14% 14% ⇤ 20% 13% 5% 12% 14%
Totals 100% 100% 100% ⇤ 100% 100% 100% 100% 100%(Weighted N) (455) (258) (197) (47) (85) (222) (100) (229) (202)
3
CBS News 2016 Battleground TrackerNew Hampshire
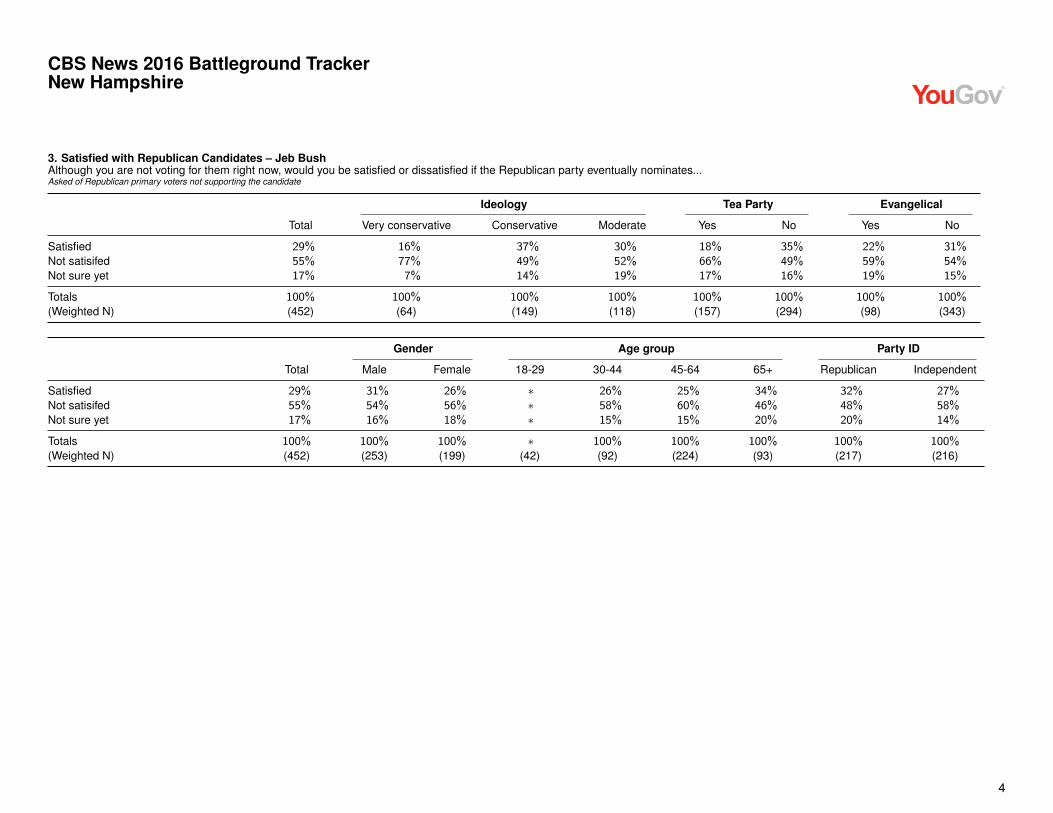
3. Satisfied with Republican Candidates – Jeb BushAlthough you are not voting for them right now, would you be satisfied or dissatisfied if the Republican party eventually nominates...Asked of Republican primary voters not supporting the candidate
Ideology Tea Party Evangelical
Total Very conservative Conservative Moderate Yes No Yes No
Satisfied 29% 16% 37% 30% 18% 35% 22% 31%Not satisifed 55% 77% 49% 52% 66% 49% 59% 54%Not sure yet 17% 7% 14% 19% 17% 16% 19% 15%
Totals 100% 100% 100% 100% 100% 100% 100% 100%(Weighted N) (452) (64) (149) (118) (157) (294) (98) (343)
Gender Age group Party ID
Total Male Female 18-29 30-44 45-64 65+ Republican Independent
Satisfied 29% 31% 26% ⇤ 26% 25% 34% 32% 27%Not satisifed 55% 54% 56% ⇤ 58% 60% 46% 48% 58%Not sure yet 17% 16% 18% ⇤ 15% 15% 20% 20% 14%
Totals 100% 100% 100% ⇤ 100% 100% 100% 100% 100%(Weighted N) (452) (253) (199) (42) (92) (224) (93) (217) (216)
4

CBS News 2016 Battleground TrackerNew Hampshire
4. Satisfied with Republican Candidates – Ben CarsonAlthough you are not voting for them right now, would you be satisfied or dissatisfied if the Republican party eventually nominates...Asked of Republican primary voters not supporting the candidate
Ideology Tea Party Evangelical
Total Very conservative Conservative Moderate Yes No Yes No
Satisfied 40% 57% 53% 27% 53% 34% 51% 36%Not satisifed 39% 23% 27% 54% 34% 42% 31% 42%Not sure yet 21% 20% 21% 19% 13% 24% 18% 22%
Totals 100% 100% 100% 100% 100% 100% 100% 100%(Weighted N) (423) (52) (139) (114) (128) (295) (86) (328)
Gender Age group Party ID
Total Male Female 18-29 30-44 45-64 65+ Republican Independent
Satisfied 40% 37% 43% ⇤ 24% 44% 62% 45% 38%Not satisifed 39% 43% 34% ⇤ 51% 40% 29% 35% 39%Not sure yet 21% 20% 23% ⇤ 25% 16% 9% 21% 23%
Totals 100% 100% 100% ⇤ 100% 100% 100% 100% 100%(Weighted N) (423) (234) (189) (48) (75) (214) (85) (200) (200)
5

CBS News 2016 Battleground TrackerNew Hampshire
5. Satisfied with Republican Candidates – Chris ChristieAlthough you are not voting for them right now, would you be satisfied or dissatisfied if the Republican party eventually nominates...Asked of Republican primary voters not supporting the candidate
Ideology Tea Party Evangelical
Total Very conservative Conservative Moderate Yes No Yes No
Satisfied 29% 16% 32% 38% 17% 35% 25% 30%Not satisifed 50% 69% 51% 45% 70% 41% 56% 49%Not sure yet 20% 15% 17% 17% 13% 24% 19% 21%
Totals 100% 100% 100% 100% 100% 100% 100% 100%(Weighted N) (475) (63) (157) (123) (159) (317) (110) (355)
Gender Age group Party ID
Total Male Female 18-29 30-44 45-64 65+ Republican Independent
Satisfied 29% 32% 25% 23% 27% 26% 41% 29% 30%Not satisifed 50% 53% 47% 33% 55% 58% 38% 49% 49%Not sure yet 20% 14% 28% 44% 18% 16% 21% 22% 20%
Totals 100% 100% 100% 100% 100% 100% 100% 100% 100%(Weighted N) (475) (256) (219) (52) (90) (230) (103) (228) (223)
6

CBS News 2016 Battleground TrackerNew Hampshire
6. Satisfied with Republican Candidates – Ted CruzAlthough you are not voting for them right now, would you be satisfied or dissatisfied if the Republican party eventually nominates...Asked of Republican primary voters not supporting the candidate
Ideology Tea Party Evangelical
Total Very conservative Conservative Moderate Yes No Yes No
Satisfied 30% 54% 44% 16% 56% 18% 43% 25%Not satisifed 49% 28% 35% 67% 29% 58% 31% 55%Not sure yet 21% 18% 21% 17% 15% 24% 26% 20%
Totals 100% 100% 100% 100% 100% 100% 100% 100%(Weighted N) (456) (55) (148) (119) (140) (317) (109) (337)
Gender Age group Party ID
Total Male Female 18-29 30-44 45-64 65+ Republican Independent
Satisfied 30% 31% 28% 25% 27% 29% 36% 33% 28%Not satisifed 49% 52% 45% 44% 53% 51% 44% 42% 54%Not sure yet 21% 17% 27% 31% 20% 20% 20% 26% 18%
Totals 100% 100% 100% 100% 100% 100% 100% 100% 100%(Weighted N) (456) (249) (207) (52) (89) (218) (98) (230) (203)
7

CBS News 2016 Battleground TrackerNew Hampshire
7. Satisfied with Republican Candidates – Carly FiorinaAlthough you are not voting for them right now, would you be satisfied or dissatisfied if the Republican party eventually nominates...Asked of Republican primary voters not supporting the candidate
Ideology Tea Party Evangelical
Total Very conservative Conservative Moderate Yes No Yes No
Satisfied 37% 48% 41% 40% 43% 34% 30% 39%Not satisifed 35% 34% 31% 38% 31% 37% 37% 35%Not sure yet 28% 18% 28% 22% 25% 29% 33% 26%
Totals 100% 100% 100% 100% 100% 100% 100% 100%(Weighted N) (451) (57) (146) (117) (148) (303) (102) (339)
Gender Age group Party ID
Total Male Female 18-29 30-44 45-64 65+ Republican Independent
Satisfied 37% 39% 35% ⇤ 40% 37% 52% 40% 36%Not satisifed 35% 38% 32% ⇤ 38% 39% 26% 30% 37%Not sure yet 28% 23% 33% ⇤ 22% 24% 22% 30% 27%
Totals 100% 100% 100% ⇤ 100% 100% 100% 100% 100%(Weighted N) (451) (243) (208) (49) (92) (216) (94) (220) (207)
8

CBS News 2016 Battleground TrackerNew Hampshire
8. Satisfied with Republican Candidates – Mike HuckabeeAlthough you are not voting for them right now, would you be satisfied or dissatisfied if the Republican party eventually nominates...Asked of Republican primary voters not supporting the candidate
Ideology Tea Party Evangelical
Total Very conservative Conservative Moderate Yes No Yes No
Satisfied 13% 17% 20% 6% 21% 9% 21% 11%Not satisifed 69% 61% 64% 81% 60% 73% 52% 74%Not sure yet 18% 22% 16% 13% 19% 18% 27% 15%
Totals 100% 100% 100% 100% 100% 100% 100% 100%(Weighted N) (482) (63) (162) (122) (156) (326) (108) (363)
Gender Age group Party ID
Total Male Female 18-29 30-44 45-64 65+ Republican Independent
Satisfied 13% 11% 15% 1% 6% 14% 23% 13% 13%Not satisifed 69% 73% 64% 78% 80% 68% 58% 68% 66%Not sure yet 18% 15% 22% 21% 14% 19% 20% 18% 20%
Totals 100% 100% 100% 100% 100% 100% 100% 100% 100%(Weighted N) (482) (262) (221) (52) (90) (236) (104) (236) (222)
9

CBS News 2016 Battleground TrackerNew Hampshire
9. Satisfied with Republican Candidates – John KasichAlthough you are not voting for them right now, would you be satisfied or dissatisfied if the Republican party eventually nominates...Asked of Republican primary voters not supporting the candidate
Ideology Tea Party Evangelical
Total Very conservative Conservative Moderate Yes No Yes No
Satisfied 28% 20% 37% 30% 24% 30% 21% 30%Not satisifed 43% 59% 38% 44% 52% 38% 36% 45%Not sure yet 29% 21% 25% 26% 25% 32% 44% 25%
Totals 100% 100% 100% 100% 100% 100% 100% 100%(Weighted N) (456) (63) (159) (104) (152) (304) (109) (338)
Gender Age group Party ID
Total Male Female 18-29 30-44 45-64 65+ Republican Independent
Satisfied 28% 32% 23% ⇤ 18% 25% 46% 31% 25%Not satisifed 43% 44% 41% ⇤ 43% 52% 27% 38% 45%Not sure yet 29% 24% 36% ⇤ 39% 23% 27% 30% 31%
Totals 100% 100% 100% ⇤ 100% 100% 100% 100% 100%(Weighted N) (456) (246) (210) (48) (90) (223) (94) (220) (212)
10

CBS News 2016 Battleground TrackerNew Hampshire
10. Satisfied with Republican Candidates – Rand PaulAlthough you are not voting for them right now, would you be satisfied or dissatisfied if the Republican party eventually nominates...Asked of Republican primary voters not supporting the candidate
Ideology Tea Party Evangelical
Total Very conservative Conservative Moderate Yes No Yes No
Satisfied 18% 23% 22% 10% 26% 14% 14% 19%Not satisifed 64% 65% 60% 70% 61% 65% 58% 65%Not sure yet 18% 12% 19% 20% 13% 20% 28% 15%
Totals 100% 100% 100% 100% 100% 100% 100% 100%(Weighted N) (463) (58) (155) (117) (144) (319) (101) (353)
Gender Age group Party ID
Total Male Female 18-29 30-44 45-64 65+ Republican Independent
Satisfied 18% 21% 14% ⇤ 19% 19% 10% 17% 19%Not satisifed 64% 65% 63% ⇤ 61% 69% 71% 60% 66%Not sure yet 18% 14% 23% ⇤ 20% 12% 19% 23% 15%
Totals 100% 100% 100% ⇤ 100% 100% 100% 100% 100%(Weighted N) (463) (245) (218) (47) (86) (229) (101) (227) (214)
11

CBS News 2016 Battleground TrackerNew Hampshire
11. Satisfied with Republican Candidates – Marco RubioAlthough you are not voting for them right now, would you be satisfied or dissatisfied if the Republican party eventually nominates...Asked of Republican primary voters not supporting the candidate
Ideology Tea Party Evangelical
Total Very conservative Conservative Moderate Yes No Yes No
Satisfied 36% 45% 46% 30% 42% 34% 33% 37%Not satisifed 41% 45% 29% 44% 39% 41% 40% 41%Not sure yet 23% 10% 26% 27% 19% 25% 27% 22%
Totals 100% 100% 100% 100% 100% 100% 100% 100%(Weighted N) (444) (61) (149) (107) (151) (293) (100) (333)
Gender Age group Party ID
Total Male Female 18-29 30-44 45-64 65+ Republican Independent
Satisfied 36% 40% 33% ⇤ 31% 34% 54% 42% 34%Not satisifed 41% 37% 45% ⇤ 45% 48% 26% 35% 42%Not sure yet 23% 24% 22% ⇤ 24% 19% 20% 23% 24%
Totals 100% 100% 100% ⇤ 100% 100% 100% 100% 100%(Weighted N) (444) (239) (205) (44) (89) (216) (94) (211) (209)
12

CBS News 2016 Battleground TrackerNew Hampshire
12. Satisfied with Republican Candidates – Donald TrumpAlthough you are not voting for them right now, would you be satisfied or dissatisfied if the Republican party eventually nominates...Asked of Republican primary voters not supporting the candidate
Ideology Tea Party Evangelical
Total Very conservative Conservative Moderate Yes No Yes No
Satisfied 22% ⇤ 24% 13% 35% 16% 27% 20%Not satisifed 57% ⇤ 48% 73% 49% 61% 37% 65%Not sure yet 21% ⇤ 28% 14% 15% 23% 36% 15%
Totals 100% ⇤ 100% 100% 100% 100% 100% 100%(Weighted N) (305) (43) (110) (76) (95) (210) (76) (226)
Gender Age group Party ID
Total Male Female 18-29 30-44 45-64 65+ Republican Independent
Satisfied 22% 25% 18% ⇤ 21% 23% 27% 25% 20%Not satisifed 57% 63% 52% ⇤ 68% 56% 44% 57% 59%Not sure yet 21% 12% 30% ⇤ 11% 21% 29% 18% 22%
Totals 100% 100% 100% ⇤ 100% 100% 100% 100% 100%(Weighted N) (305) (158) (147) (38) (53) (141) (73) (152) (141)
13

CBS News 2016 Battleground TrackerNew Hampshire
13. Republican President Policy GoalIf the next President is a Republican and you could choose one of these things they were certain to accomplish, which of these would it be...Asked of Republican primary voters
Ideology Tea Party Evangelical
Total Very conservative Conservative Moderate Yes No Yes No
Defeat ISIS with the US military 18% 15% 22% 13% 10% 21% 26% 15%Build a wall along the US-Mexicoborder 11% 11% 18% 11% 20% 7% 6% 13%Defund Planned Parenthood 4% 11% 5% 1% 6% 3% 12% 1%Repeal Obamacare entirely 20% 28% 16% 14% 26% 18% 17% 21%Balance the Federal Budget 35% 32% 35% 42% 34% 36% 38% 35%Raise taxes on Wall Street investmentfirms 6% 1% 1% 6% 1% 8% 0% 8%None of these 5% 3% 3% 11% 3% 7% 2% 7%
Totals 100% 100% 100% 100% 100% 100% 100% 100%(Weighted N) (496) (67) (166) (126) (162) (334) (111) (374)
Gender Age group Party ID
Total Male Female 18-29 30-44 45-64 65+ Republican Independent
Defeat ISIS with the US military 18% 11% 25% 25% 15% 15% 24% 23% 11%Build a wall along the US-Mexicoborder 11% 12% 11% 0% 8% 15% 12% 11% 13%Defund Planned Parenthood 4% 3% 4% 0% 4% 4% 5% 4% 4%Repeal Obamacare entirely 20% 17% 24% 8% 26% 21% 18% 21% 21%Balance the Federal Budget 35% 46% 23% 56% 43% 31% 28% 36% 37%Raise taxes on Wall Street investmentfirms 6% 7% 6% 0% 5% 7% 7% 3% 6%None of these 5% 4% 7% 11% 0% 6% 5% 2% 9%
Totals 100% 100% 100% 100% 100% 100% 100% 100% 100%(Weighted N) (496) (269) (227) (52) (96) (242) (105) (241) (230)
14

CBS News 2016 Battleground TrackerNew Hampshire
14. Republican Party Attention – The wealthyDo you think the Republican party is currently paying too much, enough, or not enough attention to the needs of...Asked of Republican primary voters
Ideology Tea Party Evangelical
Total Very conservative Conservative Moderate Yes No Yes No
Too much 48% 29% 38% 62% 30% 57% 32% 54%Enough 46% 68% 55% 35% 63% 37% 57% 42%Not enough 6% 3% 7% 3% 7% 6% 11% 5%
Totals 100% 100% 100% 100% 100% 100% 100% 100%(Weighted N) (489) (65) (163) (124) (160) (329) (110) (368)
Gender Age group Party ID
Total Male Female 18-29 30-44 45-64 65+ Republican Independent
Too much 48% 43% 55% 46% 52% 49% 44% 42% 51%Enough 46% 50% 40% 39% 38% 49% 49% 50% 44%Not enough 6% 7% 5% 16% 10% 2% 7% 8% 4%
Totals 100% 100% 100% 100% 100% 100% 100% 100% 100%(Weighted N) (489) (266) (223) (52) (96) (235) (105) (238) (229)
15

CBS News 2016 Battleground TrackerNew Hampshire
15. Republican Party Attention – The middle classDo you think the Republican party is currently paying too much, enough, or not enough attention to the needs of...Asked of Republican primary voters
Ideology Tea Party Evangelical
Total Very conservative Conservative Moderate Yes No Yes No
Too much 3% 0% 3% 2% 4% 2% 6% 2%Enough 29% 33% 36% 17% 29% 30% 35% 28%Not enough 68% 67% 61% 82% 67% 68% 59% 70%
Totals 100% 100% 100% 100% 100% 100% 100% 100%(Weighted N) (489) (66) (162) (124) (160) (330) (109) (370)
Gender Age group Party ID
Total Male Female 18-29 30-44 45-64 65+ Republican Independent
Too much 3% 4% 2% 8% 7% 1% 0% 6% 0%Enough 29% 31% 28% 48% 29% 28% 23% 37% 24%Not enough 68% 66% 70% 44% 63% 71% 77% 57% 76%
Totals 100% 100% 100% 100% 100% 100% 100% 100% 100%(Weighted N) (489) (265) (225) (52) (96) (236) (105) (238) (229)
16

CBS News 2016 Battleground TrackerNew Hampshire
16. Republican Party Attention – The Tea Party movementDo you think the Republican party is currently paying too much, enough, or not enough attention to the needs of...Asked of Republican primary voters
Ideology Tea Party Evangelical
Total Very conservative Conservative Moderate Yes No Yes No
Too much 24% 10% 13% 42% 1% 35% 9% 27%Enough 41% 37% 43% 36% 30% 46% 41% 41%Not enough 35% 53% 43% 21% 70% 19% 50% 32%
Totals 100% 100% 100% 100% 100% 100% 100% 100%(Weighted N) (485) (64) (164) (120) (156) (329) (108) (366)
Gender Age group Party ID
Total Male Female 18-29 30-44 45-64 65+ Republican Independent
Too much 24% 28% 19% 39% 17% 23% 23% 20% 29%Enough 41% 32% 52% 33% 41% 40% 47% 47% 36%Not enough 35% 41% 29% 29% 42% 37% 30% 33% 35%
Totals 100% 100% 100% 100% 100% 100% 100% 100% 100%(Weighted N) (485) (263) (222) (52) (93) (236) (105) (236) (226)
17

CBS News 2016 Battleground TrackerNew Hampshire
17. Republican Party Attention – Large campaign donorsDo you think the Republican party is currently paying too much, enough, or not enough attention to the needs of...Asked of Republican primary voters
Ideology Tea Party Evangelical
Total Very conservative Conservative Moderate Yes No Yes No
Too much 51% 57% 41% 61% 47% 53% 37% 55%Enough 40% 39% 51% 30% 49% 35% 59% 34%Not enough 9% 3% 8% 10% 4% 12% 4% 11%
Totals 100% 100% 100% 100% 100% 100% 100% 100%(Weighted N) (482) (64) (162) (120) (155) (327) (108) (363)
Gender Age group Party ID
Total Male Female 18-29 30-44 45-64 65+ Republican Independent
Too much 51% 53% 48% 72% 36% 53% 50% 48% 56%Enough 40% 37% 42% 15% 47% 41% 42% 43% 37%Not enough 9% 9% 9% 13% 17% 6% 8% 9% 7%
Totals 100% 100% 100% 100% 100% 100% 100% 100% 100%(Weighted N) (482) (261) (221) (52) (93) (233) (104) (235) (225)
18

CBS News 2016 Battleground TrackerNew Hampshire
Sample 499 Likely Democratic Primary VotersConducted October 15-22, 2015Margin of Error ±7.1%
1. First Choice Democratic CandidateWhich candidate are you most likely to vote for in the New Hampshire Democratic Presidential primary in 2016?Asked of Democratic primary voters
Ideology Gender Age group Party ID
Total Very liberal Liberal Moderate Male Female 18-29 30-44 45-64 65+ Democrat Independent
Joe Biden 7% 1% 12% 5% 5% 9% 2% 7% 9% 6% 8% 5%Lincoln Chafee 0% 0% 0% 0% 0% 0% 0% 0% 0% 0% 0% 0%Hillary Clinton 36% 18% 27% 46% 26% 43% 7% 33% 49% 38% 45% 26%Lawrence Lessig 0% 0% 0% 1% 1% 0% 0% 0% 1% 0% 0% 1%Martin O’Malley 2% 0% 0% 9% 3% 2% 6% 2% 1% 1% 3% 1%Bernie Sanders 51% 80% 59% 37% 64% 42% 77% 55% 38% 51% 40% 65%Jim Webb 0% 0% 0% 0% 0% 0% 0% 0% 0% 1% 0% 0%No preference 3% 0% 2% 2% 1% 5% 8% 3% 2% 3% 4% 2%
Totals 100% 100% 100% 100% 100% 100% 100% 100% 100% 100% 100% 100%(Weighted N) (499) (116) (129) (116) (198) (301) (82) (131) (221) (65) (301) (185)
2. 2nd Choice after BidenIf Joe Biden decides not to run, which of these candidates are you most likely to vote for?Asked if Biden is first choice candidate
Question not listed due to small sample size.
1

CBS News 2016 Battleground TrackerNew Hampshire
3. First Choice Democratic CandidateWhich candidate are you most likely to vote for in the New Hampshire Democratic Presidential primary in 2016?Asked of Democratic primary voters; Biden votes reallocated to 2nd choice
Ideology Gender Age group Party ID
Total Very liberal Liberal Moderate Male Female 18-29 30-44 45-64 65+ Democrat Independent
Lincoln Chafee 0% 0% 0% 0% 0% 0% 0% 0% 0% 0% 0% 0%Hillary Clinton 39% 18% 33% 47% 27% 47% 7% 33% 55% 40% 50% 26%Lawrence Lessig 0% 0% 0% 1% 1% 0% 0% 0% 1% 0% 0% 1%Martin O’Malley 3% 0% 0% 10% 4% 2% 6% 2% 3% 2% 3% 1%Bernie Sanders 54% 81% 64% 40% 67% 45% 79% 62% 40% 54% 42% 70%Jim Webb 0% 0% 0% 0% 0% 0% 0% 0% 0% 1% 0% 0%No preference 3% 0% 2% 2% 1% 5% 8% 3% 2% 3% 5% 2%
Totals 100% 100% 100% 100% 100% 100% 100% 100% 100% 100% 100% 100%(Weighted N) (499) (116) (129) (116) (198) (301) (83) (130) (222) (65) (300) (183)
2

CBS News 2016 Battleground TrackerNew Hampshire
4. Enthusiasm for First ChoiceHow would you describe your feelings right now about [First Choice Candidate Name] ... ?
Ideology Gender Age group Party ID
Total Very liberal Liberal Moderate Male Female 18-29 30-44 45-64 65+ Democrat Independent
Enthusiastic 66% 84% 80% 47% 66% 67% 67% 67% 69% 56% 67% 66%Supporting with reservations 29% 16% 16% 51% 29% 30% 25% 31% 29% 33% 29% 30%Considering as best alternative 4% 0% 4% 2% 6% 3% 8% 2% 2% 11% 3% 3%
Totals 100% 100% 100% 100% 100% 100% 100% 100% 100% 100% 100% 100%(Weighted N) (477) (116) (126) (114) (197) (279) (76) (127) (211) (63) (279) (182)
3

CBS News 2016 Battleground TrackerNew Hampshire
5. Satisfied with Democratic Candidates – Joe BidenAlthough you are not voting for them right now, would you be satisfied or dissatisfied if the Democratic party eventually nominates...Asked of Democratic primary voters not supporting the candidate
Ideology Gender Age group Party ID
Total Very liberal Liberal Moderate Male Female 18-29 30-44 45-64 65+ Democrat Independent
Satisfied 47% 41% 50% 52% 51% 44% 41% 40% 51% 59% 52% 41%Not satisifed 29% 33% 34% 19% 29% 29% 16% 38% 29% 26% 24% 35%Not sure yet 24% 26% 16% 29% 20% 27% 43% 22% 20% 15% 24% 25%
Totals 100% 100% 100% 100% 100% 100% 100% 100% 100% 100% 100% 100%(Weighted N) (461) (115) (111) (109) (188) (273) (81) (122) (200) (58) (272) (175)
4

CBS News 2016 Battleground TrackerNew Hampshire
6. Satisfied with Democratic Candidates – Hillary ClintonAlthough you are not voting for them right now, would you be satisfied or dissatisfied if the Democratic party eventually nominates...Asked of Democratic primary voters not supporting the candidate
Ideology Gender Age group Party ID
Total Very liberal Liberal Moderate Male Female 18-29 30-44 45-64 65+ Democrat Independent
Satisfied 38% 39% 31% 44% 34% 41% 36% 31% 40% ⇤ 52% 22%Not satisifed 45% 55% 43% 32% 51% 40% 47% 55% 37% ⇤ 32% 58%Not sure yet 17% 6% 25% 24% 15% 19% 16% 14% 22% ⇤ 16% 20%
Totals 100% 100% 100% 100% 100% 100% 100% 100% 100% ⇤ 100% 100%(Weighted N) (317) (95) (91) (63) (148) (169) (77) (88) (112) (40) (164) (138)
5

CBS News 2016 Battleground TrackerNew Hampshire
7. Satisfied with Democratic Candidates – Bernie SandersAlthough you are not voting for them right now, would you be satisfied or dissatisfied if the Democratic party eventually nominates...Asked of Democratic primary voters not supporting the candidate
Ideology Gender Age group Party ID
Total Very liberal Liberal Moderate Male Female 18-29 30-44 45-64 65+ Democrat Independent
Satisfied 41% ⇤ ⇤ 44% 50% 38% ⇤ 47% 39% ⇤ 46% 31%Not satisifed 30% ⇤ ⇤ 45% 39% 27% ⇤ 26% 28% ⇤ 26% 39%Not sure yet 28% ⇤ ⇤ 11% 11% 35% ⇤ 27% 34% ⇤ 28% 30%
Totals 100% ⇤ ⇤ 100% 100% 100% ⇤ 100% 100% ⇤ 100% 100%(Weighted N) (242) (23) (50) (73) (70) (172) (19) (59) (134) (31) (176) (64)
6

CBS News 2016 Battleground TrackerNew Hampshire
8. Who Won the DebateWho do you think won the recent Democratic debate?Asked of Democratic primary voters
Ideology Gender Age group Party ID
Total Very liberal Liberal Moderate Male Female 18-29 30-44 45-64 65+ Democrat Independent
Lincoln Chafee 0% 0% 0% 0% 0% 0% 0% 0% 0% 0% 0% 0%Hillary Clinton 39% 22% 35% 51% 31% 43% 20% 21% 52% 52% 47% 25%Martin O’Malley 1% 3% 0% 1% 2% 0% 0% 2% 1% 0% 1% 1%Bernie Sanders 38% 62% 49% 23% 48% 32% 60% 53% 23% 35% 31% 49%Jim Webb 0% 0% 0% 0% 0% 0% 0% 0% 0% 0% 0% 0%Not sure 5% 4% 3% 7% 5% 4% 5% 2% 6% 5% 4% 6%Have not heard or seen enough to say 17% 10% 13% 18% 14% 20% 16% 23% 18% 9% 17% 18%
Totals 100% 100% 100% 100% 100% 100% 100% 100% 100% 100% 100% 100%(Weighted N) (499) (116) (129) (116) (198) (301) (82) (131) (221) (65) (301) (185)
7

CBS News 2016 Battleground TrackerNew Hampshire
9. Reason for Supporting ClintonOf these, which is the most important reason you are supporting Hillary Clinton?Asked if Clinton is first choice candidate
Ideology Gender Age group Party ID
Total Very liberal Liberal Moderate Male Female 18-29 30-44 45-64 65+ Democrat Independent
It’s time for a woman president 19% ⇤ ⇤ 6% 6% 25% ⇤ ⇤ 22% ⇤ 17% ⇤She has the right experience 51% ⇤ ⇤ 63% 52% 51% ⇤ ⇤ 57% ⇤ 52% ⇤She could change Washington andthe political system 9% ⇤ ⇤ 7% 11% 8% ⇤ ⇤ 5% ⇤ 8% ⇤She can win the General Election 10% ⇤ ⇤ 14% 20% 7% ⇤ ⇤ 8% ⇤ 12% ⇤She cares about people like me 10% ⇤ ⇤ 9% 12% 10% ⇤ ⇤ 8% ⇤ 11% ⇤
Totals 100% ⇤ ⇤ 100% 100% 100% ⇤ ⇤ 100% ⇤ 100% ⇤(Weighted N) (182) (21) (35) (53) (51) (130) (5) (43) (108) (25) (134) (47)
8

CBS News 2016 Battleground TrackerNew Hampshire
10. Reason for Supporting SandersOf these, which is the most important reason you are supporting Bernie Sanders?Asked if Sanders is first choice candidate
Ideology Gender Age group Party ID
Total Very liberal Liberal Moderate Male Female 18-29 30-44 45-64 65+ Democrat Independent
His policies on income inequality 30% 38% 26% ⇤ 38% 21% 30% 29% 35% ⇤ 37% 26%He says what he believes 26% 13% 25% ⇤ 22% 29% 17% 23% 30% ⇤ 22% 27%He could change Washington and thepolitical system 32% 38% 43% ⇤ 30% 35% 45% 38% 25% ⇤ 29% 37%He can win the General Election 1% 1% 1% ⇤ 1% 0% 0% 0% 1% ⇤ 0% 1%He cares about people like me 12% 10% 4% ⇤ 9% 14% 9% 11% 8% ⇤ 12% 9%
Totals 100% 100% 100% ⇤ 100% 100% 100% 100% 100% ⇤ 100% 100%(Weighted N) (254) (93) (76) (43) (129) (126) (64) (72) (85) (33) (119) (121)
9

CBS News 2016 Battleground TrackerNew Hampshire
11. Democratic President Policy GoalIf the next President is a Democrat and you could choose one of these things they were certain to accomplish, which of these would it be...Asked of Democratic primary voters
Ideology Gender Age group Party ID
Total Very liberal Liberal Moderate Male Female 18-29 30-44 45-64 65+ Democrat Independent
Defeat ISIS with the US military 7% 9% 0% 8% 4% 9% 2% 13% 7% 3% 6% 10%Raise the minimum wage 20% 15% 20% 11% 17% 22% 29% 22% 20% 4% 24% 14%Raise taxes on Wall Street investmentfirms 18% 12% 21% 27% 22% 15% 4% 21% 20% 21% 18% 16%Put more restrictions on guns 13% 7% 11% 10% 6% 17% 14% 10% 13% 17% 15% 10%Reform the campaign finance system 29% 42% 33% 37% 36% 25% 42% 16% 29% 44% 26% 36%Make public college free 9% 13% 11% 6% 10% 8% 4% 16% 8% 1% 9% 8%None of these 4% 2% 4% 1% 5% 4% 5% 2% 4% 10% 2% 5%
Totals 100% 100% 100% 100% 100% 100% 100% 100% 100% 100% 100% 100%(Weighted N) (499) (116) (129) (116) (198) (301) (82) (131) (221) (65) (301) (185)
10