cbt corporate tax ranking 2012 - saïd business school 4 cbt corporate tax ranking 2012 executive...
TRANSCRIPT

CBT Corporate tax ranking 2012Katarzyna BilickaMichael Devereux

CBT CorPorATE TAx rAnkinG 2012 PAGE 1
CBT Corporate tax ranking 2012Katarzyna BilickaMichael Devereux
June 2012

PAGE 2 CBT CorPorATE TAx rAnkinG 2012
OXFORD UNIVERSITYCENTRE FORBUSINESS TAXATIONSaïd Business SchoolPark End Street, oxford ox1 1HP, Ukwww.sbs.ox.ac.uk/tax/
© oxford University Centre for Business Taxation, 2012
The opinions expressed in this report represent the views of the authors. They do not represent the views of the oxford University Centre for Business Taxation, which has no corporate views.
This report forms part of the output of the oxford University Centre for Business Taxation, based in the Saïd Business School. The work was financed partly by a grant from the ESrC (grant rES-060-25-0033), and partly from donations from a number of Uk companies, members of the Hundred Group. The full list of corporate donors is provided on the Centre’s website, at www.sbs.ox.ac.uk/tax.
iSBn number: 978-0-9559350-4-6

CBT CorPorATE TAx rAnkinG 2012 PAGE 3
ContentS executive Summary 4
1 Introduction 6
2 2012 rankings for G20 countries 8
3 2012 rankings for oeCD countries 11
4 tax reforms: 2011 and beyond 15
4.1 reforms in 2011 and 2012 15
4.2 2012 and beyond 18
4.3 2015 rankings 20
5 A new wave of competition? 24
Appendix A: Methodology 30
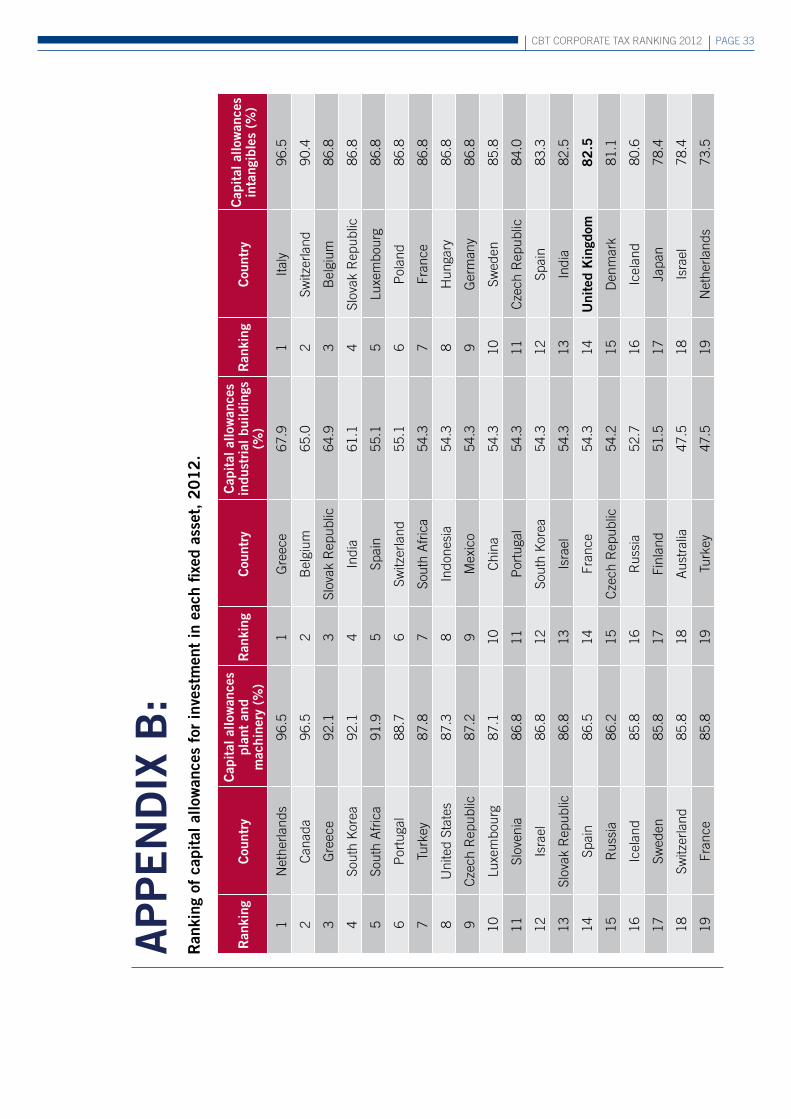
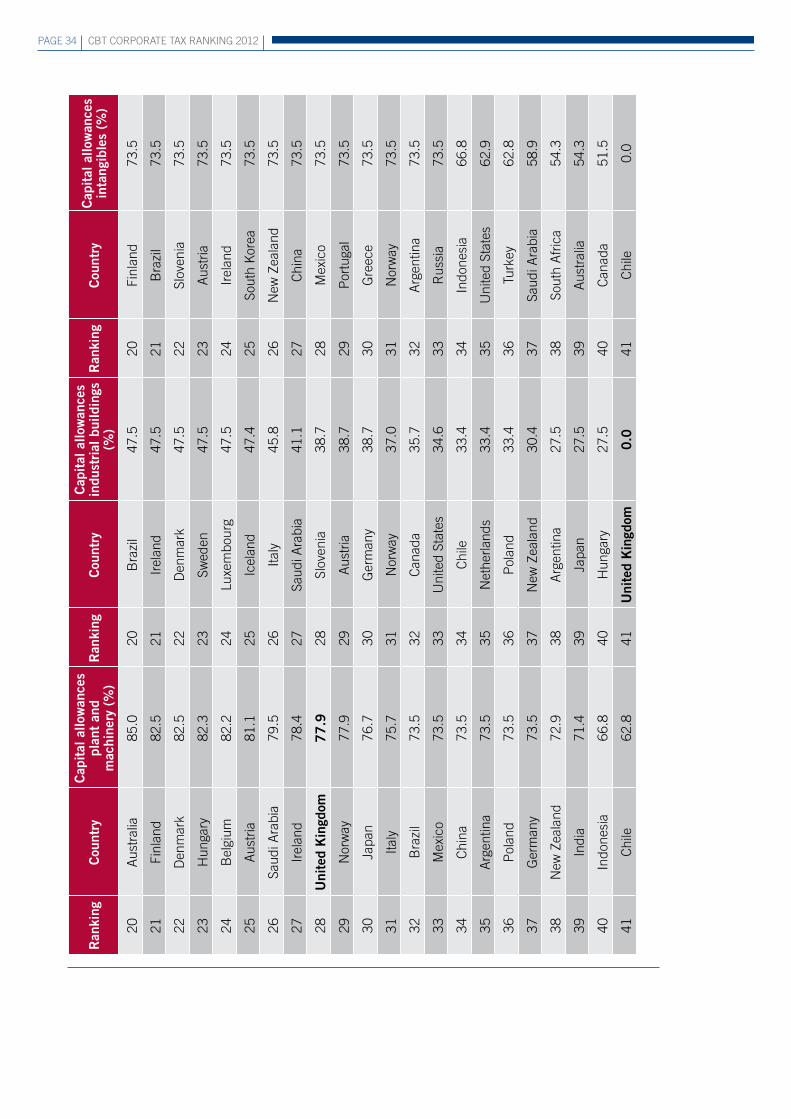
Appendix B: Ranking of capital allowances for investment 33 in each fixed asset, 2012.
References 35

PAGE 4 CBT CorPorATE TAx rAnkinG 2012
exeCutIve SuMMARyThis report assesses the competitiveness of the Uk corporation tax regime at the beginning of 2012. one motivation for such an assessment comes from the Uk coalition agreement, which stated that:
“Our aim is to create the most competitive corporate tax regime in the G20, while protecting manufacturing industries.” 1
in a 2011 report, we assessed how close the government was to achieving its objective, both on taking office and after its proposed cuts in the corporation tax rate. We assessed competitiveness using two measures of effective tax rates: an effective average tax rate (EATr) and an effective marginal tax rate (EMTr). We concluded that in 2011 the Uk ranked 9th in the G20 on the EATr, and only 15th on the EMTr. The relatively poor ranking of the EMTr reflects the low allowances available in the Uk for capital investment, particularly in industrial buildings. This is a particular concern given the last part of the government’s aim, to protect manufacturing industries.
This 2012 report updates the comparison with other G20 countries to 2012. Perhaps not surprisingly, the Uk’s rankings have not changed, despite a reduction in the corporation tax rate of 2 percentage points. This is partly because other countries have also reduced their rates, but also because the reduction in the Uk rate has not yet been very large.
The G20 may not be the most appropriate group of countries with which to compare the Uk. As an alternative, we also compare the Uk with countries that are members of the oECD. The results of this comparison show the Uk in a less flattering light. The Uk ranks 22nd out of 33 oECD countries for the EATr, and 31st out of 33 for the EMTr. This poor ranking is again mostly due to the lack of generosity of allowances for capital expenditure: amongst the 33 oECD countries, only Chile has less generous allowances. But in addition the Uk’s tax rate is relatively high when compared to oECD countries. The Uk’s tax rate of 26% at the beginning of 2012 was only the 17th lowest rate in the oECD.
This report also documents reforms that have been enacted and proposed in G20 and oECD countries in 2011, 2012 and up to 2015. A number of countries have proposed and enacted reforms to corporation tax. The most common reform has been a reduction in the statutory rate, as in the Uk. Taking into account such reforms, we also evaluate the position that would occur by 2015 if all projected reforms, but no others, took place.
1 H.M. Government (2010), p. 10

CBT CorPorATE TAx rAnkinG 2012 PAGE 5
Compared to all countries in the G20 and the oECD, in 2015 the Uk would have a ranking of 16th out of 41 countries for the EATr, with a rate of 20.3%. it would have a ranking of 32nd out of the 41 countries for the EMTr, with a rate of 18.9%. Even after the implementation of the planned cuts to corporation tax, then, the Uk will not be particularly competitive relative to other countries in the G20 and oECD.
Finally, given the large number of recent reforms to corporation tax around the world, we investigate the extent to which the economic and financial crisis may have given renewed impetus to competitive pressures between countries to reduce effective rates of corporation tax. We compare the spate of recent reforms to similar reforms over the last thirty years. Broadly, the number and size of recent reforms is consistent with earlier periods. rates of corporation tax have been declining for 30 years, and this decline is continuing. However, there is some evidence of a greater response to competitive pressures amongst G7 countries.

PAGE 6 CBT CorPorATE TAx rAnkinG 2012
1. IntRoDuCtIonThe coalition agreement of 2010 upon which the current Uk government is based contains the following statement:
“Our aim is to create the most competitive corporate tax regime in the G20, while protecting manufacturing industries.” 2
in a 2011 report, we assessed how close the government was to achieving its objective, both on taking office and after its proposed cuts in the corporation tax rate. We assessed competitiveness using two measures of effective tax rates: an effective average tax rate (EATr) and an effective marginal tax rate (EMTr). We define these measures in more detail in the next section.
Broadly, in 2011 we concluded:
the Uk had an EATr of just over 26 percent, which ranked the Uk 9th of out the 19 •independent G20 countries, and
the Uk had an EMTr of just under 23 percent, which ranked the Uk 15th out of the •19 countries.
The weaker position of the EMTr was due to the fact that, although the Uk tax rate was relatively low by international standards (in 7th position), the Uk had the least generous treatment in the G20 of allowances for capital investment. The EMTr is more sensitive to those allowances than the EATr.
This 2012 report has three main aims.
First, we update our comparison of the effective tax rates in G20 countries to 2012: specifically, we compare taxes as they were in January 2012.
Second, we broaden the set of countries with which to compare the Uk, including all oECD countries as well as G20 countries.
Third, we report on corporation tax reforms that have recently been undertaken and proposed in all G20 and oECD countries. Many countries have introduced new reforms, mostly in an effort to reduce effective tax rates and stimulate investment and growth following the financial and economic crisis. We ask whether these reforms can be seen as the beginning of a new wave of corporation tax competition.
2 H.M. Government (2010), p. 10.

CBT CorPorATE TAx rAnkinG 2012 PAGE 7
our main source of information on tax regimes and reforms for this analysis are the country tax reports of the international Bureau of Fiscal Documentation.
The report is structured as follows: Section 2 presents an update to 2012 of our rankings of the statutory rate and the two effective rates for the G20 countries. Section 3 extends this international comparison for 2012 to oECD countries. Section 4 examines corporation tax reforms in G20 and oECD countries, in 2011 and 2012, and also subsequent reforms that have already been announced. it provides an international comparison and ranking for 2015 based on measures that have already been announced. Section 5 considers whether the scale of these reforms represents a step-up in the rate of competition between countries. Finally, there are two Appendices, which set out the methodology in more detail and provide some more detailed estimates.

PAGE 8 CBT CorPorATE TAx rAnkinG 2012
2. 2012 RAnKInGS foR G20 CountRIeS We begin by presenting estimates of the main rate of corporation tax and of the two effective tax rates for each G20 country in 2012. This updates the rankings from our 2011 report.
our measure of the main rate of corporation tax is the highest statutory tax rate applied to corporate profit in each country, including average or typical local taxes and surcharge taxes where appropriate.
The measures of effective tax rates consider two different forms of investment decision. The first is a discrete choice, for example, a location choice such as whether a business should expand its activities in the Uk or in another country. We assume that the business would choose the location that would generate the higher post-tax profit, in present value terms. The relevant measure of tax for this decision is the proportion of the present value of pre-tax profit that would be taken in tax in either country. This is measured by an effective average tax rate (EATr).
The second measure considers the size of investment, conditional on the location choice. To evaluate this we consider the cost of capital: the rate of return that an investment project must earn if it is to break even, taking into account all receipts and expenditures. We would expect investment to be undertaken up to the point that the marginal gain from an additional investment is equal to the cost of capital. Corporation taxes typically increase the cost of capital. The effective marginal tax rate (EMTr) measures the proportionate increase in the cost of capital due to the tax.
A number of caveats must be acknowledged in using such measures, which were discussed in more detail in our 2011 report. Broadly, we take account only of the tax rate, capital allowances applied to three broad types of asset - plant and machinery, industrial buildings and intangibles – the treatment of inventories and interest deductibility. The measures should be regarded as an average across a number of different types of real investment. More details are provided in Appendix A. We do not take account of any taxes relating to cross-border flows. We therefore neglect the effects of the taxation of foreign source income, withholding taxes on flows of dividends, interest and royalties, as well as CFC regimes and other anti-avoidance restrictions. nevertheless, the measures that we use have been found in the academic literature to be significant in affecting a number of types of investment decisions (see, for example, the review and meta analysis of De Mooij and Ederveen, 2008).

CBT CorPorATE TAx rAnkinG 2012 PAGE 9
Table 1 presents each of these measures of taxation for each of the G20 countries in January 2012. Each column is ranked according to that measure.
Column 1 shows the ranking of the statutory corporate tax rates for G20 countries The Uk’s statutory tax rate was 26 percent, 2 percentage points lower than in January 2011. However, this reduction did not change the Uk’s ranking, which remained 7th. in fact, there was only one change in the G20 ranking of statutory tax rates between 2011 and 2012, with France and South Africa changing places. Despite this, there were some reforms to both rates and bases, which are discussed in more detail below and in section 4.
Column 2 shows the 2012 ranking of the EATrs for G20 countries. in January 2012, the Uk had an EATr of 24.8%, a reduction from 26.3% in January 2011. Again, though, this did not change the Uk’s ranking, which remained 9th. The Uk did move below Mexico, but a significant reduction in the EATr in italy due to the introduction of a new allowance for corporate equity moved italy from 11th to 6th in the ranking. The Uk would have moved ahead of Canada, but Canada also reduced its EATr between 2011 and 2012 to stay 8th in the ranking. Most of the other rankings for the EATr did not change. russia remained at the top of the ranking with an EATr of 16.7% and Japan remained at the bottom with an EATr of 36.0%.
Column 3 shows the position for the EMTrs. once again, the Uk’s rate was reduced between 2011 and 2012, in this case from 22.8% to 22.3%, but without any effect on the Uk’s ranking.
The italian tax reform had a marked effect on its EMTr, putting italy top of the EMTr ranking. The reason is that its new allowance for corporate equity gives relief for the opportunity cost of equity finance, mirroring the treatment of debt finance. if applied in its pure form to a marginal investment, this would mean that a marginal investment would not be taxed at all, and the EMTr would be zero.3 However, for technical reasons, we believe that the italian allowance is actually slightly more generous than this, with the result that the overall EMTr is negative, implying that a marginal investment would be subsidised by the italian tax.4
The lower ranking for the Uk in the effective tax rate column than in the statutory rate column reflects the fact that the Uk has low rates of capital allowance. Appendix B presents evidence of the generosity of allowances for the three types of capital investment considered here for each of the G20 and oECD countries. The Uk is ranked last out of all G20 and oECD countries in its treatment of industrial buildings.5 in fact the Uk was already ranked last in January 2011 when the rate of allowances on industrial buildings was 1%; since then it has fallen to zero. The position for the other assets is not as extreme, but is still poor – for example, the Uk still has a ranking of only 28th out of 41 amongst G20 and oECD countries in the generosity of its allowances for investment in plant and machinery.
3 This is a tax reform recently advocated by the iFS Mirrlees review, Mirrlees et al (2011), among others. 4 This is partly because the base for the allowance depends on retained earnings as measured by accounting procedures, rather
than the tax rules. offsetting this, in our calculations, the rate of relief is lower than the real risk-free rate of return, implying a higher EMTr. A final factor is that the combination of interest deductibility and italian capital allowances also make the EMTr for debt-financed investment negative.
5 Excluding Estonia, which does not have a conventional corporation tax.

PAGE 10 CBT CorPorATE TAx rAnkinG 2012
tabl
e 1
. R
anki
ngs
of t
he G
20
cou
ntri
es in
Jan
uary
20
12
.
Ran
king
Cou
ntry
Sta
tuto
ry t
ax r
ate
(%)
Ran
king
Cou
ntry
eAt
R (
%)
Ran
king
Cou
ntry
eAt
R (
%)
1r
ussi
a20
.01
rus
sia
16.7
1ita
ly-1
0.0
2Sa
udi A
rabi
a20
.02
Turk
ey16
.92
Sout
h k
orea
7.2
3Tu
rkey
20.0
3So
uth
kor
ea18
.03
rus
sia
7.9
4So
uth
kor
ea22
.04
Saud
i Ara
bia
18.1
4Tu
rkey
8.7
5C
hina
25.0
5C
hina
22.4
5Sa
udi A
rabi
a13
.4
6in
done
sia
25.0
6ita
ly23
.06
Can
ada
15.8
7u
nite
d K
ingd
om2
6.0
7in
done
sia
23.0
7C
hina
16.2
8C
anad
a28
.08
Can
ada
24.4
8M
exic
o17
.1
9A
ustr
alia
30.0
9u
nite
d K
ingd
om2
4.8
9Fr
ance
17.9
10M
exic
o30
.010
Mex
ico
26.1
10G
erm
any
18.2
11ita
ly30
.311
Aus
tral
ia26
.611
indo
nesi
a18
.5
12G
erm
any
30.9
12G
erm
any
27.0
12A
ustr
alia
19.1
13in
dia
32.4
13in
dia
28.8
13So
uth
Afr
ica
19.3
14B
razi
l34
.014
Fran
ce29
.814
indi
a21
.1
15So
uth
Afr
ica
34.6
15So
uth
Afr
ica
29.8
15u
nite
d K
ingd
om2
2.3
16Fr
ance
35.0
16B
razi
l30
.716
Uni
ted
Stat
es23
.2
17A
rgen
tina
35.0
17A
rgen
tina
32.3
17B
razi
l23
.9
18U
nite
d St
ates
40.5
18U
nite
d St
ates
34.9
18Ja
pan
27.0
19Ja
pan
40.8
19Ja
pan
36.0
19A
rgen
tina
27.0

CBT CorPorATE TAx rAnkinG 2012 PAGE 11
tabl
e 1
. R
anki
ngs
of t
he G
20
cou
ntri
es in
Jan
uary
20
12
.
Ran
king
Cou
ntry
Sta
tuto
ry t
ax r
ate
(%)
Ran
king
Cou
ntry
eAt
R (
%)
Ran
king
Cou
ntry
eAt
R (
%)
1r
ussi
a20
.01
rus
sia
16.7
1ita
ly-1
0.0
2Sa
udi A
rabi
a20
.02
Turk
ey16
.92
Sout
h k
orea
7.2
3Tu
rkey
20.0
3So
uth
kor
ea18
.03
rus
sia
7.9
4So
uth
kor
ea22
.04
Saud
i Ara
bia
18.1
4Tu
rkey
8.7
5C
hina
25.0
5C
hina
22.4
5Sa
udi A
rabi
a13
.4
6in
done
sia
25.0
6ita
ly23
.06
Can
ada
15.8
7u
nite
d K
ingd
om2
6.0
7in
done
sia
23.0
7C
hina
16.2
8C
anad
a28
.08
Can
ada
24.4
8M
exic
o17
.1
9A
ustr
alia
30.0
9u
nite
d K
ingd
om2
4.8
9Fr
ance
17.9
10M
exic
o30
.010
Mex
ico
26.1
10G
erm
any
18.2
11ita
ly30
.311
Aus
tral
ia26
.611
indo
nesi
a18
.5
12G
erm
any
30.9
12G
erm
any
27.0
12A
ustr
alia
19.1
13in
dia
32.4
13in
dia
28.8
13So
uth
Afr
ica
19.3
14B
razi
l34
.014
Fran
ce29
.814
indi
a21
.1
15So
uth
Afr
ica
34.6
15So
uth
Afr
ica
29.8
15u
nite
d K
ingd
om2
2.3
16Fr
ance
35.0
16B
razi
l30
.716
Uni
ted
Stat
es23
.2
17A
rgen
tina
35.0
17A
rgen
tina
32.3
17B
razi
l23
.9
18U
nite
d St
ates
40.5
18U
nite
d St
ates
34.9
18Ja
pan
27.0
19Ja
pan
40.8
19Ja
pan
36.0
19A
rgen
tina
27.0 3. 2012 RAnKInGS foR
oeCD CountRIeS The choice of G20 as a comparison group is somewhat arbitrary: one can question whether, for example, Turkey and Saudi Arabia are the most appropriate comparators for the Uk. To broaden the comparison we now consider the Uk in the context of the group of countries that are members of the organisation for Economic Co-operation and Development (oECD), which are listed in Table 2.
The oECD is an international economic organisation of 34 countries, founded in 1961, to stimulate economic progress and world trade. This provides a much broader group, which includes most European Union countries as well as Switzerland. These countries are arguably a more appropriate comparator group for the Uk since they include most of the world’s developed economies, with many located in Europe. The inclusion of fast growing Eastern European countries could also be important since these countries may be alternative locations for production. in 2007 oECD countries accounted for 25 of the largest 30 recipients of foreign direct investment.6
Many of the G20 countries analysed above are also members of the oECD, but some are not: Saudi Arabia, russia, indonesia, China, india, Brazil, South Africa and Argentina are not oECD members. in subsequent sections of the report we analyse the position for all countries that are members of the G20, the oECD or both, a total of 42 countries.
Table 2 provides rankings for statutory tax rate and corporate tax bases in the oECD countries.7 The measure of the statutory rate is the same as that used in the previous section. The measure of the tax base is the net present value of capital allowances permitted for an investment expressed as a percentage of the initial cost of the asset. For example, if an asset costing £100 was allowed a capital allowance of £25 in each of the four years following the investment, then the measure would be the present value of the four allowances of £25 expressed as a proportion of £100. We take the weighted average of this measure across the different types of capital assets considered in this report.
The first column of Table 2 shows the ranking of the statutory rate. of the 33 oECD countries analysed, the United kingdom is ranked 18th. This is a one place improvement over the equivalent 2011 ranking. This ranking appears much less favourable to the Uk as a location than the comparison with G20 countries. Amongst oECD countries, the Uk is in the bottom half of the ranking, trailing behind countries such as ireland, all of the Central European countries, Switzerland and the netherlands. More generally, oECD statutory tax rates range from 12.5% in ireland to 40.8% in Japan in 2012.
6 See international Financial Statistics (April 2012), Annual Series. 7 We exclude Estonia, which does not have a conventional corporation tax. instead, Estonia charges a distribution tax on distributed
profits, including transactions that are considered as hidden profit distributions. So the corporation tax rate is zero, and there are no capital allowances.

PAGE 12 CBT CorPorATE TAx rAnkinG 2012
The second column of Table 2 shows the ranking of the corporate tax base. The Uk is ranked 32nd among the oECD countries: only Chile has a broader tax base, with less generous allowances; Chile has no allowances for patents and very small allowances for plant and machinery. This is the only country in either the G20 or the oECD to have smaller allowances than the Uk.
Table 3 presents our estimates and rankings for the effective average and effective marginal tax rates for the oECD countries. As is the case for the G20 rankings, the Uk is ranked lower for both the EATr and the EMTr than for the statutory tax rate. For the EATr, the Uk is ranked 22nd among the 33 oECD countries, an improvement of 3 places from 2011. For the EMTr, the Uk is 31st in 2012, the same as 2011. Based on the latter measure especially, the Uk is one of the least competitive countries for corporation tax in the oECD.

CBT CorPorATE TAx rAnkinG 2012 PAGE 13
table 2. Ranking of statutory tax rates and statutory tax bases, oeCD countries, 2012.
Ranking CountryStatutory tax
rate (%)Country
Pv of capital allowances (% of cost)
1 ireland 12.5 Greece 79.3
2 Slovenia 18.0 Slovak republic 77.8
3 Poland 19.0 Belgium 75.8
4 Czech republic 19.0 Switzerland 73.9
5 Slovak republic 19.0 South korea 73.8
6 Chile 20.0 Spain 73.1
7 Turkey 20.0 Czech republic 73.1
8 Greece 20.0 France 73.0
9 iceland 20.0 Portugal 72.3
10 Hungary 21.0 israel 72.2
11 Switzerland 21.2 Luxembourg 70.8
12 South korea 22.0 Sweden 70.0
13 Finland 24.5 iceland 69.2
14 Austria 25.0 Finland 68.4
15 israel 25.0 Denmark 67.9
16 Denmark 25.0 Turkey 67.5
17 netherlands 25.0 italy 66.5
18 united Kingdom 26.0 Mexico 65.6
19 Sweden 26.3 Slovenia 65.0
20 norway 28.0 Australia 65.0
21 new Zealand 28.0 ireland 64.9
22 Canada 28.0 Canada 64.8
23 Luxembourg 28.8 Austria 62.5
24 Portugal 29.5 United States 62.0
25 Mexico 30.0 Germany 61.1
26 Australia 30.0 Hungary 60.4
27 italy 30.3 norway 60.4
28 Germany 30.9 Poland 59.0
29 Belgium 34.0 netherlands 58.3
30 France 35.0 Japan 56.7
31 Spain 35.3 new Zealand 55.5
32 United States 40.5 united Kingdom 46.5
33 Japan 40.8 Chile 41.4
note: We do not include Estonia in rankings of oECD countries as it does not have a conventional corporation tax.

PAGE 14 CBT CorPorATE TAx rAnkinG 2012
table 3. Ranking of effective tax rates, oeCD countries, 2012.
Ranking Country eAtR (%) Country eMtR (%)
1 ireland 11.1 italy -10.0
2 Slovenia 15.7 Greece 5.2
3 Slovak republic 15.9 Switzerland 7.1
4 Czech republic 16.1 South korea 7.2
5 Greece 16.1 ireland 7.3
6 Poland 16.7 Slovak republic 7.4
7 Turkey 16.9 netherlands 8.1
8 Switzerland 17.4 Czech republic 8.3
9 iceland 17.7 Turkey 8.7
10 South korea 18.0 Slovenia 9.7
11 Hungary 18.6 Poland 10.7
12 netherlands 19.1 Luxembourg 11.2
13 Chile 20.2 iceland 12.0
14 israel 21.3 israel 12.1
15 Austria 21.6 Hungary 12.5
16 Finland 22.0 Austria 13.1
17 Denmark 22.4 Belgium 13.5
18 italy 23.0 Portugal 14.9
19 Sweden 23.2 Canada 15.8
20 Luxembourg 23.8 Sweden 16.0
21 Canada 24.4 Finland 16.2
22 united Kingdom 24.8 Denmark 16.3
23 Portugal 25.2 Mexico 17.1
24 new Zealand 25.8 France 17.9
25 norway 25.9 Spain 18.2
26 Mexico 26.1 Germany 18.2
27 Australia 26.6 Australia 19.1
28 Germany 27.0 Chile 20.7
29 Belgium 28.1 new Zealand 21.0
30 France 29.8 norway 21.5
31 Spain 30.0 united Kingdom 22.3
32 United States 34.9 United States 23.2
33 Japan 36.0 Japan 27.0

CBT CorPorATE TAx rAnkinG 2012 PAGE 15
4. tAx RefoRMS: 2011 AnD BeyonD
in this section we discuss corporation tax reforms in G20 and oECD countries. We begin in Section 4.1 with reforms that took place over the last year, which helps compare the 2011 and 2012 rankings. Section 4.2 presents reforms planned for the years 2012-2015. in Section 4.3 we use these reforms to produce rankings of the statutory tax rate and the effective tax rates for 2015, based on existing regimes and already announced reforms, for a combined sample of G20 and oECD countries.
4.1 rEForMS in 2011 AnD 2012
As is well known, the Uk has significantly reformed its corporation tax recently, even leaving to one side changes to international aspects of the tax. The main tax rate was cut from 30% to 28% in April 2007. Further cuts brought the rate down to 26% in April 2011, and will gradually reduce the rate to 22% by April 2014. These rate cuts have partly been matched by base broadening. in particular, capital allowances for industrial buildings, which were permitted at 4% before April 2008, were reduced by 1 percentage point each year before finally being abolished in April 2011. Allowances on plant and machinery were also reduced from 25% to 20% in April 2008, and to 18% from April 2012.
But the Uk is far from the only country to have undertaken reforms of its corporation tax in the last year. reforms that took place between January 2011 and January 2012 are summarised briefly in Table 4.
A number of countries have reduced their corporation tax rates.
Canada has been gradually lowering its federal rates of corporation tax. The main federal rate was 21% until 2007. in 2007 Canada began a gradual reduction to 15% by 2012. The cut from 16.5% in 2011 to 15% in 2012 shown in Table 4 is the last stage of this reform. Finland announced a cut to its main corporation tax rate from 26 percent to 24.5 percent in 2012. in 2011 Greece enacted a tax law aimed at “Combatting tax evasion and organization of the tax audit authorities”. This included a cut to the main corporation tax rate from 24 percent to 20 percent in 2012.
new Zealand cut its corporation tax rate from 30% to 28% from 2011/2012, with the aim of making its tax system “fairer, more sustainable and more supporting of economic

PAGE 16 CBT CorPorATE TAx rAnkinG 2012
growth” and to “encourage companies to invest.”8 Slovenia cut its main rate of corporation tax from 20% in 2011 to 18% in 2012. Slovenia also proposed further cuts to 17% in 2013 and 16% in 2014. South korea cut its main rate of corporation tax from 22% to 20% in 2012. The changes in South korea were “aimed at facilitating sustainable growth and job creation, promoting fair competition, and improving fiscal conditions”.9
table 4. Summary of tax reforms, January 2011 to January 2012.
Country Reform
Canada Main (federal) corporation tax rate cut from 16.5% to 15%.
ChileAbandoned planned reduction of corporation tax rate in 2012; main
corporation tax rate increased from 18.5% back up to 20%.
Finland Main corporation tax rate cut from 26% to 24.5%.
FranceThe 3.3% tax surcharge on the tax liability was temporarily increased to
5%.
Greece Main corporation tax rate cut from 24% to 20%.
iceland Main corporation tax rate increased back up from 18% to 20%.
india The 7.5% surcharge on main rate of corporation tax cut to 5%.
israel
Abandoned planned gradual reduction of personal income tax rates
and corporate income tax rates from 2012 to 2016; main corporation
tax rate increased from 24% back up to 25%.
italyAllowance for Corporate Equity (ACE) and full deductibility of irAP
introduced.
new Zealand Main corporation tax rate cut from 30% to 28%.
Portugal2.5% surtax of tax liability increased to 3% (5% for taxable profits
exceeding EUr 10 million).
Slovenia Main corporation tax rate cut from 20% to 18%.
South korea Main corporation tax rate cut from 22 % to 20%.
United kingdomMain corporation tax rate cut from 28% to 26%; Capital allowances on
industrial buildings withdrawn.
However, in other countries, planned cuts to corporation tax rates have been reversed. Under temporary rules provided in 2010 to finance the reconstruction of property losses and damages caused by the earthquake and tsunami of February 2010, Chile increased its tax rate from 17% in 2010 to 20% in 2011. The rate had been set to come down to 18.5% in 2012 and to 17% in 2013. However, in May 2012, the government changed its mind, and held the main tax rate at 20% for 2012.
8 http://www.treasury.govt.nz/budget/2010/speech/b10-spch.pdf9 iBFD South korea country news

CBT CorPorATE TAx rAnkinG 2012 PAGE 17
Also, in iceland the tax rate was cut from 18% to 15% in 2009/10, before being raised to 18% in 2011 and 20% in 2012. israel planned a gradual reduction of corporate income tax rates in the years 2012-2016. it started with a reduction of its headline rate from 25% to 24% in 2011. However, the reduction has been abolished and the rate was increased back up to 25% in 2012.
Several countries have recently changed their surcharge taxes. in november 2011, as part of new measures to reduce the public deficit, France proposed a temporary increase in the surcharge on the gross corporation tax liability from 3.3% to 5%. This temporary measure is applicable until 30 December 2013, and applies only to companies with a turnover exceeding EUr 250 million. Portugal and Luxembourg also raised their surcharge taxes. Portugal raised its surtax from 1.5% to 2.5% in 2011 and then further up to 3% in 2012, with 5% for taxable profits exceeding EUr 10 million. Luxembourg raised its surcharge tax from 4% to 5% in 2011.
However, Spain abolished its corporation tax surcharge at the beginning of 2011. From January 2011, this surcharge is only compulsory for the companies that intend to be a member of the Chamber of Commerce. in 2012, india also lowered the surcharge applicable to the main corporation tax rate from 7.5% in 2011 to 5%. This followed a reduction in 2011 from 10%. The government has announced its intention to phase out the surcharge.10
Finally, in 2011, the new italian government introduced an Allowance for Corporate Equity (ACE), along the lines of that proposed in 1991 by the institute of Fiscal Studies and recently championed by the iFS Mirrlees Review (Mirrlees et al. 2011). This measure gives an allowance to equity-financed investment which is broadly equivalent to the deductibility of interest payments available for debt-financed investment. Although this applies only to new investment financed by new equity and retained earnings, it significantly reduces the costs of such new investment, which is reflected in the very low EMTr for italy in 2012. The revenue cost of this allowance should grow over time. in addition, from 2012 it will be possible to fully deduct from corporate income tax the italian regional income Tax on Productive Activities (irAP) paid on labour costs.
10 indiabudget.nic.in/ub2011-12/bs/bs.doc

PAGE 18 CBT CorPorATE TAx rAnkinG 2012
4.2 2012 AnD BEyonD
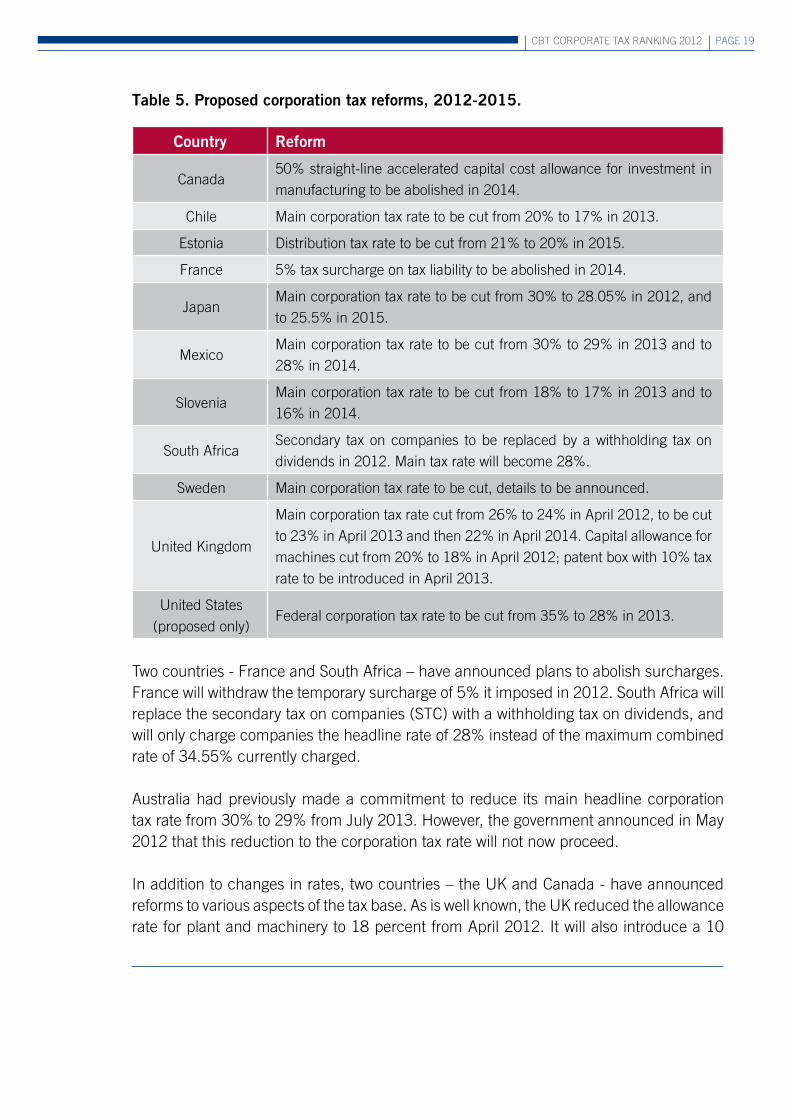
We now summarise reforms that have already been proposed for years 2012 - 2015. our main source of information is the iBFD Tax research Platform that publishes news regarding the announcements of corporate tax reforms around the world. We briefly describe the reforms in Table 5; we include a reform in the USA that has been proposed but not yet legislated.
out of 42 oECD and G20 countries, 11 have already proposed to reform their corporation taxes between 2012 and 2015. of course, more reforms are likely to be announced for this period in the future.
of these 11 counties, 7 have announced reductions in their main corporation tax rates: Chile, Estonia, Japan, Mexico, Slovenia, the Uk and the USA.
Chile originally announced plans to cut its corporation tax rate to 17%. However, following its earthquake and the reversal of the cut planned for 2012, this must now be considered to be uncertain. We nevertheless include this reform in our analysis since the government has not yet announced an abandonment of the plans. Japan has announced a cut in its main federal corporation tax rate from 30% to 25.5% in April 2012. However, due to the recent earthquake, Japan has also implemented a temporary surcharge of 10% on the new rate. This will result in a rate of 28.05% for fiscal years between 1 April 2012 and 31 March 2015.
Mexico will reduce its tax rate from 30% to 29% in 2013 and to 28% from 2014. Slovenia has announced a gradual reduction in its corporation tax rate from 20% to 16% by 2014.
The Uk will proceed with the reforms as amended in the 2012 March budget, which will gradually reduce the main corporation tax rate to 22% by 2015. The United States has also proposed a reduction in the federal corporation tax rate from 35% to 28%. However, it seems unlikely that such a major reform will be implemented before the 2012 presidential elections. While we include this tax reform in Table 5, we do not include it in the subsequent analysis.
in addition, Sweden has announced it will reduce the corporate tax rate, but details will only be announced in the autumn of 2012. Estonia has announced plans to cut its distribution tax, levied on the gross amount of the profit distribution, from 21% to 20% from 2015.
CBT CorPorATE TAx rAnkinG 2012 PAGE 19
table 5. Proposed corporation tax reforms, 2012-2015.
Country Reform
Canada50% straight-line accelerated capital cost allowance for investment in
manufacturing to be abolished in 2014.
Chile Main corporation tax rate to be cut from 20% to 17% in 2013.
Estonia Distribution tax rate to be cut from 21% to 20% in 2015.
France 5% tax surcharge on tax liability to be abolished in 2014.
JapanMain corporation tax rate to be cut from 30% to 28.05% in 2012, and
to 25.5% in 2015.
MexicoMain corporation tax rate to be cut from 30% to 29% in 2013 and to
28% in 2014.
SloveniaMain corporation tax rate to be cut from 18% to 17% in 2013 and to
16% in 2014.
South AfricaSecondary tax on companies to be replaced by a withholding tax on
dividends in 2012. Main tax rate will become 28%.
Sweden Main corporation tax rate to be cut, details to be announced.
United kingdom
Main corporation tax rate cut from 26% to 24% in April 2012, to be cut
to 23% in April 2013 and then 22% in April 2014. Capital allowance for
machines cut from 20% to 18% in April 2012; patent box with 10% tax
rate to be introduced in April 2013.
United States
(proposed only)Federal corporation tax rate to be cut from 35% to 28% in 2013.
Two countries - France and South Africa – have announced plans to abolish surcharges. France will withdraw the temporary surcharge of 5% it imposed in 2012. South Africa will replace the secondary tax on companies (STC) with a withholding tax on dividends, and will only charge companies the headline rate of 28% instead of the maximum combined rate of 34.55% currently charged.
Australia had previously made a commitment to reduce its main headline corporation tax rate from 30% to 29% from July 2013. However, the government announced in May 2012 that this reduction to the corporation tax rate will not now proceed.
in addition to changes in rates, two countries – the Uk and Canada - have announced reforms to various aspects of the tax base. As is well known, the Uk reduced the allowance rate for plant and machinery to 18 percent from April 2012. it will also introduce a 10
PAGE 20 CBT CorPorATE TAx rAnkinG 2012
percent rate of tax for income from patents (so called “patent box”). Canada is planning to withdraw the 50% straight-line accelerated capital allowance rate for investment in machinery and equipment that was in place between 2007 and 2012. it will revert back to the old rate of 30% on a declining-balance basis.
4.3 2015 rAnkinGS
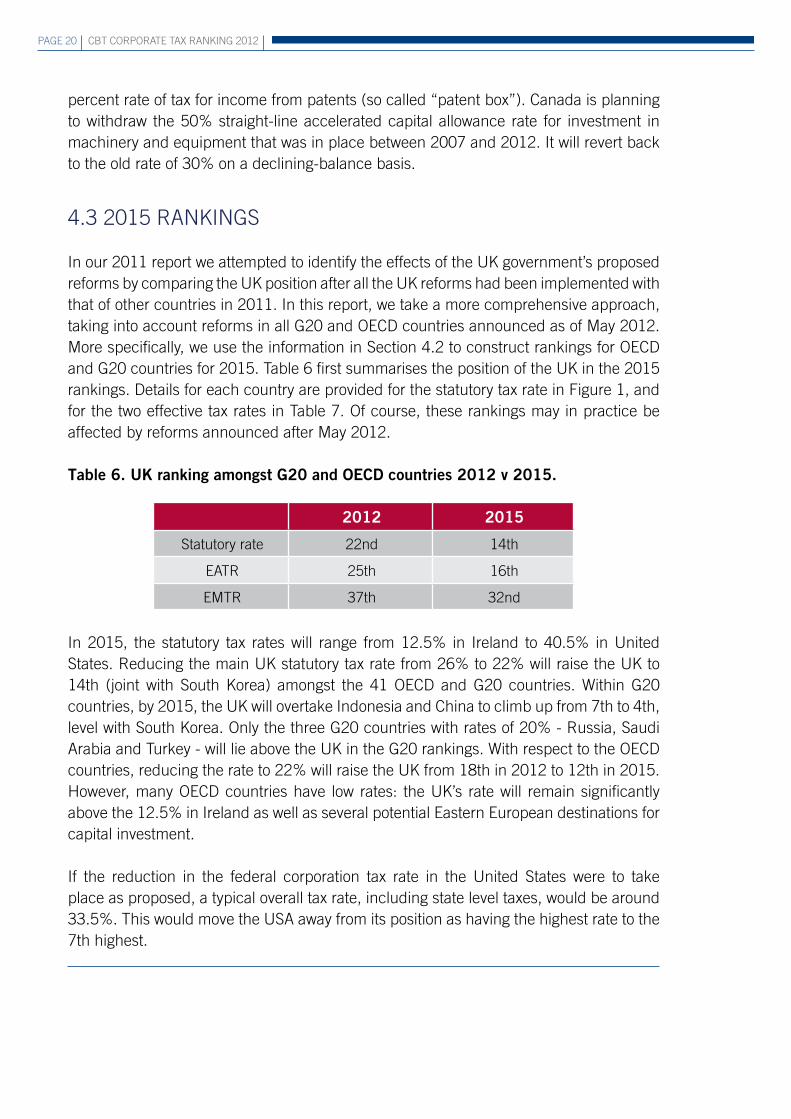
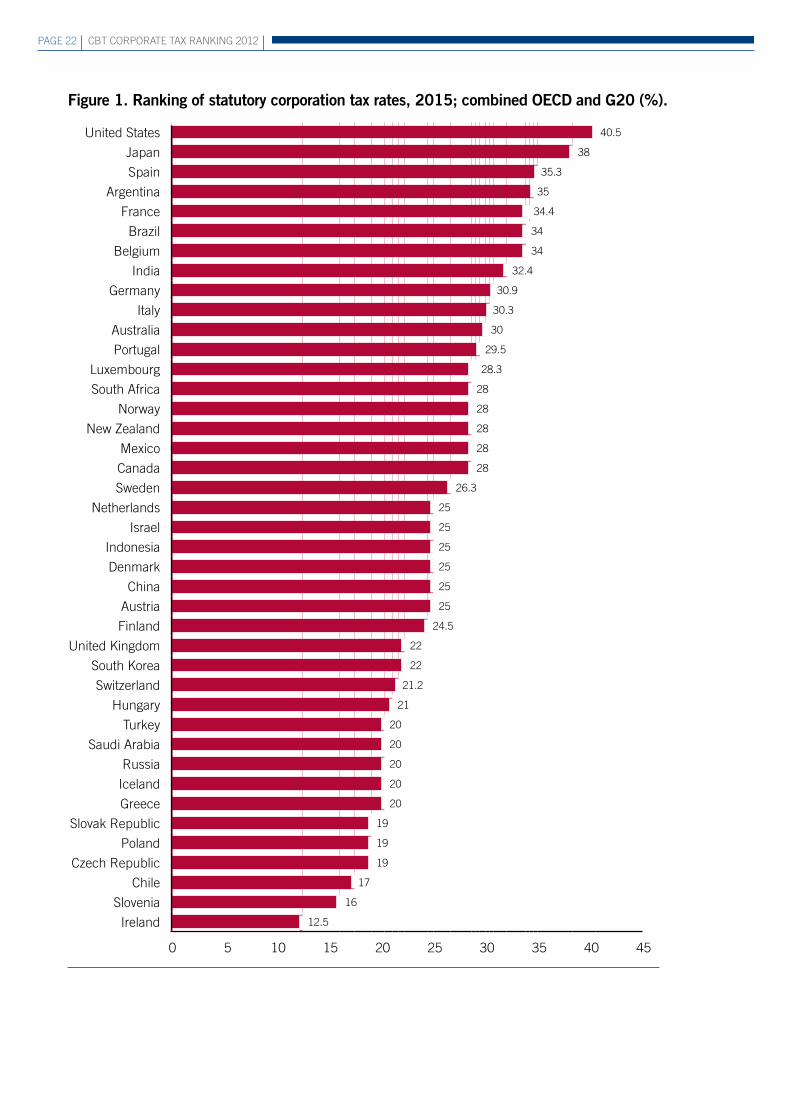
in our 2011 report we attempted to identify the effects of the Uk government’s proposed reforms by comparing the Uk position after all the Uk reforms had been implemented with that of other countries in 2011. in this report, we take a more comprehensive approach, taking into account reforms in all G20 and oECD countries announced as of May 2012. More specifically, we use the information in Section 4.2 to construct rankings for oECD and G20 countries for 2015. Table 6 first summarises the position of the Uk in the 2015 rankings. Details for each country are provided for the statutory tax rate in Figure 1, and for the two effective tax rates in Table 7. of course, these rankings may in practice be affected by reforms announced after May 2012.
table 6. uK ranking amongst G20 and oeCD countries 2012 v 2015.
2012 2015
Statutory rate 22nd 14th
EATr 25th 16th
EMTr 37th 32nd
in 2015, the statutory tax rates will range from 12.5% in ireland to 40.5% in United States. reducing the main Uk statutory tax rate from 26% to 22% will raise the Uk to 14th (joint with South korea) amongst the 41 oECD and G20 countries. Within G20 countries, by 2015, the Uk will overtake indonesia and China to climb up from 7th to 4th, level with South korea. only the three G20 countries with rates of 20% - russia, Saudi Arabia and Turkey - will lie above the Uk in the G20 rankings. With respect to the oECD countries, reducing the rate to 22% will raise the Uk from 18th in 2012 to 12th in 2015. However, many oECD countries have low rates: the Uk’s rate will remain significantly above the 12.5% in ireland as well as several potential Eastern European destinations for capital investment.
if the reduction in the federal corporation tax rate in the United States were to take place as proposed, a typical overall tax rate, including state level taxes, would be around 33.5%. This would move the USA away from its position as having the highest rate to the 7th highest.

CBT CorPorATE TAx rAnkinG 2012 PAGE 21
The EATr for Uk will decrease from 24.8% in 2012 to 20.3% in 2015. This will raise the Uk to 16th. There is a smaller improvement in the Uk’s ranking amongst G20 countries, of 3 places from 8th to 5th.
in 2015, the Uk’s EMTr will be 18.9%, lower than its 2012 level of 22.3%. This would only raise the Uk’s ranking to 32nd, which is still very low. This reduction would improve the Uk’s ranking amongst G20 countries by only one place from 15th to 14th. Amongst oECD countries, the Uk would move up to 29th – still an extremely low ranking.
if the USA reduced its federal tax rate as proposed this would also significantly affect its effective tax rates. The EATr would be reduced to 28.8 percent and the EMTr to 18.2 percent. This would raise the US rankings to 35th for the EATr and 31st for the EMTr. Provided no tax base reforms occur, this would bring the US EMTr below that of the Uk, in spite of the Uk’s much lower statutory rate.
PAGE 22 CBT CorPorATE TAx rAnkinG 2012
figure 1. Ranking of statutory corporation tax rates, 2015; combined oeCD and G20 (%).
0 5 10 15 20 25 30 35 40 45
United States 40.5
Japan 38
Spain 35.3
Argentina 35
France 34.4
Brazil 34
Belgium 34
india 32.4
Germany 30.9
italy 30.3
Australia 30
Portugal 29.5
Luxembourg 28.3
South Africa 28
norway 28
new Zealand 28
Mexico 28
Canada 28
Sweden 26.3
netherlands 25
israel 25
indonesia 25
Denmark 25
China 25
Austria 25
Finland 24.5
United kingdom 22
South korea 22
Switzerland 21.2
Hungary 21
Turkey 20
Saudi Arabia 20
russia 20
iceland 20
Greece 20
Slovak republic 19
Poland 19
Czech republic 19
Chile 17
Slovenia 16
ireland 12.5

CBT CorPorATE TAx rAnkinG 2012 PAGE 23
table 7. Ranking of effective tax rates, oeCD and G20 countries, 2015.
Ranking Country eAtR (%) Ranking Country eMtR (%)1 ireland 11.1 1 italy -10.0
2 Slovenia 14.0 2 Greece 5.2
3 Slovak republic 15.9 3 Switzerland 7.1
4 Czech republic 16.1 4 South korea 7.2
5 Greece 16.1 5 ireland 7.3
6 Poland 16.7 6 Slovak republic 7.4
7 russia 16.7 7 russia 7.9
8 Turkey 16.9 8 netherlands 8.1
9 Chile 17.2 9 Czech republic 8.3
10 Switzerland 17.4 10 Slovenia 8.5
11 iceland 17.7 11 Turkey 8.7
12 South korea 18.0 12 Poland 10.7
13 Saudi Arabia 18.1 13 Luxembourg 11.2
14 Hungary 18.6 14 iceland 12.0
15 netherlands 19.1 15 israel 12.1
16 united Kingdom 20.3 16 Hungary 12.5
17 israel 21.3 17 Austria 13.1
18 Austria 21.6 18 Saudi Arabia 13.4
19 Finland 22.0 19 Belgium 13.5
20 China 22.4 20 South Africa 14.8
21 Denmark 22.4 21 Portugal 14.9
22 italy 23.0 22 Mexico 15.7
23 indonesia 23.0 23 Sweden 16.0
24 Sweden 23.2 24 Finland 16.2
25 Luxembourg 23.8 25 China 16.2
26 South Africa 24.1 26 Denmark 16.3
27 Mexico 24.4 27 France 17.5
28 Portugal 25.2 28 Chile 17.6
29 Canada 25.4 29 Spain 18.2
30 new Zealand 25.8 30 Germany 18.2
31 norway 25.9 31 indonesia 18.5
32 Australia 26.6 32 united Kingdom 18.933 Germany 27.0 33 Australia 19.1
34 Belgium 28.1 34 Canada 19.7
35 india 28.8 35 new Zealand 21.0
36 France 29.3 36 india 21.1
37 Spain 30.0 37 norway 21.5
38 Brazil 30.7 38 United States 23.2
39 Argentina 32.3 39 Brazil 23.9
40 Japan 33.6 40 Japan 24.7
41 United States 34.9 41 Argentina 27.0

PAGE 24 CBT CorPorATE TAx rAnkinG 2012
5. A new wAve of CoMPetItIon?
The reforms summarised above in Tables 4 and 5 indicate that there is an appetite amongst G20 and oECD governments to consider reforms of their corporation taxes. Most of the reforms have been in the direction of reducing statutory and effective tax rates, consistent with governments attempting to promote investment and growth despite fiscal deficits. of course, statutory and effective corporation tax rates have been falling for several decades. This is typically interpreted as the outcome of a process of competition between governments to attract inward investment; there is a large theoretical and empirical literature investigating this phenomenon. in the light of the recent reforms, an interesting question that arises is whether the response of governments to the financial and economic crisis will trigger a new wave of tax competition. We now address this question.
We begin in Figure 2 by documenting what has happened to statutory rates in the G20 and oECD over the last thirty years for a subset of 28 countries for which we have data back to 1983. The unbroken line represents an average of these 28 countries.11 As is well known, rates have fallen substantially over this period – the average has fallen from nearly 50% to below 30%. Moreover the decline in the average rate to 2012 has been fairly continuous.
Figure 2 also shows a measure of the variation in rates across countries. Each dotted line is one standard deviation away from the average; this summarises the distribution across countries in each year. As is clear from the Figure, the standard deviation has also been declining, indicating that rates have been converging as well as falling.
Both the reduction and the convergence of rates are consistent with a sustained process of tax competition over three decades. We would like to address the question of whether this process has intensified following the financial and economic crisis.
We begin in Table 8 by summarising the number of statutory tax rate reductions that have occurred in the past and that have recently been announced. We use 5-year time periods to smooth for random changes between years. We examine the number of rate cuts as well as the number for each particular group – oECD, G20 and G7. The periods with the highest number of rate cuts have been since 2000: there were 50 cuts between 2000 and 2004 and 59 between 2005 and 2009. The total number of tax cuts already announced for 2010 – 2015 is well short of these numbers, at 33, though this already
11 We have data for the full sample of 42 countries from 1996; the trend looks very similar for the larger group.

CBT CorPorATE TAx rAnkinG 2012 PAGE 25
matches the second half of the 1990s and exceeds the second half of the 1980s. in any case, this comparison should clearly be interpreted with caution since there is plenty of time for further cuts to be announced before the end of this period.
figure 2. Corporate tax rates, 28 G20 and oeCD countries, 1983 - 2015.
note: The unbroken line is the mean tax rate over the 28 countries. Each dotted line represents one standard deviation away from the mean.
table 8. number of tax rate cuts, 5-year periods.
no. of tax cuts G20+oeCD
no. of tax cuts oeCD
no. of tax cuts G20
no. of tax cuts G7
1985-1989 26 25 14 11
1990-1994 48 44 22 13
1995-1999 33 28 16 8
2000-2004 50 43 25 13
2005-2009 59 52 21 7
2010-2015 33 29 17 10
0.6
0.55
0.5
0.45
0.4
0.35
0.3
0.25
0.2
0.15
1983
1984
1985
1986
1987
1988
1989
1990
1991
1992
1993
1994
1995
1996
1997
1998
1999
2000
2001
2002
2003
2004
2005
2006
2007
2008
2009
2010
2011
2012
2013
2014
2015

PAGE 26 CBT CorPorATE TAx rAnkinG 2012
The situation varies between groups of countries. For oECD countries, the number of cuts that have occurred and that have been announced between 2010 and 2015 is relatively small relative to recent history. However, the number appears more significant for the G20, and still more so for G7 countries. For G7 countries the number of tax cuts enacted and proposed for 2010 – 2015 is already larger than the number of cuts that occurred in 2005 – 2009.
Figure 3 presents the number of cuts in each year separately, for both oECD countries and G20 countries. There is clearly a great deal of variation between individual years. The number of cuts was high in 2008 for both oECD and G20 countries, but declined as the financial crisis developed. A very low number of rate cuts was recorded in 2011. However, in 2012 the number rebounded with 8 rate cuts in oECD countries and 5 in G20 countries. relatively high numbers of rate cuts have also already been announced for G20 countries for 2013 and 2014.
figure 3. number of corporate tax rate cuts: 1983 - 2015.
no. of tax cuts G20no. of tax cuts oECD
16
14
12
10
8
6
4
2
0
1984
1985
1986
1987
1988
1989
1990
1991
1992
1993
1994
1995
1996
1997
1998
1999
2000
2001
2002
2003
2004
2005
2006
2007
2008
2009
2010
2011
2012
2013
2014
2015
To investigate this further, we examine the size of tax cuts. Figure 4 shows the average size of corporation tax cuts in each year, measured in percentage points (i.e. a reduction from, say 25% to 20%, would be a 5 percentage point reduction). Figure 5 presents the cuts in percentage terms (so a cut from 25% to 20% would be a 20 percent reduction). These figures combine oECD and G20 countries.

CBT CorPorATE TAx rAnkinG 2012 PAGE 27
figure 4. Size of corporate tax rate cuts 1984 - 2015: percentage points.
2.5%
2.0%
1.5%
1.0%
0.5%
0.0%
-0.5%
-1.0%
1984
1985
1986
1987
1988
1989
1990
1991
1992
1993
1994
1995
1996
1997
1998
1999
2000
2001
2002
2003
2004
2005
2006
2007
2008
2009
2010
2011
2012
2013
2014
2015
figure 5. Average size of corporate tax rate cuts: 1984 - 2015: percentages.
5
4
3
2
1
0
-1
-2
1984
1985
1986
1987
1988
1989
1990
1991
1992
1993
1994
1995
1996
1997
1998
1999
2000
2001
2002
2003
2004
2005
2006
2007
2008
2009
2010
2012
2013
2014
2015
PAGE 28 CBT CorPorATE TAx rAnkinG 2012
The size of tax rate cuts in recent years does not appear to be large by the standards of the previous three decades. Perhaps not surprisingly, the largest cuts in percentage point terms were in the late 1980s and early 1990s, when tax rates tended to be much higher. But Figure 4 does not give any indication of significant cuts for 2011, 2012 and later. The cuts that have been announced for these years appear larger in percentage terms since tax rates are already lower than in earlier years. However, even in Figure 5, there is no indication that there is a new wave of particularly intense competition across all G20 and oECD countries.
in Table 9, we revert to considering 5-year windows, as in Table 8. We define a 5-year tax cut as the difference between tax rate in year t and year t-5. Thus for 2015 the tax cut will be the difference between the rate in 2010 and in 2015. Table 9 presents results from 5 year non-overlapping windows. it also considers separately the different groups of countries, and presents results in both percentage point, and percentage terms.
Clearly, as indicated in Figures 4 and 5, the overall corporation tax rate cuts already announced for 2010-2015 are not very large relative to earlier periods. However, the G7 is an exception, with G7 countries proposing to cut their corporation tax rates much more extensively than other countries. in percentage terms, the proposed cuts in the G7 countries for 2005-10 are quite significant, especially since further cuts could yet be announced.
Most of the countries that proposed to reform their tax systems between now and 2015 have statutory tax rates higher than Uk. Japan - the country with the highest statutory tax rate in 2012 - will have the highest rate in 2015 as well, in spite of the proposed reforms. These developments may suggest that, so far at least, it has tended to be the countries with the highest tax rates that have focused on rate cuts.

CBT CorPorATE TAx rAnkinG 2012 PAGE 29
table 9. Size of tax rate cuts: percentage points and percentages, 5-year periods.
year oeCD and G20 oeCD G20 G7
percentage points
1985-1990 5.0 5.0 5.5 6.4
1990-1995 4.4 5.2 0.4 -0.03
1995-2000 3.1 3.1 3.3 5.8
2000-2005 3.5 3.6 3.0 1.9
2005-2010 2.9 2.6 3.6 3.2
2010-2015 0.7 0.7 1.3 1.8
percentages
1985-1990 9.7 9.2 12.3 12.7
1990-1995 7.7 9.9 -1.2 -0.03
1995-2000 6.9 6.9 6.3 11.1
2000-2005 9.8 10.1 7.9 4.6
2005-2010 9.2 8.2 11.3 8.6
2010-2015 2.3 2.2 4.1 5.9

PAGE 30 CBT CorPorATE TAx rAnkinG 2012
APPenDIx A: MethoDoloGyThe methodology used in this report is that proposed by Devereux and Griffith (1998). it has been widely used in the academic literature as well as by the European Commission and the oECD.
The approach is to consider the implications for corporate taxation of an increase in the capital stock and inventories of a business financed by a proportionate increase in each source of finance. Thus, each asset is increased in proportion to its existing weight in the capital stock, and the increase is financed by debt in proportion to the existing use of debt. in this report, we analyse two tangible fixed assets, plant and machinery and buildings, intangible assets and inventories. We use data from the annual reports of just under 300,000 European companies from the orBiS database to identify appropriate weights for each asset. Details of this procedure are described in Devereux and Loretz (2008). The weights used are based on the average size of each asset in these companies, and the average use of debt. The resulting weights are as follows.
Plant and Machinery 25.6%Buildings 24.0%intangible assets 8.7%inventories 41.7%
Proportion financed by debt 35.0%
To calculate the effective average tax rate (EATr), we identify the cash flows associated with a one-period investment in a composite of the four assets, financed by debt and equity12, where we assume a given rate of return on the composite investment. Applying the tax allowances and rates described below allows us to calculate the pre-tax and post-tax net present value of the investment in each country. Devereux and Griffith (1998) define a measure of the EATr to be the difference between the two scaled by the present value of the income stream. This measure has the property that it is equal to the EMTr (defined below) for an investment that just breaks even, but tends towards the statutory tax rate as the rate of profit increases.
To calculate the effective marginal tax rate (EMTr) we analyse the same investment. However, instead of fixing a rate of profit and calculating the net present value, we instead identify the rate of profit that would be required for the investment to break even in the
12 We do not analyse personal taxes, and so the treatment of retained earnings and new equity issues is the same.

CBT CorPorATE TAx rAnkinG 2012 PAGE 31
presence and absence of tax - that is the cost of capital. in the absence of taxation, the cost of capital is the sum of the required financial rate of return (or discount rate) and the depreciation rate of the composite asset. The cost of capital is typically raised by introducing tax. We define the EMTr to be the change in the cost of capital arising from introducing the tax, expressed as a proportion of the cost of capital in the absence of tax.
This procedure requires values of several parameters. We fix these to be the same across all countries, so that differences in effective tax rates depend only on differences in tax regimes. The values chosen here are similar to those used elsewhere in the literature, notably by the European Commission;13 this makes our estimates comparable with those used elsewhere. The values are as follows.
Economic deprecation rate (declining balance rate)
Plant and Machinery 17.5%
Buildings 3.1%
intangible assets 15.35%
inflation rate 2.5%
real discount rate 5%
Pre-tax rate of return (for EATr only) 20%
information on statutory tax regimes was collected primarily from country tax reports of the international Bureau of Fiscal Documentation. This was supplemented from other sources, in particular Devereux et al (2010) and various issues of the Ernst and young Worldwide Corporate Tax Guide. As far as possible we identify the tax regime in place on 1st January of each year.
We use data on the main rate of corporation tax at national and sub-national levels, including information on whether one is deductible in calculating the other. We use information on capital allowance rates for the different assets.
To make comparisons as fair as possible between countries, we attempt to identify the tax treatment in each country of three specific assets: an item of plant and machinery deemed to have a useful life of 7 years; an industrial building deemed to have a useful life of 25 years; and the purchase of a patent deemed to have a useful life of 10 years. This is again the same approach as used in studies for the European Commission.14 Definitions of acceptable allowances vary considerably between countries. in some cases there is a clear acceptable rate – in January 2011, for example, the Uk permitted a 20% declining balance rate of plant and machinery, a 1 percent straight line rate of industrial buildings and a 25 percent declining balance rate for the purchase of a patent. However, many
13 See Devereux et al (2010). 14 See Devereux et al (2010).
PAGE 32 CBT CorPorATE TAx rAnkinG 2012
countries offer more elaborate schedules, and some rely on the notion of the useful life of the asset for tax purposes: hence the need to define this for the assets we model.
Finally, we also record the acceptable valuation of inventories in each country. The Uk tax system, for example, uses the FiFo method which implies that increases in the price of inventories between periods are subject to tax.
in all cases where there is some choice within the tax regime, we assume that the company would use the most tax advantageous approach.
We do not record the entire dataset of tax rates and allowances here. These data are available on the CBT website at www.sbs.ox.ac.uk/centres/tax/Pages/reports.asp.
CBT CorPorATE TAx rAnkinG 2012 PAGE 33
AP
Pe
nD
Ix B
: R
anki
ng o
f ca
pita
l allo
wan
ces
for
inve
stm
ent
in e
ach
fixed
ass
et,
20
12
.
Ran
king
Cou
ntry
Cap
ital
allo
wan
ces
plan
t an
d m
achi
nery
(%
)R
anki
ngC
ount
ryC
apit
al a
llow
ance
s in
dust
rial
bui
ldin
gs
(%)
Ran
king
Cou
ntry
Cap
ital
allo
wan
ces
inta
ngib
les
(%)
1n
ethe
rland
s96
.51
Gre
ece
67.9
1ita
ly96
.5
2C
anad
a96
.52
Bel
gium
65.0
2Sw
itzer
land
90.4
3G
reec
e92
.13
Slov
ak r
epub
lic64
.93
Bel
gium
86.8
4So
uth
kor
ea92
.14
indi
a61
.14
Slov
ak r
epub
lic86
.8
5So
uth
Afr
ica
91.9
5Sp
ain
55.1
5Lu
xem
bour
g86
.8
6P
ortu
gal
88.7
6Sw
itzer
land
55.1
6P
olan
d86
.8
7Tu
rkey
87.8
7So
uth
Afr
ica
54.3
7Fr
ance
86.8
8U
nite
d St
ates
87.3
8in
done
sia
54.3
8H
unga
ry86
.8
9C
zech
rep
ublic
87.2
9M
exic
o54
.39
Ger
man
y86
.8
10Lu
xem
bour
g87
.110
Chi
na54
.310
Swed
en85
.8
11Sl
oven
ia86
.811
Por
tuga
l54
.311
Cze
ch r
epub
lic84
.0
12is
rael
86.8
12So
uth
kor
ea54
.312
Spai
n83
.3
13Sl
ovak
rep
ublic
86.8
13is
rael
54.3
13in
dia
82.5
14Sp
ain
86.5
14Fr
ance
54.3
14u
nite
d K
ingd
om8
2.5
15r
ussi
a86
.215
Cze
ch r
epub
lic54
.215
Den
mar
k81
.1
16ic
elan
d85
.816
rus
sia
52.7
16ic
elan
d80
.6
17Sw
eden
85.8
17Fi
nlan
d51
.517
Japa
n78
.4
18Sw
itzer
land
85.8
18A
ustr
alia
47.5
18is
rael
78.4
19Fr
ance
85.8
19Tu
rkey
47.5
19n
ethe
rland
s73
.5
PAGE 34 CBT CorPorATE TAx rAnkinG 2012
Ran
king
Cou
ntry
Cap
ital
allo
wan
ces
plan
t an
d m
achi
nery
(%
)R
anki
ngC
ount
ryC
apit
al a
llow
ance
s in
dust
rial
bui
ldin
gs
(%)
Ran
king
Cou
ntry
Cap
ital
allo
wan
ces
inta
ngib
les
(%)
20A
ustr
alia
85.0
20B
razi
l47
.520
Finl
and
73.5
21Fi
nlan
d82
.521
irel
and
47.5
21B
razi
l73
.5
22D
enm
ark
82.5
22D
enm
ark
47.5
22Sl
oven
ia73
.5
23H
unga
ry82
.323
Swed
en47
.523
Aus
tria
73.5
24B
elgi
um82
.224
Luxe
mbo
urg
47.5
24ir
elan
d73
.5
25A
ustr
ia81
.125
icel
and
47.4
25So
uth
kor
ea73
.5
26Sa
udi A
rabi
a79
.526
italy
45.8
26n
ew Z
eala
nd73
.5
27ir
elan
d78
.427
Saud
i Ara
bia
41.1
27C
hina
73.5
28u
nite
d K
ingd
om7
7.9
28Sl
oven
ia38
.728
Mex
ico
73.5
29n
orw
ay77
.929
Aus
tria
38.7
29P
ortu
gal
73.5
30Ja
pan
76.7
30G
erm
any
38.7
30G
reec
e73
.5
31ita
ly75
.731
nor
way
37.0
31n
orw
ay73
.5
32B
razi
l73
.532
Can
ada
35.7
32A
rgen
tina
73.5
33M
exic
o73
.533
Uni
ted
Stat
es34
.633
rus
sia
73.5
34C
hina
73.5
34C
hile
33.4
34in
done
sia
66.8
35A
rgen
tina
73.5
35n
ethe
rland
s33
.435
Uni
ted
Stat
es62
.9
36P
olan
d73
.536
Pol
and
33.4
36Tu
rkey
62.8
37G
erm
any
73.5
37n
ew Z
eala
nd30
.437
Saud
i Ara
bia
58.9
38n
ew Z
eala
nd72
.938
Arg
entin
a27
.538
Sout
h A
fric
a54
.3
39in
dia
71.4
39Ja
pan
27.5
39A
ustr
alia
54.3
40in
done
sia
66.8
40H
unga
ry27
.540
Can
ada
51.5
41C
hile
62.8
41u
nite
d K
ingd
om0
.041
Chi
le0.
0

CBT CorPorATE TAx rAnkinG 2012 PAGE 35
Ran
king
Cou
ntry
Cap
ital
allo
wan
ces
plan
t an
d m
achi
nery
(%
)R
anki
ngC
ount
ryC
apit
al a
llow
ance
s in
dust
rial
bui
ldin
gs
(%)
Ran
king
Cou
ntry
Cap
ital
allo
wan
ces
inta
ngib
les
(%)
20A
ustr
alia
85.0
20B
razi
l47
.520
Finl
and
73.5
21Fi
nlan
d82
.521
irel
and
47.5
21B
razi
l73
.5
22D
enm
ark
82.5
22D
enm
ark
47.5
22Sl
oven
ia73
.5
23H
unga
ry82
.323
Swed
en47
.523
Aus
tria
73.5
24B
elgi
um82
.224
Luxe
mbo
urg
47.5
24ir
elan
d73
.5
25A
ustr
ia81
.125
icel
and
47.4
25So
uth
kor
ea73
.5
26Sa
udi A
rabi
a79
.526
italy
45.8
26n
ew Z
eala
nd73
.5
27ir
elan
d78
.427
Saud
i Ara
bia
41.1
27C
hina
73.5
28u
nite
d K
ingd
om7
7.9
28Sl
oven
ia38
.728
Mex
ico
73.5
29n
orw
ay77
.929
Aus
tria
38.7
29P
ortu
gal
73.5
30Ja
pan
76.7
30G
erm
any
38.7
30G
reec
e73
.5
31ita
ly75
.731
nor
way
37.0
31n
orw
ay73
.5
32B
razi
l73
.532
Can
ada
35.7
32A
rgen
tina
73.5
33M
exic
o73
.533
Uni
ted
Stat
es34
.633
rus
sia
73.5
34C
hina
73.5
34C
hile
33.4
34in
done
sia
66.8
35A
rgen
tina
73.5
35n
ethe
rland
s33
.435
Uni
ted
Stat
es62
.9
36P
olan
d73
.536
Pol
and
33.4
36Tu
rkey
62.8
37G
erm
any
73.5
37n
ew Z
eala
nd30
.437
Saud
i Ara
bia
58.9
38n
ew Z
eala
nd72
.938
Arg
entin
a27
.538
Sout
h A
fric
a54
.3
39in
dia
71.4
39Ja
pan
27.5
39A
ustr
alia
54.3
40in
done
sia
66.8
40H
unga
ry27
.540
Can
ada
51.5
41C
hile
62.8
41u
nite
d K
ingd
om0
.041
Chi
le0.
0
RefeRenCeSDe Mooij, Ruud and Sjef ederveen (2008) “Corporate tax elasticities: a reader’s guide to empirical findings”, Oxford Review of Economic Policy 24.4, 680-697.
Devereux Michael P., Christina elschner, Dieter endres and Christoph Spengel (2010) “Effective Tax Levels Using The Devereux/Griffith Methodology: Project for the EU Commission TAxUD/2008/CC/099”, Brussels: European Commission. Available at: http://ec.europa.eu/taxation_customs/resources/documents/common/publications/studies/etr_company_tax.pdf.
Devereux Michael P. and Rachel Griffith (1998) “The taxation of discrete investment choices,” iFS Working Papers W98/16, institute for Fiscal Studies.
Devereux, Michael P. and Rachel Griffith (2003) “Evaluating Tax Policy for Location Decisions”, International Tax and Public Finance 10.2, 107-26.
Devereux Michael P. and Simon loretz (2008) “increased efficiency through consolidation and formula apportionment in the European Union?”, Working Paper 08/12, oxford University Centre for Business Taxation.
ernst & young worldwide (various years) Corporate Tax Guide, London: Ernst & young.
hM Government (2010) “The Coalition: our Programme for Government”, London: Cabinet office.
International Bureau for fiscal Documentation (various years) “Global corporate tax handbook” and “European tax handbook”, Amsterdam: iBFD.
International financial Statistics (April 2012), Annual Series
Mirrlees, James, Stuart Adam, timothy Besley, Richard Blundell, Stephen Bond, Robert Chote, Malcolm Gammie, Paul Johnson, Gareth Myles, and James Poterba (2011) Tax by Design: The Mirrlees review, oxford: oxford University Press.
PAGE 38 CBT CorPorATE TAx rAnkinG 2012
oxfoRD unIveRSItyCentRe foR BuSIneSS tAxAtIon
Saïd Business SchoolPark End Streetoxford ox1 1HPUnited kingdomwww.sbs.ox.ac.uk/tax