ccfra technology ltd - seafish€¦ · hull hu3 4qe and norconserv, ... craig leadley, hannah shaw,...
TRANSCRIPT

CCFRA TECHNOLOGY LTD.,
CHIPPING CAMPDEN, GLOS., GL55 6LD
Pilot trials to determine the benefits of high pressure
processing (HPP) for seafood in the UK
Report on phase 1 studies:
Confidential to:
Sea Fish Industry Authority
St Andrews Dock
Hull
HU3 4QE
and
Norconserv, Institute of Fishprocessing &
Preservation Technology,
Alex. Kiellandsgt 2
PO Box 327, 4002, Stavanger
Norway
REPORT No: FMT/REP/95900/1
Craig Leadley, Hannah Shaw, Lucy Brown and Sue Burling
ISSUE DATE: 28/01/2008
Report Approved By: Report Checked By:
Name: Name:
Information supplied by the Campden & Chorleywood Food Research Association Group
(CCFRA) is given after the exercise of all reasonable care and skill in its compilation,
preparation and issue but is provided without liability in its application and use.
This report shall not be reproduced, except in full, without written approval of CCFRA

Executive Summary
Aside from irradiation, HPP is perhaps the most widely researched and commercially
developed emerging non-thermal preservation technique for food processing. As
currently used, HPP is an essentially non-thermal pasteurisation process in which a food
is subjected to pressures in the region of 150 MPa to around 600 MPa (1500 to 6000 bar)
and held at pressure for a time, generally under 10 minutes. A hold time of less than 5
minutes is recommended if this achieves the required processing objective.
As of September 2007, it was estimated that there were approximately 115 full scale
industrial units in operation world wide. As of August 2006, around 60% of these
vessels were in the USA, and around 20% were in Europe. There is only 1 commercial
HPP plant in the UK: the Bare Fruit Products company in Belfast, manufacturing fruit
smoothies under the ‘Puro’ brand-name. Spanish meat products are available in some
UK retail outlets. Of the current world-wide HPP applications, almost 20% are for
seafood processing. Current seafood applications include oyster shucking and lobster de-
shelling. Whilst commercial products exist outside the UK there is limited independent
public-domain ‘know-how’ in the UK regarding the pressure treatment of seafood. The
main objective of this project is to redress this knowledge gap.
High pressure processing studies were carried out on 11 species of fish and shellfish in
order to determine whether there were any potential processing benefits for the UK
seafood processing industry. The species tested were: Nephrops norvegicus, mussels,
oysters, crab, cold water prawns, lobster, warm water prawns, unsmoked salmon, squid,
mackerel and cod.
In each case, a 20-run experimental design was employed and six of the 20 runs (from a
single design block) were evaluated for sensory quality compared with a control sample.
After processing, all 20 runs were evaluated for survival of TVCs, coliforms and
pseudomonads. In some products, measurements of yield were carried out to determine
whether HPP offered any processing benefits, e.g. for peeling, picking or shucking of
seafood.
Key findings for Nephrops norvegicus
Yield benefits as a result of HPP appear very promising; a yield increase of up to 3% was
measured using 270 MPa, 1°C for 5 minutes. Further work is required to determine
whether the apparent yield benefits seen with hand peeling are transferrable to
commercial peeling operations. Pseudomonads were found to be very pressure sensitive
in Nephrops which could prove useful for shelf life extension. Storage trials may form
part of the second phase of the project to determine whether significant shelf-life
extension can be achieved. Sensory results suggested that sour and astringent flavours
could develop in the product along with ‘rubbery’ textures in some instances. Pressures
of around 300 MPa gave the best sensory results.
Key findings for mussels and oysters
The main benefit from HPP treatment of mussels and oysters was the ‘automatic’
shucking that was achievable along with an increase in meat weight after processing.
Muscle meat for example increased, on average, by 34%. This effect could also be
utilised to introduce flavours into the product and to produce value-added products.
Mussels were completely released from the shell at almost all conditions tested. Oysters
tended to still have some loose attachment to the shell but could probably be separated by
a simple vibrating belt. To prevent liquor loss post-process, it would be necessary to
manually seal the product shut in some way, i.e. as per the ‘gold-band’ commercial oyster
products. The effects of HPP on sensory quality appear to be favourable within the limits
of the conditions tested. Samples were generally perceived to be plump, attractive and
less chewy than the control. The degree of plumping in the case of oysters was related to
the pressure and time applied and was therefore controllable.

Key findings for crab and lobster
Reductions in total viable counts were low in crab (<2 log reductions) but much higher
in lobster (at least 4 log reductions in TVC); this could be due to practical limitations in
terms of handling the product after picking, raw material variation or genuine differences
in microbial resistance in the two substrates. The highest picking yield for crab was 53%
found using a process of 250 MPa, 2.5 mins, 15°C or 300 MPa, 2.5 mins, 16°C, but no
comparative picking yields could be taken on raw crabs. There was some run-to-run
variability as to ease of picking of crab and larger scale studies are required to assess the
yield benefits achievable using HPP compared with conventional processing. As a
general though subjective point, it appeared that when removing the legs of crabs after
processing, more meat could be removed from the purse. This finding, if transferrable to
industrial operations, could be commercially significant because ‘intact’ purse meat
commands a higher value than mechanically recovered purse meat. Yield on lobster
claws was up to 23% higher than on cooked controls but this data did not take in to
account cooking losses that could have occurred in the control sample. In general,
pressures of greater than 270 MPa gave better results for tail yield in lobsters. Indications
from the work are that overall picking yields from lobsters and crabs could be enhanced
significantly because meat could be readily extracted even from the legs – gentle
squeezing was sufficient to remove the meat from lobster legs. All treatments used
pressure of between 200 and 300 MPa. Crab samples treated close to 300 MPa tended to
score lower in terms of sensory quality and ‘eggy’ notes were sometimes reported. In
many instances HPP treated lobster was considered to be higher quality than the control.
Key findings for cold and warm water prawns
Peeling yield for cold water prawns varied between 39% and 46% for the pressure treated
samples but was on average 44%, which was the same as that of the control. A 2%
increase in yield would be commercially significant, i.e. if 46% could be consistently
achieved compared with 44% using normal production methods, but it is difficult to

determine whether these yield increases are genuine or are within the measurement errors
inherent in the manual peeling process. Examination of the sample images from the trials
would suggest that the very tip of the prawn was more frequently extracted compared
with the control samples and therefore the yield increases could be genuine. In the case
of warm water prawns peeling yields were enhanced substantially by HPP treatment,
typically being 55-57% compared with 46% for the control. The highest yield was
obtained using a process of 237 MPa at 11.1°C for 2.5 minutes and this pressure also
gave the best sensory results. Cooked, pressure treated samples matched the controls for
sensory quality. The tip of warm water prawns could be extracted fully intact in warm
water prawns after pressure treatment. Larger-scale trials are required in order to give a
more objective measure of peeling yield in a commercial context for both products.
Larger trials are planned on warm water prawns in the second phase of the project to
address this question more fully.
Key findings for salmon, squid, mackerel and cod
HPP was very effective for microbial inactivation with TVC, coliforms and
pseudomonads being reduced to the limits of detection even with starting levels in the
region of 105 cfu/g in some instances. However, pressure treatments in excess of 200
MPa generally resulted in fish products taking on a cooked appearance. This effect
became increasingly noticeable as pressure increased. HPP is therefore unsuitable for use
as a pasteurisation process if it is desirable to maintain the raw appearance of fish.
However, it could still prove very useful for the processing of ready meals and other
added-value products where a cooked appearance is not necessarily a problem. The
cooked quality of pressure treated fish could match that of control samples but in some
cases the product developed a very dense texture and was perceived to be of lower
quality than controls. HPP could potentially be useful for enhancing marination using
pressures below 200 MPa.

Future work
Five products have been short-listed for further work; these are: Nephrops, warm water
prawns, crab, salmon and cod. Trials on crab, warm water prawns and Nephrops will
focus on large scale picking/peeling trials to determine whether the yield benefits
identified in phase 1 are transferrable to a commercial scale. Two commercial processors
are participating in these studies. Trials on salmon and cod will focus on two areas: low
pressure for marination and the production of ready-meals to compare product quality
with that of conventional heat processed ready-meals.
Acknowledgements
The financial assistance of Defra, Seafish and Norconserv for this project is gratefully
acknowledged. The technical assistance of Seafish and Norconserv is gratefully
acknowledged.

Contents
1 Introduction ................................................................................................................. 1
1.1 Basic principles of HPP ........................................................................................ 1
1.2 Current commercial applications .......................................................................... 2
1.3 Previous work on HPP effects on seafood ............................................................ 3
1.4 Equipment for pressure pasteurisation .................................................................. 9
2 Objectives of the project and phase 1. ...................................................................... 13
3 Materials and methods .............................................................................................. 14
3.1 General methods ................................................................................................. 14
3.2 Experimental design and statistical analysis ....................................................... 22
3.3 Microbiological methods .................................................................................... 26
3.4 Sensory evaluation methods ............................................................................... 26
4 Results ....................................................................................................................... 26
4.1 Nephrops ............................................................................................................. 27
4.2 Mussels ............................................................................................................... 34
4.3 Oysters ................................................................................................................ 40
4.4 Crab ..................................................................................................................... 47
4.5 Cold water prawns .............................................................................................. 54
4.6 Lobster ................................................................................................................ 59
4.7 Warm water prawns ............................................................................................ 65
4.8 Salmon ................................................................................................................ 71
4.9 Squid ................................................................................................................... 77
4.10 Mackerel ............................................................................................................. 81
4.11 Cod ...................................................................................................................... 84
5 Conclusions ............................................................................................................... 88
6 Future work ............................................................................................................... 90
7 References ................................................................................................................. 91

List of Figures
Figure 1 A vertical batch high pressure processing vessel from Avure Pressure Systems
(image courtesy of Nigel Rogers, Avure Technologies) .................................................. 10
Figure 2 A horizontal batch high pressure processing vessel (covers removed) from nc
Hyperbaric (image courtesy of Carole Tonello, nc Hyperbaric) ...................................... 11
Figure 3. Nephrops predicted % weight change against measured % change after HPP 30
Figure 4. Nephrops % weight change against pressure applied ....................................... 31
Figure 5. Shucking of mussels as a function of pressure and time .................................. 38
Figure 6. Influence of pressure and time on the weight of oysters after processing ........ 44
Figure 7. Influence of pressure and time on % oysters shucked ...................................... 45
Figure 8. Body of crab removed after pressure treatment ............................................... 51
Figure 9. Run 8 hand-picked claw meat after treatment .................................................. 51
Figure 10. Run 11 hand-picked claw meat after treatment ............................................... 52
Figure 11. Yield on lobster tails as a function of pressure and time. ............................... 62
Figure 12. Yield on lobster claws as a function of pressure and time ............................. 63
Figure 13. Influence of pressure on TVC log reductions................................................. 66
Figure 14 Control warm water prawns ............................................................................ 68
Figure 15 Target pressure of 250 MPa, temperature of 10.2°C, hold time 2.5 minutes . 69
Figure 16 Influence of pressure and temperature on TVC log reduction ........................ 72
Figure 17. Influence of pressure on a* and b* colour measurements in unsmoked salmon
........................................................................................................................................... 73
Figure 18. Predicted versus actual C* values for pressure treated salmon ...................... 74
Figure 19. Influence of temperature and pressure on the value of C* in unsmoked salmon
........................................................................................................................................... 75
Figure 20. Influence of pressure on log TVC reduction in squid .................................... 78
Figure 21. Influence of pressure and time on log TVC reduction in cod. ....................... 85

List of tables
Table 1. Examples of HPP products world-wide ............................................................... 3
Table 2. Examples of existing work on HPP treatment of seafood .................................. 9
Table 3. Suppliers of commercial high pressure equipment for food processing ............ 12
Table 4. Experimental design for salmon trials. Design values are those attained during
the trials rather than target values ..................................................................................... 20
Table 5. Experimental design used for shellfish experiments. ........................................ 24
Table 6. Experimental design used for fish experiments ................................................. 25
Table 7. Nephrops microbial reductions .......................................................................... 27
Table 8. Nephrops yield data ........................................................................................... 29
Table 9. Mussels microbial reductions ............................................................................ 34
Table 10. Mussels yield data ............................................................................................ 36
Table 11. Oysters microbial reductions ........................................................................... 40
Table 12. Oysters yield data............................................................................................. 42
Table 13. Crab microbial reductions ................................................................................ 47
Table 14. Crab yields ....................................................................................................... 49
Table 15. Cold water prawns microbial reductions ......................................................... 54
Table 16. Cold water prawns yield data........................................................................... 56
Table 17. Lobster microbial reductions ........................................................................... 59
Table 18. Lobster yield data............................................................................................. 61
Table 19. Warm water prawns microbial reductions ....................................................... 65
Table 20. Warm water prawns yield data ........................................................................ 67
Table 21. Salmon microbial reductions ........................................................................... 71
Table 22. Squid microbial reductions .............................................................................. 77
Table 23. Squid yield data ............................................................................................... 79
Table 24. Mackerel microbial reductions ........................................................................ 81
Table 25. Mackerel yield data .......................................................................................... 82
Table 26. Cod microbial reductions ................................................................................. 84
Table 27. Cod yield data .................................................................................................. 86

1 Wp Ref:secs/2008/FMT/CEL/KT06976
1 Introduction
1.1 Basic principles of HPP
Aside from irradiation, HPP is perhaps the most widely researched and commercially
developed emerging non-thermal preservation technique for food processing. As
currently used, HPP is an essentially non-thermal pasteurisation process in which a food
is subjected to pressures in the region of 150 MPa to around 600 MPa (1500 to 6000 bar)
and held at pressure for a time, generally under 10 minutes. A hold time of less than 5
minutes is recommended if this achieves the required processing objective (Purroy 2007).
A small temperature rise is observed during pressurisation. This rise is typically around
3-4°C per 100 MPa of applied pressure for predominantly aqueous foods but varies
depending on the product composition [see for example de Heij et al (2003); Ting et al
(2002); Rasanayagam et al (2003)]. Although this is a small temperature rise, it can have
significant implications on the overall lethality of the process, especially when pressure is
combined with moderate heating. Consequently, an understanding of temperature
variation within the vessel is important for commercial processing.
The majority of HPP products are packed and then filled into batch pressure vessels for
treatment. The pressure medium is generally water. In the case of seafood applications,
the product is generally brought into direct contact with the pressure medium.
Commercial systems are designed to run with filtered sea water or 1% salt water in the
main vessel (personal communications with NC Hyperbaric and Avure). In the case of
NC Hyperbaric systems sea water can be used in the vessel but only mains water is
connected to the pump intensifiers in order to extend pump seal life. Whether the product
is packaged or not, the pressure applied can, when sufficiently high, inactivate vegetative
microorganisms.

2 Wp Ref:secs/2008/FMT/CEL/KT06976
Since the process does not involve heating, the sensory and nutritional quality of products
can be remarkably similar to their unprocessed counterpart. However, since HPP can
affect the tertiary structure of proteins, colour and texture changes can and do occur in
some cases. Enzyme resistance to HPP is product dependent and stabilising the product
to enzymic changes must therefore be assessed on a case-by-case basis. Bacterial spores
are very resistant to commercially achievable pressures. As a result, products that are
currently on the market tend to be chilled and many are high acid or contain additional
hurdles for microbial growth such as the presence of antimicrobial compounds.
1.2 Current commercial applications
Commercial pasteurisation using high pressure as a replacement for heating was not
considered feasible until the late 1980’s. Pioneering work in Japan led to the launch of
the world’s first high-pressure pasteurised food in 1990 - a jam product manufactured by
the Meidi-ya Food Factory Co (Leadley & Williams 1996). Further high added-value
products such as juices and dairy desserts appeared in Japan shortly afterwards.
Since then, high pressure has been used as an alternative to heat pasteurisation by a
number of companies throughout the world. Table 1 is a selection of some of the
products manufactured in Europe and the USA using high pressure processing. Fruit
smoothies and Tapas products are now available in the UK.

3 Wp Ref:secs/2008/FMT/CEL/KT06976
Company Product
Fresherized Foods (USA) Range of guacamole, salsa dips and ‘meal
kits’
Motivatit Seafood (USA) ‘Gold band’ Oysters
Goose Point Oysters (USA) Oysters
Hannah International (USA) Hummous
Hormel Foods (USA) Prepared ham products
Joey Oysters (USA) Oysters
Oceans Choice (Canada) Lobsters
Purdue Farms (USA) Prepared poultry products
Shucks Maine Lobster (USA) Lobster
Espuna (Spain) Vacuum packed sliced ham, tapas
Pampryl (France) Range of fruit juices
Frubaca (Portugal) Apple juice
Espuna (imported into the UK) Tapas
Bare Fruit Products (UK) Fruit smoothies
Table 1. Examples of HPP products world-wide
As of September 2007, it was estimated that there were approximately 115 full scale
industrial units in operation world wide (Purroy 2007). As of August 2006, around 60%
of these vessels were in the USA, and around 20% were in Europe (Leadley 2007). As
far as CCFRA is aware, there is only 1 commercial HPP plant in the UK: the Bare Fruit
Products company in Belfast, manufacturing fruit smoothies under the ‘Puro’ brand-
name. Spanish meat products are available in some UK retail outlets. Of the current
world-wide HPP applications, almost 20% are for seafood processing.
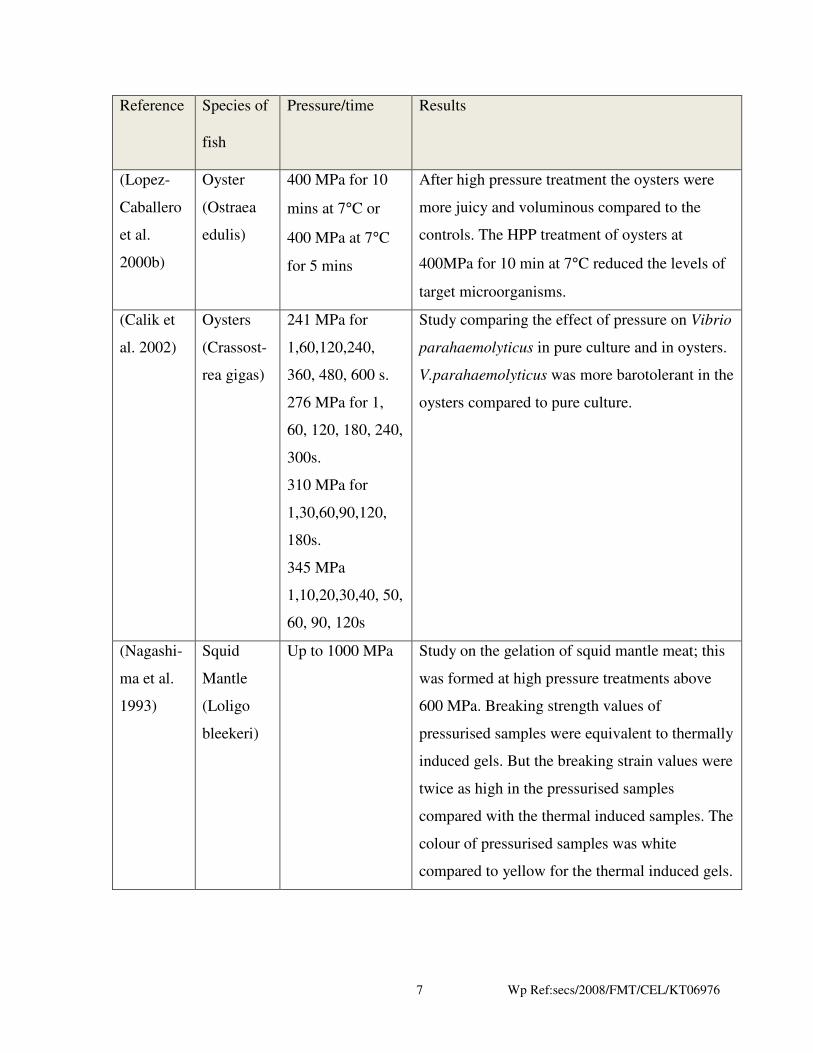
1.3 Previous work on HPP effects on seafood
Whilst there are a growing number of seafood processors using HPP worldwide, there is
very limited technical knowledge in the UK (in the public domain) regarding pressure
processing of seafood. Much of the research carried out on high pressure processing of

4 Wp Ref:secs/2008/FMT/CEL/KT06976
seafood has focused on microbiological effects rather than functional benefits or quality
changes. Often when quality parameters have been the subject of study, the hold times at
pressure have been excessively long for commercial applications (i.e. greater than 5-10
minutes). Examples of work done to date are summarised in Table 2.
Reference Species of
fish
Pressure/time Results
(Ramirez-
Suarez &
Morrissey
2006)
Albacore
Tuna
(Thunnus
alalunga)
275 MPa and 310
MPa for 2,4, and
6 minutes
HPP treated sample had a slight increase in pH.
Microbiological results showed that HPP can
prolong the shelf life to > 22 days at 4°C.
310 MPa for 6 minutes resulted in the
microorganisms not being able to recover during
storage. HPP gave a higher gel hardness level
than the controls in all the pressure treated
samples. HPP resulted in significant colour
change when compared to the control; the
product became lighter and whiter as pressure
and time increased.
(Ashie &
Simpson
1996)
Bluefish
and
Sheephead
1000-3000
atmospheres for
various time
durations
The results showed that seafood enzymes were
more sensitive to high pressure than the
mammalian counterparts due to the
environmental habitat. Colour changes were
detected with the applied pressure; as the
pressure increased the L* value of the fish
increased, i.e. the fish became lighter. The b*
values were reduced with pressure and time. Up
to 2000 atmospheres for 10 minutes there was no
significant difference in colour but above this the
differences were significant.

5 Wp Ref:secs/2008/FMT/CEL/KT06976
Reference Species of
fish
Pressure/time Results
(Hurtado,
Montero,
&
Borderias
2006)
Octopus
(Octopus
vulgaris)
400 MPa for 15
min
400MPa in 3 5-
min pulses
at 7 and 40°C
Microbial counts were lower in the pressurized
samples than in the controls, and the counts in
the pulsed samples were generally lower than in
the continuous processes for both temperatures.
Production of Trimethylamine was greatly
reduced in all pressurized samples. This was
thought to be due to the decreased number of
Gram negative bacteria which produce this
compound. The levels of total volatile bases
increased with storage in the control but
remained constant at lower levels in the
pressurized samples. The level of hardness in the
controls decreased during storage whereas the
levels of hardness in the pressurized samples
remained stable throughout storage.
(Montero,
Lopez-
Caballero,
& Perez-
Mateos
2001)
Prawns
(Penaeus
japonicus)
400 MPa for 10
min at 7°C
Study compared pressurised sample and
pressurised samples plus melanosis inhibitors.
HPP appeared to increase melanosis but
melanosis inhibitors were effective with and
without HPP. Authors proposed a combination
approach.

6 Wp Ref:secs/2008/FMT/CEL/KT06976
Reference Species of
fish
Pressure/time Results
(Lopez-
Caballero
et al.
2000a)
Prawns
(Penaeus
japonicus)
200 and 400 MPa
at 7°C for 10
mins
Study compared Vacuum packaging (VP) and
VP HPP of prawns. Neither the VP nor HPP had
an effect on the shear strength of the prawn
muscle. Both methods decreased the levels of
melanosis compared to the controls and
increased the shelf life of the product. There
were reports that the colour was affected in the
HPP samples with a slight whitening of the
product.
(He et al.
2002).
Oysters
(Crassostr-
ea gigas)
207 MPa for 2
min, 242 MPa for
0,1,2 min, 276
MPa for 0 and 1
min, 311 MPa for
0 min
Treatment of 242 MPa for 2 min caused 88%
detachment of the adductor muscle. 310 MPa
caused 100%; however, it was suggested that
this would change with oyster type and season.
HPP treatments extended the shelf life of the
product in terms of aerobic and anaerobic plate
counts, but coliforms increased above the
controls after day 13 of storage.
(Koo et al.
2006)
Oysters
(Crassostr-
ea
virginica
and
Crassost-
rea gigas)
A range of
pressure between
207 and 586 MPa
and times
between 0 and 6
min
Study into the inactivation of Vibrio
parahaemolyticus and Vibrio vulnificus in
oysters. Both organisms were reduced to
nondetectable levels after pressures of 586 MPa
for 7-8 min.
7 Wp Ref:secs/2008/FMT/CEL/KT06976
Reference Species of
fish
Pressure/time Results
(Lopez-
Caballero
et al.
2000b)
Oyster
(Ostraea
edulis)
400 MPa for 10
mins at 7°C or
400 MPa at 7°C
for 5 mins
After high pressure treatment the oysters were
more juicy and voluminous compared to the
controls. The HPP treatment of oysters at
400MPa for 10 min at 7°C reduced the levels of
target microorganisms.
(Calik et
al. 2002)
Oysters
(Crassost-
rea gigas)
241 MPa for
1,60,120,240,
360, 480, 600 s.
276 MPa for 1,
60, 120, 180, 240,
300s.
310 MPa for
1,30,60,90,120,
180s.
345 MPa
1,10,20,30,40, 50,
60, 90, 120s
Study comparing the effect of pressure on Vibrio
parahaemolyticus in pure culture and in oysters.
V.parahaemolyticus was more barotolerant in the
oysters compared to pure culture.
(Nagashi-
ma et al.
1993)
Squid
Mantle
(Loligo
bleekeri)
Up to 1000 MPa Study on the gelation of squid mantle meat; this
was formed at high pressure treatments above
600 MPa. Breaking strength values of
pressurised samples were equivalent to thermally
induced gels. But the breaking strain values were
twice as high in the pressurised samples
compared with the thermal induced samples. The
colour of pressurised samples was white
compared to yellow for the thermal induced gels.

8 Wp Ref:secs/2008/FMT/CEL/KT06976
Reference Species of
fish
Pressure/time Results
(Paarup et
al. 2002)
Squid
Mantle
(Todaropsi
s eblanae)
150, 200, 300 and
400 MPa for 15
min stored at 4°C
Pressures of between 200 and 400 extended the
shelf life of squid; this altered the appearance of
the sample from grey to a reddish colour.
(Linton,
McClem-
ents, &
Patterson
2003)
Mussels,
prawns,
scallops
and
oysters
300,400, 500 and
600 MPa for 2
min at 20°C and
stored for up to
28 days at 2°C
The psychrotrophic counts in all the pressure
treated samples were less than the controls and
took longer to reach the cut off point in the shelf
life test.
(Sequeira-
Munoz et
al. 2006)
Carp
(Cyprinus
carpio)
100, 140, 180 and
200 MPa at 4°C
for 15 and 20 min
At levels of above 140 MPa the L* values of the
fish increased with pressure and processing time.
Values of a* and b* also increased as pressure
increased with pressure and holding times above
140 MPa.
(Chevalier
Bail, &
Ghoul
2001)
Turbot
(Scophtha-
lmus
maximus)
100,140, 180 and
200 MPa for 15
and 30 min at
4°C.
The samples which had been pressurised lost the
transparent colour of raw fish and became
lighter. Increased L* values with increased
pressure and time.
(Amanati-
dou et al.
2000)
Fresh
Atlantic
Salmon
0,100,150, 200
MPa for 0,10,30,
60 min
Study measured the effectiveness of Modified
Atmosphere and HPP on shelf-life of salmon.
L* values of salmon increased with pressure
treatment and time. Values of a* declined with
increasing pressure and time and the product was
unacceptable at 200MPa. The combined effect of
HPP and MA increased the shelf life by at least 5
days compared to VP. Combination was more
effective than either treatment alone.

9 Wp Ref:secs/2008/FMT/CEL/KT06976
Reference Species of
fish
Pressure/time Results
(Fioretto
et al.
2005)
Caviar 400 MPa for 15
min, 350MPa for
5 min in 3 cycles.
500 MPa for 15
min and 450 MPa
for 5 min in 3
cycles
Inoculated caviar with Staphylococcus aureus
and Salmonella enteritidis. Treatments of
500MPa /15 min and 450MPa/5 min x 3 cycles
were successful in reducing levels of S. aureus
and treatments of 400MPa/15 min and
350MPa/5 x 3 cycles were successful in reducing
levels of Salmonella enteritidis.
(Matser et
al. 2000)
Various
species
100-1000 MPa
for 5 min for
colour trials. 100,
200 and 400 MPa
for texture trials
for 10 minutes
Most fish gave a change in colour at
150-200 MPa. Octopus retained its raw
appearance until 400-800 MPa. Hardness
increased as the pressure increased and product
loss was increased at pressures of 200-400 MPa.
Table 2. Examples of existing work on HPP treatment of seafood
1.4 Equipment for pressure pasteurisation
There are two main types of HPP equipment available - batch and semi-continuous.
Industrial food applications are almost exclusively batch. In a batch process, the product
is filled into bulk or individual primary packaging and loaded into the vessel. A liquid
pressure medium (usually water) is pumped into the vessel until the target processing
pressure is reached and held at this pressure for the required time. In a semi-continuous
system, the product is pumped directly into a treatment chamber and is separated from
the pressure medium by a floating piston. As the pressure medium is introduced, the
piston moves up to pressurise the product. By using a number of units it is possible to

10 Wp Ref:secs/2008/FMT/CEL/KT06976
co-ordinate the process such that one unit is emptying as another is filling and a third is
pressurising. In this manner, a continuous stream of product can be supplied to a clean or
aseptic filling system. Examples of vertical and horizontal batch pressure processing
equipment for food use can be seen in Figure 1 and Figure 2.
Figure 1 A vertical batch high pressure processing vessel from Avure Pressure Systems
(image courtesy of Nigel Rogers, Avure Technologies)

11 Wp Ref:secs/2008/FMT/CEL/KT06976
Figure 2 A horizontal batch high pressure processing vessel (covers removed)
from nc Hyperbaric (image courtesy of Carole Tonello, nc Hyperbaric)
There are a large number of equipment suppliers providing equipment on varying scales
from laboratory through to full production scale models. A list of some of the larger
manufacturers of high pressure processing equipment on an industrial scale can be found
in Table 3. Market leaders are currently Avure Technologies and nc Hyperbaric. Both
companies produce horizontal systems; Avure also produces vertical systems.

12 Wp Ref:secs/2008/FMT/CEL/KT06976
Avure Technologies,
23500 64th Avenue South,
P.O. Box 97040,
Kent, Washington 98064-9740,
USA
nc Hyperbaric
Condado de Treviño,
59 – Políg. Villalonguéjar
09001 BURGOS
SPAIN
Kobelco (Kobe Steel Ltd)
9-12, Kita-Shinagawa-ku, Tokyo,
141-8688
Japan
Engineered Pressure Systems International N.V. (EPSI)
Walgoedstraat 19
B-9140 TEMSE
Belgium.
Elmhurst Technologies Inc
60 Loudonville Road
Albany, NY 12204-1513
USA
Stork Food & Dairy Systems B.V.
Ketelstraat 2, 1021 JX
Amsterdam, The Netherlands
Table 3 suppliers of commercial high pressure equipment for food processing

13 Wp Ref:secs/2008/FMT/CEL/KT06976
2 Objectives of the project and phase 1.
The seafood processing industry needs information on what high pressure processing can
achieve and some typical treatment conditions. This project aims to provide this
information, subject to the limitations of using laboratory scale equipment, and will allow
industry to make informed choices on equipment purchases and test conditions. This
project has the potential to identify new products and markets for the seafood industry
and thus to improve profitability. In addition, the project could identify means of
improving the safety of seafoods.
Specifically, this project aims to provide:
• Platform knowledge about a new technology for the UK industry
• Information for the fish and seafood sector for the development of individual
consortium projects
• Data on the extraction of edible meat and aiding shell removal/opening from
shellfish
• Information on the potential to develop new high added-value products
• On-going demonstration and experimental facilities for use by the seafood sector
Phase 1 was specifically designed to be a screening trial, to identify commercial
opportunities and to identify a short-list of 5 products for further exploratory work.

14 Wp Ref:secs/2008/FMT/CEL/KT06976
3 Materials and methods
3.1 General methods
Samples were delivered to CCFRA and stored at an appropriate temperature prior to
testing (-18°C for frozen materials and 2-5°C for chilled or live materials). For each
process run, samples were weighed into bags with sufficient reverse osmosis treated
water to just cover the sample. Unless otherwise stated, the bags used were vacuum
pouches provided by The Vacuum Pouch Company Ltd, UK. Product weights were
recorded for each sample pack. The bags were heat sealed ready for processing; care was
taken to expel as much air as was practical from the packs prior to sealing. Samples were
placed into a high pressure processing vessel. Vessels used were a Stansted Fluid Power
(UK) system having a working volume of approximately 5L and a maximum operating
pressure of 400 MPa, or a 700 ml system manufactured by Engineered Pressure Systems
International (Belgium). The pressure fluid in the Stansted system was a 30% w/w
propylene glycol solution (Stansted Fluid Power, UK). The pressure fluid in the EPSI
system was a 3% w/w MKU solution (an oil based corrosion inhibitor supplied by EPSI).
The temperature of the vessels was not controlled but product temperatures before and
after treatment were recorded wherever possible. Although product and fluid temperature
could not be measured during processing, compression heating effects for predominantly
aqueous materials are unlikely to have exceeded 3-4°C per 100 MPa of applied pressure
(Leadley 2005). Compression heating of 100% propylene glycol has previously been
reported to be 5.8 ± 0.6 per 100 MPa of applied pressure (Rasanayagam et al. 2003).
Using a mixture model suggested by Rasanayagam et al. ( 2003) and reported to have
given reasonable results for propylene glycol, an approximation for compression heating
of the pressure fluid in the Stansted fluid is between 3.5 and 4.2°C per 100 MPa of
applied pressure. Extensive temperature testing has previously been undertaken by
CCFRA for the EPSI system and compression heating of the fluid is typically around 4°C
per 100 MPa of applied pressure, but this is rapidly dissipated unless steps are taken to

15 Wp Ref:secs/2008/FMT/CEL/KT06976
retain the heat in the system. Compression heating of the MKU solution is marginally
influenced by the initial temperature of the fluid (Leadley 2006).
Samples were pressure treated according to the experimental designs detailed in section
3.2. Peak pressure, come-up time and come-down time were recorded for each run.
After treatment, samples were drained for 2 minutes and re-weighed. A sub-sample from
each process was taken, weighed and handled as appropriate for each species (see
methods section for individual species for details). In all cases, sub-samples were
photographed using a digital imaging system (DigiEye, UK). Sub-samples, generally
from the first block of each design, were subjected to sensory evaluation. For clarity,
sensory reports for all species including the method used have been written as self-
contained reports that are included as appendices to the main report. Similarly, to
improve the clarity of the report, all images of the samples have been included as
appendices rather than in the body of the report. Images have occasionally been included
within the body of the report when illustrating a specific point of discussion.
Sub-samples from every pressure cycle were evaluated for total viable counts,
pseudomonads and coliforms. Microbiological methods are detailed in section 3.3.
Where possible, samples for microbiology were separately bagged prior to pressure
treatment but this was not practical in all cases, e.g. for crab and lobster where hand
picking of the sample was required.
3.1.1 Method detail specific to Nephrops norvegicus
Frozen, un-peeled tails of Nephrops norvegicus were supplied by Young’s Seafood Ltd,
delivered to CCFRA and stored at –18°C prior to starting high pressure experiments. For
each pressure treatment, approximately 500 g of tails (actual weights were recorded)
were placed into vacuum bags along with sufficient reverse osmosis treated water to just
cover the sample. The initial temperature of tails prior to high pressure treatment was

16 Wp Ref:secs/2008/FMT/CEL/KT06976
0°C (s.d. = 0.86°C, n = 20). The temperature of the sample after processing was on
average 0.3°C cooler than before treatment (s.d. = 0.4°C, n=20).
Each sample was pressure treated according to the experimental design as outlined in
Table 5. Twenty tails were sub-sampled from each run and were weighed and hand-
peeled. The weight of meat and shell recovered from the 20 sample sub-set was recorded
for each process condition and yields were calculated.
3.1.2 Methods detail specific to mussels
Depurated rope grown mussels were supplied from Cornish Mussels Ltd. Samples were
delivered live on the day of testing and stored chilled until use. Approximately 500g of
mussels were weighed into a sterile stomacher bag (actual weight recorded) and sufficient
reverse osmosis treated water was added to just cover the mussels. Samples were triple
bagged as early experiments had shown that the sharp edges of the mussels made the
bags prone to puncture. Commercially this would not pose a problem because the
mussels would generally be brought into direct contact with the pressure fluid. The
initial temperature of mussels prior to high pressure treatment was 11.4°C (s.d. = 2.2°C,
n=20). The temperature of the sample after processing was on average 1.5°C warmer
than before treatment (s.d. = 2.0°C, n=20).
Each sample was pressure treated according to the experimental design outlined in
Table 5. After treatment, a sub-sample of 30 mussels was taken and weighed. The 30
mussels were examined to see how effective the process had been for shucking the meat
from the shells. The weight of the meat and shells was recorded and yields were
calculated.
3.1.3 Method detail specific to oysters
Oysters were supplied by Colchester Oyster Fisheries Ltd. Oysters were delivered the
day before processing and were stored at <3°C overnight. For each run, 10 oysters were
placed in stomacher bags and sufficient reverse osmosis treated water was added to cover

17 Wp Ref:secs/2008/FMT/CEL/KT06976
the samples. Oysters were triple bagged to protect against puncture. The initial
temperature of oysters prior to high pressure treatment was 13.1°C (s.d. = 1.1°C, n=20).
The temperature of the sample after processing was on average 1.7°C warmer than before
treatment (s.d. = 1.0°C, n=19).
Each sample was pressure treated according to the experimental design as outlined in
Table 5. After treatment, the oysters were drained and re-weighed. The oysters were
examined to see how effective the process had been for shucking the meat from the
shells. The weight of the meat and shells was recorded and yields were calculated.
3.1.4 Methods detail specific to crab
Crabs were delivered live to CCFRA on the day of processing. Live and cooked samples
were supplied by the Blue Seafood Company Ltd and technical staff from the company
were present on the day of the trials. Crabs were stored at <3°C. Live crabs were
stunned prior to pressure treatment using a Crustastun humane crustacean stunner
(Crustastun, UK). Crabs were weighed and filled (double bagged) into vacuum bags.
Bags were then filled with sufficient reverse osmosis treated water to just cover each
crab. The initial temperature of the crabs prior to high pressure treatment
was 14.8°C (s.d. = 1.5°C, n=18). The temperature of the sample after processing was on
average 1.6°C colder than before treatment (s.d. = 1.4°C, n=18).
Each sample was pressure treated according to experimental design as outlined in
Table 5. After treatment, the crab was drained for 2 minutes and re-weighed. The claws
of the crab were removed and weighed. The claws were then manually picked and
subjectively assessed for ‘ease of picking’. The weight of meat and shell was recorded
and yields were calculated. Meat was extracted from the legs of the crab for
microbiological analysis. For practical reasons, extraction could not be carried out
aseptically.

18 Wp Ref:secs/2008/FMT/CEL/KT06976
3.1.5 Method detail specific to cold water prawns
Cold water prawns were supplied frozen by Icelandic Export Centre Ltd and a
representative from the company was present for the trials. The prawns were placed in a
3% w/w brine solution and thawed overnight in a chiller at <3°C in order to simulate
commercial practice prior to peeling as advised by Lyons Seafoods Ltd. Approximately
500g of prawns (actual weights were recorded) were filled into vacuum bags and just
covered with either chilled or ambient temperature reverse osmosis treated water. A
separate bag of prawns weighing approximately 50g was also prepared, covered with
reverse osmosis treated water and processed along with the main sample. This smaller
sample was used for microbiological analysis to ensure that cross contamination risks
were minimised. The initial temperature of the prawns prior to high pressure treatment
was 8.6°C (s.d. = 5.4°C, n=18). The temperature of the sample after processing was on
average 4.3°C warmer than before treatment (s.d. = 3.3°C, n=18).
Each sample was pressure treated according to experimental design as outlined in
Table 5. After treatment, the prawns were drained for 2 minutes and re-weighed. A sub-
sample of 30 prawns was hand-peeled. The meat and shell were weighed and yields were
calculated.
3.1.6 Method detail specific to lobster
Lobsters were sourced from Clearwater Lobster Merchants. Staff from the Blue Seafood
Company Ltd were present for the trials. The samples arrived live on the day of
processing and were stored at <3°C prior to use. Lobsters were stunned prior to pressure
treatment using a Crustastun humane crustacean stunner (Crustastun, UK). The lobsters
were weighed, double bagged in vacuum pouches and covered with either chilled or
ambient temperature reverse osmosis treated water. The mean initial temperature of the
lobsters prior to high pressure treatment was 16.5°C (s.d. = 4.9°C, n=18). The

19 Wp Ref:secs/2008/FMT/CEL/KT06976
temperature of the sample after processing was on average 0.2°C warmer than before
treatment (s.d. = 2.8°C, n=18).
Each sample was pressure treated according to the experimental design as outlined in
Table 5. After treatment, the lobsters were drained for 2 minutes and re-weighed. The
meat from one claw from each run was sub-sampled for microbiological enumeration.
Handling of the meat was minimised as much as was practical but was not aseptic. The
weight of the second claw was recorded; the claw was then manually picked. The weight
of meat and shell was recorded and yields were calculated.
3.1.7 Method detail specific to warm water prawns
Raw frozen whole prawns were supplied by Lyons Seafoods Ltd. The prawns were
thawed by soaking in a 3% w/w brine solution overnight at <3°C to simulate commercial
practice prior to peeling. Approximately 500g of prawns (actual weights were recorded)
were filled into vacuum packaging, double bagged and covered with reverse osmosis
treated water at either ambient or chilled temperature. Each sample was pressure treated
according to the experimental design as outlined in Table 5. After processing, samples
were drained for 2 minutes and then re-weighed. The mean initial temperature of the
prawns prior to high pressure treatment was 8.6°C (s.d. = 1.29°C, n=18). The
temperature of the sample after processing was on average 3.0°C warmer than before
treatment (s.d. = 3.9°C, n=17). A sub-sample of 10 prawns was taken, weighed, and
manually peeled. The weight of meat and shell was taken and yields were calculated.
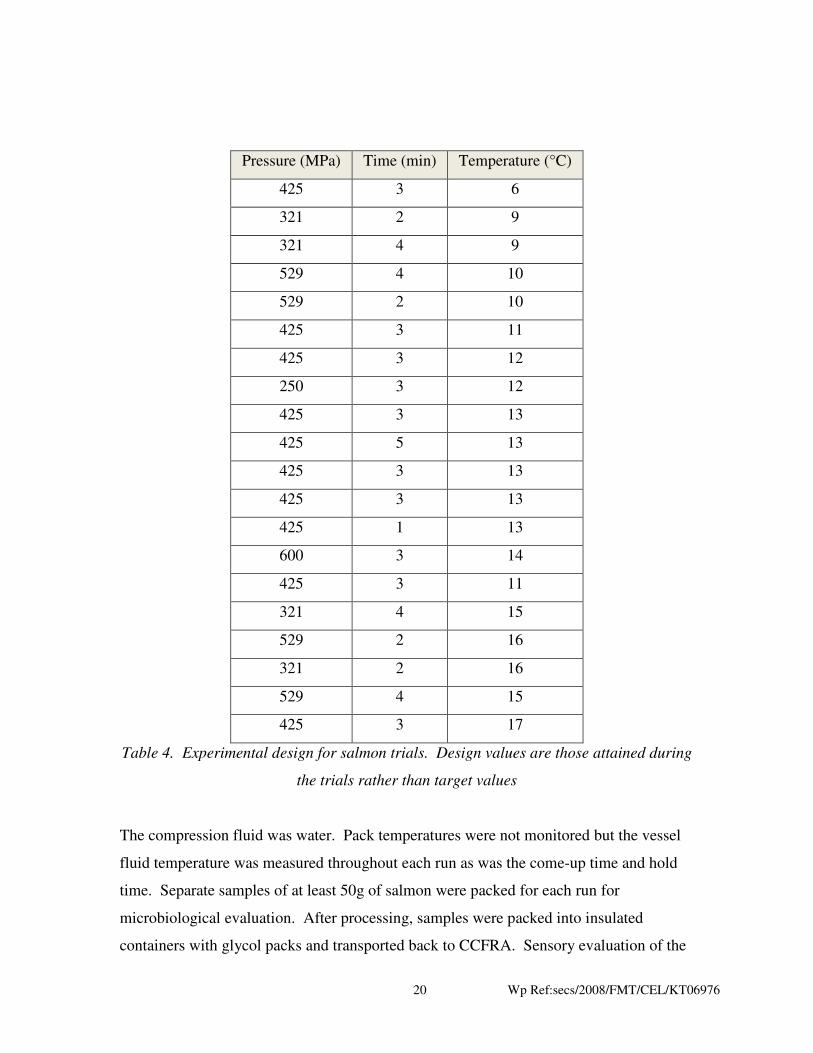
3.1.8 Method detail specific to salmon
Salmon trials were carried out at AFBI Belfast using a 35 litre HPP system manufactured
by Avure (USA). Fresh farmed salmon (Salmo salar) was purchased from a local
supplier. The salmon was provided vacuum packed; each pack was opened and the
salmon was hand portioned before being re-vacuum packed. Temperature control was
possible on the Avure system so a modified experimental design was employed as shown
in Table 4.
20 Wp Ref:secs/2008/FMT/CEL/KT06976
Pressure (MPa) Time (min) Temperature (°C)
425 3 6
321 2 9
321 4 9
529 4 10
529 2 10
425 3 11
425 3 12
250 3 12
425 3 13
425 5 13
425 3 13
425 3 13
425 1 13
600 3 14
425 3 11
321 4 15
529 2 16
321 2 16
529 4 15
425 3 17
Table 4. Experimental design for salmon trials. Design values are those attained during
the trials rather than target values
The compression fluid was water. Pack temperatures were not monitored but the vessel
fluid temperature was measured throughout each run as was the come-up time and hold
time. Separate samples of at least 50g of salmon were packed for each run for
microbiological evaluation. After processing, samples were packed into insulated
containers with glycol packs and transported back to CCFRA. Sensory evaluation of the

21 Wp Ref:secs/2008/FMT/CEL/KT06976
pressure treated samples took place the day after processing. Photography of the samples
also took place the day after processing.
3.1.9 Method detail specific to squid
Squid was supplied by New Wave Seafoods (Fairford, Gloucestershire). Samples were
supplied cleaned and size graded (30-35 squid weighing 10 kg). Squid tubes were
packed for the sensory trials and photography; tentacles were packed for microbiological
evaluation. All samples were vacuum packed the day before processing and were stored
overnight at 2-5°C prior to pressure treatment. All trials were carried out on the ESPI
high pressure system because pressures in excess of 400 MPa were required. The vessel
wall temperature was set to 20°C but heat generated by continuous pumping of fluid
around the vessel wall meant that the pressure transmission fluid was typically around
29°C. Each sample was pressure treated according to the experimental design as outlined
in Table 6. The initial temperature of the pressure fluid prior to high pressure treatment
was 28.9°C (s.d. = 1.8°C, n=19). The temperature of the fluid after processing was on
average 0.4°C warmer than before treatment (s.d. = 1.4°C, n=16). The initial temperature
of the squid was not recorded because the vacuum packed bags could not be pierced prior
to HPP treatment, but samples were stored at 2-5°C and were brought out singularly for
trials so the initial temperature is expected to be around 2-5°C. The average temperature
of the squid after processing was 21.5°C (s.d. = 2.0°C, n=20).
3.1.10 Method detail specific to cod
Air-freighted Icelandic cod was supplied by Seachill Ltd (Grimsby, UK) and a member
of staff from Seachill was present for the trials. The cod was four days from catch,
having being caught on Friday 21st September, air-freighted to Grimsby on 22
nd
September and pressure treated on 25th
September. The cod was portioned into 16-cm
long pieces before being packed into vacuum bags. The samples were not vacuum-
packed but care was taken to expel air from the pack prior to sealing. A separate portion
was cut for microbiological evaluation. All samples were held on ice at all times during
the experiments. After treatment the samples were transferred to a chiller operating at

22 Wp Ref:secs/2008/FMT/CEL/KT06976
2-5°C. All trials were carried out on the ESPI high pressure system because pressures in
excess of 400 MPa were required. Each sample was pressure treated according to the
experimental design as outlined in Table 6. The initial temperature of each sample was
not recorded because the samples were vacuum packed but all samples were kept on ice
until pressure treated. The temperature of the sample after treatment was typically
11.7°C (s.d. = 1.2°C, n=20).
3.1.11 Method detail specific to mackerel
Mackerel was supplied by New Wave Seafoods (Fairford, Gloucestershire). Samples for
sensory evaluation were provided gutted and cleaned (approximate weight of each fish
was 300g) and were hand-filleted by CCFRA staff. Each fillet was filled into vacuum
packs and vacuum sealed. The packed samples were then stored overnight at 2-5°C
before being pressure treated and subjected to sensory evaluation. The remaining
samples, i.e. those not used in sensory evaluation, could not be treated due to a site flood.
A second batch of mackerel was therefore purchased to complete the studies. Samples
were provided by New Wave Seafoods and were provided as fillets. All 20 runs were
completed on this new raw material for photography and microbiological studies.
However, sensory evaluation was not repeated on these samples. Care should therefore
be taken in inferring any relationships between the sensory evaluation and the
microbiological data as different raw materials were used in each case. Each sample was
pressure treated according to the experimental design as outlined in Table 6. The initial
temperature of each sample was not recorded because the samples were vacuum packed,
but all samples were stored at 2-5°C and brought out singularly for each pressure
treatment. The temperature of the sample after treatment was typically 13.3°C (s.d. =
1.7°C, n=20).
3.2 Experimental design and statistical analysis
All experiments were based on a customised central composite design. Two basic
designs were employed, one for fish using pressures between 200-600 MPa and one for

23 Wp Ref:secs/2008/FMT/CEL/KT06976
shellfish using 200-300 MPa. Times ranged between zero and five minutes.
Temperature could not be controlled but was recorded before and after processing. The
target values for pressure and time in the two designs are recorded in Table 5 and
Table 6. The actual temperature, pressures and times achieved during processing were
substituted for the target values of the design (established using Minitab version 15.0).
There were five replicates of the centre point of the design. Where appropriate, an
analysis of variance was carried out on the data and a quadratic surface response was
fitted for each response variable.

24 Wp Ref:secs/2008/FMT/CEL/KT06976
Target pressure
(MPa)
Target time (min)
250 2.5
280 1
220 1
250 2.5
220 4
280 4
250 5
250 2.5
250 2.5
250 0
250 2.5
300 2.5
250 2.5
200 2.5
220 4
250 2.5
280 1
220 1
250 2.5
280 4
Table 5. Experimental design used for shellfish experiments.

25 Wp Ref:secs/2008/FMT/CEL/KT06976
Target pressure
(MPa)
Target time (min)
400 5
200 2.5
600 2.5
400 2.5
400 2.5
400 2.5
400 2.5
400 0
522 1
278 4
278 1
400 2.5
400 2.5
522 4
522 4
400 2.5
522 1
278 1
400 2.5
278 4
Table 6. Experimental design used for fish experiments
26 Wp Ref:secs/2008/FMT/CEL/KT06976
3.3 Microbiological methods
Methods used for microbiological enumeration were standard methods as recorded in the
CCFRA Business Management manual (TES-MB-002 for aerobic plates counts, TES-
MB-005 for coliforms and TES-MB-012 for pseudomonads). These methods are
available on request.
3.4 Sensory evaluation methods
Unless otherwise stated, controls and runs 1-6 were subjected to sensory evaluation after
processing using experienced assessors. Each assessor independently described the
uncooked appearance and odour of the samples and awarded an overall quality grade for
the raw sample using a 9-point scale. The sample was then cooked and the assessors
described the appearance, odour, flavour and texture/mouthfeel and awarded a quality
grade for the cooked assessment. The consensus scores were calculated and the
individual comments combined. Detailed sensory methods and results are attached as
self-contained reports in appendices 1-11. A short summary of the results is presented on
a species-by-species basis in section 4.
4 Results
For clarity, results and discussion have been presented on a species-by-species basis.
Sensory results are attached as separate self-contained reports in Appendices 1-11.

27 Wp Ref:secs/2008/FMT/CEL/KT06976
4.1 Nephrops
Microbial reductions obtained for HPP treatment of Nephrops are reported in Table 7.
Yield data are reported in Table 8. Results for sensory evaluation are briefly
summarised in section 4.1.3 but are fully reported in Appendix 1.
4.1.1 Microbiological results
Run no. Pressure
(MPa)
Initial
product
temp (°C)
Product
temp after
processing
(°C)
Time
(min)
TVC
(per g)
TVC log
reduction
Coliforms
(per g)
Pseudomonads
(per g)
Control 1 No
Water
0.1 * * 0 2.10E+03 0.0 <5 1.90E+03
Control 2 Water 0.1 * * 0 1.00E+04 -0.7 <5 1.90E+03
1 269 -3.3 -3.1 2.5 * * * *
2 297 0.4 -0.3 1 2.04E+02 1.0 <5 <50
3 239 0.2 0 1 1.10E+03 0.3 10 <50
4 268 0.5 -0.4 2.5 4.13E+02 0.7 5 <50
5 237 0.1 0.1 4 4.20E+03 -0.3 <5 <50
6 299 0.1 -0.1 4 3.31E+02 0.8 <5 <50
7 270 1 0.1 5 3.00E+02 0.8 <5 <50
8 268 0.7 -0.4 2.5 1.60E+03 0.1 <5 <50
9 267 0.1 -0.1 2.5 5.40E+03 -0.4 <5 <50
10 268 0.1 -0.2 0 7.10E+03 -0.5 <5 <50
11 269 -0.1 -0.1 2.5 5.00E+03 -0.4 <5 <50
12 323 -0.1 -0.7 2.5 3.40E+03 -0.2 <5 <50
13 268 0 -0.1 2.5 5.50E+01 1.6 <5 <50
14 219 0 -0.1 2.5 2.80E+03 -0.1 <5 <50
15 233 0.4 -0.2 4 7.54E+02 0.4 <5 <50
16 237 0.1 0.3 2.5 6.70E+03 -0.5 <5 <50
17 299 0.1 -0.1 1 9.09E+02 0.4 <5 <50
18 239 0.1 0.1 1 6.32E+02 0.5 <5 50
19 269 1 0.6 2.5 2.10E+03 0.0 45 50
20 298 0 0.5 4 2.00E+03 0.0 <5 50
Table 7. Nephrops microbial reductions

28 Wp Ref:secs/2008/FMT/CEL/KT06976
There was no evidence of statistically significant differences in Log TVC reductions as a
function of pressure, temperature and time (P>0.05) within the design space tested. The
maximum observed log reduction was 1.6 but this was not at the highest pressure as
would perhaps have been expected. The narrow window of processing conditions and
inherent variation in the raw material may both be factors explaining why variation in
TVC reductions were relatively large and log reductions were small. Coliforms were
absent in all samples including the controls. Pseudomonads were found to be very
pressure sensitive in Nephrops, being reduced from 103 cfu/g to the limits of detection in
17 of the 20 runs.

29 Wp Ref:secs/2008/FMT/CEL/KT06976
4.1.2 Yield/quality data
Run No. Weight of tails
before processing
(g)
Weight of tails after
processing (g)
Difference
(g)
Weight of
20 tails (g)
Yield based on
original weight
(%)
Yield based on
sum of meat
and shell
weights (%)
Control 1 No
Water 501.1 501.1 0.0 150.4 65 66
Control 2
Water 504.2 * * 158.0 54 71
1 501.4 * * * * 68
2 500.4 567.7 67.3 154.4 62 72
3 500.4 563.5 63.1 115.3 68 71
4 503.5 642.2 138.7 117.2 65 69
5 500.9 550.6 49.7 139.9 68 71
6 501.7 620.0 118.3 148.1 69 73
7 502.4 505.1 2.8 131.1 74 72
8 502.6 551.2 48.6 135.0 69 73
9 499.5 543.3 43.8 130.4 69 71
10 504.8 649.3 144.5 162.3 62 70
11 502.4 514.6 12.2 110.9 66 74
12 502.4 509.7 7.3 116.5 66 71
13 503.1 507.3 4.2 113 72 73
14 503.2 413.7 -89.5 117.3 72 73
15 500.1 441.4 -58.7 135.5 71 72
16 501.6 499.0 -2.6 128.3 72 74
17 508.0 570.4 62.4 135.9 69 72
18 508.8 546.6 37.8 121.5 70 72
19 508.0 520.9 12.9 117.23 71 72
20 499.3 527.4 28.1 130.45 68 71
Table 8. Nephrops yield data
30 Wp Ref:secs/2008/FMT/CEL/KT06976
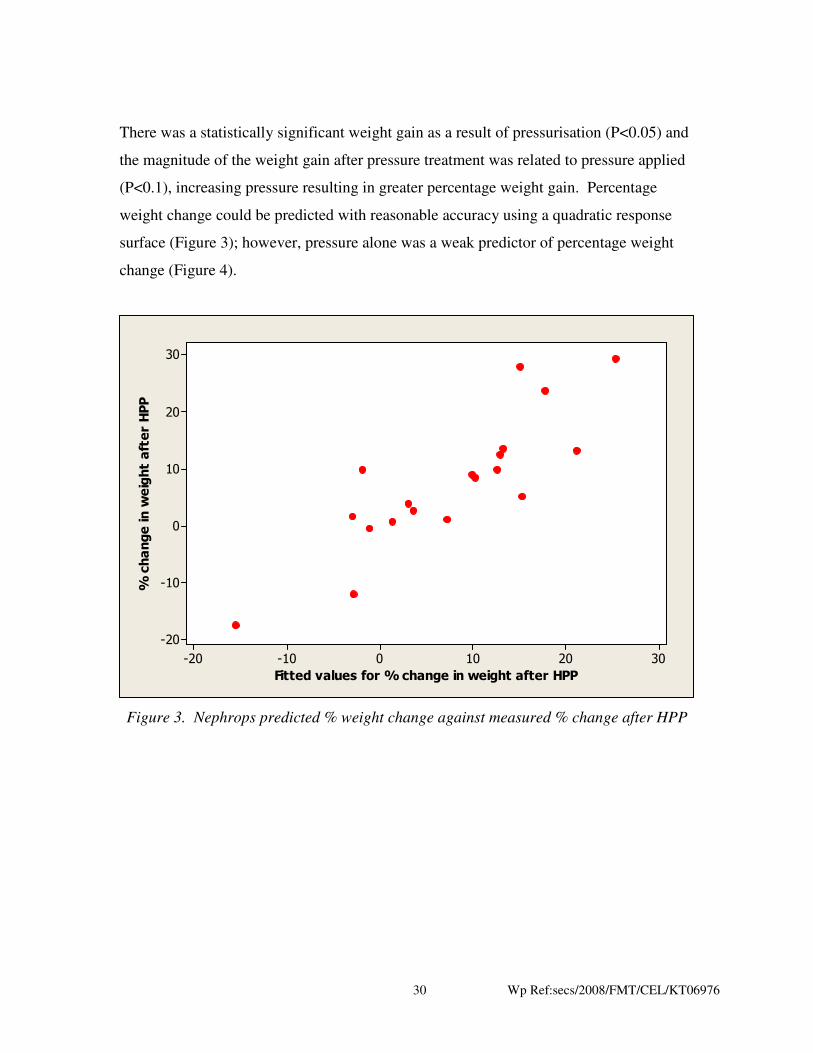
There was a statistically significant weight gain as a result of pressurisation (P<0.05) and
the magnitude of the weight gain after pressure treatment was related to pressure applied
(P<0.1), increasing pressure resulting in greater percentage weight gain. Percentage
weight change could be predicted with reasonable accuracy using a quadratic response
surface (Figure 3); however, pressure alone was a weak predictor of percentage weight
change (Figure 4).
3020100-10-20
30
20
10
0
-10
-20
Fitted values for % change in weight after HPP
% change in weight after HPP
Figure 3. Nephrops predicted % weight change against measured % change after HPP

31 Wp Ref:secs/2008/FMT/CEL/KT06976
320300280260240220
30
20
10
0
-10
-20
Pressure applied (MPa)
% change in weight after processing
Figure 4. Nephrops % weight change against pressure applied
From a starting weight of around 500g Nephrops on average gained 36.4g after pressure
treatment. The maximum measured yield resulting from hand-peeling of the Nephrops
was 74% whereas in the control sample the yield was 65%. However, there were
concerns that there was some bias being introduced into the yield measurements as staff
became more proficient at peeling. For this reason yield measurements were repeated on
the control samples and a yield of 71% was obtained. There was no statistically
significant evidence (P>0.05) to demonstrate differences in peeling yield at different
pressures and temperature within the design space; however, time was significant
(P<0.05) with longer times generally appearing to give an increase in yield compared
with untreated Nephrops; hold times of 5 minutes gave statistically significant differences
in yield compared with the control. A three percent yield increase is substantial and of
commercial interest. Further work in phase two of the project will generate more
objective peeling yields by producing a large quantity of Nephrops and using commercial
peeling equipment to obtain realistic commercial yields.

32 Wp Ref:secs/2008/FMT/CEL/KT06976
4.1.3 Brief summary of sensory results for Nephrops
Controls and runs 1-6 were subjected to sensory evaluation; for each evaluation 12 tails
were assessed. Run 2 scored highest for uncooked quality and scored higher than the
control, being brighter and having less translucency. After cooking, the Control was
graded the highest followed by Runs 2 and 6. These were both slightly less bright, had
lost the slight seawater odour present in the Control and were both slightly more gritty in
texture. Run 6 also had a slightly astringent mouthfeel. All other samples tested were
graded lower than Run 2 and Run 6 due to changes in appearance: dirty grey coloration,
less bright and more shape loss; off odours and sour/acid flavour; more fibrous and gritty,
astringent notes present and one described as rubbery/chewy.
Images of all pressure treated samples can be found in Appendix 12.
4.1.4 Key conclusions for Nephrops
Yield benefits as a result of HPP look very promising; a 3% yield increase is
commercially significant and further work is therefore required to determine whether the
apparent yield benefits seen with hand peeling are transferrable to commercial peeling
operations. Since Nephrops are a commercially important species for the UK industry
and the peeling yields are of interest, this species will be selected for further investigation
in phase 2 of the work. Commercial peeling trials will be carried out on HPP treated
Nephrops.
Regarding the microbiological results, pseudomonads were very pressure sensitive, which
could prove useful for shelf life extension. However, total viable counts were not
reduced to any significant degree. It is therefore difficult to postulate whether a
meaningful shelf life extension could be obtained without knowing the make-up of the
organisms that were present on the TVC plates. Storage trials may form part of the

33 Wp Ref:secs/2008/FMT/CEL/KT06976
second phase of the project where this question will be addressed more fully in certain
species.
Sensory results for runs 1-6 suggested that sour and astringent flavours could develop in
the product along with ‘rubbery’ textures in some instances. Interestingly, the two
conditions which gave the best sensory results were at higher pressures, i.e. around 300
MPa. Since there was no clear optimum for microbiological inactivation and yield
improvements but sensory quality was not seriously affected at the higher pressure
treatments, it is proposed that phase 2 trials will involve larger scale peeling trials with a
commercial processor using pressures of 300 MPa with a hold time of 5 minutes.
34 Wp Ref:secs/2008/FMT/CEL/KT06976
4.2 Mussels
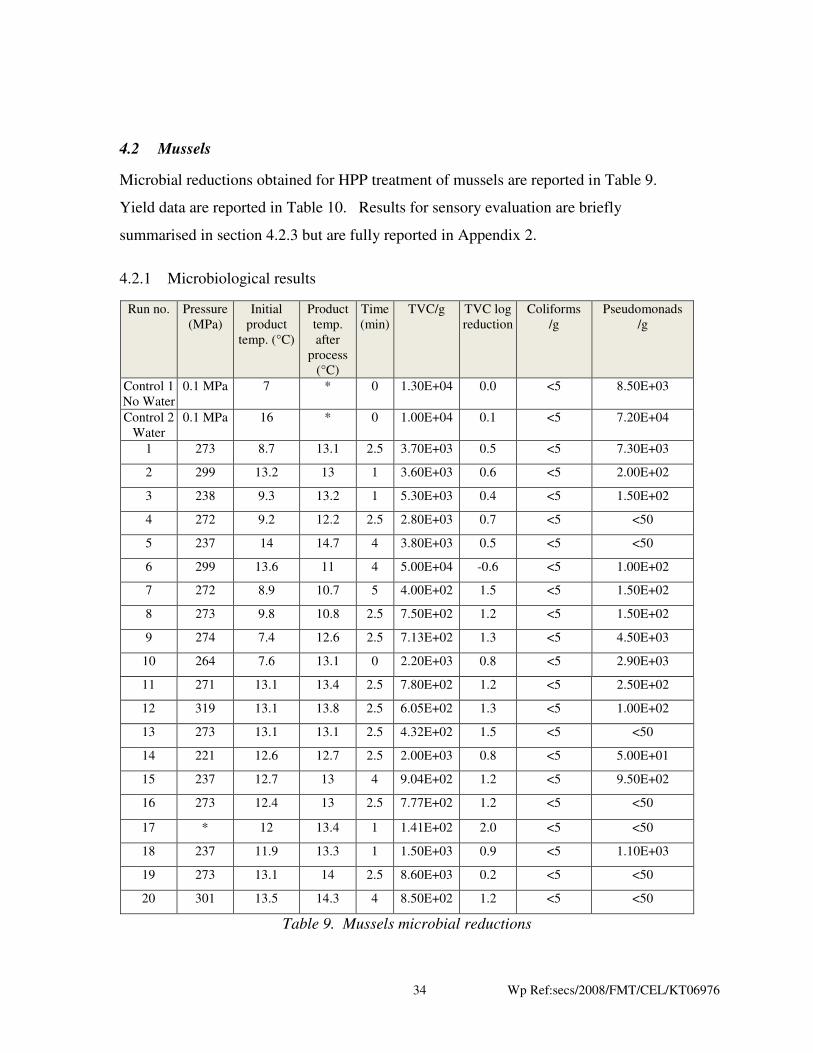
Microbial reductions obtained for HPP treatment of mussels are reported in Table 9.
Yield data are reported in Table 10. Results for sensory evaluation are briefly
summarised in section 4.2.3 but are fully reported in Appendix 2.
4.2.1 Microbiological results
Run no. Pressure
(MPa)
Initial
product
temp. (°C)
Product
temp.
after
process
(°C)
Time
(min)
TVC/g TVC log
reduction
Coliforms
/g
Pseudomonads
/g
Control 1
No Water
0.1 MPa 7 * 0 1.30E+04 0.0 <5 8.50E+03
Control 2
Water
0.1 MPa 16 * 0 1.00E+04 0.1 <5 7.20E+04
1 273 8.7 13.1 2.5 3.70E+03 0.5 <5 7.30E+03
2 299 13.2 13 1 3.60E+03 0.6 <5 2.00E+02
3 238 9.3 13.2 1 5.30E+03 0.4 <5 1.50E+02
4 272 9.2 12.2 2.5 2.80E+03 0.7 <5 <50
5 237 14 14.7 4 3.80E+03 0.5 <5 <50
6 299 13.6 11 4 5.00E+04 -0.6 <5 1.00E+02
7 272 8.9 10.7 5 4.00E+02 1.5 <5 1.50E+02
8 273 9.8 10.8 2.5 7.50E+02 1.2 <5 1.50E+02
9 274 7.4 12.6 2.5 7.13E+02 1.3 <5 4.50E+03
10 264 7.6 13.1 0 2.20E+03 0.8 <5 2.90E+03
11 271 13.1 13.4 2.5 7.80E+02 1.2 <5 2.50E+02
12 319 13.1 13.8 2.5 6.05E+02 1.3 <5 1.00E+02
13 273 13.1 13.1 2.5 4.32E+02 1.5 <5 <50
14 221 12.6 12.7 2.5 2.00E+03 0.8 <5 5.00E+01
15 237 12.7 13 4 9.04E+02 1.2 <5 9.50E+02
16 273 12.4 13 2.5 7.77E+02 1.2 <5 <50
17 * 12 13.4 1 1.41E+02 2.0 <5 <50
18 237 11.9 13.3 1 1.50E+03 0.9 <5 1.10E+03
19 273 13.1 14 2.5 8.60E+03 0.2 <5 <50
20 301 13.5 14.3 4 8.50E+02 1.2 <5 <50
Table 9. Mussels microbial reductions
35 Wp Ref:secs/2008/FMT/CEL/KT06976
The maximum measured TVC reduction in pressure treated mussels was 2 log cycles.
Coliforms were absent in all samples including the controls. Pseudomonads were
reduced from 103 cfu/g to the limits of detection in 7 of 20 conditions. There was no
obvious pattern as to what conditions of pressure temperature and time gave optimal
inactivation for TVCs or pseudomonads. As was the case for Nephrops, this could be due
to the relatively small operating window used for processing, the natural raw material
variation or a combination of these factors. Whilst the microbiological data is of interest,
the primary aim of the trials was to investigate yield changes and shucking of the mussels
using pressure.

36 Wp Ref:secs/2008/FMT/CEL/KT06976
4.2.2 Yield/quality data
Run no. Weight
before
process (g)
Weight after
process (g)
Difference
(g)
Total weight of
30 mussels (g)
Weight of
meat
(g)
Yield based
on total
weight (%)
Yield based on
sum of meat and
shell weights
(%)
Control 1 No
Water * * * 334.9 129.8 38.76 45.70
Control 2
Water * * * 353.4 * * *
1 500.6 470.5 -30.1 339.5 192.4 56.67 58.06
2 505.0 475.4 -29.6 357.3 194 54.30 55.94
3 496.8 462 -34.8 313.9 174.4 55.56 56.88
4 510.0 467.8 -42.2 320.2 174.9 54.62 55.74
5 500.0 460.1 -39.9 359.5 196.3 54.60 56.10
6 504.0 490.6 -13.4 332.1 185.6 55.89 57.64
7 496.6 492.5 -4.1 341.2 184.6 54.10 57.29
8 503.0 502.4 -0.6 311.5 167.3 53.71 55.90
9 504.2 485.6 -18.6 354.4 194.9 54.99 56.67
10 499.2 486.9 -12.3 343.8 * * *
11 506.6 492.5 -14.1 333.4 174.2 52.25 53.97
12 495.2 466.7 -28.5 335.7 175.4 52.25 55.84
13 504.1 474.8 -29.3 324.3 173.7 53.56 55.66
14 510.5 * * 321 168.5 52.49 54.27
15 510.4 * * * * *
16 500.0 441.4 -58.6 286.9 153 53.33 54.68
17 512.0 476.6 -35.4 * 105.1 * 55.58
18 503.3 478.1 -25.2 297.1 160.8 54.12 55.95
19 503.9 444.5 -59.4 309.6 162 52.33 54.00
20 516.0 456.6 -59.4 328.5 198.7 60.49 59.47
Table 10. Mussels yield data
37 Wp Ref:secs/2008/FMT/CEL/KT06976
The overall weight of the samples was reduced significantly after treatment (P<0.05),
samples typically losing around 30g in weight after processing from a mean starting
weight of 503g. Up to 12% weight loss was measured in some samples after treatment,
which is thought to be due to liquor loss from the mussel once the shells opened and the
pressure was released. This is presumably the reason that commercial HPP processors of
shellfish shrink a band around the product to keep the shell closed after treatment.
Looking at the mussel meat in isolation, pressure treated samples on average gained in
weight by 34%. This figure is based on typical weights of 30 mussels post treatment
relative to the weight of 30 control mussels, i.e. it is not based on the pre-treatment
weight of the actual mussels that were pressure treated. This direct measurement was not
possible because a large sample was pressure treated and sub-samples were taken from
this for shucking and yield assessment. This weight increase is therefore indicative only.
The maximum recorded yield was 60% compared with a yield of 39% in the control
sample. Most conditions resulted in a substantial weight gain in the meat relative to the
controls (Table 10). Yield was always increased relative to the control (typically 50-60%
yield compared with 39% in the control), but there were not statistically significant
differences between treatments (P>0.05).
Mussels were readily shucked by HPP treatment with almost every treatment resulting in
a high percentage of the samples being completely detached by the pressure treatment
(Figure 5). In most cases, the shells of the mussels post process were free of visible meat
contamination.

38 Wp Ref:secs/2008/FMT/CEL/KT06976
Figure 5. Shucking of mussels as a function of pressure and time
4.2.3 Brief summary of sensory results for mussels
Controls and runs 1-6 were assessed for sensory quality. For each evaluation 9 mussels
were assessed. For the uncooked assessment all treated samples were consistently graded
higher than the Control, with Run 5 and Run 6 graded the highest. All treated samples
appeared plump and retained their shape much better than the Control. Run 5 and Run 6
were graded higher as they had a brighter appearance.
For the cooked assessment, again all treated samples were graded higher than the Control
with the exception of Run 6 which was graded equally. Appearance was important, along
with the texture. The treated samples retained their shape better, they were brighter and
were all slightly less chewy than the Control. Run 2 was graded higher as it had retained
its shape better than the other runs. Overall Run 2 appeared to be the treatment with the
0
3 3 0
3 00 3 0
2 7 0
6 0
0 .
90
2 4 01 .5
3 . 0 4 . 5
% S hucked
Ac tual pres sur e MPa
Ti me (mi n)
3D Scatte rp lot of % Sh ucke d vs A ctual pr es s ur e M P a vs T i me ( mi n )

39 Wp Ref:secs/2008/FMT/CEL/KT06976
most consistent effect on increasing sensory quality when compared to the Control
sample.
Images of all pressure treated samples can be found in Appendix 13.
4.2.4 Key conclusions for mussels
Pseudomonads were again found to be relatively pressure sensitive, being reduced to the
limits of detection in 7 of the 20 runs. This could prove useful for shelf life extension.
The main benefit from HPP treatment of mussels, however, was the ‘automatic’ shucking
that was achievable along with the increase in meat weight after processing. This effect
could also be used to introduce flavours into the product and produce value-added
products. Mussels were successfully shucked at almost all conditions tested. To prevent
liquor loss from the mussels post-process, it would be necessary to manually seal the
mussels shut in some way, i.e. as per the ‘gold-band’ commercial oyster products. The
effects of HPP on sensory quality appear to be favourable within the limits of the
conditions tested. Samples were perceived to be plump, attractive and less chewy than
the control
Mussels will not be taken forward for phase 2 trials. The main reason for this is that
phase 1 trials have proven the effectiveness of HPP for shucking within the processing
range of 200-300 MPa and it is believed therefore that ‘proof of principle’ has been
adequately assessed. There are microbiological benefits but automatic shucking is the
key benefit and this has been shown to work very effectively without deleterious effects
on sensory quality.

40 Wp Ref:secs/2008/FMT/CEL/KT06976
4.3 Oysters
Microbial reductions obtained for HPP treatment of oysters are reported in Table 11.
Yield data are reported in Table 12. Results for sensory evaluation are briefly
summarised in section 4.3.3 but are fully reported in Appendix 3.
4.3.1 Microbiological results
Run no. Pressure
(MPa)
Initial
product
temp.
(°C)
Product
temperature
after
processing
(°C)
Time
(min)
TVC/g TVC log
reduction
Coliforms
per g
Pseudomonas
per g
Control 1
No Water
0.1 * * 0 5.09E+02 0.0 3.09E+02 6.00E+02
Control 2
Water
0.1 * * 0 3.50E+02 0.2 8.00E+01 1.50E+02
1 273 13.6 12.1 2.5 9.27E+02 -0.3 2.00E+01 <50
2 304 13.7 10.1 1 3.50E+03 -0.8 1.50E+01 <50
3 240 12.4 10.2 1 1.50E+01 1.5 <5 <50
4 270 12.9 10.5 2.5 4.00E+01 1.1 <5 <50
5 238 11.9 10.6 4 3.50E+01 1.2 <5 5.00E+01
6 304 12.8 10.4 4 3.00E+01 1.2 <5 <50
7 273 11.9 9.4 5 7.00E+01 0.9 <5 <50
8 272 13.5 11 2.5 2.50E+01 1.3 <5 <50
9 274 11.3 11 2.5 <5 >2.0 <5 <50
10 269? 12.4 11.6 0 5.00E+00 2.0 <5 <50
11 272 12.9 11.9 2.5 1.25E+02 0.6 <5 <50
12 317 13 11.6 2.5 <5 >2.0 <5 <50
13 271 13.1 11.3 2.5 1.00E+01 1.7 <5 <50
14 219 13.4 * 2.5 3.50E+01 1.2 <5 <50
15 237 11.7 12.3 4 <5 >2.0 <5 <50
16 273 13.1 13 2.5 1.00E+01 1.7 <5 <50
17 302 15.3 12.4 1 4.50E+01 1.1 <5 <50
18 237 15.1 12.7 1 3.00E+01 1.2 <5 <50
19 270 15 12.1 2.5 <5 >2.0 <5 <50
20 304 13.8 12.5 4 <5 >2.0 <5 <50
Table 11. Oysters microbial reductions

41 Wp Ref:secs/2008/FMT/CEL/KT06976
Total viable counts were reduced from 102 cfu/g to the limits of detection in 5 of the 20
runs. Coliforms were reduced from 102 cfu/g to the limits of detection in 18 of the 20
runs. Pseudomonads were reduced from 102 cfu/g to the limits of detection in 19 of the
20 conditions. There was no obvious pattern as to what conditions of pressure,
temperature and time gave optimal inactivation for TVCs. As was found for Nephrops,
this could be due to the relatively small operating window used for processing, the natural
raw material variation or a combination of these factors.
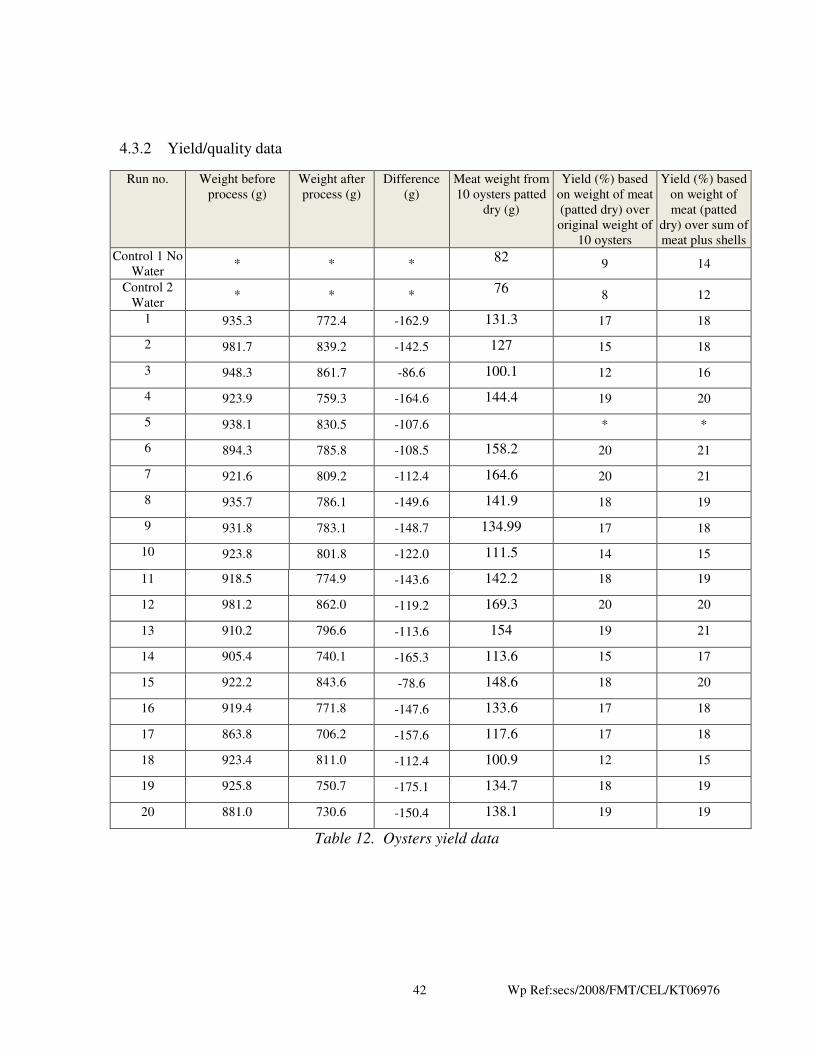
42 Wp Ref:secs/2008/FMT/CEL/KT06976
4.3.2 Yield/quality data
Run no. Weight before
process (g)
Weight after
process (g)
Difference
(g)
Meat weight from
10 oysters patted
dry (g)
Yield (%) based
on weight of meat
(patted dry) over
original weight of
10 oysters
Yield (%) based
on weight of
meat (patted
dry) over sum of
meat plus shells
Control 1 No
Water * * *
82 9 14
Control 2
Water * * *
76 8 12
1 935.3 772.4 -162.9 131.3 17 18
2 981.7 839.2 -142.5 127 15 18
3 948.3 861.7 -86.6 100.1 12 16
4 923.9 759.3 -164.6 144.4 19 20
5 938.1 830.5 -107.6 * *
6 894.3 785.8 -108.5 158.2 20 21
7 921.6 809.2 -112.4 164.6 20 21
8 935.7 786.1 -149.6 141.9 18 19
9 931.8 783.1 -148.7 134.99 17 18
10 923.8 801.8 -122.0 111.5 14 15
11 918.5 774.9 -143.6 142.2 18 19
12 981.2 862.0 -119.2 169.3 20 20
13 910.2 796.6 -113.6 154 19 21
14 905.4 740.1 -165.3 113.6 15 17
15 922.2 843.6 -78.6 148.6 18 20
16 919.4 771.8 -147.6 133.6 17 18
17 863.8 706.2 -157.6 117.6 17 18
18 923.4 811.0 -112.4 100.9 12 15
19 925.8 750.7 -175.1 134.7 18 19
20 881.0 730.6 -150.4 138.1 19 19
Table 12. Oysters yield data
43 Wp Ref:secs/2008/FMT/CEL/KT06976
The overall weight of all pressure treated samples was reduced after processing
(Table 12) but as for mussels, this is thought to be due to liquor loss because the samples
were not sealed prior to treatment. There was a lot of residual water on the control
samples relative to the pressure treated so in order to get a consistent yield measurement,
the meat of all samples was patted dry prior to weighing. Yield increases were
significant in all pressure treated samples with yields being on average 16% in pressure
treated samples compared with 9% for the controls. The weigh of meat from 10 oysters
was on average 135g in pressure treated samples compared with 79g in the controls, i.e.
an increase of around 71%. Anecdotal evidence would suggest that in some countries,
e.g. the USA, this increase in volume is seen as a positive benefit because the oysters are
larger and are viewed as more succulent. However, in other markets, e.g. Japan, the
‘swelling’ of the oyster is seen as a negative impact on the product (personal
communication with NC Hyperbaric and Avure). Pressure and time both significantly
(P<0.05) influenced the weight of the oysters after processing with time appearing to be
particularly important in determining the final weight of the oyster, but a quadratic model
was not appropriate to predict weight gain. Temperature was not significant (P>0.05).
Pressure and time could both be manipulated to control the level of ‘swelling’ to match
the requirements of the target market.

44 Wp Ref:secs/2008/FMT/CEL/KT06976
320300280260240220
170
160
150
140
130
120
110
100
Actual pressure Mpa
Weight of meat dryed
0.0
1.0
2.5
4.0
5.0
(min)
Time
Figure 6. Influence of pressure and time on the weight of oysters after processing
Pressure and time both influenced the percentage of oysters shucked by a particular
process (Figure 7) (P<0.05), but a quadratic surface response was not a suitable model for
shucking. There was variation in ‘% shucked’ even at the same processing conditions;
this variation is not thought to be due to process variation but is thought to be due to the
relatively subject assessment of ‘shucked’ compared with ‘un-shucked’. In reality, there
was a spectrum of attachment from ‘firm’ to completely detached. Only samples where
there was complete detachment of the meat were considered to be ‘shucked’ in the visual
assessment. Many of the conditions resulted in a level of detachment whereby it seemed
likely that all of the meat could have been subsequently removed by, for example, a
vibrating belt. As a general point, oysters were, in general, harder to shuck completely
compared with mussels.

45 Wp Ref:secs/2008/FMT/CEL/KT06976
Figure 7. Influence of pressure and time on % oysters shucked
4.3.3 Brief summary of sensory results for oysters
Controls and runs 1-6 were assessed for sensory quality. For each evaluation eight
oysters were assessed. For the uncooked assessment all the treated samples were graded
higher than the Control, with Run 4 being graded the highest. All samples were brighter
than the Control, very plump with little shape loss and all had a stronger fresh odour.
For the cooked assessment, Run 1, Run 5 and Run 6 were all graded higher than the
Control as they were all plump with little shape loss and all had a stronger fresh odour.
Run 1 was also described as brighter than the Control and less gritty. Run 4 was graded
the lowest for the cooked assessment due to the presence of an off odour. Overall, Runs
1 and 6 appeared to be the treatments with the most consistent effect on increasing
sensory quality when compared to the Control sample.

46 Wp Ref:secs/2008/FMT/CEL/KT06976
Images of all pressure treated samples can be found in Appendix 14.
4.3.4 Key conclusions for Oysters
Many of the conclusions made for mussels are applicable to oysters. Coliforms and
Pseudomonads were found to be very pressure sensitive in oysters. This could prove
useful for shelf life extension. The main benefit from HPP treatment, however, was the
‘automatic’ shucking that was achievable along with the increase in meat weight after
processing. This effect could also be used to introduce flavours into the product and
produce value-added products. Oysters could be successfully shucked using HPP but
were generally more difficult to shuck compared with mussels in the sense that there was
usually some level of light attachment after processing. As for mussels, to prevent liquor
loss post-process, it would be necessary to manually seal the oyster shut in some way,
e.g.. as per the ‘gold-band’ commercial oyster products. The effects of HPP on sensory
quality appear to be favourable within the limits of the conditions tested. Samples were
perceived to be plump, attractive and having ‘fresh’ odours.
Oysters will not be taken forward for phase 2 trials. The main reason for this is that
phase 1 trials have proven the effectiveness of HPP for shucking within the processing
range of 200-300 MPa and it is believed therefore that ‘proof of principle’ has been
adequately assessed. There are microbiological benefits but automatic shucking is the
key benefit and this has been shown to work very effectively without deleterious effects
on sensory quality.

47 Wp Ref:secs/2008/FMT/CEL/KT06976
4.4 Crab
Microbial reductions obtained for HPP treatment of crab are reported in Table 13. Yield
data are reported in Table 14. Results for sensory evaluation are briefly summarised in
section 4.4.3 but are fully reported in Appendix 4.
4.4.1 Microbiological results
Run no. Pressure
(MPa)
Initial
product
temp. (°C)
Product
temp. after
processing
(°C)
Time
(min)
TVC
(per g)
TVC log
reduction
Coliforms
(per g)
Pseudomonads
(per g)
Control 1 Cooked 0. 1 * * 0 8.0E+03 0.0 <5 2.00E+02
Control 2 Raw 0.1 * * 0 7.1E+03 0.1 1.00E+01 <50
1 273 * 12.1 2.5 5.1E+03 0.2 <5 <50
2 301 14.3 13.3 1 1.5E+04 -0.3 <5 <50
3 238 10.4 12.8 1 9.2E+04 -1.1 1.20E+02 1.80E+03
4 272 * 13 2.5 1.5E+05 -1.3 7.50E+02 1.10E+03
5 237 13.9 12.3 4 4.8E+04 -0.8 2.45E+02 8.00E+02
6 * 14.6 12.3 4 4.0E+04 -0.7 1.18E+02 1.50E+03
7 270 16.2 12.8 5 1.4E+03 0.8 <5 <50
8 270 15 13 2.5 4.3E+04 -0.7 1.00E+01 <50
9 271 15.2 13.1 2.5 1.8E+03 0.6 <5 <50
10 268 16.1 14.5 0 2.5E+03 0.5 <5 <50
11 273 16.2 13.6 2.5 2.5E+03 0.5 <5 <50
12 319 16 13.7 2.5 1.9E+03 0.6 <5 <50
13 271 12.4 13.2 2.5 4.4E+03 0.3 3.00E+01 2.00E+02
14 221 15.2 13.2 2.5 3.7E+02 1.3 5.00E+00 2.50E+02
15 239 13.7 12.5 4 2.5E+03 0.5 <5 <50
16 271 15.2 12.8 2.5 3.4E+03 0.4 <5 3.80E+03
17 304 16.2 14.1 1 4.2E+03 0.3 2.04E+02 2.50E+03
18 239 14.8 13.1 1 5.2E+03 0.2 8.50E+01 3.00E+02
19 271 14.2 14 2.5 1.6E+03 0.7 <5 2.00E+02
20 301 15.9 13.2 4 6.3E+02 1.1 <5 <50
Table 13. Crab microbial reductions

48 Wp Ref:secs/2008/FMT/CEL/KT06976
The maximum reduction of TVCs in crab was 1.3 log cycles. This low level of
inactivation could have been due to the method of handling the claws as it was not
practical to pick the meat aseptically. However, it should also be noted that the pressures
used in these studies were low for pasteurisation applications and it is well known that
pressure resistance can vary considerably according to the food substrate. Coliforms
were reduced from 101 cfu/g to the limits of detection in 11 of the 20 runs but were
present at levels of up to 102 cfu/g in some of the treated samples. Pseudomonads were
absent in the control and in 10 of the 20 conditions tested. They were present at up to
103 cfu/g in some samples. It seems likely that considerable variation in the
microbiological counts in the raw material masked any differences between processing
runs.
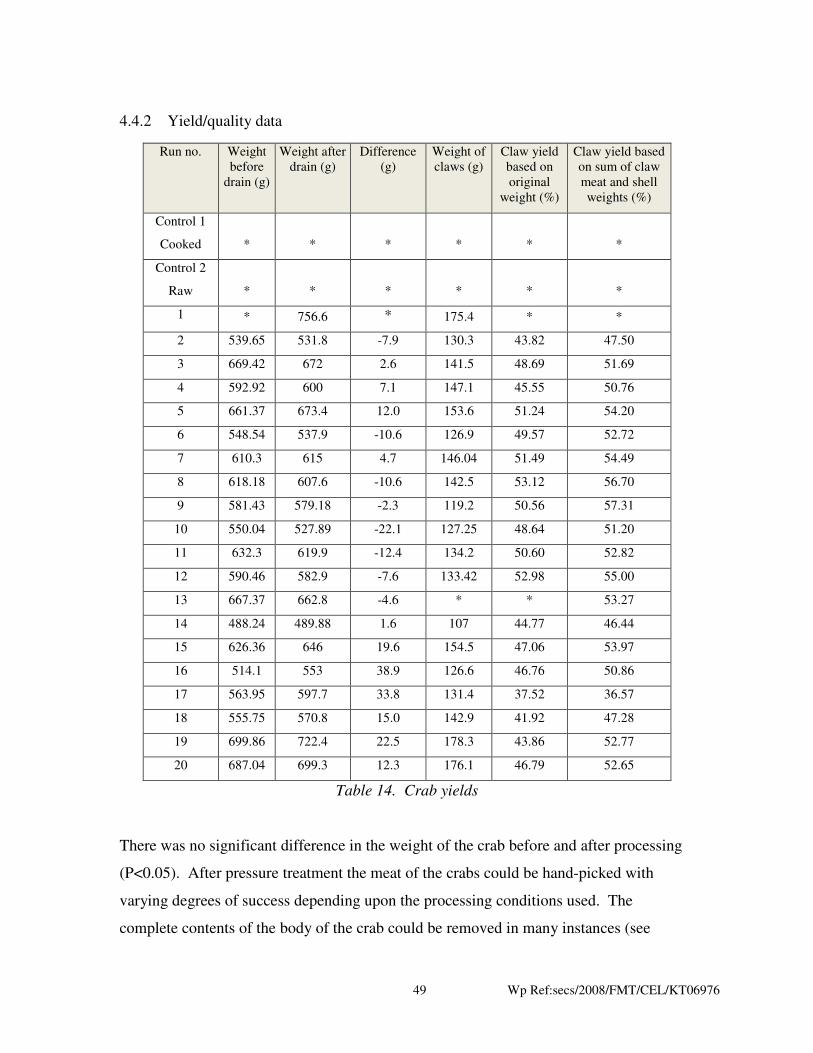
49 Wp Ref:secs/2008/FMT/CEL/KT06976
4.4.2 Yield/quality data
Run no. Weight
before
drain (g)
Weight after
drain (g)
Difference
(g)
Weight of
claws (g)
Claw yield
based on
original
weight (%)
Claw yield based
on sum of claw
meat and shell
weights (%)
Control 1
Cooked * * * * * *
Control 2
Raw * * * * * *
1 * 756.6 * 175.4 * *
2 539.65 531.8 -7.9 130.3 43.82 47.50
3 669.42 672 2.6 141.5 48.69 51.69
4 592.92 600 7.1 147.1 45.55 50.76
5 661.37 673.4 12.0 153.6 51.24 54.20
6 548.54 537.9 -10.6 126.9 49.57 52.72
7 610.3 615 4.7 146.04 51.49 54.49
8 618.18 607.6 -10.6 142.5 53.12 56.70
9 581.43 579.18 -2.3 119.2 50.56 57.31
10 550.04 527.89 -22.1 127.25 48.64 51.20
11 632.3 619.9 -12.4 134.2 50.60 52.82
12 590.46 582.9 -7.6 133.42 52.98 55.00
13 667.37 662.8 -4.6 * * 53.27
14 488.24 489.88 1.6 107 44.77 46.44
15 626.36 646 19.6 154.5 47.06 53.97
16 514.1 553 38.9 126.6 46.76 50.86
17 563.95 597.7 33.8 131.4 37.52 36.57
18 555.75 570.8 15.0 142.9 41.92 47.28
19 699.86 722.4 22.5 178.3 43.86 52.77
20 687.04 699.3 12.3 176.1 46.79 52.65
Table 14. Crab yields
There was no significant difference in the weight of the crab before and after processing
(P<0.05). After pressure treatment the meat of the crabs could be hand-picked with
varying degrees of success depending upon the processing conditions used. The
complete contents of the body of the crab could be removed in many instances (see
50 Wp Ref:secs/2008/FMT/CEL/KT06976
Figure 8). The highest picking yield was 53%, found in runs 8 and 12 (250 MPa, 2.5
mins, 15°C and 300 MPa, 2.5 mins, 16°C respectively). Picking of raw crab for
comparative yield values with picked pressure treated crabs was not possible. We do not
have commercial yield data for picking of cooked crabs so we cannot assess whether a
53% picking yield in the claws is significant relative to conventional cooking and
picking. This question will be addressed more fully in phase 2 trials.
Run 8 gave the best picking yields and best visual appearance after processing (Figure 9).
However, replicate processes at the same pressure and time gave variable results for
picking (Figure 10). This variation could be due to ease of product picking, being highly
susceptible to temperature changes (e.g. picking at 16.2°C or 12.4°C gave poor results
compared with picking at 15°C) or it could be due to variation in the raw materials. It
was not possible to identify statistically significant differences between claw yields
between processing conditions.
As a general though subjective point, it appeared that when removing the legs of the crab
after processing, more meat could be removed from the purse. This finding, if
transferrable to industrial operations, could be commercially significant because ‘intact’
purse meat commands a higher value than mechanically recovered purse meat.

51 Wp Ref:secs/2008/FMT/CEL/KT06976
Figure 8. Body of crab removed after pressure treatment
Figure 9. Run 8 hand-picked claw meat after treatment

52 Wp Ref:secs/2008/FMT/CEL/KT06976
Figure 10. Run 11 hand-picked claw meat after treatment
4.4.3 Brief summary of sensory results for crab.
Controls and runs 1-6 were assessed for sensory quality. Two crab claws were assessed
for each sample. For the uncooked assessment there was no Control sample for
comparison. Run 1 and Run 4 were graded the highest, with less shape loss than the
other samples. Run 2 was graded the lowest, with the most noticeable shape loss.
For the cooked assessment, none of the runs was graded as high as the Control. Run 3
had the highest grade, with a very fresh odour, and strong crab notes, with only slight loss
of shape. Run 2 was graded the lowest, with marked loss of shape, and very slight bitter
notes.
Images of all pressure treated samples can be found in Appendix 15.

53 Wp Ref:secs/2008/FMT/CEL/KT06976
4.4.4 Key conclusions for crab
Reductions in total viable counts were low; this could be due to practical limitations in
terms of handling the product after picking but could also be due to raw material
variation. The highest picking yield was 53%, found in runs 8 and 12 (250 MPa, 2.5
mins, 15°C and 300 MPa, 2.5 mins, 16°C respectively) but no comparative picking yields
could be taken on raw crabs. There was some run-to-run variability as to ease of picking
and larger scale studies are required to assess the yield benefits achievable using HPP.
As a general though subjective point, it appeared that when removing the legs of the crab
after processing, more meat could be removed from the purse. This finding, if
transferrable to industrial operations, could be commercially significant because ‘intact’
purse meat commands a higher value than mechanical recovered purse meat.
None of the samples from runs 1-6 matched the cooked sensory quality of the control but
run 3 was still considered to be good quality. Interestingly, run 3 was the lowest pressure
treatment of the 6 runs and also had a short hold time. The more severe treatments scored
lower in terms of sensory quality and ‘eggy’ notes were sometimes reported.
Crab has been selected for further work in phase 2. A process of 250 MPa for 2.5
minutes is proposed for the studies as this gave the best picked appearance of the trial
samples. A large batch (50-100 kg) of crabs will be pressure treated and then picked
along-side conventionally processed crabs to determine whether there are significant
yield benefits to be gained from using HPP.

54 Wp Ref:secs/2008/FMT/CEL/KT06976
4.5 Cold water prawns
Microbial reductions obtained for HPP treatment of cold water prawns are reported in
Table 15. Yield data are reported in Table 16. Results for sensory evaluation are briefly
summarised in section 4.5.3 and are fully reported in Appendix 5.
4.5.1 Microbiological results
Run No. Pressure
(MPa)
Initial
product
temp
(°C)
Product temp
after
processing
(°C)
Time
(min)
TVC
per g
TVC log
reduction
Coliforms
per g
Pseudomonas
per g
Control
Brined
0.1 MPa * * * 1.60E+03 0.0 <5 <50
1 273 3.9 9.8 2.5 1.05E+02 1.2 <5 <50
2 302 11.3 12.7 1 5.50E+01 1.5 <5 <50
3 237 0.5 5.2 1 5.50E+01 1.5 <5 <50
4 270 6.6 10 2.5 4.00E+01 1.6 <5 <50
5 237 1.6 11 4 5.00E+00 2.5 <5 <50
6 298 * 8.7 4 6.00E+01 1.4 <5 <50
7 272 7 11.6 5 4.00E+01 1.6 <5 <50
8 270? 4.1 11.6 2.5 4.50E+01 1.6 <5 <50
9 270 6.3 12.4 2.5 1.50E+01 2.0 <5 <50
10 272 9 14.4 0 1.35E+02 1.1 <5 <50
11 270? 10.2 14.1 2.5 7.50E+01 1.3 <5 <50
12 321 10.1 14.8 2.5 6.50E+01 1.4 <5 <50
13 270 17.5 16.4 2.5 5.00E+01 1.5 <5 <50
14 223 * 17.1 2.5 1.15E+02 1.1 <5 <50
15 233 3.3 15.2 4 4.50E+01 1.6 <5 <50
16 246 17.1 17.3 2.5 3.00E+01 1.7 <5 <50
17 285 3.3 7.9 1 2.00E+01 1.9 <5 <50
18 237 17 16.3 1 5.00E+00 2.5 <5 <50
19 272 11 15.9 2.5 1.00E+01 2.2 <5 <50
20 299 15.1 17.3 4 5.50E+01 1.5 <5 <50
Table 15. Cold water prawns microbial reductions

55 Wp Ref:secs/2008/FMT/CEL/KT06976
The maximum reduction in total viable count was 2.5 log cycles. This was achieved in
runs 5 and 18 using 237 MPa for 4 and 1 minute respectively. The initial product
temperature for run 5 was 1.6°C compared with 17.1°C in run 18. Coliforms and
pseudomonads were at non-detectable levels in the control and all treated samples. Log
TVC reductions could not be predicted as a function of pressure, temperature and time
using linear or quadratic terms (P>0.05). Again this could be due to variation in raw
materials but is more likely to be due to the fact that pressure treatments were conducted
over a very narrow pressure range.

56 Wp Ref:secs/2008/FMT/CEL/KT06976
4.5.2 Yield/quality data
Run No. Weight
before
drain
(g)
Weight
after drain
(g)
Difference
(g)
Weight of 30
prawns (g)
Yield based on
original weight
(%)
Yield based on sum of meat
and shell weights (%)
Control 1 Brined * * * 157.2 43.96 45.61
1 596.26 465.7 130.6 156.4 44.05 45.96
2 576 433 143.0 153.7 45.28 46.74
3 543 358.5 184.5 * * 45.79
4 545 451.6 93.4 139.2 45.26 46.43
5 563 369 194.0 145.6 45.95 48.03
6 460 383.6 76.4 148 42.91 43.52
7 456 351.1 104.9 164.3 44.00 45.13
8 437 328.9 108.1 156.5 45.11 46.45
9 604 371.6 232.4 138 45.22 45.92
10 558 496.8 61.2 153.1 43.96 45.29
11 458 382.4 75.6 139.7 45.38 45.38
12 536 496.9 39.1 161.7 44.84 44.84
13 536 541.8 -5.8 152.9 45.59 45.59
14 452 410.9 41.1 166.5 38.74 38.74
15 570 515.5 54.5 164.4 39.59 39.59
16 437 376.5 60.5 152.4 45.14 45.14
17 546 463.7 82.3 166.1 44.61 44.61
18 486 508.8 -22.8 167 44.79 44.79
19 611 568.9 42.1 164.6 43.32 43.32
20 677 587 90.0 161.8 45.36 45.36
Table 16. Cold water prawns yield data
57 Wp Ref:secs/2008/FMT/CEL/KT06976
Peeling yield varied between 39% and 46% for the pressure treated samples but was on
average 44%, i.e. the same as the brined control. A 2% increase in yield would be
commercially significant, i.e. if 46% could be consistently achieved compared with 44%
using normal production methods, but it is difficult to determine whether these yield
increases are genuine or are within the measurement errors inherent in the manual peeling
process. Examination of the sample images from the trials would suggest that the very
tip of the prawn was more frequently extracted compared with the control samples and
therefore the yield increases could be genuine. Larger scale trials on commercial peeling
equipment would be required in order to give a more objective measure of peeling
benefits because the apparent yield increase is relatively small.
There was a statistically significant weight loss in cold water prawns after pressure
treatment (P<0.05), the average weight across runs before processing being 532.4g and
after being 443.1g.
4.5.3 Brief summary of sensory results for cold water prawns
Controls and runs 1-6 were assessed for sensory quality. For each evaluation
approximately 60g of prawns were assessed. For the uncooked assessment none of the
runs were graded higher than the Control. Run 1 was graded equal to the Control sample,
and all other Runs were graded lower than the Control, with Run 6 achieving the lowest
grade. This was due to less retention of the tip end, and more shape loss.
For the cooked assessment, the Control, Run 1 and Run 2 were graded the highest. The
other runs were all graded as ‘Just Acceptable’ due to some eggy notes in the odour, and
less prawn flavour.
Images of all pressure treated samples can be found in Appendix 16.

58 Wp Ref:secs/2008/FMT/CEL/KT06976
4.5.4 Key conclusions for cold water prawns
Total viable counts could be reduced by up to 2.5 log cycles but no conclusions could be
drawn regarding the HPP sensitivity of coliforms and pseudomonds because they were
absent in all samples including the controls. Average peeling yields across all 20 runs
were no better than the control but yield increases of up to 2% were achieved in some
runs. Large scale peeling trials would be required to determine whether this potential
yield benefit was transferrable to commercial processing. The sensory quality of HPP
treated prawns can match that of conventional processing.
Cold water prawns are not being taken forward to phase 2. The results of warm water
prawns are likely to inform processors as to potential benefits for cold water prawns. A
second reason for the omission of cold water prawns from phase 2 is that they are a very
high volume, relatively low price product and are therefore less suitable for HPP
processing compared with warm water prawns. This latter product is relatively low
volume but high value so processing economics are likely to be more favourable. HPP
processing can currently only achieve something in the region of 1-2 tonnes per hour per
machine so is more likely to be able to match the required production volumes.
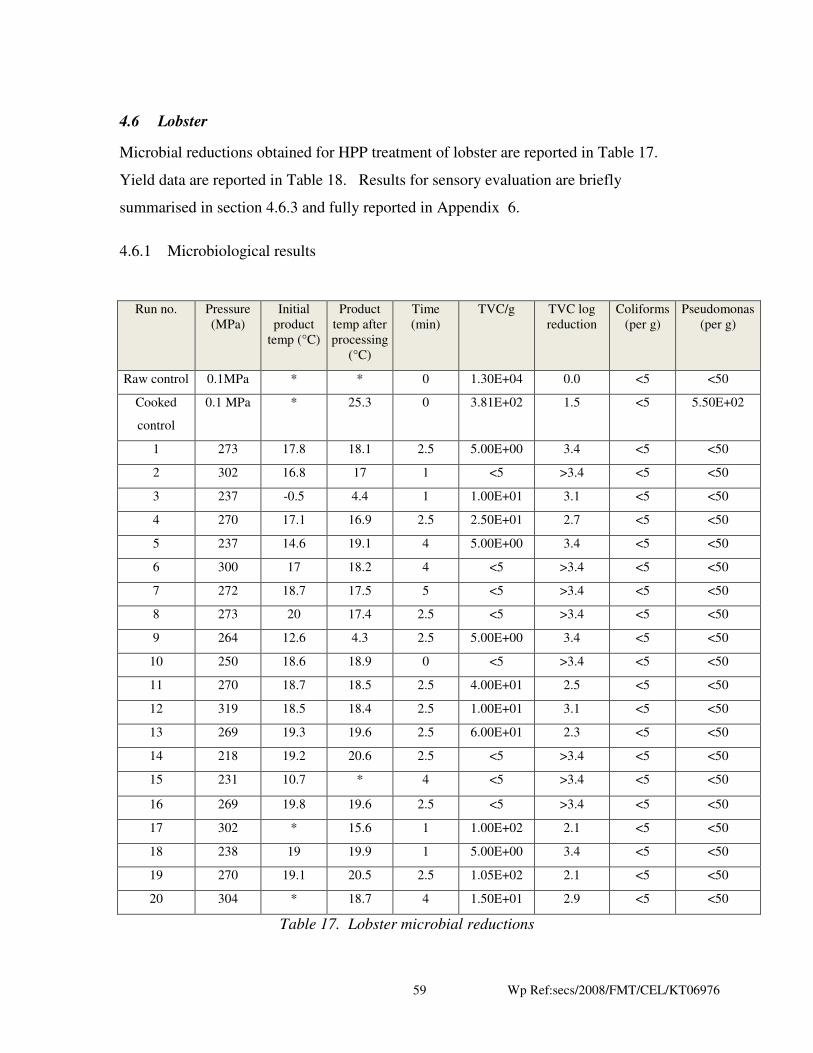
59 Wp Ref:secs/2008/FMT/CEL/KT06976
4.6 Lobster
Microbial reductions obtained for HPP treatment of lobster are reported in Table 17.
Yield data are reported in Table 18. Results for sensory evaluation are briefly
summarised in section 4.6.3 and fully reported in Appendix 6.
4.6.1 Microbiological results
Run no. Pressure
(MPa)
Initial
product
temp (°C)
Product
temp after
processing
(°C)
Time
(min)
TVC/g TVC log
reduction
Coliforms
(per g)
Pseudomonas
(per g)
Raw control 0.1MPa * * 0 1.30E+04 0.0 <5 <50
Cooked
control
0.1 MPa * 25.3 0 3.81E+02 1.5 <5 5.50E+02
1 273 17.8 18.1 2.5 5.00E+00 3.4 <5 <50
2 302 16.8 17 1 <5 >3.4 <5 <50
3 237 -0.5 4.4 1 1.00E+01 3.1 <5 <50
4 270 17.1 16.9 2.5 2.50E+01 2.7 <5 <50
5 237 14.6 19.1 4 5.00E+00 3.4 <5 <50
6 300 17 18.2 4 <5 >3.4 <5 <50
7 272 18.7 17.5 5 <5 >3.4 <5 <50
8 273 20 17.4 2.5 <5 >3.4 <5 <50
9 264 12.6 4.3 2.5 5.00E+00 3.4 <5 <50
10 250 18.6 18.9 0 <5 >3.4 <5 <50
11 270 18.7 18.5 2.5 4.00E+01 2.5 <5 <50
12 319 18.5 18.4 2.5 1.00E+01 3.1 <5 <50
13 269 19.3 19.6 2.5 6.00E+01 2.3 <5 <50
14 218 19.2 20.6 2.5 <5 >3.4 <5 <50
15 231 10.7 * 4 <5 >3.4 <5 <50
16 269 19.8 19.6 2.5 <5 >3.4 <5 <50
17 302 * 15.6 1 1.00E+02 2.1 <5 <50
18 238 19 19.9 1 5.00E+00 3.4 <5 <50
19 270 19.1 20.5 2.5 1.05E+02 2.1 <5 <50
20 304 * 18.7 4 1.50E+01 2.9 <5 <50
Table 17. Lobster microbial reductions

60 Wp Ref:secs/2008/FMT/CEL/KT06976
Total viable counts were reduced from 104 cfu/g to the limits of detection in 8 of the 20
process conditions but there were no clear optimum conditions. For example, the
maximum recorded pressure did not result in the maximum level of inactivation as would
typically be expected. Coliforms and pseudomonads were absent in all samples
(including the control) apart from the cooked control where pseudomonads were found at
102 cfu/g. This is thought to be due to experimental error because a core temperature of
90°C was recorded when cooking the control lobster. As in the data for the previously
reported species, differences between runs as a function of pressure, temperature and time
appear to be being masked by raw material variation and the narrow range of pressure
conditions tested.

61 Wp Ref:secs/2008/FMT/CEL/KT06976
4.6.2 Yield/quality data
Run no. Weight
before
drain (g)
Weight
after
drain (g)
Difference
(g)
Weight of
claws(g)
Claw yield
based on
original
weight of
claws (%)
Claw yield
based on sum
of claw meat
and shell
weights (%)
Tail yield
based on
original
weight of
tail
Tail yield
based on sum
of tail meat
and shell
weights
Raw control * * * * * * * *
Cooked
control * 740 * 320 42.19
47.37
*
70.37
1 720.8 765.7 6.23 * * 63.64 72.22 72.22
2 710.2 750 5.60 115 61.74 63.39 72.62 72.62
3 708.8 753 6.24 107 57.01 61.00 69.27 *
4 731.8 794 8.50 115 62.61 65.45 74.40 76.22
5 675.5 709.3 5.00 114 54.39 54.39 69.68 73.06
6 753 785 4.25 117 62.39 64.04 76.16 75.72
7 708 744 5.08 * * 56.45 77.34 76.74
8 643 683 6.22 102 62.75 62.75 74.21 75.64
9 738.8 760.4 2.92 98 52.04 60.00 65.05 73.33
10 743.7 779.5 4.81 111 64.86 66.06 76.92 77.38
11 689.9 725 5.09 109 60.55 63.46 72.83 75.28
12 725 753 3.86 104 50.00 58.43 68.48 75.84
13 723.6 755 4.34 99 50.51 57.47 63.44 69.41
14 741.2 781 5.37 125 57.60 62.07 70.41 74.38
15 746.2 785 5.20 106 61.32 63.11 69.54 73.26
16 756.4 780.5 3.19 109 61.47 62.62 73.13 75.48
17 760.7 792 4.11 102 * * 61.08 71.97
18 688 724 5.23 115 58.70 62.15 * 77.84
19 761.6 779 2.28 128 50.55 54.97 71.43 72.94
20 716.3 754 5.26 114 55.12 61.10 74.12 75.45
Table 18. Lobster yield data

62 Wp Ref:secs/2008/FMT/CEL/KT06976
Yield on lobster claws ranged between 50 and 65% and was on average 58% compared
with a yield on a cooked control of 42%. Yield of lobster tails ranged between 61% and
71%; a control yield on cooked lobster tail was not taken. It was not possible to measure
picking yield on raw lobsters. Differences between treated samples in tail and claw yield
were not statistically significant (P>0.05) but tail and claw yields appeared to fall into
two populations, yield increasing substantially at pressures of greater than 270 MPa, but
some deviations from this general trend were observed (Figure 11 and Figure 12).
2
330
300
60 70
65
70
75
0.0 2401.5
3.04.5
Tail yield (%)
Pressure MPa
Time (min)
Figure 11. Yield on lobster tails as a function of pressure and time.
Meat yield from the lobster legs was explored in 3 of the 20 runs and compared with the
cooked control. Whereas only 8% of the leg weight could be extracted as meat in the
cooked control, a yield of 39-44% was achievable in the pressure treated samples. The
leg meat could simply be squeezed out of the leg and this could probably be achieved
mechanically in a commercial process. Complete extraction of the lobster was attempted
for one run only (run 17) but was readily achieved. As was the case for crab, meat

63 Wp Ref:secs/2008/FMT/CEL/KT06976
extraction from all parts of the lobster was straightforward but some care was needed in
order to extract the meat in whole pieces.
330
30050
2
0
70
55
60
0.
65
2401.5
3.04.5
Claw yield (%)
Pressure MPa
Time (min)
Figure 12. Yield on lobster claws as a function of pressure and time
4.6.3 Brief summary of sensory results for lobster
Controls and runs 1-6 were assessed for sensory quality. For the uncooked assessment
there was no Control sample for comparison. Run 1 and Run 5 were graded the highest,
with bright clean, white flesh and no loss of shape. Run 2, Run 3 and Run 6 were graded
the lowest, with some grey tints in the flesh, and some loss of shape, which was most
noticeable in Run 3, which showed complete breakdown.
For the cooked assessment, four runs were graded higher than the Control, which was
found to be very fibrous, chewy and rubbery in texture. Runs 1 and 4 were graded the
highest, with bright, clean flesh, slightly sweet fresh lobster flavour, and some
64 Wp Ref:secs/2008/FMT/CEL/KT06976
fibrousness. Run 2 and Run 5 were also graded higher than the Control, with moderately
bright flesh, with only slight yellow or grey tints. Run 3 and Run 6 were graded the
lowest, both with some sewage/skatole notes in the odour, and complete shape loss in
Run 3.
Images of all pressure treated samples can be found in Appendix 17.
4.6.4 Key conclusions for lobster
Substantial reductions in total viable counts were suggested in some experimental runs,
i.e. control samples had 104 cfu/ml and TVCs were reduced to non-detectable levels in
some runs. There may of course be an element of sample-to-sample variation in terms of
the initial microbial loading. Yield on lobster claws was up to 23% higher than cooked
controls but this data did not take in to account cooking losses that could have occurred in
the control sample. In general, pressures of greater than 270 MPa gave better results for
tail yield. Indications from the work are that overall picking yields from lobsters could
be enhanced significantly because meat could be readily extracted even from the legs –
gentle squeezing was sufficient to remove the meat. Sensory evaluation by a trained
panel suggested that in many instances HPP treated lobster was considered to be higher
quality than the control. Although the results from the lobster work were positive and
very interesting, this product is not being taken forward to phase 2. This is because the
findings from crab are expected to be transferrable to lobster.

65 Wp Ref:secs/2008/FMT/CEL/KT06976
4.7 Warm water prawns
Microbial reductions obtained for HPP treatment of warm water prawns are reported in
Table 19. Yield data are reported in Table 20. Results for sensory evaluation are briefly
summarised in 4.7.3 and fully reported in Appendix 7.
4.7.1 Microbiological results
Run No. Pressure
(MPa)
Initial
product temp
(°C)
Product temp
after
processing
(°C)
Time
(min)
TVC/g TVC log
reduction
Coliforms
(per g)
Pseudomonas
(per g)
Control 1
Brined
0.1 MPa -0.5 * 0 2.00E+03 0.0 1.50E+01 <50
1 273 8.3 14.3 2.5 6.72E+02 0.5 <5 <50
2 300 9.4 14.6 1 1.63E+02 1.1 <5 <50
3 237 8.9 3.3 1 3.68E+02 0.7 <5 <50
4 273 1.7 11.4 2.5 1.31E+02 1.2 <5 <50
5 239 11.8 13.5 4 1.05E+02 1.3 <5 <50
6 297 2.3 5.5 4 4.50E+01 1.6 <5 <50
7 271 * 13.3 5 1.45E+02 1.1 <5 <50
8 272 4.5 14.7 2.5 7.00E+01 1.5 <5 <50
9 264 7.8 5.2 2.5 1.77E+02 1.1 <5 <50
10 227 7.9 14.5 0 3.54E+02 0.8 <5 <50
11 236 11.1 13.9 2.5 4.86E+02 0.6 3.5 <50
12 315 10.8 14.6 2.5 1.00E+01 2.3 2.9 <50
13 268 10.3 16.3 2.5 1.10E+02 1.3 3.2 <50
14 219 * 15.2 2.5 3.20E+02 0.8 3.4 <50
15 233 10.2 6.4 4 2.45E+02 0.9 3.3 <50
16 273 12.6 16.1 2.5 2.36E+02 0.9 3.3 <50
17 300 11.1 12.9 1 2.54E+02 0.9 3.3 <50
18 238 12.8 16.5 1 2.63E+02 0.9 3.4 <50
19 272 14.1 16.4 2.5 1.25E+02 1.2 3.2 <50
20 299 16.2 * 4 8.00E+01 1.4 3.2 <50
Table 19. Warm water prawns microbial reductions
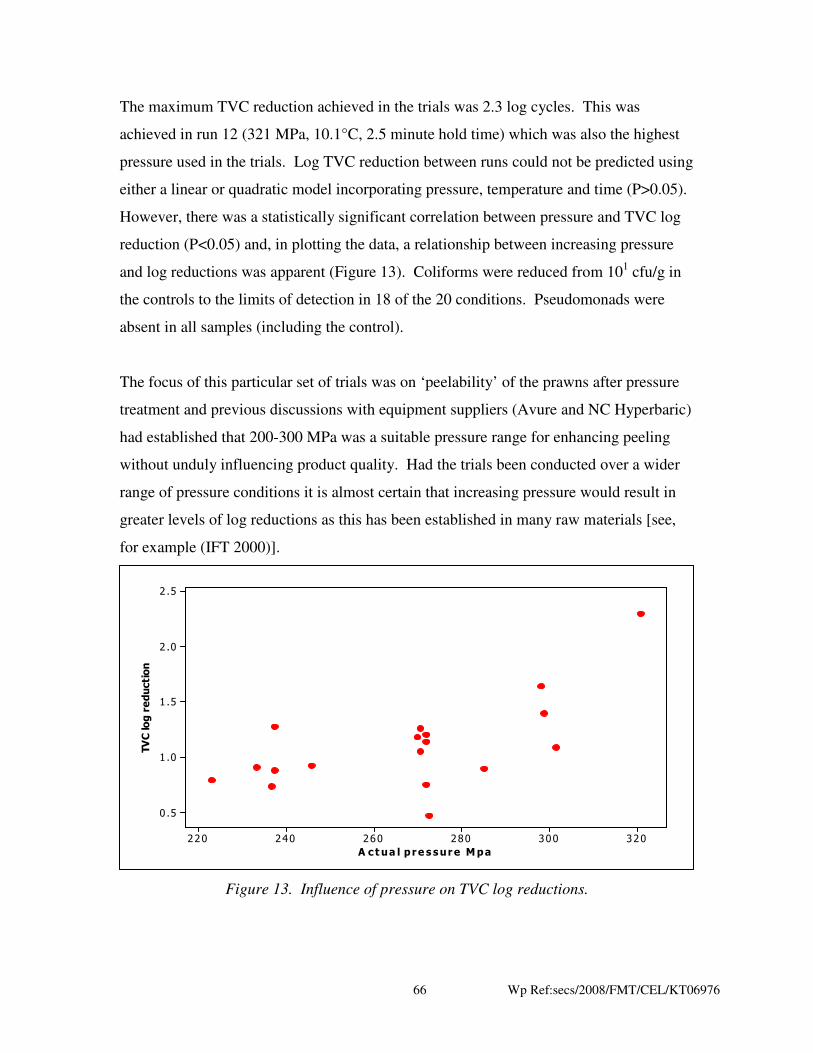
66 Wp Ref:secs/2008/FMT/CEL/KT06976
The maximum TVC reduction achieved in the trials was 2.3 log cycles. This was
achieved in run 12 (321 MPa, 10.1°C, 2.5 minute hold time) which was also the highest
pressure used in the trials. Log TVC reduction between runs could not be predicted using
either a linear or quadratic model incorporating pressure, temperature and time (P>0.05).
However, there was a statistically significant correlation between pressure and TVC log
reduction (P<0.05) and, in plotting the data, a relationship between increasing pressure
and log reductions was apparent (Figure 13). Coliforms were reduced from 101 cfu/g in
the controls to the limits of detection in 18 of the 20 conditions. Pseudomonads were
absent in all samples (including the control).
The focus of this particular set of trials was on ‘peelability’ of the prawns after pressure
treatment and previous discussions with equipment suppliers (Avure and NC Hyperbaric)
had established that 200-300 MPa was a suitable pressure range for enhancing peeling
without unduly influencing product quality. Had the trials been conducted over a wider
range of pressure conditions it is almost certain that increasing pressure would result in
greater levels of log reductions as this has been established in many raw materials [see,
for example (IFT 2000)].
320300280260240220
2 .5
2 .0
1 .5
1 .0
0 .5
A ctua l p re s sure Mpa
TVC log reduction
Figure 13. Influence of pressure on TVC log reductions.

67 Wp Ref:secs/2008/FMT/CEL/KT06976
4.7.2 Yield/quality data
Run No. Weight
before
drain (g)
Weight
after drain
(g)
Difference
(g)
Weight of
10 prawns(g)
Yield based on
original weight
(%)
Yield based on
sum of meat
and shell
weights (%)
Control 1
Brined * * * 211.1 49.03
53.41
1 561.2 514.3 46.9 191 55.81 56.94
2 571.3 583 -11.7 196.2 54.94 55.34
3 573.7 564.6 9.1 * * 57.76
4 614.3 581.2 33.1 186.7 56.19 56.64
5 513.4 491.6 21.8 190.5 56.01 56.85
6 586.1 573.9 12.2 188.5 55.17 56.25
7 604.3 606.3 -2.0 191.3 54.73 *
8 591.1 596.3 -5.2 200.1 56.87 57.88
9 584.2 594.2 -10.0 195.3 55.97 56.63
10 * 572.1 * 197.1 56.93 57.72
11 606 601.6 4.4 192.3 56.99 57.47
12 577.1 590 -12.9 193.5 56.54 57.70
13 590.3 567 23.3 205.1 56.22 57.36
14 585.3 577.2 8.1 187 55.83 56.92
15 599.5 594.1 5.4 199.5 55.59 56.52
16 659.4 620.4 39.0 202.4 56.03 57.42
17 561.3 558.2 3.1 * * 57.19
18 593.6 574.9 18.7 197.8 56.12 57.28
19 653.3 585.5 67.8 194.2 56.49 56.90
20 607.7 596.7 11.0 197.2 55.38 56.67
Table 20. Warm water prawns yield data
Peeling yields were increased substantially as a result of pressure treatment. Yield in the
control samples was 49% compared with, on average, 56% in the pressure treated
samples. The highest yield achieved was 57% (236 MPa, temperature of 11.1°C, hold
time 2.5 minutes) but the differences between treatment conditions were very small (yield
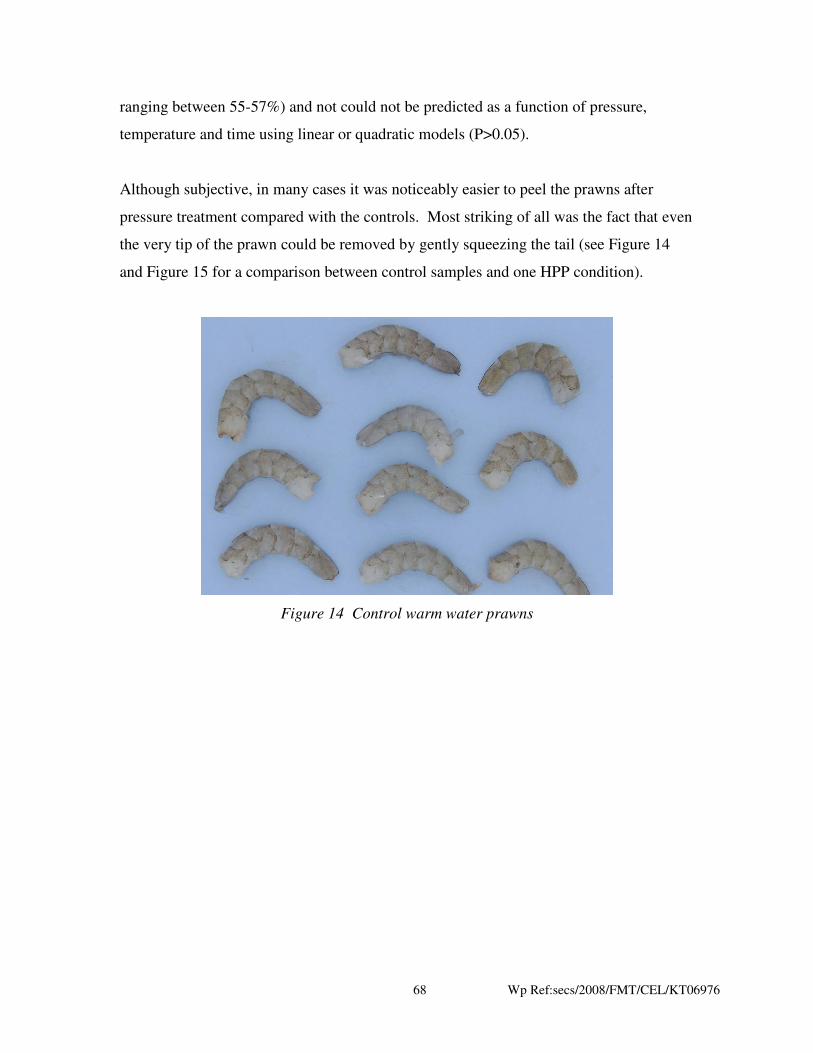
68 Wp Ref:secs/2008/FMT/CEL/KT06976
ranging between 55-57%) and not could not be predicted as a function of pressure,
temperature and time using linear or quadratic models (P>0.05).
Although subjective, in many cases it was noticeably easier to peel the prawns after
pressure treatment compared with the controls. Most striking of all was the fact that even
the very tip of the prawn could be removed by gently squeezing the tail (see Figure 14
and Figure 15 for a comparison between control samples and one HPP condition).
Figure 14 Control warm water prawns
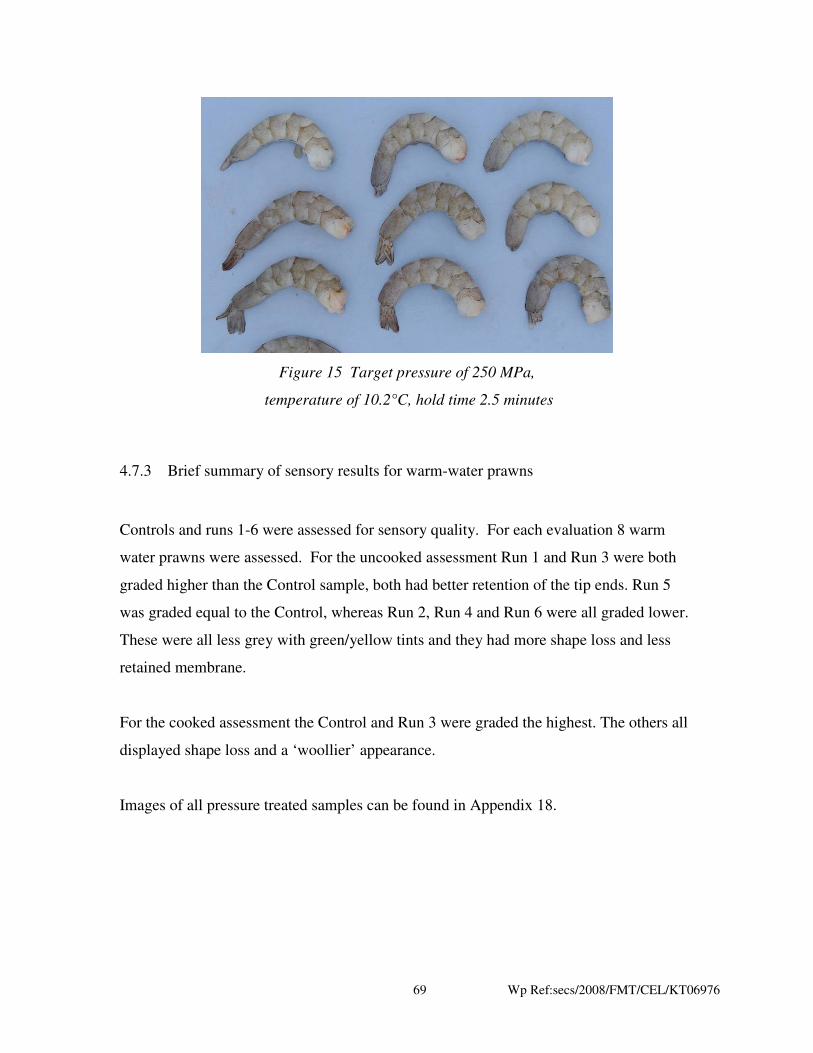
69 Wp Ref:secs/2008/FMT/CEL/KT06976
Figure 15 Target pressure of 250 MPa,
temperature of 10.2°C, hold time 2.5 minutes
4.7.3 Brief summary of sensory results for warm-water prawns
Controls and runs 1-6 were assessed for sensory quality. For each evaluation 8 warm
water prawns were assessed. For the uncooked assessment Run 1 and Run 3 were both
graded higher than the Control sample, both had better retention of the tip ends. Run 5
was graded equal to the Control, whereas Run 2, Run 4 and Run 6 were all graded lower.
These were all less grey with green/yellow tints and they had more shape loss and less
retained membrane.
For the cooked assessment the Control and Run 3 were graded the highest. The others all
displayed shape loss and a ‘woollier’ appearance.
Images of all pressure treated samples can be found in Appendix 18.

70 Wp Ref:secs/2008/FMT/CEL/KT06976
4.7.4 Key conclusions for warm water prawns
Peeling yields were enhanced substantially by HPP treatment, typically being 55-57%
compared with 46% for the control. Run 11 gave the highest yields (237 MPa, 11.1°C,
2.5 minutes) and a pressure of 237 MPa also gave the best sensory results from runs 1-6.
Cooked, pressure treated samples matched the controls for sensory quality.
Since peeling yields benefits look very significant for this product it has been selected for
further investigation in phase 2 of the project. A large quantity of prawns (50-100 kg)
will be pressure treated, hand-peeled and compared with a control. A pressure close to
237 MPa with a 2.5 minute hold time is suggested as this treatment gave good yield, and
sensory quality at 237 MPa appears to be acceptable. The temperature used for the trials
will be decided after further discussions with industry and will also be subject to the
temperature control limitations on the pressure system used for the work.

71 Wp Ref:secs/2008/FMT/CEL/KT06976
4.8 Salmon
Microbial reductions obtained for HPP treatment of salmon are reported in Table 21.
Results for sensory evaluation are briefly summarised in 4.8.3 and fully reported in
Appendix 8.
4.8.1 Microbiological results
Run No. Pressure
(MPa)
Time
(min)
Temperature
(°C)
TVC
(per g)
TVC log
reductions Coliforms (per g)
Pseudomonads
(per g)
Control 1 0.1 0 * 2.00E+05 0.0 1.70E+04 8.50E+02
Control 2 0.1 0 * 1.60E+05 0.1 1.20E+04 1.10E+05
1 425 3 6 245 2.9 <5 <50
2 321 2 9 1300 2.2 <5 <50
3 321 4 9 473 2.6 <5 <50
4 529 4 10 <5 4.6 <5 <50
5 529 2 10 10 4.3 <5 <50
6 425 3 11 291 2.8 <5 <50
7 425 3 12 305 2.8 <5 <50
8 250 3 12 3700 1.7 <5 <50
9 425 3 13 395 2.7 <5 <50
10 425 5 13 300 2.8 <5 <50
11 425 3 13 445 2.7 <5 <50
12 425 3 13 832 2.4 <5 <50
13 425 1 13 295 2.8 <5 <50
14 600 3 14 <5 4.6 <5 <50
15 425 3 11 527 2.6 <5 <50
16 321 4 15 2100 2.0 <5 <50
17 529 2 16 5 4.6 <5 <50
18 321 2 16 20000 1.0 <5 <50
19 529 4 15 <5 4.6 <5 <50
20 425 3 17 1200 2.2 <5 <50
Table 21. Salmon microbial reductions

72 Wp Ref:secs/2008/FMT/CEL/KT06976
Pressure significantly influenced the observed log TVC reductions (P<0.05) as can been
seen in Figure 16. Pressures in the region of 200-300 MPa typically resulted in 1-2 log
reductions; pressures around 400 MPa gave around a 3 log reduction; and pressures of
500-600 MPa reduced log TVC counts to the limits of detection. Temperature also
significantly influenced log TVC reductions (P<0.05) but the magnitude of the effect was
small relative to the influence of pressure. Hold time did not appear to significantly
influence log TVC reductions (P>0.05) over the range of hold periods tested.
17.515.012.510.07.55.0
5
4
3
2
1
Temperature
log reduction
High
Low
Med
PresGrp
Figure 16 Influence of pressure and temperature on TVC log reduction
Coliforms were reduced from 104 cfu/g in the controls to the limits of detection in all 20
runs. Similarly, pseudomonads were reduced from between 102 and 10
5 cfu/g to the
limits of detection in all 20 runs. A quadratic surface response was not an appropriate
model for the response of log TVC reduction to pressure, temperature and time.

73 Wp Ref:secs/2008/FMT/CEL/KT06976
4.8.2 Yield/quality data
Colour changes as a result of processing were evident with the product taking on a
cooked appearance in all treatments over 250 MPa. Differences in L* could be predicted
reasonably well with a quadratic response surface and the vast majority of the observed
variation was attributable to changes in pressure (R2 66.5%, P = 0.058). Changes in a*
and b* as a result of processing could be predicted very well using a quadratic surface
response (R2 = 89.7 and 92.3 respectively) with both parameters being influenced by
pressure (P<0.05) and temperature (P<0.01). Time was not found to significantly
influence a* and b* values (P>0.05). Whilst temperature had a significant effect on a*
and b* values, pressure was by far the most important determinant of colour shift. Figure
17 shows a* and b* measurements for all 20 runs with each data point indicating the
pressure applied during the run. There is good grouping of the data points according to
the pressure applied. As pressure increases a* and b* measurements decline.
27262524232221201918
22
21
20
19
18
17
16
15
14
Flesh Mean a*
Flesh Mean b*
425
529
321
529
321
425
600
425
425
425
425
425
250
425
425
529
529
321
321
425
Figure 17. Influence of pressure on a* and b* colour measurements in unsmoked salmon

74 Wp Ref:secs/2008/FMT/CEL/KT06976
This uniform and predictable shift in a* and b* can be described by the parameter C*
which is calculated from the a* and b* values using Equation 1.
Equation 1
Values of C* could be predicted very well using a quadratic surface response model
(Figure 18). As pressure increases, the value of C* decreases; samples took on an
increasingly pink, cooked appearance.
35.032.530.027.525.0
35.0
32.5
30.0
27.5
25.0
C* fits
C*
Line represents a perfect fit i.e. C*=C*fit
Figure 18. Predicted versus actual C* values for pressure treated salmon

75 Wp Ref:secs/2008/FMT/CEL/KT06976
1
1525
0
30
35
300400 5500
600
C*
Temperature
Pressure
Time (min) = 3
Hold Values
Figure 19. Influence of temperature and pressure on the value of C* in unsmoked
salmon
4.8.3 Brief summary of sensory results for salmon
A control and runs 1, 8, 10, 11, 14 and 20 were assessed for sensory quality. For each
evaluation one fillet was assessed. For the uncooked assessment none of the samples
were graded as high as the Control, which was bright and moist. Run 20 was graded the
highest, with dense, moderately bright flesh. Run 1 and Run 11 were graded the lowest,
with very dense, compressed flesh, and no defined flake structure.
For the cooked assessment none of the samples were graded as high as the Control, which
was bright and moist, with a very fresh odour. Run 8 and Run 20 were graded the
highest, with moderately bright flesh, and expected balanced flavour. Run 1, Run 10 and
Run 14 were graded the lowest, being pale in colour, and with a very fibrous, tough
texture.

76 Wp Ref:secs/2008/FMT/CEL/KT06976
Images of all pressure treated samples can be found in Appendix 19.
4.8.4 Key conclusions for salmon
Total viable counts, pseudomonads and coliforms could be reduced to the limits of
detection in salmon using HPP. It is very likely that HPP could be used to inactivate
pathogenic organisms and therefore to effectively pasteurise the product but this would
need to be confirmed by challenge test. However, the pressures required for
pasteurisation would lead to an undesirable ‘cooked’ appearance in the product. HPP is
therefore unsuitable for the pasteurisation of salmon if it is desirable for the product to
still appear raw after processing. It could still have applications, however, for use as a
pasteurisation step, e.g. in a fish based ready meal, if it were not critical for the fish to
appear raw. There may also be applications for using low pressures (<250 MPa) to assist
with marinating (as is done to produce flavoured oysters in the USA). This particular
application will be explored further for salmon in phase 2 of the project.

77 Wp Ref:secs/2008/FMT/CEL/KT06976
4.9 Squid
Microbial reductions obtained for HPP treatment of squid are reported in Table 22.
Weight changes after processing are reported in Table 23. Methods and results for
sensory evaluation are briefly summarised in section 4.9.3 and fully reported in
Appendix 9.
4.9.1 Microbiological results
Run
number
Pressure
(MPa)
Time
(Min)
Initial
temperature
of Pressure
fluid (°C)
Product
temperature
after
processing
(°C)
TVC
per g
Log TVC
reduction
Coliforms
per g
Pseudomonads
per g
Control 0.1 0 * * 270000 * 120 <10
1 400 5 29.2 21 50 3.7 <5 <10
2 200 2.5 28 21.2 24000 1.1 1100 <10
3 600 2.5 29.9 18.7 10 4.4 <5 <10
4 400 2.5 28.4 19.4 1100 2.4 <5 <10
5 400 2.5 28.6 22.8 341 2.9 <5 <10
6 400 2.5 28.8 21.3 30 4.0 <5 <10
7 400 2.5 28.2 22.2 50 3.7 <5 <10
8 400 0 28.1 21.4 2300 2.1 90 <10
9 522 1 27.4 18.8 5 4.7 <5 <10
10 278 4 28.3 24.4 600 2.7 10 <10
11 278 1 29.1 19.5 2400 2.1 <5 <10
12 400 2.5 29.7 21.6 25 4.0 <5 <10
13 400 2.5 * 25 25 4.0 <5 <10
14 522 4 26 18.7 <5 4.7 <5 <10
15 522 4 28.8 19.6 15 4.3 <5 <10
16 400 2.5 25.7 23.8 80 3.5 <5 <10
17 522 1 30.1 24.6 <5 4.7 <5 <10
18 278 1 29.6 21 15000 1.3 <5 <10
19 400 2.5 32.2 20.7 <5 4.7 <5 <10
20 278 4 33.4 23.8 1000 2.4 <5 <10
Table 22. Squid microbial reductions

78 Wp Ref:secs/2008/FMT/CEL/KT06976
Pressure was found to significantly influence log TVC reduction (P<0.05) with
increasing levels of microbial inactivation found with increasing pressure (Figure 20).
Temperature and time were not significant (P<0.05). A quadratic surface response model
could not be used to accurately model inactivation as a function of pressure, temperature
and time.
600500400300200
5
4
3
2
1
Pressure (MPa)
Log TVC reduction
Figure 20. Influence of pressure on log TVC reduction in squid
Coliforms were reduced from 102 per g in the control sample to the limits of detection in
19 of the 20 conditions tested. Pseudomonads were absent in all samples including the
control. TVCs could be reduced from 105 cfu/g in the controls to the limits of detection
in some processing conditions, e.g. 522 MPa for 1 minute at 30.1°C.

79 Wp Ref:secs/2008/FMT/CEL/KT06976
4.9.2 Yield/quality data
Run number
Pressure
(MPa)
Time
(Min)
Weight before HPP
(g)
Weight after HPP
(g)
% change
Control 0.1 0 164.1 164.1 *
1 400 5 160.3 132.6 -17
2 200 2.5 169.2 149.9 -11
3 600 2.5 180.9 155.9 -14
4 400 2.5 190.8 160.0 -16
5 400 2.5 113.9 93.1 -18
6 400 2.5 131.3 108.8 -17
7 400 2.5 113.9 111.6 -2
8 400 0 158 145.9 -8
9 522 1 165.5 165.1 0
10 278 4 129.8 124.4 -4
11 278 1 149 149.4 0
12 400 2.5 157.4 157.2 0
13 400 2.5 179.2 171.1 -5
14 522 4 155.1 154.8 0
15 522 4 128.4 128 0
16 400 2.5 157 156.6 0
17 522 1 158.6 158.7 0
18 278 1 132.5 132.1 0
19 400 2.5 179.2 178 -1
20 278 4 172.4 172.3 0
Table 23. Squid yield data
The weight of each squid tube was recorded before and after processing but runs 1-6
were handled more, e.g. for photography prior to sensory evaluation, and this is thought
to be the reason for the bigger weight losses post process in the first 6 samples. The
weight of the squid after processing was slightly reduced and was statistically
significantly different from the weight before processing (P<0.05).

80 Wp Ref:secs/2008/FMT/CEL/KT06976
4.9.3 Brief summary of sensory results for squid
A control and runs 1-6 were assessed for sensory quality. For the uncooked assessment
none of the samples were graded as high as the Control, which was very bright and moist,
with the expected milky white colour. The Run 6 sample was graded the highest, being
moderately bright and moist, with very little loss of shape. The Run 2 sample was graded
the lowest, with a denser, slightly dirty flesh, and slight loss of shape.
For the cooked assessment none of the samples were graded as high as the Control, which
was moderately bright and moist, with very little loss of shape, and a balanced salty and
sweet flavour. Run 1 and Run 2 were graded the highest, having a similar bright and
moist appearance to that of the control, but with more bitterness in the flavour. Runs 3, 5
and 6 were graded the lowest. Runs 3 and 5 were badly cleaned internally, and had some
protein cook-out present, a moderately bitter flavour, and extremely fibrous texture. Run
6 also had an extremely fibrous texture, but a cleaner appearance, and was also very
bitter.
Images of all pressure treated samples can be found in Appendix 20.
4.9.4 Key conclusions for squid
HPP reduced TVCs, pseudomonads and coliforms to the limits of detection at some
pressure/time/temperature combinations and it seems likely that it could be applied for
pasteurisation of squid (this would need to be confirmed by challenge testing). However,
the sensory quality of the squid was not as good as the control (although still considered
to be of fairly good quality). HPP also seemed to increase the perceived bitterness of the
sample relative to the control. In conclusion, HPP gave good reductions in
microbiological loading and hence would almost certainly extend shelf life but there were
no major benefits in terms of quality improvements. This product has not been selected
for further work in phase 2.
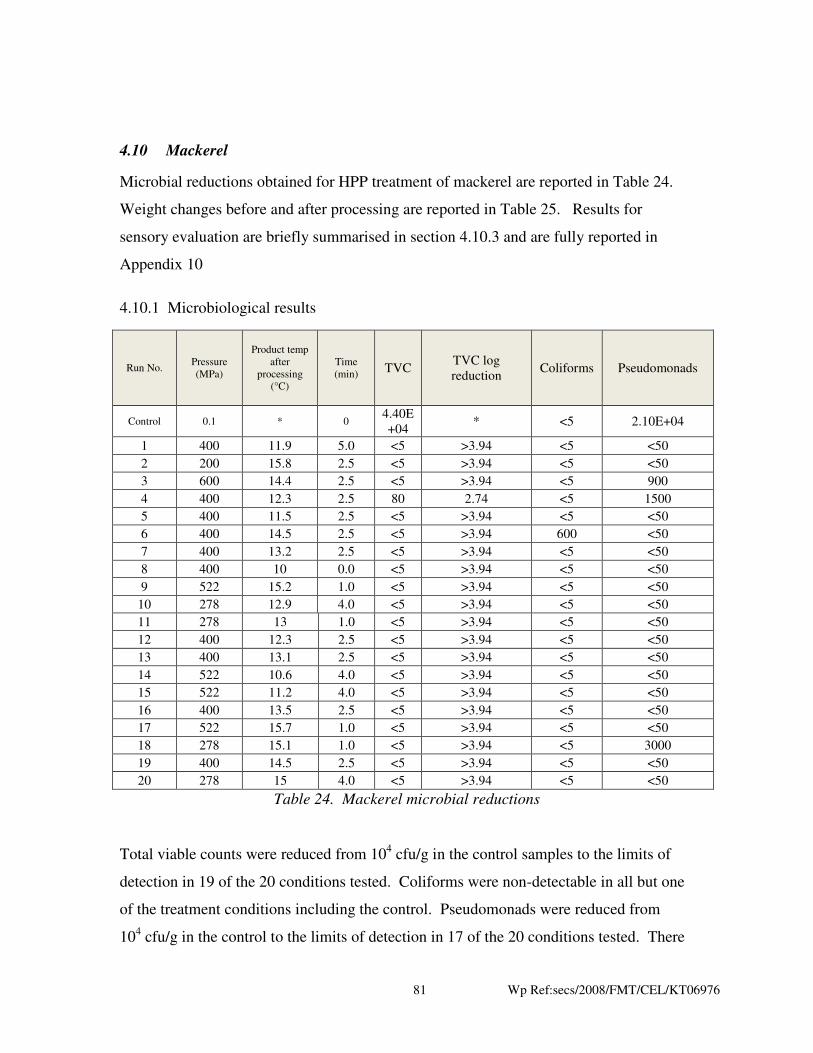
81 Wp Ref:secs/2008/FMT/CEL/KT06976
4.10 Mackerel
Microbial reductions obtained for HPP treatment of mackerel are reported in Table 24.
Weight changes before and after processing are reported in Table 25. Results for
sensory evaluation are briefly summarised in section 4.10.3 and are fully reported in
Appendix 10
4.10.1 Microbiological results
Run No. Pressure
(MPa)
Product temp
after
processing
(°C)
Time
(min) TVC
TVC log
reduction Coliforms Pseudomonads
Control 0.1 * 0 4.40E
+04 * <5 2.10E+04
1 400 11.9 5.0 <5 >3.94 <5 <50
2 200 15.8 2.5 <5 >3.94 <5 <50
3 600 14.4 2.5 <5 >3.94 <5 900
4 400 12.3 2.5 80 2.74 <5 1500
5 400 11.5 2.5 <5 >3.94 <5 <50
6 400 14.5 2.5 <5 >3.94 600 <50
7 400 13.2 2.5 <5 >3.94 <5 <50
8 400 10 0.0 <5 >3.94 <5 <50
9 522 15.2 1.0 <5 >3.94 <5 <50
10 278 12.9 4.0 <5 >3.94 <5 <50
11 278 13 1.0 <5 >3.94 <5 <50
12 400 12.3 2.5 <5 >3.94 <5 <50
13 400 13.1 2.5 <5 >3.94 <5 <50
14 522 10.6 4.0 <5 >3.94 <5 <50
15 522 11.2 4.0 <5 >3.94 <5 <50
16 400 13.5 2.5 <5 >3.94 <5 <50
17 522 15.7 1.0 <5 >3.94 <5 <50
18 278 15.1 1.0 <5 >3.94 <5 3000
19 400 14.5 2.5 <5 >3.94 <5 <50
20 278 15 4.0 <5 >3.94 <5 <50
Table 24. Mackerel microbial reductions
Total viable counts were reduced from 104 cfu/g in the control samples to the limits of
detection in 19 of the 20 conditions tested. Coliforms were non-detectable in all but one
of the treatment conditions including the control. Pseudomonads were reduced from
104 cfu/g in the control to the limits of detection in 17 of the 20 conditions tested. There

82 Wp Ref:secs/2008/FMT/CEL/KT06976
was no clear pattern explaining why pseudomonads survived in 3 runs and this could
simply be due to sample-to-sample variation or experimental error.
4.10.2 Yield/quality data
Run
Number Blocks
Product
temp after
processing
Time (min)
Weight
before
processing
Weight
after
processing
% change
Control
0
1 400 11.9 5.0 102.6 103.5 1
2 200 15.8 2.5 93.8 93.9 0
3 600 14.4 2.5 108.7 110 1
4 400 12.3 2.5 102.6 104.1 1
5 400 11.5 2.5 98.2 100 2
6 400 14.5 2.5 110 111.3 1
7 400 13.2 2.5 98.9 97.9 -1
8 400 10 0.0 93.6 95.8 2
9 522 15.2 1.0 89.9 89.9 0
10 278 12.9 4.0 99.8 99.8 0
11 278 13 1.0 102.9 103.2 0
12 400 12.3 2.5 99.2 99.2 0
13 400 13.1 2.5 107.9 109.8 2
14 522 10.6 4.0 97.4 96.1 -1
15 522 11.2 4.0 113.4 114.4 1
16 400 13.5 2.5 100.9 101.3 0
17 522 15.7 1.0 87 87.4 0
18 278 15.1 1.0 83.7 84.3 1
19 400 14.5 2.5 109.7 109.5 0
20 278 15 4.0 106.7 107.2 0
Table 25. Mackerel yield data
There was a statistically significant difference (P<0.05) between mackerel fillet weights
before and after pressure treatment but in practical terms this difference was very small
(average weights before and after processing differed by only 0.6g).
Significant colour changes were apparent in pressure treated mackerel; as pressure
increased, the samples took on an increasingly ‘cooked’ appearance. The only sample
with a visual appearance close to raw was run 2 processed at 200 MPa.

83 Wp Ref:secs/2008/FMT/CEL/KT06976
4.10.3 Brief summary of sensory results for mackerel
Controls and runs 1-6 were assessed for sensory quality. For the uncooked assessment
only the Run 2 sample was graded as high as the control, being bright and moist, with
very little loss of shape. Run 3 and Run 4 were graded the lowest, with very dense flesh,
and little defined flake structure.
For the cooked assessment none of the samples were graded as high as the Control, which
was bright and moist, with a well-balanced, typically oily flavour. Runs 1, 4 and 5 were
graded the highest, with moderately bright flesh, and expected balanced flavour, with
only slight acidity. Runs 2 and 3 were graded the lowest, being less bright, with some
loss of shape. The Run 2 sample had a dry, open appearance, and the Run 3 sample was
very dense and compressed.
Images of all pressure treated samples can be found in Appendix 21.
4.10.4 Key conclusions for mackerel
The process was very successful in terms of microbiological inactivation with TVCs and
pseudomonads being reduced dramatically as a result of pressure treatment. However,
above 200 MPa the process caused very significant colour changes and general changes
in visual appearance; the product appeared compressed with a loss of defined flakes.
HPP is unlikely to be suitable for use as a pasteurisation process where it is desirable that
the product still appears raw. As was the case for salmon, HPP could still be useful for
the non-thermal pasteurisation of ready meals or as a processing aid for marination.
Mackerel is not being taken forward for further evaluation in phase 2. Cod and salmon
are being investigated further and data from these trials is likely to give a good indication
as to the likely effects on other fish species.

84 Wp Ref:secs/2008/FMT/CEL/KT06976
4.11 Cod
Microbial reductions obtained for HPP treatment of cod are reported in Table 26. Yield
data are reported in Table 27. Results for sensory evaluation are briefly summarised in
section 4.11.3 and are fully reported in Appendix 11.
4.11.1 Microbiological results
Run No. Pressure
(MPa)
Product temp
after
processing
Time
(min) TVC TVC log
reduction
Coliforms
(per g)
Pseudomonads
(per g)
Control
0 94000
5 110000
1 400 13 5 95 3.0 <5 <50
2 200 12.8 2.5 3500 1.4 <5 400
3 600 10.9 2.5 <5 >4.3 <5 <50
4 400 12.4 2.5 80 3.1 <5 <50
5 400 11.3 2.5 150 2.8 <5 <50
6 400 11 2.5 125 2.9 <5 <50
7 400 12 2.5 110 2.9 <5 <50
8 400 11.6 0 1800 1.7 <5 <50
9 522 11 1 55 3.2 <5 <50
10 278 8.1 4 904 2.0 <5 <50
11 278 13.1 1 450 2.3 <5 <50
12 400 11.4 2.5 259 2.6 <5 <50
13 400 12.6 2.5 105 3.0 <5 <50
14 522 10.7 4 <5 >4.3 <5 <50
15 522 10.7 4 15 3.8 <5 <50
16 400 12.2 2.5 218 2.6 <5 <50
17 522 12.2 1 45 3.3 <5 <50
18 278 11.3 1 3300 1.5 <5 350
19 400 12.3 2.5 150 2.8 <5 <50
20 278 13.6 4 1600 1.8 <5 <50
Table 26. Cod microbial reductions
Total viable count log reductions were significantly influenced by pressure and hold time
(P<0.05 in both cases) but pressure was the more important factor in determining the
level of microbial inactivation achieved (Figure 21). TVCs were reduced from 104 cfu/g
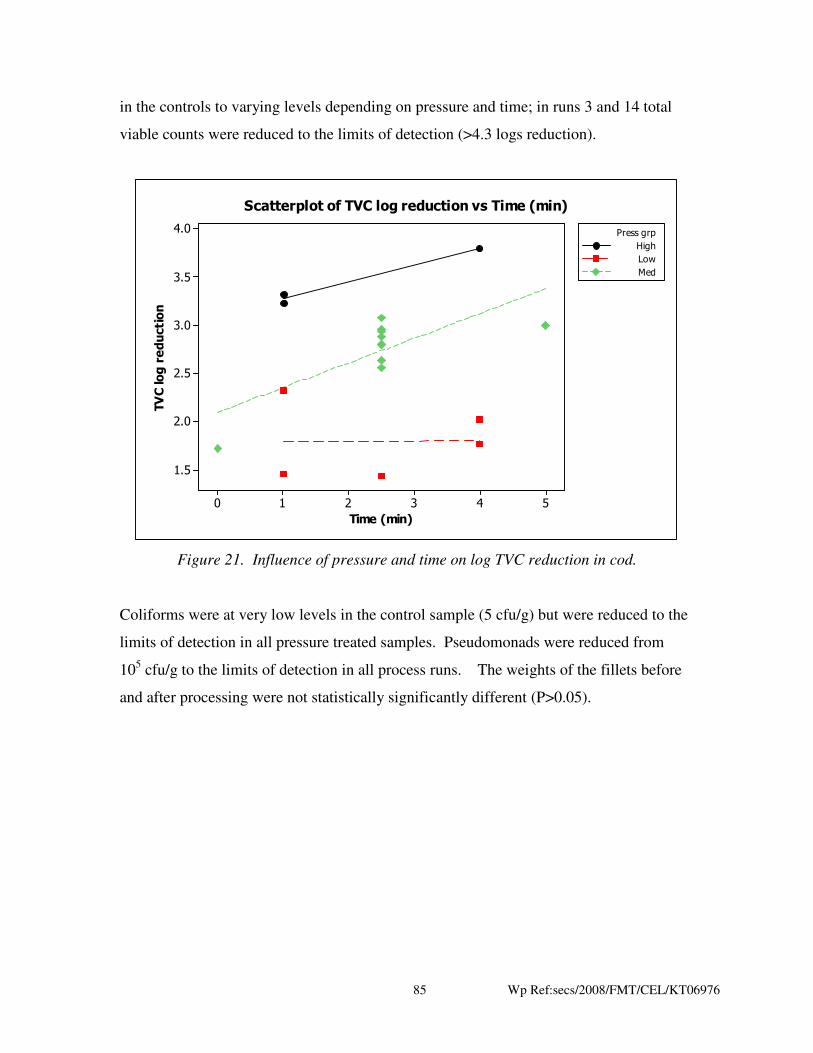
85 Wp Ref:secs/2008/FMT/CEL/KT06976
in the controls to varying levels depending on pressure and time; in runs 3 and 14 total
viable counts were reduced to the limits of detection (>4.3 logs reduction).
543210
4.0
3.5
3.0
2.5
2.0
1.5
Time (min)
TVC log reduction
High
Low
Med
Press grp
Scatterplot of TVC log reduction vs Time (min)
Figure 21. Influence of pressure and time on log TVC reduction in cod.
Coliforms were at very low levels in the control sample (5 cfu/g) but were reduced to the
limits of detection in all pressure treated samples. Pseudomonads were reduced from
105 cfu/g to the limits of detection in all process runs. The weights of the fillets before
and after processing were not statistically significantly different (P>0.05).
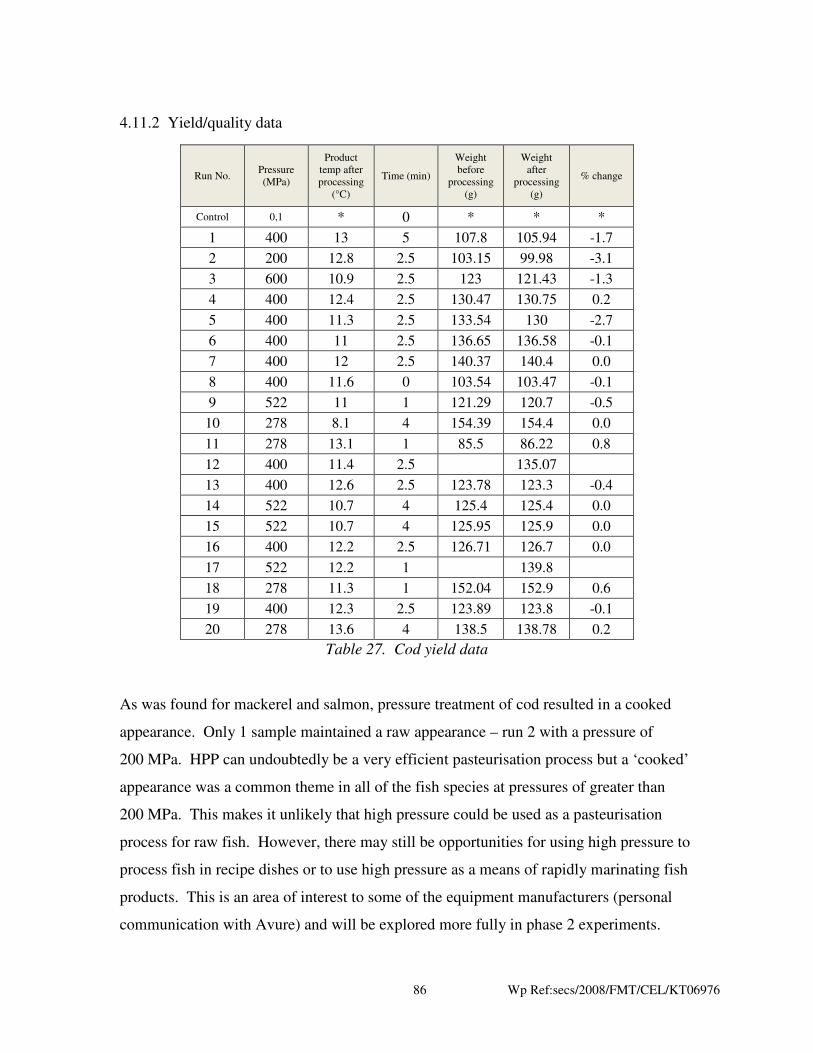
86 Wp Ref:secs/2008/FMT/CEL/KT06976
4.11.2 Yield/quality data
Run No. Pressure
(MPa)
Product
temp after
processing
(°C)
Time (min)
Weight
before
processing
(g)
Weight
after
processing
(g)
% change
Control 0,1 * 0 * * *
1 400 13 5 107.8 105.94 -1.7
2 200 12.8 2.5 103.15 99.98 -3.1
3 600 10.9 2.5 123 121.43 -1.3
4 400 12.4 2.5 130.47 130.75 0.2
5 400 11.3 2.5 133.54 130 -2.7
6 400 11 2.5 136.65 136.58 -0.1
7 400 12 2.5 140.37 140.4 0.0
8 400 11.6 0 103.54 103.47 -0.1
9 522 11 1 121.29 120.7 -0.5
10 278 8.1 4 154.39 154.4 0.0
11 278 13.1 1 85.5 86.22 0.8
12 400 11.4 2.5
135.07
13 400 12.6 2.5 123.78 123.3 -0.4
14 522 10.7 4 125.4 125.4 0.0
15 522 10.7 4 125.95 125.9 0.0
16 400 12.2 2.5 126.71 126.7 0.0
17 522 12.2 1
139.8
18 278 11.3 1 152.04 152.9 0.6
19 400 12.3 2.5 123.89 123.8 -0.1
20 278 13.6 4 138.5 138.78 0.2
Table 27. Cod yield data
As was found for mackerel and salmon, pressure treatment of cod resulted in a cooked
appearance. Only 1 sample maintained a raw appearance – run 2 with a pressure of
200 MPa. HPP can undoubtedly be a very efficient pasteurisation process but a ‘cooked’
appearance was a common theme in all of the fish species at pressures of greater than
200 MPa. This makes it unlikely that high pressure could be used as a pasteurisation
process for raw fish. However, there may still be opportunities for using high pressure to
process fish in recipe dishes or to use high pressure as a means of rapidly marinating fish
products. This is an area of interest to some of the equipment manufacturers (personal
communication with Avure) and will be explored more fully in phase 2 experiments.

87 Wp Ref:secs/2008/FMT/CEL/KT06976
4.11.3 Brief summary of sensory results for cod
A control and runs 1-6 were assessed for sensory quality. For the uncooked assessment,
none of the samples were graded as high as the Control, which was bright and moist, with
good retention of fillet shape. Runs 3, 5 and 6 were graded the lowest, with moderate
loss of brightness and little defined flake structure.
For the cooked assessment, only Run 3 was graded as high as the control, being moist
with well defined flakes, and a well-balanced flavour and soft, moist texture. Runs 5 and
6 were graded the lowest, having a drier appearance. Run 5 also had a firm, dry, fibrous
texture and Run 6 had acidic and bitter notes in the flavour.
Images of all pressure treated samples can be found in Appendix 22.
4.11.4 Key conclusions for cod
As was found for salmon and mackerel, HPP was very efficient with respect to
microbiological inactivation, but a cooked appearance was induced in all samples treated
over 200 MPa, making HPP unsuitable for pasteurisation of raw cod were it desirable to
maintain a raw appearance. Interestingly, of the six runs tested for sensory quality, run 3
treated at 600 MPa was the only sample to be of comparable quality to the control. This
suggests that HPP could be used to pasteurise cod in products where the colour change
was not a problem and the sensory quality of the product would not be compromised. It
would be interesting to compare the quality of a pressure treated ready meal,
subsequently cooked by a consumer, with that of a heat processed ready meal that was
subsequently cooked by the consumer. This may be explored further in phase 2 of the
project.

88 Wp Ref:secs/2008/FMT/CEL/KT06976
5 Conclusions
Key findings from the work to date can be summarised as follows:
• HPP is an effective method for the inactivation of a range of microorganisms
provided the pressure applied is sufficiently high.
• At the pressures used for shucking/picking applications, reductions in TVCs
varied from species to species, but even at pressures of 200-300 MPa substantial
reductions in pseudomonads and coliforms could be achieved, which could offer
useful shelf-life extension. It should be noted however that no attempts were
made to detect sub-lethal injury and recovery of the organisms and this is known
to sometimes occur with HPP at the lower end of the pressure spectrum.
• At pressures in excess of around 200 MPa, all fish species began to take on a
cooked appearance and this effect was more pronounced as pressure increased.
This means that HPP is unlikely to be suitable for pasteurisation of wet fish and is
probably best used to produce multi-component pasteurised ready-meals where a
cooked appearance in the fish is not necessarily a concern. It may be possible to
use pressures less than 200 MPa to enhance marination and to flavour products.
Both of these applications are worthy of further exploration and may be studied in
phase 2 of the project
• The cooked quality of HPP treated fish can match that of untreated controls which
once again suggests that HPP could be used for ready-meal processing without
compromising on product quality. It may be that by only fully cooking the
product once (on consumption) the eating quality may be improved compared
with a ‘twice-cooked’ product (once during manufacture and once by the
consumer). This may be explored in phase 2 of the project.
• Substantial yield benefits may be possible for all shellfish. This was particularly
apparent for mussels and oysters. The sensory quality of these products was
generally considered to be improved by the HPP process. Care must be taken
however to ensure that yield increases do not change the product eating quality

89 Wp Ref:secs/2008/FMT/CEL/KT06976
too dramatically. The results of these trials suggest that the amount of water
uptake could be manipulated by varying the pressure and hold time applied.
• Substantial yield benefits look achievable for warm water prawns and possibly
Nephrops but larger scale peeling trials are required in both cases to confirm that
these apparent benefits are transferrable to a commercial scale operation. Larger
scale peeling trials (50-100 kg) batches will form part of the work programme for
phase 2 of the project.
• Lobsters and crabs can be picked raw after pressure treatment, offering the
potential for completely new added-value products, i.e. picked, raw, ready-to-
cook meat. Meat can be readily extracted even from difficult areas such as the
legs; in some cases the meat can simply be squeezed out of the leg.
• The project has been very successful in meeting the core objectives as described
in section 2. A great deal of practical knowledge has been developed to assist the
industry in making informed choices about the use of HPP for their products.
Clear benefits have been identified with respect to yield, microbiological
inactivation and sensory quality but at the same time some of the limitations of
the technology have been highlighted. A number of opportunities have been
identified for the development of added value products and some of these ideas
may be explored more fully in the second phase of the project. The high pressure
facilities and expertise developed between CCFRA and Norconserv is now
available for seafood processors to use on a confidential basis and a number of
companies are already in discussions with CCFRA about conducting specific
trials for their particular product lines.

90 Wp Ref:secs/2008/FMT/CEL/KT06976
6 Future work
Five products have been selected for further work in phase 2 of the project. The short-list
of products is as follows:
• Crab
• Warm water prawns
• Nephrops
• Salmon
• Cod
Trials on crab, warm water prawns and Nephrops will focus on large scale
picking/peeling trials to determine whether the yield benefits identified in phase 1 are
transferrable to a commercial scale. Two commercial processors are participating in
these studies. Trials on salmon and cod will focus on two areas: low pressure for
marination, and the production of ready-meals, to compare product quality with that of
conventional heat processed ready-meals.
91 Wp Ref:secs/2008/FMT/CEL/KT06976
7 References
Amanatidou, A., Schluter, O., Lemkau, K., Gorris, L. G. M., Smid, E. J., & Knorr, D.
2000, "Effect of combined application of high pressure treatment and modified
atmospheres on the shelf life of fresh Atlantic salmon", Innovative Food Science &
Emerging Technologies, vol. 1, no. 2, pp. 87-98.
Ashie, I.-N. A. & Simpson, B. K. 1996, "Application of high hydrostatic pressure to
control enzyme related fresh seafood texture deterioration", Food Research International,
vol. 29(5/6): pp. 569-575.
Calik, H., Morrissey, M. T., Reno, P. W., & An, H. 2002, "Effect of high-pressure
processing on Vibrio parahaemolyticus strains in pure culture and Pacific oysters",
Journal of Food Science, vol. 67, no. 4, pp. 1506-1510.
Chevalier, D., Bail, A. l., & Ghoul, M. 2001, "Effects of high pressure treatment (100-
200 MPa) at low temperature on turbot (Scophthalmus maximus) muscle", Food
Research International, vol. 34(5): pp. 425-429.
de Heij, W. B. C., van Schepdael, L. J. M. M., Moezelaar, R., Hoogland, H., Matser, A.
M., & Berg, R.-W. R.-W. 2003, "High-pressure sterilization: maximizing the benefits of
adiabatic heating", Food Technology, vol. 57, no. 3, pp. 37-41.
Fioretto, F., Cruz, C., Largeteau, A., Sarli, T. A., Demazeau, G., & El Moueffak, A.
2005, Inactivation of Staphylococcus aureus and Salmonella enteritidis in tryptic soy
broth and caviar samples by high pressure processing. Brazilian Journal of Medical and
Biological Research 38, 1259-1265.
He, H., Adams, R. M., Farkas, D. F., & Morrissey, M. T. 2002, "Use of high-pressure
processing for oyster shucking and shelf-life extension", Journal of Food Science, vol.
67(2): pp. 640-645.
Hurtado, J. L., Montero, P., & Borderias, A. J. 2006, Chilled storage of pressurized
octopus (Octopus vulgaris) muscle. Journal of Food Science 66(3), 400-406.
IFT 2000, "Special supplement: Kinetics of microbial inactivation for alternative food
processing technologies - IFT's response to task order #1, US Food and Drug
Administration: How to quantify the destruction kinetics of alternative processing
technologies", Journal of Food Science pp. 4-108.
Koo, J., Jahncke, M. L., Reno, P. W., Hu, X., & Mallikarjunan, P. 2006, Inactivation of
Vibrio parahaemolyticus and Vibrio vulnificus in phosphate-buffered saline and in
inoculated whole oysters by high-pressure processing. Journal of Food Protection 69,
596-601.

92 Wp Ref:secs/2008/FMT/CEL/KT06976
Leadley C.E. 2007, Introduction to high pressure processing: benefits, limitations, current
and potential applications. Presentation at NovelQ workshop, held 9-10th July 2007 at
Campden & Chorleywood Food Research Association, Chipping Campden,
Gloucestershire GL55 6LD, UK.
Leadley C.E. & Williams, A. 1996, New Technologies Bulletin No. 14. Campden &
Chorleywood Food Research Association, Chipping Campden, Gloucestershire, GL55
6LD, UK.
Leadley, C. 2006, High pressure sterilisation - temperature distribution studies in a
laboratory scale high pressure vessel. R&D Report 226. Campden & Chorleywood Food
Research Association, Chipping Campden, Gloucestershire, GL55 6LD.
Leadley, C. E. 2005, High pressure sterilisation: A review. CCFRA review 47. Chipping
Campden, Gloucestershire GL55 6LD, UK . 2005.
Linton, M., McClements, J.-M. J., & Patterson, M. F. 2003, "Changes in the
microbiological quality of shellfish, brought about by treatment with high hydrostatic
pressure", International Journal of Food Science & Technology, vol. 38, no. 6, pp. 713-
727.
Lopez-Caballero, M. E., Perez-Mateos, M., Borderias, J. A., & Montero, P. 2000a,
"Extension of the shelf life of prawns (Penaeus japonicus) by vacuum packaging and
high-pressure treatment", Journal of Food Protection, vol. 63, no. 10, pp. 1381-1388.
Lopez-Caballero, M. E., Perez-Mateos, M., Montero, P., & Borderias, A. J. 2000b,
"Oyster preservation by high-pressure treatment", Journal of Food Protection, vol. 63,
no. 2, pp. 196-201.
Matser, A. M., Stegman, D., Kals, J., & Bartels, P. V. 2000, Effects of high pressure on
colour and texture of fish. High Pressure Research 19, 109-115.
Montero, P., Lopez-Caballero, M. E., & Perez-Mateos, M. 2001, "The effect of inhibitors
and high pressure treatment to prevent melanosis and microbial growth on chilled prawns
(Penaeus japonicus)", Journal of Food Science, vol. 66(8): pp. 1201-1206.
Nagashima, Y., Ebina, H., Tanaka, M., & Taguchi, T. 1993, "Effect of high hydrostatic
pressure on the thermal gelation of squid mantle meat", Food Research International,
vol. 26(2): pp. 119-123.
Paarup, T., Sanchez, J. A., Pelaez, C., & Moral, A. 2002, "Sensory, chemical and
bacteriological changes in vacuum-packed pressurised squid mantle (Todaropsis eblanae)
stored at 4°C", International Journal of Food Microbiology, vol. 74, no. 1-2, pp. 1-12.

93 Wp Ref:secs/2008/FMT/CEL/KT06976
Purroy, F. 2007, Engineering challenges and economical analysis for a novel processing
technology: High Pressure Processing. Presentation to CCFRA Emerging Technologies
Panel held 19th September 2007.
Ramirez-Suarez, J. C. & Morrissey, M. T. 2006, Effect of high pressure processing (HPP)
on shelf life of albacore tuna (Thunnus alalunga) minced muscle. Innovative Food
Science & Emerging Technologies 7, 19-27.
Rasanayagam, V., Balasubramaniam, V. M., Ting, E., Sizer, C. E., Bush, C., &
Anderson, C. 2003, "Compression heating of selected fatty food materials during high-
pressure processing", Journal of Food Science, vol. 68, no. 1, pp. 254-259.
Sequeira-Munoz, A., Chevalier, D., Le Bail, A., Ramaswamy, H., & Simpson, B. K.,
2006, Physicochemical changes induced in carp (Cyprinus carpio) fillets by high
pressure processing at low temperatures. Innovative Food Science & Emerging
Technologies 7, 13-18.
.
Ting, E., Balasubramaniam, V. M., & Raghubeer, E. 2002, "Determining thermal effects
in high-pressure processing", Food Technology, vol. 56, no. 2, pp. 31-35.