cd equisearchpv pvt ltd
TRANSCRIPT
CD EquisearchPv
Equities Derivatives Commoditie
Aegis Logistics Ltd.
No. of shares (m) 339.66
Mkt cap (Rs crs/$m) 6034/851.0
Current price (Rs/$) 178/2.5
Price target (Rs/$) 222/3.1
52 W H/L (Rs.) 242/170
Book Value (Rs/$) 42/0.6
Beta 0.5
Daily volume (avg. monthly) 137990
P/BV (FY20e/21e) 3.9/3.3
EV/EBITDA (FY20e/21e) 13.0/11.3
P/E (FY20e/21e) 22.3/19.2
EPS growth (FY19/20e/21e) 11.9/20.1/16.4
OPM (FY19/20e/21e) 6.6/6.6/6.6
ROE (FY19/20e/21e) 17.5/18.5/18.6
ROCE(FY19/20e/21e) 17.0/18.1/18.1
D/E ratio (FY19/20e/21e) 0.2/0.1/0.1
BSE Code 500003
NSE Code AEGISCHEM
Bloomberg AGIS IN
Reuters AEGS.NS
Shareholding pattern %
Promoters 60.6
MFs / Banks / FIIs/FIs 2.4
Foreign Portfolio Investors 12.7
Govt. Holding -
Public & Others 24.4
Total 100.0
As on June 30, 2019
Recommendation
BUY
Phone: + 91 (33) 4488 0055
E- mail: [email protected]
Consolidated (Rs crs)
Income from operations
Other Income
EBITDA (other income included)
PAT after MI and EO EPS(Rs)
EPS growth (%)
Pvt Ltd
ities Distribution of Mutual Funds Dist
FY17
FY18
FY19
3930.29 4790.96 5615.82
5.72 8.35 8.19
209.29 274.36 379.06
119.22 197.81 221.38
3.57 5.92 6.63
5.2 65.9 11.9
Quarterly Highlights
• According to industry reports, global LPG market is expected to grow at a
CAGR of 3.1% between 2019 and 2025 and reach USD 359 bn by 2025 from
USD 278 bn in 2018. Asia Pacific is the leader in terms of revenue and is
projected to sustain its dominance over the forecast time period with the
highest growth rate. Increasing government support for LPG adoption
as Pradhan Mantri Ujjwala Scheme (PMUY)
target of providing free cooking gas to 80 m
ahead of schedule, are fuelling the LPG market in the region.
• Topline witnessed an uptick of 92.3% (yoy) last quarter, the highest growth
in recent years, driven by 96.2% (yoy) and 8.8% (yoy) growth in gas division
and liquid division respectively. Although op
(yoy), OPM declined to 5.2% vs 8.5% a year ago. With PBT up by 21.6%
(yoy), higher taxes restricted post tax earnings growth to 10.3% (yoy).
• Throughput volume in gas division grew by mere 2.0% (yoy), partially due
to delay in approval for BPCL cargoes in Haldia (although permission for
contract renewal has been received in July). Sourcing volume witnessed an
uptick of 2.1x due to new IOC contracts won by Aegis Group International,
driving the overall volume growth of gas divis
• The stock currently trades at 22.3x FY20e EPS of Rs 7.96 and 19.2x FY21e
EPS of Rs 9.27. Strong push by GOI under the Pradhan Mantri Ujjwala
Scheme would boost LPG demand in India. Planned capacity expansions
(as mentioned) along with liquid and gas terminals operating at
capacity utilization would help it post revenue growth at a CAGR
in two years ending FY21, though Pipavav liquid terminal is still
underperforming at 25% to 30% capacity utilization
chemical traffic.
• With modest improvement in margins of both
FY20 and FY21owing to shift to higher value chemicals and petrochemicals
(especially in Kandla and Mangalore ports) and higher volumes in gas
division, we expect net profits to post CAGR growth of 19.2
ending FY21. However, any unfavorable changes in government policy
with regards to subsidized pricing of LPG could impact its gas busi
Inadequate port infrastructure (like insufficient berthing facilities, improper
material handling equipment, etc) and geo-political instability could lead to
uncertainty on pricing, impacting customers for the liquid logistics
business. On balance, we assign ‘buy’ rating on the s
of Rs 222 (previous target Rs 254) based on 24
Sep 27, 2019
istribution of Life Insurance
FY20e FY21e
6621.91 7621.17
10.29 12.02
448.62 518.23
270.33 314.75
7.96 9.27
20.1 16.4
cording to industry reports, global LPG market is expected to grow at a
CAGR of 3.1% between 2019 and 2025 and reach USD 359 bn by 2025 from
Asia Pacific is the leader in terms of revenue and is
he forecast time period with the
Increasing government support for LPG adoption such
Pradhan Mantri Ujjwala Scheme (PMUY) by GOI, which recently met its
target of providing free cooking gas to 80 mn poor families seven months
market in the region.
Topline witnessed an uptick of 92.3% (yoy) last quarter, the highest growth
in recent years, driven by 96.2% (yoy) and 8.8% (yoy) growth in gas division
and liquid division respectively. Although operating profit was up 18.0%
(yoy), OPM declined to 5.2% vs 8.5% a year ago. With PBT up by 21.6%
(yoy), higher taxes restricted post tax earnings growth to 10.3% (yoy).
Throughput volume in gas division grew by mere 2.0% (yoy), partially due
approval for BPCL cargoes in Haldia (although permission for
contract renewal has been received in July). Sourcing volume witnessed an
uptick of 2.1x due to new IOC contracts won by Aegis Group International,
driving the overall volume growth of gas division to 32.3% (yoy).
ly trades at 22.3x FY20e EPS of Rs 7.96 and 19.2x FY21e
. Strong push by GOI under the Pradhan Mantri Ujjwala
Scheme would boost LPG demand in India. Planned capacity expansions
liquid and gas terminals operating at improved
capacity utilization would help it post revenue growth at a CAGR of 16.5%
FY21, though Pipavav liquid terminal is still
underperforming at 25% to 30% capacity utilization on account of less
both liquid and gas division in
FY20 and FY21owing to shift to higher value chemicals and petrochemicals
and Mangalore ports) and higher volumes in gas
fits to post CAGR growth of 19.2% in two years
However, any unfavorable changes in government policy
with regards to subsidized pricing of LPG could impact its gas business.
(like insufficient berthing facilities, improper
political instability could lead to
uncertainty on pricing, impacting customers for the liquid logistics
’ rating on the stock with target price
vious target Rs 254) based on 24x FY21e EPS of Rs 9.27.

CD EquisearchPvt Ltd
Equities Derivatives Commoditie
Outlook & Recommendation
Indian Logistics Industry
The global logistics market is estimated to grow at a CAGR of 7.4% during 2018
logistics industry, emergence of e-commerce retail market has resulted into
value of the industry and has also been a catalyst in driving the growth in overall global market.
online shopping globally serves as one of the major factors driving the demand for logistics services,” stated the
Transparency Market Research report.
The Asia-Pacific region, which currently accounts for the largest share in the
of over 13% during the forecast period on back of
adoption of internet and mobile services, all of which contribute to a significant growth of the region’s e
The key players in the region are entering into
trade corridors between Asia and Africa, Asia and South America
chains. Trade volumes would shift towards emerging markets and
the global marketplace. However, poor infrastructure, dearth of skilled manpower and technology backwardness are some
of the challenges that might dent growth of logistics market, particularly in
Indian logistics sector is expected to clock a CAGR growth of 10.4% and reach market size of $215 bn by 2020 from $160 bn
in 2017, employing ~40 mn people across the country (~22 mn in 2017).
logistics leaves the industry fragmented with organized players
consumer base of the sector encompassing a wide range of industries including retail, automobile, telecom, pharmaceuticals
and heavy industries, logistics industry has been increasingly attracting investments in the last decade
receive investments of $500 bn by 2025.
Key reform measures and policy interventions like
the core competencies of the Indian logistics industry.
parks, dedicated freight corridors, free trade warehousing zones and container freight stations with the
identifying and ironing out the existing bottlenecks and gaps in the industry.
retail, e-commerce, manufacturing and various other sectors
the integral part that logistics plays in the e-commerce value chain, many established players and specialized start
entered this space.
India’s logistics industry is expected to grow, though not without
warehousing, multiple regulatory and policy making bodies, lack of seamless movement of goods across modes, minim
integrated IT infrastructure, etc. In order to develop this sector
removing bottlenecks, improving inter-modal transportation, automation, single window system for giving clearances, and
simplifying processes would be required.
2
CD EquisearchPvt Ltd
ities Distribution of Mutual Funds Dist
The global logistics market is estimated to grow at a CAGR of 7.4% during 2018-2026. As per a recent report on global
commerce retail market has resulted into fast paced expansio
stry and has also been a catalyst in driving the growth in overall global market.
online shopping globally serves as one of the major factors driving the demand for logistics services,” stated the
currently accounts for the largest share in the logistics market, is expected to grow at a CAGR
on back of growing middle-class population, rising disposable income
nternet and mobile services, all of which contribute to a significant growth of the region’s e
into M&A to diversify their portfolio and increase their global
Asia and Africa, Asia and South America and within Asia are expected to
emerging markets and least developed countries would
However, poor infrastructure, dearth of skilled manpower and technology backwardness are some
of the challenges that might dent growth of logistics market, particularly in developing markets.
Indian logistics sector is expected to clock a CAGR growth of 10.4% and reach market size of $215 bn by 2020 from $160 bn
in 2017, employing ~40 mn people across the country (~22 mn in 2017). The presence of highly unorganized players i
logistics leaves the industry fragmented with organized players accounting for just ~10% of total market share.
consumer base of the sector encompassing a wide range of industries including retail, automobile, telecom, pharmaceuticals
heavy industries, logistics industry has been increasingly attracting investments in the last decade
Key reform measures and policy interventions like GST, relaxed FDI regulations and granting of
the core competencies of the Indian logistics industry. It laid the foundation for setting up of large multi
free trade warehousing zones and container freight stations with the
identifying and ironing out the existing bottlenecks and gaps in the industry. Growth is also backed by improvement
and various other sectors. E-commerce logistics has arisen as a key focus area and g
commerce value chain, many established players and specialized start
India’s logistics industry is expected to grow, though not without challenges such as inadequate
policy making bodies, lack of seamless movement of goods across modes, minim
In order to develop this sector, focus on new technology, improved investment, skilling,
modal transportation, automation, single window system for giving clearances, and
2
CD EquisearchPvt Ltd
istribution of Life Insurance
2026. As per a recent report on global
paced expansion in the overall size and
stry and has also been a catalyst in driving the growth in overall global market.“The rising popularity of
online shopping globally serves as one of the major factors driving the demand for logistics services,” stated the
is expected to grow at a CAGR
rising disposable income and increasing
nternet and mobile services, all of which contribute to a significant growth of the region’s e-commerce sales.
their portfolio and increase their global presence. New
and within Asia are expected to re-chart global supply
countries would take their first steps into
However, poor infrastructure, dearth of skilled manpower and technology backwardness are some
Indian logistics sector is expected to clock a CAGR growth of 10.4% and reach market size of $215 bn by 2020 from $160 bn
unorganized players in Indian
10% of total market share. With the
consumer base of the sector encompassing a wide range of industries including retail, automobile, telecom, pharmaceuticals
heavy industries, logistics industry has been increasingly attracting investments in the last decade and is poised to
ranting of infra status have boosted
It laid the foundation for setting up of large multi-format logistics
free trade warehousing zones and container freight stations with the objective of
Growth is also backed by improvement in
arisen as a key focus area and given
commerce value chain, many established players and specialized start-ups have
enges such as inadequate infrastructure, fragmented
policy making bodies, lack of seamless movement of goods across modes, minimal
focus on new technology, improved investment, skilling,
modal transportation, automation, single window system for giving clearances, and

CD EquisearchPvt Ltd
Equities Derivatives Commoditie
[
Expansion Plans
Gas Terminal Division
In view of increasing demand for LPG, Aegis has envisaged a plan of setting up a new LPG terminal with a capacity of
45,000 MT - 2 fully refrigerated tanks of 22,500 MT each
H1FY21, involving capex of Rs 350 crs. It has also approved brownfield capacity expansion for LPG at Pipavav port
MT by adding 2 new spheres over and above the existing 18,300 MT and setting up of LPG railway gantry
The expansion is expected to be completed by next fiscal and would be funded by internal accruals.
Total static and throughput LPG capacity post expansion would be 112,100 MT (existing capacity 63,300 MT) and 92m MT
(existing capacity 50m MT) respectively. It completed
finished implementation of two fully refrigerated tanks of static storage capacity of 25
2.5m MT and an LPG bottling plant at Haldia
expected to be completed in H1FY18). Brownfield capacity expansion at Pipavav involving a capex of Rs 75 crs (static
capacity and throughput capacity pegged at 10200 MT an
expected time of completion was H1FY18).
Liquid Terminal Division
Aegis plans to set up an additional liquid terminal with storage capacity of 40,000 KL (current capacity 100,000 KL
port involving a capex of Rs 25 crs, slated to be completed in H2FY20. Another expansion of 20,000 KL of bulk liquid storage
beyond the existing 51,000 KL at Kochi port
approved setting up of an additional storage capacity of 50,000 KL (existing capacity of 25,000 KL) at Mangalore port costing
Rs 35 crs, which is scheduled to be completed next fiscal.
Total liquid capacity post expansion would be ~799,000 KL (existing ca
internal accruals. Yet, it is exposed to risk of delays in expansion plans. As witnessed in the past, greenfield expansion of
25,000 KL at Mangalore plant, earlier slated to be completed in FY18, was complet
3
CD EquisearchPvt Ltd
ities Distribution of Mutual Funds Dist
In view of increasing demand for LPG, Aegis has envisaged a plan of setting up a new LPG terminal with a capacity of
anks of 22,500 MT each - at Kandla, which is in progress and is expected to be completed by
It has also approved brownfield capacity expansion for LPG at Pipavav port
MT by adding 2 new spheres over and above the existing 18,300 MT and setting up of LPG railway gantry
is expected to be completed by next fiscal and would be funded by internal accruals.
Total static and throughput LPG capacity post expansion would be 112,100 MT (existing capacity 63,300 MT) and 92m MT
(existing capacity 50m MT) respectively. It completed all major capacity expansions (almost timely) in gas division in FY18. It
implementation of two fully refrigerated tanks of static storage capacity of 25,000 MT with a throughput capacity of
2.5m MT and an LPG bottling plant at Haldia at a total project cost of Rs 250 crs and Rs 25 crs respectively in Q3FY18 (earlier
expected to be completed in H1FY18). Brownfield capacity expansion at Pipavav involving a capex of Rs 75 crs (static
capacity and throughput capacity pegged at 10200 MT and ~0.8m MT respectively) was also wrapped up in Q3FY18 (original
Aegis plans to set up an additional liquid terminal with storage capacity of 40,000 KL (current capacity 100,000 KL
port involving a capex of Rs 25 crs, slated to be completed in H2FY20. Another expansion of 20,000 KL of bulk liquid storage
ort with capex of Rs 15 crs is expected to be completed by Q4FY20. It has also
approved setting up of an additional storage capacity of 50,000 KL (existing capacity of 25,000 KL) at Mangalore port costing
Rs 35 crs, which is scheduled to be completed next fiscal.
Total liquid capacity post expansion would be ~799,000 KL (existing capacity of 689,000 KL) and all would be funded by
internal accruals. Yet, it is exposed to risk of delays in expansion plans. As witnessed in the past, greenfield expansion of
25,000 KL at Mangalore plant, earlier slated to be completed in FY18, was completed in H1FY19.
3
CD EquisearchPvt Ltd
istribution of Life Insurance
In view of increasing demand for LPG, Aegis has envisaged a plan of setting up a new LPG terminal with a capacity of
which is in progress and is expected to be completed by
It has also approved brownfield capacity expansion for LPG at Pipavav port by 3,800
MT by adding 2 new spheres over and above the existing 18,300 MT and setting up of LPG railway gantry, costing Rs 75 crs.
is expected to be completed by next fiscal and would be funded by internal accruals.
Total static and throughput LPG capacity post expansion would be 112,100 MT (existing capacity 63,300 MT) and 92m MT
all major capacity expansions (almost timely) in gas division in FY18. It
with a throughput capacity of
at a total project cost of Rs 250 crs and Rs 25 crs respectively in Q3FY18 (earlier
expected to be completed in H1FY18). Brownfield capacity expansion at Pipavav involving a capex of Rs 75 crs (static
wrapped up in Q3FY18 (original
Aegis plans to set up an additional liquid terminal with storage capacity of 40,000 KL (current capacity 100,000 KL) at Kandla
port involving a capex of Rs 25 crs, slated to be completed in H2FY20. Another expansion of 20,000 KL of bulk liquid storage
with capex of Rs 15 crs is expected to be completed by Q4FY20. It has also
approved setting up of an additional storage capacity of 50,000 KL (existing capacity of 25,000 KL) at Mangalore port costing
pacity of 689,000 KL) and all would be funded by
internal accruals. Yet, it is exposed to risk of delays in expansion plans. As witnessed in the past, greenfield expansion of
ed in H1FY19.

CD EquisearchPvt Ltd
Equities Derivatives Commoditie
Financials & Valuations
Aegis has posted not subdued revenue CAGR of 9.4% during FY15
driven by revenue growth in gas terminal division (revenue up 17.5% yoy). Better than expected performance of its new
LPG terminal at Haldia - it produced above 1m MT in FY19
as a key customer led to higher volumes (up by 29.0% yoy). With Mumbai terminal functioning at full capacity and
commissioning of additional capacities at Mangalore, Kandla and Haldia, liquid division witnessed topline uptick of 8.6%
(yoy).
Successful implementation of PMUY scheme in rural areas has increased LPG demand and with upcoming capacity
additions in gas terminal division as mentioned earlier (total
existing capacity of 50m MT), we expect the segment’s revenue to grow not modestly over the next two years;
growth of 17.7% and 15.2% estimated for FY20 and FY21 respectively, aided by average volume growth
FY19-21 period. Improved capacity utilization at Haldia,
at these ports (total liquid capacity post expansion would be ~799,000 KL; existing capacity 689,000 KL)
segment to report revenue growth at a CAGR of 17.8% in two years e
The fortunes of Indian logistics industry are closely tied with those of the
impacted by slowdown in auto sector as well as loan defaults by fleet operators who purchased new trucks
weak economy, demand for other types of freight has also fallen, severely impacting the financial health of transporters and
truck drivers. Many have deferred their purchase of heavy duty trucks, impactin
Ashok Leyland, to name a few, as well as their component suppliers.
4
CD EquisearchPvt Ltd
ities Distribution of Mutual Funds Dist
CAGR of 9.4% during FY15-19 period. Sales grew by 17.2% (yoy
driven by revenue growth in gas terminal division (revenue up 17.5% yoy). Better than expected performance of its new
it produced above 1m MT in FY19 - with capacity of 2.5m MT and successful addition of India
as a key customer led to higher volumes (up by 29.0% yoy). With Mumbai terminal functioning at full capacity and
commissioning of additional capacities at Mangalore, Kandla and Haldia, liquid division witnessed topline uptick of 8.6%
cessful implementation of PMUY scheme in rural areas has increased LPG demand and with upcoming capacity
additions in gas terminal division as mentioned earlier (total throughput LPG capacity post expansion would be 92m MT;
expect the segment’s revenue to grow not modestly over the next two years;
% estimated for FY20 and FY21 respectively, aided by average volume growth
utilization at Haldia, Kandla, Mangalore and Kochi, as well as further capacity additions
total liquid capacity post expansion would be ~799,000 KL; existing capacity 689,000 KL)
segment to report revenue growth at a CAGR of 17.8% in two years ending FY21.
The fortunes of Indian logistics industry are closely tied with those of the automobile sector.
impacted by slowdown in auto sector as well as loan defaults by fleet operators who purchased new trucks
weak economy, demand for other types of freight has also fallen, severely impacting the financial health of transporters and
truck drivers. Many have deferred their purchase of heavy duty trucks, impacting sales of CV makers like Tata M
yland, to name a few, as well as their component suppliers.
4
CD EquisearchPvt Ltd
istribution of Life Insurance
19 period. Sales grew by 17.2% (yoy) last fiscal, mainly
driven by revenue growth in gas terminal division (revenue up 17.5% yoy). Better than expected performance of its new
with capacity of 2.5m MT and successful addition of Indian Oil
as a key customer led to higher volumes (up by 29.0% yoy). With Mumbai terminal functioning at full capacity and
commissioning of additional capacities at Mangalore, Kandla and Haldia, liquid division witnessed topline uptick of 8.6%
cessful implementation of PMUY scheme in rural areas has increased LPG demand and with upcoming capacity
throughput LPG capacity post expansion would be 92m MT;
expect the segment’s revenue to grow not modestly over the next two years; revenue
% estimated for FY20 and FY21 respectively, aided by average volume growth of 14.8% during
Kandla, Mangalore and Kochi, as well as further capacity additions
total liquid capacity post expansion would be ~799,000 KL; existing capacity 689,000 KL) would help liquid
automobile sector. Logistics sector has been
impacted by slowdown in auto sector as well as loan defaults by fleet operators who purchased new trucks. With an overall
weak economy, demand for other types of freight has also fallen, severely impacting the financial health of transporters and
g sales of CV makers like Tata Motors,
CD EquisearchPvt Ltd
Equities Derivatives Commoditie
The stock currently trades at 22.3x FY20e EPS of Rs 7.96
poised to grow remarkably due to Government initiatives like the E
many others, which might also improve India’s
number 44. The government is also focusing o
(which currently stands at 14.4%). Yet, it faces numerous challenges in new technological applications, underdeveloped
material handling infrastructure, little awareness about using proper modes of transport for different uses, etc. GOI’s stron
push for cleaner fuels and the commitment to
increasing penetration of electric vehicles and government’ effort to promote electricity as cooking fuel demand scrutiny; t
Ministry of New and Renewable Energy (MNRE) has requested the
the cooking gas and kerosene subsidy (~ Rs 25,000 crore/year) towards solar photovolataic (PV) cooking.
expansion plans and its recent performance, we have margina
Given the recent performance, we assign ‘buy
on 24x FY21e EPS of Rs 9.27. For more information, refer to our November 2018 rep
5
CD EquisearchPvt Ltd
ities Distribution of Mutual Funds Dist
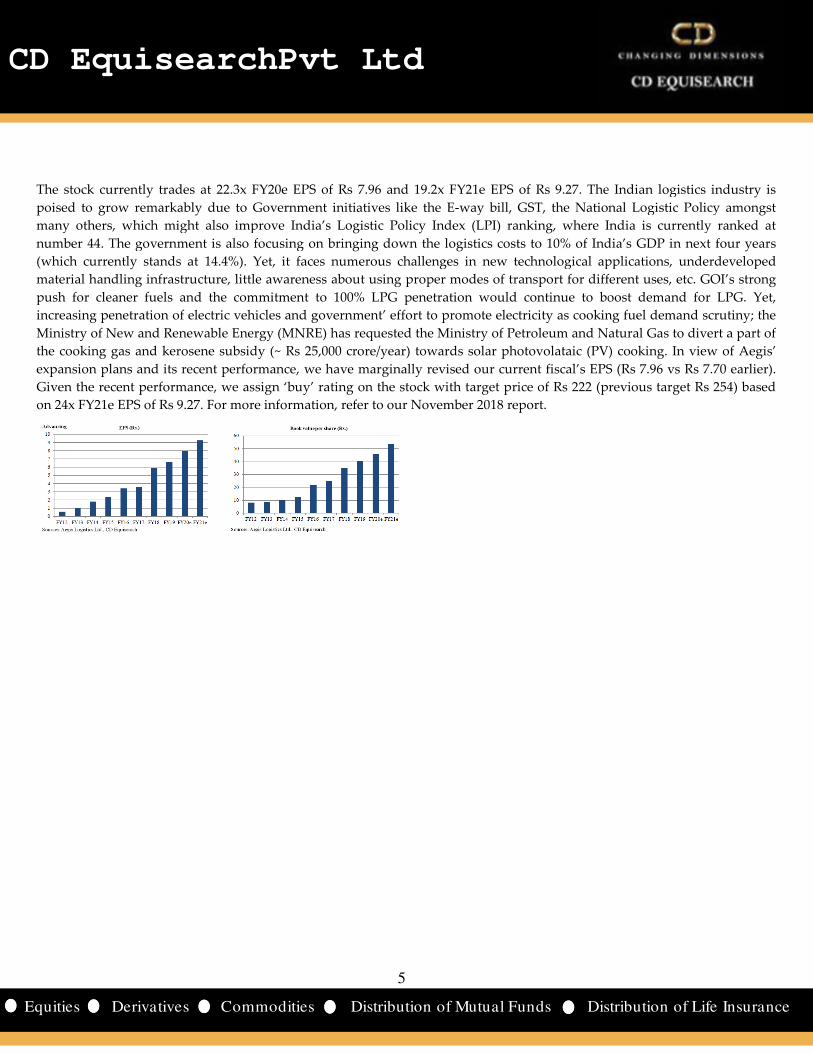
at 22.3x FY20e EPS of Rs 7.96 and 19.2x FY21e EPS of Rs 9.27. The Indian logistic
due to Government initiatives like the E-way bill, GST, the National Logistic Policy
many others, which might also improve India’s Logistic Policy Index (LPI) ranking, where India is currently ranked at
The government is also focusing on bringing down the logistics costs to 10% of India’s GDP in next four
Yet, it faces numerous challenges in new technological applications, underdeveloped
material handling infrastructure, little awareness about using proper modes of transport for different uses, etc. GOI’s stron
push for cleaner fuels and the commitment to 100% LPG penetration would continue to boost demand for LPG. Yet,
increasing penetration of electric vehicles and government’ effort to promote electricity as cooking fuel demand scrutiny; t
Ministry of New and Renewable Energy (MNRE) has requested the Ministry of Petroleum and Natural Gas
Rs 25,000 crore/year) towards solar photovolataic (PV) cooking.
expansion plans and its recent performance, we have marginally revised our current fiscal’s EPS (Rs
buy’ rating on the stock with target price of Rs 222 (pre
7. For more information, refer to our November 2018 report.
5
CD EquisearchPvt Ltd
istribution of Life Insurance
The Indian logistics industry is
way bill, GST, the National Logistic Policy amongst
India is currently ranked at
of India’s GDP in next four years
Yet, it faces numerous challenges in new technological applications, underdeveloped
material handling infrastructure, little awareness about using proper modes of transport for different uses, etc. GOI’s strong
100% LPG penetration would continue to boost demand for LPG. Yet,
increasing penetration of electric vehicles and government’ effort to promote electricity as cooking fuel demand scrutiny; the
y of Petroleum and Natural Gas to divert a part of
Rs 25,000 crore/year) towards solar photovolataic (PV) cooking. In view of Aegis’
S (Rs 7.96 vs Rs 7.70 earlier).
(previous target Rs 254) based
CD EquisearchPvt Ltd
Equities Derivatives Commoditie
Cross Sectional Analysis
Company Equity CMP MCAP*
Aegis Log. 34 178 6034
Gati Ltd. 22 57 617
Transport Corp 15 284 2184
Allcargo Log. 49 110 2690
Container Corp 305 619 37688 *figures in crores; calculations on ttm basis; consolidated data as available on June Businesses of companies mentioned in exhibit are not truly comparable.
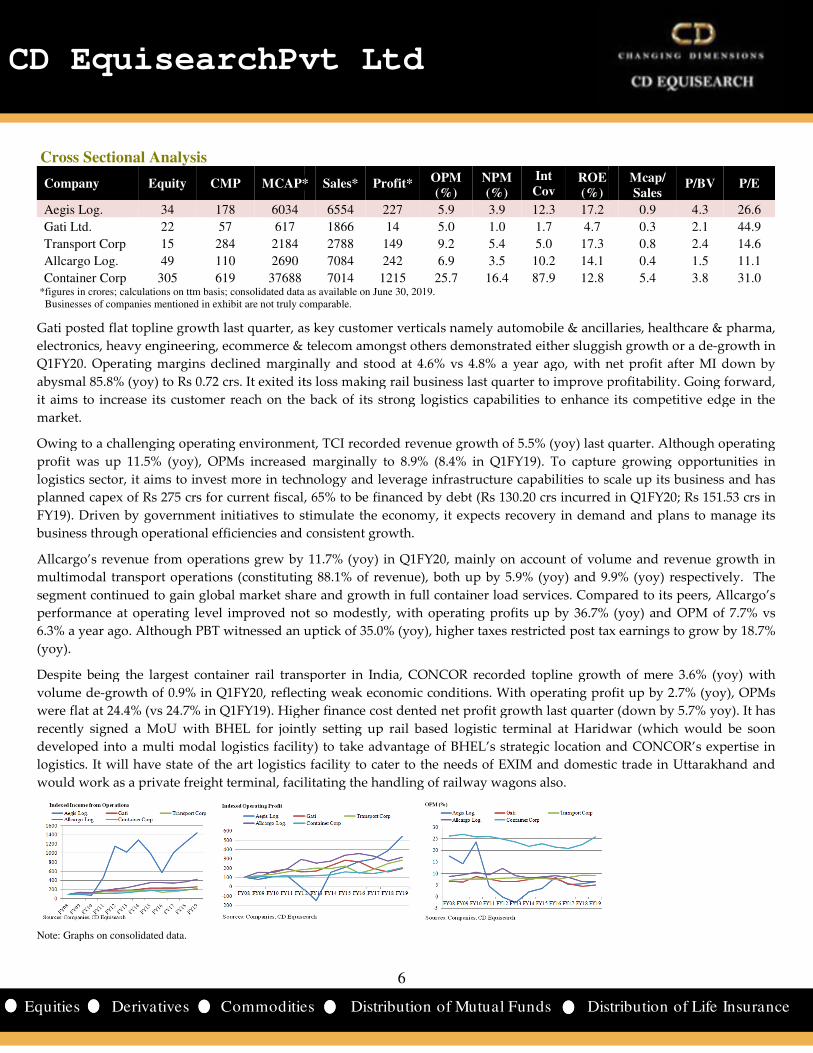
Gati posted flat topline growth last quarter, as
electronics, heavy engineering, ecommerce & t
Q1FY20. Operating margins declined marginally and stood at 4.6% vs 4.8% a year ago, with net profit after MI down by
abysmal 85.8% (yoy) to Rs 0.72 crs. It exited its loss making rail business last quarter to improve profitability. Going forw
it aims to increase its customer reach on the back of its strong logistics capabilities to enhance its competitive edge in the
market.
Owing to a challenging operating environment, TCI recorded revenue growth of 5.5% (yoy) last quarter. Although operating
profit was up 11.5% (yoy), OPMs increased marginally to 8.9% (8.4% in Q1FY19). To capture growing opportunities in
logistics sector, it aims to invest more in technology and leverage infrastructure capabilities to scale up its business and
planned capex of Rs 275 crs for current fiscal, 65% to be financed by debt (Rs 130.20 crs incurred in Q1FY20; Rs 151.53 crs in
FY19). Driven by government initiatives to stimulate the economy, it expects recovery in demand and plans to manage its
business through operational efficiencies and
Allcargo’s revenue from operations grew by 11.7% (yoy) in Q1FY20, mainly on account of volume and revenue growth in
multimodal transport operations (constituting 88.1% of revenue), both up by 5.9% (yoy) and 9.9% (yoy) respectively. Th
segment continued to gain global market share and growth in full container load services. Compared to its peers, Allcargo’s
performance at operating level improved not so modestly, with operating profits up by 36.7% (yoy) and OPM of 7.7% vs
6.3% a year ago. Although PBT witnessed an uptick of 35.0% (yoy), higher taxes restricted post tax earnings to grow by 18.7%
(yoy).
Despite being the largest container rail transporter in India, CONCOR recorded topline growth of mere 3.6% (yoy) with
volume de-growth of 0.9% in Q1FY20, reflecting weak economic conditions. With operating profit up by 2.7% (yoy), OPMs
were flat at 24.4% (vs 24.7% in Q1FY19). Higher finance cost dented net profit growth last quarter (down by 5.7% yoy). It has
recently signed a MoU with BHEL for jointly setting up rail based logistic terminal at Haridwar (which would be soon
developed into a multi modal logistics facility) to take advantage of BHEL’s strategic location and CONCOR’s expertise in
logistics. It will have state of the art logistics facility to cater to the needs of EXIM and domestic trade in Uttarakhand and
would work as a private freight terminal, facilitating the handling of railway wagons also.
Note: Graphs on consolidated data.
6
CD EquisearchPvt Ltd
ities Distribution of Mutual Funds Dist
MCAP* Sales* Profit* OPM (%)
NPM (%)
Int Cov
ROE (%)
6554 227 5.9 3.9 12.3 17.2
1866 14 5.0 1.0 1.7 4.7
2788 149 9.2 5.4 5.0 17.3
7084 242 6.9 3.5 10.2 14.1
7014 1215 25.7 16.4 87.9 12.8 idated data as available on June 30, 2019.
comparable.
pline growth last quarter, as key customer verticals namely automobile & ancillaries, healthcare & pharma,
electronics, heavy engineering, ecommerce & telecom amongst others demonstrated either sluggish gr
clined marginally and stood at 4.6% vs 4.8% a year ago, with net profit after MI down by
abysmal 85.8% (yoy) to Rs 0.72 crs. It exited its loss making rail business last quarter to improve profitability. Going forw
h on the back of its strong logistics capabilities to enhance its competitive edge in the
Owing to a challenging operating environment, TCI recorded revenue growth of 5.5% (yoy) last quarter. Although operating
), OPMs increased marginally to 8.9% (8.4% in Q1FY19). To capture growing opportunities in
logistics sector, it aims to invest more in technology and leverage infrastructure capabilities to scale up its business and
ent fiscal, 65% to be financed by debt (Rs 130.20 crs incurred in Q1FY20; Rs 151.53 crs in
FY19). Driven by government initiatives to stimulate the economy, it expects recovery in demand and plans to manage its
consistent growth.
Allcargo’s revenue from operations grew by 11.7% (yoy) in Q1FY20, mainly on account of volume and revenue growth in
multimodal transport operations (constituting 88.1% of revenue), both up by 5.9% (yoy) and 9.9% (yoy) respectively. Th
segment continued to gain global market share and growth in full container load services. Compared to its peers, Allcargo’s
performance at operating level improved not so modestly, with operating profits up by 36.7% (yoy) and OPM of 7.7% vs
go. Although PBT witnessed an uptick of 35.0% (yoy), higher taxes restricted post tax earnings to grow by 18.7%
Despite being the largest container rail transporter in India, CONCOR recorded topline growth of mere 3.6% (yoy) with
f 0.9% in Q1FY20, reflecting weak economic conditions. With operating profit up by 2.7% (yoy), OPMs
were flat at 24.4% (vs 24.7% in Q1FY19). Higher finance cost dented net profit growth last quarter (down by 5.7% yoy). It has
L for jointly setting up rail based logistic terminal at Haridwar (which would be soon
developed into a multi modal logistics facility) to take advantage of BHEL’s strategic location and CONCOR’s expertise in
ics facility to cater to the needs of EXIM and domestic trade in Uttarakhand and
would work as a private freight terminal, facilitating the handling of railway wagons also.
6
CD EquisearchPvt Ltd
istribution of Life Insurance
ROE
Mcap/ Sales
P/BV P/E
0.9 4.3 26.6
0.3 2.1 44.9
0.8 2.4 14.6
0.4 1.5 11.1
5.4 3.8 31.0
customer verticals namely automobile & ancillaries, healthcare & pharma,
sluggish growth or a de-growth in
clined marginally and stood at 4.6% vs 4.8% a year ago, with net profit after MI down by
abysmal 85.8% (yoy) to Rs 0.72 crs. It exited its loss making rail business last quarter to improve profitability. Going forward,
h on the back of its strong logistics capabilities to enhance its competitive edge in the
Owing to a challenging operating environment, TCI recorded revenue growth of 5.5% (yoy) last quarter. Although operating
), OPMs increased marginally to 8.9% (8.4% in Q1FY19). To capture growing opportunities in
logistics sector, it aims to invest more in technology and leverage infrastructure capabilities to scale up its business and has
ent fiscal, 65% to be financed by debt (Rs 130.20 crs incurred in Q1FY20; Rs 151.53 crs in
FY19). Driven by government initiatives to stimulate the economy, it expects recovery in demand and plans to manage its
Allcargo’s revenue from operations grew by 11.7% (yoy) in Q1FY20, mainly on account of volume and revenue growth in
multimodal transport operations (constituting 88.1% of revenue), both up by 5.9% (yoy) and 9.9% (yoy) respectively. The
segment continued to gain global market share and growth in full container load services. Compared to its peers, Allcargo’s
performance at operating level improved not so modestly, with operating profits up by 36.7% (yoy) and OPM of 7.7% vs
go. Although PBT witnessed an uptick of 35.0% (yoy), higher taxes restricted post tax earnings to grow by 18.7%
Despite being the largest container rail transporter in India, CONCOR recorded topline growth of mere 3.6% (yoy) with
f 0.9% in Q1FY20, reflecting weak economic conditions. With operating profit up by 2.7% (yoy), OPMs
were flat at 24.4% (vs 24.7% in Q1FY19). Higher finance cost dented net profit growth last quarter (down by 5.7% yoy). It has
L for jointly setting up rail based logistic terminal at Haridwar (which would be soon
developed into a multi modal logistics facility) to take advantage of BHEL’s strategic location and CONCOR’s expertise in
ics facility to cater to the needs of EXIM and domestic trade in Uttarakhand and
CD EquisearchPvt Ltd
Equities Derivatives Commoditie
Financials
Consolidated Quarterly Results Q1FY20
Income From Operations 1955.28
Other Income 6.22
Total Income 1961.50
Total Expenditure 1853.27
EBITDA (other income included) 108.23
Interest 8.49
Depreciation 15.89
PBT 83.85
Tax 21.53
PAT 62.32
Minority Interest 5.37
PAT after MI 56.95
EO -
Adjusted Net Profit 56.95
EPS(Rs) 1.71
Consolidated Segment Results Q1FY20
Segment Revenue
Liquid Terminal Division 49.46
Gas Terminal Division 1905.82
Segment Revenue 1955.28
Segment EBIT
Liquid Terminal Division 24.22
Gas Terminal Division 73.77
Sub Total 97.99
Interest 8.49
Other Unallocable Exp. (net) 5.65
PBT 83.85
7
CD EquisearchPvt Ltd
ities Distribution of Mutual Funds Dist
Consolidated Quarterly Results Figures in Rs crs
Q1FY20 Q1FY19 % chg. FY19 FY18
1955.28 1016.85 92.3 5615.82 4790.96
1.17 431.6 8.19 8.35
1961.50 1018.02 92.7 5624.01 4799.31
1853.27 930.42 99.2 5244.95 4524.96
108.23 87.60 23.6 379.06 274.35
6.53 30.0 26.19 15.23
15.89 12.09 31.4 50.54 34.31
83.85 68.98 21.6 302.33 224.82
21.53 9.81 119.5 50.22 11.01
62.32 59.17 5.3 252.11 213.80
7.53 -28.7 30.72 16.00
56.95 51.64 10.3 221.39 197.81
- - 0.01 -
56.95 51.64 10.3 221.38 197.81
1.55 10.3 6.63 5.92
Consolidated Segment Results Figures in Rs crs
Q1FY19 % chg. FY19 FY18
45.45 8.8 182.80 168.28
971.40 96.2 5433.02 4622.68
1016.85 92.3 5615.82 4790.96
22.96 5.5 78.33 84.80
58.59 25.9 286.90 184.36
81.55 20.2 365.23 269.16
6.53 30.0 26.19 15.23
6.04 -6.5 36.72 29.12
68.98 21.6 302.33 224.82
7
CD EquisearchPvt Ltd
istribution of Life Insurance
Figures in Rs crs
% chg.
4790.96 17.2
-2.0
4799.31 17.2
4524.96 15.9
274.35 38.2
72.0
47.3
224.82 34.5
356.1
213.80 17.9
92.0
197.81 11.9
-
197.81 11.9
11.9
Figures in Rs crs
% chg.
8.6
4622.68 17.5
4790.96 17.2
-7.6
55.6
35.7
72.0
26.1
34.5

CD EquisearchPvt Ltd
Equities Derivatives Commoditie
Financials
Consolidated Income Statement
FY17
Income From Operations 3930.29
Growth (%) 77.6
Other Income 5.72
Total Income 3936.01
Total Expenditure 3726.72
EBITDA (other income included) 209.29
Interest 16.34
Depreciation 23.81
PBT 169.13
Tax 36.16
PAT 132.97
Minority Interest 13.74
PAT after MI 119.23
EO 0.01
Adjusted Net Profit 119.22
EPS (Rs) 3.57
Segment Results
FY17
Segment Revenue
Liquid Terminal Division 153.88
Gas Terminal Division 3776.41
Segment Revenue 3930.29
Segment EBIT
Liquid Terminal Division 72.97
Gas Terminal Division 139.73
Sub Total 212.70
Interest 16.34
Other Unallocable Exp. (net) 27.22
PBT 169.13
8
CD EquisearchPvt Ltd
ities Distribution of Mutual Funds Dist
Consolidated Income Statement Figures in Rs crs
FY17 FY18 FY19 FY20e FY21e
3930.29 4790.96 5615.82 6621.91 7621.17
77.6 21.9 17.2 17.9
5.72 8.35 8.19 10.29 12.02
3936.01 4799.31 5624.01 6632.20 7633.18
3726.72 4524.96 5244.95 6183.58 7114.95
209.29 274.35 379.06 448.62 518.23
16.34 15.23 26.19 24.16 23.37
23.81 34.31 50.54 62.02 76.85
169.13 224.82 302.33 362.44 418.01
36.16 11.01 50.22 61.61 71.06
132.97 213.80 252.11 300.83 346.95
13.74 16.00 30.72 30.50 32.20
119.23 197.81 221.39 270.33 314.75
0.01 - 0.01 -
119.22 197.81 221.38 270.33 314.75
3.57 5.92 6.63 7.96
Segment Results Figures in Rs crs
FY17 FY18 FY19 FY20e FY21e
153.88 168.28 182.80 227.56 253.57
3776.41 4622.68 5433.02 6394.35 7367.60
3930.29 4790.96 5615.82 6621.91 7621.17
72.97 84.80 78.33 109.23 121.71
139.73 184.36 286.90 319.72 368.38
212.70 269.16 365.23 428.95 490.09
16.34 15.23 26.19 24.16 23.37
27.22 29.12 36.72 42.35 48.71
169.13 224.82 302.33 362.44 418.01
8
CD EquisearchPvt Ltd
istribution of Life Insurance
Figures in Rs crs
FY21e
7621.17
15.1
12.02
7633.18
7114.95
518.23
23.37
76.85
418.01
71.06
346.95
32.20
314.75
-
314.75
9.27
Figures in Rs crs
FY21e
253.57
7367.60
7621.17
121.71
368.38
490.09
23.37
48.71
418.01
CD EquisearchPvt Ltd
Equities Derivatives Commoditie
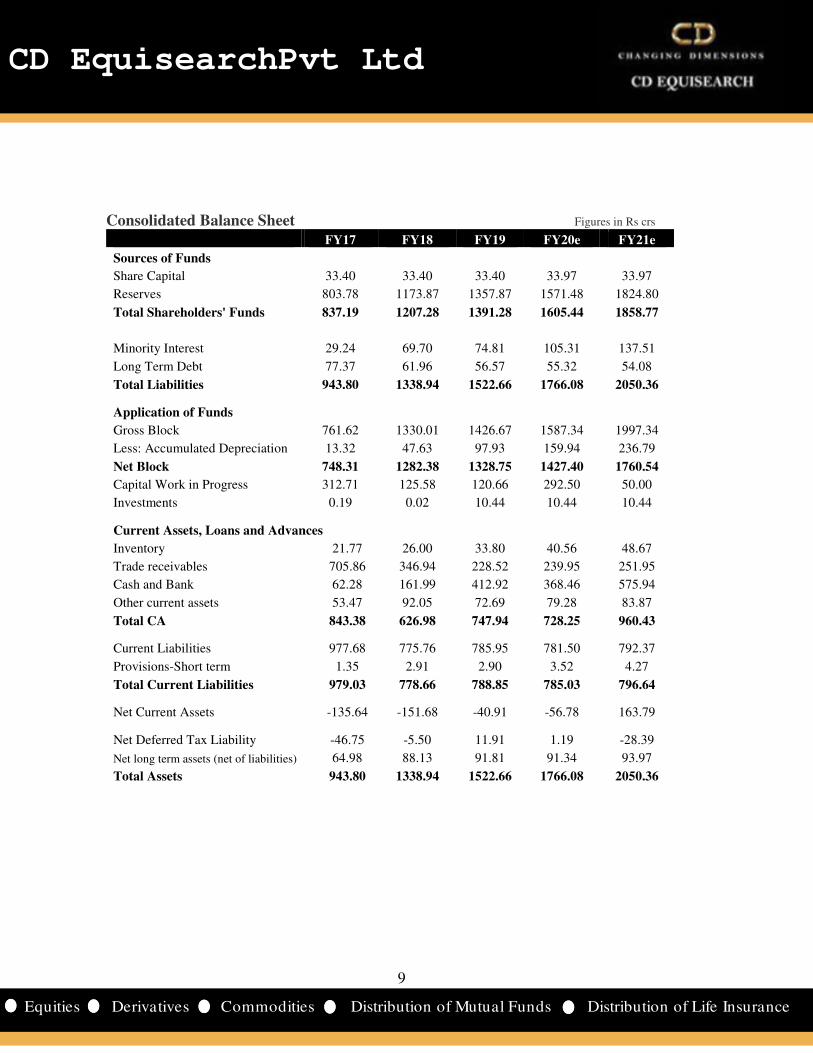
Consolidated Balance Sheet
Sources of Funds
Share Capital
Reserves
Total Shareholders' Funds
Minority Interest
Long Term Debt
Total Liabilities
Application of Funds
Gross Block
Less: Accumulated Depreciation
Net Block
Capital Work in Progress
Investments
Current Assets, Loans and Advances
Inventory
Trade receivables
Cash and Bank
Other current assets
Total CA
Current Liabilities
Provisions-Short term
Total Current Liabilities
Net Current Assets
Net Deferred Tax Liability
Net long term assets (net of liabilities)
Total Assets
9
CD EquisearchPvt Ltd
ities Distribution of Mutual Funds Dist
Figures in Rs crs
FY17 FY18 FY19 FY20e
33.40 33.40 33.40 33.97
803.78 1173.87 1357.87 1571.48
837.19 1207.28 1391.28 1605.44
29.24 69.70 74.81 105.31
77.37 61.96 56.57 55.32
943.80 1338.94 1522.66 1766.08
761.62 1330.01 1426.67 1587.34
13.32 47.63 97.93 159.94
748.31 1282.38 1328.75 1427.40
312.71 125.58 120.66 292.50
0.19 0.02 10.44 10.44
Current Assets, Loans and Advances
21.77 26.00 33.80 40.56
705.86 346.94 228.52 239.95
62.28 161.99 412.92 368.46
53.47 92.05 72.69 79.28
843.38 626.98 747.94 728.25
977.68 775.76 785.95 781.50
1.35 2.91 2.90 3.52
979.03 778.66 788.85 785.03
-135.64 -151.68 -40.91 -56.78
-46.75 -5.50 11.91 1.19
64.98 88.13 91.81 91.34
943.80 1338.94 1522.66 1766.08
9
CD EquisearchPvt Ltd
istribution of Life Insurance
Figures in Rs crs FY21e
33.97
1824.80
1858.77
137.51
54.08
2050.36
1997.34
236.79
1760.54
50.00
10.44
48.67
251.95
575.94
83.87
960.43
792.37
4.27
796.64
163.79
-28.39
93.97
2050.36

CD EquisearchPvt Ltd
Equities Derivatives Commoditie
Key Financial Ratios FY17
Growth Ratios(%)
Revenue 77.6
EBITDA 8.0
Net Profit 5.2
EPS 5.2
Margins (%)
Operating Profit Margin 5.2
Gross profit Margin 4.9
Net Profit Margin 3.4
Return (%)
ROCE 13.9
ROE 15.4
Valuations
Market Cap/ Sales 1.7
EV/EBITDA 32.1
P/E 54.5
P/BV 7.9
Other Ratios
Interest Coverage 11.3
Debt Equity 0.3
Net Debt-Equity Ratio 0.3
Current Ratio 0.9
Turnover Ratios
Fixed Asset Turnover 5.2
Total Asset Turnover 4.4
Inventory Turnover 223.9
Debtors Turnover 9.8
Creditor Turnover 9.9
WC Ratios
Inventory Days 1.6
Debtor Days 37.3
Creditor Days 37.0
Cash Conversion Cycle 2.0
10
CD EquisearchPvt Ltd
ities Distribution of Mutual Funds Dist
FY18 FY19 FY20e FY21e
21.9 17.2 17.9 15.1
31.1 38.2 18.4 15.5
65.9 11.9 22.1 16.4
65.9 11.9 20.1 16.4
5.6 6.6 6.6 6.6
5.4 6.3 6.4 6.5
4.5 4.5 4.5 4.6
17.0 17.0 18.1 18.1
19.8 17.5 18.5 18.6
1.8 1.2 0.9 0.8
32.1 17.4 13.0 11.3
43.8 30.7 22.3 19.2
7.4 5.0 3.9 3.3
15.8 12.5 16.0 18.9
0.2 0.2 0.1 0.1
0.1 -0.1 -0.1 -0.2
0.8 0.9 0.9 1.2
4.7 4.3 4.8 4.8
4.3 4.0 4.1 4.1
189.5 175.4 166.3 159.5
9.1 19.5 28.3 31.0
8.6 12.1 12.4 13.8
1.9 2.1 2.2 2.3
40.1 18.7 12.9 11.8
42.6 30.1 29.4 26.4
-0.6 -9.3 -14.3 -12.3
10
CD EquisearchPvt Ltd
istribution of Life Insurance

CD EquisearchPvt Ltd
Equities Derivatives Commoditie
Cumulative Financial Data Figures in Rs crs FY10-12 FY13
Liquid Terminal Division 260
Gas Terminal Division 6320
Income from operations** 6580
Operating profit 150
EBIT 219
PBT 157
PAT after MI 109
Dividends 35 OPM (%) 2.3
NPM (%) 1.7
ROE (%) 16.8
ROCE (%) 3.8
Interest Coverage 3.5
Debt Equity* 7.5
Fixed asset turnover 10.1
Debtors turnover 8.0
Inventory turnover 238.2
Creditors turnover 8.2
Debtor days 45.7
Inventory days 1.5
Creditor days 44.6
Cash conversion 2.7
Dividend payout ratio (%) 32.4
FY10-12 implies three year period ending fiscal 12;*as on terminal year
Aegis posted cumulative topline growth of 2.0x during FY13
which improved largely due to higher offtake by national oil companies during
however failed to improve – 1.2% during FY13
on forward and currency option contracts in FY13. Decline in international LPG prices in FY16 and
of AGI as an international vendor affected cumulative revenues during FY16
overall volume due to sharp increase in LPG demand, commissioning of an additional 2700 MT of LPG storage capacity at
Pipavav in FY17 and the operational debottlenecking at the
18 period (see table).
With expansions undertaken in the recent past and rise in LPG consumption, we expect Aegi
81.6% during three year period ending FY21. With most
would improve to 0.1. Rise in earnings and reduced interest cost would result in interest coverage of 15.7.
utilization would perk up margins (see table). Return ratios
respectively during FY19-21 period.
11
CD EquisearchPvt Ltd
ities Distribution of Mutual Funds Dist
FY13-15 FY16-18 FY19-21e
392 493 664
12537 10442 19195
12929 10934 19859
151 655 1315
343 596 1156
244 547 1083
174 430 806
59 121 183
1.2 6.0 6.6
1.5 4.3 4.5
16.7 18.0 18.0
5.8 15.5 17.2
3.5 12.1 15.7
0.5 0.2 0.1
13.0 4.2 4.4
11.9 13.3 22.1
263.2 147.8 165.6
12.5 12.0 13.8
30.7 27.4 16.5
1.4 2.5 2.2
29.3 30.4 26.5
2.8 -0.5 -7.8
29.8 28.2 22.7
terminal year; ** includes other operating income
Aegis posted cumulative topline growth of 2.0x during FY13-15 period, mainly driven by growth in gas terminal division,
largely due to higher offtake by national oil companies during FY14. Cumulative operating margins
1.2% during FY13-15 period vs 2.3% during FY10-12 period – due to amortization of premium
in FY13. Decline in international LPG prices in FY16 and
ected cumulative revenues during FY16-18 period (see table). But improvement of
overall volume due to sharp increase in LPG demand, commissioning of an additional 2700 MT of LPG storage capacity at
Pipavav in FY17 and the operational debottlenecking at the Mumbai LPG terminal, improved overall margins during FY16
With expansions undertaken in the recent past and rise in LPG consumption, we expect Aegi
% during three year period ending FY21. With most of the capex funded through internal accruals, debt/equity
earnings and reduced interest cost would result in interest coverage of 15.7.
utilization would perk up margins (see table). Return ratios – ROE and ROCE – would stand at 18.0% and 17.2%
11
CD EquisearchPvt Ltd
istribution of Life Insurance
15 period, mainly driven by growth in gas terminal division,
FY14. Cumulative operating margins
due to amortization of premium
in FY13. Decline in international LPG prices in FY16 and delay in the registration
18 period (see table). But improvement of
overall volume due to sharp increase in LPG demand, commissioning of an additional 2700 MT of LPG storage capacity at
Mumbai LPG terminal, improved overall margins during FY16-
With expansions undertaken in the recent past and rise in LPG consumption, we expect Aegis to post revenue growth of
of the capex funded through internal accruals, debt/equity further
earnings and reduced interest cost would result in interest coverage of 15.7. Higher capacity
would stand at 18.0% and 17.2%

CD EquisearchPvt Ltd
Equities Derivatives Commoditie
Financial Summary- US Dollar denominated million $ FY17 FY18
Equity capital 5.2
Shareholders' funds 127.1 181.19
Total debt 44.2
Net fixed assets (incl. CWIP) 163.4 216.3
Investments 0.0
Net current assets -22.8 -
Total assets 143.5 201.4 Revenues 585.8 743.4
EBITDA 31.2
EBDT 28.8
PBT 25.2
PAT 17.8
EPS($) 0.05
Book value ($) 0.38
Income statement figures translated at average rates; balance sheet All dollar denominated figures are adjusted for extraordinary items.
12
CD EquisearchPvt Ltd
ities Distribution of Mutual Funds Dist
US Dollar denominated FY18 FY19 FY20e FY21e
5.1 4.8 4.8 4.8
181.19 195.7 220.5 255.6
46.7 34.5 30.4 30.6
216.3 209.4 242.4 255.2
0.0 1.5 1.5 1.5
-27.6 -11.2 -13.8 16.7
201.4 214.7 243.1 282.7
743.4 803.5 934.0 1074.9
42.6 54.2 63.3 73.1
40.2 50.5 59.9 69.8
34.9 43.3 51.1 59.0
30.7 31.7 38.1 44.4
0.09 0.09 0.11 0.13
0.54 0.59 0.65 0.75
tes; balance sheet at year end rates; projections at current rates (Rs 70.90/$).All dollar denominated figures are adjusted for extraordinary items.
12
CD EquisearchPvt Ltd
istribution of Life Insurance
; projections at current rates (Rs 70.90/$).

CD EquisearchPvt Ltd
Equities Derivatives Commoditie
Disclosure & Disclaimer CD Equisearch Private Limited (hereinafter referred to as
Limited, Bombay Stock Exchange Limited and Metropolitan Stock Exchange of India Limited (Formerly known as MCX Stock Exchange
Limited). CD Equi is also registered as Depository Participant with
CD Equi are engaged in activities relating to NBFC
CD Equi is registered under SEBI (Research Analysts) Regulations, 201
hereby declares that –
• No disciplinary action has been taken against CD Equi by any of the regulatory authorities.
• CD Equi/its associates/research analysts do not have any financial interest/benef
conflict of interest in the subject company(s)
• CD Equi/its associates/research analysts have not received any compensation from the subject company(s) during the past twelv
months.
• CD Equi/its research analysts has not served as an officer, director or employee of company covered by analysts and has not b
engaged in market making activity of the company covered by analysts
This document is solely for the personal informa
decision. Nothing in this document should be construed as investment or financial advice. Each recipient of this document sho
such investigations as they deem necessary to arrive at an independent evaluation of an investment in the securities of the companies
referred to in this document (including the merits and risks involved) and should consult their own advisors to determine the
risks of such an investment.
Reports based on technical and derivative analysis center on studying charts of a stock's price movement, outstanding positio
trading volume, as opposed to focusing on a company's fundamentals and as such, may not match with a report on a co
fundamentals.
The information in this document has been printed on the basis of publicly available information, internal data and other rel
believed to be true but we do not represent that it is accurate or complete and it should not be relied on as such, a
general guidance only. CD Equi or any of its affiliates/group companies shall not be in any way responsible for any loss or d
may arise to any person from any inadvertent error in the information contained in this report. C
the information contained within this document. Accordingly, we cannot testify nor make any representation or warranty, expre
implied, to the accuracy, contents or data contained within this document.
While, CD Equi endeavors to update on a reasonable basis the information discussed in this material, there may be regulatory complia
or other reasons that prevent us from doing so.
This document is being supplied to you solely for your information and its co
redistributed or passed on, directly or indirectly. Neither, CD Equi nor its directors, employees or affiliates shall be liab
damage that may arise from or in connection with the use of t
CD Equisearch Private Limited (CIN: U67120WB1995PTC071521)
Registered Office: 37, Shakespeare Sarani, 3rd Floor, Kolkata
10, Vasawani Mansion, 5th Floor, Dinshaw Wachha Road, Churchgate, Mumbai
2283, 2276 Website: www.cdequi.com; Email: [email protected]
buy: >20% accumulate: >10% to ≤20% hold:
Exchange Rates Used- Indicative
Rs/$ FY16 FY17
Average 65.46 67.09
Year end 66.33 64.84
All $ values mentioned in the write-up translated at the average rate of the respective quarter/ year as applicable. Projections
current exchange rate. Cumulative dollar figure is the sum of respective yearly dollar value
13
CD EquisearchPvt Ltd
ities Distribution of Mutual Funds Dist
CD Equisearch Private Limited (hereinafter referred to as ‘CD Equi’) is a Member registered with National Stock Exchange of India
Limited, Bombay Stock Exchange Limited and Metropolitan Stock Exchange of India Limited (Formerly known as MCX Stock Exchange
Limited). CD Equi is also registered as Depository Participant with CDSL and AMFI registered Mutual Fund Advisor. The associates of
CD Equi are engaged in activities relating to NBFC-ND - Financing and Investment, Commodity Broking, Real Estate, etc.
CD Equi is registered under SEBI (Research Analysts) Regulations, 2014 with SEBI Registration no INH300002274. Further, CD Equi
No disciplinary action has been taken against CD Equi by any of the regulatory authorities.
CD Equi/its associates/research analysts do not have any financial interest/beneficial interest of more than one percent/material
conflict of interest in the subject company(s) (kindly disclose if otherwise).
CD Equi/its associates/research analysts have not received any compensation from the subject company(s) during the past twelv
CD Equi/its research analysts has not served as an officer, director or employee of company covered by analysts and has not b
engaged in market making activity of the company covered by analysts.
This document is solely for the personal information of the recipient and must not be singularly used as the basis of any investment
decision. Nothing in this document should be construed as investment or financial advice. Each recipient of this document sho
ssary to arrive at an independent evaluation of an investment in the securities of the companies
referred to in this document (including the merits and risks involved) and should consult their own advisors to determine the
Reports based on technical and derivative analysis center on studying charts of a stock's price movement, outstanding positio
trading volume, as opposed to focusing on a company's fundamentals and as such, may not match with a report on a co
The information in this document has been printed on the basis of publicly available information, internal data and other rel
believed to be true but we do not represent that it is accurate or complete and it should not be relied on as such, a
general guidance only. CD Equi or any of its affiliates/group companies shall not be in any way responsible for any loss or d
may arise to any person from any inadvertent error in the information contained in this report. CD Equi has not independently verified all
the information contained within this document. Accordingly, we cannot testify nor make any representation or warranty, expre
implied, to the accuracy, contents or data contained within this document.
CD Equi endeavors to update on a reasonable basis the information discussed in this material, there may be regulatory complia
This document is being supplied to you solely for your information and its contents, information or data may not be reproduced,
redistributed or passed on, directly or indirectly. Neither, CD Equi nor its directors, employees or affiliates shall be liab
damage that may arise from or in connection with the use of this information.
CD Equisearch Private Limited (CIN: U67120WB1995PTC071521)
Floor, Kolkata – 700 017; Phone: +91(33) 4488 0000; Fax: +91(33) 2289 2557 Corporate Office:
Wachha Road, Churchgate, Mumbai – 400 020. Phone: +91(22) 2283 0652/0653; Fax: +91(22)
2283, 2276 Website: www.cdequi.com; Email: [email protected]
hold: ≥-10% to ≤10% reduce: ≥-20% to <-10% sell:
FY18 FY19
64.45 69.89
65.04 69.17
up translated at the average rate of the respective quarter/ year as applicable. Projections
current exchange rate. Cumulative dollar figure is the sum of respective yearly dollar value.
13
CD EquisearchPvt Ltd
istribution of Life Insurance
) is a Member registered with National Stock Exchange of India
Limited, Bombay Stock Exchange Limited and Metropolitan Stock Exchange of India Limited (Formerly known as MCX Stock Exchange
CDSL and AMFI registered Mutual Fund Advisor. The associates of
Financing and Investment, Commodity Broking, Real Estate, etc.
4 with SEBI Registration no INH300002274. Further, CD Equi
icial interest of more than one percent/material
CD Equi/its associates/research analysts have not received any compensation from the subject company(s) during the past twelve
CD Equi/its research analysts has not served as an officer, director or employee of company covered by analysts and has not been
tion of the recipient and must not be singularly used as the basis of any investment
decision. Nothing in this document should be construed as investment or financial advice. Each recipient of this document should make
ssary to arrive at an independent evaluation of an investment in the securities of the companies
referred to in this document (including the merits and risks involved) and should consult their own advisors to determine the merits and
Reports based on technical and derivative analysis center on studying charts of a stock's price movement, outstanding positions and
trading volume, as opposed to focusing on a company's fundamentals and as such, may not match with a report on a company's
The information in this document has been printed on the basis of publicly available information, internal data and other reliable sources
believed to be true but we do not represent that it is accurate or complete and it should not be relied on as such, as this document is for
general guidance only. CD Equi or any of its affiliates/group companies shall not be in any way responsible for any loss or damage that
D Equi has not independently verified all
the information contained within this document. Accordingly, we cannot testify nor make any representation or warranty, express or
CD Equi endeavors to update on a reasonable basis the information discussed in this material, there may be regulatory compliance
ntents, information or data may not be reproduced,
redistributed or passed on, directly or indirectly. Neither, CD Equi nor its directors, employees or affiliates shall be liable for any loss or
700 017; Phone: +91(33) 4488 0000; Fax: +91(33) 2289 2557 Corporate Office:
400 020. Phone: +91(22) 2283 0652/0653; Fax: +91(22)
sell: <-20%
up translated at the average rate of the respective quarter/ year as applicable. Projections converted at