cd83 expression is essential for treg cell · cd83 expression is essential for treg cell...
TRANSCRIPT
CD83 expression is essential for Treg celldifferentiation and stability
Marina Doebbeler, … , Alexander Steinkasserer, MatthiasLechmann
JCI Insight. 2019;3(11):e99712. https://doi.org/10.1172/jci.insight.99712.
Foxp3-positive regulatory T cells (Tregs) are crucial for the maintenance of immunehomeostasis and keep immune responses in check. Upon activation, Tregs are transferredinto an effector state expressing transcripts essential for their suppressive activity, migration,and survival. However, it is not completely understood how different intrinsic andenvironmental factors control differentiation. Here, we present for the first time to ourknowledge data suggesting that Treg-intrinsic expression of CD83 is essential for Tregdifferentiation upon activation. Interestingly, mice with Treg-intrinsic CD83 deficiency arecharacterized by a proinflammatory phenotype. Furthermore, the loss of CD83 expressionby Tregs leads to the downregulation of Treg-specific differentiation markers and theinduction of an inflammatory profile. In addition, Treg-specific conditional knockout miceshowed aggravated autoimmunity and an impaired resolution of inflammation. Altogether,our results show that CD83 expression in Tregs is an essential factor for the developmentand function of effector Tregs upon activation. Since Tregs play a crucial role in themaintenance of immune tolerance and thus prevention of autoimmune disorders, ourfindings are also clinically relevant.
Research Article Immunology
Find the latest version:
http://jci.me/99712/pdf

1insight.jci.org https://doi.org/10.1172/jci.insight.99712
R E S E A R C H A R T I C L E
Authorship note: MD and CK contributed equally to this work.
Conflict of interest: The authors have declared that no conflict of interest exists.
Submitted: January 9, 2018 Accepted: May 1, 2018 Published: June 7, 2018
Reference information: JCI Insight. 2018;3(11):e99712. https://doi.org/10.1172/jci.insight.99712.
CD83 expression is essential for Treg cell differentiation and stabilityMarina Doebbeler,1 Christina Koenig,1 Lena Krzyzak,1 Christine Seitz,1 Andreas Wild,1 Thomas Ulas,2 Kevin Baßler,2 Dmitry Kopelyanskiy,2 Alina Butterhof,1 Christine Kuhnt,1 Simon Kreiser,1 Lena Stich,1 Elisabeth Zinser,1 Ilka Knippertz,1 Stefan Wirtz,3 Christin Riegel,4 Petra Hoffmann,4 Matthias Edinger,4 Lars Nitschke,5 Thomas Winkler,5 Joachim L. Schultze,2 Alexander Steinkasserer,1 and Matthias Lechmann1
1Department of Immune Modulation at the Department of Dermatology, University Hospital Erlangen, Erlangen, Germany. 2Genomics & Immunoregulation, LIMES-Institute, University of Bonn, Bonn, Germany. 3Department of Medicine 1,
University Hospital Erlangen, Erlangen, Germany. 4Department of Internal Medicine 3, University Hospital Regensburg,
Regensburg, Germany. 5Division of Genetics, Department of Biology, University of Erlangen-Nürnberg, Erlangen, Germany.
IntroductionRegulatory T cells (Tregs) control self-reactive T cells in the periphery, maintaining immunological self-tolerance mechanisms (1). In addition to the prevention of autoimmune diseases, they suppress allergy and asthma (2, 3) and limit pathogen-induced immunopathology (4). Tregs naturally arise in the thymus. They were initially characterized as CD25+CD4+ T cells and shown later to specifically express the transcription factor Foxp3, which is essential for their development and function (5–7). Tregs can also be induced in the periphery from CD4+Foxp3– naive T cells in response to TGF-β in combination with IL-2 (8, 9).
The CD83 molecule is a 45-kDa heavily glycosylated Ig-like type 1 transmembrane protein and belongs to the Ig superfamily. It has been characterized as one of the most prominent surface markers for fully mature dendritic cells (DCs) (10–12). However, CD83 expression is not restricted to DCs but also pres-ent on a variety of immune cell types including activated B and T cells (10, 13–16). Until now, 2 different isoforms of CD83 have been reported in vivo: the membrane-bound form (mCD83) (11) and a soluble form (sCD83) (17). The soluble form is found in the blood of healthy donors and at increased levels in patients with hematological malignancies like chronic lymphatic leukemia (CLL), mantle cell lymphoma (18), or rheumatoid arthritis (RA) (19). sCD83 has been reported to have therapeutic and immunosuppres-sive properties by suppressing DC-mediated T cell activation and inducing tolerogenic DCs (20–25).
Furthermore, studies with complete-CD83-knockout (CD83–/–) mice revealed the requirement of CD83 expression on thymic epithelial cells for proper CD4+ T cell development (26–28). We recently reported that CD83’s transmembrane domain is necessary and sufficient for thymic CD4+ T cell selection. By antagonizing the ubiquitin ligase MARCH8, CD83 mediates MHCII stabilization, as a novel functional adaptation of cortical thymic epithelial cells for T cell selection (28). Interestingly, CD4+CD25+Foxp3+
Foxp3-positive regulatory T cells (Tregs) are crucial for the maintenance of immune homeostasis and keep immune responses in check. Upon activation, Tregs are transferred into an effector state expressing transcripts essential for their suppressive activity, migration, and survival. However, it is not completely understood how different intrinsic and environmental factors control differentiation. Here, we present for the first time to our knowledge data suggesting that Treg-intrinsic expression of CD83 is essential for Treg differentiation upon activation. Interestingly, mice with Treg-intrinsic CD83 deficiency are characterized by a proinflammatory phenotype. Furthermore, the loss of CD83 expression by Tregs leads to the downregulation of Treg-specific differentiation markers and the induction of an inflammatory profile. In addition, Treg-specific conditional knockout mice showed aggravated autoimmunity and an impaired resolution of inflammation. Altogether, our results show that CD83 expression in Tregs is an essential factor for the development and function of effector Tregs upon activation. Since Tregs play a crucial role in the maintenance of immune tolerance and thus prevention of autoimmune disorders, our findings are also clinically relevant.

2insight.jci.org https://doi.org/10.1172/jci.insight.99712
R E S E A R C H A R T I C L E
Tregs rapidly and strongly induce the transcription of CD83 after activation (14, 29, 30). Using CD83eGFP reporter mice (15), we recently reported that CD83 protein expression is correlated to murine T cells that have highly upregulated Treg-associated molecules. We showed that murine CD83+CD4+CD25+Foxp3+ T cells have a suppressive effect on the proliferation and cytokine release of activated T effector cells and pre-vent the onset of disease in a murine transfer colitis model (14). Additionally, human Tregs were found to express CD83 at the mRNA level as well as at the protein level. In conclusion, these data show a conserved CD83 expression in human and murine CD83+ T cells with a Treg phenotype, which indicates CD83 as a novel marker for activated Treg lineages (14). Interestingly, overexpression of CD83 in naive murine CD4+ T cells in vitro has been demonstrated to induce FOXP3 expression and antigen-specific tolerogenic mecha-nisms in vivo (10). However, regarding the functional implication of CD83 expression on Tregs, no data were available. Since CD83–/– animals have a strongly reduced CD4+ T cell repertoire, and are therefore not suitable for functional studies regarding CD83 effects on Tregs, we generated specific CD83 conditional knockout (cKO) animals, whereby CD83 expression has only been deleted in Foxp3+ Tregs (CD83cKO) (31). Interestingly, CD83-deleted Tregs showed a highly activated proinflammatory phenotype, which in vivo correlated with an increased autoimmunity and a hampered resolution of inflammation.
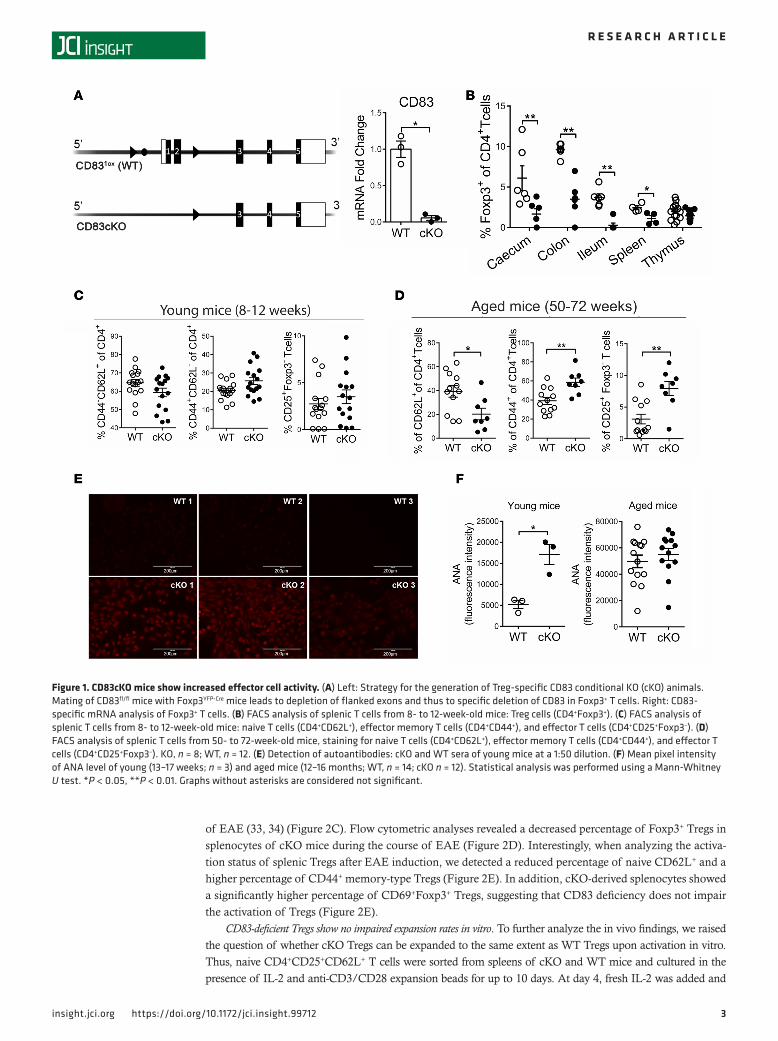
ResultsCD83cKO mice showed increased effector cell activity. To analyze the endogenous role of CD83 expression in Tregs, we generated a cell-type-specific conditional knockout mouse. This mouse was bred by mating CD83fl/fl mice (31) with Foxp3YFP-Cre mice to specifically deplete CD83 on Tregs (CD83cKO) (Figure 1A). In these mice, Foxp3+ Tregs are identified by YFP fluorescence (Supplemental Figure 1A.1; supplemental material available online with this article; https://doi.org/10.1172/jci.insight.99712DS1). The successful knock-out of CD83 on Tregs was confirmed by mRNA analysis (Figure 1A) as well at the protein level (Supple-mental Figure 1A.2); CD83 expression was clearly knocked down in sorted Foxp3YFP+ Tregs in these mice. Analyzing different leukocyte populations, we did not observe any differences in B cell, DC, or monocyte numbers in CD83cKO mice. CD4+/CD8+ T cell ratios were not affected in spleen, thymus, and peripheral lymph nodes (Supplemental Figure 1, B and C). Interestingly, significantly reduced percentages of Foxp3+ Tregs were observed in caecum, colon, ileum, and spleen of CD83cKO mice, but not in the thymus (Figure 1B). These results indicate that Treg-specific CD83 expression was necessary for maintaining normal Treg homeostasis and frequency in mice. In addition, young cKO mice (8–12 weeks old) showed a tendency towards more CD4+CD25+Foxp3– T effector cells, fewer CD4+CD62L+ naive T cells, and more CD4+CD44+ effector memory T cells (Figure 1C). These tendencies became significant in aged mice (12–16 months old) (Figure 1D). As aged cKO mice had significantly fewer naive CD4+CD62L+ T cells, more CD4+CD44+ memory T cells, and more CD4+CD25+Foxp3– T effector cells, CD83cKO mice revealed an increased effec-tor cell phenotype compared with WT mice (Figure 1D). Next, we analyzed sera from CD83cKO mice with respect to the content of anti-nuclear antibodies (ANAs). All sera from young CD83cKO mice contained ANAs, while WT controls showed weak staining (Figure 1E). CD83cKO mice showed significantly elevated values for ANAs in young and increased amounts in aged mice compared with WT controls (Figure 1F). Because aged animals (12–16 months) did not develop signs of spontaneous autoimmune pathology, we hypothesize that the remaining Tregs still control these immune responses in naive mice.
CD83cKO mice developed an exacerbated and long-lasting EAE pathology. Although we did not detect spon-taneous fatal immune pathology in CD83cKO mice, the reduced number of Foxp3+ Tregs and increased ANAs in sera of these mice suggested deficiencies in Treg function. As shown in several publications (32), in the experimental autoimmune encephalomyelitis (EAE) model, Tregs are very important for protection. To address the question of whether CD83 deficiency in Tregs impairs their important protective function, we next challenged CD83cKO mice using this EAE model. Interestingly, CD83cKO mice showed a faster disease progress compared with WT controls and reached a significantly higher maximal clinical score, indicating that resolution of inflammation was impaired (Figure 2A). Further, we isolated splenocytes at day 30 after EAE induction and restimulated these cells in vitro with a myelin oligodendrocyte glycopro-tein–derived (MOG-derived) peptide. Splenocytes derived from cKO mice showed significantly higher pro-liferation responses, supporting the observed in vivo data. This means that CD83 deficiency in Tregs results in a decreased ability of these cKO Tregs to control the activation of MOG-specific T cell clones in vivo (Figure 2B). This is also reflected by increased inflammatory cytokine levels, determined in the superna-tants of the restimulated cells, including IFN-γ and IL-17A, both of which are critical for the development
3insight.jci.org https://doi.org/10.1172/jci.insight.99712
R E S E A R C H A R T I C L E
of EAE (33, 34) (Figure 2C). Flow cytometric analyses revealed a decreased percentage of Foxp3+ Tregs in splenocytes of cKO mice during the course of EAE (Figure 2D). Interestingly, when analyzing the activa-tion status of splenic Tregs after EAE induction, we detected a reduced percentage of naive CD62L+ and a higher percentage of CD44+ memory-type Tregs (Figure 2E). In addition, cKO-derived splenocytes showed a significantly higher percentage of CD69+Foxp3+ Tregs, suggesting that CD83 deficiency does not impair the activation of Tregs (Figure 2E).
CD83-deficient Tregs show no impaired expansion rates in vitro. To further analyze the in vivo findings, we raised the question of whether cKO Tregs can be expanded to the same extent as WT Tregs upon activation in vitro. Thus, naive CD4+CD25+CD62L+ T cells were sorted from spleens of cKO and WT mice and cultured in the presence of IL-2 and anti-CD3/CD28 expansion beads for up to 10 days. At day 4, fresh IL-2 was added and
Figure 1. CD83cKO mice show increased effector cell activity. (A) Left: Strategy for the generation of Treg-specific CD83 conditional KO (cKO) animals. Mating of CD83fl/fl mice with Foxp3YFP-Cre mice leads to depletion of flanked exons and thus to specific deletion of CD83 in Foxp3+ T cells. Right: CD83-specific mRNA analysis of Foxp3+ T cells. (B) FACS analysis of splenic T cells from 8- to 12-week-old mice: Treg cells (CD4+Foxp3+). (C) FACS analysis of splenic T cells from 8- to 12-week-old mice: naive T cells (CD4+CD62L+), effector memory T cells (CD4+CD44+), and effector T cells (CD4+CD25+Foxp3–). (D) FACS analysis of splenic T cells from 50- to 72-week-old mice, staining for naive T cells (CD4+CD62L+), effector memory T cells (CD4+CD44+), and effector T cells (CD4+CD25+Foxp3–). KO, n = 8; WT, n = 12. (E) Detection of autoantibodies: cKO and WT sera of young mice at a 1:50 dilution. (F) Mean pixel intensity of ANA level of young (13–17 weeks; n = 3) and aged mice (12–16 months; WT, n = 14; cKO n = 12). Statistical analysis was performed using a Mann-Whitney U test. *P < 0.05, **P < 0.01. Graphs without asterisks are considered not significant.

4insight.jci.org https://doi.org/10.1172/jci.insight.99712
R E S E A R C H A R T I C L E
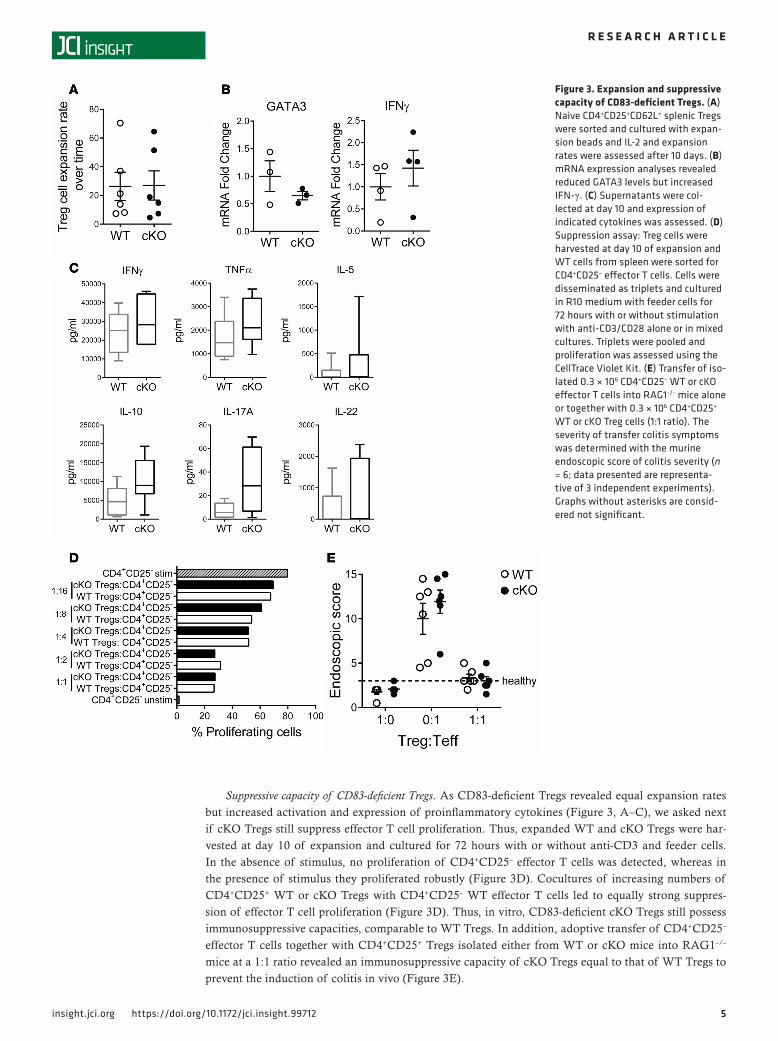
at day 7 cells were restimulated. After 10 days, cKO Tregs showed expansion rates equal to those of WT Tregs (Figure 3A). At the mRNA level we detected a tendency towards increased IFN-γ levels in cKO Tregs and a trend towards downregulation of GATA3 expression levels after 10 days of expansion (Figure 3B). Supernatants of expanded cKO Tregs revealed a trend towards higher levels of the cytokines TNF-α, IL-17A, and IL-22 (Fig-ure 3C). Thus, these data suggest that anti-CD3/CD28– and IL-2–stimulated cKO Tregs can be equally activat-ed and expanded and cKO-derived Tregs showed a trend towards an altered proinflammatory cytokine pattern.
Figure 2. CD83cKO mice developed an exacerbated and long-lasting EAE pathology. (A) EAE was induced in female cKO mice or wild-type (WT) control animals by immunization with myelin oligodendrocyte glycoprotein peptide 35–55 (MOG35–55) in complete Freund’s adjuvant (CFA). Left: Disease severity was monitored according to the classical EAE scoring system (cKO n = 6, WT n = 8; data presented are representative of 3 independent experiments. Right: Maximal clinical EAE score ± SEM. (B) Restimulation of isolated splenocytes from EAE mice at day 30 with MOG peptide in increasing concentrations (cKO n = 6, WT n = 6; data shown for 1 of 2 independent experiments). (C) Cytometric bead array of supernatants from MOG-restimulated cKO and WT sple-nocytes (mean ± SEM). (D and E) FACS analysis of splenic T cell staining for Treg cells (CD4+Foxp3+) (D) and for naive Foxp3+ T cells (CD4+CD62L+), effector memory T cells (CD4+CD44+), and CD4+CD69+ expression (E) in T cells at day 30. Statistical analysis was performed using a Mann-Whitney U test. *P < 0.05, **P < 0.01. Graphs without asterisks are considered not significant.
5insight.jci.org https://doi.org/10.1172/jci.insight.99712
R E S E A R C H A R T I C L E
Suppressive capacity of CD83-deficient Tregs. As CD83-deficient Tregs revealed equal expansion rates but increased activation and expression of proinflammatory cytokines (Figure 3, A–C), we asked next if cKO Tregs still suppress effector T cell proliferation. Thus, expanded WT and cKO Tregs were har-vested at day 10 of expansion and cultured for 72 hours with or without anti-CD3 and feeder cells. In the absence of stimulus, no proliferation of CD4+CD25– effector T cells was detected, whereas in the presence of stimulus they proliferated robustly (Figure 3D). Cocultures of increasing numbers of CD4+CD25+ WT or cKO Tregs with CD4+CD25– WT effector T cells led to equally strong suppres-sion of effector T cell proliferation (Figure 3D). Thus, in vitro, CD83-deficient cKO Tregs still possess immunosuppressive capacities, comparable to WT Tregs. In addition, adoptive transfer of CD4+CD25– effector T cells together with CD4+CD25+ Tregs isolated either from WT or cKO mice into RAG1–/– mice at a 1:1 ratio revealed an immunosuppressive capacity of cKO Tregs equal to that of WT Tregs to prevent the induction of colitis in vivo (Figure 3E).
Figure 3. Expansion and suppressive capacity of CD83-deficient Tregs. (A) Naive CD4+CD25+CD62L+ splenic Tregs were sorted and cultured with expan-sion beads and IL-2 and expansion rates were assessed after 10 days. (B) mRNA expression analyses revealed reduced GATA3 levels but increased IFN-γ. (C) Supernatants were col-lected at day 10 and expression of indicated cytokines was assessed. (D) Suppression assay: Treg cells were harvested at day 10 of expansion and WT cells from spleen were sorted for CD4+CD25– effector T cells. Cells were disseminated as triplets and cultured in R10 medium with feeder cells for 72 hours with or without stimulation with anti-CD3/CD28 alone or in mixed cultures. Triplets were pooled and proliferation was assessed using the CellTrace Violet Kit. (E) Transfer of iso-lated 0.3 × 10⁶ CD4+CD25– WT or cKO effector T cells into RAG1−/− mice alone or together with 0.3 × 10⁶ CD4+CD25+ WT or cKO Treg cells (1:1 ratio). The severity of transfer colitis symptoms was determined with the murine endoscopic score of colitis severity (n = 6; data presented are representa-tive of 3 independent experiments). Graphs without asterisks are consid-ered not significant.

6insight.jci.org https://doi.org/10.1172/jci.insight.99712
R E S E A R C H A R T I C L E
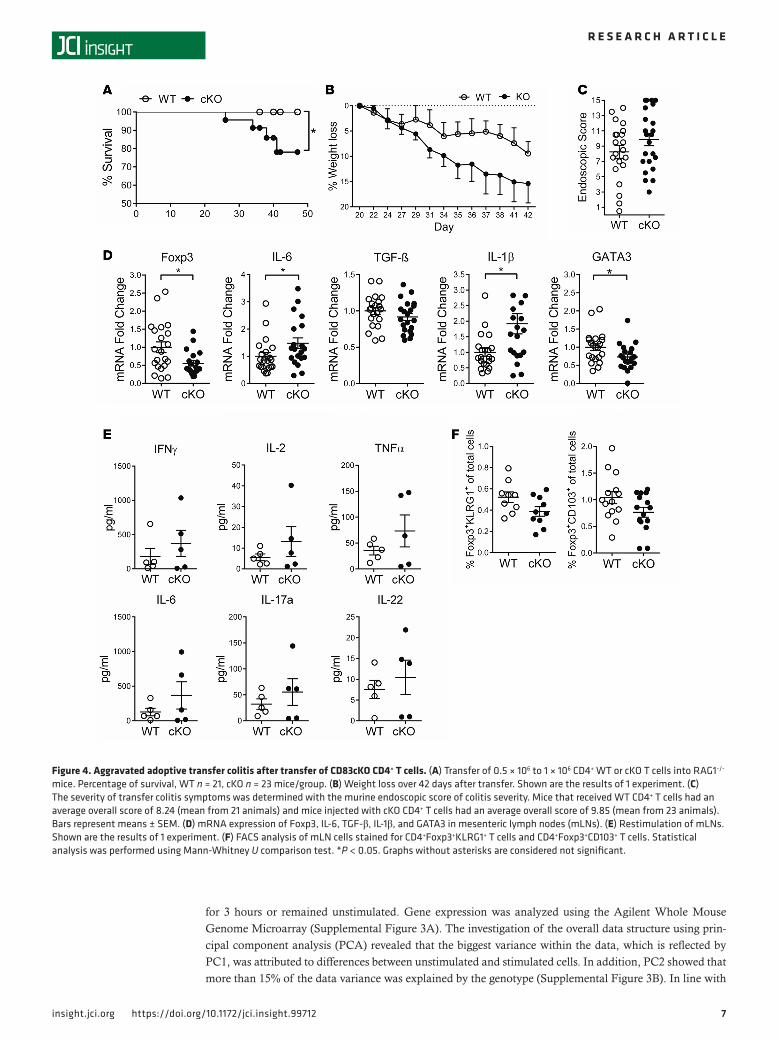
Aggravated inflammatory phenotype after adoptive transfer of CD4+ T cells from CD83cKO mice. Despite the fact that CD83-deficient Tregs still had comparable suppressive capabilities in vitro, we saw increased T effector cell activity during homeostatic conditions in CD83cKO mice (Figure 1). To analyze if the suppres-sive capacity of cKO Tregs is impaired in vivo, total CD4+ T cells from WT or cKO mice were isolated and transferred into RAG1–/– mice. The transfer of CD4+ T effector cells into immunodeficient RAG1–/– mice leads to deregulated mucosal Th1/Th17 T cell responses (35), which can be counteracted by the transferred Tregs present in the total CD4+ T cell population. Body weight and health status, which were monitored for 6 weeks until clear colitis symptoms were observable, revealed aggravated colitis symptoms in cKO cell–transferred mice. The first and very striking effect was a strongly increased mortality rate in RAG1–/– mice, which we observed by cKO cell transfer (Figure 4A). These mice also showed an average weight loss of 15.39% ± 3.838% at day 42, whereas WT cell–transferred animals only had an average weight reduction of 9.448% ± 2.351% (Figure 4B). To address whether these macroscopic signs of severe disease in cKO cell–transferred mice are related to the degree of intestinal inflammation we examined the mice by high-resolution endoscopy. Thereby, a score of mucosal changes was determined by translucency, granularity, fibrin deposits, vascularity, and stool consistency, as previously described (36). As depicted in Figure 4C, an increased clinical severity score with higher inflammation was observed in cKO cell–transferred animals compared with WT controls.
In this mouse model, transferred T cells infiltrate the colonic tissue and induce inflammatory responses. As a consequence, lymphoid organs located nearby, such as mesenteric lymph nodes (mLNs), are affected. Analysis of this tissue correlated with the endoscopic results of the colon and showed a significantly lower infiltration of Tregs, whereas proinflammatory cytokine production, i.e., IL-1β and IL-6, was significantly increased (Figure 4D). In contrast, significantly reduced GATA3 expression levels were detected in cKO animals, while TGF-β levels were not affected (Figure 4D). Furthermore, cytometric bead array analyses of restimulated lymphocytes harvested from mLNs after adoptive transfer confirmed the trend of an increased release of proinflammatory cytokines such as IFN-γ, IL-2, IL-6, TNF-α, IL-17A, and IL-22 (Figure 4E). Similar results were obtained when cytokine expression patterns of colonic lamina propria mononuclear cells were analyzed (data not shown). Additionally, flow cytometric analyses of mLNs revealed a trend towards reduced KLRG1 and CD103 expression levels among the Foxp3+ T cell population in cKO cell–transferred mice (Figure 4F). This indicates a reduced number of terminally differentiated Tregs in the gastrointestinal tract of RAG1–/– mice after adoptive CD4+ T cell transfer from CD83cKO mice.
Reduced numbers of Foxp3+ T cells after iTreg differentiation. From in vivo experiments described above we hypothesized that CD83 is necessary for Treg differentiation upon activation and that CD83 expres-sion is involved in Treg memory development. To analyze the influence of CD83 on Treg differentiation and the expression of Foxp3, naive CD4+CD25–CD62L+ T cells derived from cKO and WT mice were stimulated with anti-CD3/CD28, in the presence of specific cytokine cocktails to differentiate Th1, Th2, induced Treg (iTreg), or Th17 cells. With respect to the generation of Th1, Th2, or Th17 cells, no differ-ences were observed for T cells derived from cKO mice (data not shown). However, and in sharp contrast regarding iTreg differentiation, cKO-derived cells showed reduced numbers of Foxp3+ T cells as well as Foxp3+pSmad2/3+ double-positive T cells compared with WT-derived cells (Figure 5A). This was accom-panied by significantly reduced mRNA levels of Foxp3 and CD83 (Figure 5B), while IL-10, Tbet, and IFN-γ transcripts were increased. On the protein level, the release of cytokines during this process was determined using supernatants from these cell cultures and revealed higher levels of IFN-γ, TNF-α, IL-9, and IL-17A in cKO-derived T cells (Figure 5C).
Additionally, we analyzed iTreg differentiation in vivo, by transferring CD4+CD25–CD44lo T effector cells from WT and cKO mice into RAG1–/– recipients. After 52 days, mice developed colitis symptoms and lamina propria cells were isolated from the colon. Flow cytometric analysis revealed reduced peripherally induced Foxp3+ T cells in the lamina propria, when cKO-derived cells were transferred. Thus, the generation of iTregs was impaired in RAG1–/– mice after the transfer of CD4+ naive T cells derived from CD83cKO mice. Similar to the data obtained in vivo using the CD4+ T cell transfer colitis model, Foxp3+CD103+ and Foxp3+KLRG1+ T cells were reduced when compared with WT-derived cells (Figure 5D).
cKO of CD83 on Tregs leads to highly modulated gene expression profile. To gain further insight into affected transcripts and subsequent mechanisms, we sorted Tregs derived from CD83cKO animals and, for compar-ison, from DEREG (WT) mice. Using these mice, Foxp3+ Tregs were identified either via YFP in the case of cKO mice or via GFP in the case of WT mice. Sorted Tregs were then stimulated with anti-CD3/CD28
7insight.jci.org https://doi.org/10.1172/jci.insight.99712
R E S E A R C H A R T I C L E
for 3 hours or remained unstimulated. Gene expression was analyzed using the Agilent Whole Mouse Genome Microarray (Supplemental Figure 3A). The investigation of the overall data structure using prin-cipal component analysis (PCA) revealed that the biggest variance within the data, which is reflected by PC1, was attributed to differences between unstimulated and stimulated cells. In addition, PC2 showed that more than 15% of the data variance was explained by the genotype (Supplemental Figure 3B). In line with
Figure 4. Aggravated adoptive transfer colitis after transfer of CD83cKO CD4+ T cells. (A) Transfer of 0.5 × 10⁶ to 1 × 10⁶ CD4+ WT or cKO T cells into RAG1−/− mice. Percentage of survival, WT n = 21, cKO n = 23 mice/group. (B) Weight loss over 42 days after transfer. Shown are the results of 1 experiment. (C) The severity of transfer colitis symptoms was determined with the murine endoscopic score of colitis severity. Mice that received WT CD4+ T cells had an average overall score of 8.24 (mean from 21 animals) and mice injected with cKO CD4+ T cells had an average overall score of 9.85 (mean from 23 animals). Bars represent means ± SEM. (D) mRNA expression of Foxp3, IL-6, TGF-β, IL-1β, and GATA3 in mesenteric lymph nodes (mLNs). (E) Restimulation of mLNs. Shown are the results of 1 experiment. (F) FACS analysis of mLN cells stained for CD4+Foxp3+KLRG1+ T cells and CD4+Foxp3+CD103+ T cells. Statistical analysis was performed using Mann-Whitney U comparison test. *P < 0.05. Graphs without asterisks are considered not significant.

8insight.jci.org https://doi.org/10.1172/jci.insight.99712
R E S E A R C H A R T I C L E
this observation, a considerable number of genes were significantly differentially expressed between WT and cKO Tregs (0 hours = 271 genes; 3 hours = 155 genes) (Figure 6A). Without stimulation (0 hours), many WT-associated Treg signature genes were downregulated in cKO-derived Tregs. This includes the late differentiation marker Klrg1, the T cell homing marker CD103 (Itgae) and the transcription factors Smarcd3, Prdm1, and Prdm5 (Figure 6B and Supplemental Figure 3C). In contrast, transcripts for the pro-inflammatory cytokine Il1b and the pattern recognition receptor Tlr13 were more highly expressed in cKO Tregs compared with WT. Interestingly, in cKO Tregs, we also found higher induction of TNF-α signaling–associated genes (Tnfaip2, Tnfrsf11a) together with the transcription factors Nr1h3 and Pparg. Both transcrip-tion factors are actually described to be downregulated by TNF-α (37, 38). After 3 hours of stimulation, we observed a similar picture (Supplemental Figure 3C). In line with this observation, we found a strong enrichment of immune response– and immune cell activation–related Gene Ontology (GO) terms in dif-ferentially expressed genes associated with cKO Tregs in clusters 5, 7, 8, 12, 13, 14, and 16 (Figure 6C and Supplemental Figure 3D).
cKO Tregs display aberrant activation status. For phenotypical analyses using FACS, splenocytes were isolated from WT and cKO mice and stained with antibodies recognizing specific surface and intra-cellular molecules that are differentially expressed in the gene array data analysis. Confirming the gene array data, the frequencies of KLRG1+ and CD103+ (Itgae) T cells were significantly reduced in
Figure 5. Impaired iTreg differentiation in CD83cKO T cells. (A) Naive CD4+ T cells were cultured with anti-CD3/CD28 plus cytokines, and Foxp3 expression (left), absolute numbers of Foxp3+ T cells (middle), and double-positive Foxp3+pSmad2/3+ T cells (right) were determined 3 days later. Data are from 1 experi-ment, representative of 3. (B) Naive CD4+ T cells were cultured with anti-CD3/CD28 plus cytokines and mRNA expression of the indicated genes was deter-mined after 3 days. (C) Expression of indicated cytokines from supernatants of cultured cells from A. (D) FACS analysis of colon lamina propria cells stained for CD4+Foxp3+ Tregs, CD4+Foxp3+KLRG1+ T cells, and CD4+Foxp3+CD103+ T cells. Statistical analyses were performed using a Mann-Whitney U test. *P < 0.05, **P < 0.01, ***P < 0.001. Graphs without asterisks are considered not significant.

9insight.jci.org https://doi.org/10.1172/jci.insight.99712
R E S E A R C H A R T I C L E
cKO-derived T cells compared with WT (Figure 7, B and C and Supplemental Figure 3C). While we saw no difference in Foxp3 protein level (Figure 7A), cKO Tregs showed reduced expression levels of GATA3 and a reduced frequency of CD25+ (Il2ra) cells (Figure 7, D and E). In addition, as outlined above, we measured higher concentrations of TNF-α in the supernatant of cultured cKO Tregs com-pared with WT. This is in line with the upregulation of TNF-α–associated signaling molecules in cKO Tregs identified by gene array analysis (Figure 3C and Figure 4E). Interestingly, protein expression of the proinflammatory IL-1R–associated kinase-1 (IRAK-1) was increased in cKO Tregs (Figure 7F). This is in line with an upregulation of Toll-like receptors and increased TNF-α levels and hence an increased proinflammatory phenotype observed in cKO Tregs (Figure 6B). Taken together, our data reveal that CD83cKO-derived Tregs have an activated, more proinflammatory phenotype and that functionally important Treg molecules, e.g., for late differentiation and T cell homing, are strongly downmodulated.
Figure 6. CD83 deletion on Tregs leads to highly differential gene expression. (A) Visualization of differentially up- and downregulated genes between all 4 conditions. (B) Volcano plot of all present genes comparing unstimulated cKO T cells versus WT Tregs. Interesting differentially expressed genes have been highlighted. (C) Hierarchical clustering (HC) of genes differentially expressed (P value ≤ 0.05 and fold change ≥ 2) compar-ing unstimulated cKO T cells versus WT Tregs.

1 0insight.jci.org https://doi.org/10.1172/jci.insight.99712
R E S E A R C H A R T I C L E
DiscussionRecently, we showed that murine as well as human CD4+CD25+Foxp3+ Tregs express the CD83 molecule at the protein level, which indicated CD83 as a novel marker for activated Treg lineages (14). Although CD83 is not expressed on naive or resting Tregs, its expression is rapidly and highly upregulated upon activation. In this study, we demonstrate that upregulation of CD83 is essential for activated Tregs to stably achieve their terminally differentiated phenotype. To decipher the physiologic role of CD83 endogenously expressed by Tregs, we generated the CD83cKO mouse. In young mice we found that the loss of endog-enous CD83 expression by Tregs results in a reduced Foxp3 expression by peripheral T cells in vivo, and an incidence towards more effector and effector memory T cells. Interestingly in aged mice, these trends became significant differences. We also discovered significantly elevated levels of ANAs in young cKO mice. This is of interest since it has lately been demonstrated that Treg-deficient scurfy mice are positive for ANAs and other autoantibodies and even develop systemic lupus erythematosus–like symptoms (39). Although CD83cKO mice did not develop spontaneous autoimmune disorders, deletion of CD83 on Tregs clearly resulted in a more highly activated, proinflammatory phenotype.
Recently, Reinwald and colleagues demonstrated that retroviral overexpression of CD83 in naive CD4+ T cells induced Foxp3 expression and antigen-specific tolerogenic mechanisms in vivo, thereby inhibiting EAE paralysis (10). As Tregs are important key players in preventing autoimmune diseases, we addressed the question of whether cKO Tregs have impaired proliferation and suppressive capacity. We discovered that naive cKO mice not only revealed a more activated effector T cell phenotype but also developed an aggravated EAE pathology, developing exacerbated clinical symptoms with an earlier onset and an impaired resolution of inflammation. Although we found reduced numbers of Foxp3+ T cells in the cKO mice, the remaining Tregs revealed an increased activation status as shown by augmented CD69, CD44, and CD62L expression levels compared with WT animals. Expansion of WT- and cKO-derived Tregs revealed equal expansion rates, suggesting that the observed reduced number of Foxp3+ Tregs in cKO ani-mals is not due to a reduced activation capacity and ameliorated proliferation.
Next, we asked if cKO Tregs were still able to suppress effector T cells. We show that these expanded cKO Tregs still have the same suppressive capacities as WT Tregs in vitro, but in contrast to WT Tregs we detected an enhanced expression of proinflammatory cytokines in the supernatants of cKO-derived T cells. Our group previously reported that treatment with sCD83, which is derived from the extracellular domain of mCD83, possesses an interesting immunomodulatory property to prevent EAE-associated paralyses (40). Furthermore, it has been shown that Tregs release sCD83 molecules during suppression of effector T cells in vitro (14), and thus the absence of sCD83 release by cKO-derived Treg cells could be one explana-tion for the aggravated course of the EAE pathology in cKO mice.
Figure 7. cKO Tregs display aberrant activation status. (A) Mean fluorescence intensity (MFI) of Foxp3 expression within splenocytes (n = 7). (B and C) FACS analysis of splenocytes (n = 4) stained for expression of KLRG1+ (B) and CD103+ (C) within Foxp3+ T cells. (D–F) FACS analysis of splenocytes for CD25+ of CD4+ Foxp3+ T cells (D), GATA3 MFI on CD4+Foxp3+ T cells (E), and MFI for IRAK-1 staining on CD4+Foxp3+ T cells (F). Statistical analyses were performed using a Mann-Whitney U test. *P < 0.05. Graphs without asterisks are considered not significant.

1 1insight.jci.org https://doi.org/10.1172/jci.insight.99712
R E S E A R C H A R T I C L E
Several studies clearly demonstrated that CD83 is a highly efficient immune modulator and that admin-istration of sCD83 could even induce Foxp3+ Tregs and tolerance in vivo (20, 21, 40). Thus, we investi-gated whether there is a defect in peripheral Treg differentiation. Interestingly, RAG1–/– mice mimicked the increased proinflammatory immune response observed in CD83cKO mice after the transfer of naive CD4+ T cells from cKO mice, resulting in a higher clinical score and an increased mortality rate. A lower infiltration of Treg cells in mLNs and an increased proinflammatory cytokine production after restimulation suggested an impaired iTreg differentiation and suppressive capacity in vivo. Since activation of cKO-derived Tregs is not reduced — on the contrary they are even more activated — other reasons must account for the observed effects in cKO animals in vivo. Thus, defects in late differentiation and stability also had to be considered.
Interestingly, we observed significantly reduced GATA3 expression levels in mLNs after the transfer of cKO T cells. Several publications have shown that GATA3 expression is an essential mediator of Treg function and Foxp3+ expression by enhancing its stability (41).
Supporting impairment of iTreg differentiation in cKO mice, in vitro differentiation of naive CD4+CD62L+, cKO-derived T cells, revealed a reduced number of Foxp3+ T cells and Foxp3+Smad3+ dou-ble-positive T cells. In addition, mRNA levels of Foxp3 and CD83 were decreased, whereas expression of the inflammatory cytokines IL-1β, Tbet, and IFN-γ was increased. As CD83 is only deleted in Tregs after Foxp3 expression occurs, differentiation into iTregs is starting, but the subsequent deletion of CD83 leads to instability of Foxp3 expression and therefore the cells fail to fully differentiate. Consistent with this, we also detected reduced numbers of KLRG1-positive cKO-derived Tregs and a reduced proportion of in vivo–activated CD103+ Tregs.
To gain further insight regarding the underlying mechanisms and involved transcripts, we performed gene array analysis comparing WT Tregs and cKO Tregs. The heatmap generated from these differential expression data highlights striking differences. Many typical Treg signature genes are downregulated in cKO Tregs, like the late differentiation marker KLRG1 and the homing marker CD103.
KLRG1 is known as a marker of T cell senescence and is expressed on antigen-experienced T cells. Signaling through KLRG1 may be responsible in part for the defects observed in highly differentiated T cells (42). Reduced expression of KLRG1 indicates that CD83 is necessary for late Treg differentiation and that CD83 expression is involved in Treg memory development.
CD103 is encoded by the ITGAE gene and is a ligand for E-cadherin, an adhesion molecule found on epithelial cells. It is known that CD103 mediates T cell retention in the epithelial compartment and is a well-established marker for murine effector/memory-like Tregs that have been activated in vivo by antigen (43). Interestingly, in cKO-derived Tregs IL-2RA (CD25) was found to be downregulated. CD25 is the α-chain of the IL-2 receptor, and it is known that the IL-2 signal is essential for the differentiation, expan-sion, and function of Tregs (44). Taken together, these results suggest that downregulation of CD25 may be involved in survival and less activation of Tregs.
Furthermore, the transcription factors GATA3 and Smarcd3 were also downregulated in cKO-derived Tregs. GATA3-deficient Tregs exhibited lower amounts of Foxp3 as well as typical Treg signature genes, but had elevated levels of effector cytokines (45). Blimp-1 (Prdm1), an important transcription factor for Foxp3, was downmodulated in cKO Tregs. Blimp-1 regulates the expression of Foxp3 target genes that contribute to the effector function of Tregs (46, 47).
In sharp contrast, the proinflammatory cytokine IL-1β and TNF-α signaling–associated genes as well as the surface activation marker CD44 are highly upregulated in the cKO Tregs. Thus, cKO-derived Tregs are characterized by an activated and proinflammatory-biased phenotype, missing the expression of impor-tant Treg-specific late differentiation and homing molecules.
Recently, first insights regarding CD83-mediated signaling events were published (48). This study reported that on monocytes sCD83 binds to the TLR4/MD-2 complex and alters the signaling cascade by rapidly degrading IRAK-1. Strikingly, CD83-deficient Tregs revealed enhanced IRAK-1 levels compared with WT control cells. Interestingly, IRAK-1 has been reported to be crucial to keep NFAT in an inactive state (49). Furthermore, the same group demonstrated that IRAK-1 deletion leads to elevated NFATc2 levels and subsequently increased NFATc2 and Smad3 interactions result in increased Foxp3 expression, higher Treg levels, and reduced inflammatory responses in vivo (50). Thus, we analyzed next if changes in IRAK-1 expression, observed in our cKO Tregs, would also influence NFATc2 expression levels. Indeed, enhanced IRAK-1 expression levels correlated with reduced NFATc2 levels (Supplemental Table 2), fur-ther supporting the mechanistic impact of CD83 on Treg differentiation. Interestingly, expression levels of
1 2insight.jci.org https://doi.org/10.1172/jci.insight.99712
R E S E A R C H A R T I C L E
NFATc1, NFATc2ip, and NFATc3 were not affected, underlining the important role of NFATc2. Therefore, we propose that also in Tregs, similar to monocytes (46), CD83 modulates immune response also via the control of IRAK-1 expression.
In summary, we show that CD83 expression by Tregs is involved in the control of late differentiation and stability of Treg homeostasis. Since we earlier demonstrated that CD83 expression in human Tregs is also rapidly and strongly enhanced upon activation, one could envisage that CD83 has similar functions in human Treg differentiation. However, this has to be investigated in future studies. Finally, these results may help find new pathways and therapeutic intervention strategies to specifically modulate Treg differentiation upon activation and memory development for the therapy of autoimmune disorders such as multiple scle-rosis or inflammatory bowel diseases.
MethodsMice. All mice were maintained on the C57BL/6 background. Animal experiments were approved by the national animal ethics committee. DEREG mice were provided by Tim Sparwasser (Institute of Infec-tion Immunology, Medical School Hannover, Germany). B6.129S7-Rag1tm1Mom/J (termed RAG1–/– mice) were purchased from Charles River Germany. Floxed CD83 animals were generated in our laboratory as described previously (31). Foxp3-Cre animals were provided by A. Rudensky (University of Washing-ton, Seattle, Washington, USA). For Treg-specific depletion of the Cd83 gene, floxed CD83 animals were crossed with Foxp3-Cre mice (CD83cKO).
Determination of ANAs. Blood serum was taken from young (8–12 weeks) and old (50–72 weeks) mice and stored at –20°C. ANAs were determined using an indirect immunofluorescence test (Euroimmun AG). Biochip slides coated with Hep20-10 cells were used as antigen substrates. First, specific antibodies in the diluted serum attach to the antigens coupled to the slides. Then, the attached antibodies were stained with an IgG-Cy3 labeled anti-mouse antibody at a 1:200 dilution and visualized with a fluorescence microscope. Additional DAPI staining was performed to visualize the cell nucleus. For analysis, pixel intensity of the antibody staining was measured using the program ImageJ (NIH) according to Jensen (51).
EAE. Female and male CD83fl/fl and CD83cKO mice (8–12 weeks old) were immunized subcutane-ously (s.c.) in the flank with an emulsion containing Mycobacterium tuberculosis and a MOG-derived peptide (MOG35–55) (Charité Universitätsmedizin) dissolved in complete Freund’s adjuvant at day 0 to induce EAE. Mice received intraperitoneally (i.p.) pertussis toxin at days 0 and 2 after immunization. Paralysis was scored as follows: 0, no abnormality; 1, limp tail; 2, limp tail and hindlimb weakness; 3, hindlimb paralysis; 4, hindlimb paralysis and forelimb weakness; 5, death (52).
Adoptive transfer of CD4+ T cells into RAG1–/– mice. Lymphocytes from the spleen were isolated from WT and CD83cKO mice. Either total CD4+ T cells were enriched by negative selection using the mouse CD4+ T Cell Isolation Kit (Miltenyi Biotec) with a purity of greater than 91%, or CD4+CD25– effector T cells and CD4+CD25+ Tregs were enriched using the CD4+CD25+ Regulatory T Cell Isolation Kit (Miltenyi Biotec). Either 1 × 10⁶ total CD4+ T cells or 0.3 × 10⁶ CD4+CD25– effector T cells and CD4+CD25+ Tregs alone or in a 1:1 ratio (in 200 μl PBS) were transferred into RAG1–/– mice by a single i.p. injection. Severity of colitis was assessed by high-resolution endoscopy as described below.
High-resolution colonoscopy. Endoscopy in living mice was performed as previously described (36). The overall score consists of different parameters, including translucency, granularity, fibrin, vascularity, and stool, each of which can range from 0 to 3. In consequence, the overall score can range from 0 in a healthy mouse to 15 in a mouse with the most severe pathology.
Isolation of lamina propria mononuclear cells from murine colitis tissue. To isolate mononuclear cells from intestinal lamina propria, isolated mouse colons of sacrificed mice were dissociated from mucosa by shak-ing the tissue in 1× Hank’s balanced salt solution (without sodium bicarbonate) containing 5 mM EDTA, 5% fetal bovine serum, and 1 mM dithiothreitol and then degraded enzymatically into a single-cell suspen-sion using the gentleMACS Octo Dissociator with the Lamina Propria Dissociation Kit, mouse (Miltenyi Biotec), according to the manufacturer’s protocol.
qRT-PCR. Tissues were removed and stored in Ambion RNAlater solution (ThermoFisher Scientific) and cells were stored in RLTplus with β-ME at –80°C. Total RNA was isolated from tissue/cells using the RNeasy Plus Mini or Micro Kit (Qiagen). Subsequently, cDNA synthesis was performed (First-Strand cDNA Syn-thesis Kit; ThermoFisher Scientific). Primers, selected from a primer bank, were used for quantitative reverse transcription PCR (qRT-PCR) analyses with the SsoAdvanced Universal SYBR Green Supermix (Bio-Rad).
1 3insight.jci.org https://doi.org/10.1172/jci.insight.99712
R E S E A R C H A R T I C L E
Relative quantification normalizing to HPRT was performed using the C1000 Touch Thermal Cycler (Bio-Rad). Oligonucleotides used in this study are listed in Supplemental Table 1.
Flow cytometry. Spleen, mLNs, and colon were dissociated mechanically. Cell surface staining using flow cytometry employed standard procedures and the following conjugated antibodies and reagents: Live/Dead (ThermoFisher Scientific); CD3 (17A2), CD4 (RM4-5), CD25 (PC61), CD44 (IM7), CD62L (MEL-14), CD103 (2E7) (Biolegend); CD69 (H1.2F3), CD16/CD32 (Mouse BD Fc Block, 2.4G2) (BD Biosci-ences); and KLRG1 (2F1) (eBioscience). Intracellular staining for Foxp3 (FJK-16s) and GATA3 (TWAJ) was conducted according to the manufacturer’s protocol (eBioscience). Staining for pSmad2/3 (O72-670) (BD Biosciences) or IRAK-1 (D51G7) (Cell Signaling Technology) was performed after Foxp3 staining according to the manufacturer’s protocol for methanol staining (BD Biosciences). Single-cell suspensions were incubated with appropriate fluorochrome-conjugated monoclonal antibodies and run for 4- or 7-color fluorescence staining using a FACSCanto II (BD Biosciences) and analyzed with FlowJo v10 (Tree Star).
Treg expansion. Splenocytes were isolated and sorted for CD4+ T cells using the CD4+ T Cell Isolation Kit (Miltenyi Biotec). Cells were stained and sorted for CD4+ (PerCP), CD25+ (PE), and CD62L+ (APC) via flow cytometry. T cells (1 × 10⁴) were incubated in 100 μl cDMEM in a 96-well plate with IL-2 (2000 U/ml, ProleukinS, Novartis) and stimulated with beads (4 beads/cell; Treg Expansion Kit, mouse, Miltenyi Biotec) for up to 7 days. At day 4, cells were fed with medium containing IL-2 (2000 U/ml) and at day 7 restimulated with beads (1 bead/cell) and IL-2 (2000 U/ml). Cytokine expression levels were determined in supernatants using cytometric bead arrays (BioLegend) according to the manufacturer’s instructions.
In vitro suppression assay. Expanded WT and cKO Tregs were harvested at day 10 of expansion, cultured with sorted CD4+CD25– WT effector T cells (CD4+CD25+ Regulatory T Cell Isolation Kit, mouse; Miltenyi Biotec) in triplicate in the presence of feeder cells of RAG1–/– mice. T effector cells were labeled with a CellTrace Violet Cell Proliferation Kit (Life Technologies) and cocultured with Tregs at indicated ratios. Cells were stimulated with soluble anti-CD3 (0.25 mg/ml, clone 145-2C11, BioLegend). After 72 hours, cells were stained for CD4 and CD25 and proliferation was determined using CellTrace Violet. Samples were analyzed by flow cytometry.
iTreg differentiation. Splenocytes were isolated and sorted for CD4+CD62L+ T cells using the Naive T Cell Isolation Kit (Miltenyi Biotec) according to the manufacturer’s protocol. Cells were then stimulated with plate-bound anti-CD3 (1 μg/ml, clone 145-2C11, BioLegend) and soluble anti-CD28 (1 μg/ml, Bio-Legend). Treg-driving cytokines (5 μg/ml anti–IFN-γ, 50 U IL-2, 3 ng/ml TGF-β), Th1-driving cytokines (4 ng/ml IL-12, 50 U IL-2), Th2-driving cytokines (5 μg/ml anti–IFN-γ, 50 U IL-2, 10 ng/ml IL-4), and Th17-driving cytokines (5 μg/ml anti–IFN-γ, 30 ng/ml IL-6, 2 ng/ml TGF-β) were added and cells cul-tured for 72 hours. Supernatants were collected to determine cytokine levels using cytometric bead arrays (BioLegend) according to the manufacturer’s instructions. Before staining, cells were activated with 50 nM PMA (Sigma Aldrich) and 750 nM ionomycin (Sigma Aldrich), and 1 μl/ml GolgiPlug/Stop (BD Biosci-ences) was added for an additional 6 hours at 37°C of incubation.
MOG-specific restimulation. Splenocytes were harvested from CD83cKO and WT mice at day 30 after immunization with MOG35–55 peptide. Isolated splenocytes (4 × 10⁵) were incubated with different concen-trations of MOG35–55 peptide in 200 ml HLA-1/well in a 96-well tissue culture plate. At day 3, supernatants were collected to determine cytokine levels using cytometric bead arrays (BioLegend) according to the manufacturer’s instructions. Proliferation was then assessed using a thymidine incorporation assay.
Restimulation of colon- and mLN-derived cells after CD4+ T cell transfer. Cells were isolated from the colon and from mLNs. Cells (4 × 10⁵) were incubated for 4.5 hours with anti-CD3 (1 μg/ml) and anti-CD28 (1 μg/ml) in 100 μl R10 medium in a 96-well U-bottom plate. Supernatants were collected to determine cyto-kine levels using cytometric bead arrays (BioLegend) according to the manufacturer’s instructions.
Gene array analysis. CD4+ T cells were purified from splenocytes derived from CD83cKO and from DEREG (WT) mice and further sorted for Foxp3+ (GFP) cells. These cells were then stored in RLTplus with β-ME at –80°C. For each experimental condition total RNA was isolated from 3 individual mice. Samples were processed for microarray hybridization using Agilent Whole Mouse Genome Microarray. Data were imported into the Partek Genomics Suite 6.6 (PGS; V6.14.0724) for the bioinformatic analyses. Microarray data were MIAME compliant and deposited in the NCBI’s Gene Expression Omnibus (GEO GSE106598). We used the F ratio to verify that the variance between groups is higher relative to the random within-group variance. The calculated F ratio was 10.19 before correction for technical variance and 23.1 after correction, indicating the substantial higher variation associated with knockout and activation com-pared with the within-group variance.

1 4insight.jci.org https://doi.org/10.1172/jci.insight.99712
R E S E A R C H A R T I C L E
Bioinformatic analysis of microarray data. For import of microarray data into PGS, background correc-tion, removal of pseudogenes and the corresponding probes, log2 transformation and quantile normaliza-tion of Agilent Whole Mouse Genome Microarray expression data was applied. Further, only one probe per gene symbol was chosen by selecting those probes covering a gene that showed the highest variance among all samples. This approach reflects gene-level rather than transcript-level expression. Importantly, utilizing all probes versus only those probes per gene with the highest variance did not alter the overall data structure (e.g., grouping of samples) (data not shown). Another advantage of reducing the probe numbers per gene is an increased signal-to-noise ratio (F ratio) and therefore increased data quality (data not shown). Following this approach, 10,267 unique transcripts were selected for further analysis. Technical variances were corrected using the surrogate variable analysis (SVA) algorithm (53) implemented in R (54) with defining significant surrogate variables using the “be” method (used number of surrogate variables = 1). The identified surrogate variable was used as covariate in the model design of the analysis of covariance (ANCOVA) model of PGS. Differentially expressed genes were defined by a fold change ≥ 2 or ≤ –2 and an FDR-corrected P ≤ 0.05. To visualize the structure within the data, we performed PCA on all present genes and hierarchical clustering (HC) across all conditions using default settings in PGS on the 271 differen-tially expressed genes comparing cKO–0 hours (cKO-0h) versus WT-0h and 155 comparing cKO-3h versus WT-3h. HC identified 8 clusters (clusters 1–8) within the resulting heatmap of the comparison KO-0h vs WT-0h and 8 clusters (clusters 9–16) within the resulting heatmap of the comparison KO-3h versus WT-3h. Subsequently, we assessed the functionality of these clustered gene sets using the enrichGO function provided within the R package clusterProfiler (55). GO terms were considered significantly enriched with a Bonferroni-corrected P value < 0.01. Genes being in a cluster and being responsible for a GO enrichment were extracted and are shown in the figure.
Statistics. All statistics were calculated with Prism version 6.0 (GraphPad) using a Mann–Whitney U comparison test or 2-tailed unpaired Student’s t test as indicated. All data are presented as mean ± SEM. P values less than 0.05 were considered statistically significant, with *P < 0.05, **P < 0.01, and ***P < 0.001.
Study approval. All animal care and use procedures of the present study were performed in accordance with the European Community Standards on the Care and Use of Laboratory Animals and were approved by the ethics committee at University Hospital Erlangen, Erlangen, Germany.
Author contributionsMD and CK designed, conducted, and analyzed the majority of experiments, and prepared the manuscript. DK, TU, and KB conducted the bioinformatics analyses and edited the manuscript. LK, CS, AW, AB, CK, SK, LS, EZ, CR, PH, and IK performed some experiments, analyzed data, and edited the manuscript. SW, LN, TW, and ME provided scientific insight, supervised some analyses, and edited the manuscript. ML, AS, and JLS conceived and designed the study, supervised experiments, and prepared the manuscript.
AcknowledgmentsThis work was supported by the Deutsche Forschungsgemeinschaft (DFG) via the SFB1181 projects B03 (to A. Steinkasserer), A08 (to S. Wirtz), and B06 (to L. Nitschke) and the Graduiertenkolleg 1660 grant B02 to A. Steinkasserer. M. Lechmann and A. Steinkasserer were supported by the DFG projects LE1853/5-1 and STE432/9-1, respectively. A. Steinkasserer was funded by the IZKF from the University Hospital Erlangen, grant A72. M. Lechmann was funded by ELAN from the University Hospital Erlangen. Foxp3-Cre mice were kindly provided by A. Rudensky.
Address correspondence to: Matthias Lechmann or Alexander Steinkasserer, Department of Immune Modulation at the Department of Dermatology, University Hospital Erlangen, Hartmannstrasse 14, 91052 Erlangen, Germany. Phone: 49.9131.853.4746; Email: [email protected] (M. Lechmann). Phone: 49.9131.853.6725; Email: [email protected] (A. Steinkasserer).
1. Sakaguchi S, Sakaguchi N, Asano M, Itoh M, Toda M. Immunologic self-tolerance maintained by activated T cells express-ing IL-2 receptor alpha-chains (CD25). Breakdown of a single mechanism of self-tolerance causes various autoimmune dis-eases. J Immunol. 1995;155(3):1151–1164.
2. Zuany-Amorim C, et al. Suppression of airway eosinophilia by killed Mycobacterium vaccae-induced allergen-specific regula-tory T-cells. Nat Med. 2002;8(6):625–629.

1 5insight.jci.org https://doi.org/10.1172/jci.insight.99712
R E S E A R C H A R T I C L E
3. Akbari O, et al. Antigen-specific regulatory T cells develop via the ICOS-ICOS-ligand pathway and inhibit allergen-induced air-way hyperreactivity. Nat Med. 2002;8(9):1024–1032.
4. Kullberg MC, et al. Bacteria-triggered CD4(+) T regulatory cells suppress Helicobacter hepaticus-induced colitis. J Exp Med. 2002;196(4):505–515.
5. Fontenot JD, Gavin MA, Rudensky AY. Foxp3 programs the development and function of CD4+CD25+ regulatory T cells. Nat Immunol. 2003;4(4):330–336.
6. Hori S, Nomura T, Sakaguchi S. Control of regulatory T cell development by the transcription factor Foxp3. Science. 2003;299(5609):1057–1061.
7. Khattri R, Cox T, Yasayko SA, Ramsdell F. An essential role for Scurfin in CD4+CD25+ T regulatory cells. Nat Immunol. 2003;4(4):337–342.
8. Chen W, et al. Conversion of peripheral CD4+CD25- naive T cells to CD4+CD25+ regulatory T cells by TGF-beta induction of transcription factor Foxp3. J Exp Med. 2003;198(12):1875–1886.
9. Zheng SG, Wang J, Wang P, Gray JD, Horwitz DA. IL-2 is essential for TGF-beta to convert naive CD4+CD25- cells to CD25+Foxp3+ regulatory T cells and for expansion of these cells. J Immunol. 2007;178(4):2018–2027.
10. Reinwald S, et al. CD83 expression in CD4+ T cells modulates inflammation and autoimmunity. J Immunol. 2008;180(9):5890–5897. 11. Zhou LJ, Tedder TF. Human blood dendritic cells selectively express CD83, a member of the immunoglobulin superfamily.
J Immunol. 1995;154(8):3821–3835. 12. Zinser E, Turza N, Steinkasserer A. CNI-1493 mediated suppression of dendritic cell activation in vitro and in vivo. Immunobiol-
ogy. 2004;209(1–2):89–97. 13. Breloer M. CD83: regulator of central T cell maturation and peripheral immune response. Immunol Lett. 2008;115(1):16–17. 14. Kreiser S, et al. Murine CD83-positive T cells mediate suppressor functions in vitro and in vivo. Immunobiology.
2015;220(2):270–279. 15. Lechmann M, Shuman N, Wakeham A, Mak TW. The CD83 reporter mouse elucidates the activity of the CD83 promoter in B,
T, and dendritic cell populations in vivo. Proc Natl Acad Sci USA. 2008;105(33):11887–11892. 16. Prazma CM, Yazawa N, Fujimoto Y, Fujimoto M, Tedder TF. CD83 expression is a sensitive marker of activation required for
B cell and CD4+ T cell longevity in vivo. J Immunol. 2007;179(7):4550–4562. 17. Hock BD, Kato M, McKenzie JL, Hart DN. A soluble form of CD83 is released from activated dendritic cells and B lympho-
cytes, and is detectable in normal human sera. Int Immunol. 2001;13(7):959–967. 18. Hock BD, Haring LF, Steinkasserer A, Taylor KG, Patton WN, McKenzie JL. The soluble form of CD83 is present at elevated
levels in a number of hematological malignancies. Leuk Res. 2004;28(3):237–241. 19. Hock BD, et al. Levels of the soluble forms of CD80, CD86, and CD83 are elevated in the synovial fluid of rheumatoid arthritis
patients. Tissue Antigens. 2006;67(1):57–60. 20. Bock F, et al. Topical application of soluble CD83 induces IDO-mediated immune modulation, increases Foxp3+ T cells, and
prolongs allogeneic corneal graft survival. J Immunol. 2013;191(4):1965–1975. 21. Eckhardt J, et al. Soluble CD83 ameliorates experimental colitis in mice. Mucosal Immunol. 2014;7(4):1006–1018. 22. Ge W, et al. Immunosuppression involving soluble CD83 induces tolerogenic dendritic cells that prevent cardiac allograft rejec-
tion. Transplantation. 2010;90(11):1145–1156. 23. Lan Z, et al. Induction of kidney allograft tolerance by soluble CD83 associated with prevalence of tolerogenic dendritic cells
and indoleamine 2,3-dioxygenase. Transplantation. 2010;90(12):1286–1293. 24. Lan Z, et al. Prevention of chronic renal allograft rejection by soluble CD83. Transplantation. 2010;90(12):1278–1285. 25. Xu JF, et al. A limited course of soluble CD83 delays acute cellular rejection of MHC-mismatched mouse skin allografts.
Transpl Int. 2007;20(3):266–276. 26. Fujimoto Y, et al. CD83 expression influences CD4+ T cell development in the thymus. Cell. 2002;108(6):755–767. 27. Fujimoto Y, Tedder TF. CD83: a regulatory molecule of the immune system with great potential for therapeutic application. J
Med Dent Sci. 2006;53(2):85–91. 28. von Rohrscheidt J, et al. Thymic CD4 T cell selection requires attenuation of March8-mediated MHCII turnover in cortical epi-
thelial cells through CD83. J Exp Med. 2016;213(9):1685–1694. 29. Fontenot JD, Rasmussen JP, Williams LM, Dooley JL, Farr AG, Rudensky AY. Regulatory T cell lineage specification by the
forkhead transcription factor foxp3. Immunity. 2005;22(3):329–341. 30. Gavin MA, et al. Foxp3-dependent programme of regulatory T-cell differentiation. Nature. 2007;445(7129):771–775. 31. Krzyzak L, et al. CD83 modulates B cell activation and germinal center responses. J Immunol. 2016;196(9):3581–3594. 32. Robinson AP, Harp CT, Noronha A, Miller SD. The experimental autoimmune encephalomyelitis (EAE) model of MS: utility
for understanding disease pathophysiology and treatment. Handb Clin Neurol. 2014;122:173–189. 33. Bailey SL, Schreiner B, McMahon EJ, Miller SD. CNS myeloid DCs presenting endogenous myelin peptides ‘preferentially’
polarize CD4+ T(H)-17 cells in relapsing EAE. Nat Immunol. 2007;8(2):172–180. 34. Kang Z, et al. Astrocyte-restricted ablation of interleukin-17-induced Act1-mediated signaling ameliorates autoimmune enceph-
alomyelitis. Immunity. 2010;32(3):414–425. 35. Mombaerts P, Iacomini J, Johnson RS, Herrup K, Tonegawa S, Papaioannou VE. RAG-1-deficient mice have no mature B and
T lymphocytes. Cell. 1992;68(5):869–877. 36. Becker C, et al. In vivo imaging of colitis and colon cancer development in mice using high resolution chromoendoscopy. Gut.
2005;54(7):950–954. 37. Kajita K, et al. TNFalpha reduces the expression of peroxisome proliferator-activated receptor gamma (PPARgamma) via the
production of ceramide and activation of atypical PKC. Diabetes Res Clin Pract. 2004;66 Suppl 1:S79–S83. 38. Ye J. Regulation of PPARgamma function by TNF-alpha. Biochem Biophys Res Commun. 2008;374(3):405–408. 39. Hadaschik EN, et al. Regulatory T cell-deficient scurfy mice develop systemic autoimmune features resembling lupus-like dis-
ease. Arthritis Res Ther. 2015;17:35. 40. Zinser E, Lechmann M, Golka A, Lutz MB, Steinkasserer A. Prevention and treatment of experimental autoimmune encepha-
lomyelitis by soluble CD83. J Exp Med. 2004;200(3):345–351.

1 6insight.jci.org https://doi.org/10.1172/jci.insight.99712
R E S E A R C H A R T I C L E
41. Wang Y, Su MA, Wan YY. An essential role of the transcription factor GATA-3 for the function of regulatory T cells. Immunity. 2011;35(3):337–348.
42. Henson SM, Akbar AN. KLRG1--more than a marker for T cell senescence. Age (Dordr). 2009;31(4):285–291. 43. Yuan X, Dee MJ, Altman NH, Malek TR. IL-2Rβ-dependent signaling and CD103 functionally cooperate to maintain tolerance
in the gut mucosa. J Immunol. 2015;194(3):1334–1346. 44. Chinen T, et al. An essential role for the IL-2 receptor in Treg cell function. Nat Immunol. 2016;17(11):1322–1333. 45. Tanoue T, Atarashi K, Honda K. Development and maintenance of intestinal regulatory T cells. Nat Rev Immunol.
2016;16(5):295–309. 46. Ohkura N, Sakaguchi S. Maturation of effector regulatory T cells. Nat Immunol. 2011;12(4):283–284. 47. Cretney E, Kallies A, Nutt SL. Differentiation and function of Foxp3(+) effector regulatory T cells. Trends Immunol.
2013;34(2):74–80. 48. Horvatinovich JM, et al. Soluble CD83 inhibits T cell activation by binding to the TLR4/MD-2 complex on CD14+ monocytes.
J Immunol. 2017;198(6):2286–2301. 49. Huang Y, Li T, Sane DC, Li L. IRAK1 serves as a novel regulator essential for lipopolysaccharide-induced interleukin-10 gene
expression. J Biol Chem. 2004;279(49):51697–51703. 50. Maitra U, Davis S, Reilly CM, Li L. Differential regulation of Foxp3 and IL-17 expression in CD4 T helper cells by IRAK-1.
J Immunol. 2009;182(9):5763–5769. 51. Jensen EC. Quantitative analysis of histological staining and fluorescence using ImageJ. Anat Rec (Hoboken). 2013;296(3):378–381. 52. Miller SD, Karpus WJ. Experimental autoimmune encephalomyelitis in the mouse. Curr Protoc Immunol. 2007;Chapter 15:Unit 15.1. 53. Leek JT, Storey JD. Capturing heterogeneity in gene expression studies by surrogate variable analysis. PLoS Genet.
2007;3(9):1724–1735. 54. Leek JT, Johnson WE, Parker HS, Jaffe AE, Storey JD. The sva package for removing batch effects and other unwanted varia-
tion in high-throughput experiments. Bioinformatics. 2012;28(6):882–883. 55. Yu G, Wang LG, Han Y, He QY. clusterProfiler: an R package for comparing biological themes among gene clusters. OMICS.
2012;16(5):284–287.