cdn.sare.org · web viewvegetation weight veg vs roots 0.22600000000000001 8.4000000000000019e-2...
TRANSCRIPT

<--- 1 m --->
<1m>
Ginseng GI)
1/2 meter
BC
1/2 meter
FU
1/2 meter
VS
1/2 meter
GO
1/2 meter
GI
1/2 meter
Goldenseal (GO) GI BC FU VS GO
1/2 meter
VA Snakeroot
(VS)GO GI BC FU VS
1/2 meter
F. Unicorn (FU) VS GO GI BC FU
1/2 meter
Black Cohosh
(BC)FU VS GO GI BC
Figure 1. planting design for FFN private landowner trials
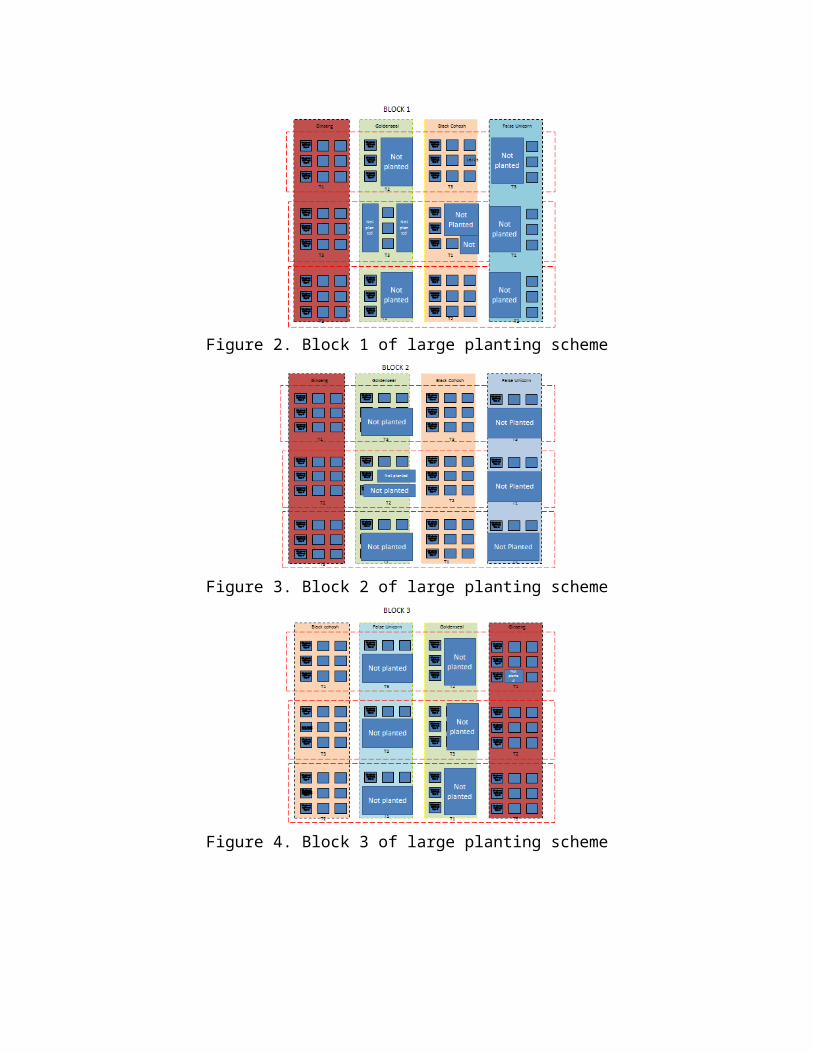
Figure 2. Block 1 of large planting scheme
Figure 3. Block 2 of large planting scheme
Figure 4. Block 3 of large planting scheme

0 0.2 0.4 0.6 0.8 1 1.2 1.40
0.1
0.2
0.3
0.4
0.5
0.6
0.7
0.8
f(x) = 0.658941655185617 x − 0.0544729006975243R² = 0.672434963830395
Veg vs RootsLinear (Veg vs Roots)
Vegetation weight
Root
Wei
ght
Figure 5. Relationship between ginseng root weight and vegetation weights of plants harvested from the UGA experimental forest in 2011.

0 1 2 3 4 5 60
2
4
6
8
10
12
14
16
18
f(x) = 0.853377483443709 x + 1.68562913907285R² = 0.0963253912157164
Root to ShootLinear (Root to Shoot)
Vegetation weight (grams)
Root
wei
ght (
gram
s)
Figure 6. Relationship between false unicorn root weight and vegetation weights of plants harvested from the UGA experimental forest in 2011.
0 0.5 1 1.5 2 2.50
0.5
1
1.5
2
2.5
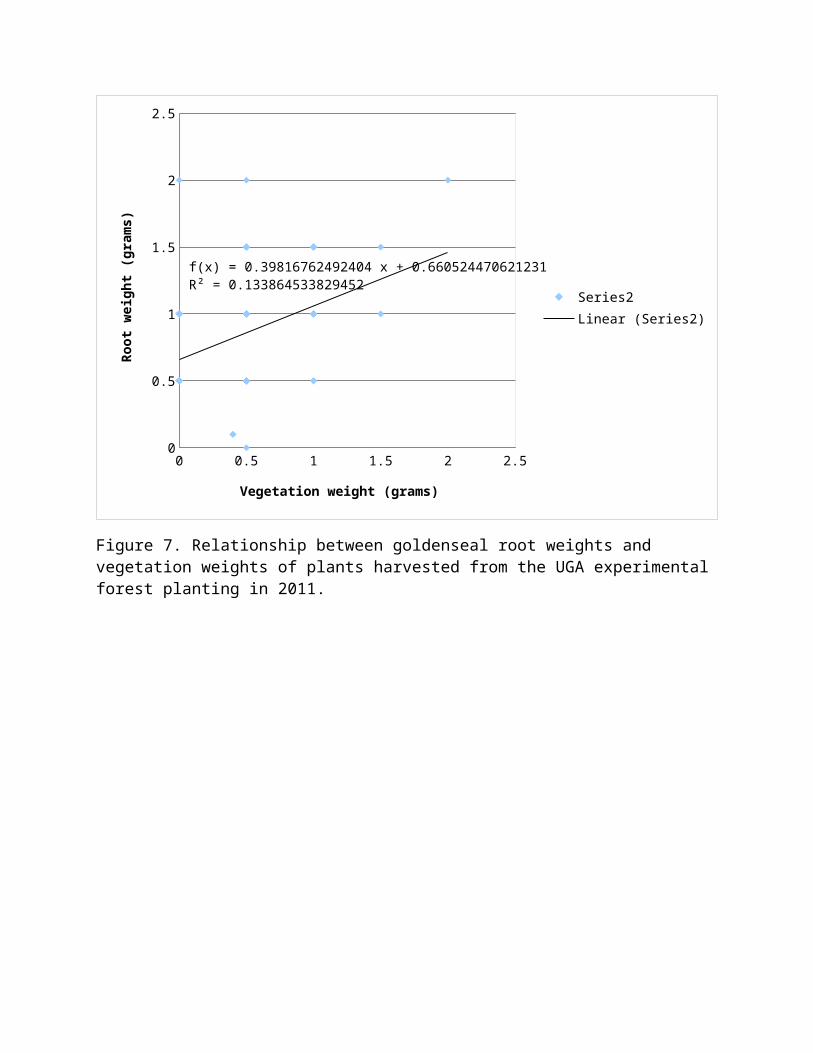
f(x) = 0.39816762492404 x + 0.660524470621231R² = 0.133864533829452
Series2Linear (Series2)
Vegetation weight (grams)
Root
wei
ght (
gram
s)
Figure 7. Relationship between goldenseal root weights and vegetation weights of plants harvested from the UGA experimental forest planting in 2011.
0 0.2 0.4 0.6 0.8 1 1.2 1.4 1.6 1.8 20
0.1
0.2
0.3
0.4
0.5
0.6
0.7
0.8
0.9
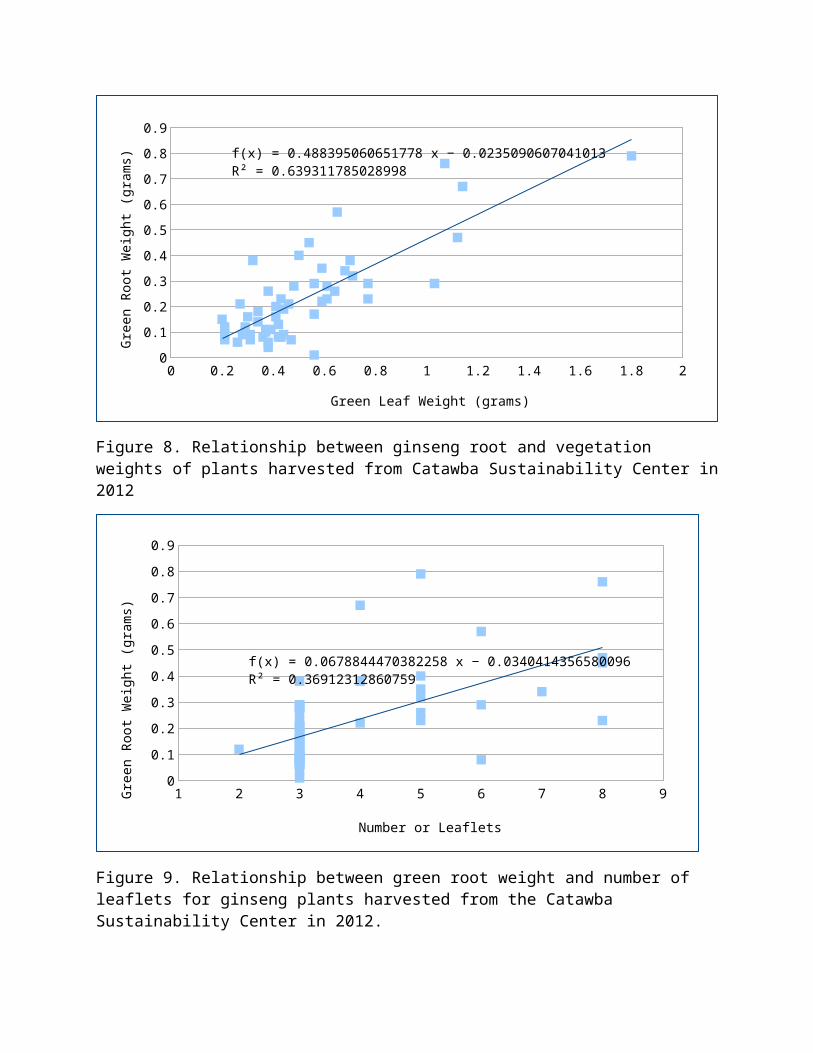
f(x) = 0.488395060651778 x − 0.0235090607041013R² = 0.639311785028998
Green Leaf Weight (grams)
Gree
n Ro
ot W
eigh
t (gr
ams)
Figure 8. Relationship between ginseng root and vegetation weights of plants harvested from Catawba Sustainability Center in 2012
1 2 3 4 5 6 7 8 90
0.1
0.2
0.3
0.4
0.5
0.6
0.7
0.8
0.9
f(x) = 0.0678844470382258 x − 0.0340414356580096R² = 0.36912312860759
Number or Leaflets
Gree
n Ro
ot W
eigh
t (gr
ams)
Figure 9. Relationship between green root weight and number of leaflets for ginseng plants harvested from the Catawba Sustainability Center in 2012.

0 5 10 15 20 25 30 35 40 450
5
10
15
20
25
30f(x) = 0.765437809743222 x + 3.13016853998809R² = 0.63518728357266
Green Leaf Weight (grams)
Gre
en R
oot W
eigh
t (gr
ams)
Figure 10. Relationship between goldenseal green root weights and green leaf weights for plants harvested from the Catawba Sustainability Center plantings in 2012.
0 5 10 15 20 25 30 350
5
10
15
20
25
30
f(x) = 0.979199852985127 exp( 0.100364354336634 x )R² = 0.492455941754434
Largest Leaf Diameter (cm)
Gree
n Ro
ot W
eigh
t (gr
ams)
Figure 11. Relationship between goldenseal green leaf diameter (cm) and green root weights (grams) for plants harvested from the Catawba Sustainability Center plantings in 2012

Figure 12. Ginseng growth in sites with and without Japanese stilt grass suggests that the invasive plant may improve ginseng production.
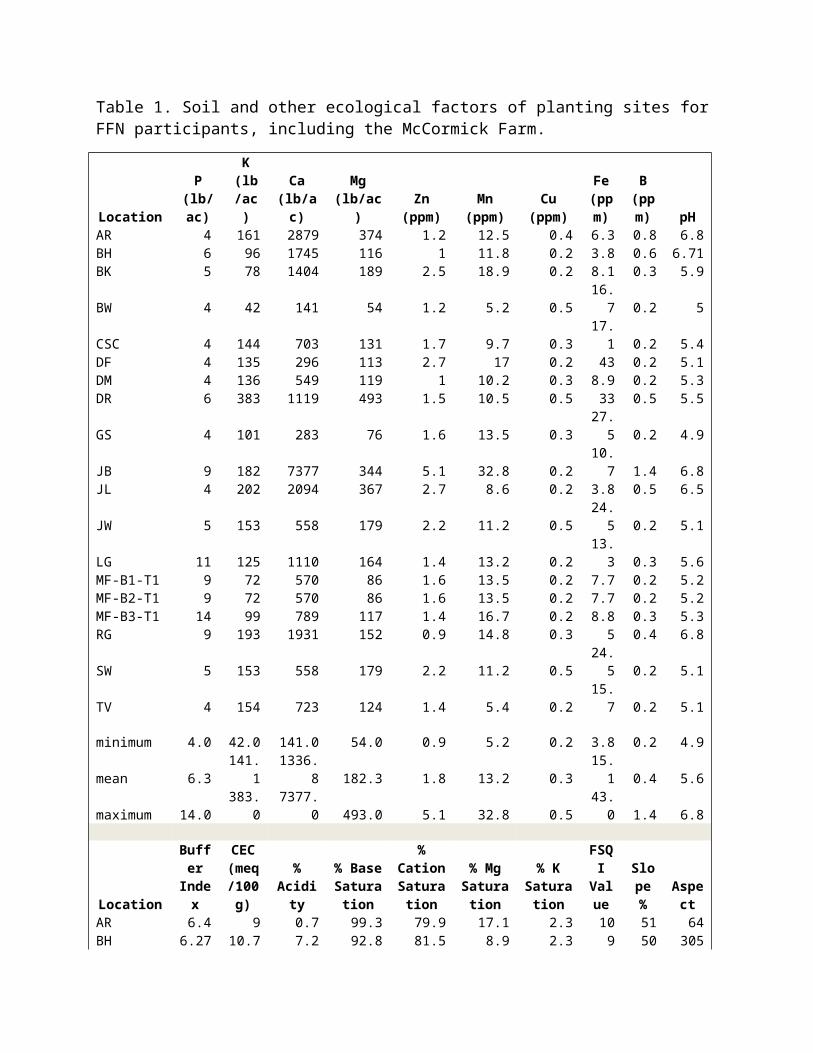
Table 1. Soil and other ecological factors of planting sites for FFN participants, including the McCormick Farm.
Location
P (lb/ac
)
K (lb/a
c)Ca
(lb/ac)Mg
(lb/ac)Zn
(ppm)Mn
(ppm)Cu
(ppm)
Fe (ppm)
B (ppm) pH
AR 4 161 2879 374 1.2 12.5 0.4 6.3 0.8 6.8BH 6 96 1745 116 1 11.8 0.2 3.8 0.6 6.71BK 5 78 1404 189 2.5 18.9 0.2 8.1 0.3 5.9BW 4 42 141 54 1.2 5.2 0.5 16.7 0.2 5CSC 4 144 703 131 1.7 9.7 0.3 17.1 0.2 5.4DF 4 135 296 113 2.7 17 0.2 43 0.2 5.1DM 4 136 549 119 1 10.2 0.3 8.9 0.2 5.3DR 6 383 1119 493 1.5 10.5 0.5 33 0.5 5.5GS 4 101 283 76 1.6 13.5 0.3 27.5 0.2 4.9JB 9 182 7377 344 5.1 32.8 0.2 10.7 1.4 6.8JL 4 202 2094 367 2.7 8.6 0.2 3.8 0.5 6.5JW 5 153 558 179 2.2 11.2 0.5 24.5 0.2 5.1LG 11 125 1110 164 1.4 13.2 0.2 13.3 0.3 5.6MF-B1-T1 9 72 570 86 1.6 13.5 0.2 7.7 0.2 5.2MF-B2-T1 9 72 570 86 1.6 13.5 0.2 7.7 0.2 5.2MF-B3-T1 14 99 789 117 1.4 16.7 0.2 8.8 0.3 5.3RG 9 193 1931 152 0.9 14.8 0.3 5 0.4 6.8SW 5 153 558 179 2.2 11.2 0.5 24.5 0.2 5.1TV 4 154 723 124 1.4 5.4 0.2 15.7 0.2 5.1
minimum 4.0 42.0 141.0 54.0 0.9 5.2 0.2 3.8 0.2 4.9mean 6.3 141.1 1336.8 182.3 1.8 13.2 0.3 15.1 0.4 5.6maximum 14.0 383.0 7377.0 493.0 5.1 32.8 0.5 43.0 1.4 6.8
Location
Buffer
Index
CEC (meq/100g
)
% Acidit
y
% Base Saturat
ion
% Cation Saturat
ion
% Mg Saturat
ion
% K Saturat
ion
FSQI
Value
Slope %
Aspect
AR 6.4 9 0.7 99.3 79.9 17.1 2.3 10 51 64BH 6.27 10.7 7.2 92.8 81.5 8.9 2.3 9 50 305BK 6.14 5.9 26 74 59.1 13.1 1.7 13 13 14BW 5.78 4.3 85.4 14.6 8.2 5.2 1.3 12 25 38CSC 5.87 5.6 55.9 44.1 31.2 9.6 3.3 7 57 336DF 5.81 4.9 71.8 28.2 15.1 9.5 3.5 12 30 52DM 5.92 4.9 58.3 41.7 28.1 10 3.6 13 47 30DR 6.09 7.2 25.7 74.3 39 28.4 6.9 7 119GS 5.67 5.5 79 21 12.9 5.7 2.4JB 6.34 20.4 1.8 98.3 90.2 6.9 1.1 7 40 280JL 6.27 7.8 9.9 90.1 67.3 19.5 3.3 8 24 245JW 5.59 7.1 67.4 32.6 19.5 10.3 2.8 9 35 260LG 5.88 6.7 46.1 53.9 41.4 10.1 2.4 12 25 28MF-B1-T1 60.1 4.2 55.3 44.7 34 8.5 2.2 12 9 2MF-B2-T1 60.1 4.2 55.3 44.7 34 8.5 2.2 11 2 300MF-B3-T1 5.92 5.4 52.5 47.5 36.3 8.9 2.3 12 3 352RG 6.37 5.9 3.1 97 82.1 10.7 4.2 12 23 31

SW 5.59 7.1 67.4 32.6 19.5 10.3 2.8 9 35 260TV 5.81 6 58.2 41.8 30 8.5 3.3 7 34 270
minimum 5.6 4.2 0.7 14.6 8.2 5.2 1.1 7.0 2.0mean 11.7 7.0 43.5 56.5 42.6 11.0 2.8 10.1 29.6maximum 60.1 20.4 85.4 99.3 90.2 28.4 6.9 13.0 57.0
Location
Slope
Position
Oak SI (ft)
Elevation (ft)
AR 2 70BH 4 65 1914BK 4 80 2117BW 1 75 2568CSC 2 60 2131DF 3 75 2580DM 5 80 2316DR 2 50 2111GS 2578JB 2 60 2020JL 3 60 2899JW 5 65 1819LG 2 75 2788MF-B1-T1 4 75 1800MF-B2-T1 3 72 1800MF-B3-T1 3 75 1800RG 4 75 1905SW 5 65 2774TV 2 60 2751
minimum 1.0 50.0 1800.0mean 3.1 68.7 2259.5maximum 5.0 80.0 2899.0

Table 2. Soil conditions of the three sites on the UGA forest that were planted.
Block1 2 3
pH (soil water) 4.77c 5.07b 5.74apH (CaCl2) 4.04c 4.28b 5.03a
g-C/100 g-soil 3.39b 3.29b 11.98a
g-N/100 g-soil 0.13b 0.13b 0.48a
C:N 25.93a 25.67a 24.24a
meq Ortho-P/100g-soil 1.07a 0.66a 0.75a
meq Ca/100g-soil 1.15b 0.97b 3.69a
meq K/100g-soil 0.16b 0.15b 0.24a
cmol exchangeable acidity/kg-soil 1.46a 1.04b 0.21c
meq CEC/100g-soil 3.23b 2.71b 5.42a
% base saturation 53.7b 60.7b 95.2a

Table 3. Overall plant survival of species planted by private landowners of the FFN.
Species Mean(Std Dev)
Ginseng 11.4 (6.5)Goldenseal 14.6 (6)Virginia Snakeroot 3.9 (4.9)False unicorn 0Black cohosh 0
Table 4. 2012 survival of species planted at the McCormick farm in 2010, reported by treatment.
TreatmentSpecies T1 – No Disturb T2 – Rake T3 – Till MeanBlack cohosh 0 0 0 0False unicorn 10.1 (3.4) 12.8 (4.6) 15.0 (2.6) 12.63 (3.53)Ginseng 10.6 (3.9) 10.5 (4.8) 6.0 (3.6) 9.0 (4.1)Goldenseal 10.9 (4) 7.9 (3.8) 7.6 (3.5) 8.8 (3.76)
Table 5. Overall plant survival of species planted at the UGA experimental forest in 2010, reported by treatment.
TreatmentSpecies T1 – No Disturb T2 – Rake T3 – Till MeanBlack cohosh 0 0 1.1 0.4False unicorn 18.9 (2.9) 17.4 (1.7) 17.6 (3.4) 17.9 (2.7)Ginseng 5.8 (2.2) 7.4 (3.9) 9.3 (3.5) 7.5 (3.2)Goldenseal 5.6 (5.7) 10.3 (3.4) 10.1 (5.0) 8.7 (4.7)

Table 6. Demographic characteristics of FFN participants, and potential forest farmers.
Characteristic Response Category MeanPercent of
RespondentsPrimary motivations for collaborative conservation partnership membership*
Environmental 79%Educational 79%Economic 46%Social 44%
Initial information source about collaborative conservation partnership
Word of mouth 46%Presentation 25%Other organization 16%Advertisement 15%
Belong to multiple conservation groups 60%Gender Male 59%
Female 36%Both (a couple) 5%
Household Annual Income $55,000-$99,000Age 55-64RaceEducational Attainment Bachelor's
DegreeAcres forestland owned 95Years of land tenure 24Primary residence 75%Primary ownership motivations Live there
Appreciate the woods/aesthetics/privacyRecreation
Most common harvest objectives Improve forest health 44%Achieve objectives in management plan 44%Obtain products for personal use 41%
Primary land management information sources
Virginia Department of Forestry 87%Conservation organizations 57%Extension/university personnel 55%Private consultant 49%
Diffusion of Innovations Adopter Categories
Innovators 53%Majority 21%Laggards 26%

Table 7. Descriptive statistics for ginseng root and vegetation harvested from the UGA experimental forest plantings in 2011.
Total Root VegetationCount 158 158 158mean 0.386 0.120 0.265
maximum 1.779 0.759 1.197minimum 0.111 0.001 0.049
skew 3.078 2.826 3.036kurtosis 12.696 10.638 14.255variance 0.060 0.013 0.020
std. deviation 0.246 0.115 0.143Pearson 0.820
Table 8. Descriptive statistics for false unicorn root and vegetation harvested from the UGA experimental forest plantings in 2011.
Total Root VegetationCount 161 161 161Min 0.50 0.50 0.00Max 16.00 15.50 5.00
Mean 3.52 2.53 0.99Stdev 2.74 2.35 0.86
Variance 7.52 5.54 0.73Pearson
s 0.31
Table 9. Descriptive statistics for goldenseal root and vegetation harvested from the UGA experimental forest plantings in 2011.
Total Root VegetationCount 82 82 82Min 0.5 0 0Max 4 2 2
Mean 1.43 0.88 0.55Stdev 0.69 0.44 0.40
Variance 0.48 0.19 0.16Pearson
s 0.37