supplemental material: individual and neighborhood ... · hs/trade school/ged 0.254 0.435 0.255...
TRANSCRIPT
Environ Health Perspect DOI: 10.1289/EHP199
Note to readers with disabilities: EHP strives to ensure that all journal content is accessible to all
readers. However, some figures and Supplemental Material published in EHP articles may not conform to
508 standards due to the complexity of the information being presented. If you need assistance accessing
journal content, please contact [email protected]. Our staff will work with you to assess and meet
your accessibility needs within 3 working days.
Supplemental Material
Individual and Neighborhood Socioeconomic Status and the
Association between Air Pollution and Cardiovascular Disease
Gloria C. Chi, Anjum Hajat, Chloe E. Bird, Mark R. Cullen, Beth Ann Griffin, Kristin A.
Miller, Regina A. Shih, Marcia L. Stefanick, Sverre Vedal, Eric A. Whitsel, and Joel D.
Kaufman
Table of Contents
Women’s Health Initiative Classification Criteria for Cardiovascular Disease Events
Cross-level Interaction
Multiple Imputation
Table S1. Standardized mean differences of participant characteristics between complete cases
and original eligible sample of women CVD-free at baseline.
Table S2. Correlation Matrix of Socioeconomic Indicators.
Table S3. Baseline population characteristics by cardiovascular event incidence.
Table S4. Estimated hazard ratios for time to first cardiovascular event associated with 5 μg/m3
higher exposure to PM2.5, by different levels of covariate adjustment and with additional
adjustment for each socioeconomic measure.
Table S5. Estimated hazard ratios for time to first cardiovascular event associated with 5 μg/m3
higher exposure to baseline PM2.5 from multiple imputation analysis.

Table S6. Estimated hazard ratios for time to first cardiovascular event associated with 5 μg/m3
higher exposure to PM2.5 according to levels of SES and p-values for interactions, from multiple
imputation analysis.
Figure S1. Scatter plot of first predicted annual average PM2.5 by neighborhood socioeconomic
status (NSES) score with a locally weighted scatterplot smoothing (LOWESS) curve. For most
participants, the first available PM2.5 prediction was the baseline prediction; otherwise, the next
available non-missing PM2.5 prediction was used.
Figure S2. Estimated Hazard Ratios for Time to First Cardiovascular Event Associated with 5
μg/m3 Higher Exposure to Fine Particulate Matter (PM2.5) According to Combined Levels of
Individual and Neighborhood Socioeconomic Status (SES) and P values for interactions,
Women’s Health Initiative Observational Study, 1993-2005. All models except for the NSES
score model (see below) adjusted for age, race/ethnicity, smoking, body mass index, diabetes,
hypertension, hypercholesterolemia, individual education, individual family income, individual
occupation, percent adults over 25 years with high school degree, median family income, percent
of civilian population over 16 with professional/managerial/executive occupations, median value
of owner-occupied housing units, and percent of families above poverty line. Effect modification
was modeled by adding multiplicative interaction terms. The NSES score model adjusted for
individual SES indicators but not other NSES indicators. A) Estimated hazard ratios by levels of
combined NSES and individual education. Low/Low participants have low individual education
and low neighborhood SES (NSES). Low/High participants have low education and high NSES
or high education and low NSES. High/High participants have high education and high NSES.
B) Estimated hazard ratios by levels of combined NSES and individual income. Low/Low
participants have low individual income and low NSES. Low/High participants have low income
and high NSES or high income and low NSES. High/High participants have high income and
high NSES.

Women’s Health Initiative classification criteria for cardiovascular disease events
The outcome of interest in this study included time to first cardiovascular event (defined as
myocardial infarction (MI), stroke, and death from coronary heart disease (CHD) or cerebrovascular
disease). An algorithm that incorporated elements of the medical history, electrocardiogram readings,
and results of cardiac enzyme/troponin determinations were used to identify and categorize MI’s into
definite or possible MI’s.21 Strokes included persistent neurological deficit of more than 24 hour
duration, due to obstruction or rupture in the brain arterial system. Deaths due to coronary heart disease
include deaths due to definite MI’s and to definite or possible CHD. Definite fatal CHD were those with
no known non-atherosclerotic cause and chest pain within the 72 hours of death and/or a history of
chronic disease (with no valvular heart disease or non-ischemic cardiomyopathy). Possible
atherosclerotic cardiac disease death was defined as those with no known non-atherosclerotic cause that
were consistent with CHD as an underlying cause.
Cross-level interaction
Cross-level interactions were explored in sensitivity analyses. On the individual level,
participant education (HS/trade school/GED or less vs. some college or more) and income (<$50,000 vs.
$50,000 or more) were dichotomized. All neighborhood socioeconomic status (NSES) characteristics
were dichotomized at the median. For each NSES characteristic and individual-level education or
income, participants were categorized as low on both levels (low/low), low on one level and high on the
other (low/high), and high on both levels. We were unable to separate out those who had discordant
socioeconomic status (SES) levels as low individual SES/high NSES or vice versa due to small
numbers. The relationship between long-term annual average PM2.5 exposure and time until incident
cardiovascular events was assessed using Cox proportional hazards models. Potential effect
modification by SES was investigated by fitting multiplicative interaction terms for different levels of
the SES variable with PM2.5. All models except for the NSES score models adjusted for age,

race/ethnicity, smoking, body mass index, diabetes, hypertension, hypercholesterolemia, individual
education, individual family income, individual occupation, percent adults over 25 years with high
school degree, median family income, percent of civilian population over 16 with
professional/managerial/executive occupations, median value of owner-occupied housing units, and
percent of families above poverty line. The NSES score model adjusted for all covariates except for
other neighborhood-level SES indicators.
Results for the cross-level interactions can be found in Figure S1. There was no evidence that
having low education and low NSES conferred greater disadvantage than having low SES on only one
level. However, there is evidence that the association between PM2.5 and CVD is the greatest among
those with low income and low NSES, even more so than those who have low SES on only one level.
Multiple imputation
Multiple imputation analyses included 60,744 women who did not have CVD at baseline and did
not have missing baseline PM2.5 predictions. These analyses were conducted using baseline PM2.5
instead of time-weighted PM2.5 for computational feasibility. Missing values in all SES indicators and
covariates were multiply imputed 5 times using chained equations in Stata 13 (StataCorp 2013). The
relationship between long-term annual average PM2.5 exposure and time from enrollment until incident
cardiovascular events was assessed using Cox proportional hazards models. The same baseline
characteristics were controlled for as potential confounders as in the main analysis: age, race/ethnicity,
diabetes, hypertension, hypercholesterolemia, smoking (smoking status, cigarettes per day, years
smoked), and body mass index. Analyses were stratified by 5 year age categories, body mass index (5
categories), and diabetes status for a more thorough adjustment.

Table S1. Standardized mean differences of participant characteristics between complete cases and original eligible sample of
women CVD-free at baseline.
Original Eligible Sample of
CVD-Free Women at Baseline
N=73,094
Complete Case
N=51,754
Standardized
Mean Difference
Variable Mean SD Mean SD
PM2.5 prediction 12.743 2.946 12.650 2.914 0.032
CVD event 0.034 0.181 0.034 0.180 0.001
Age 63.086 7.304 63.037 7.273 0.007
Race/ethnicity
American Indian/Alaskan Native 0.004 0.063 0.004 0.061 0.005
Asian/Pacific Islander 0.031 0.174 0.014 0.117 0.099
Black 0.078 0.268 0.071 0.258 0.025
Hispanic 0.039 0.195 0.039 0.193 0.003
White not of Hispanic origin 0.834 0.372 0.863 0.344 -0.079
Unknown 0.011 0.104 0.009 0.093 0.02
Body mass index 27.081 5.740 27.105 5.714 -0.004
Percent adults 25+ with HS degree 0.865 0.108 0.866 0.107 -0.013
Percent civilians over 16 with
professional/managerial/executive occupations 0.423 0.160 0.424 0.160 -0.011
Median family income 68,056.312 29,549.337 68,139.614 29,401.450 -0.003
Median home value 200,541.217 148,648.707 195,228.912 145,024.650 0.036
Percent families above poverty line 0.912 0.082 0.914 0.081 -0.015
NSES score 76.136 8.495 76.298 8.406 -0.019
Hypertension
No 0.701 0.458 0.706 0.455 -0.011
Yes 0.294 0.456 0.294 0.455 0.001
Diabetes
No 0.955 0.208 0.958 0.201 -0.015

Yes 0.045 0.207 0.042 0.201 0.012
Smoking status
Never smoker 0.508 0.500 0.524 0.499 -0.031
Past smoker 0.419 0.493 0.414 0.493 0.010
Current smoker 0.061 0.239 0.062 0.242 -0.007
Hypercholesterolemia
No 0.866 0.341 0.876 0.330 -0.030
Yes 0.124 0.330 0.124 0.330 0.001
Education
Less than HS 0.047 0.211 0.041 0.199 0.027
HS/trade school/GED 0.254 0.435 0.255 0.436 -0.004
Some college or associate degree 0.262 0.440 0.264 0.441 -0.004
Bachelor's degree or higher 0.429 0.495 0.440 0.496 -0.021
Family income
<$20,000 0.134 0.341 0.134 0.341 -0.001
$20,000-$34,999 0.210 0.407 0.221 0.415 -0.027
$35,000-$49,999 0.189 0.391 0.200 0.400 -0.030
$50,000-$74,999 0.194 0.395 0.203 0.403 -0.025
$75,000+ 0.231 0.421 0.241 0.428 -0.025
Occupation at baseline
Managerial/professional 0.423 0.494 0.440 0.496 -0.036
Technical/sales/administrative 0.276 0.447 0.291 0.454 -0.033
Service/labor 0.162 0.369 0.166 0.372 -0.010
Homemaker only 0.102 0.302 0.103 0.304 -0.005

Table S2. Correlation Matrix of Socioeconomic Indicators.
Individual SESa Neighborhood SES
Education Income Education Income Employment
Home
Values Poverty
NSES
Score
Individual SES
Education 1
Income 0.3619 1
Neighborhood SES
Education 0.2735 0.3053 1
Income 0.2656 0.3524 0.763 1
Employment 0.3187 0.3307 0.7946 0.7909 1
Home values 0.2485 0.2941 0.5815 0.7493 0.6729 1
Poverty 0.1374 0.2462 0.6003 0.6984 0.5008 0.4485 1
NSES score 0.2196 0.3218 0.7722 0.8542 0.7057 0.6202 0.7966 1
SES, socioeconomic status; NSES, neighborhood socioeconomic status.
a Individual occupation was included as the following categories (managerial/professional, technical/sales/administrative, service/labor, and
homemaker) and thus not included in the correlation matrix.

Table S3. Baseline population characteristics by cardiovascular event incidence.
Total CVD Events
Yes No
N (%) N (%) N (%)
Race/ethnicity
American Indian/Alaskan Native 193 (0.4) 8 (0.5) 185 (0.4)
Asian/Pacific Islander 722 (1.4) 20 (1.2) 702 (1.4)
Black 3,696 (7.1) 127 (7.3) 3,569 (7.1)
Hispanic 2,016 (3.9) 35 (2.0) 1,981 (3.9)
White not of Hispanic origin 44,671 (86.3) 1,529 (88.0) 43,142 (86.3)
Unknown 456 (0.9) 18 (1.0) 438 (0.9)
Smoking status
Never smoker 27,102 (52.4) 864 (49.7) 26,238 (52.4)
Past smoker 21,425 (41.4) 727 (41.9) 20,698 (41.4)
Current smoker 3,227 (6.2) 146 (8.4) 3,081 (6.2)
Body Mass Index
Normal and underweight (<25) 21,589 (41.7) 616 (35.5) 20,973 (41.7)
Overweight (25-29.9) 17,737 (34.3) 629 (36.2) 17,108 (34.3)
Obese (>=30) 12,428 (24.0) 492 (28.3) 11,936 (24.0)
Hypertension
No 36,553 (70.6) 874 (50.3) 35,679 (70.6)
Yes 15,201 (29.4) 863 (49.7) 14,338 (29.4)
Hypercholesterolemia
No 45,335 (87.6) 1,471 (84.7) 43,864 (87.6)
Yes 6,419 (12.4) 266 (15.3) 6,153 (12.4)
Diabetes
No 49,565 (95.8) 1,545 (88.9) 48,020 (95.8)
Yes 2,189 (4.2) 192 (11.1) 1,997 (4.2)
Individual SES
Education
Less than HS 2,135 (4.1) 105 (6.0) 2,030 (4.1)
HS/trade school/GED 13,217 (25.5) 546 (31.4) 12,671 (25.5)
Some college or associate degree 13,647 (26.4) 477 (27.5) 13,170 (26.4)
Bachelor's degree or higher 22,755 (44.0) 609 (35.1) 22,146 (44.0)
Family income
<$20,000 6,948 (13.4) 358 (20.6) 6,590 (13.4)
$20,000-$34,999 11,428 (22.1) 499 (28.7) 10,929 (22.1)
$35,000-$49,999 10,373 (20.0) 340 (19.6) 10,033 (20.0)
$50,000-$74,999 10,531 (20.3) 255 (14.7) 10,276 (20.3)
$75,000+ 12,474 (24.1) 285 (16.4) 12,189 (24.1)
Occupation at baseline
Managerial/professional 22,796 (44.0) 644 (37.1) 22,152 (44.0)
Technical/sales/administrative 15,038 (29.1) 541 (31.1) 14,497 (29.1)
Service/labor 8,583 (16.6) 327 (18.8) 8,256 (16.6)

Homemaker only 5,337 (10.3) 225 (13.0) 5,112 (10.3)
Neighborhood SES
Percent adults 25+ with HS degree
<82.3% 12,952 (25.0) 461 (26.5) 12,491 (25.0)
82.3-89.4% 12,927 (25.0) 438 (25.2) 12,489 (25.0)
89.5-94.3%+ 12,937 (25.0) 413 (23.8) 12,524 (25.0)
>94.3% 12,938 (25.0) 425 (24.5) 12,513 (25.0)
Median family income
<$47,891 12,946 (25.0) 491 (28.3) 12,455 (25.0)
$47,891-62,526 12,933 (25.0) 421 (24.2) 12,512 (25.0)
$62,527-81,973 12,939 (25.0) 430 (24.8) 12,509 (25.0)
>$81,973 12,936 (25.0) 395 (22.7) 12,541 (25.0)
Percent civilians over 16 with
professional/managerial/executive occupations
<29.7% 12,941 (25.0) 461 (26.5) 12,480 (25.0)
29.7-41.3% 12,939 (25.0) 429 (24.7) 12,510 (25.0)
41.4-54.1% 12,939 (25.0) 441 (25.4) 12,498 (25.0)
>54.1% 12,935 (25.0) 406 (23.4) 12,529 (25.0)
Median home value
<$103,500 12,939 (25.0) 482 (27.7) 12,457 (25.0)
$103,500-153,599 12,943 (25.0) 450 (25.9) 12,493 (25.0)
$153,600-233,999 12,934 (25.0) 385 (22.2) 12,549 (25.0)
>$233,999 12,938 (25.0) 420 (24.2) 12,518 (25.0)
Percent families above poverty line
<89.2% 12,940 (25.0) 453 (26.1) 12,487 (25.0)
89.2-94.0% 12,940 (25.0) 457 (26.3) 12,483 (25.0)
94.1-96.5% 12,943 (25.0) 433 (24.9) 12,510 (25.0)
>96.5% 12,931 (25.0) 394 (22.7) 12,537 (25.0)
NSES score
<72.6 12,939 (25.0) 465 (26.8) 12,474 (25.0)
72.6-77.6 12,938 (25.0) 450 (25.9) 12,488 (25.0)
77.7-81.6 12,939 (25.0) 426 (24.5) 12,513 (25.0)
>81.6 12,938 (25.0) 396 (22.8) 12,542 (25.0)
PM2.5, fine particulate matter; CVD, cardiovascular disease; SES, socioeconomic status; NSES,
neighborhood socioeconomic status; HS, high school.
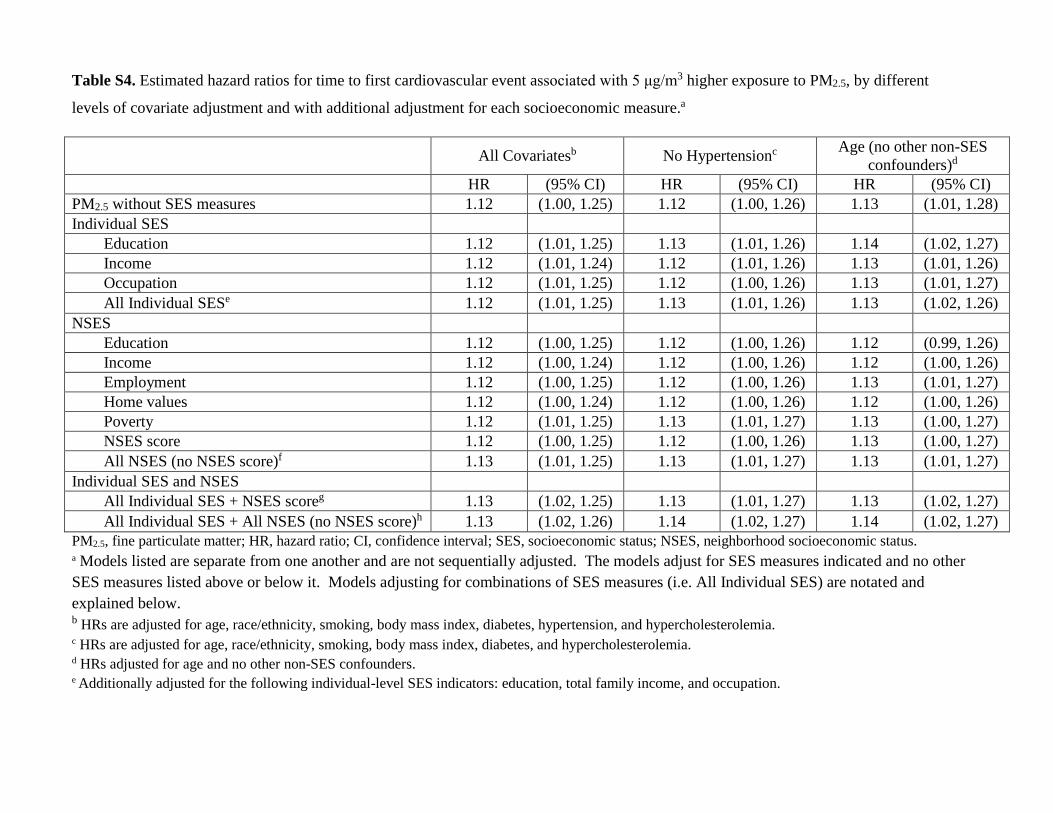
Table S4. Estimated hazard ratios for time to first cardiovascular event associated with 5 μg/m3 higher exposure to PM2.5, by different
levels of covariate adjustment and with additional adjustment for each socioeconomic measure.a
All Covariatesb No Hypertensionc Age (no other non-SES
confounders)d
HR (95% CI) HR (95% CI) HR (95% CI)
PM2.5 without SES measures 1.12 (1.00, 1.25) 1.12 (1.00, 1.26) 1.13 (1.01, 1.28)
Individual SES
Education 1.12 (1.01, 1.25) 1.13 (1.01, 1.26) 1.14 (1.02, 1.27)
Income 1.12 (1.01, 1.24) 1.12 (1.01, 1.26) 1.13 (1.01, 1.26)
Occupation 1.12 (1.01, 1.25) 1.12 (1.00, 1.26) 1.13 (1.01, 1.27)
All Individual SESe 1.12 (1.01, 1.25) 1.13 (1.01, 1.26) 1.13 (1.02, 1.26)
NSES
Education 1.12 (1.00, 1.25) 1.12 (1.00, 1.26) 1.12 (0.99, 1.26)
Income 1.12 (1.00, 1.24) 1.12 (1.00, 1.26) 1.12 (1.00, 1.26)
Employment 1.12 (1.00, 1.25) 1.12 (1.00, 1.26) 1.13 (1.01, 1.27)
Home values 1.12 (1.00, 1.24) 1.12 (1.00, 1.26) 1.12 (1.00, 1.26)
Poverty 1.12 (1.01, 1.25) 1.13 (1.01, 1.27) 1.13 (1.00, 1.27)
NSES score 1.12 (1.00, 1.25) 1.12 (1.00, 1.26) 1.13 (1.00, 1.27)
All NSES (no NSES score)f 1.13 (1.01, 1.25) 1.13 (1.01, 1.27) 1.13 (1.01, 1.27)
Individual SES and NSES
All Individual SES + NSES scoreg 1.13 (1.02, 1.25) 1.13 (1.01, 1.27) 1.13 (1.02, 1.27)
All Individual SES + All NSES (no NSES score)h 1.13 (1.02, 1.26) 1.14 (1.02, 1.27) 1.14 (1.02, 1.27)
PM2.5, fine particulate matter; HR, hazard ratio; CI, confidence interval; SES, socioeconomic status; NSES, neighborhood socioeconomic status. a Models listed are separate from one another and are not sequentially adjusted. The models adjust for SES measures indicated and no other
SES measures listed above or below it. Models adjusting for combinations of SES measures (i.e. All Individual SES) are notated and
explained below. b HRs are adjusted for age, race/ethnicity, smoking, body mass index, diabetes, hypertension, and hypercholesterolemia. c HRs are adjusted for age, race/ethnicity, smoking, body mass index, diabetes, and hypercholesterolemia. d HRs adjusted for age and no other non-SES confounders. e Additionally adjusted for the following individual-level SES indicators: education, total family income, and occupation.

f Additionally adjusted for the following neighborhood-level SES indicators: percent adults over 25 years with high school degree, median family income,
percent of civilian population over 16 with professional/managerial/executive occupations, median value of owner-occupied housing units, and percent of
families above poverty line. This model does not include the NSES score. g Additionally adjusted for the NSES score and all individual SES indicators.h Additionally adjusted for all individual and neighborhood SES indicators except for NSES score.

Table S5. Estimated hazard ratios for time to first cardiovascular event associated with 5 μg/m3 higher
exposure to baseline PM2.5 from multiple imputation analysis. a,b
HRa (95% CI)
PM2.5 without SES measures 1.12 (1.01, 1.24)
Individual SES
Education 1.12 (1.02, 1.24)
Income 1.12 (1.01, 1.23)
Occupation 1.12 (1.01, 1.24)
All Individual SESc 1.12 (1.02, 1.24)
NSES
Education 1.12 (1.01, 1.24)
Income 1.12 (1.01, 1.23)
Employment 1.12 (1.01, 1.24)
Home values 1.12 (1.01, 1.23)
Poverty 1.12 (1.01, 1.24)
NSES score 1.12 (1.01, 1.24)
All NSES (no NSES score)d 1.13 (1.02, 1.25)
Individual SES and NSES
All individual SES + NSES scoree 1.13 (1.03, 1.25)
All individual SES + All NSES (no NSES score)f 1.13 (1.02, 1.24) PM2.5, fine particulate matter; HR, hazard ratio; CI, confidence interval; SES, socioeconomic status; NSES,
neighborhood socioeconomic status. a All HRs are adjusted for age, race/ethnicity, smoking, body mass index, diabetes, hypertension, and
hypercholesterolemia. b Models listed are separate from one another and are not sequentially adjusted. The models adjust for
SES measures indicated and no other SES measures listed above or below it. Models adjusting for
combinations of SES measures (i.e. All Individual SES) are notated and explained below. c Additionally adjusted for the following individual-level SES indicators: education, total family income, and
occupation. d Additionally adjusted for the following neighborhood-level SES indicators: percent adults over 25 years with
high school degree, median family income, percent of civilian population over 16 with
professional/managerial/executive occupations, median value of owner-occupied housing units, and percent of
families above poverty line. This model does not include the NSES score. e Additionally adjusted for the NSES score and all individual SES indicators.
f Additionally adjusted for all individual and neighborhood SES indicators except for NSES score.

Table S6. Estimated hazard ratios for time to first cardiovascular event associated with 5 μg/m3 higher
exposure to PM2.5 according to levels of SES and p-values for interactions, from multiple imputation
analysis.
HRa (95% CI) Overall P-valueb
Individual SES
Education 0.063
Not high school graduate 1.43 (1.07, 1.91)
High school graduate 1.01 (0.88, 1.16)
Some college or associate degree 1.16 (1.04, 1.30)
Bachelor's degree or higher 1.18 (0.99, 1.40)
Family Income 0.047
<$20,000 1.26 (1.09, 1.45)
$20,000-$34,999 1.02 (0.90, 1.16)
$35,000-$49,999 1.29 (1.06, 1.58)
$50,000-$74,999 1.01 (0.85, 1.20)
$75,000+ 1.10 (0.92, 1.32)
Occupation at baseline 0.853
Managerial/professional 1.18 (1.03, 1.36)
Technical/sales/administrative 1.11 (0.96, 1.30)
Service/labor 1.09 (0.92, 1.29)
Homemaker only 1.11 (0.84, 1.46)
Neighborhood SES
NSES scorec 0.002
<72.7 1.42 (1.26, 1.60)
72.7-77.8 1.08 (0.95, 1.21)
77.9-81.9 1.02 (0.86, 1.23)
≥82.0 1.00 (0.81, 1.22)
Percent adults 25+ with HS degree 0.188
<82.3% 1.00 (1.01, 1.35)
82.3-89.4% 1.00 (1.08, 1.44)
89.5-94.3%+ 1.00 (0.91, 1.38)
>94.3% 1.00 (0.86, 1.17)
Median family income 0.068
<$47,891 1.29 (1.15, 1.45)
$47,891-62,526 1.17 (1.05, 1.30)
$62,527-81,973 1.07 (0.89, 1.28)
>$81,973 0.97 (0.82, 1.14)
Percent civilians over 16 with
professional/managerial/executive
occupations 0.409
<29.7% 1.26 (1.09, 1.45)
29.7-41.3% 1.18 (1.06, 1.32)
41.4-54.1% 0.97 (0.76, 1.23)
>54.1% 1.12 (0.93, 1.35)

Median home value <0.0001
<$103,500 1.43 (1.26, 1.63)
$103,500-153,599 1.22 (1.04, 1.43)
$153,600-233,999 1.00 (0.89, 1.13)
>$233,999 0.91 (0.77, 1.07)
Percent families above poverty line 0.0001
<89.2% 1.36 (1.22, 1.52)
89.2-94.0% 1.08 (0.92, 1.26)
94.1-96.5% 1.03 (0.88, 1.21)
>96.5% 1.06 (0.88, 1.28)
PM2.5, fine particulate matter; SES, socioeconomic status; HR, hazard ratio; CI, confidence interval; NSES,
neighborhood socioeconomic status; HS, high school. a All HRs (except those for the NSES score) are adjusted for age, race/ethnicity, smoking, body mass index,
diabetes, hypertension, hypercholesterolemia, and all individual and neighborhood socioeconomic status
indicators except for the NSES score. b P-value for joint test of all multiplicative interaction terms. c The NSES score model adjusted for individual level SES indicators but no other NSES indicators.

Figure S1. Scatter plot of first predicted annual average PM2.5 by neighborhood socioeconomic status (NSES)
score with a locally weighted scatterplot smoothing (LOWESS) curve. For most participants, the first available
PM2.5 prediction was the baseline prediction; otherwise, the next available non-missing PM2.5 prediction was used.
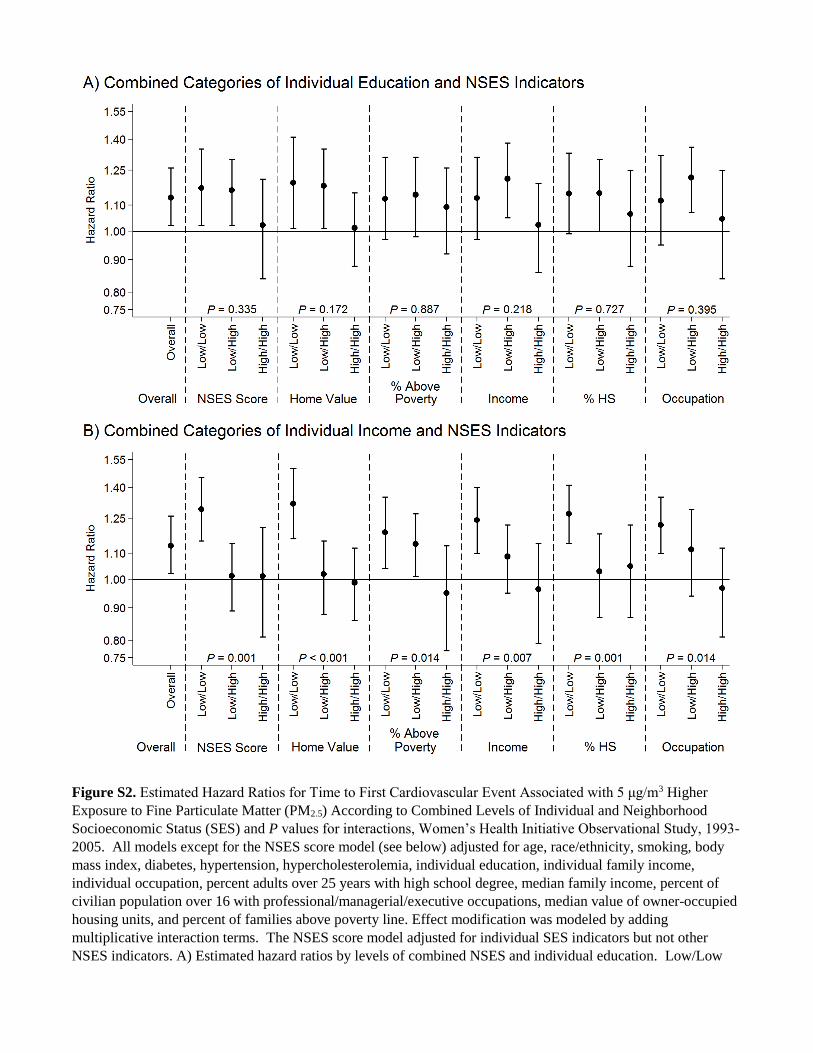
Figure S2. Estimated Hazard Ratios for Time to First Cardiovascular Event Associated with 5 μg/m3 Higher
Exposure to Fine Particulate Matter (PM2.5) According to Combined Levels of Individual and Neighborhood
Socioeconomic Status (SES) and P values for interactions, Women’s Health Initiative Observational Study, 1993-
2005. All models except for the NSES score model (see below) adjusted for age, race/ethnicity, smoking, body
mass index, diabetes, hypertension, hypercholesterolemia, individual education, individual family income,
individual occupation, percent adults over 25 years with high school degree, median family income, percent of
civilian population over 16 with professional/managerial/executive occupations, median value of owner-occupied
housing units, and percent of families above poverty line. Effect modification was modeled by adding
multiplicative interaction terms. The NSES score model adjusted for individual SES indicators but not other
NSES indicators. A) Estimated hazard ratios by levels of combined NSES and individual education. Low/Low
participants have low individual education and low neighborhood SES (NSES). Low/High participants have low
education and high NSES or high education and low NSES. High/High participants have high education and high
NSES. B) Estimated hazard ratios by levels of combined NSES and individual income. Low/Low participants
have low individual income and low NSES. Low/High participants have low income and high NSES or high
income and low NSES. High/High participants have high income and high NSES.