cea prespective on energy efficiency in coal fired...
TRANSCRIPT

CEA PRESPECTIVE
ON
Energy Efficiency
in
Coal Fired Power Stations
CHANDRA SHEKHAR DIRECTOR,CEA

ALL INDIA PLANT LOAD FACTOR OF COAL BASED POWER PLANTS (%)
11-12 FO 11.46 pm 5.93 Av. 82.61
12-13 FO 13.59 pm 5.71 AV. 80.69
13-14 FO 17.65 pm 5.01 Av. 77.34

GROWTH OF GENERATION GWH 1947 to 2014
4073
5106
9662
1693
7
3299
0
4743
4
6668
9
1025
23
1046
27
1568
59
2454
38
2870
29
3958
89
5174
39
6244
95
7890
13
8768
85
9120
00
9671
50
0
500000
1000000
1500000
2000000
2500000 generation Gwh
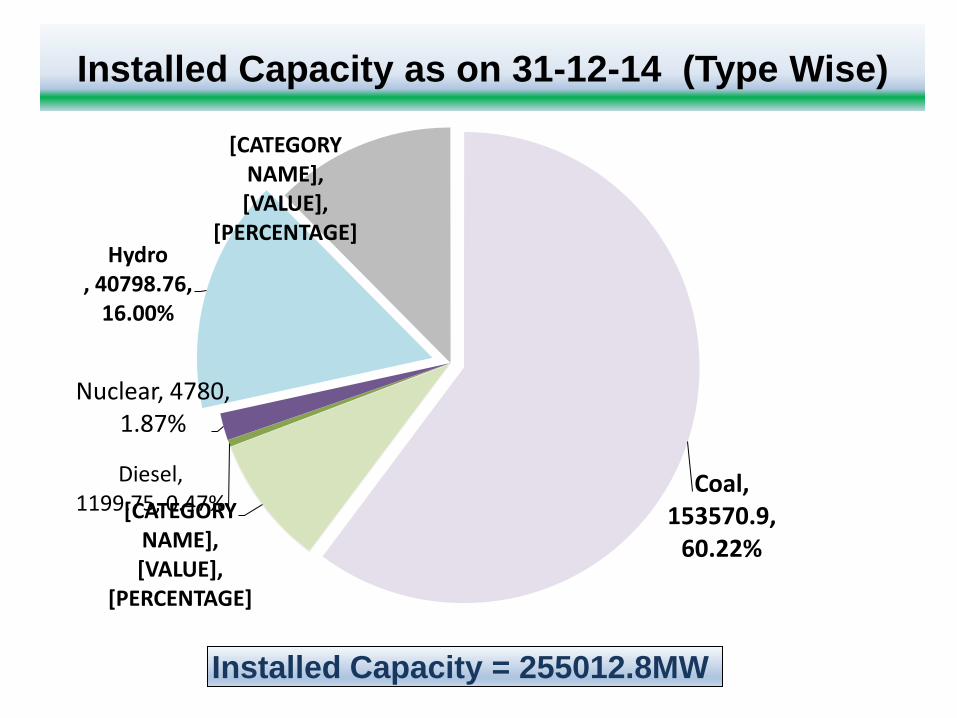
Installed Capacity = 255012.8MW
Installed Capacity as on 31-12-14 (Type Wise)
Coal, 153570.9,
60.22% [CATEGORY
NAME], [VALUE],
[PERCENTAGE]
Diesel, 1199.75, 0.47%
Nuclear, 4780, 1.87%
Hydro , 40798.76,
16.00%
[CATEGORY NAME], [VALUE],
[PERCENTAGE]

Installed Capacity = 243028.95MW
Installed Capacity as on 31.03.2014 (Type Wise)
Hydro 18%
Coal, 130370
.89, 58%
Gas 9%
Diesel 1%
Nuclear
2%
R.E.S 12%

GENERATION
• Gen. 13-14 -967BU (14-15) upto 31st Dec.793.7BU 722 last year
• Comprises Coal/lignite based 746.1 BU (77.14% of total
Gen.) on 60% Capacity • Gas = 44.52 BU(4.6% of total Gen.) on 9% Capacity, • Hydro= 134.84 BU (13.9% of total Gen.) on 17% Capacity
• In 2014-15 upto December,2014 COAL/Lignite 75.28% on 60.22% capacity Gas 4% on 9% Capacity Hydro 13.44% on 15.99 % Capacity

Power position in the country (2013-14)
COAL , 746.1, 77% 60% CAP.
GAS , 44.52,
5% 9%
DIESEL, 1.85, 0%
HYDRO, 134.85, 14%
17%
NUCLEAR, 34.23, 3%
BHUTAN IMP., 5.6,
1%

(in MW)
Capacity addition target during 11th Plan 78,700
Capacity Commissioned during 11th Plan
54,964 MW 43384 MW coal 5156MW gas 5544MW hydro
CAPACITY ADDITION DURING 11TH PLAN (2007-2012)

(in MW)
Capacity addition target during 12th Plan 88,537
Capacity already Commissioned during 12th Plan (as on 31 Dec., 2014)
Total- 49058.2 42845 COAL 4318.2 GAS 1895.02 Hydro State 10011.1 Pvt. 29776.5 Central 9270.62
CAPACITY ADDITION DURING 12TH PLAN (2012-2017)

Size Steam Parameter Design Efficiency
Year
MW ata/C/C (%) 30-50 60/ 482 ~31 1950 60-100 90/ 535 32-33 1960 110 to150 130/ 535/535 35-36 1970 200/210 130,150/535/535 36.3,37.8 1977 250 150/535/535 38.3 1995 500 170/ 538/538 38.5 1984 500 170/535/565 38.7 2010 660 247/535/565 ~39.5 2010 660/800 247/565/593 40.5 2012
Efficiency on HHV basis
Major Unit Sizes and Steam parameters
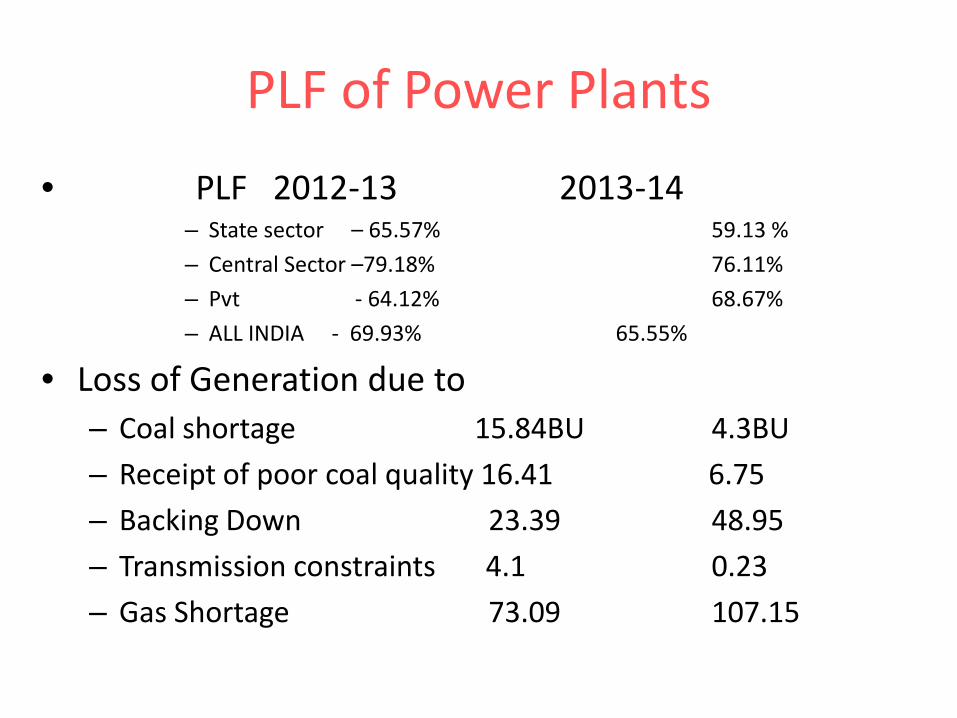
PLF of Power Plants • PLF 2012-13 2013-14
– State sector – 65.57% 59.13 % – Central Sector –79.18% 76.11% – Pvt - 64.12% 68.67% – ALL INDIA - 69.93% 65.55%
• Loss of Generation due to – Coal shortage 15.84BU 4.3BU – Receipt of poor coal quality 16.41 6.75 – Backing Down 23.39 48.95 – Transmission constraints 4.1 0.23 – Gas Shortage 73.09 107.15

ALL INDIA Thermal PS last Five Years Efficiency Trend Capacity Analysed 82973.47 MW (13-14) 73 Stations
Design Efficiency 36.75%
32.54
33.49
33.7533.84
33.91
31.50
32.00
32.50
33.00
33.50
34.00
34.50
2009-10 2010-11 2011-12 2012-13 2013-14
EFFI
CIEN
CY
YEAR
Efficiency
Efficiency

BOILER LOSSES to be taken care off seriously of COAL FIRED STATIONS

The major factors to be looked into in TURBINE SIDE LOSSES
• Main steam and reheat steam inlet parameters (For every 1°drop in Main Steam/ R H temperature than the designed value of 537 °C, causes a heat loss of approx 0.67 KCal/KWh 1 KG/CM2 drop in Main Steam Pressure at Turbine Inlet than the design value i.e 150 KG/CM2 causes a heat loss of approx. 1.31 KCal/KWh)
• Turbine exhaust steam parameters • Reheater and super heater spray • Passing of high energy draining • Loading on the turbine • Boiler loading and boiler performance • Operations and maintenance constraints • Condenser performance and cooling water parameters • Silica deposition and its impact on the turbine efficiency • Inter stage sealing, balance drum and gland sealing • Sealing fins clearances • Nozzle blocks • Turbine blade erosion • Functioning of the valves • Operational status of HP heaters

The major TURBINE CYCLE LOSSES •

Major Possibilities for Condenser and Water pumping and Cooling tower
•

Heat rate GAURENTEED BY EQUIPMENT MANUFACTURER

PLF% Groupwise 2013-14 Sl. Capacity
Group(MW) No. of Units
Cap. in MW
PLF% in 13-14/12-13/11-12
1 660-800 21 14600 67.92/57.52/44.31
1 450-600 87 45130 67.66/71.97/78.38
2 300-350 26 8020 62.82/70.45/72.26
3 250 51 12830 71.96/77.91/81.75
4 210 143 30030 68.76/76.91/78.67
5 195-200 25 4990 73.23/76.62/74.98
6 100-150 101 12145 46.36/50.23/49.11
7 25-99 85 4880 47.85/54.39/55.46
8 Total 539 132625 65.56/69.93/73.32 * No of units reviewed (Total commissioned – 539/490 Cap.132624 Stations 143

VARIOUS FACTOR EFFECTING HEAT RATE Measurement System
•COAL CONSUMTION •GCV CALCULATION •GROSS & AUX Power •OIL Consumption
COOLING TOWER
•CT Efficiency •CW Flow
Partial Load
•Tie up LOSS •Evacuation LOSS •Load Throw off/LOSS
BOILER EFFICIENCY
•APH Seal Leakage •Mill Fineness •Soot Blowing Loss •Boiler Blow Down •H2 in Coal Loss •Moisture in Coal Loss •Moisture in Air Loss •Water Chemistry •O2 Control •Flue Gas Exit Temp. •Dry Flue Gas Loss •SWAS steam Draining •Air Ingress •Insulation Missing •Attemperation Loss •Unburnt Loss
TURBINE Heat Rate
•Low Rated MS/RH Temp & Pressure •Gland and Drain Valve Leakages •HL in Drip System Failure •Heat Loss in Drip Pump Failure/NA •Air Ingress •High Dissolved O2, D/A Vent •HP/IP/LP Cylinder Efficiency •Missing Insulation •TDBFP Efficiency •HP/LP Heater Performance Condenser •Low Vacuum, •Tube Cleaning •Sub cooling
COAL
•H2 in Coal •Moisture •Coal Burning in Yard •Sulphur in Coal •Coal Blending

Efforts towards improvement in
Efficiency of Thermal Power
Generation

Adoption of Supercritical Technology • Efficiency gain of about 2 % is possible over sub critical
units • First Supercritical unit of 660 MW Commissioned in Dec-
2010, 800 MW in July,12 • 33 Units with total capacity 22700 MW operating • Supercritical to constitute ~40%(~25000MW) coal fired
capacity addition in 12th Plan (2012-17) • 100% coal fired capacity addition in 13th Plan and
beyond to be supercritical

EFFICIENCY IMPROVEMENT THROUGH RENOVATION AND MODERNISATION Programme
• To restore rated capacity and design parameters such as
Heat Rate, APC, SOC etc..
• To make the operating units well equipped with modified/ augmented latest technology.
• To overcome technological obsolescence and non-availability of spares.
• To improve the performance parameters in terms of PLF, Efficiency, Forced Outages, Availability and Reliability.
• To reduce maintenance requirements and enhance the ease in maintenance.
• Compliance of stringent environmental norms, safety and other statutory requirements.

• Renovation & Modernization of old thermal power stations is an economical option to supplement capacity addition programme for increased power availability and Efficiency
• Extension of useful economic life of generating units by another 15 - 20 years.
• To focus on full load operation of the unit beyond their original design life.
• Uprating of Generating Unit.
• Improvement beyond design parameters.

24
Drivers for E E R&M
• Availability of Coal, Land & Water is becoming more difficult for new power projects.
• Coal is an exhaustible natural resource. Hence, its saving through efficiency enhancement is desirable. R&M results in lower Specific Coal Consumption.
• R&M is one of the most cost effective measure for getting additional generation.
• Additional generation from old units becomes available in very short duration.
( Contd--)

• The benefits expected from Comprehensive R&M in a
typical 200/210 MW unit include : - - Increased output by about 4 - 8% - Improved Unit Heat Rate by 10 - 15% - Extended Plant Life by about 15 - 20 years.
• There is a shift from ‘Generation Maximisation’ to ‘Generation Optimisation’ with efficiency enhancement. Efficiency enhancement of about 8-10% is feasible in the existing LMZ units.
• Increased emphasis on Environment for clean technology. The environmental norms are getting more and more stringent.

26
11th Plan R&M Programme & Achievements (2007-12 )
Programme (MW)
Achievement (MW)
Life Extension Programme (LEP)
7318 (53 units)
1291 (13 Units)
R&M Programme 18965 (76 units)
14855 (59 units)
Total
26383 (129 units)
16146 (72 units)

27
12th Plan R&M Programme (20012-17 )
Programme (MW)
Achievement (MW)
( 30-09-2014 )
Life Extension Programme (LEP)
12066 (70 units)
1347.19 ( 12 Units )
R&M Programme 17301 (65 units)
1060.5 ( 09 units )
Total
29367 (135 units)
2407.69 ( 21 units )

•Retirement in a systematic manner an ongoing activity with focus on closing down
•Small and Old units
•Units of non-reheat type
•Units having very low design efficiencies
•Units having very low actual efficiency
RETIREMENT OF POWER PLANTS

Present Methodology for Retirement of units
Units deviating more from design to retire first Retirement is linked to commissioning of new
units In case of Gas based , Technology changing
rapidly. Faster retirement could be considered to keep abreast with technology development

RETIREMENTS OF OLD UNITS • Details of Retirements :
11th Plan - 2398 MW has already been retired
comprising mainly of small size ( <100 MW) ,old and non reheat units 12th Plan12-17( Planned)- 4075 MW (< 100 MW coal units,
> 35 years old Gas stations) till date 771 MW 13th Plan (Planned) – about 4000MW

Efforts under IGEN Programme
Mapping of 85 Thermal units done and all the recommended measure have been implemented
Guided for adoption of Better O&M Practices
55 Ebsilon Professional Professional Software Licenses provided to 15 Utilities
GSECL, HPGCL, PSPCL, MAHAGENCO, CSPGCL, MPPGCL, RRVUNL, NLC, TANGEDCO, OPGCL, TVNL, DVC, APGENCO, UPRVUNL, and GIPCL

TRAINING on USE OF EBSILON ….under IGEN
TRAINING TO 100 ENGINEERS HAS BEEN IMPARTED ON EBSILON PROFESSIONAL SOFTWARE
(This training has been imparted by GERMAN and Indian EBSILON EXPERTS)

IGEN contd….. Introduction of Online BPOS and Other Activities
for OLDER TPS for 200MW and Above
The Boiler Performance Optimization System (BPOS) is an online computer system which monitors and optimizes boiler operation. Module for soot blowing management. In the closed loop mode of operation at Suratgarh TPS
INTRODUCTION to energy efficiency through Efficiency measure and Better Operation and Maintenance Practices

85 Units MAPPING STUDIES Capacity range of
units
No. of
units
Average Design
Gross Heat Rate
(kcal/kWh)
Average Operating
Gross Heat Rate (kcal/kWh)
Average Deviation
(%)
Range of operating
GHR (kcal/kWh)
100-110 MW 8 2434.9 3016.8 19.0 2696 - 3601 120-125 MW 9 2395.4 2921.9 18.5 2690 - 3730 140 MW
4 2360.2 2824.1 19.7 2750 - 2905 195-200 MW 5 2399.6 2989.1 24.4 2393 - 3962 210 MW
49 2361.6 2714.4 14.9 2384 - 3064 250 MW
5 2339.1 2687.2 14.9 2546 - 2773 500 MW
5 2254.6 2566.2 13.8 2508 - 2647

MAJOR REASONS FOR THE HIGH OPERATING GROSS HEAT RATE
1. Low combustion efficiency due to improper air-fuel ratio. 2. Poor performance of milling system to meet new demand. 3. Low turbine cylinder efficiency 4. High dry gas losses due to poor heat transfer 5. Poor sealing and heat transfer in air pre-heaters 6. Low condenser vacuum. 7. High air ingress in the boiler and high heat loss due to poor
insulation 8. Improper mill maintenance due to poor spare availability 9. Poor quality of coal 10.High auxiliary power consumption

Section wise Unit Heat rate losses in a particular unit

Saving Potential of Coal Based State Power Plants emerged out through current case studies on 70% plf
0
1
2
3
4
5
6
1 2
0.46
5.07
Case Studies All State Utilities
Milli
on to
nnes
of O
il eq
uiva
lent
(M
Toe)

Comparison of average Unit Heat Rate of different unit sizes
2353.21
2532.30
2311.60
2195.00 2268.60
2633.38 2557.80 2542.80
2343.00
2497.30
1900.00 2000.00 2100.00 2200.00 2300.00 2400.00 2500.00 2600.00 2700.00
120MW 125MW 210MW 250MW 500MW Load
Average Design Average Operating

Variations in Boiler Efficiency
86.03
78.61
86.61 88.93
87.40
81.37
78.12
83.91
88.13
85.70
72.00 74.00 76.00 78.00 80.00 82.00 84.00 86.00 88.00 90.00
120MW 125MW 210MW 250MW 500MW
Boi
ler E
ffici
ency
(%)
LOAD
Design Average Operating Average
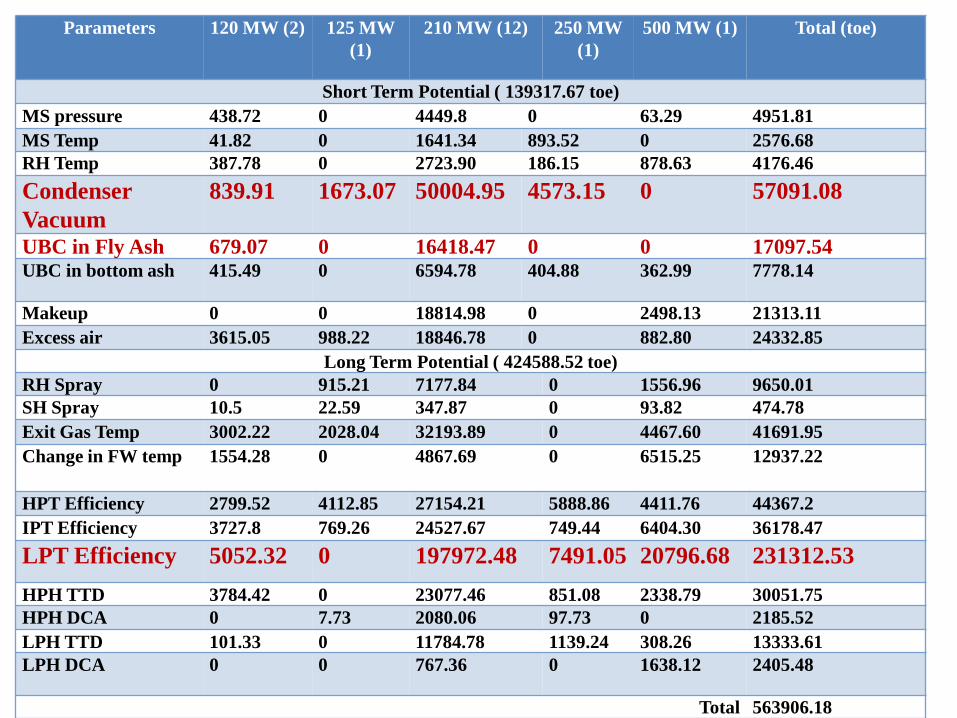
Parameters 120 MW (2) 125 MW (1)
210 MW (12) 250 MW (1)
500 MW (1) Total (toe)
Short Term Potential ( 139317.67 toe) MS pressure 438.72 0 4449.8 0 63.29 4951.81 MS Temp 41.82 0 1641.34 893.52 0 2576.68 RH Temp 387.78 0 2723.90 186.15 878.63 4176.46 Condenser Vacuum
839.91 1673.07 50004.95 4573.15 0 57091.08
UBC in Fly Ash 679.07 0 16418.47 0 0 17097.54 UBC in bottom ash 415.49 0 6594.78 404.88 362.99 7778.14
Makeup 0 0 18814.98 0 2498.13 21313.11 Excess air 3615.05 988.22 18846.78 0 882.80 24332.85
Long Term Potential ( 424588.52 toe) RH Spray 0 915.21 7177.84 0 1556.96 9650.01 SH Spray 10.5 22.59 347.87 0 93.82 474.78 Exit Gas Temp 3002.22 2028.04 32193.89 0 4467.60 41691.95 Change in FW temp 1554.28 0 4867.69 0 6515.25 12937.22
HPT Efficiency 2799.52 4112.85 27154.21 5888.86 4411.76 44367.2 IPT Efficiency 3727.8 769.26 24527.67 749.44 6404.30 36178.47 LPT Efficiency 5052.32 0 197972.48 7491.05 20796.68 231312.53 HPH TTD 3784.42 0 23077.46 851.08 2338.79 30051.75 HPH DCA 0 7.73 2080.06 97.73 0 2185.52 LPH TTD 101.33 0 11784.78 1139.24 308.26 13333.61 LPH DCA 0 0 767.36 0 1638.12 2405.48
Total 563906.18

PAT Scheme • Perform, Achieve and Trade scheme- aim is to
improve Efficiency of the thermal plants both coal & gas based.
• Total Target Set for thermal power stations= 3.2 MTOE out of total 6.686 MTOE
• Threshold limit to be DC = 30,000 tons of oil equivalent (TOE) per annum ( all power plants above 11-12 MW will be covered in PAT scheme)
• MOP notified net heat rate reduction targets to 144 Thermal power Stations.
• Stations to achieve the targets within 3 years from date of notification i.e by 31.3.2015
• Penalty for non achievement

Thermal Power Plant Groups under PAT Scheme
Thermal Power Plants [144 Nos]
Gas [40] Diesel [7]
Coal/Lignite [97]

Target Setting for Reduction of NHR Deviation in Net Station Heat Rate from Design Net Heat Rate
Reduction Target for Deviation in Net Station Heat Rate (%)
Up to 5 %
10 %
More than 5% and Up to 10 %
17 %
More than 10% and Up to 20%
21 %
More Than 20 % 24 %
TARGET SET ARE UNDER NORMALISATION

Actual Heat Rate Deviations S.No. Particulars 2013-14 1.
No. of Stations in the range of SHR deviation(below 5%)
27%
2. No. of Stations in the range of SHR deviation(5-Below 10%)
32%
3. No. of Stations in the range of SHR deviation(10-20%)
26%
4. No. of Stations with SHR deviation of more than 20%
15%
(ALL INDIA HEAT RATE DEVIATION wrt Design 10.04% (Huge potential)


THANKS
CEA website: www.cea.nic.in