ceat investor presentation nov'14
TRANSCRIPT

Investor Presentation
November 2014

Disclaimer
2
The information in this presentation has been prepared by CEAT Limited (the “Company”) and has not been independently verified. No representation or
warranty expressed or implied is made as to, and no reliance should be placed on, the fairness, accuracy, completeness or correctness of such information or
opinions contained herein. The information presented or contained in these slides is current as of the date hereof and is subject to change without notice, and its
accuracy is not guaranteed. Neither the Company, nor any of its advisers or representatives, nor any of their respective affiliates makes any undertaking to
update any such information subsequent to the date hereof. This presentation should not be construed as legal, tax, investment or other advice. No
consideration has been given to the particular objectives, financial situation or particular needs of any recipient. Neither the Company nor any of its advisors or
representatives, nor any of their respective affiliates shall have any liability whatsoever (in negligence or otherwise) for any loss arising from the use of this
presentation or its contents or otherwise arising in connection with this presentation. By assessing this presentation, you are agreeing to be bound by the trailing
restrictions.
This presentation is intended for financial institutions and professional investors only and is not intended for distribution or reproduction to, or use by, retail
investors. This presentation is also not intended for distribution or reproduction to, or use by, any person or entity in any jurisdiction or country where such
distribution or use would be contrary to law or regulation.
The information in this presentation is given in confidence, and reproduction of this presentation, in whole or in part, or disclosure of any of its contents, without
prior consent of the Company, is prohibited. This presentation should be distributed and read in its entirety. This presentation remains the property of the
Company and on request must be returned and any copies destroyed.
This presentation is for information and convenient reference and does not constitute or form part of, and should not be construed as, any offer for sale or
subscription of, or solicitation of any offer to buy or subscribe for, any securities of the Company nor should it, or any part of it, form the basis of, or be relied on
in connection with, any contract or commitment whatsoever. This presentation does not constitute an offer of securities for sale in any jurisdiction, including
the United States, and any securities described in this announcement may not be offered or sold in the United States absent registration under the US Securities
Act of 1933, as amended or an exemption from such registration.
Please refer to the financial statements of the Company that have been filed with the stock exchanges and is available on the Company’s website. This
presentation is not intended to be fully inclusive and may not contain all of the information that you may consider material. This presentation contains historical
information of the Company that should not be regarded as an indication of future performance or results.
Certain statements in these slides may be considered forward-looking. These statements are based on management’s current expectations and are subject to
uncertainty and changes in circumstances. Actual results may differ materially from those included in these statements due to a variety of factors.
By accepting any copy of this presentation, you agree to be bound by the foregoing limitations.

Table of Contents
3
Indian Tyre Industry: Outlook 1
CEAT: An Overview2

Indian Tyre Industry: Robust Fundamentals
4
Domestic Tyre Industry: An Overview
235
293
355 367 382
FY'10 FY'11 FY'12 FY'13 FY'14
OEM
32%
Replacement
68%
MHCV
49%
LCV
7%
Cars &
UVs
18%
Tractors
11%
2/3
Wheelers
12%
Others
3%
Break up by End Use1 Break up by Customer1
Competitive LandscapeMarket Share2
MRF Ltd.
27%
Apollo Tyres
Ltd.
19%
JK Tyre & Inds.
Ltd.
13%
CEAT
12%
Others
29%
• The domestic tyre industry has grown at a CAGR of
12.9% driven by robust growth in the Indian
automobile industry
• Commercial vehicles (M&HCV and LCV) account
for > 50% of the domestic market
• Top 4 players account for ~ 70% market share
Turnover (Rs Bn)
Source CRISIL
1. Based on total tonnage of 15,92,000 in FY’14
2. Market share of FY’14 as per CRISIL based on turnover

OEM Production across Key Segments
OEM Demand is likely to rebound on Economic Revival
5
OEM
560
523
504
FY'12 FY'13 FY'14
9-11%
FY'15P
(000’ Tonnes) Growth
Replacement
978
1,0551,088
FY'12 FY'13 FY'14
5-7%
FY'15P
(000’ Tonnes) Growth
385281
222
FY'12 FY'13 FY'14
(‘000s)
M&
HC
V 6%
H1 FY'15 (YOY)¹
Growth rates
Improved Economic Growth and Consumer Sentiment will drive sales across categories (M&HCV, PC + UV
and 2/3 Wheeler)
PC
+ U
V 3,146
3,231
3,066
FY'12 FY'13 FY'14
(‘000s) Growth rates
3%
H1 FY'15 (YOY)¹
2/3
Wh
ee
ler
15,42815,744
16,879
FY'12 FY'13 FY'14
(‘000s) Growth rates
18%
H1 FY'15 (YOY)¹
Source CRISIL
1. Growth in H1 FY’15 is over H1 FY’14

Radialisation Trend
6
Radialisation in M&HCV and LCV Segment to gain momentum on back of improved road infrastructure , launch of multi-
axle vehicles and stricter regulation
Source: ATMA
M&HCV & Passenger Cars(%)
3%4%
6%
10%
12%
18%
22%
25%
95% 95%
97% 97%
98% 98% 98% 98%
80%
84%
88%
92%
96%
100%
0%
5%
10%
15%
20%
25%
30%
35%
FY'07 FY'08 FY'09 FY'10 FY'11 FY'12 FY'13 FY'14
M&HVC (LHS) Passenger Cars (RHS)

Raw Material Price Trend
7
3.0
1.7
184.6
123.3
100
120
140
160
180
200
1.5
2.0
2.5
3.0
3.5
Sep-12 Dec-12 Mar-13 Jun-13 Sep-13 Dec-13 Mar-14 Jun-14 Sep-14
International ($ per Kg) (LHS) Domestic (Rs per Kg) (RHS)
Rubber Prices have fallen due to weak global demand amidst an increase in supply
102.1
82.680.0
85.0
90.0
95.0
100.0
105.0
110.0
115.0
1-Sep-12 23-Dec-12 15-Apr-13 6-Aug-13 27-Nov-13 20-Mar-14 11-Jul-14 4-Nov-14
Natural Rubber
Brent Crude Oil (US$/bbl)
Source CRISIL
Source Bloomberg

Table of Contents
8
Indian Tyre Industry: Outlook 1
CEAT: An Overview2
RPG Group : Overview
9
TYRE INFRASTRUCTURE
IT SPECIALITY
PHARMA
PLANTATIONS
POWER / TELECOM
ANCILLARY
����RPG Group is a leading Business Group
in India
����Diversified business operations with Diversified business operations with
presence in key sectors of the
economy
���� Over 20,000 employees

CEAT : Overview
10
CEAT Distribution Reach
India
Sri Lanka
88 countries where
CEAT Products were sold
in FY’14
• Leading Tyre Company in India with
over 50 yrs of presence
• 4th Largest Company in India with
Market Share of ~ 12%1
• Manufacturing Facilities in Bhandup,
Nashik and Halol
• Pan India Distribution Network
comprising of 3,500+ Dealers and 300+
CEAT Franchisees (CEAT Shoppe + CEAT
Hubs)
• Presence through 50% interest in a JV
with Kelani Tyres Ltd
• Strong presence in the Sri Lankan tyre
market
• Sri Lanka JV companies operates from
two manufacturing facilities in Sri Lanka
Note
1. Market share of FY’14 as per CRISIL based on turnover

3 Pronged Growth Strategy…
11
Effective Implementation of Business Strategy resulting in Improved Profitability
• Strong Brand Recall
• Barriers to Entry
• Proven Model in Sri Lanka
• Replicate in Bangladesh
• Competitive Advantage
• CEAT Global Brand
Passenger
segment1
Emerging
markets
Exports
Focus on
Profitable
Growth
Brand
Building
Channel
Expansion
R&D
Capability
Note
1. Consists of Two Wheeler, Passenger Cars and Utility Vehicles sub segments

…resulting in Favourable change in Business Mix
12
Gross Sales1 by Customer
Gradual shift towards profitable segments and radial tyres
Gross Sales1 by End Use Gross Sales1 by Tyre Type
Replacement
64%
OEM 16%
Exports 20%
FY’12
Replacement
61%
OEM 21%
Exports 18%
FY’14
Bias 87%
Radial 13%
FY’12
FY’14
Bias 81%
Radial 19%
Truck & Bus
53%
2/3 Wheeler
12%
LCV 10%
Cars & Uvs 6%
Farm &
Speciality 15%Last Mile 4%
FY’12
FY’14
Truck & Bus
46%
Two Wheeler²
17%
LCV 8%
Cars & Uvs 9%
Farm &
Speciality 14% Last Mile 5%
Note
1. Gross Sales represents Standalone Gross Sale of Products (Including excise Duty before discount)

Passenger Segment1: Overview and Strategy
13
• Achieved higher than industry growth in both the 2 Wheeler as well as PC + UV categories
• Partner of choice for many 2 Wheeler OEMs
• Increased share of business with leading passenger car OEMs mainly due to ability to produce low rolling resistant passenger car radial tyres
• Aim to further strengthen position by building brand loyalty through
• Product innovations and differentiated customer services
• Innovative marketing campaigns
• Optimum mix of in-house vs outsourced production
Gross Sales2 (Rs mn) Market Share3
6,088
10,652
FY'12 FY'14
2 Wheelers Passenger Car & Utility Vehicle
(PC + UV)
3,224
5,557
FY'12 FY'14
Notes1. Consists of Two Wheeler, Passenger Cars and Utility Vehicles sub segments2. Gross Sales represents Standalone Gross Sale of Products (Including excise Duty before discount)3. Market share data in FY’12 and H1 FY’14 is based on production (No of tyres) of CEAT and industry production as per ATMA for respective period
2 Wheelers Passenger Car & Utility Vehicle
(PC + UV)
5%
8%
FY'12 H1 FY'14
8%
14%
FY'12 H1 FY'14

Emerging Markets: Overview and Strategy
14
• Presence through CEAT Kelani Ltd : a 50% JV with Kelani Tyres Ltd
• CEAT Kelani Ltd has a strong presence in the truck, light truck, three-wheeler, two-wheeler and other radial tyre segments in Sri Lanka
• Sri Lanka JV companies operate from two manufacturing facilities in Sri Lanka with total capacity2 of 61 tonnes per day
• Manufacturing within Sri Lanka enables avoidance of import duty on tyres thereby enabling CEAT Kelani Ltd to competitively price
products
• Plans to replicate the Sri Lankan success in Bangladesh (through a 70:30 JV with AK Khan & Company Ltd) with the aim to cater to local
and eastern part of Indian market
• Setting up a manufacturing plant with an initial capacity of 65 tonnes per day that is likely to be operational by end CY’15
• Commencement of seed marketing campaign to prepare for product launch
• Imports from Bangladesh to India enjoy zero basic customs duty
Sri
La
nk
aB
an
gla
de
sh
Revenue
(SL Rs mn)
EBITDA1 (SL Rs mn) &
EBITDA Margin (%)
PAT
(SL Rs mn)
EBITDA
Margin 12.2% 20.1%
Net Worth
(SL Rs mn)
4,357
4,889
FY'12 FY'14
532
983
FY'12 FY'14
316
687
FY'12 FY'14
1,071
1,924
FY'12 FY'14
Notes
1. EBITDA = Profit before taxation + Depreciation and Amortization Exps + Finance Costs
2. Capacity refers to achievable capacity

Investment in Brand Building
Key Catalysts of Growth
15
“Monsoon Smart”“Monsoon Smart”
“Be Idiot Safe”“Be Idiot Safe” SUV Tyre CampaignSUV Tyre Campaign
Other InitiativesOther Initiatives
Effie Award Winning Campaigns Branded Campaign Others
Key Catalysts of Growth (Cont’d)
16
����
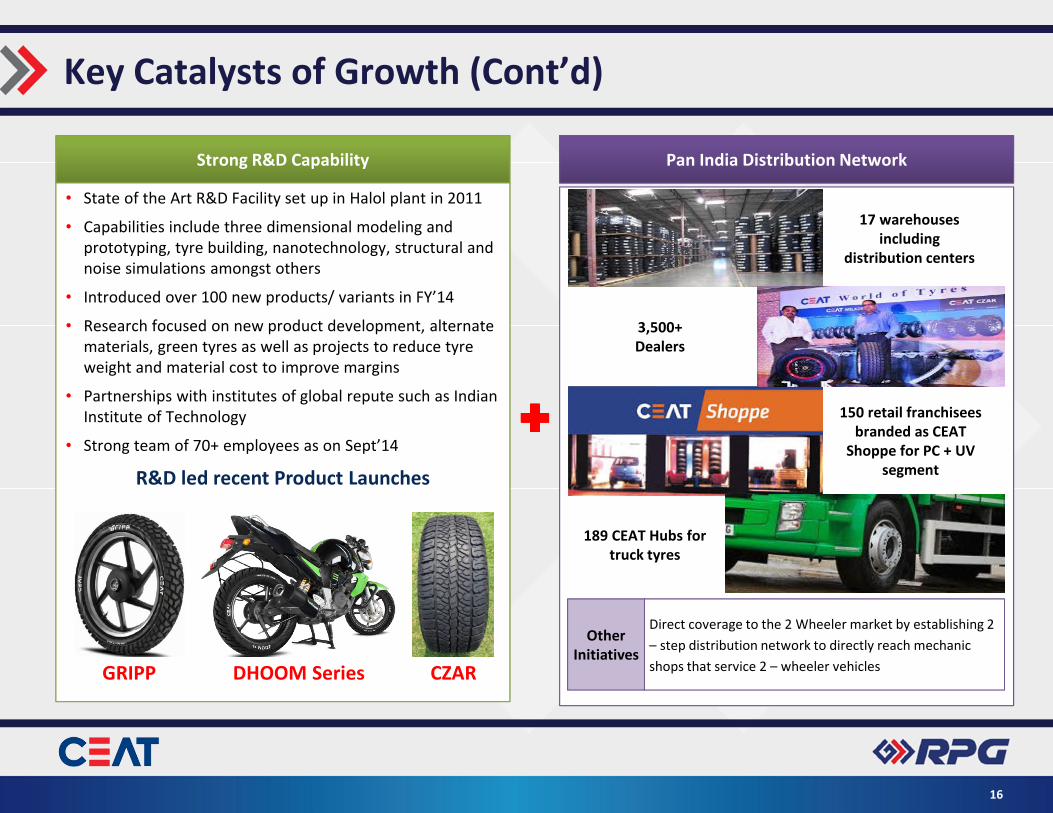
Strong R&D Capability
• State of the Art R&D Facility set up in Halol plant in 2011
• Capabilities include three dimensional modeling and
prototyping, tyre building, nanotechnology, structural and
noise simulations amongst others
• Introduced over 100 new products/ variants in FY’14
• Research focused on new product development, alternate
materials, green tyres as well as projects to reduce tyre
weight and material cost to improve margins
• Partnerships with institutes of global repute such as Indian
Institute of Technology
• Strong team of 70+ employees as on Sept’14
GRIPPGRIPP DHOOM SeriesDHOOM Series CZARCZAR
R&D led recent Product Launches
Pan India Distribution Network
17 warehouses
including
distribution centers
150 retail franchisees
branded as CEAT
Shoppe for PC + UV
segment
3,500+
Dealers
Direct coverage to the 2 Wheeler market by establishing 2
– step distribution network to directly reach mechanic
shops that service 2 – wheeler vehicles
Other
Initiatives
189 CEAT Hubs for
truck tyres

Financial Overview¹
17
46,52750,522
55,540
29,003
FY'12 FY'13 FY'14 H1 FY'15
Growth 28.1% 8.6% 9.9%
2,737
4,379
6,579
3,128
FY'12 FY'13 FY'14 H1 FY'15
EBITDA
Margin 5.9% 10.9%
PAT and RoE2
(Rs mn)
182
1,202
2,712
1,340
FY'12 FY'13 FY'14 H1 FY'15
RoE 2.7% 15.3% 26.4%
Total Debt³ and Total Debt/ Net Worth(Rs mn)
11,049
8,288
10,202
7,914
FY'12 FY'13 FY'14 H1 FY'15
Total Debt/
Net Worth1.6x 1.0x 0.7x 1.1x
8.7% 11.9%
23.3%
Notes1. Numbers for FY12, FY13 and FY14 are based on the audited consolidated financial statements; numbers for H1FY15 are based
on the auditors’ review report on interim condensed consolidated financial statements2. EBITDA: Earnings before Depreciation & Amortization, Interest and Tax; RoE: Return on Equity on closing networth. For H1 FY’15
PAT has been annualized to compute RoE
3. Total Debt = LT debt + ST Debt excluding Current maturities of Long Term Debt
Net Revenue from Operations and its Growth(Rs mn)
EBITDA² and EBITDA Margin (Rs mn)

18
Y O UT H A N K