ceat: us launch strategy
TRANSCRIPT

Submitted by:
Team Tri-Us IIM Ranchi
Varun Jaiswal || Sayan Kar || Snehal Vasant Madne

Executive Summary
U.S.A Market Competitive
Scenario STP
Marketing Mix
Buying Behavior
Launch Strategy
Target Financials
Situational Analysis Strategic Direction Launch Strategy Financials
Strategic
Objectives
To understand the market
dynamics in terms of USA
economy demand drivers,
raw material costs and
competitive scenario
To proactively search for best
suppliers, understand buying
behavior, target the appropriate
market segment
To formulate detailed
entry strategy for 3 years
and lay down concrete
marketing plan
To understand and support
distribution & marketing
expenditures and create
financial roadmap for 3 years
Analysis • Rise in demand
• Fall in raw materials cost
• Lower labor costs in India
and reduced import
duties in India
• Robust equipment sales in
farming industry
• Small & large OTR segment
constitute maximum sales
• Actively seeking ecological
product
• Tie up with top 15
clients,
• Leverage on the
relationship with
Mahindra
• Differentiate with
dedicated Service
Program
• Projected year wise
market share & revenue
break up to be achieved
• BKT, with closest business
model has good revenue
growth
• CEAT has added
advantage of lower
capital intensity
Insights • Manufacturing Set Up in
India
• Enter value segment
• Focus on Farm, then
construction & mining
• Focus on the credit norm
payment period
• Green Marketing
• Enter Replacement Market
through clients & establish
OEM relationship
• One OEM in each
secto , utilize it s service center
• Exclusive dealer in
each state, 24*7
emergency service
Estimated marketing budget
is $1.6 Million for year 2016.
Year wise OTR revenue break
up is forecasted by projecting
year wise break up of market
share.

Executive Summary
U.S.A Market Competitive
Scenario STP
Marketing Mix
Buying Behavior
Launch Strategy
Target Financials
• Falling Natural Rubber
Prices globally
• Growth in replacement
segment coupled with
product mix
• Structural Shift
technology: cross ply to
radial tires
• Better trade relations,
after cheap Chinese tire
industry increased tariffs
Growth Drivers
• US Market GDP growth is poised to stabilize as per industry standards
• Revenue is expected to increase at an annualized rate of 3.5% per year to $ 3.0 billion USD
• Industry growth around 6.4% with OEM segment, while Replacement targeted to grow at 9% CAGR
• The tire industry is highly sensitive to fluctuations in raw materials prices
• Raw materials constitute 75% of the operational costs, 70% of the sales turnover
• Manufacturing Setup – India, since low cost labor and natural rubber input material availability
• As per forecasts, margins will expand on account of decline in rubber prices. (INR prices by 5-7%)
Takeaway: OEM demand expected to remain under pressure in short term whereas replacement demand
would continue to remain the growth engine in near term for US market.
31%
25% 16%
13%
8%
7%
Raw Material
Natural Rubber Synthetic Rubber
Fillers Chemicals
Steelcord Textile
Source: Michelin
Units
- Steady or up
Raw Material Costs
- Lower
Price Control
= Improved Margins
Net Result
Positive

Takeaway: Firestone and BKT have less number of products in their portfolio and still have
a very high M.S. This shows a focused strategy helps in this industry. Rather than going for
a wide variety of products CEAT should seek to build expertise in few application areas.
18%
34%
18%
14%
6%
5%
0
10
20
30
40
50
60
70
-5% 0% 5% 10% 15% 20% 25% 30% 35% 40%
Ag
ri.
- P
rod
uct
Mix
Market Share by Value
Strategic Groups
BKT
Firestone
Goodyear
Titan
Michelin
Alliance
Executive Summary
U.S.A Market Competitive
Scenario STP
Marketing Mix
Buying Behavior
Launch Strategy
Target Financials
Source: MTD Facts Issue 2015
• Titan has extensive focus on the farm equipment tires offering
• Goodyear focuses on safety & fuel efficiency
• Alliance provides customized solutions, heat & cut resistant thread compounds
• Firestone has a strong distribution presence in the US, via the Bridgestone network
• BKT has a large product mix for the farm equipment sector, and a strong M.S by value
18%
34%
18%
14%
6% 5%
6%
0%
5%
10%
15%
20%
25%
30%
35%
40%
US Market - Farm
US Market - Farm

Executive Summary
U.S.A Market Competitive
Scenario STP
Marketing Mix
Buying Behavior
Launch Strategy
Target Financials
- The $3 billion U.S. OTR tire market
breaks down as follows:
• 69%, or $2.07 billion, for small
OTR (rim diameters of less than 25
inches)
• 15%, or $450 million, for large
OTR (rim diameters of 26 to 49
inches)
• 10%, or $300 million, for giant
OTR (rim diameters of 50 to 63
inches)
• 5%, or $180 million, for repair
materials (products used for the
repair of OTR tires)
Source: IBIS US Market Statistics Source: Tire Industry Association
Consructi
on
43% Mining
24%
Exports
23%
Agricultu
re
6%
Others
4%
OTR tire U.S - Revenue
Consruction Mining Exports
Agriculture Others
• Agriculture production is concentrated on a small number of large, specialized farms in rural areas where 15% of the U.S. population lives
• Tractor Sales in U.S Market is consistently better than the 5 Yr Average (2010-2014) figures
• Equipment sales in other relevant industries is not so robust
Source: Association of Equipment Manufacturers (September, 2015)
Target:
- Value Segment (Many Indian Players in Low End Segment)
- Product: Small & Large OTR Segment [84% of the OTR market]
- Industry Focus: Construction, Mining & Agriculture
Positioning: Providing quality value products, timely service and reliable collaborators

Takeaway:
Differentiating in the areas possible can help CEAT develop awareness in the US Market, and pave the way for a strong market capture.
Dealers will have better deals for replacement markets in the Value Segment, same which can be passed in the market.
Executive Summary
U.S.A Market Competitive
Scenario STP
Marketing Mix
Buying Behavior
Launch Strategy
Target Financials
PR
OD
UC
T
• Variety: Focused
• Quality: Strong R&D and testing labs
• Design: OE Collaborations
• Services: Business Solutions for clients
• Warranties: As per industry norms
• Returns: 3 month cycle
PR
ICE
• Follow a Value Optimized Pricing Strategy
• Margins: Smart Pricing via an extensive PSM Study
• Credit: 2.5 months, 15 days more than the industry average since engaging with Low Risk Clients
• Working Capital Cycle: 3 months
PLA
CE
• Locations: CEAT to have strategic Distribution Centers setup across the country
• Coverage:
• - Direct Dealer n/w at high demand points
• - Indirect: Capitalize on building up relationship with OEMs
• Inventory Days at
DC: 90 days
PR
OM
OT
ION
• Advertising: Develop a strong Brand Salience via engagements
• PR: Engage with trade journals and trade shows to highlight the Eco- Friendly and other differentiators vis-à-vis the industry
• Buzz: Service Centers Visibility & frequent ATLs

Executive Summary
U.S.A Market Competitive
Scenario STP
Marketing Mix
Buying Behavior
Launch Strategy
Target Financials
• U.S.A shopper is mostly credit driven, proven historically
• A phenomenal 33.3% of the tire buyers do not specify the tire brand, scope for penetration exists
• Farm Equipment industry is growing in the USA, and the consumer willingness to spend will increase
• The main focus area identified are:
- The equipment depth & load resistance [Efficiency]
- Average distance of travel on the work-site [Durability]
Takeaway: Focus on the credit norm payment period, rather than competing on price in the replacement market for consumers.
• Job-Site Visit by the
Nearest Dealer has to
be implemented
religiously to ensure
the customer business
requirements &
processes are better
understood, the tire
maintenance is smooth
& investments are
value worthy for the
customer.
• Due to quality Value
Added Services (VAS)
the price can be
marginally hiked, and
value price segment
pricing can be justified.
Source: World Tire Report

Executive Summary
U.S.A Market Competitive
Scenario STP
Marketing Mix
Buying Behavior
Launch Strategy
Target Financials
• Replacement Market (73%) is a major revenue earner in the tire industry
vis-à-vis the OEM (28%) market
• Focus on obtaining tie-ups with: M&M, John Deere
• CEAT India has strong business relationships with Mahindra. It should be
extended to USA for farm equipment tires, since Mahindra is the largest
tractor manufacturer.
• Promote the eco-friendly aspect of fuel consumption
• Make the CEAT tires available in the Service Centers of Mahindra, via a
Service Bundled Offer (discounted retreading rates) during repairs &
replacement of the OE tires.
• Mahindra dealer network would be a helpful source for the procurement
of Specialty Farm Equipment tires. This would help capture the Agriculture
Industry tire requirements faster.
• Supplier as an OEM to: Komatsu, Escorts International Tractors, and
Caterpillar has to be developed in the next phase
• This is needed to break into the lucrative Mining & Construction Industry
• Pitch for Dealers:
- Increased Fill Rate
- Better Warranty/Adjustment Policy & Technical Support
Incremental Planning - Timeline
Time
Go
al
Where we are now?
Farm Equipment
Tires, Mahindra
Dealership
Priority Areas
Develop a deeper dealer
network in the country
2017
2016
2018
Increase the OEM market
share
Total Span: 3 years (2016-2018)
All Activities to be undertaken simultaneously with the focus on P1, P2 & P3 respectively
P1 P2
P3

• Target the top 15 clients in the Farming Equipment, Construction & Mining Industry value-wise
• Reach out with customized credit norms, and service delivery mechanisms – for replacement tires
Reduced import duties for manufacture of tires in India, since majorly exported to US for OTR
3PL firm would help to bring down cost
This would help to cushion the extended credit and better margins for dealers
• Pitch For Clients:
- 24-Hour Emergency Roadside Service – Dealer Proximity
- Tire Maintenance Program (includes the Job-Site Service visits)
Marketing Focus
ATL Activities:
- Extensive targeted Advertisements, focus on the industry connect
- CEAT brand history leverage
- Establish endorsements of opinion leaders to drive sales in replacement market
• BTL Activities:
- Participate in Industrial Shows, Auto Expos to build
familiarity
- Ensure participation in ConExpo – Con/Agg,
Agritechnica Trade Shows in the US
- Focus on showing how the selected industrial tires are
a right fit for their business
TTL • TTL Activities:
- Provide further details on website about the Eco
Friendly Product & the Improved Credit Norms
Executive Summary
U.S.A Market Competitive
Scenario STP
Marketing Mix
Buying Behavior
Launch Strategy
Target Financials

U.S.A Map
Mahindra Dealer Presence
Legend:
Bridgestone OTR Distribution
Centre
Source: MahindraUSA.com, Bridgestone
Proposed CEAT – OTR
Distribution Centers
United States – Agri.
o/p $395,068,677,000
Rank Commodity Cash Receipts Percent
1 California $44,738,132,000 11.30%
2 Iowa $31,985,370,000 8.10%
3 Nebraska $24,465,882,000 6.20%
4 Texas $22,726,067,000 5.80%
5 Minnesota $20,580,696,000 5.20%
6 Illinois $19,649,939,000 5.00%
7 Kansas $16,223,254,000 4.10%
8 Wisconsin $12,110,055,000 3.10%
9 Indiana $12,052,964,000 3.10%
10 North Carolina $11,706,602,000 3.00%
Iowa
California
Pennsylvania
Texas
Georgia
• In accordance with the Central Place Theory, the Distribution Centers are decided by mapping farm
equipment requirement by industry, Mahindra farm tractor dealer presence & OTR DCs by competitors
• There should be an extensive n/w of on-ground dealers to enable timely delivery
• Keeping the investment setup in mind, the OTR DC number has been tried to be kept minimal till a necessary
M.S. is captured
• Have an Exclusive Dealer in each State. Logistics Partner is different zone.
Executive Summary
U.S.A Market Competitive
Scenario STP
Marketing Mix
Buying Behavior
Launch Strategy
Target Financials
Hero Logistics Lp
(Texas)
TLD Logistics Services, Inc
(Tennessee)
Neovia
(Wyoming)

CEAT Mahindra Adventure Contest
A
I
D
A
Co su e s Co ce
Concerted Consumer Action
Green Marketing, Optimized
Fuel Economy
• TNS survey found that 26% were
actively seeking environmental
products
• Washington Post poll in 2014 found
that 96% respondents were willing to
personally improve the situation by
buying green products
• Rising percentage of US adults who
believe global warming will pose a
serious threat
Cause 1: Friction between tire and the
road, causes extra fuel to burn along with
Green House Gas emission
Approach 1: Reduce rolling resistance of
tires (5 % less friction) Fuel economy
boosted by 4-8% that is 40-300 ltr over
lifetime of a tire
Approach 2: Renewably sourced raw
materials to replace current oil-based
ingredients of tires and non petroleum
versions of special additives boost (fillers)
Approach 3: Modified silica to replace some
of the carbon black reinforcement in
standard tires, lessens the frictional heat that
the rubber compound creates as it flexes,
stretches and recovers with each turn
Approach 4: Natural rubber that grips
better than unmodified versions, along
with vegetable-derived processing oil,
and cellulose-based (rayon) casing
fibers
Recycling: recycle more of the estimated 300
million used tires Freezes the rubber with
liquid nitrogen before grinding it into
pulverized rubber feedstock that could go
into tires
Tire And Rubber Recycling & it’s i pact o the e viro e t
Executive Summary
U.S.A Market Competitive
Scenario STP
Marketing Mix
Buying Behavior
Launch Strategy
Target Financials

Takeaway: Taking cue from the buying behavior of US consumers focus should be on innovative and smart credit norms to stand out from
competition. Credit Norms: 75 days for Dealers.
Smart Credit Norms- A Differentiator
Will not reduce price but play on credit
This will help protect CEAT from low-price image while attracting consumers
Loyal customers to gradually get
increased credit facilities
and hence better credit
terms
Provide improved
credit norms for bundled
offerings (Replacement + Retreading)
Provide extra credit features
to small consumers
referring CEAT tyres to others
Precautions
• Adequate checking of credit ratings of
consumers to minimize default
• Focus on service and product bundling as
a customer becomes more regular
• Being flexible enough to extend
favorable credit norms to even
organizations if they so need
• Keep an adequate balance between
credit and cash payments to stay on track
with liquidity
• Mai tai the uality p oduct i age of CEAT of all times and not trivializing it by
allowing too much credit to all
consumers
• Proper evaluation criteria to list
consumers in different bands eligible for
different levels of credit facilities
• Change the credit pattern as per demand
seasonality quarterly
- It is up to deale s discretion depending on
the competitiveness to
extend credit in the
market or not.
Executive Summary
U.S.A Market Competitive
Scenario STP
Marketing Mix
Buying Behavior
Launch Strategy
Target Financials
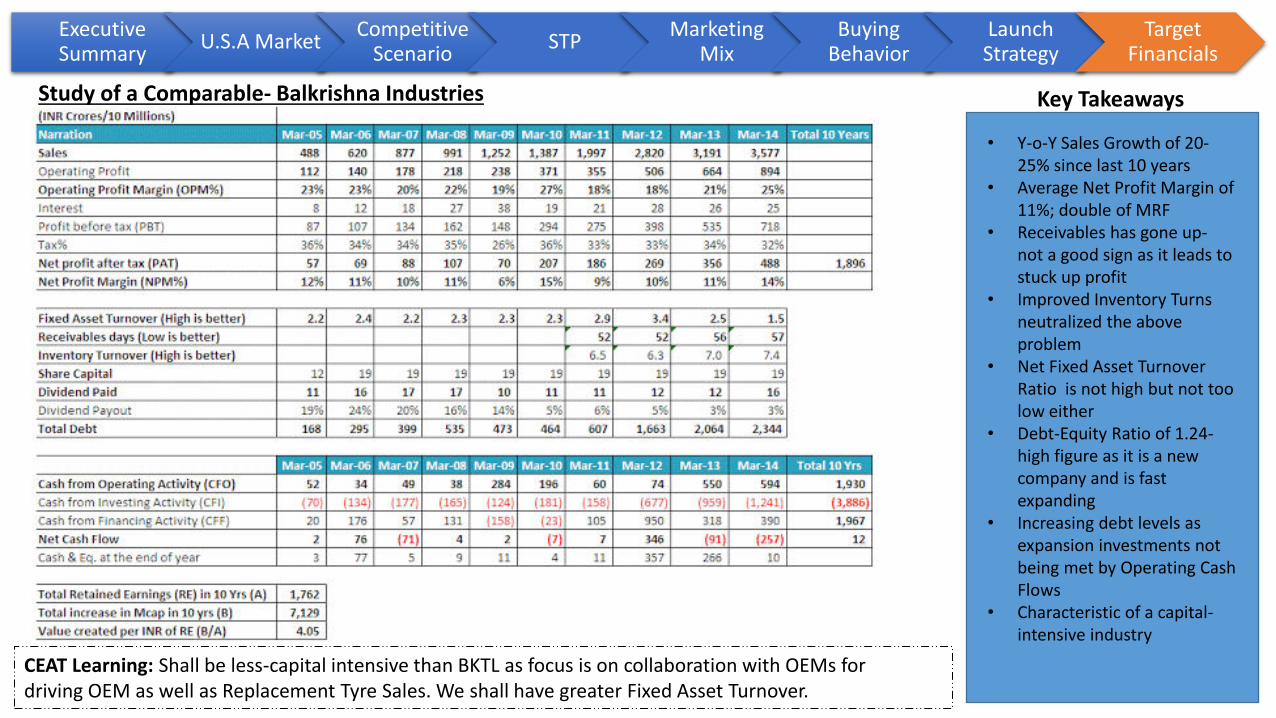
Study of a Comparable- Balkrishna Industries Key Takeaways
• Y-o-Y Sales Growth of 20-
25% since last 10 years
• Average Net Profit Margin of
11%; double of MRF
• Receivables has gone up-
not a good sign as it leads to
stuck up profit
• Improved Inventory Turns
neutralized the above
problem
• Net Fixed Asset Turnover
Ratio is not high but not too
low either
• Debt-Equity Ratio of 1.24-
high figure as it is a new
company and is fast
expanding
• Increasing debt levels as
expansion investments not
being met by Operating Cash
Flows
• Characteristic of a capital-
intensive industry
Executive Summary
U.S.A Market Competitive
Scenario STP
Marketing Mix
Buying Behavior
Launch Strategy
Target Financials
CEAT Learning: Shall be less-capital intensive than BKTL as focus is on collaboration with OEMs for
driving OEM as well as Replacement Tyre Sales. We shall have greater Fixed Asset Turnover.

Source: Industry Reports
• The revenue source of 2015 US OTR
market has been used, flat line growth
assumed
• Target goal is assumed to capture 5%
M.S in overall OTR market, in US
• In order to capture the M.S heavy
focus has been given to tap into the
growing market in the farm machinery
sector
• The data points have been considered
over a period of 3 years (2016-2018)
• With a aggressive penetration
approach 2% M.S in the 1st year would
be driven by the Farm Machinery OE
& replacement markets
• Growth estimates has been done
taking in account the maturity of the
US market
Assumptions (by value) (in Million USD)
OTR 2015 Market Revenue in US 3000
Goal (in 3 years) 5% Market Share 150
Projected Break-up
2016 2% M.S 60.0
2017 3% M.S 90.0
2018 5% M.S 150.0
OTR Revenue Breakup by Industry
Construction 43% 1290
Mining 24% 720
Exports 23% 690
Agriculture 6% 180
Others 4% 120
Forecasted Revenue Breakup (2018)
Construction 34% 51.0
Mining 28% 42.0
Agriculture 35% 52.5
Others 3% 4.5
Net Value 100% 150.0
Industry Size
Construction Machinery US Market (in million USD) 40000
Farm Equipment Market - Global CAGR forcasted growth - 9.2%
Executive Summary
U.S.A Market Competitive
Scenario STP
Marketing Mix
Buying Behavior
Launch Strategy
Target Financials
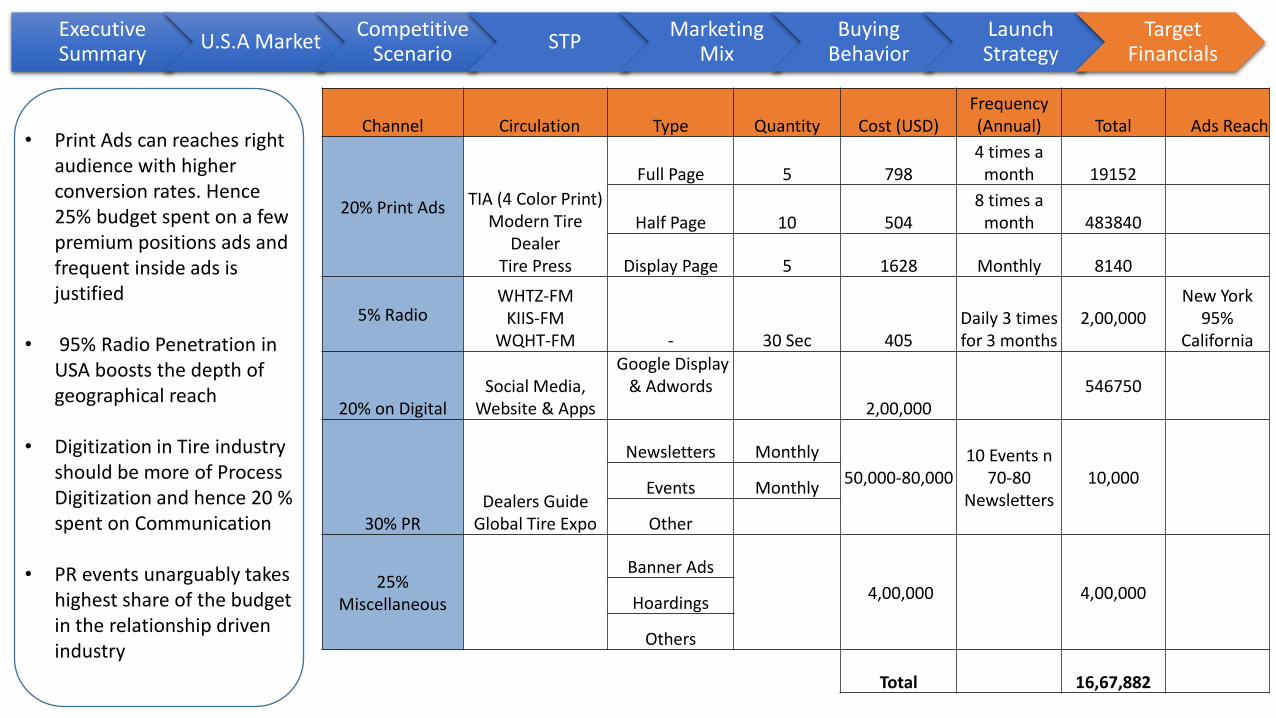
Channel Circulation Type Quantity Cost (USD)
Frequency
(Annual) Total Ads Reach
20% Print Ads TIA (4 Color Print)
Modern Tire
Dealer
Tire Press
Full Page 5 798
4 times a
month 19152
Half Page 10 504
8 times a
month 483840
Display Page 5 1628 Monthly 8140
5% Radio WHTZ-FM
KIIS-FM
WQHT-FM - 30 Sec 405
Daily 3 times
for 3 months
2,00,000
New York
95%
California
20% on Digital
Social Media,
Website & Apps
Google Display
& Adwords
2,00,000
546750
30% PR
Dealers Guide
Global Tire Expo
Newsletters Monthly
50,000-80,000
10 Events n
70-80
Newsletters
10,000 Events Monthly
Other
25%
Miscellaneous
Banner Ads
4,00,000 4,00,000 Hoardings
Others
Total 16,67,882
• Print Ads can reaches right
audience with higher
conversion rates. Hence
25% budget spent on a few
premium positions ads and
frequent inside ads is
justified
• 95% Radio Penetration in
USA boosts the depth of
geographical reach
• Digitization in Tire industry
should be more of Process
Digitization and hence 20 %
spent on Communication
• PR events unarguably takes
highest share of the budget
in the relationship driven
industry
Executive Summary
U.S.A Market Competitive
Scenario STP
Marketing Mix
Buying Behavior
Launch Strategy
Target Financials


Price Sensitivity Meter Questions:
• At what price would you begin to
think product is too expensive to
consider?
• At what price would you begin to
think product is so inexpensive
that you would question the
quality and not consider it?
• At what price would you begin to
think product is getting
expensive, but you still might
consider it?
• At what price would you think
product is a bargain – a great buy
for the money -

List of Prospective Clients
Top 15 Construction Companies (US)
• Bechtel Group Inc., San Francisco, CA
• Fluor Corporation, Irvine, CA
• Skankska Inc., Greenwich, CT
• CENTEX Construction Group, Dallas, TX
• The Turner Corp., NY
• Halliburton- Kellogg Brown & Root, Houston, TX
• Peter Kiewit Sons Inc., Omaha, NE
• Washington Group International, Inc
• J.A. Jones Inc., Charlotte, NC
• Bovis Lend Lease, NY
• Gilbane Buidling Co., Providence, RI
• The Clark Construction Group Inc., Bethesda, MD
• The Whiting-Turner Contracting Co., Baltimore, MD
• Jacobs Engineering Group, Pasadena, CA
• Foster Wheeler Corp., Clinton, NJ
Top 15 Mining Companies (US)
• Rio Tinto
• Barrick
• Freeport-McMoRan
• Goldcorp
• Norilsk Nickel
• The Mosaic Company
• Newmont Mining Corporation
• Alcoa
• AngloGold Ashanti
• Kinross Gold
• Peabody Energy
• 3M
• Dells Mining Company
• Sugarland Mining Company
• Omaha Mining Company

Source: CEAT.com

http://www.quirks.com/advertise/print/adrates.aspx