ceer annual conference 2021 dynamic regulation in practice
TRANSCRIPT

CEER Annual Conference 2021 Dynamic Regulation in Practice:The energy sector during the pandemic and Energy Transition
30 March 2021
#CAC2021
1

#CAC2021
Agenda
2
2
Keynote address by Kadri Simson, European
Commission
Session One: Impact of the Covid-19
Pandemic on the Energy Sector
Presentations by Mechthild Wörsdörfer,
International Energy Agency & Jean-Laurent
Lastelle, CEER
Panel discussion
Jiří Jaromír Klemeš, Brno University of
Technology
Matthew Vickers, Ombudsman Services &
NEON
Marie-Pierre Fauconnier, Sibelga
Moderator: Jean-Laurent Lastelle, CEER
Session Two: Sector coupling and the
energy transition
Presentations by Pedro Verdelho &
Christine Materazzi-Wagner, CEER
Panel discussion
Catharina Sikow-Magny, European
Commission
Uroš Salobir, ELES
Jorgo Chatzimarkakis, Hydrogen Europe
Moderator: Wolfgang Urbantschitsch, CEER
Closing remarks & preview new CEER
Strategy for 2022-2025 by Annegret
Groebel, CEER President

IEA 2020. All rights reserved.
Impact of the Covid-19 pandemic on the energy sector
Mechthild Wörsdörfer, Director, Sustainability, Technology & Outlooks, IEA
CEER 2021 Annual Conference
30 March 2021

IEA 2020 All rights reserved.
A shock to the energy system
The impacts of Covid-19 on future energy and emissions trends depend on the duration and severity
of the pandemic, and the responses from the world’s energy policy makers
Key estimated energy demand, CO2 emissions and investment indicators, 2020 relative to 2019
Sources:
Global Energy Review,
World Energy Investment
WEO-2020-20% -15% -10% -5% 0% 5%
Coal
Gas
Oil
Nuclear
Renewables
Total
CO2 emissions
Energy investment
Ener
gy D
eman
d

IEA 2020 All rights reserved.
Major emitters underpinned the rebound of global CO2 emissions
Major emerging economies underpinned the rebound in global CO2 emissions, led by China where CO2
emissions in 2020 were already above 2019 levels by April
Evolution of monthly CO2 emissions in 2020 relative to 2019
-50%
-40%
-30%
-20%
-10%
0%
10%
Jan Feb Mar Apr May Jun Jul Aug Sep Oct Nov Dec
World
China
India
United States

IEA 2020 All rights reserved.
The number of people without electricity access is rising in 2020, and five countries make up half of the total in
Africa. Higher financing costs limit progress and a delayed recovery leaves 630 million in the dark in 2030.
The poorest feel the worst effects of the crisis
400
500
600
700
2000 2005 2010 2015 2020
Mill
ion
2013
2019
The number of people without electricity access is rising in 2020, and five countries make up half of the total in
Africa.
0
200
400
600
2020
Congo DRC
Nigeria
Ethiopia
TanzaniaUganda
Rest of Africa
Population without access to electricity in Africa

IEA 2020 All rights reserved.
Diversification: the critical watchword for oil and gas producers
A changing energy system is posing critical questions for countries heavily dependent on oil & gas revenue
.
Today’s value of global oil and gas production to 2040
Oil
Gas
Oil
Gas
Oil
Gas
0
5
10
15
20
25
Before Covid Post-Covid
Updated policy settings
Sustainable
Development
Scenario
Trillion dollars-24%
-34%
The push for net-zero emissions creates additional pressure for changes in strategies and business models

IEA 2020 All rights reserved.
Wind and solar PV’s combined installed capacity surpasses that of natural gas in 2023 and coal in 2024.
Renewables will become the largest source of electricity generation in 2025, overtaking coal.
A major shift in global electricity generation on the horizon
Electricity generation by technology, 2019
0 2 000 4 000 6 000 8 000 10 000 12 000
Renewables
Coal
Natural gas
TWh
Electricity generation by technology, 2025
0 2 000 4 000 6 000 8 000 10 000 12 000
Renewables
Coal
Natural gas
TWh
Hydropower Wind Solar PV Bioenergy Other renewables
Source:
Renewables 2020

IEA 2020 All rights reserved.
The Covid-19 crisis has shocked both economic activity and energy demand. While some clean energy
technologies have proved resilient, the rate of global energy intensity progress halved in 2020
Efficiency progress, already weakened, faces further setbacks
Global energy intensity improvement, 2015 - 2020
0.0%
0.5%
1.0%
1.5%
2.0%
2.5%
3.0%
3.5%
2015 2016 2017 2018 2019 2020
An
nu
al ch
an
ge
Source:
Efficiency 2020

IEA 2020 All rights reserved.
15
20
25
30
35
40
2010 2015 2020e 2025 2030 2035 2040
Gt
CO
₂
Only a sustainable recovery can break the emissions trend
Energy sector and industrial process CO2 emissions by scenario
Stated Policies
Delayed
Recovery
Sustainable
Development
Scenario
WEO-2019
- 4
- 2
0
2
2021 2025 2030 2035 2040
Lower activity
Less efficiency
Renewables
Other
Net change relative to STEPS
Gt
CO
2
Emissions reductions in the DRS come at a huge social and economic cost.
Structural changes in energy supply and demand, not reductions in activity, are the key to energy transitions
Emissions reductions in the Delayed Recovery
Scenario, relative to Stated Policies (STEPS)
Emissions reductions in the Delayed Recovery Scenario come at a huge social and economic cost.

IEA 2020 All rights reserved.

The Impact of the COVID-19 Pandemic on the Energy Sector– A first snapshot
Jean-Laurent Lastelle, CEER Vice President
You can find the CEER paper here.

Objectives
• Mapping the effects of the COVID-19 pandemic on the electricity and gas systems, consumers and energy companies in CEER countries;
• Identifying a first set of lessons learned and best practices from 2020.
Approach and data collection
• Questionnaire on the effects of the pandemic on the energy system as a whole, consumers, energy suppliers and network operators;
• 28 NRAs provided input: Austria, Belgium, Bulgaria, Croatia, Czech Republic, Estonia, Finland, France, Georgia, Germany, Great Britain, Greece, Hungary, Ireland, Italy, Latvia, Lithuania, Luxembourg, Malta, the Netherlands, North Macedonia, Norway, Portugal, Romania, Slovakia, Slovenia, Spain, Sweden;
• Comparing the results of that exercise with findings from other institutions (IEA, OECD, EC, ACER/CEER).
13

Impact on electricity and gas systems 1/3
• Electricity consumption (2020 vs. 2019)
14

Impact on the electricity and gas systems 2/3
• Electricity
►Demand and prices fell markedly over the spring months of 2020 that coincidedwith restriction measures, such as lockdowns.
• E.g.: A fall in global electricity consumption per month in March-June 2020 inselected countries, compared to the same month of 2019.
• Regarding prices, the COVID-19 pandemic was one of the causes, but not theonly cause. Depending on the country, other factors were at play (e.g. weatherconditions).
►Second wave restrictions (winter 2020) seem to have had less of an impact thanfirst wave restrictions (spring 2020).
►Renewable energy sources (RES): Several countries saw an increase in the RESshare of their electricity mix, which the system was able to handle.
15

Impact on the electricity and gas systems 3/3
• Gas
►Demand and prices were already low in Q1 2020, but reachednew lows at the same time restrictions were imposed.
►Gas trends varied more widely over all respondent countries, againdue to other factors, such as weather conditions.
16

Impact on energy consumers
• Restrictions entailed business closures, income and even job losses.
• Risk of inability to pay energy bills and of losing energy supply.
Risk for consumers
• Moratorium on disconnections: the most widespread measure (reported by 18 NRAs);
• Staggering or deferral of consumer energy bills;
• Social welfare measures: mostly not specific to energy expenditure;
• But: in some countries, direct subsidies for energy costs, fuel vouchers (Great Britain, Ireland), facilitated access to social tariffs (Italy, Spain).
• Aid for businesses: mostly not linked to energy supply;
• But: in some countries, suspension or reduction of contracted capacity (Ireland, Portugal, Spain).
Types of measures put in place to support consumers
17

Impact on energy companies
Energy suppliers
• Mirror image of disconnection bans: several NRAs reported or expected an increase in unpaid energy bills.
• Suppliers reported losses due to drops in electricity demand and prices.
• Measure taken to support suppliers in some countries: staggering and deferral of network tariff bills.
Network operators
• Lockdown measures entailed delays to network development and smart-meter roll-out.
• Some NRAs already anticipated / reported a slight decrease in tariff revenue.
• At the time of writing, the majority of NRAs had not yet taken any measures to support network operators.
• In some countries: easing of quality of service obligations and penalties, consideration for pandemic-related costs.
18

Lessons learnt & best practices
• Resilience of the energy sector;
► Ireland: some generation units set aside to ensure availability in winter;
• Ensuring good and swift information flows;
► Finland: centralised task force including all relevant parties;
• Adapting procedures and deadlines where necessary;
► Germany: legislation adopted to adapt deadlines and enable digital solutions in planning andapproval procedures;
• Key measure: preventing disconnections of consumers;
► Spain, Lithuania: possibly the most impactful measure;
• Sharing the burden more widely within the sector;
► Italy: for suppliers, partial suspension of tariff bills and ad hoc financing.
• Remote operations and digitalisation;
► Luxembourg: restrictions have pushed digitalisation efforts ahead.
19

#CAC2021
Session One: Impact of the Covid-19 Pandemic on the
Energy Sector – panel discussion
Jiří Jaromír Klemeš, Professor Brno University of Technology
Matthew Vickers, CEO Ombudsman Services & Vice
President National Energy Ombudsmen Network (NEON)
Marie-Pierre Fauconnier, CEO Sibelga (Distribution network
operator of Brussels Capital Region)
Moderator Jean-Laurent Lastelle, CEER Vice President
20

More Lessons from COVID-19 pandemic: Creative Destruction
Jiří Jaromír Klemeš, Yee Van Fan
Sustainable Process Integration Laboratory – SPIL, NETME Centre
Faculty of Mechanical Engineering Brno University of Technology - VUT Brno
Technická 2896/2, 616 00 Brno, Czech Republic.

Waves of Innovation
Klemeš, J. J., Fan, Y.V., Jiang, P. (2020). COVID‐19 pandemic facilitating energy transition opportunities.
International Journal of Energy Research. DOI:10.1002/er.6007

New Opportunities and Emerging Development
1. Spread out of distance meeting and learning
2. Massive home office
3. The growing popularity of e‐shopping
4. Raise in e‐socialising
5. Related to this intensifying the data transmissions as 5G and even starting 6G
6. Urban and sanitary reforms
7. Remote and robotic health monitoring and even treatment
8. Related preference to shortening the commuting
9. Intelligent traffic control, strengthening to favour self‐driving autonomous vehicles
10. Advanced digital manufacturing. Advanced and possible person‐less waste management
collection and treatment.
11. Applications of novel ways for deliveries
12. Promotion of renewable energy
13. Setting up a post‐COVID‐19 supply chain
14. Industrial Internet of Things (IIoT)
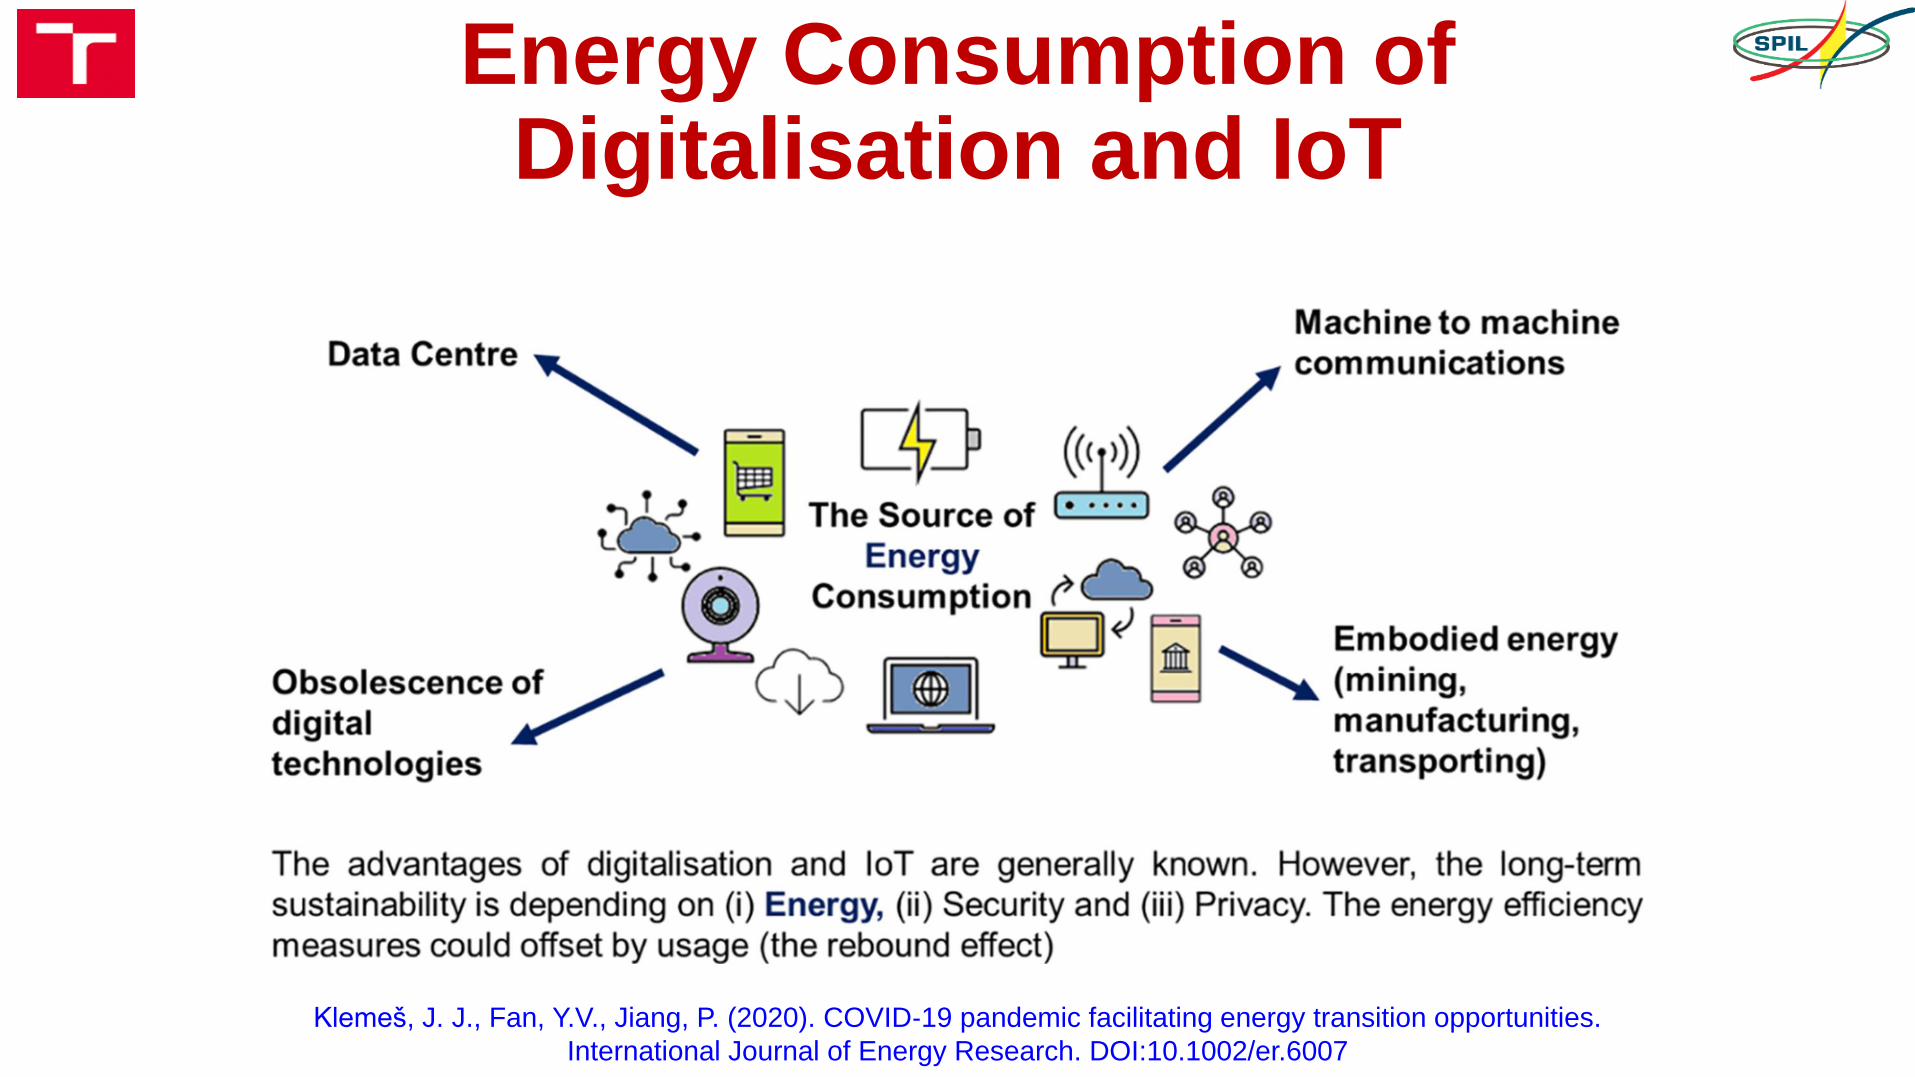
Energy Consumption of Digitalisation and IoT
Klemeš, J. J., Fan, Y.V., Jiang, P. (2020). COVID‐19 pandemic facilitating energy transition opportunities.
International Journal of Energy Research. DOI:10.1002/er.6007

Marie-Pierre Fauconnier, CEO Sibelga (Distribution network operator of Brussels Capital Region)
The energy network operator function during the pandemic crisis
25

Sibelga, DSO gas and electricity in Brussels
Key data
• 1,200 staff
• 717,638 EAN electricity
• 510,050 EAN gas
• 85,300 street lights
• 2,918 km gas grid
• 6,424 km electricity grid
• Turnover: € 313 million
26

Recap of the COVID-19 evolution in Belgium
Total of people in hospital and in intensive care
Intensive care capacity
27

Phasing of activities @Sibelga• No preparedness plan prior to 13 March 2020
(Belgian lockdown);
• Lesson learned from Italy as ‘early mover’;
• Phasing by activities and in line with the official communication:• Essential service incl. dispatching and on-call service for
emergencies: never interrupted;
• 100% telework for administrative staff (sometimes presence on the field is requested);
• Non urgent activities: resuming from 15 April 2020 (by phases);
• From May 2020: 100% activities on the field ;
• In November 2020: ‘second wave’ stress on essential services.
28

Lessons learned
• Staff is proud and committed to performing
essential service (no absence);
• Crisis Steering Committee establishing its governance early;
• Good cooperation with labour unions;
• Daily exchanges and cooperation with other DSOs;
• Keeping close communication with staff (intranet, e-café, virtual yoga/stretching classes, recorded messages from the Management, etc.).
29

See you again after the short
break!
30
30