national report 2015 - ceer
TRANSCRIPT

R O M A N I A N E N E R G Y R E G U L A T O R Y A U T H O R I T Y
3, Constantin Nacu st., sector 2, Bucharest, postal code: 020995, phone: 021/311.22.44, fax: 021/312.43.65, mail: [email protected] Web page: www.anre.ro
ANRE
NATIONAL REPORT 2015
31 August 2016

31.08.2016
Romanian Energy Regulatory Authority Page 2 of 109
Content
1 Foreword ........................................................................................................... 3
2 Main developments in the electricity and natural gas market .................... 6
3. Electricity market .......................................................................................... 13
3.1. Network regulation .................................................................................... 13
3.2. Promoting Competition ............................................................................. 39
3.3. Security of electricity supply ..................................................................... 73
4. Natural gas market ........................................................................................ 80
4.1. Network regulation .................................................................................... 80
4.2. Promoting competition .............................................................................. 91
4.3. Security of supply ..................................................................................... 100
5. Consumer protection and dispute settlement in electricity and gas…...101
5.1. Consumer protection ................................................................................ 101
5.2. Dispute settlement .................................................................................... 106
31.08.2016
Romanian Energy Regulatory Authority Page 3 of 109
1 Foreword
This document constitutes the national report issued by the Romanian Energy Regulatory
Authority - ANRE for similar institutions in the Member States, Agency for the Cooperation
of Energy Regulators - ACER and the European Commission in order to fulfil the reporting
obligations included in the provisions of Article 37 paragraph (1) letter e) of Directive
2009/72/CE and Article 41 paragraph (1) letter e) of Directive 2009/73/CE. The report also
responds to the reporting requirements required by Article 9 paragraph (1) letter ș),
paragraphs (4), (5), (6) and (7) of Law no. 160/2012 approving Government Emergency
Ordinance no. 33/2007 on the organization and functioning of ANRE. The report contains
information on developments in the electricity and natural gas markets for the period 1
January 2015 - 31 December 2015, in accordance with the requirements of ACER - CEER.
To create a modern energy sector, corresponding to the major principles and objectives of the
European Union energy policy of electricity and natural gas market liberalization and capable
of meeting consumer demand, ANRE has developed and issued in 2015 approx. 986 orders,
decisions and opinions in accordance with the obligations deriving from the primary and the
European legislation.
Significant developments in the electricity market in the aforementioned period were:
finalizing the certification of C.N. Transelectrica S.A. as transmission and system operator
according to the ownership unbundling model, completing the regulatory framework for the
process of connecting users to public electricity networks, measures for the deployment of
electricity smart metering, increasing transparency the number of transactions on the
electricity markets, harmonization of secondary legislation with the provisions of the primary
legislation and the European codes, continuation of the process of phasing out regulated
prices correlated with optimal management of energy consumption, finalizing the
implementation of universal service for electricity and reviewing the regulatory framework
for the supply of last resort, updating the regulatory framework of support schemes for the
promotion of electricity produced from renewable energy sources and of high efficiency
cogeneration.
In the application of the Regulation (EU) 2015/1222 of the European Commission, the
activity regarding Romania's participation in the CEE FB MC project (Flow-based Market
Coupling in Central and Eastern Europe) has continued.
By ANRE Decision no. 2515/2015, the company Electricity and Natural Gas Market Operator
“OPCOM” S.A. was appointed as „nominated electricity market operator” (NEMO) of the
day-ahead and intra-day markets from the Romanian bidding zone, within the meaning of
Regulation (EU) 2015/1222 of the European Commission of 24 July 2015 laying down
guidelines on capacity allocation and congestion management.
Until 31 December 2015, ANRE approved renewable energy generation capacities with a
total installed power of 4662 MW.
On the natural gas sector we mention: completing the regulatory process of phasing out the
prices for the non-household customers starting with 1 January 2015, adjusting the regulatory
framework for the retail natural gas market to the legislative amendments on the gas market

31.08.2016
Romanian Energy Regulatory Authority Page 4 of 109
structure in Romania due to the implementation of the roadmap for phasing out regulated
prices, increase the integrity and the transparency of the wholesale natural gas market.
Compared to 2014, the degree of the market opening increased by approx. 10% to about 66%
of the total consumption in 2015.
For the gas household customers, Government and ANRE have elaborated a new timetable
for phasing out the regulated prices for the period 1 July 2015 – 30 June 2021 taking into
account the downward trend of the evolution of the international prices for the hydrocarbons.
Regarding the energy efficiency sector, ANRE has conducted specific activities such as law
enforcement to promote energy efficiency and the development of secondary legislation,
activities of energy auditor’s authorization and certification of energy managers, project
activities financed within the Intelligent Energy Europe Programme, participating at the
internal and international working groups, monitoring the evolution of the implementation of
the National Energy Efficiency Action Plan and of the related programs to improve the energy
efficiency at the national level.
In order to apply the provisions of Regulation (EU) no. 1227/2011 (REMIT) and the
provisions of ACER Decision no. 01/2012 regarding the registration of the market
participants, ANRE issued Order no. 1/2015 establishing the National Register of the
wholesale energy market participants and approving the Registration Procedure for the
participants to the energy wholesale market.
ANRE will continue to pursue the increase of the efficiency of the energy markets and their
integration on the European market, the harmonization process of the secondary legislation to
the provisions of the primary legislation and to the European codes, the development of the
trading platforms, the implementation of the provisions of the European regulations regarding
the integrity and the transparency of the markets, the integration of the renewable energy
sources in a secure and reliable manner, promotion of the investments in the smart grids, the
information and protection of the customer.
NICULAE HAVRILEȚ
PRESIDENT

31.08.2016
Romanian Energy Regulatory Authority Page 5 of 109
Abbreviations
ATC – Available Transmission Capacity
AS - Ancillary Services
BM - Balancing Market
BRM - Romanian Commodities Exchange
CMBC – Centralized Market of Bilateral Contracts
CMBC-EA - Centralized Market of Bilateral Contracts by Extended Public Auction
CMBC-CN - Centralized Market of Bilateral Contracts by Public Auction with Continuous
Negotiation
CMBC-OTC - Centralised Market of Bilateral Contracts with Double Continuous Trading
CMBC-PC - Centralised Market of Bilateral Contracts for Processing Contracts
CMC – Competitive Market Component
CMUS - Centralized Market for Universal Service
DAM – Day-Ahead Market
DSO – Distribution System Operator
ENTSO - E –European Network of Transmission System Operators for Electricity
ENTSO-G - European Network of Transmission System Operators for Natural Gas
E-RES – Electricity produced from Renewable Energy Sources
GD – Government Decision
HHI – Herfindahl-Hirschman Index
IDM - Intra-day market
NPS –National Power System
NTS - Natural Gas Transmission System
PCR – Price Coupling of Regions solution
SO – storage operator
SoLR – Supplier of Last Resort
TSO – Transmission System Operator

31.08.2016
Romanian Energy Regulatory Authority Page 6 of 109
2 Main developments in the electricity and natural gas market
2.1 Electricity market
The main developments on the electricity market in 2015 were:
ANRE authorized since the beginning of the application of the support scheme until 31
December 2015, generation capacities of renewable energy with a total installed power of
4662 de MW. Of the total, 2931 MW are wind turbines, 1296 — photovoltaic panels and
106.5 MW — biomass, biogas and landfill gas units. At the same time, 327.8 MW
represents small hydropower plants below 10 MW of which 228.8 MW in new units, 85.5
MW in refurbished units and 13.5 MW in old units;
In 2015, the electricity production was 65.6 TWh, approximately 1.1% higher than in
2014. Internal consumption was about 58.9 TWh, about 2% higher than in 2014.
Romania was a net exporter of electricity in 2015, the export-import balance being
negative (- 6.73 TWh);
Regarding the mix of resources, there are no significant differences to 2014. The nuclear
and hydroelectric production registered decreases of 0.26% respectively 3.88%. Increases
were recorded in electricity production from coal and biomass (0.02%), renewable
photovoltaic (0.53%), wind (1.21%) and hydrocarbons (2.37%);
ANRE approved the final certification of the National Company for Power Grid
"Transelectrica" - S.A., according to the model of ownership unbundling, as
transmission system operator of the national electricity system, by ANRE Order no.
164/2015. On 10/12/2015, ANRE notified the European Commission regarding the
approval of the National Company for Power Grid "Transelectrica" - S.A. as transmission
system operator in Romania in accordance with Art. 10 of EC Directive 72/2009;
Decrease with 6.8 % of the average transmission tariff from 1 July 2015, compared the
approved tariff for the period 1 July 2014 – 30 June 2015, was due to the increase of the
electricity consumption and the export, as well as to correction applied by ANRE related
to the ending of the first semester of 2014 and also to the estimation of the achievements
of the first year of the regulatory period;
The tariffs for the electricity distribution service decreased: for high voltage (- 11.35
%), for medium voltage (- 11.90 %) and for low voltage (- 12.84 %);
ANRE approved the values of annual investment programs for the concessionaires
distribution operators for the regulatory period 2014-2018, accepting inclusion in the
RAB of fixed assets resulting from prudent investments, respectively those investments
that prove to be necessary, appropriate and efficient;
Regarding the state of the distribution networks, comparing the evolution of the main
indicators of continuity from the period 2008-2015 it is obviously a general progress.
Thus, planned SAIFI, as average value on country decreased from 1.6 interruptions/year
in 2008, to 0.77 interruptions/year in 2015, and unplanned SAIFI, as average value on
country decreased from 6.7 interruptions/year in 2008, to 4.19 interruptions/year in 2015.
Planned SAIDI, as average value on country decreased from 386 min/year in 2008, to 211

31.08.2016
Romanian Energy Regulatory Authority Page 7 of 109
min/year in 2015, and unplanned SAIDI decreased from 639 min/year (10 hours and 39
minutes) in 2008 to 308 min/year (5 hours and 8 minutes) in 2015, recording a decrease
of 331 min/year (5 hours and 31 minutes);
The average time for the network connection process amounted to 109 days across the
country ( from the complete documentation submission, without the solution study, to the
powering on installation), the average cost is 3003 RON;
The cross-border commercial activity intensified in 2015, the amount of energy
exported on contractual basis was about 10.50 TWh, 28% higher than the previous year,
while the imported energy had exceed by 2.5 times the amount in 2014, reaching to 3.78
TWh. We mention that the electricity export activity was achieved mainly by suppliers (
approx. 98% of the traded volume on this type of contracts), respectively Transelectrica
SA as transfer agent for the coupled DAM for the import activity (approx. 78% of the
traded volume);
As a result of the allocation of interconnection capacity, over 95% of Transelectrica
S.A. revenues came from long term auctions (annual and monthly), the highest values
being recorded in particular from the auctions for export capacity allocation on the
borders with Hungary, Serbia and Bulgaria. The revenues from the daily auctions were
reduced as value, most of them being made of the income determined by the congestions
on Romania-Hungary border, after the default daily allocations; mentioning that the
income from the intra-day auctions are close to zero;
The harmonised rules for long-term allocation of interconnection capacities were
approved by ANRE to be applied on Romania-Hungary border, the derogations to the
common version are presented in annexes, namely in Annex 15;
Electricity transactions volume achieved on the wholesale competitive market in 2015
increased by 34.5% compared to that achieved in 2014:
Wholesale market components Volumes traded
in 2015
-GWh-
Evolution compared
to 2014
- % -
Percentage of
internal
consumption 2015 - % -
Regulated contracts market 6413 ▼ 29.2 12.6
Directly negotiated contracts 1509 ▼67.3 3.0
Centralized market of bilateral contracts, from which: 56717 ▲52.1 109.5
- CMBC-EA 31407 ▼8.5 61.9
- CMBC-CN 7915 ▲388.3 15.6
- CM-OTC 17394 ▲1194.6 34.3
Centralized market for universal service 4592 - 9.1
Day ahead market 22496 ▲5,3 44.3
Intra-day market 76 ▲18,8 1.5
Balancing market 4861 ▲16,6 9.4
Export* 10504 ▲28,0 20.0
In 2015, trading was predominant on the centralized markets of bilateral electricity
contracts organized by OPCOM (CMBC-EA, CMBC-CN and CM-OTC), ensuring
especially the medium and long-term contracts, followed by DAM and IDM for the short-
term transactions;

31.08.2016
Romanian Energy Regulatory Authority Page 8 of 109
Transactions on brokerage platforms were actually ceased in 2014, the participants
straightening the interest to the centralized market with double continuous negotiation on
OPCOM S.A.;
It is also noted the increase by approx. 16% of the electricity volume traded on the
balancing market comparing to that in 2014;
Comparing to 2014, it is noted a further reduction of the electricity amount sold on the
regulated contracts, this is a consequence of the Memorandum of Understanding approved
by the Government in March 2012 concerning the assumed obligations with IMF, World
Bank and European Commission regarding the approval of the timetable for phasing out
regulated electricity tariffs to the final consumers;
A comparative analysis of the annual average prices resulting from transactions on
the wholesale market components in 2015 over the previous year indicates the following:
Decrease of the average annual prices for all the components of the wholesale
market, except the one registered on DAM and the average one for deficit on the
Balancing Market; the most significant decrease was registered on the IDM, and the
smallest decrease was for the price on CMBC-CN;
The average annual prices on negotiated bilateral contracts registered smaller values
than on other competitive contracts,
The average selling price for Centralized Market for universal service was the
highest average price registered on the centralized platforms managed by market
operator; this fact reflects the offering policy of the participants on this segment of
the market and the novelty introduced by the regulatory framework implemented,
and is probably influenced by the type/number of the traded products;
In order to apply the provisions of Regulation (EU) no. 1227/2011 and the provisions
of ACER Decision no. 01/2012 regarding the register format in accordance with Art. 9,
paragraph (3) of REMIT and to the necessity to adapt the national regulatory framework
to international developments concerning the REMIT implementation, ANRE issued
Order no. 1/2015 establishing the National Register of the wholesale energy market
participants, published in the Official Gazette of Romania no. 80/30.01.2015. Thus, as of
18 March 2015, the participants on the energy wholesale market in Romania were
required to register on the National Register of wholesale energy market participants, set
out and managed by ANRE according to the procedure set out in the Annex to the Order.
Presently, a number of 609 wholesale energy participants is registered in the national
registry and their data are sent to CEREMP-ACER;
In 2015, the number of electricity suppliers operating on the electricity retail market
was 96, of which 21 are also electricity generation license holders and 5 suppliers of last
resort (SoLR);
The electricity supplied by SoLR amounted approx. 14128 GWh, with a decrease of
7.1% compared to 2014, given the increase of the total final consumption by approx.
3.9%;
Also in 2015 it was recorded:
The increase by 3.3% of the household consumption compared to 2014, while
maintaining its share in the consumption structure;
The increase by 9.7% of the consumption of the non-households customers who

31.08.2016
Romanian Energy Regulatory Authority Page 9 of 109
have switched the supplier compared to 2014 and the increase of its share in the final
consumption;
The consumption decrease of the non-household customers supplied on universal
service and on the last resort by approx. 40.8% compared to 2014 and also the
decrease of its share in the final consumption;
In December 2015, on the competitive market were present 112018 non-household
customers, the energy supplied to them in 2015 represented 32076 GWh. The real
degree of market opening at the end of 2015 was 69%;
The value of supply switching rate for the retail market in terms of number of
consumption places recorded large increases compared to the last year values which
indicates that the customers migration from one supplier to another has restarted; it is
noted significant increases registered by the indicator for the small non-households and
households due to the deregulatory process undertaken by Romania;
According to the timetable for phasing out the regulated tariffs, stated by the
Memorandum of Understanding signed by the Government with the IMF, WB and
European Commission on 13 March 2012, in 2015, steps 8 and 9 for phasing out the
regulated tariffs were taken, the percentage of buying electricity on the competitive
market for the final customers that have not used the eligibility rights are:
- 100 % of non-household customers consumption and 40 % of household customers
consumption, for the step 8 on phasing out regulated tariffs (period 01.01.2015 -
30.06.2015);
- 100 % of non-household customers consumption and 50 % of household customers
consumption, for the step 9 on phasing out regulated tariffs (period 01.07.2015 -
31.12.2015);
ANRE has analysed the proposals of the concessionaires distribution operators and
approved in March 2015 the pilot projects on smart metering systems that have met
the required criteria. 14 pilot projects were approved for 6 concessionaires’ distribution
operators.
2.2. Natural gas market
The main developments on the natural gas market in 2015 were:
Annual consumption of natural gas has continued to decline, reaching around 11.6
billion cubic meters, with a decrease of about 5% in 2015 compared to 2014, due to a
slight decrease in the consumption of the end customers;
In 2015, the total consumption of natural gas was 121,726,748.658 MWh. The total
number of final customers was 3480661, of which 182265 non-household customers
(5.24%) and 3298396 household customers (94.76%);
In this year, the final customers consumption was 111,244,195.163 MWh, of which
80,992,734.448 MWh represented the non-household consumption (72.80%) and
30,251,460.715 MWh represented household consumption (27.20%);
Natural gas consumption is covered from internal production and imports. Internal
production was 118,816,674.270 MWh, and the import was 2,910,074.388 MWh;

31.08.2016
Romanian Energy Regulatory Authority Page 10 of 109
The number of participants on the gas market in Romania has increased steadily as the
market was liberalized, especially in the natural gas supply sector;
Natural gas internal production in 2015, current production and extracted from
underground storage, meant to consumption, represented 97.61% of the total sources. The
first two producers (Romgaz și OMV Petrom) jointly covered 94.85% from this source;
The import entering into consumption in 2015, current import and extracted from
underground storage, was 2.39%. The top three importers – internal suppliers – jointly
conducted 94.89%;
In 2015, the natural gas production in Romania was provided by a number of 6 producers:
SNGN Romgaz SA, S.C. OMV Petrom SA, S.C. Amromco Energy SRL, S.C. Raffles
Energy SRL, S.C. Foraj Sonde SA, S.C. Stratum Energy LLC;
Given the structure of the natural gas market in Romania, where over 95% of the gas
consumed is coming from the internal production, these quantities are traded on the
wholesale gas market, the exported quantities have a very low level in 2015, approx.
11,694.640 MWh representing 0.01% of the total production;
In 2015, 30 suppliers traded on the centralized markets, the volume of these contracts was
1,720,544 MWh;
Following the analyse of the final version of the Report of S.N.T.G.N. TRANSGAZ
S.A., ANRE addopted Decision no. 2296/2015, under which the interim measures on
balancing the national transmission system for the gas year 2015-2016 were approved;
The launching of the approval process of the second list of projects of common interest
and the approval of the cost’s allocation methodology for these projects represented the
main actions undertaken at European level under the provisions of Regulation (EU) no.
347/2013 on the guidelines for trans–European energy infrastructure. ANRE evaluated
the proposed projects by the investments promoters for their inclusion on the second list
of projects of European interest. In 2015, there were numerous meetings to identify the
needs of the transmission infrastructure in the region Central-South-Eastern Europe. In
this respect, some initiatives were launched such as CESEC and the gas pipeline that shall
link Bulgaria and Austria via Romania and Hungary (interconnecting project Bulgaria -
Romania - Hungary – Austria) abbreviated BRUA;
The European Commission had endorsed on 19 January 2016 the financing amount of
179 million euros for the works to be carried by the transmission and system operator to
develop BRUA – Phase 1. Thus, Transgaz will have some of the necessary financing to
execute the works on the Romanian territory;
After analysing the request for cross-border costs allocation of National Gas
Transmission Company Transgaz S.A. from Romania and Földgázszállító Zártkörűen
Működő Részvénytársaság (FGSZ) from Hungary, ANRE adopted by Decision no.
2080/07.10.2015 the method of cross-border costs allocation for the projects of common
interest on the first list of European Union, numbers 6.13, 6.14 and 7.1.5, as follows:
National Gas Transmission Company Transgaz S.A carries the costs for achieving
on the Romanian territory the project of common interest no. 7.1.5;

31.08.2016
Romanian Energy Regulatory Authority Page 11 of 109
Földgázszállító Zártkörűen Működő Részvénytársaság carries the costs for
achieving, on the Hungarian territory, the projects of common interest no. 6.14 and
6.15.
The adjusted percentage of the final regulated prices calculated as an average based
on the market share of each licensed operator performing the natural gas supply on the
regulated market were for April-May 2015 period about (-4%) and starting to July 1,
2015 about (11%). As a result, in 2015, regulated prices for the natural gas supply
recorded an average growth of about 7% for the household’s customers, mainly reflecting
the amendment of the price for the internal gas production according to the timetable for
phasing out regulated prices. Since 1 January 2015 there are no longer regulated prices
for non-households customers;
On the regulated market, in 2015, the regulated final customers were supplied by 39
suppliers; the total number of the regulated final customers was 3292505, representing
only the regulated household customers (5891 household customers switching the
suppliers), and the gas amount supplied to them was 30,026.953 GWh (31% less than in
2014);
On the competitive market, 74 suppliers have activated. The total consumption was
81,217.261 GWh (up from 2014 by approx.11%);
At the end of 2015, there were 188156 final customers who have switched the suppliers
on the competitive market, compared to 10558 in 2014, representing an increase of
approx. 10 percentage points to the real degree of gas market opening compared to 2014,
which reached in 2015 about 66% of the total consumption;
Starting with 1 October 2015, there were approved the regulated revenue, the total
revenue and the transmission tariffs for the gas transmission through NTS, valid from 30
September 2016. The monopoly tax and the tax on special constructions represent a
significant share in the structure of the transmission tariffs.
2.3. Consumer protection and dispute settlement in electricity and gas
Compared to the situation presented in 2014, in 2015 the review of the regulatory framework
for the supply of the last resort in electricity was completed. Among others new models for
bill and consumption convention were introduced.
In the same time, the Framework - Procedure on the obligation of the suppliers to solve the
electricity and natural gas consumer’s complaints (ANRE Order no. 16/2015) was approved,
setting out the steps on recording, analysing, measures and handling the customer’s
complaints by electricity and natural gas suppliers. The procedure is applied for the following
activities: contracting, billing the consumption of the energy, price and tariffs offers,
continuity of supply, ensuring the quality of the supplied energy, operation of the metering
unit, switching the supplier, end-customer information in accordance with the legislation
requirements, handling the complaints against the supplier made by the customers regarding
the non-compliance with the legislation, solving other complaints of the final customers.
ANRE amended the Regulation on information for the electricity and natural gas final
customers (ANRE Order no. 96/2015) that aimed a greater accountability of suppliers to
inform correctly, completely and specifically their final customers. It was also established a

31.08.2016
Romanian Energy Regulatory Authority Page 12 of 109
unique system of electricity and gas suppliers reporting on the informing activity of the final
customers, specifying the content of the report and the mode of sending the data and the
documents to ANRE.
ANRE amended the Performance Standard for electricity supply (ANRE Order no.
118/2015). The main changes are related to:
a) monthly sending of the statistical indicators by the electricity suppliers, revision of the
guaranteed levels of the performance indicators and increase the compensations for the final
customers in case of non-compliance of these levels, thus discouraging the suppliers not to
meet their obligations;
b) the compensations in case of non-guarantees levels is paid by the supplier of the last resort
to the household customers and small non-household customers, on the supplier initiative. To
the high non-household customers the compensation is paid at the written request to the
supplier within 30 calendar days from the fulfilment of the conditions for granting the
compensation. Compensations for failure of performance indicators shall be paid by suppliers
of the last resort only in case of consumers supplied under universal service because it is a
guaranteed supply service.
ANRE also amended the Procedure on granting customers compensations for damaged
receiver appliances due to an accidental over voltage on the network operator fault (Order
no. 177/16.12.2015).
Considering the phasing out process of the gas regulated prices (for the non-household
customers starting with 1 January 2015, respectively 1 July 2021 for the household
customers) and the competition development in the market, it was necessary a set of
legislative measures to ensure the access of the final customers to the information regarding
gas commercial supply conditions in the pre-contractual stage and in the contractual stage.
Compared to 2014, the legislativ framework was completed with the amendments of the
ANRE Order no. 107/2015 to facilitate the process of swiching the supplier for the non-
househols customers.
As a result of the inspections, 828 official reports for finding and sanctioning were drawn, for
11 individuals and 817 companies with the fines amounting to 40.151 million RON. During
2015, a number of 3625 complaints were registered to ANRE and solved.
31.08.2016
Romanian Energy Regulatory Authority Page 13 of 109
3. Electricity market
3.1. Network regulation
3.1.1. Unbundling
ANRE Decision no. 1788/12.08.2015 approved the preliminary certification of C.N.
Transelectrica S.A. as national transmission and system operator according to the ownership
unbundling model.
The certification decision and the documents issued for approval have been notified to the
European Commission. According to the Article 3 paragraph (1) of Regulation (EC) No.
714/2009, the European Commission reviewed the notified decision and issued the final
Opinion C (2015) 7053 of 10/12/2015.
Within two months from the receipt of the opinion of the European Commission, the term
provided for under this regulation, ANRE has expanded the supervision on C.N.
Transelectrica S.A. in order to take into account mainly the observations stated in the Opinion
for taking the final decision regarding the certification of the transmission system operator
according to the model of ownership unbundling. Following the findings of the analysis,
ANRE approved the final certification of C.N. Transelectrica SA, according to the model of
ownership unbundling, as national transmission and system operator, by issuing Order no.
164/2015. On 10/12/2015, ANRE notified the European Commission on the approval of C.N.
Transelectrica S.A. as transmission and system operator in Romania in accordance with
Article 10 of the Electricity Directive.
ANRE is monitoring, according to the law, the activity of distribution system operators, part
of an economic operator vertically integrated, on the implementation of the measures to
ensure excluding discriminatory practices and to establish specific obligations of the
employees of such economic operators in order to achieve the independence objective. In this
regard it was issued ANRE Order no. 5/2015 approving the Regulation on monitoring by
ANRE compliance programs established by the electricity distribution operators. The
Regulation contains a set of measures which the distribution system operator must establish,
without limitation, on the compliance program. By law, the distribution operator shall appoint
a person or a body called/designated as compliance officer to ensure proper monitoring of the
compliance program. The Regulation contains the compliance duties and the minimum
criteria on this nomination. The Regulation contains rules on the content and rules for format
of the compliance program, respectively, of the compliance report, so as to facilitate to ANRE
the monitoring process of the compliance programs. By applying the regulation, in 2015,
ANRE managed the acceptance processes for the compliance officers appointed by the
distribution operators.
At the end of 2015, ANRE received the reports of the compliance officers related to the year
2015 from the 8 distribution operators concessionaires.
CN Transelectrica SA administrates and operates the transmission power system and ensures
electricity exchanges among the countries in the Central and Eastern Europe as ENTSO-E
member (European Network of Transmission System Operators for Electricity). The length
of overhead electricity networks operated by CN Transelectrica SA is of approx. 8775 km.

31.08.2016
Romanian Energy Regulatory Authority Page 14 of 109
The ownership structure of CN Transelectrica SA in June 30, 2016 is as follows: 58.688
% – the Romanian state, 30.101% - other corporate shareholders, 6.75% - other shareholders,
physical persons and 5.134% - S.I.F Oltenia. The company has been listed on the Bucharest
Stock Exchange since August 2006.
In 2015, in the Romanian electricity market have operated a total of 49 electricity distribution
operators, from which 8 are serving over 100,000 customers. All 8 companies have completed
the legal separation of the distribution activities of electricity supply. Electricity distribution
operators with less than 100,000 customers do not have the obligation to legally unbundle the
distribution activity from other company activities in accordance with Directive 72/2009/EC
on common rules for the internal electricity market.
The ownership structure of the 8 distribution operators with more than 100,000 consumers is
as follows:
1. SC CEZ Distribuţie SA.: CEZ A.S. – holding 99.9999986019 % share capital, CEZ
POLAND DISTRIBUTION B.V. - holding 0.0000013981 % share capital;
2. SC Enel Distribuţie Banat SA: Enel Investment Holding B.V. - holding 51.0036 % of
shares, S.C. Electrica S.A. - holding 24.8683 % of shares, Fondul Proprietatea S.A. -
holding 24.1281 % of shares;
3. SC Enel Distribuţie Dobrogea SA: Enel Investment Holding B.V.- holding 51.003 % of
shares, Societatea de administrare a participaţiilor în energie (SAPE) S.A. - holding 24.903 %
of shares, Fondul Proprietatea S.A. - holding 24.094 % of shares;
4. SC Enel Distributie Muntenia SA: Enel Investment Holding B.V – holding 64.4251 % of
shares, Societatea de administrare a participațiilor în energie (SAPE) S.A. - holding 23.5749
% of shares, S.C. Fondul Proprietatea S.A. – holding 12 % of shares;
5. SC E.ON Moldova Distribuţie SA: E.ON Romania S.R.L. – holding 61.7905% of shares;
Energy Ministry – holding 13.5147% of shares, Fondul Proprietatea S.A. – holding 18.3474%
of shares, Societatea de administrare a participaţiilor în energie (SAPE) S.A. -
holding 6.3474% of shares;
6. SC FDEE Electrica Distribuţie Transilvania Sud SA, SC FDEE Electrica Distribuţie
Transilvania Nord SA and SC FDEE Electrica Distribuţie Muntenia Nord SA, with the
following ownership structure: S.C. Electrica S.A. – holding 78 % of shares and Fondul
Proprietatea S.A. - holding 22 % of shares.
The transmission and distribution operators have their own offices, logos and webpages.
The general conditions associated with the distribution service licenses for electricity
distribution operators granted by ANRE for the concessionaires were approved by Annex 1 to
ANRE Order no. 73/2014, published in the Official Gazette of Romania, Part I, no.
599/08.12.2014, the 8 concessionaire obligations to respect them are required by individual
administrative decisions issued by ANRE. Art. 49 ÷ 51 of Annex 1 sets the distribution
operators duties on ensuring independence, in accordance with the legal requirements for
unbundling of the distribution activity in relation to the supply of electricity, including
obligations on keeping separate identity for the economic actors affiliates (art. 51: "in
performing the service of electricity distribution, including communication and publicity, the
licensee is bound not to create confusion about the different identity of the operators
affiliated.").
Financial statements of the TSO and distribution operators are published separately.

31.08.2016
Romanian Energy Regulatory Authority Page 15 of 109
The regulatory authority establishes detailed rules on costs separation. These rules are
included in the conditions of the licenses granted for transmission and distribution activities
and in the specific methodologies for calculating network tariffs. The normative acts in force
provide for sanctions in case of breach of requirements on unbundling.
3.1.2. Technical functioning
Balancing Market
The balance between electricity demand and production is established on a commercial basis,
in real time, on the Balancing Market (BM). Operating rules for the balancing market were
established by ANRE Order no. 25/2004 on the approval of the wholesale market
Commercial Code, as amended and supplemented.
To ensure availability of enough electricity to balance the system, the TSO contracts reserves
(ancillary services) for periods of one year maximum (regulated contracts or concluded on the
ancillary services market). Each contract for reserves establishes the obligation of the seller to
hourly provide the TSO a certain amount of reserves, of a particular type, the energy
corresponding to the power reserved must be available on BM.
BM begins the day before, after physical notifications were accepted by TSO and ends on the
end of the day of delivery. BM is a compulsory market, which means that participants who
operate dispatchable units are obliged to offer all available electricity on this market. The
balancing energy corresponding to secondary, fast tertiary and slow tertiary regulation is
traded on BM.
The balancing energy is ensured by:
a) power increase, respectively by increasing production of a dispatchable unit or by reducing
consumption of a dispatchable consumer or a pumped storage power plant that is
registered as dispatchable consumption;
b) power decrease, respectively by reducing production of a dispatchable unit or by increasing
consumption of a pumped storage power plant registered as dispatchable consumption.
BM participants must submit daily offers for the amount of balancing energy they can make
available in each dispatching interval (60 minutes) to increase and reduce power.
All valid offers on the balancing market establish the obligation of a BM participant to deliver
the amount tendered on BM when it receives order from the TSO.
Only actually delivered quantities of balancing energy are paid on the BM. Payment for
balancing energy corresponding to secondary regulation is based on the marginal price of the
selected offers, and for the tertiary regulation, payment is made at the price of the selected
offer.
Each license holder must assume financial responsibilities towards the TSO for ensuring the
physical balance between the measured production, the scheduled purchases and imports of
electricity, on the one hand and measured consumption, scheduled sales and electricity
exports, on the other hand, for one or more points of connection and/or one or more
transactions. Balancing responsibility is assumed by the Balancing Responsible Party (BRP),
established by the TSO at the license holders’ requests. A license holder can register as a BRP
or can transfer the balancing responsibility to an existing BRP.

31.08.2016
Romanian Energy Regulatory Authority Page 16 of 109
If a BRP is in negative imbalance, it will pay the amount of electricity bought from the TSO
for balancing, with the hourly price for energy deficit, and if a BRP is in positive imbalance, it
will sell the excess energy to the TSO at the hourly price for power surplus.
Surplus energy price is determined for each dispatching interval as the ratio of incomes
resulting from the balancing of the system and the amount of balancing energy supplied to
provide reduction of power during the respectively dispatching period. Energy deficit price is
determined for each dispatching interval as the ratio of payments to balance the system and
the amount of balancing energy supplied to provide power increase in the respectively
dispatching interval.
Imbalance settlement is made after determining the measured values for all measurement
points of the participants, settling disputes/ approval by the participants of the values and their
aggregation on BRPs, according to the aggregation formulas announced to the measurement
operator; under these conditions, imbalance settlement is done within about 2 months after the
end of the month of delivery. The market model leads to net incomes/costs for the TSO after
the system balancing, and their calculation and redistribution to suppliers are made at the
same time, proportionally to the consumption of the consumers supplied by each of them.
A single balancing area is defined in Romania, operated by a single licensed system
operator/balancing market operator, CN Transelectrica SA. Interaction with other control
areas is made through exchanges of mutual aid between TSOs, and not through the acceptance
of offers that are to be integrated into a common merit order.
Performance standards and network connection issues
The performance standard for the transmission service was revised in 2007, being
approved by ANRE Order no. 17/2007.
Starting 2016, the analysis of performance indicators regarding the quality of service will be
made in accordance with the Performance Standard for electricity transmission service and
system service, approved by ANRE Order no. 12/2016.
The main performance indicator concerning the continuity of electricity transmission service
is the average interruption time - AIT, which represents the equivalent average period of
time, expressed in minutes, in which the power supply was interrupted. This indicator’s
evolution is presented below:
Year 2005 2006 2007 2008 2009 2010 2011 2012 2013 2014 2015
Average interruption
time (AIT), min/year 4.43 1.19 0.86 1.79 0.82 3.10 1.06 1.53 0.35 0.82 0.36
From 1 January 2008 the Performance standard for the electricity distribution service is
applied, approved by ANRE Order no. 28/2007. The standard requires distribution operators
to monitor continuity of electricity supply, which requires registration of all long outages (any
interruption lasting more than 3 minutes).
Starting 2016, the analysis of performance indicators regarding the quality of service will be
made in accordance with the Performance standard for the electricity distribution service,
approved by ANRE Order no. 11/2016.
Monitoring the continuity of electricity supply is realized by calculating the SAIFI and SAIDI
indicators for each voltage level separately for urban and rural areas.
31.08.2016
Romanian Energy Regulatory Authority Page 17 of 109
SAIFI – System Average Interruption Frequency Index is the average interruption number
borne by consumers supplied by the DSO. It is calculated by dividing the total number of
consumers interrupted for over 3 minutes, to the total number of consumers supplied.
SAIDI – System Average Interruption Duration Index is the average interruption time of
consumers at DSO level (weighted average). The indicator is calculated by dividing the
cumulative long interruptions to the total number of consumers supplied (served) by DSO.
Depending on the type of interruption, SAIFI and SAIDI indicators are classified as follows:
a) planned outages,
b) unplanned outages caused by force majeure,
c) unplanned outages caused by users,
d) unplanned outages, excluding those caused by force majeure and by users (due to DSO).
The most important are the values of the indicators for planned interruptions (a) and for
unplanned interruptions (d), due to distribution operators. In fact, regularly, the values of the
indicators for cases (b) and (c), which are not due to DSO, are very low.
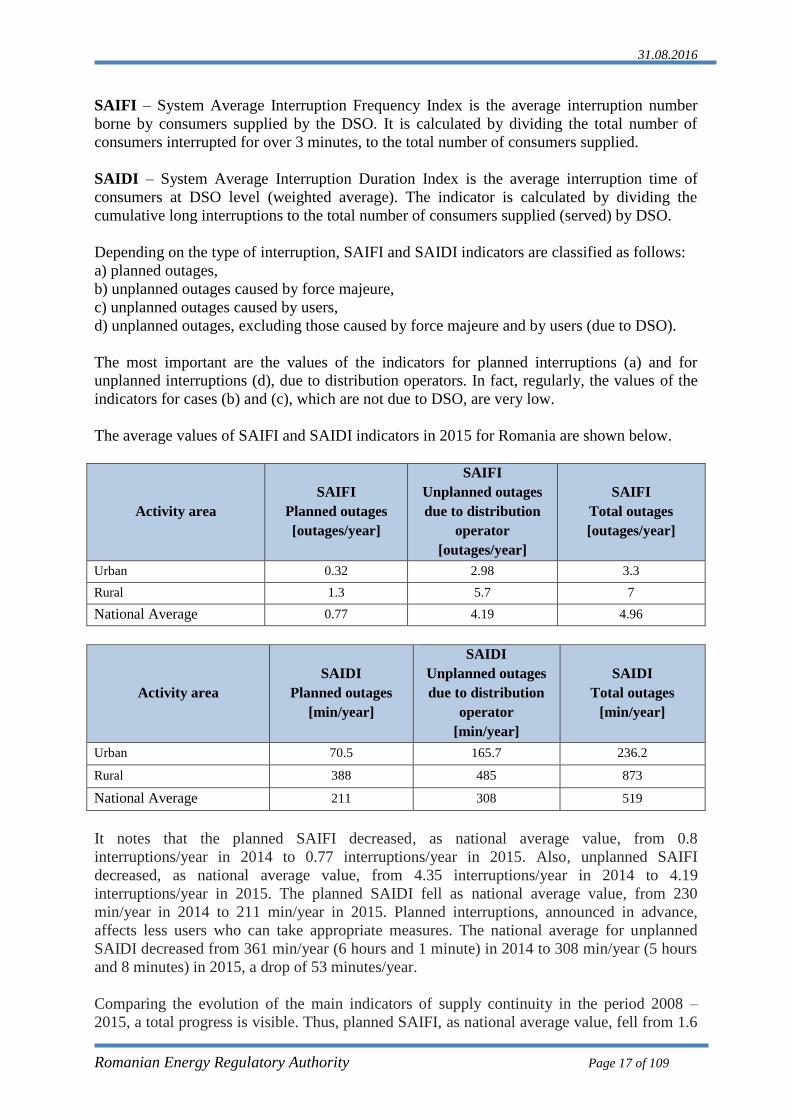
The average values of SAIFI and SAIDI indicators in 2015 for Romania are shown below.
Activity area
SAIFI
Planned outages
[outages/year]
SAIFI
Unplanned outages
due to distribution
operator
[outages/year]
SAIFI
Total outages
[outages/year]
Urban 0.32 2.98 3.3
Rural 1.3 5.7 7
National Average 0.77 4.19 4.96
Activity area
SAIDI
Planned outages
[min/year]
SAIDI
Unplanned outages
due to distribution
operator
[min/year]
SAIDI
Total outages
[min/year]
Urban 70.5 165.7 236.2
Rural 388 485 873
National Average 211 308 519
It notes that the planned SAIFI decreased, as national average value, from 0.8
interruptions/year in 2014 to 0.77 interruptions/year in 2015. Also, unplanned SAIFI
decreased, as national average value, from 4.35 interruptions/year in 2014 to 4.19
interruptions/year in 2015. The planned SAIDI fell as national average value, from 230
min/year in 2014 to 211 min/year in 2015. Planned interruptions, announced in advance,
affects less users who can take appropriate measures. The national average for unplanned
SAIDI decreased from 361 min/year (6 hours and 1 minute) in 2014 to 308 min/year (5 hours
and 8 minutes) in 2015, a drop of 53 minutes/year.
Comparing the evolution of the main indicators of supply continuity in the period 2008 –
2015, a total progress is visible. Thus, planned SAIFI, as national average value, fell from 1.6
31.08.2016
Romanian Energy Regulatory Authority Page 18 of 109
interruptions/year in 2008 to 0.77 interruptions/year in 2015 and unplanned SAIFI, as national
average value, was reduced to 6.7 interruptions/year in 2008 to 4.19 interruptions/year in
2015. The planned SAIDI, as national average value, was reduced from 386 min/year in 2008
to 211 min/year in 2015 and unplanned SAIDI decreased of 639 min/year (10 hours and 39
minutes) in 2008 to 308 min/year (5 hours and 8 minutes) in 2015, recording a decrease of
331 min/year (5 hours and 31 minutes).
The procedures and steps for connection to the network and the way of establishing
connection tariff are regulated by Regulation on connecting users to public electricity
networks, approved by ANRE Order no. 59/2013, with subsequent amendments, by
Regulation on establishing the solutions for connecting users to public electricity networks,
approved by ANRE Order no. 102/01.07.2015, by Framework contracts for users’ connection
to public electricity network, approved by ANRE Order no. 9/2006 and amended by ANRE
Order no. 11/2015 and by the Methodology for setting tariffs for connecting users to public
electricity network, approved by ANRE Order no. 11/2014, as amended and supplemented.
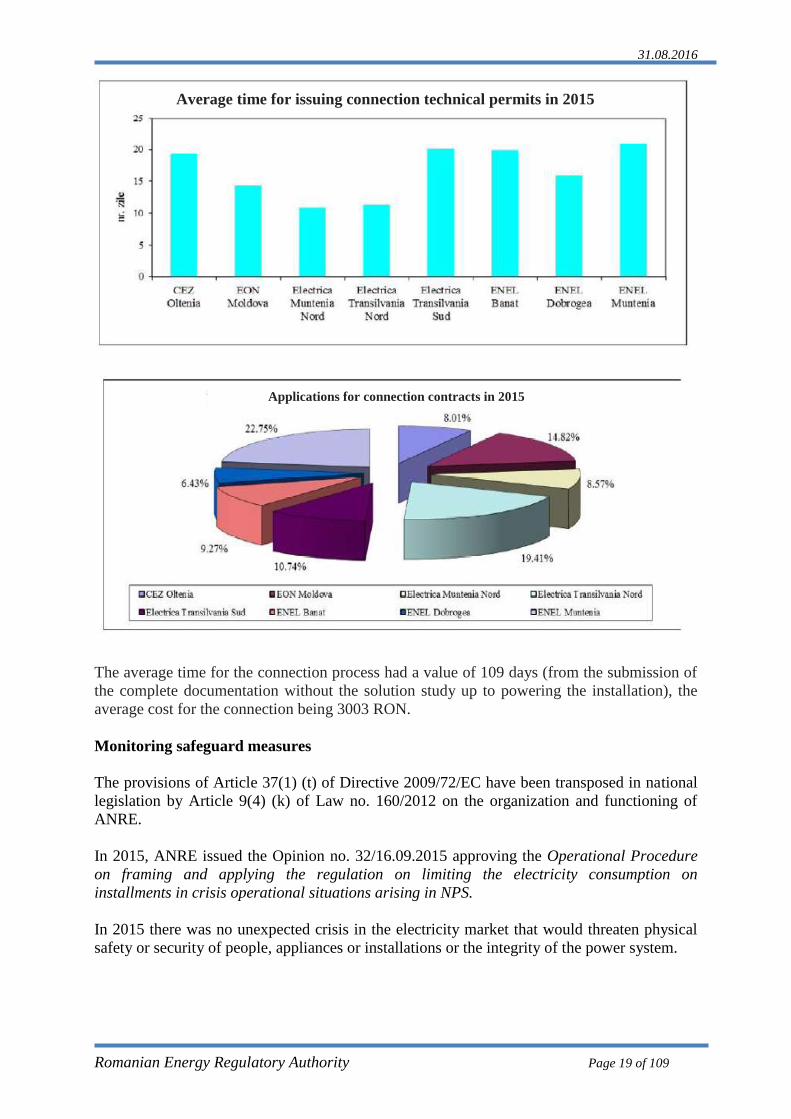
The distribution service indicators such as average time of issuing connection technical
permits or issuing connection contracts are monitored based on the performance standard
requirements.
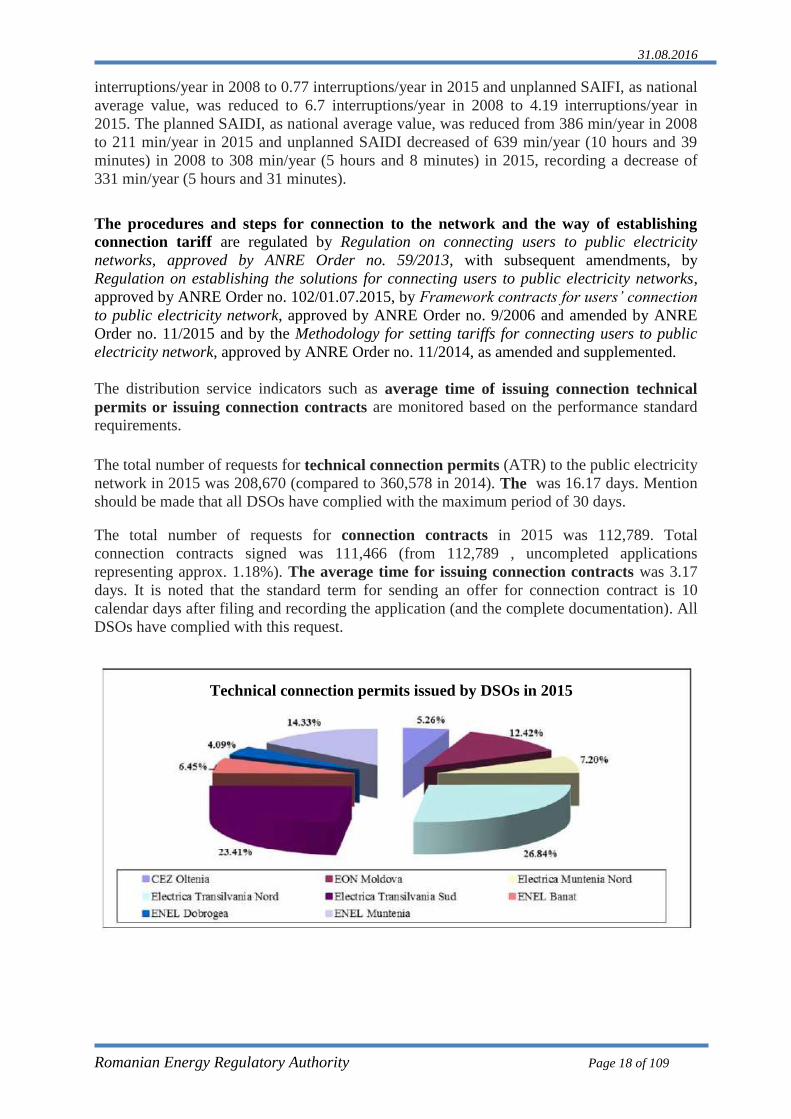
The total number of requests for technical connection permits (ATR) to the public electricity
network in 2015 was 208,670 (compared to 360,578 in 2014). The was 16.17 days. Mention
should be made that all DSOs have complied with the maximum period of 30 days.
The total number of requests for connection contracts in 2015 was 112,789. Total
connection contracts signed was 111,466 (from 112,789 , uncompleted applications
representing approx. 1.18%). The average time for issuing connection contracts was 3.17
days. It is noted that the standard term for sending an offer for connection contract is 10
calendar days after filing and recording the application (and the complete documentation). All
DSOs have complied with this request.
Technical connection permits issued by DSOs in 2015
31.08.2016
Romanian Energy Regulatory Authority Page 19 of 109
The average time for the connection process had a value of 109 days (from the submission of
the complete documentation without the solution study up to powering the installation), the
average cost for the connection being 3003 RON.
Monitoring safeguard measures
The provisions of Article 37(1) (t) of Directive 2009/72/EC have been transposed in national
legislation by Article 9(4) (k) of Law no. 160/2012 on the organization and functioning of
ANRE.
In 2015, ANRE issued the Opinion no. 32/16.09.2015 approving the Operational Procedure
on framing and applying the regulation on limiting the electricity consumption on
installments in crisis operational situations arising in NPS.
In 2015 there was no unexpected crisis in the electricity market that would threaten physical
safety or security of people, appliances or installations or the integrity of the power system.
Average time for issuing connection technical permits in 2015
Applications for connection contracts in 2015

31.08.2016
Romanian Energy Regulatory Authority Page 20 of 109
Report on connection, access and dispatching regimes for E-RES. Balancing
responsibility for E-RES
During 2015, the gross installed capacity in the power plants recorded a minor growth of
0.2%, compared to 2014. The gross installed capacity in the renewable plants increased in
January-December 2015 compared to the similar period of the last year by approx. 3% (145
MW).
The transmission system operator and/or distribution operators ensure the transmission,
distribution, as well as priority dispatching of the electricity generated from renewable
sources for all renewable energy sources generators, regardless of capacity, on the basis of
transparent and non-discriminatory criteria, with the possibility of amending the notifications
within the business day, according to the ANRE approved methodology so that the limitation
or interruption of electricity production from renewable energy sources shall be applied only
in exceptional cases where this is necessary for ensuring the stability and security of the
National Power System.
Guaranteed access to the network is ensured for the electricity contracted and sold on the
electricity market that is benefiting from the support system for renewable energy sources.
Priority access to the network is ensured for electricity contracted and sold at regulated
price (generated in power plants with an installed capacity of less or equal 1 MW per plant or
in the case of high efficiency cogeneration from biomass, of 2 MW per plant).
Electricity produced from renewable sources is priority dispatched.
Production units using dispatchable renewable sources are responsible for payment of the
induced imbalances.
3.1.3. Network and connection tariffs
Tariffs for electricity transmission applied in 2015 by C.N. Transelectrica S.A., as
transmission and system operator were approved by ANRE Order no. 51/2014 (for the period
1 July 2014-30 June 2015), ANRE Order no. 89/2015 and ANRE Order no. 93/2015 (for the
period 1 July 2015-30 July 2016). These tariffs were determined based on the Methodology
for setting tariffs for electricity transmission service, approved by ANRE Order no. 53/2013,
as amended and supplemented.
For the period 1 July 2015-30 June 2016 the tariffs for the electricity transmission service are
the followings:
- average transmission tariff – 20.97 RON/MWh, representing a decrease by 6.8 %
compared to the previous tariff period, respectively 1 July 2014 – 30 June 2015,
- average tariff for the injection of electricity in the networks (TG) - 2.57 RON/MWh,
with a variation between 0 and 4.57 RON/MWh for the 7 injection zones; thus,
transmission tariff - the component for the injection of electricity in the networks (TG)
decreased by a percentage between 58% for Dobrogea Renewables zone and 100% for
the zones Transilvania Nord, Central Transilvania and Moldova; TG tariffs maintained
significant values in Dobrogea renewables, Dobrogea and Oltenia zones, surplus areas
in terms of balance production/consumption;

31.08.2016
Romanian Energy Regulatory Authority Page 21 of 109
- average tariff for the extraction of electricity from the networks (TL) – 18.14
RON/MWh, with a variation between 15.26 and 19.57 RON/MWh for the 8 extraction
zones; thus, the component for the extraction of electricity from the networks (TL)
increased up to 58 % for all extraction zones; the largest growth was recorded in
Oltenia, but the tariff remained to the lowest value for this zone.
Evolution of the average transmission tariff in the period 2008-2016 is presented in the
following figure:
The decrease by 6.8 % of the average transmission tariff starting with 1 July 2015 compared
to tariff approved for the period 1 July 2014 – 30 June 2015 was caused by the increase of
electricity consumption and export as well as ANRE’s corrections related to the end of the 1st
semester of 2014 and estimations of the achievements on the first year of the regulatory
period.
Tariffs for ancillary services and regulated prices for producers supplying ancillary
services
Ancillary services tariffs charged during 2015 by C.N. Transelectrica S.A. as system operator
were determined based on the Methodology for setting tariffs for ancillary system approved
by ANRE Order no. 87/2013 and approved by ANRE Order no. 51/2014 for the period 1
January – 30 June 2015 and by ANRE Order no. 93/2015 for the period 1 July 2015-30 June
2016.
Starting with 1 July 2015, the following tariffs were approved:
- tariff for system service – 13.75 RON/MWh, with two components:
- ancillary service tariff – 12.58 RON/MWh and
- functional system services tariff - 1.17 RON/MWh.
During 2014-2016, the tariff for functional system services has had a downward trend mainly
due to cost reduction depreciation and return on capital compared to the forecast made for the
tariff in force in the previous period, due to the failure of the forecasted investments for
system service.
Also, the tariff for ancillary services recorded a decrease of 0.74 RON/MWh for the period 1
July 2014 – 30 June 2015 compared to the tariff approved for the 1st semester of 2014. The
15,3316,13
17
18,77 18,77
21,1622,16 22,5
20,97
0
5
10
15
20
25
2008 2009 2010 2011 2012 2013 ian-iun2014
iul 2014-iun 2015
iul 2015-iun 2016
lei/
MW
h
Evoluția tarifului mediu de transport în perioada 2008-2016

31.08.2016
Romanian Energy Regulatory Authority Page 22 of 109
reduction of the tariff for ancillary services was due to the transfer, in circumstances
mentioned by the Methodology, for efficiency gain estimated to be registered by C.N.
Transelectrica S.A. through effective management for ancillary services in the period 1
January – 30 June 2014 for the system services customers.
For the period 1 July – 30 June 2016, the tariff for the ancillary services recorded a slight
increase (0.04 RON/MWh) compared to the previous tariff period due to the ANRE approval
of the transmission system operator’s request to increase the system reserves to ensure the
safe operation of the power system (higher by 4% for BRS, by 2% for RTR and lower for
RTL by 7% compared to the previous period) and to the increase of consumption forecast.
According to the provision of the Methodology for setting the tariff for the system services
approved by ANRE Order no. 87/2013, ancillary services are purchased on competitive basis,
excepting those provided under the provisions set by specific legislation and by the producers
selected by the TSO so as to avoid the dominant position on the electricity competitive
market. Thus, to settle the tariff for the ancillary services there were implemented the
provisions of Government Decision no. 138/03.04.2013 on measures for security of electricity
supply and Government Decision no. 941/2014 for the amendment of art. 4 of Government
Decision no. 138/03.04.2013 regarding the obligation of supply ancillary service by S.C.
Complexul Energetic Hunedoara S.A., at a power value of at least 400 MW (GD no.
138/2013), respectively 500 MW (GD no. 941/2014) and by S.C. Complexul Energetic
Oltenia S.A. (GD no. 138/2013), at a power value of at least 600 MW (until 1 July 2015),
under regulations issued by ANRE.
It should be noted that the GD no. 1178/2014 regarding the measures of safety and security
for the operation of the Power System during the period 1 January - 28 February 2015 and
GD no. 1019/2015 approving the measures for achieving the safety stocks of the NPS
regarding the fuels for the cold season and the water volume in reservoirs, called Winter
Energy Program to ensure the safe and secure functioning of the NPS during the period 1
January-31 March 2016 and other measures regarding the safe and secure functioning of the
NPS settle that the transmission system operator shall acquire additional power reserves
amounts to the amounts determined in accordance with regulations.
By these GDs it was set that the additional reserves for the secondary and rapid tertiary
reserve shall be acquired on the competitive market, and the slow tertiary reserve supplied by
groups operating on alternative fuel - fuel oil shall be acquired under ANRE regulated prices
in accordance with the provisions of the methodologies.
Given the specified modifications of the system service tariff’s components, the following
figure presents the evolution of the average annual tariff for the system services during 2008-
2016:
16,84
20,08 20,68
12,85
10,2112,17
15,0213,96 13,75
0
5
10
15
20
25
2008 2009 2010 2011 2012 2013 ian-iun 2014 iul 2014-iun 2015 iul 2015-iun 2016
lei/MWh
Evoluția tarifului mediu anual pentru serviciul de sistem în perioada 2008-2015, inclusiv
în anul tarifar 2015-2016

31.08.2016
Romanian Energy Regulatory Authority Page 23 of 109
Regulated transit tariff charged by the transmission system operator for the electricity
transit service to/from the perimetrical countries through the national power system
The regulated transit tariff charged by the transmission system operator for the electricity
transit service to/from the perimetrical countries through the national power system was
approved by ANRE Order no. 83/02.06.2015 and its value was 0.6 EUR/MWh, VAT
exclusive.
Transmission system operators charge the regulated transit tariff for the electricity transit
service to/from the perimetrical countries through the national power system according to the
compensation mechanism established in accordance with the provisions of art. 13 of
Regulation (EC) no.714/2009 of the European Parliament and of the Council of 13 July 2009
regarding the conditions for network access for electricity cross-border exchanges and
repealing Regulation (EC) no. 1228/2003 and Regulation (EC) no. 838/2010 of the
Commission from 23 September 2010 on the establishment of the guidelines concerning the
compensation mechanism among the transmission system operators and the common
regulatory approach for the transmission charges.
The transit tariff is calculated yearly and is approved by ENTSO-E according to the tasks set
by ITC multiannual Contract for settlement and clearing signed on 3 March 2011 by
transmission system operators part of the mechanism and by ENTSO-E.
The transit tariff is calculated ex-ante, based on a compensating fund for the electricity
transits effects, respectively the infrastructure costs and costs of electricity losses due the
transits.
Romania applies the transit tariff for the import/export energy from/to Ukraine and Moldova
(only when operating in synchronism with NPS with a part of the Moldavian energy system).
The transmission system operators charge the regulated transit tariff from the companies that
conclude contracts for the electricity transit service to/from the perimetrical countries.
Tariffs for electricity distribution
Distribution tariffs are monomial (RON/MWh) and differentiated by three voltage levels:
high voltage (110 kV), medium voltage, low voltage and by distribution operators. The
regulator approves the distribution tariffs for each distribution operator. Distribution tariffs
are calculated according to a “tariff cap basket” methodology. Based on this regulation
method, the regulation periods are set for 5 years, except the first period which was of only 3
years (2005-2007).
Specific electricity distribution tariffs charged by the distribution operators
concessionaires in 2015, representing the second year of the third regulatory period 2014-
2018, were approved by ANRE Orders no. 149 up to no. 156 in 2014.
At the end of 2015, ANRE approved through Orders no. 168 to 175/2015 the specific tariffs
for electricity distribution service which applies to the distribution operators
concessionaires in 2016. To determine these tariffs there were applied the provisions of the
Methodology for setting tariffs for electricity distribution service, approved by ANRE Order
no. 72/2013, as amended and supplemented. There were determined and applied closing
corrections to the last four months of 2014 and those resulting from the estimated data
expected to be completed in 2015.
The corrections applied to determine the regulated tariffs for the electricity distribution
service approved at the end of 2015 are shown in the following table:

31.08.2016
Romanian Energy Regulatory Authority Page 24 of 109
Operator Corectie 2014 Corectie 2015 Corectie 2016* Total corectii
Enel Distributie Muntenia -26.640.806 -50.314.767 -17.026.260 -93.981.834
Enel Dobrogea Banat -13.244.285 -31.577.478 -10.442.324 -55.264.087
Enel Distributie Dobrogea -6.260.916 -24.851.592 -8.721.329 -39.833.837
CEZ Distributie -7.412.872 -55.117.241 -19.639.168 -82.169.281
E.ON Distributie Romania -7.637.785 -41.912.553 -13.045.992 -62.596.329
Electrica Distributie Muntenia Nord -4.413.198 -63.262.758 -13.615.108 -81.291.063
Electrica Distributie Transilvania Nord -571.239 -40.204.198 -12.322.818 -53.098.255
Electrica Distributie Transilvania Sud -1.416.825 -58.458.420 -12.293.684 -72.168.930
*Corectie aferenta modificarii RRR pentru anul 2016, conform Ord.ANRE 146/2014
LEI - termeni nominali ai anului 2015
Thus, specific average national tariff, on the voltage levels, approved for the concessionaire
electricity distribution operators, for 2016, are:
- specific average tariff for high voltage –19.24 RON/MWh,
- specific average tariff for medium voltage –37.53 RON/MWh,
- specific average tariff for low voltage –115.80 RON/MWh.
It is found that average tariffs decreased (-11.35 % variation of high voltage, - 11.90 %
medium voltage, - 12.84 % low voltage, relevant to households).
The national average tariff for 2016 of 108.03 RON/MWh decreased by approx. 12.07%
compared to the average national tariff in 2015 of 122.86 RON/MWh.
The following figure shows the evolution of the specific average tariffs for electricity
distribution for the period 2008-2016:
Share of electricity distributed nationwide in 2015 (approx. 42.4 TWh) by the eight
concessionaire distribution operators is shown in the following figure:

31.08.2016
Romanian Energy Regulatory Authority Page 25 of 109
Tariffs for the distribution service provided by operators other than concessionaire
distribution operators Tariffs for the distribution service provided by operators other than concessionaire
distribution operators are approved by ANRE at the request of distribution system operators
that own, operate, maintain and develop distribution networks and platforms in industrial
parks or designated heritage areas and have connected users - beneficiaries of the distribution
service.
During 2015, the distribution tariffs were determined based on the Methodology for
determining the tariff for electricity distribution service done by operators other than
concessionaire distribution operators, approved by ANRE Order no. 21/2013.
The Methodology provides tariff setting by the "cost +" method, i.e. based on justified costs
and a regulated rate of return of up to 5%.
During 2015, ANRE approved 3 decisions concerning the tariff for electricity distribution
service provided by distribution operators, others than concessionaire distribution operators.
Tariffs for connection to the public networks
The tariffs payed by the consumers to the network operators for the connection to the
electricity networks are set by the networks operators according to the provisions of the
Methodology for setting connection tariffs for the users of the electricity public networks,
approved by ANRE Order no. 11/2014, amended and supplemented. The connection tariff
includes the following components:
TR - component for achieving adequate connection installation;
TU - component for the verification of the installation file and commissioning the facility, for
which they were set specific rates determined on the basis of general estimate for the average
case, representative for the type of installation.
CEZ
Distribuţie
15,1%
FDEE Electrica
Distribuţie
Transilvania Sud
13,3%
%
Enel Distribuţie
Dobrogea
8,4%
FDEE Electrica
Distribuţie
Muntenia Nord
15,4%
E.ON Moldova
Distribuţie
10,3%
FDEE Electrica
Distribuţie
Transilvania Nord
11,6%
%
Enel Distribuţie
Banat
9,8%
Enel Distribuţie
Muntenia
16,2%

31.08.2016
Romanian Energy Regulatory Authority Page 26 of 109
TI – participation component to the finance of the works for strengthening the grid needed to
evacuate the approved power (for connecting a generation place or consumption and
generation place), for which were set specific tariffs „i”, corresponding to the components of
a public electricity network.
In case of the connection of a consumption place to the distribution network of low and
medium voltage or connection of a place of production to the distribution network of low
voltage, size component TR of the connection tariff is determined based on the specific
indexes for achieving energy capacities on types of network elements, possible components of
an installation connection, according to scheme and standard conditions of achievement.
In case of connecting a consumer site to the distribution network of low and medium voltage,
the component value TU of the connection tariff is calculated based on specific rates.
Both specific tariffs and specific indices used to determine the tariffs for connecting users to
public electricity networks remained unchanged in 2015, being those approved by ANRE
Order no. 141/2014.
Tariffs of issuing/updating of the technical approvals for network connection, certificates
for network connection and location permits
In order to avoid undue charging of fees for activities related to the process of connection to
public electricity networks, ANRE approved by ANRE Order no. 114/2014, the regulated
tariffs for issuing/updating technical approvals for network connection, connection certificates
and location permits, which were determined according to the Methodology of calculating
these rates, approved by ANRE Order no. 61/2014.
3.1.4. Cross-border issues
Allocation of the NPS interconnection capacities with neighbouring systems is performed for
electricity import/export transactions and transit activities. On the borders with Hungary,
Bulgaria and Serbia, the allocation of interconnection capacities is performed based on a
market mechanism, bilaterally coordinated on both directions, for 100% of the allocation
capacity, through explicit or implicit auctions on long term (annual and monthly) and short-
term (daily and intra-day), depending on border and term.
On the Romania-Ukraine border, the allocation of interconnection capacity is organized
through explicit auctions on long term, the use of capacity obtained through bids being
subject to the written approval of Ukrenergo, the TSO in Ukraine. In the case of Romania-
Moldova border, the use of the interconnection capacity depends on the agreement of the
distribution operator on the area where the consumption island is located.
On the Romania-Hungary border, the auctions for long term allocation are explicit and are
organized by MAVIR (Hungarian TSO). For intra-day auctions, the allocation is also explicit
and is organized by CN Transelectrica SA, while in case of daily auctions the interconnection
capacity allocation is achieved implicitly, through RO DAM market coupling with spot
markets from Czech Republic, Slovakia and Hungary (4M Market Coupling Project); in the
event of the 4 markets decoupling for the day ahead, the capacity allocation is achieved by
explicit daily auctions organized by MAVIR ( the so-called shadow auctions).
On the Romania-Bulgaria border, the capacity allocation is explicit for all the time horizons;
the auction organizer for long term allocation is CN Transelectrica SA, and for the daily
auctions is ESO-EAD (Bulgarian TSO). Starting with November 2014, as a result of the

31.08.2016
Romanian Energy Regulatory Authority Page 27 of 109
amendment of the market rules in Bulgaria that do not allow intra-day cross-border
exchanges, this kind of auctions was not held anymore.
On the Romania-Serbia border, the capacity allocation is explicit, the auctions for long term
are organized by EMS (TSO in Serbia), and those for short term (daily and intra-day) are
organized by CN Transelectrica SA.
Setting the ATC (available transmission capacity) for daily and intra-day auctions uses the
principle of "netting" and participants are obliged to respect the principle of exclusive
partnership (1:1). Currency trading is the EUR.
The data published on the website www.transelectrica.ro and communicated by C.N.
Transelectrica S.A. in the monthly monitoring reports on the electricity markets show that at
the auction organized for the annual allocation of interconnection capacity, the biggest
prices registered were on export direction, on the borders with Hungary (4.66 EUR/h*MW),
with Serbia (4.60 EUR/h*MW) and with Bulgaria (2.88 EUR/h*MW).
The prices set from organizing monthly auctions varied depending on the direction. Thus, if
for import, the values were most of the time under 1 EUR/h*MW (on the border with
Hungary were zero every month), it was not the case for the export. The monthly variation of
the price on export direction was scored in the range 2.33-5.67 EUR/h*MW on the border
with Hungary, in the range 1.87-5.51 EUR/h*MW on the border with Serbia, the largest range
was registered on the border with Bulgaria, where the price for the monthly auctions varied
between 0.57-6.66 EUR/h*MW.
The prices set on daily explicit auctions on the borders with Bulgaria and Serbia varied
depending on the border, direction and auctioned time slot. The hourly prices registered on
import were, in general, lower than those for export, however, for 3 months in 2015, the
maximum hourly price on import direction from Bulgaria overcame 15 EUR/h*MW, while on
import from Serbia, the maximum monthly values were close to zero.
Instead, participants preference for exports to Bulgaria materialized in hourly prices of high
values obtained every month from organizing daily auctions. Maximum hourly prices varied
between 15-35 EUR/h*MW on the border with Bulgaria, the frequency of price above 20
EUR/h*MW being high (9 of 12 months). On the border with Serbia, although the prices were
generally lower, monthly maximum values were recorded at 15 month EUR/h*MW.
In 2015, the highest annual average values of the use of the total capacity allocated in the
auctions (calculated as the ratio of energy related to notified exchanges and corresponding
energy of the total capacity allocated to all participants) were registered for export on borders
with Hungary (98.12%), Serbia (96.05%) and Bulgaria (72.40%). In the case of import, the
use was reduced regardless of the border; the highest average value was recorded on the
border with Hungary (38.53%).
As a result of the allocation of interconnection capacity, over 95% of revenues from CN
Transelectrica SA came from long-term auctions (annual and monthly), the highest values
being recorded in particular in the auctions for capacity allocation on export direction on the
borders with Hungary, Serbia and Bulgaria. The value of the revenues from daily auctions
was reduced, most of them being made of income caused by congestion on Romania-Hungary
border, after the implicit daily allocations; it worth mentioning that the income from intra-day
auctions are close to zero.

31.08.2016
Romanian Energy Regulatory Authority Page 28 of 109
The frequency of congestions
Annual allocation of ATC
The frequency of congestions on annual allocation in 2015 on each border and exchange
direction was 100 % except the border with Ukraine on export direction, where the frequency
of congestions on annual NTC allocation was 0 %.
export RO import RO export RO import RO export RO import RO export RO import RO
Număr zile congestie 365 365 365 365 348 348 347 347
Număr zile retrageri linii de interconexiune (pe
granițele cu o singură linie de interconexiune)- - - - 17 17 18 18
Frecvența de apariție a congestiei la alocarea
anuală (%)100 100 100 100 100 100 0 100
Indice de severitate 5 5 5 5 5 5 0 5
Licitațiile anuale 2015Ungaria Bulgaria Serbia Ucraina
ATC monthly allocation
export RO import RO export RO import RO export RO import RO export RO import RO
Număr zile congestie 365 0 365 365 346 29 206 267
Număr zile retrageri linii de
interconexiune (pe granițele cu o
singură linie de interconexiune)
- - - - 17 17 18 18
Frecvența de apariție a congestiei la
alocarea lunară (%)100 0.0 100.0 100.0 99.4 8.3 59.3 76.9
Indice de severitate 5 0 5 5 5 1 3 4
Licitațiile lunare 2015Ungaria Bulgaria Serbia Ucraina
ATC daily allocation
On the border with Ukraine, there is no common daily allocations.
export RO import RO export RO import RO export RO import RO export RO import RO
Număr ore congestie 2011 166 6416 5081 3872 1087 - -
Număr ore licitație 2111 6105 7591 8760 5162 8329 - -
Număr ore retrageri
linii de interconexiune
(pe granițele cu o
singură linie de
interconexiune)
- - - - 408 408 432 432
Frecvența de apariție
a congestiei la
alocarea zilnică (%)
95.3 2.7 84.5 58.0 75.0 13.1 - -
Indice de severitate 4 1 4 3 3 1 - -
Licitațiile zilnice 2015Ungaria Bulgaria Serbia Ucraina
ATC intra-day allocation
In 2015, on the borders with Hungary and Serbia, there were no congestions on the bilateral
coordinated intra-day allocations, except for four time slots on the border with Hungary, on
direction export and a single time slot on the border with Serbia, on export direction.
The congestion severity index of the annual, monthly and daily allocation on each border and
exchange direction for 2015 is presented below:

31.08.2016
Romanian Energy Regulatory Authority Page 29 of 109
Remarks regarding export:
- the most congested borders were the borders with Bulgaria, Serbia and Hungary;
- the less congested border was the border with Ukraine.
Remarks regarding import:
- the most congested border was the border with Bulgaria;
- the less congested border was the border with Ukraine.
The highest values of congestion frequency on NTC monthly allocation in 2015 were reached
on export direction to Hungary (100%, similar to 2014) and Bulgaria (100% compared to
97.5% in 2014).
Reporting revenues from congestions in the period 1 July 2015-30 June 2016 of the TSO
is done in accordance with paragraph 6.5 of Appendix 1 - Guidelines on the management and
allocation of available transfer capacity of interconnections between national systems, from
the Regulation (EC) no. 714/2009 of the European Parliament and of the Council of 13 July
2009 on conditions for access to the network for cross-border electricity exchanges and
repealing Regulation (EC) No. 1228/2003.
In accordance to Article 16(6) of Regulation, the incomes arising from the allocation of
interconnection capacities are used by the TSO for the following purposes:
a) to guarantee the actual availability of the allocated capacity; and/or

31.08.2016
Romanian Energy Regulatory Authority Page 30 of 109
b) to maintain or increase interconnection capacities through network investments, especially
investments in new interconnections; or
c) as income to be taken into account in calculating the transmission tariff, up to a maximum
amount determined by ANRE, where it cannot be used effectively for the purposes mentioned
above.
Every year, C.N. Transelectrica S.A. submits to ANRE the monitoring results for the value of
revenues from auctioning for allocation interconnection capacities on the borders. The
revenues referred to, made between July 1, 2015 - 30th of June 2016 are presented in the
following table.
Interconexiunea iul.15 aug.15 sep.15 oct.15 nov.15 dec.15 ian.16 feb.16 mar.16 apr.16 mai.16 iun.16 Total
Romania - Serbia* 2.063.244 3.272.026 2.772.816 3.024.860 3.240.737 3.119.988 2.404.493 2.431.200 1.539.855 1.365.427 1.363.077,14 1.402.764,70 28.000.488
Serbia - Romania* 7.201 4.267 2.133 3.043 2.330 2.422 8.439 140.255 204.140 188.982 400.097,22 75.665,79 1.038.975
Romania - Bulgaria* 821.936 706.296 942.243 747.952 1.249.613 756.909 1.310.668 1.399.252 1.936.601 1.257.053 1.765.611,69 1.133.755,16 14.027.890
Bulgaria - Romania* 641.813 403.621 225.559 410.165 244.672 246.699 131.252 124.372 143.757 144.537 138.470,99 183.191,58 3.038.108
Romania - Ungaria* 3.786.988 4.761.993 4.560.220 4.096.976 4.541.898 4.042.362 3.385.513 2.571.480 2.354.177 2.193.437 2.310.873,76 2.849.613,32 41.455.533
Ungaria - Romania* 132.582 34.052 371.599 108.654 39.634 192.086 182.329 397.698 583.953 173.664 506.633,56 97.843,59 2.820.726
Romania - Ucraina 7.982 1.916 0 3.620 5.405 6.942 58.073 55.102 51.065 50.476 58.158,48 56.599,20 355.339
Ucraina - Romania 81.541 94.293 51.859 104.030 76.018 64.473 74.813 56.885 61.990 38.974 144.889,20 91.032,84 940.798
Romania - Moldova 0 0 0 0 0 0 0 0 0 0 0 0 0
Moldova - Romania 0 0 0 0 0 0 0 0 0 0 0 0 0
T O T A L 7.543.287 9.278.463 8.926.429 8.499.300 9.400.306 8.431.882 7.555.579 7.176.244 6.875.538 5.412.550 6.687.812 5.890.466 91.677.857 * Income derived from NPS interconnection capacitie’s allocation with neighbouring power systems includes
the income from daily and intra-daily auctions on the border with Hungary, Bulgaria and Serbia, as well as
revenues from congestions resulting from price coupling of DAM in Romania, Czech Republic, Slovakia and
Hungary (project 4M MC)
Analysis of the collected amounts indicates that 91% of revenues come from auctions for
export capacity and only 9% for import. Analysis on border indicates that 48% of revenues
come from allocated capacity between Romania and Hungary, 32% from auctions for capacity
allocation between Romania and Serbia and 19% from auctions for capacity allocation
between Romania and Bulgaria. Only 1% of revenues come from auctions for the allocation
of capacity between Romania and Ukraine.
In the period between 1 July 2015 and 30 June 2016, C.N. Transelectrica S.A. recorded
revenues from congestions in a total amount of 91.68 million RON, which represents, on an
average exchange rate RON/EUR of 4.5148 RON/EUR, (1 July 2016), the amount of 20.31
million EUR.
Considering the provisions of national legislation, such amounts are included in the annual
gross profit achieved by the company and were reduced by allocating profits on destinations,
according to Government Ordinance no. 64/2001 regarding profit distribution to national
societies, national companies and state companies or companies with majority state
ownership, and Autonomous Regies, as amended and supplemented. Thus, after application of
a profit tax of 16% and legal reserve of 5%, the remaining amount deposited between 1 July
2015 - 30 June 2016 in the special account was 72,425,507 RON. The total amount deposited
in the account between 2013-2016 June 30, was of 180,116,615 RON (after applying the
income tax and the legal reserve).
These revenues were used mainly to maintain or increase the availability of the
interconnection capacities by investments in networks, the total amount used being of
91,254,579 RON (value available on 31.03.2016). The investments done in this period could
be found in the RO version of this report.

31.08.2016
Romanian Energy Regulatory Authority Page 31 of 109
In accordance with Article 16 (6), the second paragraph of Regulation (EC) no. 714/2009, in
setting out the transmission tariff from 1 July 2015, ANRE established that the costs
associated with cross-border trade of electricity export during the period 1 July 2015 – 30
June 2016, amounting to 18.6 million RON, be covered by the TSO’s incomes obtained in the
same period from the management of congestions. The difference remained available to C.N.
Transelectrica S.A in the dedicated account and shall be used in accordance with the
provisions of Article 16(6) of the Regulation.
Monitoring technical co-operation between TSO and third-country operators
Regional cooperation on infrastructure projects represents a significant dimension of the CN
Transelectrica SA activity in terms of the collaboration with power systems of neighbouring
countries. In this regard, the TSO’s attention has been focused on continuing infrastructure
projects meant to increase interconnection capacity in order to improve mutual exchanges of
energy between neighbouring systems and eliminate potential congestions. Thus, the projects
with Serbia, Republic of Moldova and Turkey were continued.
Interconnection between Romania and Moldova
Feasibility study for the synchronous interconnection of power systems of Ukraine and
Moldova to ENTSO-E
The request regarding the synchronous interconnection of the power systems of Moldova and
Ukraine with European system was approved by UCTE in November 2006. The
interconnection request was done considering that the power systems of Ukraine and Moldova
shall form a „control bloc”. CN Transelectrica S.A. was the supporting party of the
synchronous interconnection process. The feasibility study started in November 2014 and the
closing time is March 2016.
Asynchronous Interconnection of Romania with Moldova
The study on the analysis of the operating modes in asynchronous interconnection scheme
with Moldova aims to analyse the operating modes through stations "back to back" in
Moldova which insures the interconnections in the situation when Moldova and Ukraine
remain interconnected using IPS/UPS system.
Until the conditions for contracting a joint study to analyse the operating modes on power
systems of Romania and Moldova are met, based on assumptions agreed by the parties
concerning the level of export and the way of reservation in case of unavailability of the
network, Transelectrica had initiated a preliminary study, which was developed by Tractebel
Engineering SA in 2014.
The following interconnection projects through back-to-back substations on the territory of
the Republic of Moldova were analysed: overhead line of 400 kV Isaccea (RO) - Vulcăneşti
(RM); overhead line of 400 kV Suceava (RO) -Bălţi (RM) - for which a Memorandum of
Understanding is signed and preliminary analysis are completed - and overhead line of 400
kV Iaşi (RO) - Ungheni (RM).
We present below the significant aspects required on projects in Romania:
- The interconnection by back-to-back substation Vulcăneşti does not require investment costs

31.08.2016
Romanian Energy Regulatory Authority Page 32 of 109
in Romania to ensure the export of 600 (500) MW to Moldova and from this point of view,
may be implemented in the fastest way;
- The interconnection project by overhead line of 400 kV Suceava-Balti is relatively advanced
in Romania, with the feasibility study completed, being at the second stage of the design. The
estimated value of the investment is about 54 million EUR, of which 24 million EUR in
Romania and 30 million EUR for investment in Moldova (an overhead line of 400 kV and
substation 400/330 kV Balti, plus the costs for back-to-back substation Balti). Until now, due
to lack of funding, Moldelectrica did not enter in the second stage of design for overhead line
Suceava - Balti, the part on the territory of Moldova, similar to Transelectrica; on these
conditions, Transelectrica, even if shall complete the second stage of design, will not initiate
the procurement procedure for the execution of overhead line 400kV Suceava – Balti;
- For overhead line of 400 kV Iasi - Ungheni - Straseni, it is necessary to build an additional
substation of 400 kV to Iasi and an overhead line of 400 kV up to it, since in the region there
is only a network of 220 kV, whose capacity is occupied by the electricity consumption in the
area. The estimated value of the investment is approximately 200 million EUR in Romania.
In 2015, the Ministry of Economy in Moldova benefited from a study funded by the World
Bank that refers to interconnections with Romania. The study analysed the energy market and
the technologies used to build back-to-back substations. The study recommended
asynchronous interconnection with Romania and a market structure to facilitate the import of
energy in competitive conditions (both from West and from East).
It is estimated that synchronous interconnection solution may not be feasible until 2030, while
the version proposed; asynchronous interconnection is achievable by 2020. The recommended
scheme was the scheme of interconnection on the overhead lines of 400 kV Suceava - Balti
and Iasi-Straseni, with back to back substations in Balti and Straseni. The cost was estimated
at 450 million USD (a linearized price of 15.5 cents / kWh for 20 years).
The study did not consider the necessary costs and time periods to achieve the required
reinforcements of networks in Romania.
Interconnection Romania - Serbia
The project of the overhead line of 400 kV double circuits Resita (Romania) - Pancevo
(Serbia)
The project is considered a project of regional relevance and targets the increase of electricity
exchanges between Romania and Serbia by increasing the interconnection capacity between
the two countries. The total length of the line is 171 km, of which 63 km in Romania and 68
km in Serbia. In March 2013, the Joint Position Paper 4 was signed on which the parties
settled the technical conditions and the steps to be done for continuing the works to the
overhead line of 400 kV double circuits Resita - Pancevo. On 04.06.2014, CN
„Transelectrica” SA has signed with S.C. Electromontaj S.A. the working contract no. C212
for the investments on the Romanian territory, with the deadline on 29.12.2015. Due to the
fact that GD for definitive removal from the forestry surface of 0.2873 ha and temporary
occupation of the land area of 51.6499 hectares necessary to achieve the investment entered
into force in Octomber 2015, the implementation period of the project was postponed, the
new term being estimated to the first quarter of 2017. In June 2015, the Joint Position Paper 6
was signed based on which the parties settled the technical conditions and the further steps to
be done for continuing the works to the overhead line Reşita-Pancevo.

31.08.2016
Romanian Energy Regulatory Authority Page 33 of 109
Interconnection Romania-Turkey
The project was proposed as an alternative in connecting the two electricity markets,
considering that the synchronous interconnection between Turkey and ENTSO-E presents
technical problems that lead to limitation of cross-border electricity capacity.
The main benefits of the project are:
- creating additional opportunities to evacuate the electricity generated in Dobrogea area (due
to increase of installed power in renewables);
- increasing the potential of trading electricity on the Turkish market and on the adjacent
markets, by coupling the markets from Romania and Turkey.
In this context, CN "Transelectrica" SA have done a feasibility study on asynchronous
interconnection of both NPSs by building an undersea DC cable between Romania and
Turkey. The technical and economical feasible solution proposed by the study was
construction of a cable with a capacity of 800 MW. The Romanian TSO reaffirms its
willingness to make every effort to encourage the development of this project, analysing the
alternatives that can ensure an increased flow of electricity between the two countries.
Monitoring the investment plans of TSO and DSOs
In accordance to the provisions of Article 9(4) (c) and (5) (d) of the Government Emergency
Ordinance no. 33/2007 on the organization and functioning of ANRE, approved with
subsequent amendments and complements by Law no. 160/2012, regulatory authority
monitors the development plan of the grid and investment plans of TSO, the technical
condition and maintenance of electricity networks. In this respect, development and
investment plans of TSO and DSOs are assessed.
For the TSO, the settlement of the investments and their values, accepted by ANRE and
introduced in RAB (Regulatory Asset Base) for the electricity transmission service, is
achieved at the end of the regulatory period in order to determine the corrections of the capital
costs, according to the provisions of the Methodology to setting up tariffs for electricity
transmission service approved by ANRE Order no. 53/2014, amended and supplemented.
Considering that the third regulatory period began on 1 July 2014, ANRE monitors
achievements the commissioning of the investment objectives of the TSO for each tariff
period.
The forecasted and achieved values of investments, in the tariff period 2014 – 2015, in the
transmission service and the system service are presented in following table:
Transmission service Value
(RON)
Forecasted investments 137,556,188
Achieved investments (fixed assets established
without contributions)
107,885,407
System service Value
(RON)
Forecasted investments 6997
Achieved investments 6997
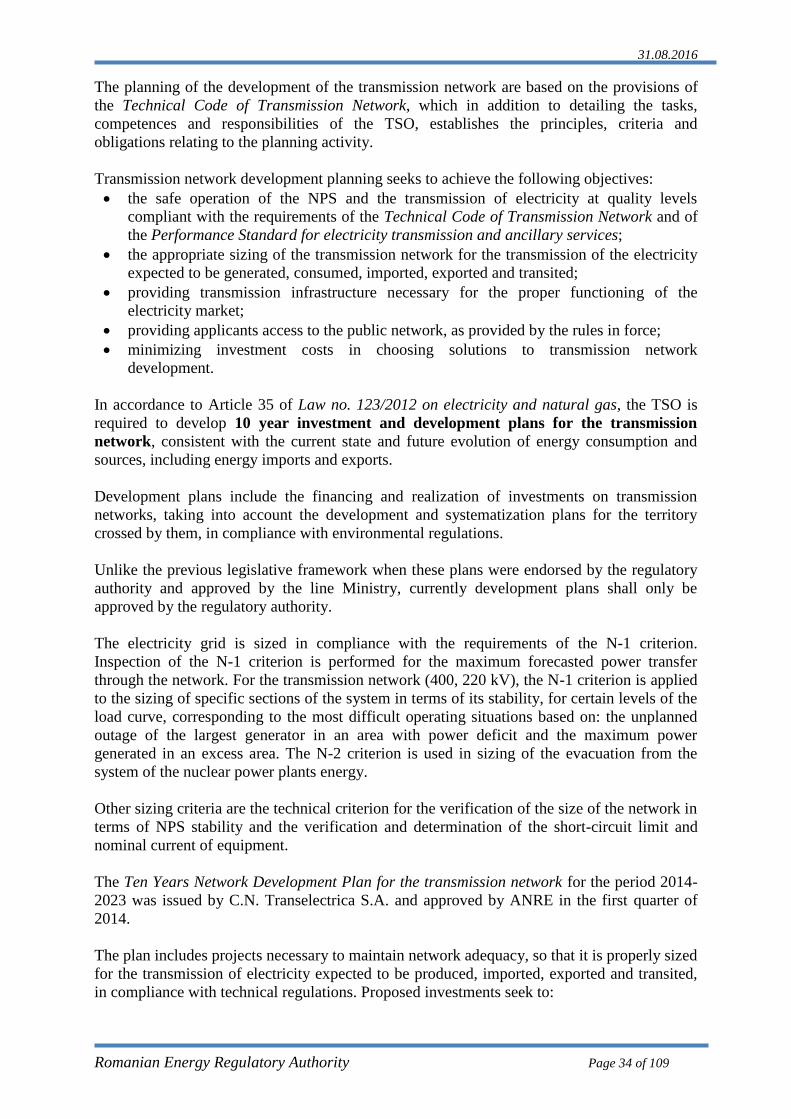
31.08.2016
Romanian Energy Regulatory Authority Page 34 of 109
The planning of the development of the transmission network are based on the provisions of
the Technical Code of Transmission Network, which in addition to detailing the tasks,
competences and responsibilities of the TSO, establishes the principles, criteria and
obligations relating to the planning activity.
Transmission network development planning seeks to achieve the following objectives:
the safe operation of the NPS and the transmission of electricity at quality levels
compliant with the requirements of the Technical Code of Transmission Network and of
the Performance Standard for electricity transmission and ancillary services;
the appropriate sizing of the transmission network for the transmission of the electricity
expected to be generated, consumed, imported, exported and transited;
providing transmission infrastructure necessary for the proper functioning of the
electricity market;
providing applicants access to the public network, as provided by the rules in force;
minimizing investment costs in choosing solutions to transmission network
development.
In accordance to Article 35 of Law no. 123/2012 on electricity and natural gas, the TSO is
required to develop 10 year investment and development plans for the transmission
network, consistent with the current state and future evolution of energy consumption and
sources, including energy imports and exports.
Development plans include the financing and realization of investments on transmission
networks, taking into account the development and systematization plans for the territory
crossed by them, in compliance with environmental regulations.
Unlike the previous legislative framework when these plans were endorsed by the regulatory
authority and approved by the line Ministry, currently development plans shall only be
approved by the regulatory authority.
The electricity grid is sized in compliance with the requirements of the N-1 criterion.
Inspection of the N-1 criterion is performed for the maximum forecasted power transfer
through the network. For the transmission network (400, 220 kV), the N-1 criterion is applied
to the sizing of specific sections of the system in terms of its stability, for certain levels of the
load curve, corresponding to the most difficult operating situations based on: the unplanned
outage of the largest generator in an area with power deficit and the maximum power
generated in an excess area. The N-2 criterion is used in sizing of the evacuation from the
system of the nuclear power plants energy.
Other sizing criteria are the technical criterion for the verification of the size of the network in
terms of NPS stability and the verification and determination of the short-circuit limit and
nominal current of equipment.
The Ten Years Network Development Plan for the transmission network for the period 2014-
2023 was issued by C.N. Transelectrica S.A. and approved by ANRE in the first quarter of
2014.
The plan includes projects necessary to maintain network adequacy, so that it is properly sized
for the transmission of electricity expected to be produced, imported, exported and transited,
in compliance with technical regulations. Proposed investments seek to:

31.08.2016
Romanian Energy Regulatory Authority Page 35 of 109
increase interconnection capacity by continuing interconnection projects with
neighbouring systems already in various stages of implementation (with Hungary, Serbia
and Bulgaria) and accelerating / introducing new projects (Moldova);
strengthen and develop the transmission network (new lines/ substations) to increase the
discharge capacities for the electricity produced in new facilities developed in recent years
in certain geographical areas (for example nuclear energy and that electricity produced
from renewable energy sources in the Dobrogea region) to consumption areas in the North
and West of the country, and completion of the 400 kV ring around the country to increase
security of supply in all the country’s regions and increase the transit capacity of the
transmission network;
upgrade equipment in order for a complete replacement of the 60s - 70s installations to
increase network reliability, reduce operating costs and ensure an appropriate degree of
operational safety.
The following map shows the main projects included in the transmission network
development plan for 2014 - 2023.
Source: CN Transelectrica SA
Applying the provisions of methodologies for establishing tariffs for electricity distribution,
ANRE has approved the yearly investment plans of the concessionaires distribution operators
for the regulatory period 2014 – 2018, supporting the inclusion in RAB of the fixed assets
resulting from prudent investments, respectively those investment proving to be necessary,
appropriate and effective.
The investments of the electricity distribution operators, according to investment programs
2014 - 2015, presented in RON and in nominal terms of each year are as follows:

31.08.2016
Romanian Energy Regulatory Authority Page 36 of 109
2014 2015
Forecasted investments
Total achieved
investments* Forecasted investments
Achieved investments*
ENEL Distributie Muntenia
180,184,461 166,995,964 161,596,866 137,996,397
ENEL Distributie Banat
72,313,365 66,793,275 92,984,767 77,794,436
ENEL Distributie Dobrogea
65,539,109 61,816,565 76,609,455 64,489,997
CEZ Distributie
155,055,396 155,055,639 161,843,711 161,853,684
E.ON Distributie Romania
173,382,141 155,691,001 183,513,064 169,632,197
FDEE Electrica Muntenia Nord
117,221,622 120,511,911 180,350,659 144,903,430
FDEE Electrica Transilvania Nord
129,780,000 120,387,761 193,689,440 194,431,718
FDEE Electrica Transilvania Sud
120,510,000 122,216,042 189,478,800 183,915,779
* The value includes: the forecasted and achieved investments for the current year, additional achieved
investments over the forecasted investment in the previous year and due to the force majeure, and also
additional achieved investments: maintenance upgrades and due to exceptional circumstances
Detailed information on the technical condition and the maintenance of electricity networks
are presented in the Report on the achievement of performance indicators for transmission
services, system services and electricity distribution services and technical situations of the
electricity transmission and distribution networks - 2015 published on ANRE’s website at
http://www.anre.ro/ro/energie-electrica/rapoarte/rapoarte-indicatori-performanta.
Other relevant aspects regarding cross-border cooperation
At the beginning of 2014, a Memorandum on the implementation of a congestion management
was signed in the CEE region and CEE market coupling project by allocating flow-based
capacity (CEE FB MC) has started. Given these developments, the 4M MC Project Board of
Directors recommended Romanian party requesting access in the CEE FB MC project. At the
end of 2014, Romania received an observer status in this project, meaning that Romanian
parties (TSO, PX and NRA) will have the right to participate to the meetings and to access the
project information. At the end of 2015, the Framework Project Agreement was signed by all
parties, excepting EPEX Spot. Completing the signing of this document implies resuming the
implementation of the project and solving participation of the Romanian as a full member of
the project. Romania's Accession Agreement clauses in this project were negotiated during
2015 and the signing shall be done in 2016.
ENTSO-E elaborated the harmonized rules at EU level for the long term allocation (yearly
and monthly) of the interconnection capacities as a preliminary step to implement the
provisions of the European Network Code on Forward Capacity Allocation -NC FCA, which
is in the process of review and approval by the European Commission, on the understanding
that one of its objectives is the use of common EU rules for allocating long-term rights to use
interconnection capacities. As a result, although their adoption by TSOs and approval by
regulatory authorities is not yet mandatory, Transelectrica and ANRE have found useful to

31.08.2016
Romanian Energy Regulatory Authority Page 37 of 109
adopt and respectively to approve them since 2015 applying from 2016, for the borders where
both TSOs agreed.
The harmonized rules for long-term allocation of interconnection capacities (HAR) were
approved by ANRE for applying on the border Romania-Hungary, the derogations to the
common version being presented in the annexes, namely in Annex 15.
Compared to the allocation rules applicable until 2015 on the Hungarian border, HAR
provides the same principles for the allocation of the interconnection capacity (ATC). The
rights to use the ATC are allocated based on the explicit auctions for yearly and monthly
timeframes. Following the submission of participants offers, the auction price is set, namely
the marginal price (price of the last winning bids, integral or partially, ordering them in
descending order), which is paid by all participants for each MW and for every hour they
obtained the rights to use the ATC.
However, HAR makes new provisions to the rules for allocating the ATC, applicable by
2015, namely:
- the possibility of allocating physical transmission rights (the holder’s right to transfer
physical volume of electricity at a certain time in a specific direction) or financial rights (the
holder’s right to receive a financial reward for making available on the market the own rights,
remuneration based on price resulting from the allocation of ATC for the next day).
According to provisions stipulated in Annex I to HAR, on the Romania-Hungary border it has
been decided to implement on this step only the allocation of physical transmission rights;
- implementing a mechanism to ensure payment of interconnection capacity awarded by
submitting a letter of credit/money in an opened account in the favour of the operator of the
allocation platform, which should cover the amount of the rights which the participant wishes
to acquire. Compared to the previous rules for allocation, the payment of ATC is achieved
only in advance, HAR provides post pay for ATC (at the next billing period), for the
situations in which the due date for payment and the deadline for starting to use ATC are very
close or overlap;
- implementing the paying mechanism Use It Or Sell (UIOSI) for the market participants for
the purchased capacity on long-term auctions, but which has not been notified as being used
by them; the previous rules stipulated the principle Use It Or Lose It (UIOLI);
- changes of the rules for compensating participants in case of curtailment of the rights to use
owned ATC by stipulating that in some situations (threat to system security or emergency
situations), the compensation shall be done by the difference between prices of the markets
for the next relevant day - limited by the revenues resulted from ATC allocation - and not just
by returning the price of the auction, as stated in the rules previously applicable.
At the request of certain producers, forwarded during the public consultation carried out by
Transelectrica, ANRE insisted on Transelectrica and Mavir to provide also in Annex 15 a
share from ATC for implicit allocation on DAM. Finally, Mavir and the regulatory authority
of Hungary agreed to reserve for implicit allocation on DAM a difference between available
ATC after the annual allocation for each sub-period of one month and 80% of the lowest
value on sub-periods of ATC available after the annual allocation. Given the results of the
simulations done with 2014 figures, it is noticed that through this method, approx. 30% of

31.08.2016
Romanian Energy Regulatory Authority Page 38 of 109
capacity would be available for DAM, which would allow export by DAM on more hourly
intervals.
3.1.5. Compliance with the provisions of the European legislation
Compliance with decisions of ACER and European Commission
In accordance to the provisions of Law no. 160/2012 on the organization and functioning of
ANRE, respectively Article 9(1)(w), ANRE complies with and implements all relevant and
legally binding decisions of the Agency for the Cooperation of Energy Regulators – ACER -
and the European Commission; the decisions of the European Commission issued under
Article 39(8) of Directive 2009/72/EC of the European Parliament and of the Council of 13
July 2009 concerning common rules for the internal market in electricity and repealing
Directive 2003/54/EC shall be implemented within 60 days after entry into force.
In order to apply the provisions of Regulation (EU) no. 1227/2011 and the provisions of
ACER Decision no. 01/2012 regarding the register format in accordance with Art. 9,
paragraph (3) of REMIT and to the necessity to adapt the national regulatory framework to
international developments concerning the REMIT implementation, ANRE issued Order no.
1/2015 establishing the National Register of the wholesale energy market participants,
published in the Official Gazette of Romania no. 80/30.01.2015.
Thus, as of 18 March 2015, the participants on the energy wholesale market in Romania were
required to register on the National Register of wholesale energy market participants, set out
and managed by ANRE according to the procedure set out in the Annex to the Order.
Presently, a number of 609 wholesale energy participants are registered in the national
registry and their data are sent to CEREMP-ACER. As of October 7, 2015, they were
required to submit data on transactions on wholesale energy market to ACER, including
orders to trade and transactions executed on organized markets and fundamental data to
European Networks of Transmission System Operators for electricity and natural gas.
The second reporting stage begins with 7 April 2016 and concerns the reporting of contracts
undertaken outside the organized markets and transmission contracts.
In 2015 there were no other mandatory ACER decisions.
Compliance of transmission and distribution companies, system owners and electricity
undertakings with relevant Community legislation, including cross-border issues
ANRE approved the final certification of the C.N. "Transelectrica" - S.A., according to
the model of ownership unbundling, as TSO of the NPS, by ANRE Order no. 164/2015.
On 10/12/2015, ANRE notified the European Commission regarding the approval of the C.N.
"Transelectrica" - S.A. as TSO in Romania according to Article 10 of EC Directive 72/2009.
ANRE monitors according to the law, distribution operator activity that is part of an economic
undertaking vertically integrated on the implementation of measures to ensure excluding
discriminatory practices and establish specific obligations for the employees of such
undertakings in achieving the objective of independence. In this regard, ANRE issued the
Order no. 5/2015 approving the Regulation on the monitoring by the National Energy
Regulatory Authority of compliance programs established by the electricity distribution
operators.

31.08.2016
Romanian Energy Regulatory Authority Page 39 of 109
Transparency of interconnection transactions is ensured by C.N. Transelectrica S.A. through
the information published on the company’s website www.transelectrica.ro, as per the
Regulation (EU) No. 714/2009.
3.2. Promoting Competition
3.2.1. Electricity wholesale market
Structure of the Romanian wholesale electricity market
The wholesale market is defined as all transactions carried out by the market participants,
holders of a license issued by ANRE, which includes and resells among participants,
performed in order to adjust the contractual position and obtain financial benefits. Volumes
traded exceed the physical quantity delivered from production to consumption.
Presently, the electricity generation sector is organized mainly from the type of primary
resource used in the production (hydro, nuclear, thermal, wind, photovoltaic and biomass).
Undertakings in the production sector, including those belonging to the state sector and
private ones, operate under the license of production issued by the regulatory authority,
participating in the electricity market. Of these, under the provisions of the Monitoring
Methodology, producers owning dispatchable groups are monitored in terms of energy
produced and delivered in NPS and activity on the electricity market in Romania, according to
Law.
In 2015, were monitored the producers whose production units were declared dispatchable
according to Regulation for scheduling production units and dispatchable customers,
approved by ANRE Order no. 32/2013, classified by power levels as following:
- hydropower group with installed power greater than 10 MW;
- turbo generator group (including biomass, nuclear) with installed power exceeding 20
MW;
- wind power plant, photovoltaic plant or plant with internal combustion engines with
installed power greater than 5 MW.
According to the results obtained in the process of achieving national electricity label for
2015, the total electricity supplied in the electricity network by the producers (with or without
dispatchable units) was 59.97 TWh, with only 0.5% more than the energy delivered by the
same producers in 2014.
Following the monthly monitoring process of the activity of producers, holders of
dispatchable units, it was noticed that in 2015 an amount of 58.53 TWh of electricity was
delivered in the network (this includes own consumption of some producers and the electricity
sold directly from the bus bars of power plants).
Quantitative comparison with previous periods of 2014 is affected by the increasing number
of producers subject to monthly monitoring process, mainly determined by commissioning of
wind and photovoltaic dispatchable groups. Thus, the number of renewable dispatchable
producers increased also in 2015, even if not as much as in 2014.

31.08.2016
Romanian Energy Regulatory Authority Page 40 of 109
We present in the following chart, the , holders of dispatchable units and undispatchable ones,
calculated on types of conventional and unconventional resources, reported according to
Regulation for electricity labelling - Revision 1, approved by ANRE Order no. 69/2009.
Source: Monthly reports of the e electricity producers according to ANRE order no. 69/2009
A comparison with the values of electricity delivered in 2014 shows an increase of approx.
1% of electricity delivered to the NPS justified by the increase by approx. 3.9% of the final
consumption linked to increased export-import transactions. It notes in particular, changing
the structure of production as a result of the functioning of hydroelectric plants in slightly
unfavourable hydrological conditions and the increase of the dispatchable power plants based
on renewable sources.
According to data reported by producers, whether in case of nuclear energy, the amount
delivered in the network remained approximately the same as in the previous year (10.69
TWh in 2015 to 10.87 TWh in 2014), in case of the electricity from hydroelectric sources
there was a decrease by approx. 13% compared to the previous year (from 18.92 TWh to
16.40 TWh).
Policy for development and integration of power plants based on renewable sources continued
in 2015, however mention should be made that the share in power production based on
conventional sources suffered only a slight drop from 88.02% in 2014 to 86.82% in 2015. The
electricity produced from natural gas increased by 18% and the electricity from coal exceeded
the previous year by only 2%.

31.08.2016
Romanian Energy Regulatory Authority Page 41 of 109
To the values of the previous year, the largest percentage of growth was recorded by the
energy from photovoltaics (56%), followed by wind power plants (approx. 14%) and power
plants using biomass (approx. 12%).
The following table presents the yearly quantities of electricity produced by the producers
owning dispatchable units, in a downward list. In comparison with the individual data in the
previous year, it appears that over 68% of production was carried out by the 3 classic
producers, Hidroelectrica (hydropower), CE Oltenia (thermoelectric) and Nuclearelectrica
(nuclear power), the rankings order of the top 3 producers remained the same as in 2014. It
also notes that the first 8 generators have produced over 1 TWh in 2015 and represented a
cumulative rate of over 85% of the yearly output of producers registered as holders of
dispatchable units, according to the monthly reported data.
Dispachable producer Electricity produced
TJ GWh
Hidroelectrica SA 4481 16132
Complexul Energetic Oltenia SA 4155 14957
SN Nuclearelectrica SA 3233 11640
OMV Petrom SA 962 3463
Electrocentrale Bucureşti SA 611 2199
Complexul Energetic Hunedoara SA 512 1842
Romgaz SA 499 1798
Enel Green Power Romania SRL 369 1330
Tomis Team SRL 216 777
CET Govora SA 171 614
Ovidiu Development SRL 149 535
Veolia Energie Prahova SRL 126 454
Other (with market shares under 0.5%) 1912 6883
TOTAL 17396 62624
Source: Monthly reports of the dispatchable electricity producers
The market shares of producers holders of dispatchable units in 2015, according to the
electricity delivered in networks are presented below.

31.08.2016
Romanian Energy Regulatory Authority Page 42 of 109
Source: Monthly reports of the dispatchable electricity producers
In 2015, the market share of the producer Hidroelectrica has decreased, but it has remained
the leading producer in terms of quantity of electricity generated and delivered to the network,
keeping the order of the top 3 producers from last year, with market shares slightly modified.
The following table presents the average yearly values of structural indicators in the period
2010-2015, calculated based on electricity delivered to the network by producers, holders of
dispatchable units. The values presented take into account the existing structure at companies
with legally separated personality, disregarding the shares held by certain operators.
An C1 HHI
2010 36% 1947
2011 26% 1469
2012 30% 1914
2013 28% 1759
2014 31% 1826
2015 27% 1826
Source: Monthly reports of the dispatchable electricity producers
As it can be noted, also in 2015 the values of such indicators are within the boundaries that
separate markets with a moderate degree of concentration of those with a high degree of
concentration, as they are established in the specialty literature.
NPS operation in 2015 was characterized by an increase by approx. 2% of domestic
consumption of electricity compared to that in 2014, calculated based on delivered energy in
the networks and the balance between imports and exports coupled with continued growth in
the share of installed capacity in power plants using renewable sources, on slightly
unfavourable hydrological conditions of the year.
At the monthly level, the electricity domestic consumption recorded, in most months of the
2015, superior values to those of the previous year, with monthly increases between 0.28%
(February 2015) and 5.64% (July 2015).

31.08.2016
Romanian Energy Regulatory Authority Page 43 of 109
Electricity wholesale market
The electricity wholesale market is defined as all transactions carried out by the market
participants, holders of a license issued by ANRE, which includes and resells among
participants, performed in order to adjust the contractual position and obtain financial
benefits. Volumes traded exceed the physical quantity delivered from production to
consumption.
Changes in the structure of the wholesale market which occurred with the entry into force of
the Law no. 123/2012 on electricity and natural gas have continued to evolve and consolidate
as market participants replaced the negotiated bilateral transactions with the obligation to
conclude transactions on the centralised markets organised by Opcom SA in a transparently,
publicly, centralized and non-discriminatory manner. The chart below illustrates the monthly
volumes traded on the major components of the wholesale electricity market in the
period 2011-2015 compared to the evolution of domestic consumption.
0
1000
2000
3000
4000
5000
6000
7000
8000
9000
10000
GWh
Evolutia lunara a volumelor tranzactionate pe componentele pietei angro comparativ cu consumul intern
PIATA CONTRACTELOR REGLEMENTATE PIATA CENTRALIZATA PT. SERVICIUL UNIVERSAL
PIATA CONTRACTELOR NEGOCIATE PIATA CONTRACTELOR PE ALTE PLATFORME
PIETE CENTRALIZATE DE CONTRACTE PIATA PENTRU ZIUA URMATOARE
PIATA DE ECHILIBRARE Consum intern (include cpt distr si transp)
Source: Monthly reports from wholesale electricity market participants, OPCOM S.A. and C.N.
TRANSELECTRICA S.A
In 2015, the trading on the centralized markets of bilateral contracts organized by Opcom SA
(CMBC-EA, CMBC-CN and CMBC-OTC) was predominant, ensuring particularly the
transactions on medium or long term contracts, followed by DAM and IDM for short-term
transactions. Due to law requirements, the transactions on brokerage platforms were virtually
ceased in 2014, the participants being more active on centralized market with continuous
double negotiation from Opcom SA, with varied trading tools. The volume of the transactions
carried out on negotiated bilateral contracts was reduced to a third of the one achieved in
2013. The volume of electricity traded on the BM also increased by approx. 16% compared to
2014 as a result of the need to ensure the balance between production - consumption due to
the large differences between the physical notifications and the electricity actually delivered
in networks by undertakings that commercially operate wind and photovoltaic units. We
mention that the electricity market for large end customers remains inactive until the end of
2015, no initiating offer being submitted.

31.08.2016
Romanian Energy Regulatory Authority Page 44 of 109
In order to reduce differences between the buying prices of electricity contracted by the
suppliers of last resort for covering the end consumption billed at CMC tariffs (competitive
market component), ANRE has developed in July 2014 the regulatory framework for CMUS
(Centralized Market for Universal Service) and the electricity market operator, Opcom SA,
has implemented the appropriate trading mechanism that became operational in April 2015.
Since that date, the purchase of forecasted electricity demand for CMC billing tariffs is
centralized on CMUS platform and the difference between billed and forecasted is traded on
DAM and IDM. To cover the electricity consumption of the end customers supplied on the
last resort, the necessary electricity is purchased on centralized platforms CMBC-EA, CMBC-
CN, CMBC-OTC, DAM and IDM.
The following table presents the volumes traded in 2015 on each component of the wholesale
market and their evolution compared to those the previous year:
Wholesale market components
Volumes
traded
in 2015
-GWh-
Evolution
compared to
2014
- % -
Percentage of
internal
consumption
2015
- % -
Market of regulated contracts 6413 ▼ 29.2 12.6
Market of directly negotiated contracts 1509 ▼67.3 3.0
Centralized market of bilateral contracts of
which: 56717 ▲52.1 109.5
- CMBC-EA 31407 ▼8.5 61.9
- CMBC-CN 7915 ▲388.3 15.6
- CMBC-OTC 17394 ▲1194.6 34.3
Centralized market for universal service 4592 - 9.1
Day ahead market 22496 ▲5.3 44.3
Intra-day market 76 ▲18.8 1.5
Balancing market 4861 ▲16.6 9.4
Export* 10504 ▲28.0 20.0
* The quantity of the export contracts in 2015 resulted from the reports of market participants to the wholesale market and include the
quantities exported by the suppliers, by the only producer achieving this kind of activity (data reported over the monitoring scheme), and the
exported quantities by CN Transelectrica SA, as a shipping agent on coupled DAM; the export volumes were verified with the notifications on DAMAS platform, there are small differences in some cases
Source: Monthly reports from wholesale electricity market participants, OPCOM S.A. and C.N.
TRANSELECTRICA S.A
The data presented shows that the highest increases were registered on CMBC-CN and
CMBC- OTC, the volume of electricity traded on both markets increased about 4 times,
respectively about 12 times that of the previous year. At the same time, in 2015, approx. 67%
of all transactions were carried out on three of the centralized markets administered by
OPCOM SA, predominantly used by market participants - CMBC-EA, DAM and CMBC-
OTC.

31.08.2016
Romanian Energy Regulatory Authority Page 45 of 109
In comparison with 2014, it stands a further reduction in the quantity of electricity sold on the
regulated contracts; it is a consequence of increasing deregulation established by the
Memorandum of Understanding approved by the Government in March 2012, in accordance
with its obligations in relation to the IMF, World Bank and European Commission approving
the roadmap for phasing-out regulated tariffs to the final customers not making use of their
eligibility rights. As in the last year, Hidroelectrica and Nuclearelectrica were the only
producers who had quantities and prices regulated by ANRE decisions.
The distribution system operators have purchased a quantity of electricity of 6 TWh only on
the competitive market.
After processing the data collected from market participants, it was noted that cross-border
commercial activity was intensified in 2015, the amount of energy exported on a contractual
basis being approx. 10.50 TWh, 28% higher than the previous year, while imported energy
has exceeded that of 2014 by 2.5 times, reaching 3.78 TWh.
We mention that the export activity of electricity was achieved mainly by suppliers (approx.
98% of the volume traded on this type of contract), respectively by CN Transelectrica SA, as
shipping agent for coupled DAM, for the import (approx.78% of the volume traded).
The table below presents for each component of the wholesale market, annual average prices
and the comparison to the previous year values.
Average prices on the wholesale market 2015
-RON/MWh-
2014
-RON/MWh-
Evolution
2015
compared to
2014
- % -
Market of regulated contracts 140.56 142.68 ▼1.5
Market of directly negotiated contracts 147.89 163.75 ▼9.7
Centralized market of bilateral contracts of
which: 163.87 173.90 ▼5.8
- CMBC-EA 162.01 174.19 ▼6.8
- CMBC-CN 167.68 168.11 ▼0.3
- CMBC-OTC 165.50 173.50 ▼4.6
Centralized market for universal service 170.52 - N/A
Day ahead market * 161.83 153.92 ▲5.1
Intra-day market ** 112.52 162.63 ▼30.8
Balancing market *** 254.74 243.35 ▲4.7
Export**** 168.05 173.47 ▼3.1
* The annual average price is that published by OPCOM SA and is calculated as simple arithmetic average ** The annual average price is calculated based on the annual traded volume and value, published by Opcom SA
*** The annual average price is calculated as arithmetic average of the monthly average deficit prices
****The average annual price reflects price information on the quantities exported by suppliers, by the only producer that have taken this type of activity (data reported outside monitoring layout) and those exported by Transelectrica, as shipping agent on coupled DAM
Source: Monthly reports from market participants, OPCOM S.A. and C.N. TRANSELECTRICA S.A.

31.08.2016
Romanian Energy Regulatory Authority Page 46 of 109
Regarding average prices on the wholesale electricity market, we make the following
comments:
i. average prices do not include VAT, excises or other taxes and were determined by
weighting the prices with the quantities corresponding to sales transactions reported
monthly by market participants;
ii. all prices include the Tg component of the transmission tariff (for the centralized
markets this is embedded in the price by the bidders).
A comparative analysis of the annual average prices resulting from transactions on the
wholesale market components in 2015 over the previous year indicates the following:
Average annual price decline for all components of the wholesale market, with the
exception of the one registered on DAM and the average deficit price on BM; the most
significant drop was registered on intra-day market, while the smallest decrease was
for the price on CMBC-CN;
the decline in average prices on centralized markets can be explained primarily by
increased of electricity production from hydropower plants traded on the competitive
market; another influencing factor is the increased share of production from renewable
sources on the market and the downward trend of price offer for this, combined with
the sale of green certificates (CV) on centralized markets organized by Opcom SA, in
their current period of life, with a limitations of number of CVs allowed for trading;
the annual average prices of negotiated bilateral contracts have been much lower than
those of other competitive contracts as a result of directly negotiated transactions
concluded before the entry into force of the Law, valid in 2015, and of directly
negotiated transactions under the exceptions provided by the primary legislative
framework;
the average selling price on the CMUS was the highest average price recorded on
centralized platforms operated by market operator; it reflects the offering policy of the
participants on this segment of the market and the innovations introduced by the
implemented regulatory framework, but it is also probably influenced by the
type/number of traded products.
Market of regulated bilateral contracts
The regulated component of the wholesale market also functioned in 2015 in order to supply
electricity at regulated tariffs to households.
Prices and quantities of the regulated contracts of electricity have been established in
accordance with the Methodology of pricing for electricity sold by producers on regulated
contracts and quantities of electricity from regulated contracts concluded by producers with
supplier of the last resort, approved by ANRE Order no. 83/20.11.2013.
In 2015, from the total of 14586 GWh of electricity purchased by the suppliers of last resort
on the wholesale market to cover the energy needs of regulated supplied end customers and
for the Universal Service, a rate of approx. 44% was covered by regulated contracts with the
producers Hidroelectrica and Nuclearelectrica, the rest being purchased on the CMUS
(approx. 31%), DAM (approx. 13%), and centralized markets for bilateral contracts organized
at Opcom SA (approx. 12%).

31.08.2016
Romanian Energy Regulatory Authority Page 47 of 109
The average purchase price of electricity corresponding to the five suppliers of last resort in
2015 was 158.97 RON/MWh.
The competitive market
The volume of the electricity transactions concluded on the competitive market increased by
34.5% compared to 2014. The competitive market covers transactions concluded on CMBCs,
CMBC-NC, CMUS, DAM, IDM and BM, and also the market for bilateral contracts directly
negotiated.
The volume of the electricity transactions concluded on import/export contracts is
significantly larger than the monthly volumes traded in 2014, excepting November 2015.
It is noted the different monthly evolution of the imported volumes compared to those
exported. The significant increase of the volumes in May, June and December, as a result of
the coupled functioning of the spot markets in the 4 countries, along with the decrease of the
exported volumes in February, May, June and September, led to significant variations of the
export-import sold for February, May and December 2015.
From the point of view of dispatchable producers, the competitive market (without taking into
account the volumes traded on BM) had the following sales structure:
Total sales of producers on competitive market 100%
(54710 GWh)
A. Transactions made upon bilateral direct contracts or concluded
through type-offers
7.5%
1. With suppliers 2,4%
2. With final customers 5.1%
B. Transactions made upon auctions on the centralized markets 60.1%
1. With suppliers 55.3%
2. With distributors 2.6%
3. With other producers 1.5%
4. With the transmission operator 0.7%
C. Transactions on CMUS 5.2%
D. Transactions on DAM and IDM 27.2%
Note: the sales transactions reported over the monitoring scheme are not included
Source: Monthly reporting of wholesale market participants, OPCOM SA and
C.N. TRANSELECTRICA S.A.
Overall, the sales of the dispatchable producers in the competitive market represented in 2015
an amount of nearly 55 TWh, at an average price of 164.98 RON/MWh (including the Tg
component of the transmission tariff); compared to the 2014 values, it is noted an increase of
10% of the sold energy quantities and a decrease of 2% of the average annual price.
The largest part of that quantity was sold on centralized markets for bilateral contracts
(approx. 32.9 TWh), and the selling to the electricity suppliers was predominant (30.2 TWh at
the average price of 163.04 RON/MWh). Large quantities were sold also on short term
markets (DAM and IDM) - approx. 14.8 TWh at the annual average price of 168.39
RON/MWh. Compared to the previous year, the producer’s selling structure continued to
change significantly in favour of the contractual centralized markets, the selling on DAM
recording a decrease by 19%.
The following table presents the competitive market structure in terms of the electricity
supplier’s sales (without considering the volumes traded on the Balancing Market):

31.08.2016
Romanian Energy Regulatory Authority Page 48 of 109
Total sales of suppliers on the competitive market 100%
(69773 GWh)
A. Transactions made upon bilateral negotiated contracts 57.1%
1. With other suppliers 0.3%
2. With external partners (export) 14.8%
3. With producers 0.0%
4. With distribution operators 0.0%
5. With final customers 42.0%
B. Transactions upon auctions on the centralized markets 34.5%
1. With other suppliers 29.3%
2. With producers 0.8%
3. With transmission and system operator 0.3%
4 With distribution operators 4.1%
C. Transactions on CMUS 2.5%
D. Transactions on DAM and IDM 5.9%
Source: Monthly reporting of wholesale market participants, OPCOM SA and
C.N. TRANSELECTRICA S.A.
It is noticed that in 2015 the largest part of the direct bilateral contracts were closed with the
final customers, while the volume of the directly negotiated contracts on the wholesale market
had a small share in the total sales of the electricity suppliers.
The smaller annual average price for selling (including the component for the electricity
injection in the transmission network) was recorded on negotiated sales contracts with others
suppliers (160.60 RON/MWh), and the biggest one was recorded on the export negotiated
contracts (167.95 RON/MWh). The average price for the sales on CMUS was 177.10
RON/MWh.
In the contracts for the supply of electricity to end customers, the average annual price was
173.14 RON/MWh. This price does not include network costs (transmission, distribution,
system services).
Regarding the activity of distribution operators, they bought 6 TWh only through competitive
market, the acquisitions using mostly the products available on CMBC (approx. 61.7% of the
annual purchase volume), followed by the acquisition on DAM (approx. 29.3%), and also
sales on DAM of about 0.05 TWh. The analysis of transactions undertaken by distribution
operators revealed their tendency to conclude bilateral agreements on centralized markets in
particular with suppliers of last resort of the same group. Thus:
- one of the distribution operators made buying/selling transactions on DAM through the
SoLR from the group they belong to, and approx. 54.4% of his acquisition from CMBC-
EA based on contracts with suppliers is from the same SoLR;
- another distribution operator closed buying transactions on CMBC-OTC only from
partners of the same group, transactions representing approx. 33% of his total acquisition;
- another distribution operator bought on CMBC-EA, 24.29% of the amount from the
partners of the group.
Noteworthy in 2015, is the evolution of CMBC-OTC and CMBC-NC compared to the
previous year. These increases have led to changes in the business structure of contracts on
centralized markets, as follows: 14% of the volumes traded on CMBC-CN, 31% on CMBC-
OTC, and the remaining 55% on CMBC-EA.

31.08.2016
Romanian Energy Regulatory Authority Page 49 of 109
The centralized market of electricity bilateral contracts with continuous double
negotiation– CMBC- OTC
This market is an organized by Opcom SA for centralized trading on a competitive condition
based on pre-established contracts for the buying and selling electricity and eligibility criteria
set to each participant. Trading is based on standard tools using framework contracts agreed
by the parties before trading; since November 2014, in accordance with the regulations
approved by ANRE Order no. 49/2013, the use of EFET type contracts is mandatory.
Starting in May 2014, CMBC-OTC represented in 2015 one of the most important
components of the electricity wholesale market, the electricity delivered on this market
recorded a market share of 34.3% of the domestic consumption and representing approx.
16% of the total of the sales transactions on the wholesale market..
In 2015, the activity of the participants on this market increased from one month to another.
Thus, if at the beginning of 2015 there were 57 participants registered, up to the end of the
year their number increased to 90. Starting with 599 transactions in January 2015, in the last
month of the year there were registered 1029 transactions for energy supplied base load, on
peak and off peak.
A part of the transactions was concluded by mediation procedure (sleeve transactions).
Monthly volumes traded on the standard tools available characterized by transaction time(day,
weekend, week, month, quarter, semester, year) and by the delivery profile (base load, on
peak and off peak) increased significantly every month.
Weighted average prices, calculated as a weighted average of prices with all electricity
quantities of all contracts on delivery during a month, recorded variations of the averaged
prices for each delivery profile; thus they were recorded monthly variations between 144.75
RON/MWh and 175.25 RON/MWh for deliveries on base load and between 170.13
RON/MWh and 210.51 RON/MWh for deliveries on peak and between 108.78 Euro/MWh
and 150.27 RON/MWh for deliveries off peak.
The annual quantity delivered during the reporting month on buying/selling contracts
concluded on CMBC-OTC was 17394 GWh at the annual average price of 165.50
RON/MWh. Monthly delivered quantities evolved from almost 961 GWh (19.6% of domestic
consumption) in January 2015 to 2 057 GWh (approx. 43.8% of domestic consumption) in
December 2015 with monthly average prices ranging between 145.34 RON/MWh (May
2015) - 178.08 RON/MWh (January 2015).
The sales of suppliers on this market in 2015 accounted for approx. 79% of the traded
quantity at an annual average price of 164.10 RON/MWh, while the producers have sold
approx. 21% of the total traded quantity at an annual average price of 170.70 RON/MWh.
Data on quantities supplied and the related prices were obtained on the basis of monthly
monitoring reports of the participants and covers the electricity actually delivered during the
reporting month as a result of transactions concluded on the CMBC-OTC.
HHI concentration indicator calculated by OPCOM SA, recorded monthly values between
542-851 for sale and 506-725 for purchase, and the concentration indicator C3 recorded every
month values less than 40%.

31.08.2016
Romanian Energy Regulatory Authority Page 50 of 109
The information contained in monthly reports transmitted by Opcom SA reflect the large
number of transactions between participants - members of groups of companies and in the
case of a such group both the supplier of last resort and concessionaire distribution operator
have contracts with companies in the group.
The information published on the website www.opcom.ro, chapter CMBC-OTC, are daily
information on products and aggregated data, summaries and statistics as well as
data/information published under provisions of Article 26 from the Regulation on the
organized trading market framework on the centralized market with continuous double
negotiation of the bilateral electricity contracts.
Opcom SA calculates and publishes daily reference prices for each CMBC-OTC product,
calculated as the arithmetic average of participants’ proposals to CMBC-OTC, but there are
difficulties in gathering the information necessary for the calculation.
Opcom SA has also published in 2015 complete information on 454 transactions of which
closing price varied by more than 10% over the reference price fixed for the product (if it is
the first transaction of the day) or to the transaction price of the previous day, for products of
which the delivery period exceeds one month.
Centralized Market for Bilateral Contracts with three trading arrangements - CMBC-EA,
CMBC-CN and CMBC-PC
2015 was characterized by the implementation of the regulatory framework approved by
ANRE Order no. 78/2014, respectively the organized market regulation framework of the
centralized market for bilateral contracts with three ways of trading - by extended public
auction (CMBC-EA), by public auction with continuous negotiation (CMBC-CN) and
processing contracts.
The changes were initiated in order to better meet the requirements of the Law as amended
and supplemented, regarding publicity, transparent and non-discriminatory trading on the
wholesale market, the specific obligations for the participation of the producers and network
operators to the market and to create the transparency and non-discriminatory conditions for
fuel processing contracts.
Participants are holders of production, supply, transmission and distribution licenses. If in the
first month of operation of CMBC-EA, the number of registered participants was 118, it
increased rapidly month by month, reaching 351 participants in December 2015. The
participants interested to conclude new bilateral contracts were enrolled on CMBC-EA, this
being the market which replaced the old centralized market of bilateral contracts CMBC.
The chart below presents the most important information on monthly volumes offered
respectively traded on CMBC-EA during 2015.

31.08.2016
Romanian Energy Regulatory Authority Page 51 of 109
Ian Feb Mar Apr Mai Iun Iul Aug Sep Oct Nov Dec
2015
volum ofertat pentru vanzare si cumparare 2924 9883 9545 15422 14799 9344 15991 12945 20655 29473 19158 16223
volum tranzactionat lunar 232 1141 1301 2179 2324 3503 2463 1232 1680 3850 1626 2690
volum contractat anterior anului 2015 pt luna in curs 2979 2591 2750 2181 1817 1762 1635 1622 1609 1676 1619 1667
volum contractat in anul 2015 pt luna in curs 0 25 152 262 298 318 893 906 924 1228 1356 1588
volum total contractat pt luna in curs 2979 2616 2902 2442 2116 2080 2527 2528 2534 2904 2975 3255
0
5,000
10,000
15,000
20,000
25,000
30,000GWh
Situatia ofertelor si tranzactiilor pe contractele incheiate pe PCCB-LE- 2015 -
Source: Monthly reports of Opcom SA
The offers for sale or purchase of electricity on CMBC-EA have firm characteristics on the
delivery time, daily delivery profile, total and hourly quantity, minimum requested price and
respectively the maximum price offered. After concluding transactions, these characteristics
determine the accurate, fixed, constant values of the quantities and price level established for
trading, for the whole period of validity of the contract. In the auction, offers are accepted by
both sides, for selling and buying, being possible to have multiple bidders on both sides.
The most active participants in terms of sale’s offer were the producers Hidroelectrica SA and
CE Oltenia that introduced the largest volumes destined to be sold. In two of the 12 months,
Hidroelectrica has offered the highest amounts, up to 75% of the total volume offered for sale
(February 2015), while CE Oltenia intended to sell in all other months with offers over 50%
of the total offered volume.
Regarding the concluded sales transactions, Hidroelectrica SA held the largest share of
volumes traded (with decreasing rates which ranged between 80% in February 2015 and
31.7% in June 2015), in first half of the year, while CE Oltenia was the first among sellers in
the second half, with sales quotas ranging between 20.7% and 31.7%.
Analysing the buying offers, it appears that from February to June 2015, the most interested
in purchasing energy in this market was E.ON Energie Romania, with market shares ranging
from 16.7% to 23% whose intentions to buy materialized in all the mentioned months. For the
second year, the most interested in buying energy were competing suppliers Tinmar-Ind (July,
August and September 2015) and Repower Supply (October, November and December 2015),
with amounts monthly offered by up to 20%. For the purchase transactions, GEN-I has
recorded the highest monthly market share (excluding December 2015).

31.08.2016
Romanian Energy Regulatory Authority Page 52 of 109
Analysing the data obtained from the monitoring process of the market participants, the
amounts of electricity delivered in 2015 (the contracts traded on CMBC-EA in 2015 or
earlier, on CMBC) decreased by almost 8.5% compared to those delivered in 2014 on CMBC
(organized centralized market according to ANRE order no. 6/2011), while the annual
average price for the total quantity delivered decreased by approx. 7% over the same period of
comparison.
The average annual price recorded on the quantities delivered in 2015 was 162.01 RON/MWh
with only 0.18 RON/MWh higher than the annual average price on DAM. Average prices on
CMBC-EA, calculated at month decreased from the beginning of the year, when it was
recorded the maximum of period under review (168.60 RON/MWh) towards the end of the
year, ranging around 160 RON/MWh.
The delivered quantity by the dispatchable producers on these types of contracts represented
70% of the total for the year, at a price 160.22 RON/MWh, while the quantity delivered by
suppliers was sold at the price of 166.44 RON/MWh.
On CMBC-CN standard products are traded in terms of power offered, the daily profile of
supplies and the delivery periods. The chart below presents the monthly trading volumes
and those contracted for delivery in the months of 2015, including those contracted
before 2015. The data are reported by Opcom SA in the monthly reports for markets
monitoring.
Ian Feb Mar Apr Mai Iun Iul Aug Sep Oct Nov Dec
2015
volum tranzactionat lunar 262 317 855 365 241 1,559 1,287 397 1,139 286 616 1,613
volum contractat anterior anului 2015 pt luna in curs 833 555 318 179 185 179 99 99 96 99 96 99
volum contractat in 2015 pt luna in curs 47 160 148 559 211 161 501 743 606 713 727 614
volum total contractat pt luna in curs 880 716 466 737 396 339 601 842 702 813 823 713
0
200
400
600
800
1,000
1,200
1,400
1,600
1,800
GWh
Situatia tranzactiilor pe contractele incheiate pe PCCB-NC- 2015 -
Source: Monthly reports of Opcom SA
According to data monthly reported by the monitored operators, the sales of electricity
delivered in 2015 (including those previously traded on CMBC-CN) was about 7.9 TWh of

31.08.2016
Romanian Energy Regulatory Authority Page 53 of 109
which approx. 84% were sales of the producers at an annual average price of 168.74
RON/MWh, while suppliers have sold 16% at the annual average price of 161.72 RON/MWh.
Day-ahead market – DAM
The volume of electricity traded on DAM in 2015 increased by approx. 4.6% compared to the
volume traded in 2014. In 2015, the monthly share volume traded on DAM, as percentage
from domestic consumption, ranged from 38.5% (in August 2015) and 46.3% (in March
2015), the annual share was approximately equal to the one in 2014, about 44%.
DAM average closing price (arithmetic average of the monthly closing market prices)
increased by approx. 5% compared to 2014.
The chart below illustrates the monthly average price and the volume traded on DAM in
the period 2006–2015.
0
250
500
750
1000
1250
1500
1750
2000
2250
0
50
100
150
200
250
300
350
GWhlei/MWh
Evolutia lunara a pretului mediu si a volumului tranzactionat pe PZU
Volum tranzactionat pe PZU
Pretul mediu PZU
Source: Monthly reports of OPCOM SA and CNTEE TRANSELECTRICA SA
Variations from one month to another of the monthly average price established on DAM
existed in both ways. The minimum of the period was reached in April 2015 (116.34
RON/MWh), and the maximum in December 2015 (185.04 RON/MWh). The annual average
price - arithmetic average of the monthly average prices - recorded in 2014 was 161.83
RON/MWh.
Starting with 19 November 2014, the DAM in Romania operates coupled with day-ahead
markets in Hungary, Slovakia and the Czech Republic, the so-called project 4M MC - the
price market coupling for DAM. This correlated and coordinated mechanism uses a method,
unique in Europe, the price coupling of the regions (Price Coupling of Regions initiative-
PCR) to harmonize European national markets and to create the European internal electricity
market. The coupled operation is based on the coupling algorithm recommended by ACER
(Euphemia) that aims to maximize the social welfare in the entire area.

31.08.2016
Romanian Energy Regulatory Authority Page 54 of 109
The mechanism of coupling is achieved through OTE - the Czech Republic and EPEX Spot
(as members of PCR), the last one acting as a service provider for OKTE-Slovakia, HUPX
Hungary and Opcom-Romania (not PCR members). Market operators act as coordinators on
the basis of monthly rotation.
The coordinated calculation of the allocated cross-border capacity is under the governance of
TSOs of the 4 countries in accordance with European legislation. The allocation model used is
the implicit allocation on the DAM of the interconnection available capacity.
In the chart below are presented the monthly average spot prices of the 4 day-ahead
markets on the 4M MC coupling mechanism starting with 1 January 2014, before and
after the beginning of operating on the coupled regime.
Ian
2014Feb Mar Apr Mai Iun Iul Aug Sep Oct Nov Dec
Ian
2015Feb Mar Apr Mai Iun Iul Aug Sep Oct Nov Dec
OPCOM 35.51 31.7 29.17 36.77 29.23 31.05 34.87 31.3 28.45 43.34 44.11 40.19 39.53 37.1 32.32 26.34 27.56 32.92 41.89 40.72 41.25 39.21 36.89 41.14
HUPX 42.72 35.1 33.23 41.56 36.6 39.76 39.31 35.99 40.56 53 46.21 41.66 42.19 41.26 35.66 34.08 29.65 33.92 52.35 42.49 47.61 44.12 41.51 42.27
OKTE 36.07 33.31 31.28 35.19 31.61 32.7 32.86 28.28 34.72 35.36 37.66 34.8 31.26 36.68 31 29.89 25.9 31.16 38.54 33.24 36.61 42.29 36.63 29.9
OTE 36.03 33.31 31.18 31.98 31.47 31.83 32.86 28.27 34.19 34.19 36.58 33.75 29.48 36.14 30.65 29.76 25.41 30.64 36.71 32.68 33.4 39.09 35.48 28.76
20
25
30
35
40
45
50
55
60
Euro/MWh
Preturile spot medii lunare
pe cele 4 piete spot membre ale proiectului 4M MC
Ianuarie 2014 - Decembrie 2015
REGIM CUPLAT
Source: Published information by Opcom SA
The expected results of DAM market coupling operation were affected by ATC values set on
implicit auctions on each direction; thus, the maximum hourly ATC values for the implicit
allocation were of 309 MW for direction Romania - Hungary and 1395 MW for direction
Hungary - Romania. Usually on export, ATC was occupied after allocations on long-term
auctions, which led to low levels for ATC on implicit auctions; as a result, electricity flows
exported through the coupling mechanism were insignificant, despite some great
opportunities, reflected in large price differences between the two areas, on many hourly
intervals. Instead, the availability of significant ATC values on implicit auctions on the import
direction, after the application of the netting principle, leads to higher imports of electricity.
Further, it is presented the hourly difference among the closing prices of coupled DAM on
Romania area and respectively Hungary area, coupled with cross-border flows resulted
on Romania-Hungary border, in both directions, in 2015.

31.08.2016
Romanian Energy Regulatory Authority Page 55 of 109
-100.00
-50.00
0.00
50.00
100.00
150.00
-1000.00
-500.00
0.00
500.00
1000.00
1500.00
1,4171,5611,7051,8491,9932,1372,2812,4252,5692,7132,8573,0013,1453,2893,4333,5773,7213,8654,0094,1534,2974,4414,5854,7294,8735,0175,1615,3055,4495,5935,7375,8816,0256,1696,3136,4576,6016,7456,8897,0337,1777,3217,4657,6097,7537,8978,0418,1858,3298,4738,617
Flux RO-HU Flux HU-RO Δ =PIP RO-PIP HU
Euro/MWhMWh
EVOLUŢIA ORARĂ A ECARTULUI DINTRE PIP ROMÂNIA ŞI PIP UNGARIA ŞI A
FLUXURILOR TRANSFRONTALIERE REZULTATE
- AN 2015 -
Source: Published information by Opcom SA
It is estimated that the price set on DAM in 2015 incorporates accurately the available
information on the resource level and electricity demand corresponding to the moment,
presenting in the same time, specific high volatility.
The HHI concentration indicator had values that indicate the lack of concentration, on buying
(monthly values in the area 338-522); on selling, there is a less concentrated market in eight
months of the year, with monthly HHI values between 527-924 and during March-July 2015
there is a moderately concentrated market, except April, when the value of HHI was 527.
By comparing the closing price of DAM with the spot prices for other European power
exchanges in 2015, it is noted that the price values recorded by Opcom SA were higher than
those on EXAA, except for some hourly intervals in February, April, October and November.
0
20
40
60
80
Euro/MWh
PRETURI SPOT MEDII ZILNICE2015
EXAA Opcom Source: Daily reports of OPCOM SA and published information by EXAA

31.08.2016
Romanian Energy Regulatory Authority Page 56 of 109
Intra-Day Market – IDM
The intra-day market, component of the wholesale market, is the centralized electricity
trading framework organized by the market operator - OPCOM SA (that is also the
counterparty) created for fine-tuning the portfolio of contracts to the production possibilities,
demand and cross-border transactions and to reduce potential imbalances. Responding to the
principles of non-discrimination, transparency, public and centralized market, IDM is a
voluntary market that offers participants standard-tools transaction, for which they may
submit offers for sale and/or purchase after the DAM closing time until near the hour of
beginning the electricity delivery. On this market, the hourly transactions are secure,
independent and are based on anonymous participants.
Although it is still underutilized by market participants, IDM experienced a positive
development compared to the previous year as regards the monthly traded volumes,
registering at the end of the year a total of 76 GWh, approx. 19% higher than in 2014, the
annual value of transactions being approx. 8527 thousands RON.
With a total of 111 holders of license that have signed the IDM participation convention, the
monthly participation degree (the number of participants who have placed offers of the total
subscribers) ranged this year between 29% (January 2015) to 49% (November 2015).
Balancing Market – BM
In December 2015, 114 producers were acting on this market and 108 Balancing Responsible
Parties were registered.
The following table shows the annual comparative values for the period 2006-2015 for the
concentration indicators determined based on the actual delivered energy by the producers
on BM, for each type of regulation and direction.
Concentration indicators on the Balancing market Year Regulation
type
Direction 2006 2007 2008 2009 2010 2011 2012 2013 2014 2015
C1
Secondary Upward 80% 60% 71% 64% 68% 59% 60% 61% 59% 58%
Downward 80% 56% 71% 64% 67% 56% 57% 58% 58% 57%
Fast tertiary Upward 69% 51% 70% 55% 53% 75% 78% 67% 58% 55%
Downward 53% 30% 38% 47% 62% 46% 53% 47% 70% 74%
Slow
tertiary
Upward 29% 29% 27% 39% 45% 30% 46% 39% 61% 37%
Downward 31% 19% 27% 32% 34% 42% 46% 37% 63% 36%
HHI
Secondary Upward 6510 3915 5438 4526 5067 3986 4815 4700 3495 4368
Downward 6612 3538 5367 4501 4943 3703 4665 4423 3396 4274
Fast tertiary Upward 5061 2979 5065 3543 3320 5729 6250 4841 3400 3626
Downward 3452 1590 2319 2843 4204 2868 3926 3202 4836 5779
Slow
tertiary
Upward 2203 1769 2021 2478 2749 1679 2375 2777 3759 2997
Downward 2582 1276 1838 2017 2089 2563 3446 2470 3959
2640
Source: Monthly reports of CN TRANSELECTRICA SA
The values of the concentration indicators for 2015 show a dominant participant and an
excessive concentration of the balancing market for all types of regulation. Compared to the
previous year, the total volume traded on BM increased by 16.6%.
The monthly volumes have consistently been well below under those traded on DAM, as
results from the following chart; the linking of the two markets (DAM and BM), was in
general correct. Hidroelectrica SA, the largest system services provider, functioned as under a
normal hydrologic year and the increased production from renewable sources, characterized

31.08.2016
Romanian Energy Regulatory Authority Page 57 of 109
0
50
100
150
200
250
300
350
400
450
lei/MWh
Preturi medii lunare inregistrate pe PZU si PE
Iulie 2005 - Decembrie 2015
Pret mediu pe PZU Pret mediu de deficit Pret mediu de excedent
Poly. (Pret mediu pe PZU) Poly. (Pret mediu de deficit) Poly. (Pret mediu de excedent)
by intermittent operation, as a result of starting the commercial operation of many wind and
photovoltaic units, let to the need to balance some significant differences on the production-
consumption balance and compliance with the value of the programmed sold by the system
operator.
0%
5%
10%
15%
20%
25%
30%
35%
40%
45%
50%
% din consumul intern
Volume tranzactionate pe PZU si PE
Volum tranzactionat spot (PZU) Volum tranzactionat PE
Source: Monthly reports of OPCOM SA and CN TRANSELECTRICA SA
The following chart describes the evolution of the monthly average settlement price of the
imbalances recorded by BRPs (surplus price and deficit price) for the period July 2005 -
December 2015. The average values of settlement prices for 2015 were 254.74 RON/MWh
for the deficit price (by about 4.7% higher than in 2014) and 15.89 Euro/MWh for the surplus
price (by about 48.4% lower than in 2014). It is noted that the values indicated are calculated
as the arithmetic mean of the hourly recorded prices.
Source: Daily/monthly reports of OPCOM SA
In 2015, the monthly additional value resulting from BM and BRP imbalance settlement had
the significance of a cost each month, the aggregate value throughout the period representing
a cost of 58.85 mil.RON, approx. 4.5 times higher than the amount recorded in 2014.
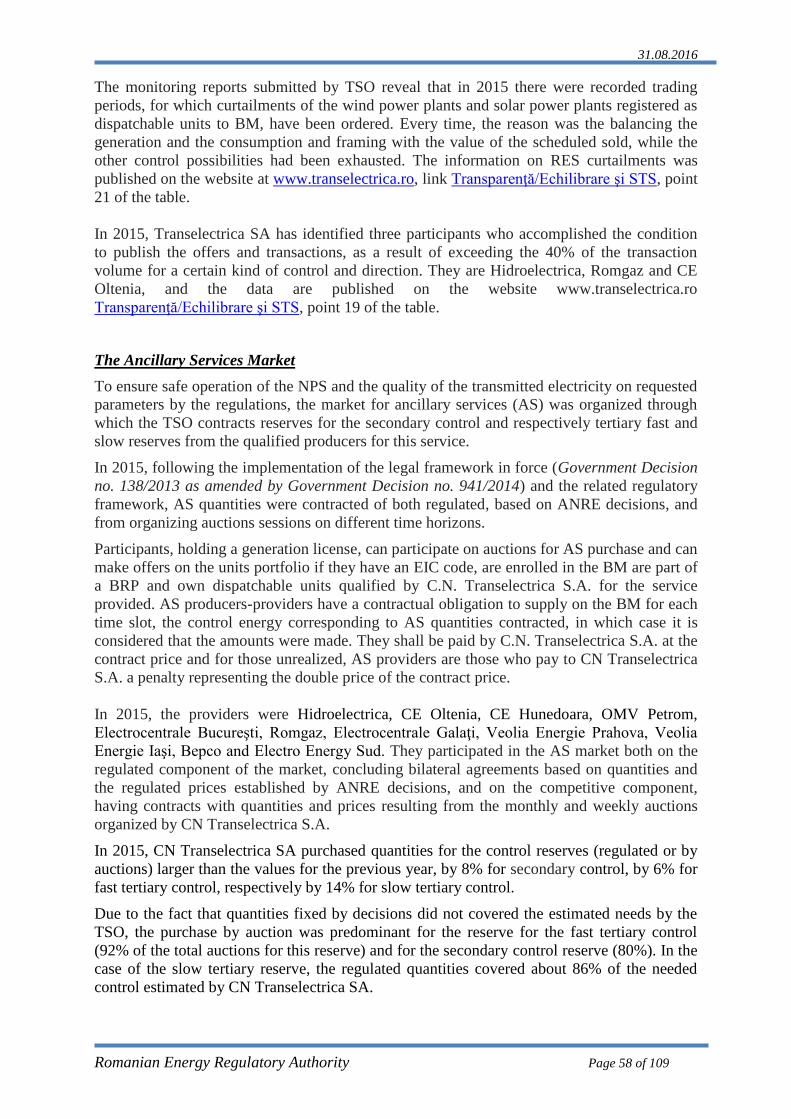
31.08.2016
Romanian Energy Regulatory Authority Page 58 of 109
The monitoring reports submitted by TSO reveal that in 2015 there were recorded trading
periods, for which curtailments of the wind power plants and solar power plants registered as
dispatchable units to BM, have been ordered. Every time, the reason was the balancing the
generation and the consumption and framing with the value of the scheduled sold, while the
other control possibilities had been exhausted. The information on RES curtailments was
published on the website at www.transelectrica.ro, link Transparenţă/Echilibrare şi STS, point
21 of the table.
In 2015, Transelectrica SA has identified three participants who accomplished the condition
to publish the offers and transactions, as a result of exceeding the 40% of the transaction
volume for a certain kind of control and direction. They are Hidroelectrica, Romgaz and CE
Oltenia, and the data are published on the website www.transelectrica.ro
Transparenţă/Echilibrare şi STS, point 19 of the table.
The Ancillary Services Market
To ensure safe operation of the NPS and the quality of the transmitted electricity on requested
parameters by the regulations, the market for ancillary services (AS) was organized through
which the TSO contracts reserves for the secondary control and respectively tertiary fast and
slow reserves from the qualified producers for this service.
In 2015, following the implementation of the legal framework in force (Government Decision
no. 138/2013 as amended by Government Decision no. 941/2014) and the related regulatory
framework, AS quantities were contracted of both regulated, based on ANRE decisions, and
from organizing auctions sessions on different time horizons.
Participants, holding a generation license, can participate on auctions for AS purchase and can
make offers on the units portfolio if they have an EIC code, are enrolled in the BM are part of
a BRP and own dispatchable units qualified by C.N. Transelectrica S.A. for the service
provided. AS producers-providers have a contractual obligation to supply on the BM for each
time slot, the control energy corresponding to AS quantities contracted, in which case it is
considered that the amounts were made. They shall be paid by C.N. Transelectrica S.A. at the
contract price and for those unrealized, AS providers are those who pay to CN Transelectrica
S.A. a penalty representing the double price of the contract price.
In 2015, the providers were Hidroelectrica, CE Oltenia, CE Hunedoara, OMV Petrom,
Electrocentrale Bucureşti, Romgaz, Electrocentrale Galaţi, Veolia Energie Prahova, Veolia
Energie Iaşi, Bepco and Electro Energy Sud. They participated in the AS market both on the
regulated component of the market, concluding bilateral agreements based on quantities and
the regulated prices established by ANRE decisions, and on the competitive component,
having contracts with quantities and prices resulting from the monthly and weekly auctions
organized by CN Transelectrica S.A.
In 2015, CN Transelectrica SA purchased quantities for the control reserves (regulated or by
auctions) larger than the values for the previous year, by 8% for secondary control, by 6% for
fast tertiary control, respectively by 14% for slow tertiary control.
Due to the fact that quantities fixed by decisions did not covered the estimated needs by the
TSO, the purchase by auction was predominant for the reserve for the fast tertiary control
(92% of the total auctions for this reserve) and for the secondary control reserve (80%). In the
case of the slow tertiary reserve, the regulated quantities covered about 86% of the needed
control estimated by CN Transelectrica SA.

31.08.2016
Romanian Energy Regulatory Authority Page 59 of 109
Monthly, increases of the acquisition for the secondary control reserve were recorded, the
values of these increases ranging from 0 to 25%, excepting March 2015, when a decrease by
1%, compared to the value in March 2014, was recorded.
The monthly purchase for the fast tertiary control service recorded large variations compared
to those in 2014, pointing out that for March 2015 the purchase was lower by 21% than in the
same period of 2014 and that in April 2015 the purchase increased by 115%.
In the first half of 2015, it is noted the increase of the purchased quantities for the slow
tertiary reserve with values between 15-82% compared to 2014, while on the second half of
the year, CN Transelectrica SA purchased constantly on both components on the AS market
(regulated and competitive), values lower than in the same period of 2014.
In the second half of the year 2015, the structure of acquisition of AS services has changed
between the two components: regulated and competitive, when was recorded a significant
decrease of the share of the regulated market component, for each type of reserve, in favour of
competitive market.
In the first half of the year, the purchase of the slow tertiary reserve was covered only based
on ANRE decisions. There were registered, every month of 2015, assignments of the
regulated contracts among qualified participants for providing the service for slow tertiary
control.
If in the first 6 months of 2015, the regulated tariffs for the 3 types of reserves remained at the
same level as in 2014, since July 2015, the tariffs were changed. The prices resulting from the
auctions varied between 40-63 RON/h*MW for secondary control reserve, in the range of
23.13 to 30.30 RON/h*MW for fast tertiary reserve and within 7.04 to 12.32 RON/h*MW for
the slow tertiary reserve.
The following table shows the concentration indicators on the AS market in 2015, based on
the information reported by CN Transelectrica SA and respectively the qualified producers for
this service.
Year 2015 Secondary
reserve
Fast tertiary
reserve
Slow tertiary
reserve
Regulated
component
Contracted quantity
(h*MW) 767,310 480,890 6,304,000
C1 (%) 77.2 63.6 63.9
C3 (%) 100 100 97.3
Competitive
component
Contracted quantity
(h*MW) 3,136,625 5,662,030 1,054,320
C1 (%) 73.5 89.7 74.2
C3 (%) 94.8 94.0 94.1
HHI 5728 8070 5756
Source: Monthly reports of C.N. TRANSELECTRICA S.A.
In 2015, it is noted the high degree of concentration on all three reserves purchased by C.N.
Transelectrica S.A., both on regulated component as well as on the competitive one.

31.08.2016
Romanian Energy Regulatory Authority Page 60 of 109
Therefore, during the first half of the year, the producers CE Oltenia and CE Hunedoara
received regulated quantities on all three types of reserves, plus Hidroelectrica for the a
secondary reserve and the fast tertiary reserve, respectively Electrocentrale Bucureşti,
Electrocentrale Galaţi şi Veolia Energie Prahova for the slow tertiary reserve.
It is noted that the larger share of purchased quantities for the secondary and fast tertiary
control, on the competitive component, was offered by the hydro producer; the difference was
covered by 5 producers with market shares ranging between 0.7%-17.3% for the secondary
reserve and 10 producers with market shares ranging between 0.1-2.3% of the total annual
purchased quantity through market mechanism for every type of reserve. For the slow tertiary
reserve, the larger quantity was covered by the producer Romgaz, and the difference by 3
producers with market share ranging between 5.9-13.3%.
3.2.2. Electricity retail market
3.2.2.1 Monitoring the level of prices, the level of transparency, the level and
effectiveness of market opening and competition
In 2015, the number of electricity suppliers operating on the retail market was 96, of which 21
holders of a generation license and 5 suppliers of last resort.
Electricity supplied by SoLR was approx. 14128 GWh, with a decrease of 7.1% compared to
2014, given the increase of the final consumption with approx. 3.9%.
Regarding the evolution of the structure of electricity consumption to final consumers, based
on data processed by ANRE, the data presented in the table below emphasize the followings:
Source: Monthly reports of the suppliers
final electricity consumption recorded in 2015 increased by approx. 3.9% from the
level recorded in the previous year;
increase by 3.3% of the household consumption in 2015 compared to 2014, but
maintaining its share in the final consumption structure;
consumption increase by 9.7% for the non-households who have switched supplier
compared to 2014 and increase of its share in the final consumption;
decrease consumption for the non-households supplied by universal service and by last
resort by approx. 40.8% in 2015 compared to 2014 and also the decrease of its share in
the final consumption.
In December 2015, on the competitive market were 112018 non-households consumers, the
electricity supplied to them in 2015 being 32076 GWh.

31.08.2016
Romanian Energy Regulatory Authority Page 61 of 109
The evolution of the number of customers in the supply competitive market is shown
graphically from the beginning of the market opening in the following figure. As it can be
noted, the number of the customers who has changed the electricity supplier strongly
increased in 2015, due to the evolution of the monitoring process of the acomplishing the
conditions imposed by the regulated framework for the supply by universal service to the non-
household customers. The electricity supplied ranged from one month to another, recording
higher or equal values to 2500 GWh/month. Since January 2011, the supplied electricity
includes the amount of self-supplied electricity to other consumption sites by the dispatchable
producers whose self-provided quantities exceeded 200 GWh in the previous year.
0
500
1000
1500
2000
2500
3000
0
20000
40000
60000
80000
100000
120000
IAN2005
IUL IAN2006
IUL IAN2007
IUL IAN2008
IUL IAN2009
IUL IAN2010
IUL IAN2011
IUL IAN2012
IUL IAN2013
IUL IAN2014
IUL IAN2015
IUL
GWh/luna
Nu
ma
r cl
ien
ti
Evolutia numarului clientilor alimentati in regim concurential si a energiei electrice furnizate acestora
Numarul de clienti alimentati in regim concurential Energia electrica furnizata clientilor alimentati in regim concurential
Source: Monthly reports of the suppliers
The values of competitive retail market concentration indicators during 2007-2015, showed in
the following table, highlights a positive evolution regarding the descrease of the
concentration. The year 2015 is characterized by a non-concentrated market, due to the large
number of suppliers who competed on this market and to their separation as market power.
Year C1 HHI
2007 19% 904
2008 17% 659
2009 16% 669
2010 14% 562
2011 13% 467
2012 12% 530
2013 12% 570
2014 13% 557
2015 15% 548

31.08.2016
Romanian Energy Regulatory Authority Page 62 of 109
Although on the overall competitive retail electricity market, indicators show an non-
concentrated market, at the level of its consumption categories, it is found that the lack of
concentration is maintained only for IC, ID, IE and Others categories, while at the IB and IF
categories is recorded a moderate level of concentration, and for the IA consumption category
there is a high level of concentration.
Indicatori - an 2015
IA IB IC ID IE IF Altii
C1 - % - 29 25 23 15 17 25 16 15
C3 - % - 74 52 42 33 37 47 36 32
HHI 2030 1210 920 610 714 1064 794 548
Consum - GWh - 794 3837 3378 8003 4350 2014 9701 32076
NR. FURNIZORI 67 81 72 66 37 22 23 96
nr. furnizori de ultimă instanţă 5 5 5 5 4 3 3 5
nr. furnizori concurentiali 49 62 55 53 29 16 15 70
nr. producatori 13 14 12 8 4 3 5 21
Total PAM
conc
Categorie consumator
Source: Monthly reports of suppliers – ANRE processing data
In the following graphs, the market shares for the year 2015 of suppliers of final customers
are shown, calculated for the entire retail electricity market (the first graph) and respectively
for the competitive component of the retail market (the second graph).
Source: Monthly reports of suppliers

31.08.2016
Romanian Energy Regulatory Authority Page 63 of 109
Source: Monthly reports of suppliers
Source: Monthly reports of suppliers
The supplier switching rate for 2015, shown in the following table, is determined for each
type of consumer in two ways: by the number of consumption sites that have switched
supplier in 2015 and according to the energy supplied to those consumption sites. It is noted
that the self-consumption of the largest industrial consumers who also have a supply license
and have decided to buy the electricity on the wholesale market, as competitive suppliers, is
not included.

31.08.2016
Romanian Energy Regulatory Authority Page 64 of 109
No. Consumer type
Supplier switching rate (%)
No. of
consumption
sites
Supplied
electricity
1. SMALL non-households + Households
(contracted power less than or equal to 100 kW) 0.381 7.141
2. LARGE non-households
(contracted power between 100 kW and 1000 kW) 13.343 26.733
3. VERY LARGE non-households
(contracted power higher or equal to 1000 kW) 41.400 30.248
4. TOTAL Retail market 0.432 18.374
Source: suppliers data, ANRE processing data
The rate value of supplier switching for the retail market determined on the basis of the
number of consumption sites has registered high increases compared to last year’s values,
which indicates that consumer migration from one supplier to the other was resumed; there
can be noticed significant increases of the indicator for small non-households and households
category, as a result of the deregulation process undertaken in Romania.
The evolution of the supplier switching rate on the number of consumption sites in 2008-2015
is shown below:
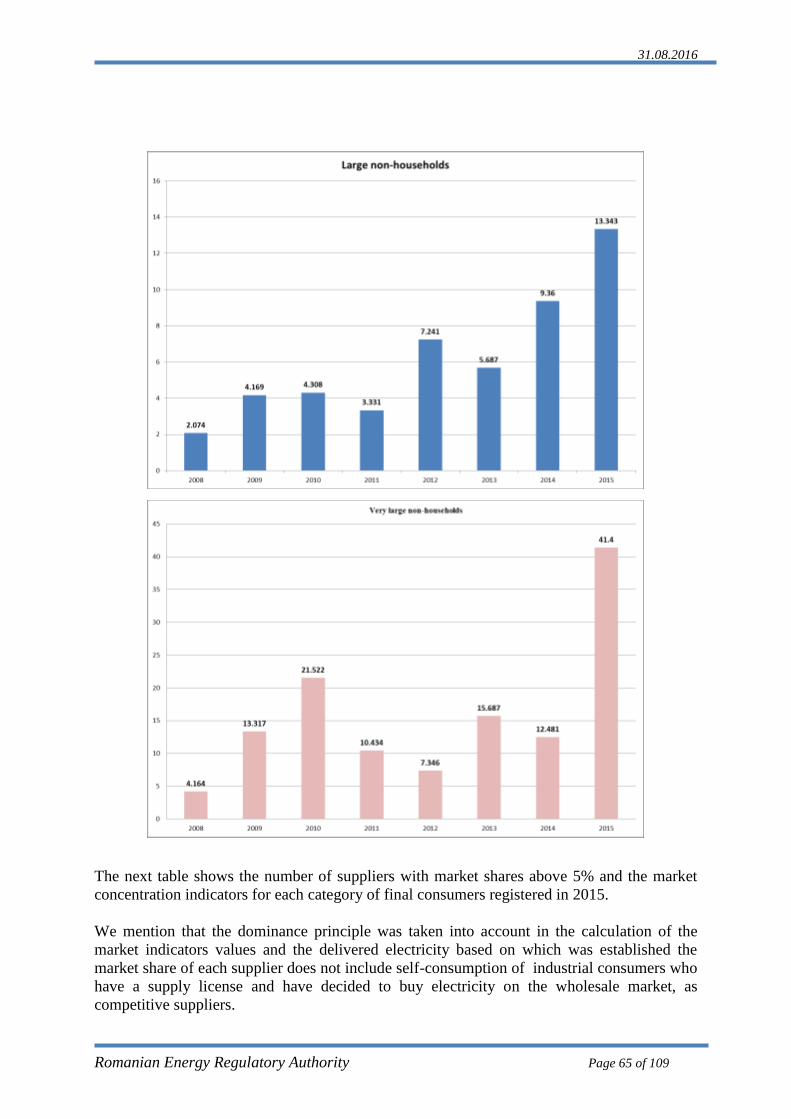
31.08.2016
Romanian Energy Regulatory Authority Page 65 of 109
The next table shows the number of suppliers with market shares above 5% and the market
concentration indicators for each category of final consumers registered in 2015.
We mention that the dominance principle was taken into account in the calculation of the
market indicators values and the delivered electricity based on which was established the
market share of each supplier does not include self-consumption of industrial consumers who
have a supply license and have decided to buy electricity on the wholesale market, as
competitive suppliers.

31.08.2016
Romanian Energy Regulatory Authority Page 66 of 109
No.
Consumer type
Number of
suppliers with
market shares
above 5%
C1
(%)
C3
(%) HHI
1. SMALL non-households + Households
(contracted power less than or equal to 100 kW) 5 25 62 1612
2. LARGE non-households
(contracted power between 100 kW and 1000
kW)
5 27 49 1182
3. VERY LARGE non-households
(contracted power higher or equal to 1000 kW) 7 10 28 544
4. TOTAL Retail market 5 19 41 796
Source: supplier data, ANRE processing data
Values of market structure indicators calculated for 2015 indicate:
a non-concentrated market for retail market segment corresponding to very large non-
households and to the whole retail market;
a moderate level of concentration for the retail market segment corresponding to large
non-households and small non-households and households;
3.2.2.2 Recommendations on supply prices, investigations and measures to promote
competition
The following table shows average electricity selling prices for each category of non-
households supplied in the competitive market. It is noticed that the average price decreased
compared to 2014, when its value was 287.16 RON/MWh.
The average selling price resulted by dividing the total value of supplier revenues from sales
to a certain consumer category (including the value of services provided: transmission TG,
transmission TL, ancillary services, distribution, settlement, imbalances, BRP aggregation
taxes, measurement), to the total amount of electricity sold to that category. Prices do not
include VAT, excise or other taxes.
Framing consumers by categories was done on the basis of their annual forecast of
consumption in accordance with the provisions of Directive 2008/92/ EC. The following table
details the ranges of consumption to each category separately.
Consumer
category
Consumption
(MWh)
Average price
(RON/MWh)
IA 793,567.619 426.67
IB 3,836,647.229 372.25
IC 3,378,025.649 318.64
ID 8,002,935.633 290.25
IE 4,349,921.448 263.15
IF 2,013,780.999 234.78
Others 9,700,907.016 213.53
Total 32,075,785.594 276.06

31.08.2016
Romanian Energy Regulatory Authority Page 67 of 109
Regulated tariffs for households
Household’s regulated tariffs, applicable starting with 01.01.2015, were set and approved at
the end of 2014 by ANRE Order no. 157 of 15.12.2014, in accordance with the provisions of
the Methodology for establishing prices and tariffs for final consumers who do not use their
eligibility right, approved by ANRE Order no. 82/2013. After the calculations of the average
return price of electricity supplied at regulated tariffs, required in 2015, the regulated tariffs
in force, approved by ANRE Order no. 57/2014 were increased by 2.25%.
In determining the regulated tariffs approved by ANRE Order no. 157/2014 the following
justified costs for 2015 were taken into account:
- Acquisition, transmission and distribution costs, according to the tariffs
established by ANRE and quantities/prices of Decisions no. 2718 and 2719 of 15
December 2014;
- Supply cost of 4.5 RON/customer/month, equal to that used in determining tariffs
applicable in 2014 (regulated and CMC). This cost was split into the two
categories of activities (regulated supply tariff, respectively CMC tariff) by
applying the 45% related to the 2015 average degree of deregulation, resulting for
the electricity related to regulated tariffs a supply cost of 2.475
RON/customer/month;
- Regulated profit of 4 RON/MWh, equal to that used in determining tariffs applied
in 2014;
- The cost of participation in the centralized market taken into consideration at the
same level with that considered in setting the tariffs applied in 2014, respectively
0.10 RON/MWh;
- Correction representing sums due to be recovered in 2015, from the activity done
in the previous periods (7.20 RON/MWh);
- Additional amounts estimated as necessary in 2015 to compensate for reduced
income of SoLR from the reservation/subscription component of regulated tariffs
(reduced by 10% compared to the second semester of 2014, corresponding to the
degree of deregulation of the first semester of 2015, and by another 10%,
corresponding to the degree of deregulation of the second half of 2015).
The average return price of the electricity supplied at regulated tariffs, resulting in 2015 from
the application of regulated tariffs approved by ANRE Order no. 157/2014, was estimated at
404.46 RON/MWh.
Calculations determining the average return price of the electricity supplied at regulated
tariffs were resumed at the end of the first semester of 2015 for the second semester of 2015,
according to the provisions of the Methodology for setting tariffs applied by suppliers of last
Non-households categories
Base - IA <20 Base - IB 20 <500 Base - IC 500 <2000 Base - ID 2000 <20000 Base - IE 20000 <70000 Base - IF 70000 <=150000 Others >150000
Annual consumption in the range (MWh):

31.08.2016
Romanian Energy Regulatory Authority Page 68 of 109
resort to final customers, approved by ANRE Order no. 92/2015. Justified costs taken into
consideration for the second semester of 2015 were the following:
- Aquisition, transmission and distribution costs, according to tariffs set by ANRE and
quantities/prices from the decisions no. 2718 and 2719 of 15 December 2014;
- Regulated profit of 1.5% of justified costs (according to the provisions of the
Methodology approved by Order 92/2015);
- Supply activity cost of 4.5 RON/customer/month (standardized at the level of each
SoLR, for all categories of customers, in RON/MWh, according to the Methodology
approved by Order 92/2015);
- The cost of participation in the centralized market, of 0.05 RON/MWh;
- The balance of regulated tariff corrections from the previous periods (according to the
Methodology approved by Order 92/2015);
- Amounts estimated as necessary to compensate for the reduction in the second
semester of 2015 of income from the reservation/subscription component
(corresponding to the increase of the degree of deregulation in the second semester of
2015 by another 10%)
Following the calculations, the regulated tariffs approved by ANRE Order no. 157/2014 were
maintained throughout 2015, not being met the conditions for their adjustment at the end of
the first semester of 2015. Under these conditions, the average return price of the electricity
supplied at regulated tariffs, determined in the second semester of 2015 from the application
of regulated tariffs approved by ANRE Order no. 157/2014 was estimated at 403.98
RON/MWh.
CMC tariffs
1. According to the roadmap for phasing out regulated tariffs, provided by the Memorandum
of Understanding signed by the Romanian Government with the European Commission on 13
March 2012, in 2015 stages 8 and 9 of phasing out regulated tariffs were concluded. The
percentages of purchasing electricity from the competitive market for final customers who
have not used their eligibility right were:
- 100% of consumption for non-households and 40% of consumption for households for
the 8th
stage of phasing out regulated tariffs (1 January 2015 – 30 June 2015);
- 100% of consumption for non-households and 50% of consumption for households for
the 9th
stage of phasing out regulated tariffs (1 July 2015 – 31 December 2015);
Pursuant to the Methodology of establishing prices and tariffs for final customers who do not
use their eligibility right, approved by ANRE Order no. 82/2013, at the end of 2014, the
values of CMC tariffs were endorsed for the 8th
stage of phasing out regulated tariffs (1
January 2015 – 30 June 2015), as following:

31.08.2016
Romanian Energy Regulatory Authority Page 69 of 109
SoLR CMC tariffs January – June 2015
[RON/kWh]
HV
(110 kV)
MV
(1-110 kV
exclusive)
LV
(0.1-1 kV
inclusive)
S.C Electrica Furnizare S.A. (Approval no. 58/15 December 2014)
-Muntenia Nord 0.2704 0.3132 0.4518
-Transilvania Nord 0.2615 0.3088 0.4210
-Transilvania Sud 0.2670 0.3138 0.4362
S.C. CEZ Vânzare S.A. (Approval no. 57/15
December 2014) 0.2634 0.3118 0.4491
S.C. E.ON Energie România S.A. (Approval
no. 61/15 December 2014) 0.2504 0.2961 0.4386
S.C. Enel Energie Muntenia S.A. (Approval
no. 59/15 December 2014) 0.2463 0.2826 0.4177
S.C. Enel Energie S.A. (Approval no. 60/15 December 2014)
- Banat area 0.2668 0.3116 0.4453
- Dobrogea area 0.2612 0.3052 0.4505
Pursuant to the Methodology of establishing tariffs applied by suppliers of last resort to final
customers, approved by ANRE Order no. 92/2015, at the end of the first semester of 2015, the
values of CMC tariffs were endorsed for the 9th
stage of phasing out regulated tariffs (1 July
2015 – 31 December 2015), as following:
SoLR CMC tariffs July – December 2015
[RON/kWh]
HV
(110 kV)
MV
(1-110 kV
exclusive)
LV
(0,1-1 kV
inclusive)
S.C Electrica Furnizare S.A. (Approval no. 21/25 June 2015)
-Muntenia Nord 0.2627 0.3055 0.4441
-Transilvania Nord 0.2661 0.3134 0.4256
-Transilvania Sud 0.2667 0.3135 0.4359
S.C. CEZ Vânzare S.A. (Approval no. 20/25
June 2015)
0.2681 0.3166 0.4539
S.C. E.ON Energie România S.A. (Approval
no. 24/25 June 2015)
0.2682 0.3139 0.4564
S.C. Enel Energie Muntenia S.A. (Approval 0.2420 0.2783 0.4134

31.08.2016
Romanian Energy Regulatory Authority Page 70 of 109
no. 22/25 June 2015)
S.C. Enel Energie S.A. (Approval no. 23/25 June 2015)
- Banat area 0.2609 0.3057 0.4393
- Dobrogea area 0.2525 0.2965 0.4418
Starting with the second quarter of 2015, the purchase of electricity supplied at CMC tariffs
was done through the Centralized Market for Universal Service (CMUS), the justified
acquisition costs being set based on the closing prices of auctions held quarterly on the
CMUS.
CMC tariffs evolution is presented in the following graphs:
0.0000
0.0500
0.1000
0.1500
0.2000
0.2500
0.3000
0.3500
0.4000
0.4500
0.5000
sep-oct2012
noi-dec2012
ian-mar2013
apr-iun2013
iul-aug2013
sep-dec2013
ian-iun2014
iul-dec2014
ian-iun2015
iul-dec2015
lei/
kWh
CMC - High Voltage
Muntenia Nord Transilvania Nord Transilvania SudOltenia Moldova Muntenia SudBanat Dobrogea

31.08.2016
Romanian Energy Regulatory Authority Page 71 of 109
0.0000
0.1000
0.2000
0.3000
0.4000
0.5000
0.6000
sep-oct2012
noi-dec2012
ian-mar2013
apr-iun2013
iul-aug2013
sep-dec2013
ian-iun2014
iul-dec2014
ian-iun2015
iul-dec2015
lei/
kWh
CMC - Medium Voltage
Muntenia Nord Transilvania Nord Transilvania SudOltenia Moldova Muntenia SudBanat Dobrogea
0.0000
0.1000
0.2000
0.3000
0.4000
0.5000
0.6000
0.7000
sep-oct2012
noi-dec2012
ian-mar2013
apr-iun2013
iul-aug2013
sep-dec2013
ian-iun2014
iul-dec2014
ian-iun2015
iul-dec2015
lei/
kWh
CMC - Low Voltage
Muntenia Nord Transilvania Nord Transilvania SudOltenia Moldova Muntenia SudBanat Dobrogea
Regulated tariffs for households in 2016
Under the Methodology for setting tariffs applied by suppliers of last resort to final
customers, approved by ANRE Order no. 92/2015, at the end of 2015 the household’s
regulated tariffs were approved, applicable starting with 01.01.2016 (by ANRE Order no.
176/2016). After the calculations for establishing the average return price of electricity

31.08.2016
Romanian Energy Regulatory Authority Page 72 of 109
supplied at regulated tariffs, necessary in 2016, resulted that conditions are met for the
reduction by 5.36% of regulated tariffs in force at the end of 2015.
CMC tariffs
Under the Methodology for setting tariffs applied by suppliers of last resort to final
customers, approved by ANRE Order no. 92/2015, the CMC values were approved for the
10th
stage of phasing out regulated tariffs (1 January 2016 – 30 June 2016), as follows:
SoLR CMC tariffs January - June 2016 [RON/kWh]
HV
(110 kV)
MV
(1-110 kV
exclusive)
LV
(0,1-1 kV
inclusive)
S.C Electrica Furnizare S.A. (Approval no. 37/22 December 2015)
-Muntenia Nord 0.2906 0.3273 0.4461
-Transilvania Nord 0.2859 0.3301 0.4337
-Transilvania Sud 0.3079 0.3502 0.4587
S.C. CEZ Vânzare S.A. (Approval no. 36/22
December 2015) 0.2899 0.2899 0.2899
S.C. E.ON Energie România S.A. (Approval no.
40/22 December 2015) 0.2996 0.2996 0.2996
S.C. Enel Energie Muntenia S.A. (Approval no.
39/22 December 2015) 0.2669 0.2669 0.2669
S.C. Enel Energie S.A. (Approval no. 38/22 December 2015)
- zona Banat 0.2878 0.3258 0.4393
- zona Dobrogea 0.2784 0.3169 0.4437
In the 10th
stage of phasing out regulated tariffs, the percentages of purchasing electricity
from the competitive market for final customers who have not used their eligibility right are:
- 100% of non-households consumption,
- 60% of household’s consumption.
The values of the average prices paid for electricity consumption by Romanian final
customers, both from the regulated and competitive market (for non-households category,
except those with consumption higher than 150,000 MWh annually, respectively for the
household’s category) in 2012-2015 periods are shown in the table below:
HOUSEHOLDS NON-HOUSEHOLDS
Price without
taxes
Price with
taxes
Tariff for
services
Price without
taxes
Price with
taxes
Tariff for
services
RON/MWh RON/MWh RON/MWh RON/MWh RON/MWh RON/MWh
2012 365.24 482.43 213.83 361.37 468.37 123.02
2013 400.11 581.31 232.74 364.45 534.42 134.35

31.08.2016
Romanian Energy Regulatory Authority Page 73 of 109
2014 412.06 575.07 234.66 318.97 455.35 138.77
2015 422.81 592.80 231.73 321.42 463.83 130.54
Taxes include VAT, excise, cogeneration contribution and the value of green certificates, and
the services tariff is the average price for the transmission, distribution, ancillary services and
market operation.
3.3. Security of electricity supply
According to the provisions of Article 24 of Law no. 123/2012 on electricity and natural gas,
in case of an unexpected crisis in the electricity market and where physical safety or security
of persons, appliances or installations or system integrity is threatened, transmission and
system operator may propose ANRE and the relevant ministry to adopt safety measures. The
measures taken in these situations should cause the least effect on the proper functioning of
the European internal market and strictly aim at solving the crisis that generated them.
Implementation of these measures is done by Government Decision, initiated by the relevant
ministry.
During 2015, there were no crisis situations in the electricity market.
3.3.1 Monitoring the balance between supply and demand
In 2015, electricity generation was of 65.598 TWh, about 1.1% higher than in 2014. Internal
consumption amounted at about 58.87 TWh, about 2% higher than in 2014. Romania was a
net electricity exporter during 2015, the import-export balance being negative (- 6.729 TWh).
Regarding the used resources, big differences have not been registered compared to 2014.
Nuclear and hydro generation registered decreases of 0.26%, respectively 3.88%. Increases
were registered in the coal and biomass-based electricity generation (0.02%), solar generation
(0.53%), wind generation (1.21%) and hydrocarbons generation (2.37%).
Maximum gross consumption in 2015 was 176 MW higher than the maximum value recorded
in 2014, but also with 321 MW higher than the consumption peak of 2013. Thus maximum
gross consumption was of 9479 MWh/h and was registered on 8 January 2015 at 6 pm. The
minimum value of consumption (4177 MWh/h) was recorded in 12 April 2015, at 3 pm.

31.08.2016
Romanian Energy Regulatory Authority Page 74 of 109
Source: CN Transelectrica SA
The sum of the net maximum installed generation capacity of individual plants at 31
December 2015 was of 20.419 GW, of which 10.623 GW renewable resources and 9.796 GW
conventional sources. Net available power and consumption values on the third Wednesday of
the month at 11 CET (net values) are shown below.
Source: CN Transelectrica SA
The generation park of a system is considered adequate if it can meet the demand of
electricity in all the stationary states of the system under normal conditions. For a perspective
evaluation, this capacity is verified for the time of year when NPS reaches the maximum
consumption; namely, peak winter evening, using the methodology applied by ENTSO-E at
European level.
Installed capacity is required to be significantly higher so that the generation park can provide
available power because generation units are periodically removed from operation for repairs
and maintenance, are affected by unplanned unavailability or partial reduction of the
availability due to different causes. Also, an operational reserve should permanently be kept
available to the TSO. Currently, this is sized to quickly balance continuous consumption
variations and the unexpected disconnection of the largest units in the system. After the
mobilization of the rapid reserve, this must be replaced by loading the slow tertiary reserve so
that it can be used in the next incident.
The structure of resources used for electricity generation
January 2014 – December 2015
Net available power
Consumption

31.08.2016
Romanian Energy Regulatory Authority Page 75 of 109
According to the specifications of the ENTSO-E study on system adequacy forecast (Scenario
Outlook and System Adequacy Forecast 2015 - 2030), the forecast of the net generation
capacities and of the electricity consumption in Romania on 2 work scenarios is presented
below:
Scenario A
2016 2020 2025
January
7:00 pm
July
7:00 pm
January
7:00 pm
July
7:00 pm
January
7:00 pm
July
7:00 pm
Net generation
capacity (GW) 21.14 21.14 22.95 22.95 25.25 25.25
Consumption
(GW) 7.91 6.12 8.18 6.29 9.02 6.81
Scenario B
2016 2020 2025
January
7:00 pm
July
7:00 pm
January
7:00 pm
July
7:00 pm
January
7:00 pm
July
7:00 pm
Net generation
capacity (GW) 21.27 21.27 24.59 24.59 26.98 26.98
Consumption
(GW) 7.91 6.12 8.18 6.29 9.02 6.81
3.3.2. Monitoring investment in generation capacities
The establishment of new generation capacities and the rehabilitation of existing ones are
done under authorizations issued by ANRE. The procedure for granting authorizations and
conditions of their grant: criteria, power levels, approvals, differentiated by power category
and activities are specified in the Regulation for granting authorizations and licenses in the
electricity sector, approved by ANRE Order no. 48/2013. Refusal to grant the authorization
or absence of a reply within the deadline, or any decision of the authority considered to be
unlawful or tortuous may be appealed to the Bucharest Court of Appeal in accordance with
legal provisions.
Authorizations granted in 2015 are presented in the table below:
No.
crt.
Authorized power plants
(by type of energy source)
No. of
authorizations
granted
Installed electrical
power of newly
authorized
capacities [MW]
1 Solar 27 208.48
2 Wind 3 42.05
3 Hydrocarbons 9 82.57
4 Hydro 5 31.76
5 Biomass 3 22.00
Total 47 Total 386.86
During 2015 a number of 42 authorizations expired. The energy capacities related to these
authorizations are totalling 917 MW within 31 solar power plant projects, 9 projects of wind
power plants and two thermo power plants. At ANRE’s request, part of the economic
operators, holding of the expired authorizations, declared that they have given up

31.08.2016
Romanian Energy Regulatory Authority Page 76 of 109
establishment of energy capacities because of the economic context that is unfavourable to the
continuation of investment projects. Part of them requested and obtained new authorizations
in order to continue projects or declared that they would obtain the authorizations prior to
starting postponed works.
ANRE approved until 31 December 2015 generation capacities of renewable energy with a
total installed capacity of 4,662 MW. Of the total, 2,932 MW are wind turbines, 1,296 -
photovoltaic panels and 106 MW - biomass, biogas and landfill gas. At the same time, 328
MW are for small hydro, below 10 MW, out of which 228.8 MW in new power plants, 85.5
MW in refurbished power plants and 13.5 in old small hydro power plants. There are 70
accredited economic operators for the wind power generation, 514 for solar power, 89 for
hydro power and 25 for biomass and biogas.
The evolution of electric capacity installed in power plants that benefited from the promotion
system of E-RES and electricity produced in these plants for 2005 ÷ 2015 is presented in the
figure below. The amount of electricity that benefited from the support system for RES during
2015 was of 8,118 GWh.
By 2015, there was a high proportion of electricity generated from wind power plants. The
structure of E-RES generation that benefited from the promotion system through green
certificates in 2015 was the following:
- 60.90% electricity generated in wind power plants,
- 10.51% electricity generated in power plants that generate electricity based on hydraulic
power with installed power of up to 10 MW,
- 8.92% electricity generated in biomass-based power plants, including landfill gas and
fermenting sludge from wastewater treatment plants,
- 19.67% electricity generated in solar-based power plants.
The structure of E-RES generation and the related installed capacities that benefited from the
promotion system through green certificates during 2015, by type of source is presented
below:

31.08.2016
Romanian Energy Regulatory Authority Page 77 of 109
The bonus support scheme has been introduced for cogeneration capacities starting with April
2011. The scheme was notified to the Commission in accordance with European regulations
on state aid.
36 cogeneration producers benefited from the support scheme in 2015. The total amount of
electricity generated in high efficiency cogeneration that benefited from the bonus during
January – December 2015 was of 4.717 TWh (after adjustment carried out in the month of
March 2016), a decrease of 7.5% compared with the value registered in 2014.
Concerning the development of electricity
networks, the main investments proposed to be
made in accordance with the Power Transmission
Grid Development Plan - 2014-2023 are following:
To increase the exchange capacity on western and
south-western part of Romania, network
reinforcements are planned in the area that will
remove congestions, both on the direction E - W at
the border with Hungary and Serbia and on transit
direction N - S, by strengthening the corridor
Portile de Fier - Resita - Timisoara - Arad. Source: CN Transelectrica SA – Projects of common interest
Considering the contribution to the implementation of European Union strategic priorities
regarding the Trans-European energy infrastructure, these projects have been included by the
European Commission in the first list of projects of common interest (PCIs), reload and
approved in the second list. The projects taken into consideration are the following:
Overhead Line 400 kV d.c. Reşiţa (RO) – Pancevo (Serbia);
Overhead Line 400 kV Porţile de Fier – Reşiţa and development of the power station
220/110 kV Reşiţa by the a new building of 400 kV;
Pass to 400 kV of Overhead Line (OHL) 220 kV d.c. Reşiţa –Timişoara – Săcălaz – Arad,
including the building of the power stations 400 kV Timişoara and Săcălaz.
Projects will also allow integration in the National Power System of wind power generation
units expected in the South-West (Banat) and the existing Portile de Fier hydroelectric power
plant.

31.08.2016
Romanian Energy Regulatory Authority Page 78 of 109
To increase the transmission capacity in the East area, with Republic of Moldova,
asynchronous interconnection by converting stations back-to-back is analysed. OHL 400 kV
Suceava (RO) - Balti (Moldova) will increase the transmission capacity provided by the OHL
400 kV Isaccea (RO) - Vulcanesti (MD) and four OHL 110 kV. Using the maximum capacity
of this project is conditioned also by the building of OHL 400 kV Suceava - Gădălin included
in the Plan.
To increase the transmission capacity between the eastern area (especially Dobrogea) and
the rest of the interconnected power system, several projects were planned to strengthen the
transmission network. To the projects provided in the 2010 edition of the Plan several projects
were added to increase the capacity of existing lines of 400 kV and 220 kV, by replacing the
conductors along the entire length or in segments with a section less than the rest of the line.
Among these projects, several major projects contribute significantly by increasing the
interconnection capacity with Bulgaria and strengthening the infrastructure that will support
the transmission of the flow of power between the Black Sea coast and the North Sea/Atlantic
Ocean coast, the implementation of the European Union strategic priorities regarding Trans-
European energy infrastructure, prerequisite for achieving energy and climate policy
objectives. These projects have been included by the European Commission in the first list of
Projects of common interest (PCIs). Part of these projects were resumed on the second list of
Projects of common interest.
Transmission projects in the East section (Dobrogea) that are included in the Development
Plan for the next ten years are the following:
OHL 400 kV d.c. Smârdan – Gutinaş;
OHL 400 kV d.c. Cernavodă - Stâlpu, input/output circuit in Gura Ialomiţei, that will be
continued with LEA 400 kV Stâlpu – Braşov;
There are also other projects dedicated to increasing the security of supply of consumption in
poor areas, retrofitting and modernization of existing plants.
The main investment objectives whose executions works will start during 2016-2018 are:
Technical upgrading of the electricity transmission network:
Technical upgrading of the 400/110/20 kV Domneşti station;
Technical upgrading of the 220/110/20 kV Turnu Severin East station;
Technical upgrading of the 400/110/20 kV Smârdan station;
Technical upgrading of the 220 kV Oţelărie Hunedoara station;
Upgrading the electrical transformer station 220/110/20kV Arefu;
Upgrading the electrical transformer station 220/110 kV Răureni;
Upgrading of 220/110 kV Dumbrava station;
Upgrading the electrical transformer station 220/110/20 kV Ungheni;
Assembling the transformer T3-250 MVA in the station 400/110 kV Sibiu South;
Connection of the Turnu Măgurele, Mostistea, Stâlpu, Teleajen stations to the fiber
optic network of Transelectrica - stage 2.
Increasing the interconnection capacity:
OHL 400 kV Gădălin-Suceava,
OHL 400 kV Suceava –Bălți,
Integration of new power plants and congestions removal: Ostrovu Mare station
OHL 400 kV Ostrovu Mare-RET;

31.08.2016
Romanian Energy Regulatory Authority Page 79 of 109
Upgrading 110 kV Bacau South and Român North stations related to 400 kV Moldova
axis
OHL 400 kV Cernavodă - Gura Ialomiței - Stâlpu,
OHL 400 kV Smârdan-Gutinaș.
Developing the system operator capabilities (dispatching)
Integrated platform for operative management of NPS;
System components replacement EMS SCADA AREVA.
IT and telecommunications infrastructure modernization – with the main projects:
Electronic communications network upgrade;
Messaging and related applications upgrade;
Measurement management of the electricity transited on the wholesale market;
Platform for the metered data management of the wholesale electricity market.
Investments in the network development are recovered through the transmission tariff set by
the regulatory authority based on the justified costs under a reasonable level of profit.

31.08.2016
Romanian Energy Regulatory Authority Page 80 of 109
4. Natural gas market
4.1. Network regulation
4.1.1. Unbundling
According to the provisions of Law no. 123/2012 on electricity and natural gas, the transport
and system operator is organised and operates according to the independent system operator
model (ISO). With the entry into force of the Law no. 117/2014 approving Government
Emergency Ordinance no. 6/2014, ANRE assessed the new certification conditions and
approved the certification of the National Gas Transport Company "TRANSGAZ" - SA
Medias, by issuing ANRE Order no. 72/06.08.2014. ANRE Order was notified to the
European Commission.
Distribution operators are holders of distribution licenses, which have the specific function
of natural gas distribution in one or more defined areas. At the end of 2015, on the Romanian
natural gas market, 40 companies had distribution licenses.
Undertakings from the natural gas sector which carry out regulated activities (transport,
storage, distribution, supply) are obliged to ensure separate accounting, legal, functional and
organizational separation. Distribution operators that serve a maximum of 100,000 final
customers are exempt from the provisions on legal separation.
Undertakings from the natural gas sector have the obligation to submit to ANRE the
regulated accounting records until the 1st of July (for the distribution and supply activities)
and 31st of August (for the storage and transport activities), of the regulatory year following
the one for which the reporting is done.
The regulated accounting records analysed contain the following assessment situations:
- Incomes,
- Expenditures,
- Tangible/intangible assets,
- Inventory assets.
Also, natural gas undertakings have the obligation to submit to ANRE, for review and
approval, reports on separation, activity that involves checking assumptions, criteria and rules
that will be the basis for the preparation of separate accounting records, which would allow
obtaining information on costs, revenues, tangible and intangible assets and inventory items
related to regulated activities carried out.
S.C. E.ON Gaz Romania S.A. and S.C. Distrigaz Sud S.A., as distribution system operators
had the obligation to establish separation of accounts, legal, functional and organizational
separation between the distribution and supply of natural gas. In the case of S.C. E.ON Gaz
Romania SA, as a result of legal separation by dividing the society, two legally independent
companies have resulted - E.ON Gaz Romania S.A., specializing in the supply of natural gas
and E.ON Gas Distributie SA, specializing in gas distribution as well as operation and
maintenance of the distribution network. The two new companies have different offices. The
legal unbundling process of the other large distribution operator S.C. DISTRIGAZ Sud S.A.
was completed in April 2008, resulting S.C. Distrigaz Sud Retele SRL, specializing in gas
distribution as well as operation and maintenance of the distribution network, and S.C.

31.08.2016
Romanian Energy Regulatory Authority Page 81 of 109
DISTRIGAZ Sud S.A. (later S.C. GDF SUEZ ENERGY ROMANIA and ENGIE ROMANIA
etc.), specializing in the supply of natural gas.
Regarding the legal unbundling obligation for underground storage activity, the requirement
was performed by the storage operator S.C. Depomureş S.A. The legal unbundling process of
the largest storage operator – S.N.G.N. ROMGAZ S.A. is still ongoing. Measures were taken
to sanction S.N.G.N. ROMGAZ S.A. for noncompliance with the legal unbundling obligation
of the natural gas storage activity.
Other distribution system operators, serving less than 100,000 final customers and that don’t
have the obligation of legal separation, have established separate accounting records for
regulated activities starting with 2007.
The licensed undertakings of natural gas submit annually to the regulatory authority the
financial reports and regulated accounting for the regulated activities carried out by them in
the gas sector.
Prior to sending to the regulatory authority, the required documents should be audited/verified
in accordance with the legal provisions in force, checking especially the compliance with the
obligation to avoid cross-subsidization between activities.
4.1.2. Technical functioning
The conditions and rules for using the natural gas transport system in Romania and the
transparent and non-discriminatory access of third parties are regulated by the Network Code.
In 2013, the document was reviewed and approved by ANRE Order no.16/2013.
The European legislative framework evolution, materialized in adopting the European
network codes on capacity allocation mechanisms in the natural gas transport systems,
congestion management procedures and balancing of natural gas transport systems led to the
necessity of starting a comprehensive process of review of the NTS Network Code, approved
by ANRE Order no. 16/2013 with subsequent amendments and additions, in order to
implement on a national level the European regulations taking into consideration the options
provided by these regulations.
This process materialized by approving ANRE Order no. 160/2015 on the amendment and
supplementation of the NTS Network Code approved by ANRE Order no. 16/2013, with
subsequent amendments and additions, taking into consideration the following elements:
a. Making amendments and additions only regarding the chapters in the Network Code
on the nomination/re-nomination, allocation and calculation of the final daily recorded
imbalances value, chapters mentioned in the first stage of the amendment and
supplementation of the Network Code provided by ANRE Order no. 54/2014 on some
measures for natural gas market development;
b. Solving problematic issues identified up to the moment of drafting the order, taking
into consideration the capability of S.N.T.G.N. TRANSGAZ S.A. to implement the
proposed amendments, according to which, for the 2015-2016 gas year it can be
considered only a limited use of the Virtual Trading Point (VTP) – only for projected
and final imbalances subject to Gas Transfer Facility (GTF), considering the capacity
reservations already made for the 2015-2016 gas year;

31.08.2016
Romanian Energy Regulatory Authority Page 82 of 109
c. reconsidering the principles applicable in case of the capacity transfer between
network users both in the NTS entry points and NTS exit points, having regard to the
reorganization of the natural gas transport system according to the "entry-exit" model
in which the capacity reservation in the entry points is independent of capacity reserve
in exit points;
d. ensuring a high degree of clarity to the regulation and specifying the exact duties of
each party involved in the specific procedures of the Network Code. In this regard,
especially concerning the correlation and allocation procedures, it was considered
limiting the responsibility of NTS neighbouring system operators only to the level of
the responsibilities assumed by them through the contracts concluded directly with
system users and their direct partners in the entry/exit in/from the NTS mentioned in
the nominations made;
e. inclusion in the Network Code of the methodology for calculating the value of daily
recorded imbalances of network users provided in the S.N.T.G.N. TRANSGAZ S.A.
report on the implementation of interim measures, given the approval of this report by
ANRE Decision no. 2296/11 November 2015.
According to the provisions of Article 45 paragraph (1) and (3) of the Commission Regulation
(EU) No. 312/2014 of 26 March 2014 establishing a Network Code on Gas Balancing of
Transmission Networks, in the absence of sufficient liquidity of the short term wholesale gas
market, suitable interim measures referred to in Articles 47-50 of the Regulation shall be
implemented by the TSOs, these being developed and implemented by each TSO, in
accordance with a Report, referred to in Article 46(1) of the Regulation, approved by the
national regulatory authority in accordance with the procedure set out in Article 46 of the
Regulation.
In this context, ANRE has assessed both the interim versions and the final version of the
S.N.T.G.N. TRANSGAZ S.A. report on the implementation of interim measures, proceeding to
consultation with national regulatory authorities from Bulgaria - Energy and Water
Regulatory Commission (EWRC) and Hungary - Energy and Public Utility Regulatory
Authority (HEA) on Report content in accordance with Article 46 paragraph (5) in
conjunction with the provisions of Article 27 paragraph (2) of the Regulation.
After the assessment of the final version of the Report of S.N.T.G.N. TRANSGAZ S.A.
ANRE Decision no. 2296/2015 was adopted, under which interim measures applicable in the
2015-2016 gas year were approved.
By the decision to approve the Report it was considered setting a deadline for submission by
S.N.T.G.N. TRANSGAZ S.A. to ANRE for endorsement of framework contracts of sale and
purchase of natural gas for balancing. This step was necessary given the fact that centralized
natural gas markets from Romania still do not provide the necessary conditions for trading
daily and intra-day standardized products, and the balancing platform that can be used as
temporary measure in accordance with Article 47 of the Regulation is still not available.
Under these conditions it is necessary the effective implementation of the alternative to the
balancing platform, as an interim measure, respectively, the operation, by the TSO, of the
natural gas sale/purchase trades to balance the NTS and the approval of the standard contracts
for sale/purchase of natural gas for balancing, whose role is precisely to compensate for the
absence of contracts related to daily and intra-day trading products.
Also, given that the Report includes interim measures applicable specifically only for the gas
year 2015-2016, it was considered necessary that before the start of the next natural gas year
(2016-2017) an update of the Report to be made.

31.08.2016
Romanian Energy Regulatory Authority Page 83 of 109
Consequently, by ANRE Decision approving the Report it was taken into consideration
setting the obligation for S.N.T.G.N. TRANSGAZ S.A. to submit to ANRE up to 15 June
2016 the updated version of the Report and an accurate explanation of the elements that must
be considered in the updated version, namely: assessment of the balancing activity developed
during 1 December 2015 – 1 June 2016, the interim measures proposed for implementation in
the 2016-2017 gas year and the way in which the provisions of Regulation (EU) no. 312/2014
will be applied to the international gas transport networks.
Also during 2015, ANRE has developed and approved revised versions of the performance
standards for transport (ANRE Order no. 161/2015) and distribution services (ANRE Order
no. 162/2015).
Storage activity is regulated by the Regulation on programming, functioning and dispatching
of natural gas underground storage (ANRGN Decision no. 1353/2004). By this Regulation
are established technical, technological and commercial rules and requirements, designed to
ensure the development of the storage processes in a transparent, objective and non-
discriminatory way.
Natural gas storage activity programming is done by storage operators under their contracts
with the beneficiaries of the natural gas underground storage service.
For each year of storage, the deadline for the beginning of the programming of
injection/extraction of natural gas quantities to/from storage is the date of publication of the
Final List for reallocation of available capacities referred to in the Regulation on access. In
establishing storage programs on each underground storage at cycle, month, day, hour level,
storage operators have to consider the following:
1. compliance with the priority order in accordance with the Regulation on access;
2. technological regimes agreed with the TSO for each storage, for both injection and
extraction;
3. optimal technological regimes for the NTS, both for injection and extraction.
Underground storage operators post on their webpages the necessary public information,
including:
Initial list of available capacities for natural gas storage for the respective injection
cycle;
Requests Register for access to the underground storage of natural gas
Initial list for storage capacity allocation
Initial list for storage capacity reallocation
Final list for storage capacity allocation
Final list for storage capacity reallocation
List of remaining capacity available for reallocation
Weekly report on natural gas underground storage capacity.
In accordance with the provisions of Article 176 of Law no. 123/2012 on electricity and
natural gas, with subsequent amendments and supplements, in case of unexpected crisis in the
natural gas market and where physical safety or security of persons, appliances or installations
or system integrity is threatened, TSO may propose to the relevant ministry to adopt safety
measures. These measures should cause the least effect on the proper functioning of the
European internal market and be strictly designed to solve the crisis that generated them.

31.08.2016
Romanian Energy Regulatory Authority Page 84 of 109
Implementation of these safety measures is made by Government Decision, initiated by the
relevant ministry. ANRE monitors the implementation of the safeguard measures for the
natural gas market, in case these measures were adopted by the state.
During 2015, there were no crisis situations in the natural gas market.
4.1.3. Connection and network tariffs
For the regulated underground storage and transport activities, tariffs and prices are set based
on a „revenue–cap” methodology and for regulated distribution and supply activities, tariffs
and prices are set based on a „price-cap” methodology.
The regulatory period for any of the regulated activities is of 5 years, except for the first
regulatory period (transitory stage), which was established for 3 years.
The tariff system for the transport activity includes a set of "revenue-cap" type tariffs which
establishes total regulated revenue covering total costs related to one year of the regulatory
period. The tariff for the transport services through the National Transport System (NTS), for
the first and second regulatory period was unique, with a binomial structure.
By ANRE Order no. 32/2014 was approved the Methodology for establishing the regulated
revenue, the total revenue and the regulated tariffs for the natural gas transport activity, by
which was introduced the “entry-exit” tariff system.
Starting with 1 October 2015 by ANRE Order no. 136/2015, were approved the regulated
revenue, total revenue and transport tariffs for the transport of natural gas through the NTS,
valid until 30 September 2016, namely:
a) capacity reservation tariff per point/group of points of entry/exit for firm/interruptible
natural gas transport services through the National Transport System
RON/MWh/h
Point / group of points for
entry/exit in/from the NTS
Types of natural gas transport services
Long
term Short term
Annual Quarterly Monthly Daily
summer winter summer winter summer winter
Poin
t /
gro
up
of
po
ints
fo
r en
try
in
th
e N
TS
Group of entry points from
the production perimeters,
from LNG terminals and
biogas production facilities
or other gases that meet the
quality requirements to be
delivered/ transported
to/from the NTS
0.93 1.62 3.61 2.40 5.36 3.60 8.03
Group of entry points from
the interconnection with
other natural gas transport
systems from non-EU
member states (Medieșu
Aurit and Isaccea Import)
3.62 6.30 14.00 9.30 20.77 13.97 31.15
entry point from the
interconnection with other
natural gas transport
3.00 5.22 11.61 7.71 17.22 11.58 25.84

31.08.2016
Romanian Energy Regulatory Authority Page 85 of 109
systems from EU member
states (Csanadpalota)
Group of entry points from
the underground storages 1.43 2.48 5.52 3.67 8.19 5.51 12.28
Po
int/
Gro
up
of
exit
poin
ts f
rom
th
e N
TS
Group of exit points to
distribution systems,
upstream pipeline networks
and final consumers directly
connected to the transport
system
1.86 3.24 7.22 4.79 10.70 7.20 16.05
Group of exit points to
underground storages 1.50 2.60 5.79 3.85 8.59 5.78 12.89
Exit point from the
interconnection with other
natural gas transport
systems from EU member
states (Csanadpalota)
6.70 11.66 25.93 17.22 38.46 2.86 57.69
Exist point from the
interconnection with other
natural gas transport
systems from non-EU
member states (Ungheni)
0.81 1.41 3.13 2.08 4.64 3.12 6.96
b) volumetric tariff for the quantity of natural gas delivered to distribution systems: 3.63
RON/MWh;
c) volumetric tariff for the quantity of natural gas transported only through the NTS: 4.38
RON/MWh;
d) volumetric tariff for the quantity of natural gas transported: 3.53 RON/MWh.
Tariffs referred to in points b) and c) contain the tax value on monopol referred to in the
Government Ordinance no. 5/2013. The tariff referred to in point d) does not contain this
value.
A significant share in the structure of transport tariffs is represented by the monopoly tax and
the tax on special constructions. For example, in 2015, in the volumetric component of the
transport tariffs approved for SNTGN TRANSGAZ S.A. the two taxes had a share of approx.
3% for the quantity of natural gas transported to distribution systems and 19% for the quantity
of natural gas transported only by NTS.
Also, the share of costs over which the operator cannot interfere, but necessary for the
business (taxes, fees imposed by central and local authorities) in the average transport tariff is
19%.
The tariff system for the distribution activity includes differentiated tariffs on licensed
distribution operators and consumer categories.
For 2015, the categories of consumers for which the regulator establishes differentiated
distribution tariffs are the following:
1. Distribution tariffs
B.1. Consumption up to 23.25 MWh
B.2. Annual consumption between 23.26 MWh and 116.28 MWh

31.08.2016
Romanian Energy Regulatory Authority Page 86 of 109
B.3. Annual consumption between 116.29 MWh and 1,162.78 MWh
B.4. Annual consumption between 1,162.79 MWh and 11,627.78 MWh
B.5. Annual consumption between 11,627.79 MWh and 116,277.79 MWh
B.6. Annual consumption over 116,277.79 MWh .
2. Proximity distribution tariff
B.6.1. Customers with an annual consumption over 250,000 MWh.
For the distribution activity, a regulated unitary income is set to cover unitary costs related to
one year of the regulatory period. The value of distribution services are invoiced monthly for
a distribution system user.
Distribution tariffs are monomial and quantify fixed and variable costs related to the
distribution activity. Distribution tariffs apply to quantities of natural gas distributed. The
calculation methodology is approved by ANRE Order no. 42/2013, with subsequent
amendments and additions.
Transport and distribution tariffs for the most relevant categories of final customers are as
follows:
Cons.
Tariff
I4-1,I4-2
(Annual
consumption
418.6 TJ )
I1 (Annual
consumption
418.6 GJ)
D3 (Annual
consumption
83.7 GJ)
D3, D3b (Typical
household -
heating, food
preparation and
hot water)
EUR/GJ EUR/GJ EUR/GJ EUR/GJ
Transport
tariff
0.59 0.59 0.59 0.59
Distribution
tariff
1.74 2.14 2.17 2.14
The tariff system for the underground storage activity includes a set of revenue cap tariffs
which establishes total regulated revenue covering total costs for the operation during a year
of the regulatory period.
Under the provisions of ANRE Order no. 22/2012 approving the Methodology for approving
prices and setting regulated tariffs in the natural gas sector, with subsequent amendments and
additions, ANRE approved, by ANRE Orders no. 67/2015 and 58/2015, for licensed operators
for the operation of underground storage S.C. DEPOMUREŞ S.A. Targu Mures and
ROMGAZ S.A. Medias its branch Ploiesti, total income, regulated revenue, the fixed
component for capacity reservation and volumetric underground injection and extraction of
natural gas components related to the tariff for underground storage service, for the period
April 2015 - March 2016, the fourth year of the 3rd
regulatory period.
An important share in the storage tariffs structure is represented by the costs over which the
operator cannot interfere, but necessary for the business (taxes, fees imposed by central and
local authorities). Therefore, in the case of S.C. DEPOMUREŞ S.A. Targu Mures operator,
their share is of 7.18%, respectively S.N.G.N. ROMGAZ S.A. Mediaș with a share of 5.40%.

31.08.2016
Romanian Energy Regulatory Authority Page 87 of 109
Tariffs in force for natural gas storage activity, charged at the date of this report by the
licensed operators in the natural gas sector are the following:
Tariff component M.U
National Gas
Company Romgaz
S.A. Medias
S.C.
“Depomureş” -
S.A. Târgu Mureș
Fixed component for
capacity reservation
RON / MWh /
complete storage
cycle
13.68 6.12
Volumetric component
for natural gas injection RON / MWh 2.37 2.32
Volumetric component
for natural gas extraction RON / MWh 1.87 0.97
4.1.4. Cross-border issues
Monitoring investment plans
Concerning the approval and monitoring of the TSO investments plans by the regulatory
authority, we mention that these attributions are provided to the regulator by the provisions of
the Law no. 123/2012 on electricity and natural gas.
Natural gas transport system development plan during 2014-2023 period provides the
development directions of Romanian natural gas transport network and the main projects that
SNTGN Transgaz SA intends to implement over the next 10 years in order to achieve a
maximum degree of transparency regarding the development of the national natural gas
transport system and the possibility of updated information for market participants regarding
existing and planned transport capacities, so that, through public consultation, decisions on
investment in the gas transport network meet market requirements.
The Development Plan meets the requirements of the European energy policy regarding:
ensuring security of supply of natural gas;
Evolution of storage tariffs in the period 2008-2015

31.08.2016
Romanian Energy Regulatory Authority Page 88 of 109
increasing the interconnection level of the national natural gas transport network
to the European network;
increasing the flexibility of national natural gas transport network;
liberalization of the natural gas market;
creating an integrated natural gas market in the European Union.
Source: SNTGN Transgaz SA
TSO sent this plan to ANRE and it was approved by ANRE Decision no. 2819/2014.
Launching the approval process of the Second list of Projects of Common Interest and
approval of cost allocation methodology for these projects were the main actions undertaken
at European level under the provisions of Regulation (EU) no. 347/2013 on guidelines for
trans-European energy infrastructure.
ANRE held the process of evaluating the projects proposed by promoters of investments for
their inclusion in the Second list of Projects of Common Interest. In 2015 there were
numerous meetings to identify the needs for transport infrastructure in the region of Central
South-Eastern Europe.
Of the initiatives launched on this occasion we mention organisation of CESEC group and
promotion of natural gas pipeline which will ensure the link between Bulgaria and Austria via
Romania and Hungary (to interconnect Bulgaria - Romania - Hungary - Austria) in short
BRUA. The European Commission validated on 19 January 2016 funding to the sum of 179
million Euros the works to be carried by the TSO for the development of BRUA - Phase 1.
Thus, Transgaz will have some of the necessary funding to execute, on the Romanian
territory, the works in question.

31.08.2016
Romanian Energy Regulatory Authority Page 89 of 109
The project involves the development of a natural gas transport capacity between existing
interconnection points with natural gas transport systems in Bulgaria (at Giurgiu) and
Hungary (Csanadpalota) by building a new pipeline. The pipeline would have a total length of
550 km, on the corridor Giurgiu - Plateau - Corbu - Hurezani - Haţeg - Recaş - Horia and
three compression stations located along the pipeline (SC Corbu, SC Haţeg, SC Horia).
After commissioning, the project will ensure a natural gas transport capacity of 1.5 bln.cm/y
towards Bulgaria and 4.4 bln.cm/y towards Hungary. Project implementation deadline is 2019
and the estimated value amounts to 560 million euros.
Also, ANRE Order no. 157/2015 was issued approving the Methodology for the evaluation
of investments in Projects of Common Interest in the gas infrastructure, including risks
relating to them.
The methodology has been drafted according to the provisions of Article 13 paragraph (6) of
Regulation (EU) no. 347/2013 of the European Parliament and of the Council of 17 April
2013 on guidelines for trans-European energy infrastructure and repealing Decision No.
1364/2006/EC and amending Regulations (EC) no. 713/2009, (EC) no. 714/2009 and (EC)
no. 715/2009, and the Agency for Cooperation of Energy Regulators Recommendation no.
3/2014 on incentives for Projects of Common Interest and a common methodology for risk
evaluation.
The methodology describes the steps the TSO or storage operators has to go through in order
to obtain incentives, by evaluating investments in infrastructure projects for the
transport/storage of gas and the risks specific to these projects.
The methodology describes the criteria used by ANRE in the assessment of requests
submitted to it by TSO/SO to provide incentives for specific risks of infrastructure projects
for the transport/storage of gas, by comparison with the extent to which the specific risks
faced by the project are already covered by the regulated tariff. The analysis takes into
account the possibilities of avoiding specific risks through appropriate measures other than
incentives.
Considering the provisions of Article 12 paragraph (3) of Regulation (EU) no. 347/2013 of
the European Parliament and of the Council of 17 April 2013 on guidelines for trans-
European energy infrastructure and repealing Decision no. 1364/2006/EC and amending
Regulations (EC) no. 713/2009, (EC) no. 714/2009 and (EC) no. 715/2009, S.N.T.G.N.
Transgaz S.A. from Romania and Földgázszállító Zártkörűen Működő Részvénytársaság
(FGSZ) from Hungary, as project initiators, have submitted to ANRE a joint investment
request in Projects of Common Interest.
The request refers to the following Projects of Common Interest included in the Ten-year
development plan (TYNDP) 2013-2022 prepared by ENTSO-G and in the First list of
projects of common interest adopted by the European Commission in 2013, respectively:
- for Romania - the project 7.1.5 "Cluster, respectively gas transport corridor from the
Caspian region and the EU, by pipeline from Bulgaria to Austria via Romania and Hungary"
- for Hungary – projects 6.13 „Cluster, respectively gas transport corridor Romania-
Hungary-Austria” and 6.14 „Project of common interest to achieve reverse flow from
Csanadpalota or Algyő”.

31.08.2016
Romanian Energy Regulatory Authority Page 90 of 109
The projects aim to develop a transport infrastructure between four Member States: Bulgaria-
Romania-Hungary-Austria respectively connecting the four gas markets, thereby creating a
transport corridor to Central Europe to transport natural gas from the Caspian region and the
potential sources of the Black Sea.
The request has been notified to the Agency for Cooperation of Energy Regulators (ACER),
in accordance with the provisions of Article 12 paragraph (3) of Regulation (EU) no.
347/2013.
After analysing the request for cross-border cost allocation, by ANRE Decision no. 2080/7
October 2015 the method of cross-border costs allocation relating to Projects of Common
Interest from the First list of the European Union numbers 6.13, 6.14 and 7.1.5 was approved.
The request was submitted by the project initiator National Natural Gas Transport Company
Transgaz S.A. from Romania and Földgázszállító Zártkörűen Működő Részvénytársaság
(FGSZ) from Hungary, as follows:
a) National Natural Gas Transport Company Transgaz S.A. covers the costs relating to
developing on the Romanian territory of the Project of Common Interest no. 7.1.5,
from the First list of Projects of Common Interest of the European Union;
b) Földgázszállító Zártkörűen Működő Részvénytársaság covers the costs relating to
developing on the Hungarian territory of the Projects of Common Interest no. 6.14 and
6.15, from the First list of Projects of Common Interest of the European Union.
The coordinated decision of the ANRE and HEA (Magyar Energetikai És Közmű-
Szabályozási Hivatal) on the joint request for cross-border allocation of costs related to
Projects of Common Interest submitted by S.N.T.G.N. Transgaz S.A. from Romania and
Földgázszállító Zártkörűen Működő Részvénytársaság (FGSZ) from Hungary was signed at 6
October 2015. The coordinated decision from the regulatory authorities is used by the project
promoters to obtain financial assistance from the European Union as grants for the
project/projects.
4.1.5. Compliance with the provisions of the European legislation
Compliance with decisions of ACER and the Commission
According to the provisions of Article 102(^1) of Law no.123/2012 on electricity and natural
gas, with subsequent amendments and additions „ANRE shall respect and implement all
relevant decisions, legally binding, of ACER ... and the Government, line ministry and other
specialized agencies of the central government, where appropriate, will take all necessary
steps in this regard, according to their tasks and competences”.
In order to implement the provisions of the Regulation (EU) no. 1227/2011 and the provisions
of ACER Decision no. 01/2012 regarding the registration format in accordance with the
provisions of Article 9 paragraph (3) of REMIT and the need to adapt the national regulatory
framework to international developments concerning the implementation of REMIT, ANRE
Order no. 1/2015 was issued establishing the National Register of wholesale energy market
participants and approving the Registration Procedure of market participants to the
wholesale energy market, published in the Official Gazette of Romania no. 80/ 30 January
2015.

31.08.2016
Romanian Energy Regulatory Authority Page 91 of 109
Thus, as of 18 March 2015, participants in the wholesale energy market in Romania have the
obligation to register with the National Register of wholesale energy market participants
established and managed by ANRE according to the procedure set out in the Annex to the
Order. At the time of writing this report, 609 economic operators, wholesale energy market
participants have registered in the National Register and sent data to CEREMP-ACER. As of
7 October 2015, they have the obligation to submit data on trades on wholesale energy market
to ACER, including orders to trade and trades concluded on organized markets and
fundamental data from the European Networks of Transmission and System Operators for
electricity and natural gas. The second stage of reporting begins at 7 April 2016 and concerns
the reporting of contracts concluded outside organized markets and of transport contracts
In 2015, there were not issued other binding ACER Decisions.
4.2. Promoting competition
According to Law no. 123/2012 on electricity and natural gas, as amended and
supplemented, the natural gas sector in Romania is divided into two segments: the regulated
and competitive market. This segmentation is designed to set clearly the specific economic
activities that are under continuous surveillance: the regulated market (transport, storage,
distribution tariffs and regulated prices for households) and those that function freely, based
on competitive mechanisms. In fact, since this is a regulated area of the economic sector, it
needs to be noted what falls under the scope of supervision by the regulator, the rest of the
economic relations being carried on freely as part of the mechanisms of a market economy.
Annual consumption of natural gas has continued to decline, reaching around 11.6 billion
cubic meters, a decline of about 5% in 2015 compared to 2014, due to a slight decrease in the
consumption of final customers.
In 2015, total natural gas consumption was 121,726,748.658 MWh. Total number of natural
gas final customers was 3,480,661, of which 182,265 non-households (5.24%) and 3,298,396
households (94.76%).
This year, the final customer consumption was 111,244,195.163 MWh, of which non-
household consumption accounted for 80,992,734.448 MWh (72.80%) and household
consumption represented 30,251,460.715 MWh (27.20%).
Natural gas consumption is ensured by the domestic production and imports. Domestic
production was 118,816,674.270 MWh, while imports were 2,910,074.388 MWh.
The number of participants in the gas market in Romania grew steadily as the market was
liberalized, especially in the supply of natural gas, including, in 2015:
A National TSO – Transgaz;
6 producers: Romgaz, OMV Petrom, Amromco Energy, Raffles Energy, Foraj
Sonde, Stratum Energy;
6 external suppliers that bring natural gas from foreign sources in Romania:
Wintershall, Axpo Elveţia, Gdf Suez Ungaria, Imex Oil, Mol Zrt. and Wiee
Hungary;
2 storage operators: Romgaz, Depomureş;
40 distribution operators – the largest being Distrigaz Sud Rețele SRL and E.ON
Gaz Distribuție S.A.;

31.08.2016
Romanian Energy Regulatory Authority Page 92 of 109
76 suppliers active on the competitive natural gas market, out of which 39
suppliers are active in the regulated natural gas market.
4.2.1. Wholesale natural gas market
In 2015, natural gas domestic production, current and extracted from storage, which entered
into consumption accounted for 97.61% of total sources. The first two producers (Romgaz
and OMV Petrom) covered together 94.85% of this source.
Imports entering in consumption, current import and extracted from storage, represented
2.39%. The first three importers – internal suppliers – achieved together 94.89%.
The quantities of exported natural gas in 2015 were very low, approximately 11,694.640
MWh, which represents 0.01% of total production.
In 2015, 39 holders of supply licenses issued by ANRE conducted activities on the wholesale
natural gas market, the market volumes traded by them being 84,949,525.190 MWh, a
decrease of approximately 41% over the previous year. A breakdown of the structure of this
market and percentages of suppliers participating in the market, by traded volumes, is shown
in the chart below:
Natural gas imports in the period 2010-2015
Average natural gas current import price in the period 2010-2015

31.08.2016
Romanian Energy Regulatory Authority Page 93 of 109
Centralized markets
By Government Emergency Ordinance no. 35/2014 amending Law no. 123/2014 on
electricity and natural gas, approved with amendments and additions by Law no. 174/2014, it
was established the obligation of trading natural gas on centralized platforms for Romanian
natural gas producers and suppliers of natural gas acting on the Romanian natural gas market.
According to these rules of law, ANRE issued Order no. 118/2014 approving the
Methodology for establishing the obligation of natural gas producers and suppliers to
conclude transactions on the centralized natural gas markets in Romania, by which were set
annual quotas specific to the two categories of operators, producers and respectively suppliers
for natural gas trading on centralized platforms in Romania.
Year Producers Suppliers
2015 35% 30%
2016 30% 25%
2017 25% 20%*
2018 20% 15%* *According to Law no. 174/2014 suppliers ‘obligation was limited to 2016
In 2015, a number of 30 suppliers concluded trades on the centralized markets, the contracts
concluded by them totalling a volume of 1,720,544.000 MWh, as follows:
Month
Monthly prices concluded
on centralized markets
(RON/MWh)
Traded quantities
(MWh)
January 90.00 106,000.000
February 88.00 206,000.00

31.08.2016
Romanian Energy Regulatory Authority Page 94 of 109
March 87.50 10,000.000
April 85.50 15,000.000
May 82.32 49,000.000
June 87.70 37,500.000
July 84.08 2,813.000
August 86.42 60,445.000
September 82.40 255,932.000
October 80.53 719,054.000
November 88.29 121,500.000
December 85.96 137,300.000
Average weighted price 2015 83.77 1,720,544.000
4.2.2. Retail natural gas market
For 2015, natural gas consumption in Romania, structured on types of consumers, was as
follows:
Final customers Connection type No. of
customers
Consumption
* (MWh)
Share in
total
consump
tion
Households
Customers connected to the NTS 2 568.417 0.00%
Customers connected to the distribution
system 3,298,394 30,250,910.62 27.19%
Total Households 3,298,396 30,251,479.04 27.19%
No
n-h
ou
seh
old
s
Sec
on
dar
y +
In
du
stri
al
Heat producers
for the
population
Customers connected to the NTS 11 3,101,827.80 2.79%
Customers connected to the distribution
system 696 9,109,386.60 8.19%
Total Heat producers for the
population 707 12,211,214.40 10.98%
Heat and
electricity producers
Customers connected to the NTS 14 13,909,858.00 12.50%
Customers connected to the distribution
system 471 6,932,008.80 6.23%
Total electricity and heat producers 485** 20,841,866.79 18.74%
Other Customers connected to the NTS 124 21,378,174.98 19.22%
Weighted average price of natural gas on centralized markets

31.08.2016
Romanian Energy Regulatory Authority Page 95 of 109
secondary and
industrial
Customers connected to the distribution
system 27,366 13,947,517.66 12.54%
Total other secondary and industrial 27,490 35,325,692.64 31.76%
Tertiary
Customers connected to the NTS 17 18,638.74 0.02%
Customers connected to the distribution
system 44,615 4,892,112.04 4.40%
Total tertiary customers 44,632 4,910,750.78 4.41%
Commercial
Customers connected to the NTS 61 435,542.43 0.39%
Customers connected to the distribution
system 109,375 7,267,649.09 6.53%
Total commercial customers 109,436 7,703,191.52 6.92%
Total non-households 182,265 80,992,716.13 72.81%
TOTAL 3,480,661 111,244,195.163 100.00%
* Total consumption delivered to final customers (not including technological consumption, energy
consumption and deviations due to measuring instruments).
** We mention that the number of clients producing heat and electricity is included in the number of clients
producing heat and electricity, which is why they were not counted in the total number of final customers.
Natural gas consumption in 2015 decreased by 4.61% compared to 2014, reaching
approximately 121,726,748.658 MWh (approx. 11.6 billion cubic meters).
In 2015, the share of quantities consumed by households of total consumption delivered by
suppliers was 27.19% and the number of these customers represents 94.76% of the total
natural gas final customers.
Although the number of non-households represents only 5.24% of all final customers of
natural gas, the share of quantities consumed by them is 72.81% of total consumption
delivered by suppliers in 2015.
Six companies have conducted production and supply activities: SNGN Romgaz SA, S.C.
OMV Petrom SA, S.C. Amromco Energy SRL, S.C. Raffles Energy SRL, S.C. Foraj Sonde
SA and S.C. Stratum Energy LLC.
The situation of companies that supply gas to the most relevant categories of final customers
is as follows:
Suppliers
Final customers
Shares of the first three companies (%)
Electricity and/or heat producers 92.95
Non-households 65.39
Households 92.27
On the regulated market in 2015, the final customers were served by 39 suppliers; total
number of final customers supplied on the regulated market was of 3,292,505, representing
only households (5891 households switching supplier), and the natural gas quantity supplied to
them was of 30,026.953 GWh (31% less than in 2014). Market shares of the three main
suppliers are presented in the table below:
Suppliers Market share (%)
GDF SUEZ Energy Romania 46.28
E.On Energie Romania 43.36
Congaz 2.69

31.08.2016
Romanian Energy Regulatory Authority Page 96 of 109
On the competitive market, 74 suppliers were active. In the table below is presented the
situation of suppliers of final customers in the competitive market, whose market shares are
above 5%; one of them is also a producer (S.N.T.G.N. Romgaz S.A.). Total consumption was
81,217.261 GWh (up from 2014 with aprox.11%).
Suppliers Market share (%)
OMV Petrom Gas 22.49
Romgaz 22.47
GDF SUEZ Energy Romania 20.29
E.On Energie Romania 13.90
OMV Petrom (branches) 7.55
At the end of 2015, there were 188,156 final customers who have switched suppliers on the
natural gas competitive market, compared to 10,558 in 2014, representing an increase of
about 10% of the real natural gas market opening degree compared to 2014, which amounted
in 2015 to about 66% of total consumption.
The number of customers who have exercised their right to choose the supplier of natural gas
has recorded a strong increase in 2015, following the liberalization of the internal market for
natural gas for non-households on 1 January 2015, which implies that final ANRE-regulated
prices for this category of customers have ceased their applicability.
Thus, from 1 January 2015, all non-households operate in the competitive natural gas market,
where prices are determined freely through competitive mechanisms. Under these conditions
it was necessary for them to exercise their eligibility, namely to choose their natural gas
supplier and to conclude with it a negotiated contract for the sale and purchase of natural gas,
through direct negotiation of the price and commercial conditions or through the acceptance
of a standard offer published by the supplier, or to resort to a supplier selection process
through specific procedures of auction/public procurement.
In order to support final customers and to ensure that they can choose knowingly the natural
gas supplier, in the context of an increased competition between suppliers, ANRE aims that
Natural gas consumption of eligible customers connected to NTS,
respectively to distribution systems

31.08.2016
Romanian Energy Regulatory Authority Page 97 of 109
all suppliers who have B1-B4 and A1-A2 final customers in their customer portfolio have
standard updated offers for them, so that customers who have not yet taken the step to the
conclusion of a negotiated contract of sale-purchase to have sufficient information available
for this step. Standard offers are published by each supplier on its webpage and the links to
this information are posted by ANRE on its webpage as a list, permanently updated and
verified. Also on ANRE website is displayed the list of undertakings, holders of natural gas
supply license.
ANRE has constantly monitored data on the supply carried out in these conditions.
Considering the stage of conclusion of sale-purchase contracts by non-households and the
requests of suppliers with the largest share of such customers in their portfolio in order for
ANRE to provide the necessary regulatory framework for continued supply of natural gas to
non-households who have not signed contracts during 2015, ANRE issued ANRE Order no.
97/2015 amending and supplementing Order no. 107/2014.
Given that 91% of all non-households who had to exercise the eligibility rights were in the
gas suppliers S.C. E.ON Energie Romania SA and S.C. GDF Suez Energy Romania SA
portfolios, based on the reports submitted by them, the evolution of the negotiated sale-
purchase contracts conclusion process during 2015 was as follows:
15 ianuarie 31 ianuarie 28 februarie 31 martie 30 aprilie 31 mai 30 iunie 31 iulie 31 august 31 decembrie
S.C. E.ON Energie România S.A. 23,43% 36,23% 47,65% 52,78% 58,58% 63,02% 63,94% 65,27% 67,63% 70,15%
S.C. GDF Suez Energy România S.A. 40,44% 44,10% 46,87% 53,12% 58,87% 65,19% 72,20% 76,27% 76,92% 77,49%
Denumire furnizor% din total clienți noncasnici care au optat pentru furnizarea în regim negociat în cursul anului 2015
On 31 December 2015, the natural gas supply was done under contracts of sale-purchase
tacitly accepted for a total of 24,240 non-households form S.C. E.ON Energie Romania SA
portfolio and a number of 17,170 non-households from SC GDF Suez Energy Romania SA
portfolio. The evolution of non-households in the portfolios of these suppliers who have not
exercised their eligibility during 2015 is shown below:
15 ianuarie 31 ianuarie 28 februarie 31 martie 30 aprilie 31 mai 30 iunie 31 iulie 31 august 31 decembrie
S.C. E.ON Energie România S.A. 81.197 62.175 51.778 42.503 38.341 33.632 30.030 29.280 28.196 26.284 24.240
S.C. GDF Suez Energy România S.A. 76.276 45.429 42.637 40.522 35.761 31.369 26.552 21.204 18.099 17.601 17.170
Număr clienti
noncasnici din
portofoliul propriu
pentru care
furnizarea gazelor
naturale se realiza
în regim
reglementat la data
de 1 noiembrie
2014
Numărul clienților noncasnici care nu și-au exercitat dreptul de eligibilitate în cursul anului 2015
Denumire furnizor
According to Law no. 123/2012 on electricity and natural gas, final customers no longer have
the right to return to regulated supply if they have exercised their eligibility rights.
4.2.3. Recommendations on supply prices, investigations and measures to promote
competition
Setting regulated prices for customers who have not exercised their eligibility right
Regulated prices are differentially set for each licensed supplier and customer category,
depending on the configuration of the natural gas supply systems.

31.08.2016
Romanian Energy Regulatory Authority Page 98 of 109
Prices are monomial and quantify the fixed and variable costs relating to the regulated supply
activity.
Regulated prices apply to natural gas quantities supplied in a regulated regime.
Regulated prices are differentially set for every holder of supply license, as follows:
a) for companies that have legally separated the natural gas supply from the distribution -
by type of customer category for which the supply of natural gas is done in a regulated
regime, placed in established areas where the affiliated undertaking has the license for natural
gas distribution, based on the annual consumption and type of systems (transport/distribution)
by which the supply of natural gas is done;
b) for companies that have not legally separated the natural gas supply from the distribution
- by type of customer category for which natural gas supply is made in a regulated regime,
placed in established areas served as licensed distribution operator, based on the annual
consumption and type of systems (transport/distribution) by which the supply of natural gas
supply is done.
We mention that, under the provisions of Law no. 123/2012 on electricity and natural gas,
with subsequent amendments and additions, Government Decision no. 488/2015 was issued
on establishing the purchase price for natural gas from domestic production for households
and heat producers, only for the natural gas quantities used to produce heat in cogeneration
plants and heating plants for household consumption, during 1 July 2015 – 30 June 2021, by
which was established an annual increase in the purchase price of natural gas from domestic
production, values that were included by ANRE in the calculation of regulated prices.
Thus, according to Government Decision no. 488/2015, the purchase price of natural gas from
domestic production was set as follows:
RON/MWh
Households and heat producers, only for the natural gas quantities
used to produce heat in cogeneration plants and heating plants for
household consumption
01.07.2015 60.00
01.07.2016 66.00
01.04.2017 72.00
01.04.2018 78.00*
01.04.2019 84.00*
01.04.2020 90.00* *) The purchase price for natural gas from domestic production for households and heat producers, only for the natural gas quantities used to produce heat in cogeneration plants and heating plants for household consumption, starting with 1 April 2018, is set to be reassessed after an
analysis carried out by the end of March 2018.
In accordance with the provisions of Article 181 paragraph (5) of Law no. 123/2012 on
electricity and natural gas, with subsequent amendments and additions, purchase price of gas
from domestic production is determined by Government Decision based on a proposal from
the line ministry and is updated by ANRE and ANRM in accordance with the provisions of
the Roadmap for phasing out regulated prices for final customers.
Thus, as of 1 January 2015, ANRE evaluated the unitary fixed amount designed to cover the
costs of purchasing natural gas for households only, as follows:

31.08.2016
Romanian Energy Regulatory Authority Page 99 of 109
On 1 January 2015, the purchase price of natural gas from domestic production for the
regulated market for households was set at 53.30 RON/MWh. Thus, the unitary fixed
amount designed to cover the costs of purchasing natural gas for households and heat
producers only for the natural gas quantity used to produce heat in cogeneration plants
and heating plants for population consumption for January – March 2015 has remained
unchanged at 71.15 RON/MWh.
On 1 April 2015, the purchase price of natural gas from domestic production for the
regulated market for hoseholds was set at 53.30 RON/MWh. Thus, in April 2015, was
published the evaluation of the fixed unitary amount to cover the costs of purchase of
natural gas for April – June 2015, for households with the value of 68.30 RON/MWh.
For July 2015 - June 2016, according to the provisions of Government Decision no.
488/2015, the purchase price of natural gas from domestic production for the regulated
market, for hoseholds was set at 60.00 RON/MWh. Thus, ANRE has estimated the fixed
unitary amount to cover the purchase price of natural gas for households and heat
producers, only for the natural gas quantity used for the production of heat in
cogeneration units and heating plants for the population, for July 2015 – June 2016, at
80.30 RON/MWh, compared to the previous value of 68.30 RON/MWh.
All documents relating to the evaluation of the fixed unitary amount to cover the costs of
purchasing natural gas for households have been published on ANRE website.
It has to be noted that there have been assessed the differences of purchasing cost of natural
gas for the period October to December 2014, representing the unitary correction component
for the difference between the fixed unitary amount recognised by ANRE to cover costs of
purchasing natural gas (GUC), including related services, designed for resale in the regulated
supply, and the actually incurred costs recognized by ANRE to the operator performing the
regulated supply.
The GUC monthly unitary difference was determined by subtracting from the GUC realized
by the company, the GUC value included by ANRE in regulated prices. Thus, starting with 1
April 2015, costs recovery component for natural gas acquisition is 0.12 RON/MWh for S.C.
GDF SUEZ ENERGY ROMANIA S.A., representing 0.11% of the regulated price related to
B1 consumption category, respectively 7.13 RON/MWh for S.C. E.ON ENERGIE
ROMANIA S.A., representing 6.03% of the regulated price related to the B1 consumption
category.
To calculate the unitary cost differences of natural gas were taken into account the provisions
of Law no. 123/2012 on electricity and natural gas, as amended and supplemented, according
to which supply at a regulated price for non-households is maintained until 31 December
2014, and for households until 30 June 2021.
Thus, the adjustment percentages of final regulated prices for households, during 2015,
determined as average based on the market share of each licensed operator performing the
supply of natural gas on the regulated market were:
at April-May 2015 of about - 4%;
at 1 July 2015 of about 11%.
Falling regulated prices from 1 April 2015 were mainly due to the reduction of import
percentages from 3% to 0%, of share of natural gas extracted from storage from the total

31.08.2016
Romanian Energy Regulatory Authority Page 100 of 109
quantities supplied from 25.33% to 0%, of distribution tariffs at S.C. DISTRIGAZ SUD
REŢELE S.R.L. with approximately 21% and to the maintenance of approximately constant
of distribution tariffs at S.C. E.ON DISTRIBUTION ROMANIA - S.A.
Rising prices from 1 July 2015 with a percentage of 11% was due to the change in the
following items:
increase of current domestic production price from 53.30 RON/MWh to 60.00
RON/MWh, with an impact of about 6.5%;
inclusion of the percentage of imported gas in the winter, with an impact of about 1.5%;
inclusion of gas quantities to be extracted from storage in winter, with an impact of about
4.5%;
decrease of unitary transport cost, with an impact of about -1,5%.
Therefore, in 2015, regulated prices recorded an average growth of approximately 7%
for households, mainly reflecting the domestic production price change according to the
roadmap of phasing out regulated tariffs.
4.3. Security of supply
According to Article 102 of Law no. 123/2012 on electricity and natural gas, the line
Ministry monitors security of supply issues, particularly regarding the supply/demand balance
on the national market at the level of expected future demand and available supplies,
envisaged additional capacity, planned or under construction, quality and maintenance of
networks and measures necessary to meet peak demand and shortfalls of one or more
suppliers. In this respect, every two years, before 31 July, it publishes a report outlining the
findings of monitoring these issues, and any measures taken or envisaged to address them and
forwards the report to the European Commission.

31.08.2016
Romanian Energy Regulatory Authority Page 101 of 109
5. Consumer protection and dispute settlement in electricity and gas
5.1. Consumer protection
Electricity
Law no. 123/2012 on electricity and natural gas defines the "vulnerable customer" as the
final customer being part of a household group that, for reasons of age, health or low income,
is at risk of social exclusion, and in order to prevent this risk, benefits from social protection
measures, including financial ones. Social protection measures and eligibility criteria for them
are established by norms and regulations. The vulnerable customers are the main beneficiaries
of the social aids envisaged in the process of the gradual phasing out the regulated
prices/tariffs.
In accordance with the "Procedure regarding terms and conditions for granting the social
tariff to electricity household consumers", approved by ANRE Order no. 38/2005 as lately
amended and supplemented, vulnerable consumers with average monthly income per family
member less than or equal to the minimum wage set by governmental decision have the right
to apply for social tariff. The social tariff was designed based on the consumption quota with
increasing progressively differentiated prices, in such a way that up to the threshold of 90
kWh/month the average return price is less than that resulting from the application of any
other tariff for households supplied at low voltage. About 979,751 consumers (5% less than
in 2013) of the total of 8,616,275 households, benefit of social tariff.
Compared to the situation presented in 2014, in 2015 it was completed the review of the
regulatory framework for the supply of last resort. Among other things it introduced a new
bill model and a new model for the Consumption Convention.
Also, it was developed the Framework - Procedure on the obligation of suppliers of last
resort of electricity and natural gas to settle final customers’ complaints (ANRE Order no.
16/2015). The procedure establishes the stages for taking over, recording, analysing,
establishing measures and handling complaints relating to electricity and natural gas supply.
The Framework - Procedure is applied by suppliers of electricity and natural gas in order to
solve complaints from final customers for the following activities: energy contracting, billing
the energy supplied, offers of prices and tariffs, continuity of supply, ensuring the quality of
energy supplied, operation of meters, switching, final customers information in accordance
with the requirements of the legislation in force, resolution of complaints against the supplier
made by final customers regarding non-compliance with the legislation in force, resolution of
other final customers’ complaints.
It was revised The Regulation on informing final customers of electricity and natural gas
(ANRE Order no. 96/2015) by which it was intended to determine greater accountability of
suppliers of electricity and natural gas in the correctly, completely and accurately information
of their final customers. It was also established a uniform system of reporting by suppliers of
electricity and natural gas on the activity of informing final customers, specifying the content
of the report and the mode of submitting to ANRE the data and documents relating to the
informing activity.
Performance standard review for the electricity supply activity has been approved by ANRE
Order no. 118/17.07.2015. The main amendments refer to:

31.08.2016
Romanian Energy Regulatory Authority Page 102 of 109
a) monthly transmission by electricity suppliers of statistical indicators, review of
guaranteed levels of performance indicators and increase of compensations that suppliers pay
their final customers for non-compliance of these guaranteed levels, so as to discourage
suppliers in not fulfilling their obligations towards final customers;
b) compensations for non-compliance of the guaranteed level are paid by the supplier of
last resort to the household and final small non-household, on supplier’s own initiative, and to
the large final non-household based on written request sent to the supplier in 30 calendar days
from fulfilment of conditions for granting compensation. Compensations for non-fulfilment of
guaranteed performance indicators are paid by suppliers of last resort only in case of
consumption sites supplied under universal service, as this is a guaranteed supply service.
Also, the Procedure on granting compensation to households for receiver appliances
damaged as a result of some incident caused by the network operator (ANRE Order no.
177/16.12.2015) was reviewed.
Regarding promotion of smart metering, in 2015, concessionaire distribution operators
submitted to ANRE proposals on developing pilot projects, whose results would offer the
necessary information for setting conditions and elements regarding the development of the
national roadmap for smart metering systems implementation, and the national plan for the
smart metering systems implementation. ANRE assessed the proposals of concessionaire
distribution operators in accordance with Annex no. 3 – Criteria for approval of pilot projects
on electricity smart metering systems implementation, of ANRE Order no. 145/2014 and
approved in March 2015 the pilot projects that respected the criteria set. 14 pilot projects were
approved for 6 concessionaire distribution operators.
Following the analysis of the progress of pilot projects development regarding smart metering
systems implementation at 30 June 2015 according to set measures, ANRE Order no.
145/2014 was amended in August, extending the deadline up to which pilot projects can be
requested and approved. Therefore, the two distribution operators FDEE Muntenia Nord and
FDEE Transilvania Nord, whose pilot projects did not qualify previously as eligible according
to requirements, received approvals for 4 pilot projects.
Table 1 shows the centralizing situation of pilot projects regarding the implementation of
electricity smart metering systems approved by ANRE in 2015.
Distribution operator No. of pilot
projects
No. of customers
included in pilot
projects
Total value of pilot
projects [RON]
Enel Distribuţie Banat 3 9,961 5,275,260
Enel Distribuţie
Dobrogea 4 10,000 4,928,379
Enel Distribuţie Muntenia 1 11,392 6,650,281
CEZ Distribuţie 2 20,150 16,085,781
E.ON Distribuţie
România 2 23,237 8,303,582
FDEE Transilvania Sud 2 23,047 22,893,216
FDEE Transilvania Nord 2 5,335 4,069,333
FDEE Muntenia Nord 2 2,143 1,433,938
TOTAL 18 105,265 69,639,770

31.08.2016
Romanian Energy Regulatory Authority Page 103 of 109
Monitoring results of smart metering systems implementation process were included in the
Reports analysing the progress of pilot projects development regarding smart metering
systems implementation at 30 June 2015, 31 August 2015 and 1 November 2015, submitted to
the ANRE Regulatory Committee
A set of performance indicators for smart metering systems was defined so as the evolution of
electricity smart metering systems implementation can be followed during the implementation
process and a period after its completion. These indicators will be applied for all projects that
imply electricity smart metering systems, so as to verify the degree of achievement of
objectives set. Performance indicators target the following issues: progress of electricity smart
metering systems implementation, electricity smart metering systems structure, economic
effects, qualitative performance indicators, information security conveyed through electricity
smart metering systems.
Implementation areas were defined and relevant data and information were set that
characterize these areas from a technical, economical, qualitative and socio-demographic
point of view. By processing these data it will be achieved prioritization/ranking of each
concessionare distribution operator’s areas, through a multi-criteria analysis, in order to
evaluate the implementation potential of electricity smart metering systems and prepare the
national plan and roadmap for the implementation of electricity smart metering systems.
Concessionaire
distribution
operator
No. of
implementatio
n areas
No. of
substations
No. of meters
Average
monthly
consumption/
meter (kWh)
No. of
planned
meters for
metrological
replacement
during 2016-
2020
Value not
amortised for
meters to be
replaced
(RON)
Network was
refurbished in
the last 5
years:
% Total Single-phase
Three-
phase
CEZ Distribuție 2,606 13,268 1,398,919 1,322,403 76,516 112,70 1,202,115 86,068,358 10
Enel Distribuție
Banat 448 7,679 866,366 759,696 106,670 251.54 360,022 73,690,952 5
Enel Distribuție
Dobrogea 344 5,498 626,627 577,942 48,689 234.13 301,874 62,323,993 19.64
Enel Distribuție
Muntenia 254 6,805 1,201,804 1,072,787 129,013 343.74 569,298 156,808,264 13.36
E.ON
Distribuție
România
2,552 9,857 1,154,729 1,101,939 52,790 104.60 947,300 0 4
FDEE Muntenia
Nord 1,414 10,218 1,246,502 1,158,577 87,925 107.41 730,766 0 13.25
FDEE
Transilvania
Nord
1,963 8,719 1,224,969 1,132,469 92,500 110.55 576,320 0 11.34
FDEE
Transilvania
Sud
1,782 6,059 1,078,383 878,898 224,212 122.03 627,864 0 8.39
TOTAL 11,363 68,103 8,798,299 8,004,711 818,315 173,34 5,315,559 378,891,567 10.67
The analysis report on the progress of pilot projects on smart metering systems
implementation at 01 November 2015 revealed the following conclusions:
- Post-implementation results on the benefits in question are not relevant to all pilot
projects due to very short period from the completion of the pilot project implementation
to the date of achievements reporting (the absence of relevant monitoring period) and
provides no eloquent prerequisites for decision making on the roll-out.
- Cost-benefit analyses submitted by distribution operators do not allow a comparative
analysis of the results obtained, as they were done on different analysis models that
follow operator’s business strategy, with specific aims and focus.
- Cost-benefit analyses are positive for Enel Distribuție, E.ON Distribuţie România and
FDEE Transilvania Sud and negative for CEZ Distribuţie.

31.08.2016
Romanian Energy Regulatory Authority Page 104 of 109
The result was the need to impose by ANRE a detailed model of cost-benefit analysis or the
performance by ANRE of a cost-benefit analysis for all distribution operators, possibly
through an impartial external consultant in order to avoid allegations of non-transparency and
lack of objectivity.
The measures proposed are:
- Establishing a period of 6 months or a year for monitoring period of pilot projects
carried out in 2015, so as benefits and costs quantifying should be based on concrete
results across all distribution operators, including FDEE Transilvania Nord and
Muntenia Nord.
- Amendment of ANRE Order no. 145/2014 regarding deadlines set for the approval of
the national roadmap for smart metering systems implementation and national plan for
smart metering systems implementation.
- Realization, during 2016, of the monitoring of pilot projects carried out in 2015, and
implementation of pilot projects for electricity smart metering systems in urban and
rural areas with recently not refurbished networks, to provide relevant information for
implementation sizing of electricity smart metering systems nationwide.
- Contacting an external consultant for establishing a suitable cost-benefit analysis
model for projects regarding the installation of electricity smart metering systems
completed/future, and for establishing interoperability requirements that electricity
smart metering systems must comply with and the analysis of distribution operators
proposals relating to communication technologies, standards and communications
protocols used.
Natural gas
Given the removal of regulated prices (for non-households at 1 January 2015, and on 1 July
2021 for households) and competition development on this market, it imposed the setting of
legislative measures to ensure access of final customers to information on commercial terms
for the supply of natural gas in the pre-contractual and contractual phase. Compared to 2014,
the regulatory framework has not been changed, except the amendments and additions
introduced by ANRE Order no. 107/2015 to facilitate efforts of final non-households to
switch suppliers.
To quantify the quality of the natural gas supply activity to final customers, by Order no.
37/2007 regarding the approval of the Performance standard for the supply of natural gas,
ANRE established the minimum performance level to carry out this activity.
Quality of supply activity is evaluated based on the performance indicators for the following
activities:
a) contracting natural gas;
b) billing natural gas supplied;
c) settlement of final customers complaints relating to quality requirements of
natural gas supplied;
d) informing final customers in accordance with the requirements of this
performance standard;
e) settlement of complaints brought by applicants/final customers against the
supplier for not complying with the performance standard;
f) settlement of other complaints and demands of applicants/final customers.

31.08.2016
Romanian Energy Regulatory Authority Page 105 of 109
The performance standard for the natural gas supply activity sets the following performance
indicators:
a) Guaranteed performance indicators – GPI – indicators that establish minimum
performance levels for the conduct of the supplier’s activity and for the breach of
which the supplier will automatically pay the affected applicant/final customer the
penalties provided in this standard. These indicators are:
GPI 1 – Contracting of natural gas;
GPI 2 – Resolution of requests of final customers regarding bills;
GPI 3 – Quality of supplied natural gas;
GPI 4 – Resolution of requests of final customers regarding measuring of
natural gas quantities;
GPI 5 – Penalities due to failure of supplier’s payment obligations.
b) Annual performance indicators – API – indicators that set annual perfomance levels in
the natural gas supply activity. Natural gas supplier has the obligation to annually
report to ANRE the level of achievement of the following indicators:
API1 – Processing contracting applications;
API 2 – Responses to final customer’s requests;
API 3 – Supply resumption in case of limitation/interruption as a result of
failure to pay;
API 4 – Information on performance indicators.
ANRE monitored the achievement of guaranteed performance indicators – GPI, based on the
reports of licensed natural gas suppliers. In 2015, there were a total of 400,955 final
customers’ requests, as stated in the table below:
Guaranteed
performance
indicator
Number of requests
received
The number of requests
resolved within the
deadlines imposed by
IPG
Number of
applicants/final
customers who were
paid penalties
The amount of
penalties paid (RON)
households Non-
households households
Non-
households households
Non-
households households
Non-
households
GPI 1-
Contracting
natural gas 268,060 64,528 268,060 64,528 0 0 0 0
GPI 2- Requests
on bills 43,852 16,968 43,849 16,968 3 0 200 0
GPI 3- Quality
of natural gas 102 36 102 36 0 0 0 0
GPI 4-Requests
on measuring 5,587 1,821 5,585 1,820 2 1 175 55
GPI 5-Penalities
due to failure of
supplier’s
payment
obligations 1 0 1 0 0 0 0 0
Total 317,602 83,353 317,597 83,352 5 1 375 55
For non-compliance with guaranteed performance indicators, natural gas suppliers paid
penalties to 5 households and one non-household, totaling 430 RON.
Regarding vulnerable customers who use natural gas for heating, they receive monthly aid for
heating during the cold season, called aid for natural gas. The method of granting this aid is
set by Governmental Emergency Ordinance no. 70/2011 on social protection measures
during the cold season, as amended and supplemented, this being a measure of support, borne

31.08.2016
Romanian Energy Regulatory Authority Page 106 of 109
from the state budget and/or, where appropriate, local budgets, intended for vulnerable
customers with incomes up to a threshold established by law and which aims to cover all or,
where appropriate, a portion of home heating costs. Aid amounts and the income level relate
to the reference social indicator - RSI.
5.2. Dispute settlement
Final customer’s complaints
Final customer’s complaints handling obligations are included in the license conditions,
framework contracts and supply standards. Supply license holders must ensure the recording,
investigating and resolving of complaints made against them by the final customers. It is
mandatory to have a department that handles every complaint against the license holder by a
final customer who considers oneself wronged by the practices of the license holder. It shall
be established and maintained a register of requests, intimations and complaints addressed by
the final customers, and the way to solve them. In 2015, electricity supply license holders
received 103,244 petitions from final customers and natural gas supply license holders
received 18,882 complaints (reports according to ANRE Order no. 16/2015)
If the final customer is not satisfied with the response received from the undertaking, it may
apply to ANRE which, based on the provisions of Government Ordinance no. 27/2002, as
amended and supplemented, assesses and formulates responses to issues raised in the
complaints. For complaints that require additional verifications, control actions are requested.
Depending on the issues addressed, dealing with complaints is different: from written answers
including explanations and references to legislation in force, to checks on site, to direct talks
with the parties involved.
In case the issues notified in the complaints, relating to non-compliance with legal provisions
by the undertakings, are proving justified, ANRE sends them reminder letters setting out
measures for compliance with legal provisions in force and/or legal measures are taken for
imposing sanctions.
During 2015, ANRE
registered and solved a
number of 3,625
complaints submitted
by natural and legal
person’s beneficiary/
applicant of the services
provided by
undertakings in the
electricity and natural
gas sectors.
Out of the 3,625 complaints, 2,639 were focused on the electricity sector and 986 on natural
gas sector.
Number of complaints received by ANRE

31.08.2016
Romanian Energy Regulatory Authority Page 107 of 109
A total of 3,049 complaints were sent directly to the ANRE, and 576 complaints were
forwarded to ANRE by other public institutions.
Electricity
The following table presents the main categories of problems identified in the complaints
settled in the electricity sector:
No. Main issues reported 2015 [%]
1 Billing of electricity 576 21.83
2 Suspicion of stealing electricity 461 17.47
3 Quality of electricity 393 14.89
4 Contracting connection works 119 4.51
5 Notice / Disconnection / Reconnection /
Termination / Cancelation 110 4.17
Through its control activity, the regulator seeks achievement of works and services of
appropriate quality to the performance requirements required by law by the participants
involved in the production, transmission, distribution, supply and use of electricity, including
those involved in the design and development of installations and equipment used for carrying
out these activities. In 2015, 694 control actions were carried out in the electricity sector.
Following the control actions, reports finding contraventions and imposing sanctions were
drawn up.
Natural gas
During 2015, 986 complaints referred to the natural gas sector. All complaints received were
solved within the legal timeframe and in accordance with the regulations in force, informing
the petitioners and institutions through which they were sent to ANRE, as appropriate.
The following table presents the main categories of issues identified in the complaints solved
in the natural gas sector:
No. Main issues reported 2015 [%]
1 System access 83 8
2 Connection to the system 157 16
3 Contracting, billing 191 20
4 Supply (termination, quality) 96 10
5 Installations 206 21
ANRE conducted 187 control actions in the natural gas sector during the period analysed.
Following the control actions, reports finding contraventions and imposing sanctions were
drawn up.

31.08.2016
Romanian Energy Regulatory Authority Page 108 of 109
The total amount of fines imposed in both the electricity and in the gas sector was
40,151,000 RON.
Dispute settlement
During 2015, were solved only 2 requests regarding disputes in the electricity sector at the
conclusion of contracts. The provisions of the Procedure on the settlement of disputes
occurred in concluding contracts in the electricity and heat produced in high efficiency
cogeneration, approved by the Annex to ANRE Order no. 35/2013, have been applied.
In the gas sector, during 2015 there were no requests for mediation of pre-contractual
disputes in the natural gas sector, according to Procedure on mediation of disputes arising
from the conclusion of contracts in the natural gas sector, approved by ANRE Order no.
35/2013.
For the settlement of disputes arising in the performance of contracts between electricity
and natural gas wholesale and retail market participants, ANRE Order no. 61/2013 was issued
approving the Regulation on the organization and functioning of the commission for settling
disputes on the wholesale and retail markets between electricity and natural gas market
participants.
During 2015, there were 7 requests for settling disputes in the natural gas sector.
Network access disputes were mainly settled through replies to complaints received, without
having to issue decisions in this regard.
The regulatory framework developed by ANRE and implemented by orders and decisions has
a major impact on economic and social conditions, given that it is binding to regulated natural
and legal persons.
The possibility of contesting the individual administrative acts or regulations of the regulator
is an important factor in ensuring its accountability to consumers.
Thus, orders and decisions issued by ANRE can be challenged in court by natural or legal
persons who believe that by applying those regulations, some of their rights have been
violated.
Current status of proceedings pending before the courts:
Total: 494 ongoing cases in 2015, of which 111 have been finalized.
Classification of disputes handled by ANRE in courts in 2015, in the electricity, natural gas
and efficiency sector, depending on their subject, is presented below:
- Administrative – 127 cases;
- Contravention law - 234 cases;
- Insolvency - 81 cases;
- Labour law - 5 cases;
- Free access to public information – 2;
- Claims - 40 cases;
- Criminal law - 1 case;
- Actions in progress – 4 cases;

31.08.2016
Romanian Energy Regulatory Authority Page 109 of 109
In 2015, out of the total number of cases completed, 111 respectively, 90% of them were
favourably solved for ANRE.
Given ANRE activity of electricity, natural gas and energy efficiency market regulation, we
mention that of the total ANRE orders and decisions that were challenged in court by
undertakings from the electricity and natural gas sectors (ie. Hidroelectrica, Nuclearelectrica,
Radet, Electrica Furnizare, OMV Petrom, GDF, E.ON Energie, TRANSGAZ, E-RES
producers and others) and which have been subject of administrative cases, out of those
definitively solved, 100% of them were solved favourably to ANRE.
In what regards reports finding contraventions and imposing sanctions, we mention that part
of them referred to the sanctioning of OPCOM and Centralized Market for Bilateral Contracts
participants for the trading/accepting to trade of electricity buy/sale offers not complying with
the legislation in force (ie. OPCOM, Complexul Energetic Oltenia, Axpo Energy România
SA etc.).
Contraventions complaints made against reports of finding contraventions and imposing
sanctions mentioned and that were solved during 2015 were favourable to ANRE at a rate of
approximately 90%.