celeg working paper series - luiss guido carli
TRANSCRIPT
CeLEG Working Paper Series
RISK SHARING IN THE EURO ZONE: THE ROLE OF EUROPEAN
INSTITUTIONS
Valentina Milano
Working Paper No. 01/17 March 2017
Center for Labor and Economic Growth Department of Economics and Finance
LUISS Guido Carli Viale Romania 32, 00197, Rome -- Italy
http://www.luiss.edu/celeg
© Valentina Milano. The aim of the series is to diffuse the research conducted by CeLEG Fellows.
The series accepts external contributions whose topics is related to the research fields of the Center.
The views expressed in the articles are those of the authors and cannot be attributed to CeLEG.

Risk Sharing in the Euro Zone: the Role of EuropeanInstitutions
Valentina Milano∗
Abstract
We study risk sharing in the Euro Area (EA) and compare it to the US federation.
Using the method of variance decomposition first implemented by Asdrubali et al.
(1996), we update and revisit the main channels of risk sharing (net factor income,
international transfers and credit markets). We contribute to this literature by
splitting the credit market channel into two parts: smoothing achieved through
private institutions (markets) and the public sector (national governments and official
European institutions). We find that the role played by European institutions (i.e.,
public lending from the ESFS, ESFM, ESM and the European Commission) has been
quite relevant during the recent financial crisis and largely compensated the reduced
role of national governments.
Keywords: Risk sharing, Euro Area, European transfers, income insurance,
international financial integration
JEL Codes: E2, E6, F15, G15
∗Valentina Milano is affiliated with LUISS Guido Carli, Department of Economics and Finance, Rome. Ithank Gian Maria Milesi-Ferretti and Bent Sorensen for helpful discussions. All errors are mine.
1
1 Introduction
To what extent countries or regions that are facing idiosyncratic risks are able to achieve
consumption smoothing through markets and public policies implemented at national or
supranational level? This issue has received a lot of attention in the academic literature
and policy circles and it is part of more general debate about the costs and benefits of
financial and political integration across countries. In particular, the great recession and
the European sovereign debt crisis have fueled a concern that risk sharing in the EMU is
well below the desirable level, both because of market failures and lack of public insurance,
and this problem may destabilize the currency union or call for a return to exchange rate
flexibility.
It is quite established that some federations share idiosyncratic shocks better than others.
In their celebrated study of risk sharing across US states from 1963 to 1990, Asdrubali
et al. (1996) find that about 75% of state level idiosyncratic shocks are smoothed via
markets or public policies. In particular, about 62% of these shocks are smoothed via capital
and credit markets and 13% through federal taxes and transfers. Some other studies have
found similar evaluations for the US, Germany and Canada (Sala-i-Martin and Sachs (1991);
Buttner (2002); Bayoumi and Klein (1997), Von Hagen and Hepp (2013)). Based on these
contributions, there is now a general consensus that risk sharing across countries belonging to
the EU or the EMU is much more limited than in other federations. For instance, according
to Sorensen and Yosha (1998), only 40 percent of GDP shocks is smoothed across the EU,
and this degree of risk sharing is mainly achieved through government and private savings.
Furthermore, channels of risk sharing in existing federations are quite different: indeed, in
the US, the most effective channel is the one arising from net factor income flows, while,
in Europe, it is the one arising from the credit market, which is, in turn, mostly driven by
governments’ net lending (Sorensen and Yosha (1998)).
The financial crisis has highlighted some relevant facts. There was a crunch in international
markets that has reflected into a paralysis of the traditional risk sharing mechanisms (Alcidi
2

et al (2016)). The austerity measures imposed to some European countries (PIGS) have
reduced the room for the intervention of national governments into credit markets through
their budgets deficits and, as a consequence, have reduced risk sharing (Kalemli et al (2014)).
Yet, a huge amount of transfers and loans have been flowing from European institutions, such
as the European Commission, the European Financial Stabilization Mechanism (EFSM),
the European Financial Stability Facility (ESFS), or the European Stabilization Mechanism
(ESM) to more vulnerable countries. These policies have been put in place with the purpose
of helping Periphery countries to recapitalize their banks, regain access to credit markets
(lowering their cost of funding) and mitigate the effects of the recession. The relevance of
these policies for risk sharing across the EMU has so far received little attention.
In this paper, we try to address this and some other related issues, with special reference
to the role that European supranational institutions have played to improve risk sharing in
Core and Peripheral economies. In particular, we arise the following questions: (i) how much
has the crisis affected risk sharing in Europe? (ii) how much have private agents, on the one
hand, and public sector, on the other hand, contributed to risk sharing? (iii) what is the
amount of risk sharing that can be imputed to the intervention of national governments and
to the European central institutions? (iiii) what have been the different responses between
Periphery and Core countries?
First, we compare risk sharing in Europe and US, taking into account the crisis period
(2007-2014). Then, we split the credit market channel into two parts, the private and the
public sector. In addition, we disentangle the latter quantifying the degree of smoothing
achieved through national governments savings and through public lending from European
institutions. Finally, we examine the linkage between these two channels for two sub-sets of
countries (Periphery and Core).
Our main results underline that, during the crisis, risk sharing increases in Europe (from
23% of shocks to GDP smoothed for the period 1999-2006 to 31% for the period 2007-2014)
whereas it falls in the US (from 70% to 60%). Moreover, in Europe, the public sector plays
3

a prominent role for consumption smoothing. Generally, the national governments channel,
that is, counter-cyclical public borrowing and lending, is the main mechanism of risk sharing.
Nevertheless, from the great recession on (2007-2014), this channel acts in a very different
way for the two groups of countries considered. Indeed, for Periphery countries it generates
dis-smoothing due to the limits on the size of government lending and efforts to contain
the expansion of public debt. However, EU policies (loans and transfers from European
institutions) largely replace national policies in enhancing risk sharing. Namely, due to
austerity measures, national government policies produce 63% of dis-smoothing, whereas
transfers from European institutions generates 86% of smoothing. Opposite conclusions
emerge for Core countries, for which the national governments savings channel plays a
fundamental role (with a percentage of consumption smoothing of 73%).
The rest of the paper is organized as follow: section 2 explains methodology and data; section
3 provides a comparison between Europe and US; section 4 focuses on the savings channel,
splitting it into the contribution from private and public sector and, in turn, splitting the
latter into national governments savings and European institutions net lending; section 5
underlines the differences for Periphery and Core countries. Section 6 concludes.
2 The Model
2.1 General Framework
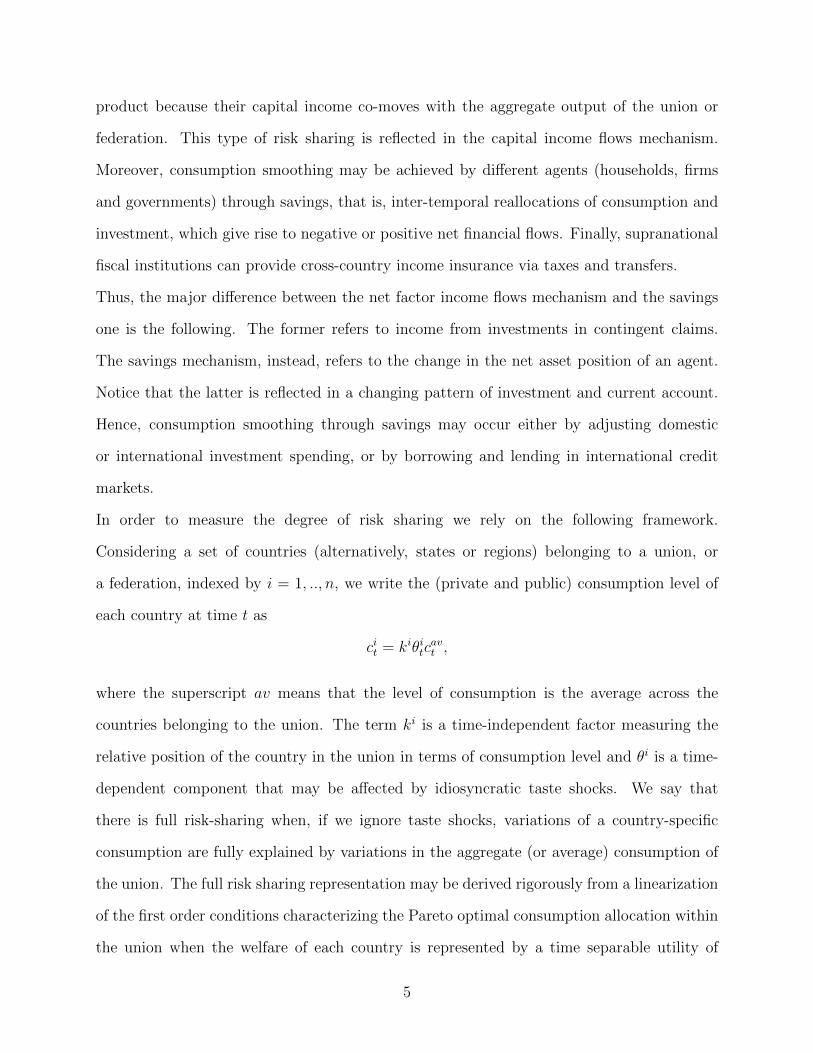
Risk sharing within a set of countries affected by idiosyncratic income shocks can be achieved
through three main channels: (i) insurance via international capital markets obtained by
private agents through the capital income flows from a diversified portfolio of international
assets (income from all claims); (ii) saving and borrowing via international financial markets;
(iii) fiscal transfers from a supranational authority.
For instance, households or financial intermediaries holding claims to output produced in
other countries may smooth out their consumption stream in the face of a volatile national
4
product because their capital income co-moves with the aggregate output of the union or
federation. This type of risk sharing is reflected in the capital income flows mechanism.
Moreover, consumption smoothing may be achieved by different agents (households, firms
and governments) through savings, that is, inter-temporal reallocations of consumption and
investment, which give rise to negative or positive net financial flows. Finally, supranational
fiscal institutions can provide cross-country income insurance via taxes and transfers.
Thus, the major difference between the net factor income flows mechanism and the savings
one is the following. The former refers to income from investments in contingent claims.
The savings mechanism, instead, refers to the change in the net asset position of an agent.
Notice that the latter is reflected in a changing pattern of investment and current account.
Hence, consumption smoothing through savings may occur either by adjusting domestic
or international investment spending, or by borrowing and lending in international credit
markets.
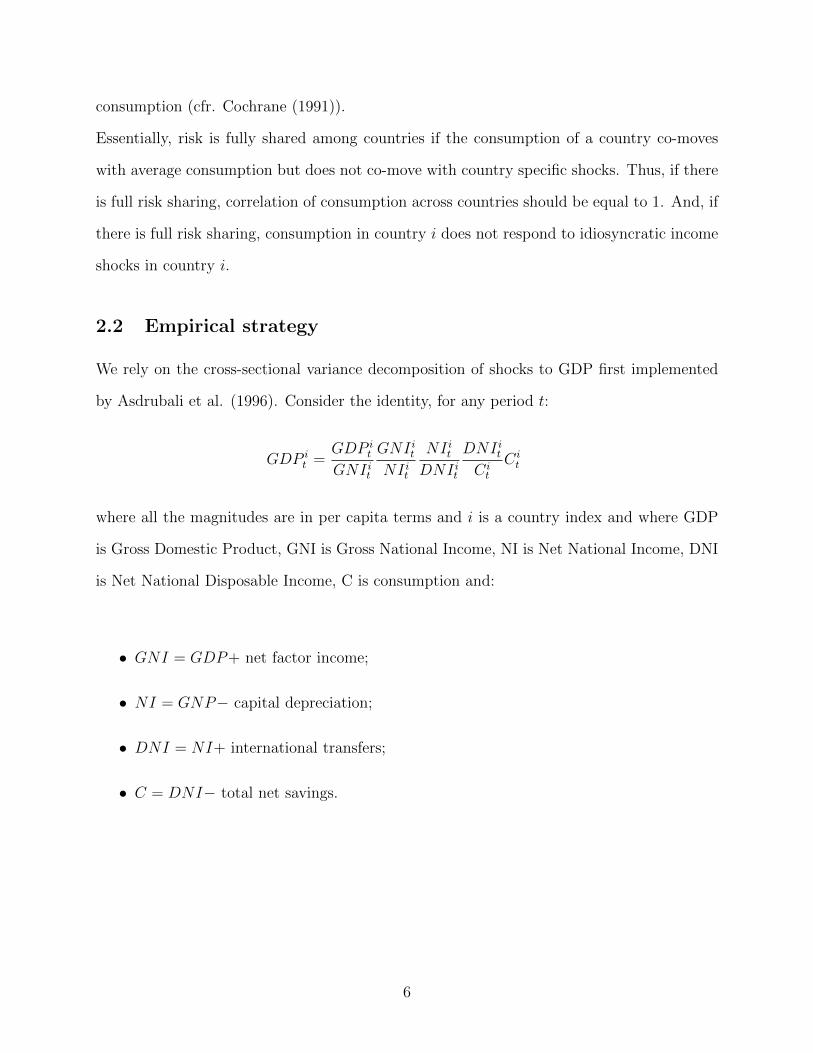
In order to measure the degree of risk sharing we rely on the following framework.
Considering a set of countries (alternatively, states or regions) belonging to a union, or
a federation, indexed by i = 1, .., n, we write the (private and public) consumption level of
each country at time t as
cit = kiθitcavt ,
where the superscript av means that the level of consumption is the average across the
countries belonging to the union. The term ki is a time-independent factor measuring the
relative position of the country in the union in terms of consumption level and θi is a time-
dependent component that may be affected by idiosyncratic taste shocks. We say that
there is full risk-sharing when, if we ignore taste shocks, variations of a country-specific
consumption are fully explained by variations in the aggregate (or average) consumption of
the union. The full risk sharing representation may be derived rigorously from a linearization
of the first order conditions characterizing the Pareto optimal consumption allocation within
the union when the welfare of each country is represented by a time separable utility of
5
consumption (cfr. Cochrane (1991)).
Essentially, risk is fully shared among countries if the consumption of a country co-moves
with average consumption but does not co-move with country specific shocks. Thus, if there
is full risk sharing, correlation of consumption across countries should be equal to 1. And, if
there is full risk sharing, consumption in country i does not respond to idiosyncratic income
shocks in country i.
2.2 Empirical strategy
We rely on the cross-sectional variance decomposition of shocks to GDP first implemented
by Asdrubali et al. (1996). Consider the identity, for any period t:
GDP it =
GDP it
GNI it
GNI itNI it
NI itDNI it
DNI itCi
t
Cit
where all the magnitudes are in per capita terms and i is a country index and where GDP
is Gross Domestic Product, GNI is Gross National Income, NI is Net National Income, DNI
is Net National Disposable Income, C is consumption and:
• GNI = GDP+ net factor income;
• NI = GNP− capital depreciation;
• DNI = NI+ international transfers;
• C = DNI− total net savings.
6

Taking logs and differences on both sides, multiplying both sides by ∆log GDP and taking
cross-sectional average, it follows that:
var[∆log GDP ] = cov[∆log GDP − ∆log GNI,∆log GDP ]
+cov[∆log GNI − ∆log NI,∆log GDP ]
+cov[∆log NI − ∆log DNI,∆log GDP ]
+cov[∆log DNI − ∆log C,∆log GDP ]
+cov[∆log C,∆log GDP ]
Dividing all components by var[∆log GDP ], we get:
1 = βf + βd + βt + βs + βu
where, for instance,
βf =cov[∆log GDP − ∆log GNI,∆log GDP ]
var[∆log GDP ]
is the ordinary OLS estimate in the regression ∆log GDP − ∆log GNI on ∆log GDP or
βu =cov[∆log C,∆log GDP ]
var[∆log GDP ]
is the ordinary OLS estimate in the regression ∆log C on ∆log GDP . By definition, full risk
sharing corresponds to cov[∆log C,∆log GDP ] = 0 and βu = 0. If full risk sharing is not
achieved, consumption in country i varies positively with idiosyncratic shocks to country’s
i output and βu > 0. Moreover, if full risk sharing is achieved via net factor income flows,
then cov[∆log GDP −∆log GNI,∆log GDP ] = var[∆log GDP ] and βf = 1; but, if full risk
sharing is not achieved via net factor income flows, then βf < 1. And so on and so forth
regarding the other channels and the other betas. Thus, the interpretations of the betas are
7

the following: βu is the fraction of shocks to GDP that is not smoothed; the other betas,
i.e. βf , βd, βt, βs are interpreted as the fraction of shocks absorbed respectively through net
factor income flows, capital depreciation, international transfers and savings.
The betas can be estimated by running the panel regressions:
∆log GDP it − ∆log GNI it = νf,t + βf∆log GDP i
t + εif,t,
∆log GNI it − ∆log NI it = νd,t + βd∆log GDPit + εid,t,
∆log NI it − ∆log DNI it = νt,t + βt∆log GDPit + εit,t,
∆log DNI it − ∆log C it = νs,t + βs∆log GDP
it + εis,t.
∆log C it = νu,t + βu∆logGDP i
t + εiu,t
We use differenced data at annual frequency. While estimating all the equations, we assume
that output shocks are not persistent and long lasting.
Differently from previous contributions that have exploited this methodology, we pay
particular attention to the savings channel and split it into its main components. Specifically,
we divide the channel into contribution given by private agents (households and firms) and
the public sector (national governments and European institutions). To this end, we proceed
as follows. Considering that:
βs =cov[∆log DNI − ∆log C,∆log GDP ]
var[∆log GDP ]
and
∆log DNI − ∆log C = ∆log (1 +S
C) ≈ ∆(
S
C),
8

we run the following regressions1:
∆(Si,tcorp
Cit
) = νscorp,t + βscorp∆log GDPit + εiscorp,t,
∆(Si,thous
Cit
) = νshous,t + βshous∆log GDPit + εishous,t,
∆(Si,tpublic
Cit
) = νspublic,t + βspublic∆log GDPit + εispublic,t.
The first two equations estimate the role of private agents, whereas the third reflects the role
of the public sector.
Additionally, for the crisis period (2007-2014), we split the public sector into two parts: the
one gives rise to net lending versus the European institutions and the other versus any other
private or public entities. To achieve this objective, we compute European institutions’ loans
and we subtract the European flows from the total public savings, that is, we hypothesize
that for each country: Governments Savings versus any other entities = Total public savings
- EU flows.2 Then, we run the following regressions:
∆(Si,tgov
Cit
) = νsgov,t + βsgov∆log GDPit + εisgov,t
∆(Si,tEU
Cit
) = νEU,t + βEU∆log GDP it + εiEU,t
The first regression captures how much national governments are able to smooth consumption
through borrowing/lending in international credit markets; the second regression only
captures risk sharing achieved through loans and aids provided by European institutions.
Throughout the paper we refer to the first beta (βsgov) as the national governments channel
1We also run regressions in the form: ∆log DNIit−∆log (DNIit−savingsk) = νsavk,t+βsavk∆log GDP i
t +εisavk,t
where k is the k − th sector (corporate, households, public). Results hold up to this change.2EU flows include either loans from EU institutions to national governments either contributions from
EMU countries to EU institutions.
9

and the second beta (βEU) as the European institutions channel.
2.3 Data
Data are from various sources. GDP, GNI, NI, DNI, C and sectoral savings data are from
OECD, Annual National Account, Main Aggregates and Detailed Tables; the period covered
is 1970-2014. We examine the Euro Zone countries: Austria, Belgium, Finland, France,
Germany, Italy, the Netherlands (Core countries) and Greece, Ireland, Portugal, Spain
(Periphery).
Transfers from European institutions are from IMF data, EU countries’ Balance of Payments,
Financial Account3(see Appendix A.2 for further details); the period covered is 2007-2014.
US data are from Bureau of Economic Analysis (BEA) and Federal Reserve Economic Data
(FRED) (see Appendix A.3 for a detailed explanation of sources and construction method).
All data are in nominal terms and are transformed into real terms using CPI deflator; they
are transformed in per-head terms using the population data from OECD.
3 Results
Table 1 shows the results for the main channels of risk sharing in the period (1970-2014). We
can summarize them as follows. First, in the EMU the percentage of shocks to GDP that
are smoothed is 23%. This result is in line with the existing literature that has quantified
the amount of risk sharing in Europe; even if previous studies do not take into account the
crisis period, results are quite similar. The decomposition of income smoothing shows that
the net factor income and the transfers channels are almost nil. A little impact is given by
the capital depreciation channel (with an estimated beta equal to -0.05) and this means that
3Financial Account provides data divided by sectors (central banks, governments, financial institutions,other sectors).
10
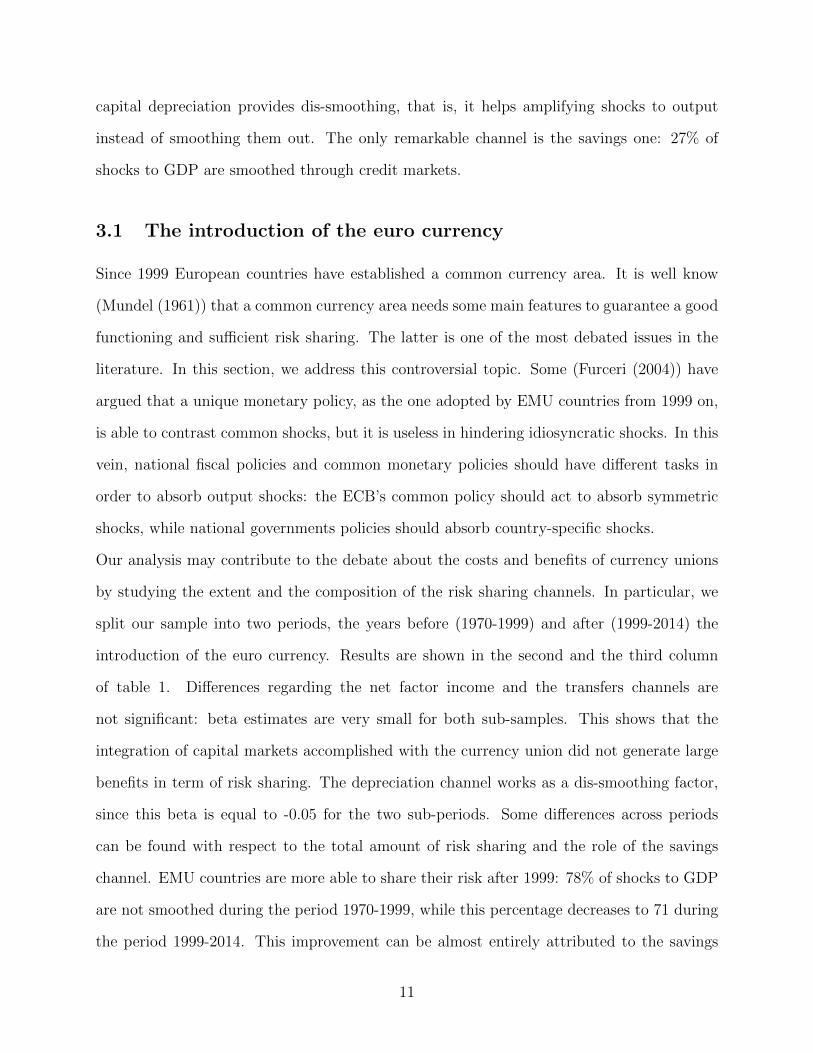
capital depreciation provides dis-smoothing, that is, it helps amplifying shocks to output
instead of smoothing them out. The only remarkable channel is the savings one: 27% of
shocks to GDP are smoothed through credit markets.
3.1 The introduction of the euro currency
Since 1999 European countries have established a common currency area. It is well know
(Mundel (1961)) that a common currency area needs some main features to guarantee a good
functioning and sufficient risk sharing. The latter is one of the most debated issues in the
literature. In this section, we address this controversial topic. Some (Furceri (2004)) have
argued that a unique monetary policy, as the one adopted by EMU countries from 1999 on,
is able to contrast common shocks, but it is useless in hindering idiosyncratic shocks. In this
vein, national fiscal policies and common monetary policies should have different tasks in
order to absorb output shocks: the ECB’s common policy should act to absorb symmetric
shocks, while national governments policies should absorb country-specific shocks.
Our analysis may contribute to the debate about the costs and benefits of currency unions
by studying the extent and the composition of the risk sharing channels. In particular, we
split our sample into two periods, the years before (1970-1999) and after (1999-2014) the
introduction of the euro currency. Results are shown in the second and the third column
of table 1. Differences regarding the net factor income and the transfers channels are
not significant: beta estimates are very small for both sub-samples. This shows that the
integration of capital markets accomplished with the currency union did not generate large
benefits in term of risk sharing. The depreciation channel works as a dis-smoothing factor,
since this beta is equal to -0.05 for the two sub-periods. Some differences across periods
can be found with respect to the total amount of risk sharing and the role of the savings
channel. EMU countries are more able to share their risk after 1999: 78% of shocks to GDP
are not smoothed during the period 1970-1999, while this percentage decreases to 71 during
the period 1999-2014. This improvement can be almost entirely attributed to the savings
11

channel. For the period 1970-1999, the beta savings is 0.27, while for the other sub-sample
(1999-2014) it increases to 0.30. To this extent, the introduction of the euro seems to have
a positive effect on the total amount of risk shared among member countries.
Has this improvement occurred before or after the financial crisis? To address this question,
we split the period 1999-2014 into two parts, 1999-2006 and 2007-2014; results are presented
in table 2. For the pre-crisis period, beta un-smoothed is equal to 0.77, while for the crisis
period is 0.69. This means that during the crisis risk sharing increased. Thus, the increase
in risk sharing highlighted for the period 1999-2014 mainly refer to the crisis period: this
casts some doubts on the real effectiveness of the common currency in helping risk sharing.4
Moreover, before the crisis (1999-2006) the beta savings has a lower impact; the two estimates
are 0.15 and 0.39 respectively for the pre-crisis and crisis period. Hence, it seems that credit
markets have contributed to share risk within the union during the crisis. To investigate
better this issue, a detailed analysis on the savings channel will be presented in section 4.
1970-2014 1970-1999 1999-2014EMU
Factor Income (βf) 1 2*** 3[1] [1] [2]
Capital Depreciation (βd) -5*** -5*** -5***[1] [1] [1]
Transfers (βt) 0 2* 0[1] [1] [1]
Savings (βs) 27*** 27*** 30***[2] [3] [5]
Not Smoothed (βu) 77*** 78*** 71***[2] [3] [3]
Table 1: Smoothing via main channels; Euro Zone; pre and post euro. Notes : Percentages ofshocks absorbed at each level of smoothing. Standard errors in brackets. ***, **, * denotesignificance at 1, 5, 10 percent levels, respectively.
4The results are in line with some recent literature (Villaverde et al. (2013); Picco (2016))
12

1999-2006 2007-2014EMU
Factor Income (βf) 7 2[5] [4]
Capital Depreciation (βd) -2 -12***[2] [2]
Transfers (βt) 1 0[1] [1]
Savings (βs) 15* 39***[9] [8]
Not Smoothed (βu) 77*** 69***[6] [6]
Table 2: Smoothing via main channels; Euro Zone; pre and post crisis. Notes : Percentagesof shocks absorbed at each level of smoothing. Standard errors in brackets. ***, **, * denotesignificance at 1, 5, 10 percent levels, respectively.
3.2 A comparison with the US
We compare our results with the US federation and we report the results for the main
channels of risk sharing in the US in Table 3. We expand the sample period that has been
taken into account by the literature, running the analysis for the years 1999-2014. Total
amount of risk sharing in the US (57%) is higher than the one in the EMU and the channels
that prevail are different in the two unions. Indeed, US capital markets play the largest role
in risk sharing (27% in the entire period), while the credit markets channel exhibits a minor
role (12%). The transfers channel could be explained in the following way. The tax-transfer
system of the US central government is a vehicle for further income smoothing (since the US
are a political union and have federal taxes and transfers almost not existing in the EMU,
the third component of smoothing displayed in Table 3 is not directly comparable with the
βt in the EMU). This channel provides a non negligible amount of income smoothing: for
the period 1999-2014 the estimated beta is 0.19.
As for the EMU analysis, we split US results into two sub-samples, pre-crisis and crisis
period. In the US the crisis has decreased the total amount of shocks to GDP smoothed and
has hindered the functioning of the main channels of risk sharing: indeed, beta un-smoothed
for the period 1999-2006 is equal to 0.30, while it is 0.40 for the period 2007-2014. Moreover,
13
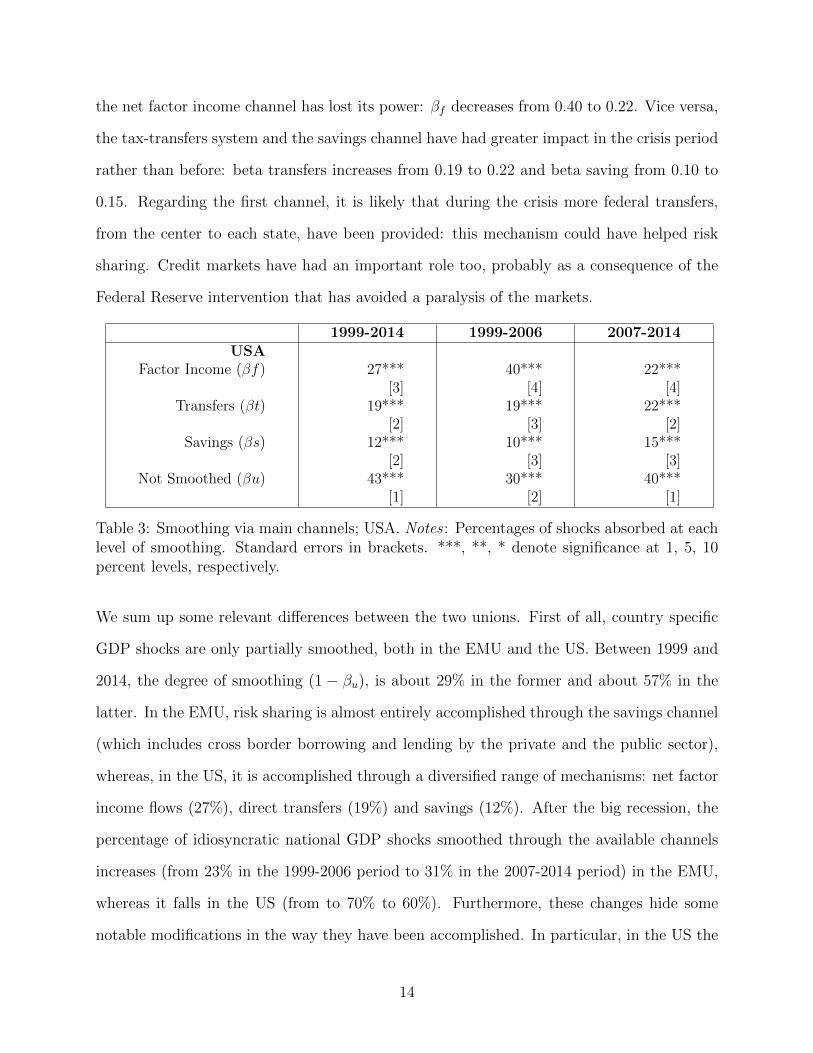
the net factor income channel has lost its power: βf decreases from 0.40 to 0.22. Vice versa,
the tax-transfers system and the savings channel have had greater impact in the crisis period
rather than before: beta transfers increases from 0.19 to 0.22 and beta saving from 0.10 to
0.15. Regarding the first channel, it is likely that during the crisis more federal transfers,
from the center to each state, have been provided: this mechanism could have helped risk
sharing. Credit markets have had an important role too, probably as a consequence of the
Federal Reserve intervention that has avoided a paralysis of the markets.
1999-2014 1999-2006 2007-2014USA
Factor Income (βf) 27*** 40*** 22***[3] [4] [4]
Transfers (βt) 19*** 19*** 22***[2] [3] [2]
Savings (βs) 12*** 10*** 15***[2] [3] [3]
Not Smoothed (βu) 43*** 30*** 40***[1] [2] [1]
Table 3: Smoothing via main channels; USA. Notes : Percentages of shocks absorbed at eachlevel of smoothing. Standard errors in brackets. ***, **, * denote significance at 1, 5, 10percent levels, respectively.
We sum up some relevant differences between the two unions. First of all, country specific
GDP shocks are only partially smoothed, both in the EMU and the US. Between 1999 and
2014, the degree of smoothing (1 − βu), is about 29% in the former and about 57% in the
latter. In the EMU, risk sharing is almost entirely accomplished through the savings channel
(which includes cross border borrowing and lending by the private and the public sector),
whereas, in the US, it is accomplished through a diversified range of mechanisms: net factor
income flows (27%), direct transfers (19%) and savings (12%). After the big recession, the
percentage of idiosyncratic national GDP shocks smoothed through the available channels
increases (from 23% in the 1999-2006 period to 31% in the 2007-2014 period) in the EMU,
whereas it falls in the US (from to 70% to 60%). Furthermore, these changes hide some
notable modifications in the way they have been accomplished. In particular, in the US the
14
channel that drops the most is the net factor income (from 40 to 22%), while the contributions
of savings and direct transfers to income smoothing increase by a modest amount (from 10
to 15% and from 19 to 22% respectively). In the EMU, instead, there is a big increase in
the amount of risk sharing achieved through savings (from 15 to 39%).
The main differences underlined above could be explained as follow. The important role of
the savings channel in the EMU could be considered as the consequence of the possibility for
European governments to implement budget deficits, whereas lack of political union in the
EMU implies a non significant role of direct transfers. On the contrary, US member states
satisfy balanced budget rules (their governments do not borrow/lend into credit markets to
achieve risk sharing), but they could exploit federal transfers from the center.
4 The savings channel and the role of European
institutions
In this section we focus on the savings channel, that is the most important mechanism of
risk sharing in the Euro Zone. Based on the previous analysis it can not be established
whether the major part is played by savings from the private or the public sector. Here, we
investigate this topic for the period 1999-2014.5 In order to catch the role of each component
we run the regressions in the form presented in the section 2.2. Results are shown in table
4.
Looking at the whole period (1999-2014), the most important component of the channel
is the public savings’ one, indeed the beta estimated is equal to 0.28; besides, corporate
savings provide a significant source of smoothing (11% of shocks to GDP are smoothed
through them). On the contrary, the households savings beta is negative. This means that
households provide dis-smoothing through their behavior on credit markets.
5Savings data by sectors are available starting from 1996.
15

Is this composition of the savings channel confirmed for the crisis period? In the second
column of table 4 we present results for 2007-2014 sample. The savings channel as a whole
increases its power: beta-total savings is equal to 0.39. As above, the role of public savings
is the most prominent one, with an estimated beta of 0.38. An important contribution is
due to corporate savings as well (16% of shocks smoothed). Households savings have the
same behavior highlighted for the other sample period: they dis-smooth income with a beta
of -0.12.
We go further in the analysis and split the amount of shocks absorbed through public savings
into government lending position versus European institutions, on the one hand, and versus
any other entities, on the other hand, as explained in section 2.2.
Before presenting regressions results, we provide some descriptive data on EU official flows
1999-2014 2007-2014EMU
Not Smoothed (βu) 71*** 69***[4] [6]
Savings (βs) 30*** 39***[5] [8]
Public savings (βspubl) 28*** 38***[5] [9]
Corporate savings (βscorp) 11*** 16**[4] [7]
Households savings (βshous) -7** -12**[3] [5]
Table 4: Smoothing via savings channel: private vs public savings; Euro Zone. Notes :Percentages of shocks absorbed at each level of smoothing. Standard errors in brackets. ***,**, * denote significance at 1, 5, 10 percent levels, respectively.
and governments savings. During the recent crisis, the increase of government bonds yields
for some countries, such as Greece, Ireland, Spain, has obstructed traditional governments
borrowing from markets; this is one of the reasons why European institutions have provided
aids to that governments and have helped some of them to borrow at lower rates. Figure 1
shows the spread between the cost of funding for the Periphery countries, i.e. the long-term
16

Figure 1: Cost of funding: spread between long-term yield and ESFS/ESM rates
government bond yield (10 years), and the rate at which ESFS and ESM have provided loans
to these countries for the period February 2011 - December 2014.6
Furthermore, it is interesting to look at the trend of EU institutions flows and governments’
savings in the Euro Zone. Figure 2 shows the pattern of the total net lending from European
institutions and governments savings of all EMU countries in the period 2007-2014. First,
during the crisis, a prominent amount of loans flow from European institutions to member
countries and, from 2012, national governments start to repay these loans. Differently,
governments savings show the following trend: from 2007 to 2009 they drop; then, they
start to grow. This means that only from 2010 on they exhibit a counter-cyclical pattern
(this is mainly due to austerity measures imposed to PIGS). Thus, during the period 2007-
2009 national governments expand their budgets and enact fiscal expansionary measures
(a big fiscal stimulus affects the entire EMU); then, they start to save and receive aids
from EU institutions in order to be helped repaying their debts. The trends plotted in
figure 2 are in line with the regressions results reported in table 5. Zooming into public
6Source: ESM Annual Report 2014.
17

Figure 2: Government savings and EU net lending; 2007-2014. Euro per capita.
2007-2014EMU
Not Smoothed (βu) 69***[6]
Private Savings (βspriv) 4**[5]
Public savings (βspubl) 38***[9]
Governments (βsgov) -17*[30]
EU institutions (βsEU) 55*[30]
Table 5: Smoothing via savings channel: national governments vs European institutions;Euro Zone. Notes : Percentages of shocks absorbed at each level of smoothing. Standarderrors in brackets. ***, **, * denote significance at 1, 5, 10 percent levels, respectively.
18
sector, it is noteworthy that the major role in sharing risk is played by net lending from
European institutions: βEU is 0.55. Conversely, the counter-cyclical pattern exhibited by
governments savings reflects into a negative βsgov (-0.17). Thus, during the crisis period,
national governments lose their power in sharing risk, but this role is largely compensated
by EU supranational mechanisms. In the next section we will show how this result comes
from different behaviors among EMU countries.
5 Core versus Periphery countries
In this section we show the main differences in risk sharing mechanisms between Core and
Periphery countries. First, we present results on the main channels of risk sharing for the
whole period, 1999-2014, and the crisis period, 2007-2014; then, we perform the key exercise
of the paper, i.e. the splitting of the βs into its components, emphasizing that the trends
underlined above (austerity measures, counter-cyclical governments’ savings pattern and
European institutions interventions) have changed risk sharing mechanisms within the EMU
during the crisis.
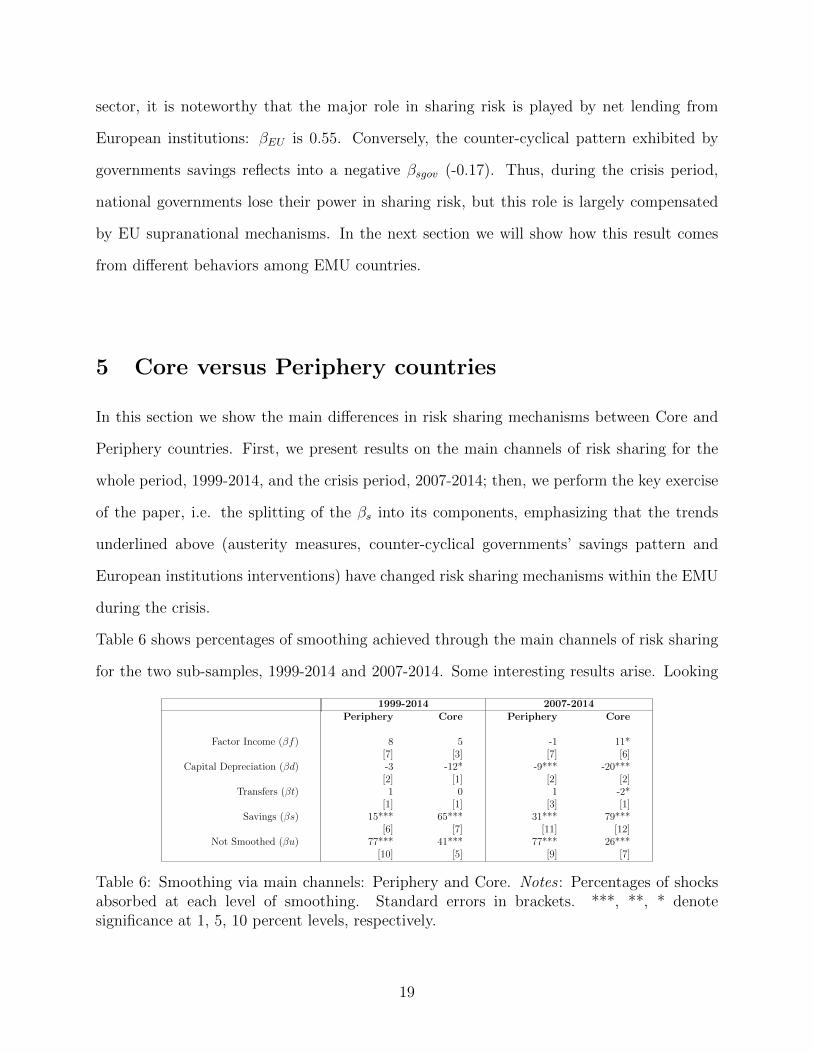
Table 6 shows percentages of smoothing achieved through the main channels of risk sharing
for the two sub-samples, 1999-2014 and 2007-2014. Some interesting results arise. Looking
1999-2014 2007-2014Periphery Core Periphery Core
Factor Income (βf) 8 5 -1 11*[7] [3] [7] [6]
Capital Depreciation (βd) -3 -12* -9*** -20***[2] [1] [2] [2]
Transfers (βt) 1 0 1 -2*[1] [1] [3] [1]
Savings (βs) 15*** 65*** 31*** 79***[6] [7] [11] [12]
Not Smoothed (βu) 77*** 41*** 77*** 26***[10] [5] [9] [7]
Table 6: Smoothing via main channels: Periphery and Core. Notes : Percentages of shocksabsorbed at each level of smoothing. Standard errors in brackets. ***, **, * denotesignificance at 1, 5, 10 percent levels, respectively.
19

at the whole period, it is noteworthy that βu is much higher for the Periphery than for the
Core (0.77 versus 0.41). This significant difference is mostly driven by the savings channel:
indeed, for the first group beta-total savings is equal to 0.15, whereas for the second it is equal
to 0.65. Thus, since the inception of the euro currency, the two groups of countries exhibit
different behaviors: in particular, the net adjustment of the asset holdings is significant for
the Core, whereas it is weak for the Periphery. A plausible explanation could be the following.
Core countries have saved in expansion (before 2007); this has allowed them to expand their
budgets during the great depression: the traditional consumption smoothing mechanism has
worked well. On the contrary, Periphery countries have increased public liabilities during
the boom (1999-2006) and consolidated their fiscal positions during the bust (2007-2014),
obstructing the consumption smoothing mechanism.
The crisis period analysis reveals other important features. For the Core countries the total
amount of risk sharing is higher than in Periphery ones (74% versus 23% respectively). The
net factor income channel gives a remarkable contribution to risk sharing only for Core
countries: indeed, its percentage of smoothing is 11. On the contrary, for the Periphery
this beta is not significant.7 As for the whole period, main differences concern the savings
channel: for the Core βs is equal to 0.79, while for the Periphery it is equal to 0.31.
The savings channel is better investigated and decomposed further: table 7 shows its
composition for the period 2007-2014. Looking at the two components of the channel, private
and public, it is noteworthy that the former exhibits a similar pattern for the two groups: beta
private saving is 0.05 for Core and 0.13 for Periphery. More remarkable differences concern
public savings. First, the beta public savings for Core is 0.77 whereas for Periphery is 0.23.
This means that public sector in Core has had a fundamental role in smoothing consumption
and this could be imputed to two mechanisms: the adjustment through investment and
borrowing/lending in international markets.8 Secondly, figures are very different also with
7These results could be partially explained by the sudden stop (cfr. Gros and Alcidi (2015)).8As underline by some literature (Kalemli et al. (2014)) “for Core countries self-insurance in the form
of pro-cyclical real investment at home provided substantial risk sharing.” Our results do not hinder thisconclusion.
20

Periphery Core
Not Smoothed (βu) 77*** 26***[9] [7]
Total Savings (βs) 31*** 79***[11] [12]
Private Savings (βspriv) 13* 5*[9] [10]
Public savings (βspubl) 23* 77***[17] [10]
Governments (βsgov) -63* 73***[30] [12]
EU institutions (βsEU) 86* 3[30] [9]
Table 7: Smoothing via savings channel: Periphery and Core. Notes : Percentages ofshocks absorbed at each level of smoothing. Standard errors in brackets. ***, **, * denotesignificance at 1, 5, 10 percent levels, respectively.
respect to the splitting into beta-national governments and beta-European institutions. As
said before, Periphery countries’ governments have been constrained by austerity measures
reducing public spending in the crisis period. This is reflected into a negative βsgov (-0.63).
Conversely, they benefited from huge loans by European institutions: their effects on risk
sharing are reflected in a high βEU of 0.86. On the contrary, Core countries have not been
constrained on their budgets and they show a very high beta national government savings
(0.73) and a βEU of 0.03.
In figure 3 we plot government savings and EU net lending trends for PIGS and non-PIGS:
less pro-cyclical savings for PIGS have lead to a decrease in risk sharing for this group of
countries; the conclusion is opposite for the Core.9
To sum up, the most interesting result is the following: on the one hand, for the first group of
countries (PIGS) the percentage of risk sharing achieved through the European institutions’
loans is high, while for non-PIGS this channel does not provide any smoothing. On the
other hand, results are opposite regarding the national government savings channel: for
9This findings are in line with Kalemli-Ozcan et al. (2014): “Risk sharing collapsed in Greece, Ireland,Italy, Portugal and Spain in 2010. This was the result of government austerity programs.” and with Balliand Sorensen (2007): “in the EU risk sharing has been declining due to less pro-cyclical saving”.
21

Figure 3: Government savings and EU net lending: Periphery and Core; 2007-2014. Europer capita.
PIGS this channel provides dis-smoothing, while for non-PIGS this channel is fundamental.
For PIGS austerity measures have impacted negatively on risk sharing,10 but this mechanism
has been replaced by a significant amount of transfers from the center; vice versa, the national
government channel continues to be an important channel for Core countries.11
These results bring to the following conclusion. As suggested by some literature (Furceri
and Zdzienicka (2015)) in order to increase risk sharing in the EMU a system of temporary
transfers could be needed; such a system has been handed out by transfers from the EFSF
and the ESM or by bilateral loans across EMU countries; our results show that these transfers
were able to increase risk sharing.12
10Kalemli-Ozcan et al (2014) find that government savings for PIIGS countries in 2010 provide dis-smoothing (their beta estimate is -0.38).
11“The ability of national government to smooth consumption by running budget deficits may be limitedby law. The 1992 Maastricht requirements regarding government debt suggest that similar restrictions arelikely to be imposed in a future EMU. This will shift the burden of smoothing consumption from the nationalgovernment to private sector or to the EC budget.” Sorensen and Yosha (1998). We add: or to some othercentralized mechanism, such as ESM.
12“Today, risk sharing between euro area countries occurs to a considerable extent through publicinstitutions and only to a limited extent through markets. This has constituted an optimal response toa temporary malfunctioning of markets. [...] Official assistance packages have provided elements of expost cross-country risk-sharing to Greece, Ireland and Portugal, which had been cut off from internationalmarkets.” Benoit Coeure, Member of the Executive Board of the ECB; speech at Princeton University, 20April 2012.
22
6 Concluding remarks
Could European union be considered a federation able to achieve good functioning of risk
sharing mechanisms as other federations? In order to answer this question it is useful to
compare some results obtained for the EMU and for the US. First of all, the major differences
between the two are that in the US risk sharing is generally higher than in Europe and that
in the US the private sector drives consumption smoothing, while in the EMU the public
sector does most of the job. As a consequence of this fact, an important argument that
arises is why so little risk sharing is achieved through factor markets in the EMU. Evidently,
the answer is that both labor and financial markets are much more fragmented. In other
words, although the EMU is highly integrated in terms of commodities trading, it is very
fragmented with respect to services and financial trading. If, between 1999 and 2014, in the
EMU net factor income flows had contributed to risk sharing as much as they did in the US
in the same time interval, the overall degree of risk sharing in the EMU would have been
about 50%, compared to 57% in the US. This may suggest that a full implementation of
a financial market union along with a much more integrated market in services and a free
movement of workers may largely compensate for the lack of a political union.
Nevertheless, even if the EMU relies very little on financial markets, it relies largely on public
sector; this feature allowed European union to respond to the recent crisis in a particular
way: in the US big recession decreased the degree of consumption smoothing, whereas in
Europe risk sharing increased. What happened? Crisis has shown pros and cons of the EMU.
Indeed, on the one hand austerity measures have pushed in the direction of a decrease in risk
sharing, less pro-cyclical government savings have had negative effects and the traditional
and most important government savings channel has lost its power; on the other hand, good
mechanisms of risk sharing, such as the creation of the ESFS and the ESM, have been
put in place and they have revealed their strength. During the crisis the contribution to
consumption smoothing from national government savings has been negative (-0.17) whereas
the contribution from official EU lending has been remarkable (0.55). For PIGS the national
23
government savings channel has provided dis-smoothing (-63%), but official EU lending
has been a suitable substitute (86% of smoothing through European institutions). Thus,
we agree with some recent literature (Kalemli-Ozcan et al. (2014)) for which risk sharing
from government savings declined during the crisis, but we add and stress a very important
result, that is, consumption smoothing increased due to the intervention of central European
institutions.
We conclude that central mechanisms help the good functioning of risk sharing in the EMU
providing coordination among member states without necessarily driving the members’ fiscal
policy decisions - that should be national prerogatives - and without going towards a fiscal
union that would cancel out sovereignty at national level.
24

References
Alcidi, C., D’Imperio, P., Thirion, G., (2016). Intertemporal risk sharing in the EMU:
Disentangling the role of international credit markets and of the governments. Working
Paper. Mimeo.
Arreaza, A., Sorensen, B., Yosha, O., (1998). Consumption smoothing through fiscal policy
in OECD and EU countries. NBER Working Paper 6372.
Asdrubali, P., Sorensen, B., Yosha, O., (1996). Channels of interstate risk sharing: United
States 1963-1990. Quarterly Journal of Economics 111, 1081-1110.
Asdrubali, P., Tedeschi, S., Ventura, L., (2015). Household Risksharing Channels. MPRA
Paper 65906.
Balli, F., Sorensen, B., (2007). Risk sharing among OECD and EU countries: the role of
capital gains, capital income, transfers and saving. MPRA Paper 10223.
Balli, F., Kalemli-Ozcan, S., Sorensen, B., (2012). Risk sharing through capital gains.
Canadian Journal of Economics 45, 472-492.
Balli, F., Basher, S. A., Ozer-Balli, H., (2013). International income risk sharing and the
global financial crisis of 2008-2009. Journal of Banking and Finance 37, 2303-2313.
Balli, F., Rana, F., (2015). Determinants of risk sharing through remittances. Journal of
Banking and Finance 55, 107-116.
Balli, F., Pierucci, E., (2016). Risk sharing among economic sectors. MPRA Paper 72452,
University Library of Munich, Germany.
Baxter, M., Crucini, M. J., (1995). Business cycles and the assets structure of foreign trade.
International Economic Review 36, 821-854.
Bayoumi, T., Klein, M., (1997). A Provincial View of Economic Integration. IMF Staff
Papers, 44, 534556.
Buttner, T., (2002). Fiscal Federalism and Interstate Risk Sharing: Empirical Evidence
from Germany. Economics Letters 74, 195202.
Cochrane J. H., (1991). A simple test of consumption insurance. Journal of Political
25

Economy 99, 957-976.
Demyanyk, Y., Ostergaard, C., Sorensen, B., (2008). Risk sharing and portfolio allocation
in EMU. European Economy - Economic Papers 2008 - 2015.
European Stability Mechanism, Annual Report (2014).
Feldstein, M., Horioka, C., (1980). Domestic savings and international capital flows.
Economic Journal 90, 314-329.
Furceri, D., (2004). Does the EMU Need a Fiscal Transfer Mechanism? Vierteljahrshefte
zur Wirtschaftsforschung / Quarterly Journal of Economic Research, DIW Berlin, German
Institute for Economic Research 73, 418-428.
Furceri, D., Karras, G., (2008). Business-cycle synchronization in the EMU. Applied
Economics 40, 1491-1501.
Furceri, D., Zdzienicka, A., (2015). The Euro Area Crisis: Need for a Supranational Fiscal
Risk Sharing Mechanism? Open Economies Review 26, 683-710.
Gros, D., Alcidi, C., (2015). Country adjustment to a sudden stop: does the euro make a
difference? International Economics and Economic Policy 12, 5-20.
Kalemli-Ozcan, S., Sorensen, B., Yosha, O., (2001). Economic integration, industrial
specialization and the asymmetry of macroeconomic fluctuations. Journal of International
Macroeconomis 55, 107-137.
Kalemli-Ozcan, S., Sorensen, B., Yosha, O., (2003). Risk sharing and industrial
specialization: regional and international evidence. American Economic Review 93, 903-
918.
Kalemli-Ozcan, S., Luttini, E., Sorensen, B., (2014). Debt crises and risk sharing: the role
of markets versus sovereigns. Scandinavian Journal of Economics 116, 253-276.
Lane, P. R., Milesi-Ferretti, G. M., (2007). The external wealth of nations mark II: revised
and extended estimates of foreign assets and liabilities, 1970-2004. Journal of International
Economics 73, 223-250.
Lewis, K., (1996). what can explain the apparent lack of international consumption risk
26

sharing? Journal of Political Economy 104, 267-297.
Mace, B., (1991). Full insurance in the presence of aggregate uncertainty. Journal of Political
Economy 99, 928-956.
Mundell, R. A., (1961). A theory of optimum currency areas. American Economic Review
51, 657-665.
Obstfeld, M., Rogoff; K., (1996). Foundations of international macroeconomics. MIT Press,
Cambridge.
Pierucci, E., Ventura, L., (2012). International risk sharing and globalization. MPRA Paper
35869, University Library of Munich, Germany.
Rogantini Picco, A., (2016). International risk sharing in EMU. Working paper. Mimeo.
Sala-i-Martin, X., Sachs, J., (1991). Fiscal Federalism and Optimum Currency Areas:
Evidence for Europe From the United States. NBER Working Papers 3855.
Sorensen B., Yosha, O., (1998). International risk sharing and European monetary
unification. Journal of International Economics 45, 211-238.
Villaverde, J. F., Garicano, L., Santos, T., (2013). Political credit cycles: the case of the
Eurozone. Journal of Economic Perspective 27, 145-166.
Von Hagen, J., Hepp, R., (2013). Interstate risk sharing in Germany: 1970-2006. Oxford
Economic Papers, Oxford University Press, vol 65 (1), p. 1-24, January.
27

A Data
A.1 National Accounts
GDP, GNI, NI, DNI, C and sectoral savings data are from OECD Annual National Account,
Main Aggregates and Detailed Tables; the period covered is 1970-2014.
All data are in nominal terms and are transformed into real terms using CPI deflator; they
are transformed in per-head terms using the population data from OECD.
• B1 GA: Gross Domestic Product (GDP);
• B5 GS1: Gross National Income (GNI);
• B5 NS1: Net National Income (NI);
• B6 NS1: Net National Disposable Income (DNI);
• SS1: Total Net Saving (corporation; general government; households)
Reference year is 2010 for all countries.
A.2 European transfers
European public transfers data are from IMF data; Balance of Payments (BPM6); Financial
account, Other investment, Loans, Net acquisition of financial assets - Net incurrence of
liabilities, General government.
Data from Balance of Payments are compared with the official data and documents from
European Commission and from the following institutions: European Financial Stability
Facility (ESFS), European Financial Stabilization Mechanism (EFSM), European Stability
Mechanism (ESM).
Loans are financial assets that are (a) created when a creditor lends funds directly to a debtor,
and (b) evidenced by documents that are not negotiable. This category includes all loans,
28

including mortgages, financial leases and repo-type operations. All repo-type operations,
i.e. repurchase agreements, sell/buy-back operations and securities lending (with exchange
of cash as collateral), are treated as collateralised loans, not as outright purchases/sales of
securities, and are recorded under Other investment, within the resident sector that carries
out the operation. Definition of loans from Commission Regulation (EU) No 555/2012 of 22
June 2012.
A.3 U.S. data
1. GDP. GDP is available from BEA.
2. SI: State income
State income is constructed as follow: State personal income
+ federal nonpersonal taxes
+ state and local nonpersonal taxes
- direct transfers
State personal income is available from BEA (SA1);
Direct transfers is available from BEA (SA35);
Federal nonpersonal taxes is constructed as follow:
Federal corporate income taxes
+ federal excise taxes.
Total federal corporate income taxes and federal excise taxes are available from FRED;
the incidence by state is not known and has been imputed using weights; the weight
for a state is the share of the state in U.S. GDP.
State and local nonpersonal taxes is constructed as follow:
State and local tax revenue
- state and local personal taxes
State and local tax revenue is from OECD; for the weights see above.
State and local personal taxes are from BEA (SA50).
29
3. DSI: Disposable state income
Disposable state income is constructed as follow:
State income
+ federal transfers to individuals
- federal nonpersonal taxes
- federal personal taxes
Federal transfers to individuals is from BEA (SA35) and include the following
components: railroads retirement and disability payments; workers compensation;
supplemental Social Security (SSI); veterans benefits; medical benefits.
Federal nonpersonal taxes: see 2.
Federal personal taxes is from BEA (SA50).
4. State consumption
State consumption is constructed as follow:
Total personal consumption expenditure
+ state and local government consumption
Total personal consumption expenditure is available from BEA.
State and local government consumption is constructed as follow:
State and local government expenditure
- state and local transfers
State and local government expenditure and state and local transfers are available from
FRED; for the weights see above.
30