cellular nanocomposites based on rigid …cellmat.es/wp-content/uploads/2017/02/19.pdf · bién por...
TRANSCRIPT

FACULTAD DE CIENCIAS
DEPARTAMENTO DE FISICA DE LA MATERIA CONDENSADA, CRISTALOGRAFÍA Y MINERALOGÍA
TESIS DOCTORAL:
CELLULAR NANOCOMPOSITES BASED ON RIGID POLYURETHANE AND NANOCLAYS:
FABRICATION, CHARACTERIZATION AND MODELING OF THE MECHANICAL AND THERMAL
PROPERTIES
Presentada por ……SERGIO ESTRAVÍS SASTRE…….. para optar al grado de
doctor /ra por la Universidad de Valladolid
Dirigida por: ……………MIGUEL ÁNGEL RODRÍGUEZ PÉREZ…….…………………..


He
di
co
Ed
co
pr
gr
sig
As
a
Fi
an
Fi
W
fo
e de agrade
versas instit
oncedida inic
ducación (b
ongresos han
royectos del
rupo CellMa
guientes pro
1. MINIS
MAT2
2. PROYE
Balsa
21414
3. “Desa
térmic
4. “Espu
Foam
5. “Uso
propie
simismo, agr
la hora de su
nancial assis
nd FPU grant
nancial assis
1. MINIS
MAT2
2. EURO
Balsa
21414
3. “Deve
Funde
4. “Polyu
Asturb
5. “Use o
PU ba
We would al
ormulations u
cer la financ
uciones. En
cialmente po
beca FPU (
n sido en gen
grupo de in
at para el e
oyectos:
STERIO DE E
2006‐11614‐C
ECTO EUROP
wood and
48,Contract N
rrollo de nu
co”. Financia
mas de poli
Asturblank 0
de nanopar
edades de es
radecemos a
uministrar fo
stance durin
t (
stance provid
STRY OF EC
2006‐11614‐C
PEAN NANC
wood and P
48,Contract N
elopment of
ed by BSH‐gr
urethane fo
blank 061/09
of sepiolite n
sed foams”.
so like to t
used in this t
ciación para
primer lugar
or la Junta d
))
neral financi
vestigación.
studio de m
CONOMIA Y
C03‐01, MAT
PEO NANCOR
PVC core m
No. NMP3‐LA
uevas espum
ado por BSH‐
iuretano pa
061/090501
rtículas de s
spumas de P
a Luis Vela, d
ormulaciones
g the course
) is gratefu
ded by the fo
ONOMY AN
C03‐01 y MA
CORE PROJEC
PVC core ma
No. NMP3‐LA
novel polyu
oup 061/111
ams for th
90501
nanoparticle
Funded by T
thank Mr. L
thesis
Financiació
a llevar a cab
r las becas pa
de Castilla y
). A su vez,
iadas por la
Además, ag
materiales c
Y COMPETIV
T 2009‐1400
RE “Microce
material”. V
A‐2008‐2148
mas de poli
‐group 061/1
ra la fabrica
sepiolita par
S y PU”. Fina
de BASF Poliu
s para el des
Funding
e of this the
ully acknowle
ollowing rese
ND COMPET
AT 2009‐1400
CT “Microce
aterial”. VII
A‐2008‐2148
urethane fo
1055
e productio
es to optimiz
TOLSA S.A 06
Luis Vela fro
ón
bo esta inve
ara para la r
y León, y fin
la realizació
beca FPU y l
gradecemos
celulares pol
VIDAD, Progr
1‐C02‐01 y M
ellular nanoc
VII Programa
841
iuretano con
111055
ación de tab
ra la optimiz
anciado por T
uretanos Ibe
arrollo de es
g
esis from UV
edged.
earch project
TITIVENESS,
01‐C02‐01, y
llular nanoc
FrameWork
841
ams with im
on of surf
ze the struct
61/121051.
om BASF fo
estigación qu
realización d
almente por
n de estanc
la Uva y tam
la financiació
liméricos pr
rama Nacion
MAT 2012‐34
composite fo
a Marco, EC
n mejoras e
blas de surf”
zación de la
TOLSA S.A 06
ria S.A., por
sta investigac
Va, Junta of
ts is also ack
National M
y MAT 2012‐3
composite fo
Program, EC
mproved the
boards ”, F
ture and pro
or supplying
ue he recibi
de la tesis do
r el Ministe
cias y asisten
mbién por div
ón recibida
roveniente d
nal de Mate
4901
or substituti
C Project Nu
en el aislam
”, Financiad
a estructura
61/121051
el apoyo log
ción.
Castile and
knowledged:
aterials Pro
34901
or substituti
C Project Nu
ermal insula
Funded by
operties of P
g of some o
do de
octoral
rio de
ncia a
versos
por el
de los
riales.
ion of
umber
miento
o por
y las
gístico
Leon,
ogram.
ion of
umber
ation”.
Foam
PS and
of the


CONTENTS
CONTENTS ...................................................................................................................................... i
Resumen de la tesis en español .................................................................................................. R1
R1. Introducción y motivación ........................................................................................ R3
R2. Objetivos .................................................................................................................. R7
R.3. Materiales, fabricación y técnicas de caracterización empleadas .......................... R9
R.4. Resultados ............................................................................................................. R17
R.5. Conclusiones y trabajo futuro ............................................................................... R22
R.6. Artículos y congresos............................................................................................. R24
R.7. Aplicación de los resultados obtenidos en procesos industriales ......................... R26
Bibliografía .................................................................................................................... R27
1. INTRODUCTION ........................................................................................................................ 1
1.1. Motivation ...................................................................................................................... 3
1.2. Objectives ....................................................................................................................... 7
1.3. Contents ......................................................................................................................... 9
1.4. Publications and presentations in conferences ........................................................... 10
1.5. Applicability of the obtained results in industrial processes ....................................... 11
Bibliography ........................................................................................................................ 12
2. BACKGROUND AND STATE OF THE ART ................................................................................. 15
2.1. Cellular materials ........................................................................................................ 17
2.1.1. Description, advantages and types ..................................................................... 20
2.1.2. Cellular structure .................................................................................................. 24
2.1.3. Estimation of mechanical properties of cellular materials .................................. 25

Index
| ii
2.1.4. Thermal conductivity of cellular materials ........................................................... 25
2.2. Water Blown Rigid Polyurethane Foams ..................................................................... 27
2.2.1. Chemistry of polyurethane .................................................................................. 27
2.2.2. Polyurethane components .................................................................................. 31
2.2.3. Cell structure of PU foams ................................................................................... 36
2.2.4. Foaming process ................................................................................................... 36
2.2.5. Properties and applications .................................................................................. 37
2.3. Montmorillonites ......................................................................................................... 38
2.3.1. Nanoparticles in polymer science ....................................................................... 38
2.3.2. Composition and structure of montmorillonites ................................................ 39
2.3.3. Functionalization ................................................................................................. 42
2.4. Foamed polyurethane nanocomposite filled with nanoclays: state of the art ............ 45
2.4.1. Density and Foaming Agents ............................................................................... 45
2.4.2. Dispersion Techniques used to
produce the polyurethane nanocomposite foams ........................................................ 48
2.4.3. Nanoclays concentration ..................................................................................... 49
2.4.4. Cellular Structure and Thermal Conductivity ...................................................... 51
2.4.5. Mechanical Properties ......................................................................................... 57
2.4.6. Conclusions ........................................................................................................... 62
Bibliography ........................................................................................................................ 63
3. MATERIALS AND CHARACTERISATION TECHNIQUES ............................................................. 71
3.1. Materials ..................................................................................................................... 73
3.1.1. Polyurethane ........................................................................................................ 73
3.1.2. Nanoclays ............................................................................................................. 74
3.1.3. Foams productions ............................................................................................... 75
3.1.4. Samples preparation ............................................................................................ 80

Index
| iii
3.2. Macroscopic Techniques .............................................................................................. 82
3.3.1. Rheology ............................................................................................................... 82
3.3.2. Density .................................................................................................................. 85
3.3.3. Mechanical properties at low strain rates: compression, bending and
torsion tests ................................................................................................................... 86
3.3.4. Dynamic Mechanical Analysis (DMA) ................................................................... 90
3.3.5. Thermal conductivity ........................................................................................... 91
3.3.5.1. Rapid K Heat Flow Meter ..................................................................... 92
3.3.5.2. Transient Plane Source ........................................................................ 93
3.4.6. Extinction coefficient ........................................................................................... 95
3.4.7. Reaction kinetics .................................................................................................. 96
3.3. Microscopic Techniques .............................................................................................. 97
3.3.1. SEM ...................................................................................................................... 97
3.3.2. Open cell content ................................................................................................. 98
3.3.3. X‐ray tomography .............................................................................................. 100
3.3.4. X‐ray diffraction .................................................................................................. 100
Bibliography ...................................................................................................................... 103
4. INFLUENCE OF THE FORMULATION AND DISPERSION TECHNIQUE EMPLOYED .................. 105
4.1. Objectives ................................................................................................................... 107
4.2. Rheological study for the different dispersion techniques
and different polyol blends .............................................................................................. 107
4.2.1. Results ............................................................................................................... 107
4.2.2. Discussion ........................................................................................................... 111
4.3. Foams characterization ............................................................................................. 113
4.3.1. Structural characterisation ................................................................................ 113
4.3.1.1. Density ............................................................................................... 113

Index
| iv
4.3.1.2 Cellular structure ................................................................................ 114
4.3.1.3 SAXS ..................................................................................................... 118
4.3.2. Macroscopic characterisation ........................................................................... 120
4.3.2.1. Dynamic Mechanical Analysis ............................................................ 120
4.3.2.2. Mechanical properties in compression and shear ............................. 122
4.3.2.3. Mechanical properties in compression: Comparison
with previous results ...................................................................................... 131
4.3.2.4. Thermal conductivity .......................................................................... 134
4.3.3. Discussion ........................................................................................................... 134
4.4.‐ Summary and conclusions ........................................................................................ 141
Bibliography ...................................................................................................................... 143
5. NANOCLAYS CONCENTRATION: EFFECTS ON MECHANICAL PROPERTIES AND THERMAL
CONDUCTIVITY ......................................................................................................................... 147
5.1. Objectives ................................................................................................................... 149
5.2. Materials .................................................................................................................... 149
5.3. Characterization ........................................................................................................ 150
5.3.1. Structural characterisation ................................................................................ 150
5.3.1.1. Density ............................................................................................... 150
5.1.2 Cellular structure ................................................................................... 151
5.3.1.3 SAXS ..................................................................................................... 158
5.3.2. Macroscopic characterisation ........................................................................... 159
5.3.2.1. Mechanical properties: compression, bending and shear ................. 159
5.3.2.2. Thermal conductivity ......................................................................... 167
5.3.2.3. Extinction coefficient .......................................................................... 171
5.3.3. Modelling of the thermal conductivity ............................................................... 177
5.3.2.2. Modelling the Extinction Coefficient .................................................. 177

Index
| v
5.3.2.3. Prediction of Thermal Conductivity .................................................... 179
5.4.‐ Discussion .................................................................................................................. 189
5.4.‐ Summary and conclusions ........................................................................................ 195
Bibliography ...................................................................................................................... 200
6.‐ CONCLUSIONS AND FUTURE WORK .................................................................................... 203


RESUMEN DE LA TESIS EN ESPAÑOL


R | 3
Resumen de la tesis en español
R.1. Introducción y motivación
Una de las principales motivaciones para la realización del presente trabajo de
investigación fue la creación de una nueva línea de investigación en espumas de poliuretano
en el Laboratorio CellMat, perteneciente al Departamento de Física de la Materia Condensada,
Cristalografía y Mineralogía de la Universidad de Valladolid. CellMat fue creado en 1999 por los
Catedráticos José Antonio de Saja y Miguel Ángel Rodríguez Pérez, con el objetivo de estudiar
los materiales celulares. Desde entonces numerosos temas han sido tratados dentro de
CellMat, como el desarrollo de nuevas rutas de producción para materiales celulares, la
obtención de productos multifuncionales más ligeros y con propiedades mejoradas, creación
de nuevos conocimientos dentro de la relación procesado‐estructura‐propiedades‐
aplicaciones, modelado del comportamiento físico de los materiales celulares, etc.
La producción científica de CellMat1‐13 ha estado centrada principalmente en las
espumas termoplásticas y de aluminio, y dentro de los termoplásticos particularmente en los
materiales basados en poliolefinas. Pese a ello, la presencia en el mercado de estos materiales
era, y continúa siendo, muy pequeña frente a materiales celulares como el poliuretano (PU), el
poliestireno (PS) y el policloruro de vinilo (PVC). Esta fue una de las principales razones que
animo a la creación de una nueva línea de investigación centrada en el área de las espumas de
poliuretano.
Las espumas de poliuretano presentan un amplio rango de aplicaciones en diferentes
industrias como la de automoción, equipamiento deportivo, muebles y construcción, entre
muchas otras. Sólo en los Estados Unidos, el negocio del poliuretano tiene un mercado
estimado de 20.000 millones de dólares y es un elemento fundamental en la economía
norteamericana, empleando de manera directa a más de 200.000 personas14. A nivel mundial,
la estimación total del mercado del poliuretano es de unos 40.000 millones de dólares,
esperándose que crezca hasta alcanzar los 62.000 millones en 201815. En el origen de esta gran
presencia en el mercado se encuentra el gran potencial de aplicación de este tipo de espumas,
que permite adaptarlas prácticamente a cualquier situación sin más que cambiar los
componentes iniciales. Junto con esto, la “aparente sencillez” de la tecnología de espumado ha
hecho a estos materiales muy competitivos desde el punto de vista económico.

Resumen de la tesis en Español
R | 4
En la actualidad hay que añadir a todo esto el creciente mercado de la nanotecnología,
la cual ha tenido un considerable impacto sobre las investigaciones que se han llevado a cabo
en CellMat en los últimos años. En general, las nanopartículas pueden tener un impacto
significativo sobre los materiales, y en particular sobre el mundo de las espumas de
poliuretano, abriendo un amplio abanico para modificar las propiedades a la carta. El empleo
de nanopartículas en la investigación científica ha presentado un aumento significativo en los
últimos años16‐19, e incluso muchas de las ventajas del empleo de esta tecnología han
alcanzado ya el mercado20, 21. Su presencia como aditivo en materiales convencionales puede
suponer, además del refuerzo de determinadas propiedades ya existentes, la aparición de
otras nuevas22. De entre todos los nanomateriales empleados para la fabricación de
nanocompuestos poliméricos, las nanoarcillas son uno de los más estudiados12, 23‐25. El secreto
de este éxito se encuentra en que las nanoarcillas son materiales presentes en la naturaleza
que ya están siendo comercializados, presentando una morfología laminar con considerable
relación de aspecto y grandes capacidades de intercambio de cationes.
Por todas las razones previamente expuestas, las espumas de poliuretano reforzadas
con nanoarcillas es un tema muy actual dentro de la investigación en materiales, con un alto
potencial de aplicación, lo que explica el interés suscitado dentro de CellMat. Varios trabajos
han sido ya publicados en este tema previamente, por ejemplo Modesti et al.22 estudiaron las
posibles sinergias en el retardo de llama entre los ignifugantes basados en fosforo (fosfinatos
de aluminio) y silicatos multicapa usando como matriz polimérica espumas de poliuretano,
obteniendo que las arcillas actuaban como barrera física previniendo o disminuyendo la
difusión de volátiles u oxígeno. El procesado, estructura y propiedades de nanocompuestos de
espumas (tanto rígidas como flexibles) de poliuretano basados en arcillas ha sido estudiado
por Cao et al.26, observándose un aumento en la densidad celular, una reducción del tamaño
de celda respecto al material sin nanopartículas y una reducción de la temperatura de
transición vítrea y de las propiedades mecánicas para espumas rígidas. Widya y Macosko27
incorporaron mediante ultrasonicación diferentes concentraciones de nanoarcillas (1, 2, 3 y 5
%) en espumas rígidas de poliuretano, obteniendo una reducción del tamaño de celda y un
aumento de la densidad celular incluso para los contenidos más bajos de nanoarcillas.
El presente trabajo explora el efecto de la incorporación de nanoarcillas en la
estructura celular, en las propiedades mecánicas y en las térmicas de espumas rígidas de
poliuretano de una manera distinta a la que se ha venido haciendo en la literatura previa.
Aunque anteriormente se había estudiado la incorporación de nanoarcillas en espumas de
poliuretano rígidas, se echaba en falta un mayor detalle en el estudio de aspectos tales como
Resumen de la tesis en Español
R | 5
la calidad de la dispersión de las arcillas, el grado de la exfoliación de las nanopartículas, la
influencia de éstas en la estructura celular, en el estudio de los mecanismo físicos y químicos
que podrían afectar a las propiedades físicas y modelado de las propiedades. Los trabajos
publicados previamente han estado típicamente centrados en un amplio número de partículas
nanométricas, incluso en un amplio número de formulaciones de poliuretano, lo que ha
implicado un estudio menos detallado de cada sistema en particular. En algunos de estos
estudios, parámetros claves en los materiales celulares como la densidad o la estructura
celular no han sido estudiados en detalle. De manera general, aspectos como la dispersión y
exfoliación de las nanopartículas y el modelado de las propiedades no se han estudiado a
fondo. Por estas razones, en este trabajo hemos seleccionado un número limitado de
formulaciones y un tipo particular de nanoarcillas funcionalizadas con el objetivo de llevar a
cabo un estudio más detallado de estos sistemas particulares. Con todos los datos obtenidos
de la caracterización y mediante el empleo de diferentes modelos teóricos, se han identificado
los orígenes de los cambios en las propiedades finales, permitiendo estos resultados analizar la
influencia de los diferentes parámetros que han sido modificados por la aditivación de las
nanoarcillas.
Otro aspecto que debe tenerse en cuenta para comprender el desarrollo de la
presente tesis es la participación de CellMat en el proyecto europeo titulado: “NanCore:
nancompuestos microcelulares para la sustitución de la madera de balsa y el PVC”,
perteneciente al Séptimo Programa Marco de la Unión Europea y que se desarrolló entre
Noviembre de 2008 y Octubre de 2012. El principal objetivo del citado proyecto era el diseño
de un nuevo nancompuesto de bajo coste y estructura microcelular, cuyas propiedades
mecánicas fuesen comparables o incluso superiores a las de la madera de Balsa y a las de la
espuma de PVC, siendo por tanto capaces de sustituir a estos materiales como núcleo de
estructuras sándwich de bajo peso. En la actualidad, los materiales que se pretendían sustituir
están ampliamente presentes en aplicaciones de tipo energético (palas de aerogeneradores) o
de transporte (embarcaciones de recreo), con un mercado estimado de unos 2 billones de
Euros para los mercados europeos y americano. Además del objetivo referente a la reducción
de costes, el desarrollo de este nuevo material podría ayudar a resolver importantes
problemas de los consumidores europeos en el mercado y suministro tanto de la espuma de
PVC como de la madera de balsa. Respecto a la reducción de costes, el material desarrollado
debería presentar una reducción en su coste total de alrededor del 30% frente a los materiales
a los cuales pretendía sustituir, de los cuales la madera de balsa es el más barato. Por otro

Resumen de la tesis en Español
R | 6
lado, el material desarrollado debería presentar unas propiedades mecánicas que permitiesen
su aplicación en la industria eólica, como primer objetivo demandado desde la industria.
TABLA R.1. Participantes y principals actividades del proyecto NanCore.
Nombre del participante
País Principales actividades
LM Glasfiber A/S
(Cordinador)
Dinamarca
Especificación de los requisitos referentes al procesado, producción, y características mecánicas. Demostración y pruebas a gran escala. Gestión del Consorcio. Integración de nanocompuesto polimérico
microcelular (MNPC) en la estructura sándwich
Aalborg University
Dinamarca Modelado multi‐escala y simulaciones de los nanocompuestos
microcelulares; integración de MNPC en la estructura de sándwich; selección de componentes funcionalizados para los nanocompuestos.
Recticel Polyurethanes
Bélgica Desarrollo de formulaciones de poliuretano. Fabricación de espumas de
poliuretano a escala industrial.
Katholieke Universiteit Leuven
Bélgica
Caracterización reológica de los nanocompuestos, modelado multi‐escala y simulaciones de los nanocompuestos, integración de
nancompuesto polimérico microcelular (MNPC) en la estructura sándwich.
Universität Kassel
Alemania Procesado industrial del nanocomposite microcelular, caracterización
mecánica de los paneles sandwich de espumas.
University of Valladolid
España Producción y caracterización de las espumas a escala laboratorio,
análisis de los mecanismos de espumación.
Azimut‐Benetti S.P.A.
Italia Especificación de los requisitos con respecto al procesado; integración del MNPC en la estructura sándwich, demostración y pruebas a gran
escala.
Centre of Molecular and Macromolecular
Studies
Polonia
Selección de componentes funcionalizados para los nanocompuestos y de los elementos del proceso de espumado, producción y
caracterización de nanocompuestos sólidos de PP para aplicaciones de espumación.
Institute of Occupational Medicine
Reino Unido
Asuntos referentes a la seguridad de las nanopartículas empleadas en los nanocomposites
Technical University of Denmark
Dinamarca Análisis del ciclo de vida del nuevo material
EconCore N.V. Bélgica Integración del MNPC en la estructura sándwich.
FOCAL Limited Reino Unido
Especificación de los requisitos con respecto al procesado; integración del MNPC en la estructura sándwich; demostración y pruebas a gran
escala
Sekisui Alveo AG
Suiza Producción del nanocompuesto de PP espumado a escala industrial.

Resumen de la tesis en Español
R | 7
El consorcio para este proyecto consistía en una combinación de empresas líderes que usarían
este tipo de compuestos, junto con una serie de grupos de investigación expertos en
materiales (Ver tabla R.1). Durante este proyecto CellMat lideró el Paquete de Trabajo 3
(WP3): “Espumado de nanocompuestos”. Una parte importante de la actividad investigadora
estuvo centrada en la mejora de formulaciones de poliuretano suministradas por el socio
industrial del proyecto Recticel mediante la incorporación de nanoarcillas. Junto con esto, una
parte de la investigación, en aspectos relacionados con la calidad de la dispersión de las
nanopartículas, fue llevada a cabo en colaboración con la Universidad Católica de Lovaina
(KUL), integrante también del consorcio del proyecto.
R.2. Objetivos
Dado que este trabajo ha sido el primer contacto del grupo CellMat con las espumas
de poliuretano, los objetivos de la presente tesis no se restringen simplemente a los sistemas
de poliuretano y nanoarcillas bajo estudio, sino que se encuentran también relacionados con
poner a punto una serie de técnicas de fabricación y caracterización necesarias en el estudio
de estos materiales y que puedan ser útiles para futuros proyectos de investigación. Debido a
esto, los objetivos de esta tesis se pueden dividir en Objetivos Metodológicos y Objetivos
Científicos.
Objetivos Metodológicos:
Puesta a punto del proceso de producción de espumas rígidas de poliuretano
con nanopartículas: el objetivo era establecer un procedimiento estándar con
el fin de obtener una elevada reproducibilidad en la producción de muestras,
eliminando así cualquier posible cambio debido a variables no controladas.
Este procedimiento mostró su validez tanto para espumas reforzadas con
nanopartículas como sin reforzar, asegurando una buena estructura celular y
buenas propiedades físicas. Para llevar a cabo este objetivo varios sub‐
objetivos se tuvieron que llevar a cabo:
Selección de las formulaciones de poliuretano rígido.
Selección de las nanopartículas
Optimización del proceso de dispersión de las nanopartículas
Optimización de los parámetros de procesado para la
producción de espumas.

Resumen de la tesis en Español
R | 8
Tabla R.2.‐ Técnicas de caracterización empleadas
Técnica de caracterización / propiedad medida
Equipo Método
Medida de densidad Mettler Toledo AT261 ASTM D162228
Propiedades mecánicas: ensayos a compresión
Máquina de ensayos universal Instron, modelo 5500R6025
ASTM D162129
Propiedades mecánicas: ensayos a flexión
Máquina de ensayos universal Instron, modelo 5500R6025
ISO 178:2010 30
Propiedades mecánicas: ensayos a torsión
TA‐instrument, reómetro Ares‐melts
‐
Análisis dinamo‐mecánico (DMA) Mettler Toledo DMA/SDTA 861e ‐
Conductividad térmica Holometrix Rapid K Heat Flow
Meter UNE12667 31
Conductividad térmica Plato caliente de fuente plana transitoria para la medida de la
constante térmica (TPS) ISO 22007‐2:2008 32
Espectroscopia infrarroja para determinar la cinética de las reacciones
y el coeficiente de extinción
Espectrómetro Bruker Tensor 27 FTIR
‐
Microscopía electrónica de barrido (SEM)
JEOL JSM 820 ‐
Picnometría para determinar el contenido de celda abierta
Eijkelcamp 08.06 Langer ASTM D6226 33
Tomografía de rayos X
Tubo de rayos‐X FXE‐ 160.50, fuente de Feinfocus, sistema de detección PerkinElmer XRD 1620 CN3, etapa rotativa de MICOS
(UPR‐160F AIR)
‐
Reología para el análisis de la dispersión de las nanoarcillas
ARES‐G2, TA Instruments
Difracción de rayos X a ángulos bajos para determinar el grado de exfoliación
Bruker Discover D8 equipado con un detector LynxEye
‐
Optimización de las técnicas de caracterización de espumas de poliuretano.
Diferentes técnicas de caracterización previamente empleadas en CellMat
para otro tipo de espumas (principalmente flexibles) han sido adaptadas para
la caracterización de las espumas rígidas de poliuretano. En la tabla 1.2 se
presentan estas técnicas de caracterización junto con las correspondientes

Resumen de la tesis en Español
R | 9
normas que se han seguido (en caso de existir). Todas estas técnicas han sido
adaptadas en mayor o menor medida. En particular las técnicas que han
requerido un mayor esfuerzo a la hora de su adaptación han sido las
empleadas para el estudio del grado de dispersión (mediante reología) y para
la medida del coeficiente de extinción mediante espectroscopía infrarroja.
Objetivos Científicos: Se ha pretendido realizar un estudio detallado de los sistemas
bajo estudio.
Evaluar en detalle el efecto de la calidad de las dispersiones de las
nanoarcillas en el poliol sobre la estructura y propiedades de las espumas
de poliuretano reforzadas con nanoarcillas.
Evaluar en detalle el efecto del contenido de nanoarcillas en la estructura
celular, en las propiedades mecánicas y en las propiedades térmicas de los
nanocompuestos de espuma de poliuretano.
Mejorar las propiedades térmicas en conductividad térmica empleando las
nanoarcillas como agentes nucleantes y bloqueantes de la radiación
infrarroja.
Modelar la conductividad térmica de las espumas fabricadas, empleando
para ello la caracterización en detalle de la estructura celular y la medida
del coeficiente de extinción de las espumas.
R.3. Materiales, fabricación y técnicas de caracterización empleadas
A continuación se procede a describir los materiales y las técnicas de caracterización
empleadas en el desarrollo de esta tesis.
Materiales:
Tres formulaciones diferentes de poliuretano rígido, suministradas por BASF (1
formulación) y Recticel (2 formulaciones), fueron empleadas en el desarrollo de esta tesis. La
selección de estos materiales estuvo condicionada por los requerimientos del proyecto
NanCore, que hacían necesaria la utilización de espumas de baja densidad y buenas
propiedades mecánicas de partida (rigidez y resistencia). En la tabla R.3 se describen las
principales propiedades de las formulaciones.

Resumen de la tesis en Español
R | 10
La formulación proporcionada por BASF se trataba de una formulación comercial,
mientras que las proporcionadas por Recticel estaban diseñadas específicamente para este
proyecto, dado que Recticel pertenecía al consorcio del proyecto NanCore. La densidad
nominal de la espuma de BASF en espumación libre es de 52 kg/m3, mientras que los
materiales de Recticel presentan densidades de 50 y 120 kg/m3. Un aspecto fundamental a la
hora de seleccionar las formulaciones fue la viscosidad del poliol de las mismas, con tres
valores diferentes claramente diferenciados.
Todas las formulaciones presentan un isocianato de tipo metil difenil isocianato (MDI),
y el agente espumante empleado es agua en todos los casos. En la tabla R.3 se muestra
también el nombre abreviado que se ha empleado a lo largo de este trabajo. También se
muestra en esta tabla la viscosidad del poliol, que se encuentra entre los 650 y los 100.000
mPA∙s, un amplio rango que permite observar una gran variedad de comportamientos en
función de la técnica de dispersión empleada.
Tabla R.3. Principales características de las diferentes formulaciones de poliuretano empleadas
en esta investigación
Nombre comercial
Densidad
nominal en
espumado
libre (Kg/m3)
Relación
Pol./ Iso.
(en peso)
Viscosidad
del poliol
(mPA.s)
Tipo de
poliol
Tipo de
isocianato
BASF (LV)
Poliol: Elastopor* H
1501/2
Isocianato: IsoPMDI
92140
52 100/160 650
Poli‐
eter
poliol
MDI
Recticel baja
viscosidad
(MV)
‐ 120 100/74 1000 ‐ MDI
Recticel alta
viscosidad
(HV)
‐ 50 100/196 100000 ‐ MDI
En este estudio se emplearon las nanoarcilas Cloisite 30b, de la empresa Southern Clay
Products. Este tipo de nanoarcillas se usan habitualmente para la mejora de varias
propiedades físicas en polímeros, tales como rigidez, resistencia, temperatura de distorsión

Resumen de la tesis en Español
R | 11
térmica, coeficiente lineal de expansión térmica y propiedades barrera. En la tabla R.4 se
muestran sus principales características.
Estas nanoarcillas fueron seleccionadas por dos motivos: las recomendaciones del
fabricante y su empleo previo en numerosos artículos de la literatura científica22, 26, 27, 34 del
poliuretano, donde se ha documentado el efecto de este tipo de material sobre propiedades
como la estructura celular o la conductividad térmica.
Tabla R.4. Principales características de las nanoarcillas Cloisite 30B empleadas en esta investigación.
Humedad < 3%
Tamaño típico de particular
seca < 10 µm (d50)
Color Off White
Densidad Compactas 365 g/l
Densidad 1.98 g/cm3
Resultados en Rayos‐X
(espaciado interlamelar) d001 = 1.85 nm
Fabricación
Para la fabricación de las espumas se empleó el espumado reactivo, consecuencia de la
reacción que se produce al mezclar los dos productos reactivos (poliol e isocianato) que dan
lugar a la espuma de poliuretano. Previamente al mezclado de estos reactivos se ha de
proceder a un premezclado del poliol, con el fin de asegurar la homogeneidad de los diferentes
aditivos que éste incluye. La temperatura de los reactivos ha de ser asimismo controlada, a fin
de conseguir una mayor reproducibilidad. En el mezclado del poliol y el isocianto se empleó la
mezcladora IKA Eurostar Power control‐visc P1 (ver Fig. R1), equipada junto con un disco de
mezclado Lenart. En la producción de espumas de poliuretano a partir de la formulación de
BASF, el poliol y el isocianato fueron mezclados a 1200 rpm durante 15 segundos en un
recipiente plástico. Inmediatamente después se transvasó la mezcla a un molde de papel en el
cual la reacción de polimerización y el espumado se completaron.

Resum
R | 12
una
concr
fuero
con e
de es
TABLA
Técni
Mezc
(HM)
Mezc
cizalla
Ultra‐
men de la te
2
Para la p
etapa adic
retamente e
on desecadas
el fin de evita
spumado y a
A R.5. Principa
ica de dispers
lado a mano
lado de baja
a (LS)
‐sonicación (U
esis en Españ
Figura
roducción d
ional: la di
en el poliol p
s en un horn
ar posibles r
la densidad
ales caracterís
sión He
IKA E
co
equ
cabeza
US)
Sonic
750 (F
ciclos d
son
segu
e
ñol
R.3.‐ Mezclad
e espumas d
ispersión de
por su baja r
no de vacío e
reacciones en
final.
sticas de las d
erramienta de
mezclado
Paleta
Eurostar Powe
ontrol‐visc P1,
uipada con un
a mezcladora
hojas
cs Vibra‐Cell V
ig. 3.1.e), 20 K
de 3 segundo
nicación con 2
ndos de parad
entre ciclos
dora (a) y cab
de poliureta
e las nano
reactividad.
en torno a 6
ntre el isocia
iferentes técn
e Tiem
mezcl
~
er
a
de 4
1
VCX
KHz,
s de
2
da
15
ezal de mezcl
ano reforzad
arcillas en
Previamente
0°C de temp
anato y el ag
nicas de dispe
mpo de
lado(s)
V
me
30
20
500
ado (b)
as con nano
uno de lo
e a este paso
peratura dur
gua que afec
rsión utilizada
Velocidad de
ezclado (rpm)
30
200
‐
oarcillas se r
os dos reac
o, las nanoa
rante varias h
cten a las cin
as.
) Otras ca
Premezc
de las n
previo a
realizó
ctivos,
arcillas
horas,
éticas
aracterísticas
‐
‐
clado a mano
nanoarcillas
la sonicación

Figur
nano
estip
de la
junto
dime
el cas
el es
dime
las es
la mu
carac
Las difere
a R.2 se i
compuestos
ulada de pol
cantidad ne
o con el isocia
nsiones del
so de las mu
studio del e
nsiones de lo
F
Para la ca
spumas con
uestra analiza
Caracteri
A contin
cterización m
R
e
NANOCAYS
AFTER
DRYING
entes técnic
ndican los
s: pesado de
liol (1), dispe
ecesaria de i
anato (4) pa
molde empl
estras fabric
fecto de la
os materiale
Figura R.2. Esq
aracterizació
el fin de con
ada.
zación Macr
nuación se
macroscópica
Reología: La
empleada de
as de mezcl
diferentes
la cantidad j
ersión de las
socianato (3
ra a continua
eado en est
cadas para e
concentrac
es necesarios
quema de fab
ón de las mu
nseguir un va
roscópica
detallan y
as empleadas
reología (
manera cua
lado se resu
pasos lleva
justa de nan
s nanoarcilla
3), mezclado
ación verter
te último pas
l estudio de
ción. Estas v
s para realiza
ricación de lo
estras se pro
alor de dens
describen
s:
(Reómetro
alitativa para
R
umen en la t
ados a cab
noarcillas a e
s con la técn
de la disper
esta mezcla
so variaron e
la dispersión
variaciones s
ar los estudio
s nanocompu
ocedió a elim
idad y propie
brevemente
ARES‐G2 de
a el estudio
‐ HA
‐ LO
‐ U
1200 rpm, 1
esumen de l
tabla R.5, m
o en la fa
emplear (1), a
nica elegida
rsión de nan
en un molde
entre los 110
n, y los 310x
se debieron
os de caracte
estos celulare
minar la part
edades cons
las diferen
e TA Instru
de la calidad
AND MIXING
OW SHEAR MIXING
LTRASONICATION
15 s
la tesis en Es
mientras que
abricación d
añadir la can
(2), incorpor
noarcillas en
e de papel (5
0x110x80 m
x250x60 mm
n a las difer
erización.
es
te más exter
stantes sobre
ntes técnica
uments) ha
d de la dispe
MIXIN
PROP
POLYO
spañol
R | 13
en la
de los
ntidad
ración
poliol
5). Las
m3 en
3 para
rentes
ior de
e toda
as de
sido
ersión
NG AT THE RIGTH
ORTION
OL/ISOCYANATE

Resumen de la tesis en Español
R | 14
de las nanoparticulas en el poliol, previo a la fabricación de las espumas. Para
ello se han empleado las 3 formulaciones previamente descritas, y en cada una
de ellas han sido dispersadas las nanopartículas. En este análisis ha sido
fundamental la representación de Winter35, del módulo de la viscosidad
compleja |η*| frente al módulo complejo de cizalla |G*|. En esta
representación es posible comparar diferentes técnicas de dispersión para una
concentración dada de nanopartículas e identificar la técnica que mejor actúa
como aquella que produce un mayor cambio frente al material puro.
Densidad: Las medidas de densidad fueron realizadas de acuerdo con la norma
ASTM D162228, calculándose la densidad como el cociente de la masa y el
volumen. Las muestras fueron acondicionadas a una temperatura de 21±2 ºC y
con una humedad relativa del 50% durante al menos 48 horas.
Propiedades mecánicas a bajas velocidades de deformación: se realizaron
medidas de compresión, flexión y torsión. Estos experimentos se llevaron a
bajas velocidades de deformación para determinar la rigidez y resistencia de
los materiales. Las muestras fueron acondicionadas en idénticas condiciones a
las de las medidas de densidad. Los experimentos de compresión fueron
llevados a cabo en una máquina Instrom (modelo 5500R6025) bajo el estándar
ASTM D162129, a temperatura ambiente y en un esquema de platos paralelos,
con muestras de dimensiones 50x50x50 mm3. La máxima deformación estática
alcanzada para todos los experimentos fue de aproximadamente el 75%. La
información obtenida de este tipo de experimentos fue el valor del módulo de
elasticidad como la pendiente de la zona lineal en la representación del
esfuerzo frente a la deformación, y el valor del esfuerzo de colapso, como el
máximo de la curva en esta misma representación.
Las medidas de flexión fueron realizadas en las mismas condiciones
ambientales y en el mismo equipo, pero esta vez bajo un esquema de carga de
tres puntos, de acuerdo con el estándar ISO 178:201030, con dimensiones de
las muestras 120x15x15 mm3. De estos experimentos fue posible obtener los
valores del módulo de flexión, esfuerzo de flexión y deformación al máximo
esfuerzo.
Finalmente, las medidas del módulo de cizalla se realizaron en la Universidad
Católica de Lovaina (KUL), en Bélgica. De estas medidas se obtuvo el valor del
módulo de cizalla, en 2 planos diferentes: en el plano que contiene la dirección
de espumación del material y en un plano perpendicular a éste.

Resumen de la tesis en Español
R | 15
Análisis Dinamo‐mecánico (DMA): este tipo de medidas permite obtener las
propiedades viscoelásticas de los materiales en función de la temperatura,
tiempo y frecuencia, cuando son sometidos a un esfuerzo de tipo periódico.
Para estas experiencias se empleó un equipo DMA/SDTA 861e de la casa
Mettler Toledo configurado en modo de compresión, sobre muestras de forma
cilíndrica con 12 mm de diámetro y un espesor de entre 4 y 6 mm. Las medidas
fueron realizadas a una frecuencia de 1 Hz, con una tasa de calentamiento de
3ºC/min entre 0°C y 190‐200°C. Se aplicó una fuerza estática de 18N y una
deformación de 30 µm al 120%, de manera que la fuerza estática aplicada
sería un 120% de la fuerza dinámica aplicada. A lo largo de estas experiencias
se registraron los valores del módulo de almacenamiento (E’), el módulo de
pérdidas (E’’) y la tangente de perdidas (tag δ).
Conductividad térmica: Para las medidas de conductividad térmica se
emplearon 2 equipos diferentes: uno de ellos de la casa Holometrix basado en
la ley de Fourier y otro basado en resolver la ecuación del calor en el regiment
transitorio (método TPS, Hot disk). En el primero de los casos las medias se
realizan estableciendo un gradiente de temperaturas entre dos de los lados del
material, empleando un sensor de unos 100x100 mm2 y bajo la norma
UNE1266731. Las temperaturas de medida fueron de 10, 20, 25, 40 y 50 ºC. Las
muestras empleadas son considerablemente más grandes que para la otra de
las técnicas, presentando también las medidas una mayor fiabilidad. Para el
caso de las medidas en régimen transitorio, se empleó un elemento plano que
actúa tanto como sensor de temperatura como de fuente de calor,
produciendo un impulso eléctrico que genera un aumento de la temperatura.
Las medias realizadas con esta técnica fueron realizadas bajo la norma ISO
22007‐2:200832. La ventaja que supone esta técnica es su rapidez frente a la
anteriormente descrita, así como la flexibilidad en las dimensiones de las
muestras (de mucho menor tamaño), pero a su vez presenta la desventaja de
que requiere un especial cuidado a la hora de conseguir reproducibilidad en las
medidas.
Coeficiente de extinción: mediante un espectrómetro de infrarrojo de la casa
Brunker (modelo Tensor 27) se realizaron medidas de la transmitancia sobre
muestras con diferentes espesores, con el fin de calcular con los datos
obtenidos el coeficiente de extinción. Se empleó una resolución de 2cm‐1, para
un estudio de la región infrarroja que abarcó desde los 400 a los 4000 cm‐1.

Resumen de la tesis en Español
R | 16
Cinéticas de reacción: Con el mismo aparato empleado en la medida del
coeficiente de extinción pero en vez de en transmisión en reflexión atenuada,
se estudió el proceso de polimerización/espumación de materiales con y sin
nanopartículas. Para ello se siguió la evolución temporal del pico característico
del isocianato situado a 2270 cm‐1.
Caracterización Microscópica
A continuación se detallan y se describen brevemente las diferentes técnicas de
caracterización microscópicas empleadas:
Microscopia electrónica de barrido: mediante un microscopio electrónico de
barrido modelo JEOL JSM 820 se obtuvieron micrografías de las muestras
producidas para su posterior análisis mediante un software desarrollado en
CellMat36. A través de este programa y de las imágenes obtenidas se
obtuvieron las distribuciones de tamaños celulares, el tamaño celular medio y
la anisotropía celular de las diferentes muestras bajo estudio. También se
calculó el parámetro de desviación estándar normalizada (NSD) y el coeficiente
de asimetría de la distribución (AC).
Contenido de celda abierta: el porcentaje de celda abierta puede ser definido
como la relación entre el volumen de celdas interconectadas y el volumen total
de gas dentro de la espuma. Para su medida se empleó un picnómetro de aire
(Eijkelcamp 08.06 Langer) y se siguió la norma ASTM D622633, sobre muestras
cúbicas de arista 30 mm, realizando una corrección por el volumen de las
celdas cortadas en la superficie de la espuma.
Tomografía de Rayos‐X: se realizaron experiencias de tomografía de las
muestras en la Universidad de Gante, con la finalidad de obtener la fracción de
sólido presente en las aristas de la estructura celular de las muestras.
Difracción de Rayos‐X: Mediante esta técnica se estudió el grado de exfoliación
de las nanoarcillas en las espumas, analizando el desplazamiento del pico de
difracción asociado a la distancia interlaminar de las arcillas. En estos estudios
se emplearon muestras de caras paralelas con dimensiones 48x15x2 mm3.

Resumen de la tesis en Español
R | 17
R.4. Resultados
Se procede a continuación a la presentación de los principales resultados, divididos en
2 apartados diferentes, referentes a la técnica de dispersión empleada y a la concentración de
nanoarcillas presente en los materiales.
Técnicas de dispersión: Se fabricaron muestras con una concentración fija del 3% de
nanoarcillas dispersada con diferentes técnicas: mezclado a mano, usando baja cizalla y
mediante ultrasonidos (ver tabla R.3). Previamente se realizó un estudio de la dispersión de las
nanoarcillas en el poliol de las 3 formulaciones seleccionadas. A continuación se muestran los
principales resultados obtenidos en esta parte de la investigación:
Estudio reológico: a través de este estudio se seleccionó la formulación con
la menor viscosidad (BASF LV) para llevar a cabo la fabricación de espumas,
pues mostró ser aquella que presentaba una mayor sensibilidad a la
técnica de dispersión empleada. De esta manera se obtendrían unos
materiales con diferentes estados de dispersión de las nanoarcillas,
posibilitando el estudio del efecto de la dispersión sobre las propiedades
finales.
Densidad: por lo general se observó un ligero aumento de la densidad de
las espumas por la incorporación de las nanoarcillas (respecto al material
sin nanoarcillas), salvo en el caso del mezclado de baja cizalla. Este cambio
puede atribuirse al aumento de la viscosidad en la mezcla inicial, que
supondría una mayor resistencia a la hora de producirse el espumado y
consecuentemente una mayor densidad, junto con el hecho de que se
están introduciendo partículas de una alta densidad (Cloisite 30B ‐ 1980
kg/m3) en un material de muy baja densidad (poliuretano ‐ 50 kg/m3).
Tamaño de celda: se observó una reducción del tamaño de celda de en
torno al 10%, independientemente de la técnica de dispersión empleada,
respecto al material sin nanoarcillas.
Anisotropía celular: no se observaron efectos claros de las diferentes
técnicas de dispersión en la anisotropía celular por la incorporación de
nanoarcillas, con variaciones en torno al 10% respecto al material puro.
Porcentaje de celda abierta: con valores siempre por debajo del 10%, la
incorporación de las nanoarcillas, independientemente de la técnica con la

Resumen de la tesis en Español
R | 18
que han sido dispersadas, no ha supuesto variación alguna de esta
característica estructural.
Distribución del tamaño de celda: el parámetro de distribución estándar
(NSD) presentó un claro aumento (de 0.2 para el material puro a 0.3 para
las diferentes técnicas), mientras que el coeficiente de asimetría se ha
visto reducido por la presencia de las nanopartículas.
Eficiencia de la nucleación: se estudió este parámetro obteniéndose
similares valores a los observados en la bibliografía, siendo esta eficiencia
baja.
Intercalación de las nanoarcillas: el estudio de los resultados de las
experiencias de difracción de Rayos‐x sobre las muestras de poliuretano
con nanoarcillas mostraron una intercalación de las mismas, con
independencia de la técnica empleada. Los estudios de DMA corroboraron
estos resultados, mostrando una clara reducción de la movilidad de las
cadenas moleculares por la presencia de las nanoarcillas, que se manifestó
en un aumento del valor de la temperatura de transición vítrea (Tg) y un
descenso del valor de tan δ.
Propiedades a compresión (relativas al cuadrado de la densidad): la
inclusión de nanoarcillas en las espumas de poliuretano ha supuesto un
ligero aumento del módulo elástico de las espumas y una disminución de la
resistencia a compresión, todo ello independientemente de la técnica de
dispersión empleada. Estos cambios parecen atribuibles tanto a la
modificación de la estructura celular como a posibles interacciones entre
los puentes de hidrógeno de las cadenas poliméricas y las nanoarcillas.
Propiedades de cizalla: se han observado pequeñas diferencias por la
introducción de nanoarcillas. Aun así los mayores cambios han sido
observados entre las dos planos en las que se ha medido esta propiedad,
mostrando su dependencia con la anisotropía celular y la dirección de
crecimiento, con una clara mejora en el plano perpendicular a la dirección
de espumación respecto al plano paralelo a la misma.
Conductividad térmica: se ha detectado una reducción de la conductividad
térmica tras la introducción de las nanoarcillas. Este resultado es el
esperable tras la reducción del tamaño de celda observada y la estrecha
relación que existe entre ambas características.

Resumen de la tesis en Español
R | 19
Diferentes concentraciones: Se fabricaron muestras con cuatro concentraciones
diferentes de nanoarcillas (0.5, 1, 3 y 5%) dispersadas a baja cizalla, así como muestras de
material sin nanoarcillas. A continuación se resumen los principales resultados obtenidos:
Densidad: salvo en el caso de la menor concentración de nanoarcillas
(0.5%) donde se observó una pequeña disminución de la densidad, por lo
general se observó un ligero aumento de la densidad de las espumas por la
incorporación de las nanoarcillas (respecto al material sin nanoarcillas). Al
igual que en el estudio de las diferentes técnicas de dispersión, este
cambio puede atribuirse al aumento de la viscosidad en la mezcla inicial,
que supondría una mayor resistencia a la hora de producirse el espumado
y consecuentemente una mayor densidad, junto con el hecho de que se
están introduciendo partículas de una alta densidad (Cloisite 30B ‐ 1980
kg/m3) en un material de muy baja densidad (poliuretano ‐ 50 kg/m3).
Tamaño de celda: se observó una reducción del tamaño de celda por la
incorporación de las nanoarcillas, existiendo una correlación clara con la
cantidad de nanoarcillas incorporadas hasta el 3%, donde se alcanza un
máximo de reducción del 24% respecto al material sin carga. Asimismo, en
el caso de la concentración más alta de nanoarcillas (5%) también se
observó una reducción respecto al material puro, pero no tan acusada
(21%).
Anisotropía celular: se ha observado una ligera reducción del valor de la
anisotropía celular a medida que se ha aumentado la concentración de
nanoarcillas.
Porcentaje de celda abierta: Aun manteniéndose por debajo del 10%, sí se
ha observado una cierta variación en el porcentaje de celda abierta por la
incorporación de las nanoarcillas, con valores de esta propiedad en torno
al 6.5% para el material puro y con un 0.5% de nanoarcillas, y del 8.5% para
el resto de muestras.
Fracción de masa en las aristas: se han observado cambios considerables
en esta propiedad con el aumento de la concentración de nanoarcillas.
Mientras que para el material puro y las muestras con un 0.5 y un 1% de
nanoarcillas se han medido valores en torno al 0.66, para el 3% de
nanoarcillas el valor se incrementó hasta el 0.78, y para el 5% se midió un
0.76. Estos cambios han implicado alteraciones medibles en propiedades

Resumen de la tesis en Español
R | 20
como el coeficiente de extinción y la conductividad térmica. Su origen
puede encontrarse en los cambios producidos en la viscosidad de la mezcla
poliol‐nanoarcillas a medida que aumentaba la concentración de estas
últimas, cambios que pueden alcanzar una importancia considerable
durante la formación y estabilización de la estructura celular. Otra posible
explicación, compatible con la anterior, puede encontrarse en las
modificaciones de la cinética de las reacciones producidas por las
nanoarcillas. La presencia de nanoarcillas puede alterar la cinética de
polimerización, la de espumado o ambas, como se ha podido observar en
pruebas iniciales mediante el empleo de FTIR para la medida de estas
reacciones.
Distribución del tamaño de celda: el parámetro de distribución estándar
(NSD) presentó un claro aumento. De hecho, para el material con un 5% de
nanoarcillas se ha observado una distribución de celdas bimodal (un valor
del NSD de 0.62 para la muestra con 5% de nanoarcillas frente a 0.20 para
el material puro). El coeficiente de asimetría también ha mostrado un
aumento por la presencia de las nanopartículas.
Eficiencia de la nucleación: se estudió este parámetro observándose
similares valores a los presentes en la bibliografía, con un valor de la
eficiencia de nucleación bajo.
Intercalación de las nanoarcillas: el estudio de los resultados de las
experiencias de difracción de rayos X sobre las muestras de poliuretano
con nanoarcillas mostraron, para las diferentes concentraciones, una
intercalación de las nanoarcillas.
Propiedades a compresión (relativas al cuadrado de la densidad): la
inclusión de nanoarcillas en las espumas de poliuretano ha supuesto un
ligero aumento del módulo elástico de las espumas (hasta el 12% respecto
al material puro para una concentración de arcillas del 3%) y una
disminución de la resistencia a la compresión (esfuerzo de colapso,
reducción del 1 al 5% respecto al material puro). Estos cambios parecen
atribuibles tanto a la modificación de la estructura celular como a posibles
interacciones entre los puentes de hidrógeno de las cadenas poliméricas y
las nanoarcillas. El aumento de la cantidad de nanoarcillas presentes no
sólo no ha supuesto un aumento de las propiedades a compresión sino
que incluso ha llevado a su disminución.

Resumen de la tesis en Español
R | 21
Propiedades a flexión: Se ha observado una disminución de la deformación
al máximo esfuerzo, con una reducción de más del 50% respecto al
material puro para las mayores concentraciones de nanoarcillas. También
se han observado aumentos en el módulo de flexión, pero sin una
tendencia clara con respecto a la cantidad de nanoarcillas. Para el esfuerzo
de flexión se ha observado una reducción significativa, pasando de los 0.73
MPa del material puro a un valor medio de 0.65 MPa para los materiales
con nanoarcillas.
Propiedades de cizalla: se han observado pequeñas diferencias por la
introducción de nanoarcillas. Aun así los mayores cambios han sido entre
los dos planos en las que se ha medido esta propiedad, mostrando su
dependencia con la anisotropía celular y la dirección de crecimiento. De
nuevo, las mejores propiedades han sido observadas en el plano
perpendicular a la dirección de espumación.
Conductividad térmica: La evolución temporal de la conductividad térmica
ha venido marcada por la difusión del agente hinchante (CO2) a la
atmósfera. Aproximadamente 12 días después de la fabricación del
material la conductividad térmica alcanzó un estado estacionario, donde se
observó una reducción de la conductividad térmica en las muestras con
baja concentración de nanoarcillas respecto al material puro. Esta mejora
pude ser considerada en una primera aproximación un efecto secundario
de la reducción en el tamaño celular producido por las nanoarcillas, dada
la gran dependencia entre estas dos propiedades. Para el 1% de
nanoarcillas se observó el mínimo de conductividad térmica, y con la
finalidad de entender mejor los cambios producidos se procedió a realizar
una modelización de esta propiedad.
Modelización de la conductividad térmica: teniendo en cuenta los valores
medidos de tamaño de celda, fracción de masa en aristas y coeficiente de
extinción, se procedió a realizar una modelización de la conductividad
térmica de los materiales. Para ello se tuvieron en cuenta los diferentes
mecanismos de transmisión del calor involucrados en los materiales
celulares: transmisión a través de la fase gaseosa, transmisión por
radiación y transmisión de la fase sólida. El primero de los mecanismos es
el que tiene un mayor peso sobre la conductividad total (en torno al 70%) y
no experimentó cambios apreciables por la presencia de las nanoarcillas.

Resumen de la tesis en Español
R | 22
La transmisión por radiación sí que mostró cambios por la presencia de
nanoarcillas, como se puede deducir de los cambios en la estructura
celular y en el coeficiente de extinción, si bien en los modelos aplicados se
echa en falta el tener en cuenta la posible absorción/reflexión de la
radiación en las arcillas que permitiese un perfecto ajuste entre los datos
experimentales y los proporcionados por los modelos. Finalmente, para el
caso de la conducción a través del sólido, no se observa una
correspondencia entre modelo y resultados experimentales, pudiéndose
deber esto a la creación por parte de las nanoarcillas de una red de
percolación para concentraciones por encima del 1%, efecto que
incrementaría la conducción a través de la fase sólida que no se habría
tenido en cuenta en la modelización.
R.5. Conclusiones y trabajo futuro
Las conclusiones obtenidas del presente trabajo se pueden clasificar en tres apartados
diferenciados:
Metodología de fabricación y caracterización: cabe resaltar como
resultado destacable del presente trabajo el establecimiento de una
metodología de fabricación y caracterización para espumas de poliuretano.
Como bien ha sido resaltado en la introducción, las espumas de
poliuretano son una nueva área de estudio dentro del grupo CellMat, y
como resultado del presente trabajo ha sido y será posible el desarrollo de
nuevos proyectos en dicha área de manera mucho más efectiva, con un
menor gasto de recursos y tiempo.
Se puede concluir que este trabajo presenta una colección de técnicas de
caracterización, de índole tanto experimental como teórica, que puede
ayudar a una mejor comprensión de diferentes sistemas de poliuretano y
nanoarcillas, aspecto fundamental y necesario para la elección de la
nanopartícula a utilizar en cada material en concreto.
Dispersión de las nanopartículas: mediante el estudio de la dispersión de
las nanopartículas que ha sido llevado a cabo de manera previa a la
fabricación de las muestras finales, este trabajo ha ayudado a entender la
dependencia de la calidad de la dispersión respecto a la viscosidad del

Resumen de la tesis en Español
R | 23
reactivo, la dependencia también respecto de la potencia de la técnica
empleada así como la relación entre las propiedades finales del material
producido y la técnica de dispersión empleada. Estos resultados son de
gran importancia en la elaboración de nanocomposites dado el alto
número de partículas presentes incluso para bajas concentraciones de
nanopartículas.
Estructura celular, propiedades mecánicas y térmicas: finalmente,
refiriéndonos ya a los materiales celulares finales, los resultados obtenidos
en el desarrollo del presente trabajo han llevado a dos conclusiones
fundamentales. Por un lado es fácil alcanzar buenos resultados con la
introducción de pequeños porcentajes de nanoarcillas, sin la necesidad de
recurrir a una técnica de dispersión demasiado cara o laboriosa para la
obtención de estos resultados. Por otro lado la pequeña mejora, incluso la
disminución, de las propiedades mecánicas para concentraciones altas de
nanoarcillas es síntoma del claro efecto que presenta la interacción entre
la matriz polimérica y las nanopartículas en las espumas rígidas de
poliuretano. Dado que la alteración de los enlaces puente de Hidrógeno
por la presencia de las nanoarcillas parece ser la responsable de este
empeoramiento, es necesario prestar especial atención a la relación de
aspecto de las nanopartículas y a su funcionalización superficial, por lo
menos en los casos en los que se trate de buscar una mejora de las
propiedades mecánicas.
Desde el punto de vista morfológico ha sido posible observar una clara
reducción del tamaño celular, achacable en gran medida a la presencia de
las nanopartículas en la matriz polimérica y su efecto nucleante. Esto ha
sido observado para todas las técnicas de dispersión empleadas y también
para las diferentes concentraciones, si bien ha sido acompañado a su vez
por una mayor dispersión de los tamaños de celda observados. Para las
concentraciones más altas de nanopartículas se ha observado una
considerable variación de la forma de repartirse el material en la
estructura celular, con un aumento de la fracción de masa en las aristas.
Otras propiedades como la conductividad térmica, altamente dependiente
de características morfológicas como el tamaño de celda y la fracción de

Resumen de la tesis en Español
R | 24
masa en aristas, han presentado mejoras incluso para las técnicas de
dispersión más sencillas.
Trabajo futuro
Tras el trabajo realizado para la elaboración de esta tesis, varios temas de investigación
serán afrontados por CellMat en los próximos años. A continuación se muestran algunos de
ellos:
1. Realizar un estudio similar pero con una selección más apropiada de los
materiales de partida. La experiencia obtenida del presente trabajo permitirá
una mejor selección de la formulación de poliuretano y de la funcionalización
de las nanoarcillas para una mejora de las propiedades con la ayuda de las
nanoarcillas.
2. Establecer una metodología para analizar la cinética de las reacciones
implicadas, que incluiría FTIR, termografía, radioscopia de rayos‐X y
expandometría óptica. Se espera con ello poder tener una mayor comprensión
del efecto de las nanopartículas durante el proceso de espumación.
3. Esclarecer diversos aspectos en la modelización de la conductividad térmica,
en particular los cambios en las propiedades ópticas del polímero base y el
cambio de las propiedades de la fase sólida por la presencia de las
nanoarcillas.
4. Desarrollar nuevos procedimientos que ayuden a una mejor dispersión y
exfoliación de las nanopartículas.
R.6. Artículos y congresos
Durante el desarrollo del presente trabajo, se llevaron a cabo las siguientes
presentaciones en congresos:
M.A. Rodriguez‐Perez, J. Pinto, J. Escudero, A. Lopez‐Gil, E. Solorzano, C. Saiz‐Arroyo, S. Estravis, S.
Pardo‐Alonso, Nano‐strategies applied to the production of cellular polymers with improved cellular
structure and properties. CellMat Conference, Dresden, Germany, 2012. (Talk)
S. Estravis , M.A. Rodriguez‐Perez, Polyurethane foam composites: relationship between mechanical
properties and filler matrix chemical interaction, SPE Eurotec Conference, Barcelona, Spain, 2011. (Talk)

Resumen de la tesis en Español
R | 25
S. Pardo, S. Estravís, E. Solórzano, M.A. Rodríguez‐Pérez, J.A. de Saja, Effect of nanoadditves in rigid
polyurethane foam nucleation monitored by X‐ray radioscopy, SPE Eurotec Conference, Barcelona,
Spain, 2011. (Talk)
S. Estravis , M.A. Rodriguez‐Perez, Modification of the mechanical properties of polyurethane
composites by using wastes of flexible polyurethane and sawdust as additives, FOAMS 2010, Seattle,
EEUU, 2010. (Poster)
P. Álvarez, A. Echeverría, M.M. Petite, M.A. Rodríguez‐Pérez, J. Pinto, S. Estravis, M.A.
Martines, J. Abenojar, Fabrication, characterization and modeling of sandwich panels with polyethylene
and polyurethane foams cores and aluminum skins, Comatcomp 09, San Sebastián, Spain, 2009.
(Poster)
M.A. Martínez, J. Abenojar, M.A. Rodríguez‐Pérez, J. Pinto, S. Estravis, J. Ecenero, E. Aldanondo, P.
Álvarez, Polyolefin and polyurethane foam‐aluminum joins: adhesion tests and modeling, X Congreso
de Adhesión y Adhesivos, Alicante, Spain, 2009. (Poster)
S. Estravis, J.A. de Saja, R. Verdejo, M.M. Bernal, M.A. Rodríguez‐Pérez, Improving the mechanical
properties of rigid PU foams using nanofillers, XI Reunión del GEP, Valladolid, Spain, 2009. (Poster)
De manera adicional, se realizaron o están próximas a realizarse las siguientes
publicaciones:
S. Pardo‐Alonso, E. Solórzano, S. Estravis, M.A. Rodriguez‐Perez, J.A. de Saja, In‐situ Evidences
of Nanoparticles Nucleating effect in Polyurethane‐Nanoclay Foamed Systems, Soft Matter
(2012) 8, 11262. DOI: 10.1039/C2SM259983D.
M. Bernal, I. Molenberg, S. Estravis, M.A. Rodriguez‐Perez, I. Huynen, M.A. Lopez‐Manchado,
R. Verdejo, Comparing the effect of carbon‐based nanofillers on the physical properties of
flexible polyurethane foams, Journal of Material Science (2012) 47 (15) 5673‐5679.
S. Estravís, M. A. Rodríguez‐Pérez , J. Tirado, S. Pardo‐Alonso; Rigid polyurethane foams with
infused nanoclays: relationship between cellular structure and thermal conductivity, Journal of
Polymer Science, 2014. (Submitted)
R. Van Hooghten, S. Gyssels, S. Estravis, M.A. Rodriguez‐Perez, P. Moldenaers, Understanding
the effect of particle free energy on the structural and mechanical properties of clay‐laden
rigid PU foams, European Polymer Journal, 2014 (Submitted)
S. Estravís, R. Van Hooghten, M. A. Rodríguez‐Pérez, R. Cardinaels, P. Moldenaers and J.
Vermant; Effect of dispersion quality on the structure and properties of polyurethane foams
infused with clays. (in preparation)
S. Estravís, R. Van Hooghten, M. A. Rodríguez‐Pérez, R. Cardinaels, P. Moldenaers and J.
Vermant; Effect of nanoparticles concentration on the structure and properties of
polyurethane foams infused with nanoclays. (in preparation)

Resumen de la tesis en Español
R | 26
R.7. Aplicación de los resultados obtenidos en procesos industriales
El conocimiento generado en el presente trabajo ha sido empleado de manera
satisfactoria para la realización de los siguientes proyectos con socios privados:
▪ Espumas de poliuretano para la producción de tablas de surf. Foam Asturblank (2009‐2010)
▪ Uso de nanopartículas de sepiolita para la optimización de estructura y propiedades en
espumas de base PS y PU. TOLSA S.A. (2012‐2013)
▪ Desarrollo de nuevas espumas de poliuretano con mejoras en sus propiedades aislantes.
(Bosch and Siemens Home appliances Group) (2012‐2013).

Resumen de la tesis en Español
R | 27
BIBLIOGRAFÍA
1 M.A. Rodríguez‐Pérez, Propiedades Térmicas y Mecánicas de Espumas de Poliolefinas, Thesis, University of Valladolid, (1999)
2 O. Almanza, Caracterización y Modelización de las Propiedades Térmicas y Mecánicas en
Espumas de Poliolefinas, Thesis, University of Valladolid, (2000)
3 L.O. Arcos y Rábago, Propiedades Térmicas y Mecánicas de Espumas de Poliolefinas
Fabricadas en un Proceso de Moldeo por Compresión, Thesis, University of Valladolid, (2002)
4 J.L. Ruiz‐Herrero, Impacto y Fluencia de Espumas con Base Polietileno, Thesis, University of
Valladolid, (2004)
5 J.I. González‐Peña, Efecto de los Tratamientos Térmicos en Bloques de Espuma de Polietileno
de Baja Densidad Producidos Mediante Moldeo por Compresión, Thesis, University of
Valladolid, (2006)
6 M. Álvarez‐Laínez, Propiedades Térmicas, Mecánicas y Acústicas de Espumas de Poliolefina de
Celda Abierta, Thesis, University of Valladolid, (2007)
7 J. A. Reglero Ruiz, Fabricacion y Caracterización de espumas de aluminio: aplicaciones en el
sector aeronáutico, Thesis, University of Valladolid, (2007)
8 E. Solórzano, Aluminum foams: Foaming process, cellular structure & properties, Thesis,
University of Valladolid, (2008)
9 F. Hidalgo‐González, Diseño Optimizado de los Parámetros de Proceso de Fabricación de
Espuma de Poliolefina Reticulada mediante Moldeo por Compresión, Thesis, University of
Valladolid, (2008)
10 S. Román‐Lorza, Fabrication and characterization of flame retardant halogen free polyolefin
based cellular materials, Thesis, University of Valladolid, (2010)
11 R. Campo‐Arnáiz, Aplicación de Técnicas Espectroscópicas al Estudio de la Morfología
Polimérica, Propiedades Térmicas y de Emisión de Espumas de Baja Densidad con Base
Poliolefina, Thesis, University of Valladolid, (2011)
12 C. Saiz Arroyo, Fabricación de materiales celulares mejorados basados en poliolefinas.
Relación procesado‐composición‐estructura‐propiedades, Thesis, University of Valladolid,
(2012)
13 J. Lobos Martín, Improving the stiffness and strength of porous materials by enhancement of
the matrix microstructure and cellular morphology, Thesis, University of Valladolid, (2013)
14 http://polyurethane.americanchemistry.com/
15 Polyurethane (PU) Foams Market by Types (Rigid & Flexible), End‐User Industries (Bedding &
Furniture, Building & Construction, Electronics, Automotives, Footwear, Packaging, & Others),
Resumen de la tesis en Español
R | 28
& Geography (North America, West Europe, Asia‐Pacific & Row) ‐ Global Trends & Forecasts to
2018, http://www.marketsandmarkets.com/Market‐Reports/polyurethane‐foams‐market‐
1251.html
16 L. J. Lee, C. Zeng, X. Cao, X. Han, J. Shen, G. Xu, Polymer nanocomposite foams, Composites
Science and Technology, 65(15–16), 2344‐2363, (2005)
17 S. Pavlidou, C.D. Papaspyrides, A review on polymer–layered silicate nanocomposites,
Progress in Polymer Science, 33, 1119–1198, (2008)
18 R. Verdejo, C. Saiz‐Arroyo, J. Carretero‐Gonzalez, F. Barroso‐Bujans, M.A. Rodriguez‐Perez,
M.A. Lopez‐Manchado, Physical properties of silicone foams filled with carbon nanotubes and
functionalized graphene sheets, European Polymer Journal, 44, 2790–2797 (2008)
19 J.I. Velasco, M. Ardanuy, V. Realinho, M.Antunes, A.I. Fernández, J.I. González‐Peña, M.A.
Rodríguez‐Pérez, J.A. de Saja, Polypropylene/clay nanocomposites: combined effects of clay
treatment and compatibilizer polymers on the structure and properties, Journal of Applied
Polymer Science, 102, 1213‐1223 (2006)
20 J. Weiss, P. Takhistov, D.J. McClements, Functional materials in food nanotechnology, Journal
of Food Science, 71(9), R107‐R116, (2006)
21 Q. H. Zeng, A. B. Yu, G. Q. Lu, D. R. Paul, Clay‐based polymer nanocomposites: research and
commercial development, Journal of nanoscience and nanotechnology, 5(10), 1574‐1592,
(2005)
22 M. Modesti, A. Lorenzetti, S. Besco, D. Hrelja, S. Semenzato, R. Bertani, R.A. Michelin,
Synergism between flame retardant and modified layered silicate on thermal stability and fire
behaviour of polyurethane nanocomposite foams, Polymer Degradation and Stability, 93,
2166–2171, (2008)
23 H. A.Patel, R. S. Somani, H. C. Bajaj, R. V. Jasra, Nanoclays for polymer nanocomposites,
paints, inks, greases and cosmetics formulations, drug delivery vehicle and waste water
treatment, Bulletin of Materials Science, 29(2), 133‐145, (2006)
24 D. Shah, P. Maiti, D. D. Jiang, C. A. Batt, E. P. Giannelis, Effect of nanoparticle mobility on
toughness of polymer nanocomposites, Advanced Materials, 17(5), 525‐528, (2005)
25 T. Kashiwagi, F. Du, J. F. Douglas, K. I. Winey, R. H. Harris, J. R. Shields, Nanoparticle networks
reduce the flammability of polymer nanocomposites, Nature Materials, 4(12), 928‐933, (2005)
26 X. Cao, L. J. Lee, T. Widya and C. Macosko, Polyurethane/clay nanocomposites foams:
processing, structure and properties, Polymer, 46, 775‐783, (2005)
27 T. Widya, C. W. Macosko, Nanoclay‐modified rigid polyurethane foam, J. of Macrom. Sci.,
Part B: Phys., 44(6), 897‐908, (2005)

Resumen de la tesis en Español
R | 29
28 ASTM D1622 – 08: Standard Test Method for Apparent Density of Rigid Cellular Plastics, ICS
Number Code 83.100 (Cellular materials), DOI: 10.1520/D1622‐08
29 ASTM D1621: Standard Test Method for Compressive Properties Of Rigid Cellular Plastics, ICS Number Code 83.100 (Cellular materials), DOI: 10.1520/D1621‐10
30 EN ISO 178, Plastics – Determination of flexural properties, European Committee for Standardization (CEN), (2010)
31 UNE‐EN 12667:2002, Thermal performance of building materials and products. Determination of thermal resistance by means of guarded hot plate and heat flow meter methods, Products of high and medium thermal resistance, (2002)
32 ISO 22007‐2. 2008. Plastics‐Determination of Thermal Conductivity and Thermal Diffusivity—Part 2: Transient Plane Heat Source (Hot Disc) Method (2008)
33 ASTM D6226 – 10: Standard Test Method for Open Cell Content of Rigid Cellular Plastics, ICS Number Code 83.080.01 (Plastics in general), DOI: 10.1520/D6226‐10
34 Ł.Piszczyk, M. Strankowski, M. Danowska, J. T. Haponiuk, M. Gazda, Preparation and characterization of rigid polyurethane–polyglycerol nanocomposite foams, European Polymer Journal, 48(10), 1726‐1733, (2012)
35 H.H. Winter, Three views of viscoelasticity for Cox–Merz materials, Rheologica acta, 48(3),
241‐243, (2009)
36 J. Pinto, E. Solórzano, M. A. Rodriguez‐Perez, J. A. de Saja, Characterization of the celular structure based on user‐interactive image analysis procedures, Journal of Cellular Plastics, 49(6), 555‐575, (2013)


CHAPTER 1:
INTRODUCTION

Chapter 1: Introduction
| 3
INTRODUCTION
1.1.‐ Motivation
One of the main motivations of this research has been establishing a new research
topic in polyurethane foams in the CellMat Laboratory, of the Condensed Matter Physics
Department of the University of Valladolid. CellMat was founded in 1999 by Professor Dr. D.
José Antonio de Saja and Professor Dr. D. Miguel Ángel Rodríguez Perez, with the aim of
studying cellular materials. From that time up to now, Cellmat has been focused on several
topics such as: development of new production routes for cellular materials, obtaining lighter
multi‐functional products with improved properties, creating new knowledge on the
relationship processing‐structure‐properties‐applications, modelling the physical behaviour of
cellular materials and designing applications using these products.
The scientific production of CellMat Laboratory1‐13 has been mainly related to
thermoplastic foams and aluminium based foams, and in particular in the case of
thermoplastic foams mainly in polyolefin based materials. However the market presence of
these particular materials was (and still is) much smaller than that of the cellular polymers
such as polyurethane (PU), polystyrene (PS) and polyvinyl chloride (PVC). This was one of the
key reasons to establish a new research area focused on polyurethane foams.
Polyurethane foams have a wide range of applications in different industries such as
automotive, sports equipment, furniture, construction and much more, and therefore a great
economical weight. Only in the United States, business of polyurethane has an estimated value
of $20 billion and it is a key element of the U.S. economy, employing directly more than
200.000 people14. Globally, the current estimated value of the global Polyurethane Foams
Market (2012) is $40.1 billion and is estimated to reach up to $61.9 billion by 201815. The origin
of this high values is largely due to the high applicability of polyurethane foams mainly based
on the possibility of tailoring the final properties of the material with just a change in the initial
components. In addition, the “apparent ” simplicity of the foaming technology has made these
materials very competitive from an economical perspective.
Furthermore, the growing field of nanotechnology has also had a considerable impact
in CellMat Laboratory research. In general terms, nanoparticles could have a significant impact
over the materials industry and in particular over polyurethane foams world, opening new
tailoring options for these materials. The use of nanoparticles in scientific research has
increased exponentially in the last few years16‐19, and even some of the advantages of this
Chapter 1: Introduction
| 4
technology have reached market20, 21. Employed as additive in conventional materials, its
presence can suppose not only the reinforcement of certain material properties, but also the
emergence of new properties22. Among the vast nano‐reinforcements available for fabricating
polymer nanocomposites, nanoclays are one of the most studied materials12, 23‐25. The reason
of this success is that nanoclays are naturally occurring minerals that are commercial available,
exhibit a layered morphology with high aspects ratios, large specific surface areas, and have
substantial cation exchange capacities.
For all the previously exposed reasons, polyurethane foams infused with nanoclays is
an actual research topic with high potential, which explains the generated interest in CellMat
Laboratory over this particular materials. Several works have been published previously in this
field. For instance Modesti et al.22 studied potential synergies in flame retardancy between
phosphorus‐based flame retardant (aluminium phosphinate) and layered silicates in
polyurethane foams, obtaining that clays act through physical effect constituting a barrier at
the surface which is effective in preventing or slowing the diffusion of volatiles and oxygen.
The processing, structure and properties of polyurethane‐clay nanocomposites foams, both
rigid and flexible, were studied by Cao et al.26, observing an increase in cell density, a reduction
of cell size for nanocomposites compared to pure PU foam and a reduction of the Tg and the
mechanical properties for rigid foams. Widya and Macosko27 incorporated different
montmorillonite based organoclay concentrations (1, 2, 3 and 5%wt.) into rigid polyurethane
foams with ultrasonication dispersion, obtaining a cell size reduction and a cell density
increase even for the lower nanoclays concentration. There are several additional examples
that will be explained in detail in chapter 2.
The present work explores the effect of incorporating nanoclays on the foam structure,
mechanical and thermal properties of rigid polyurethane systems in a different way to
previous literature. Although nanoclays incorporation to rigid polyurethane foams is
considered in previous literature, a more detailed study on aspects such as dispersion quality,
degree of exfoliation, influence of the particles on the cellular structure, physical and chemical
mechanisms influencing the physical properties and properties modelling is missing. The
previous published papers have been tipically focused on a wide range of nanometric particles,
even polyurethane formulations, and this implies a less detailed study of each particular
system. In several cases, density and cellular structure has not been deeply studied, which is a
crucial aspect for this kind of materials. In general terms aspects such as dispersion and
exfoliation of the nanoparticles, properties modelling have not been also considered in detail.
Due to the previous reasons, a particular formulation and a certain kind of functionalized

Chapter 1: Introduction
| 5
nanoclays have been selected for this thesis, with the objective to carry out a detailed study of
this particular system. With all the data obtained from the characterisation and the use of
different theoretical models, the origin of the changes in the final properties are identified,
giving these results the possibility to analyze the influence of the different parameters that
have been modified by the nanoclays addition.
Another event that had a considerable influence on the development of the present
work is the participation of CellMat Laboratory in the European project entitled “NANCORE:
Microcellular nanocomposite for substitution of Balsa wood and PVC core material” belonging
to the Seventh European Framework. The main objective of this project was to design a novel
and cost‐effective microcellular nanocomposite foam, with mechanical properties comparable
to or better than Balsa wood and PVC foam, allowing for a substitution of these materials in
the core of lightweight composite sandwich structures. Nowadays, these two materials are
widely used in energy and transport applications, with the annual EU and US markets for such
sandwich structures estimated to exceed 2 billion Euro. Besides the prospect of a significant
cost decrease, the development of a new core material would help to solve serious market
imperfections and supply problems suffered by European consumers of both PVC foam and
Balsa wood. Specifically, the NanCore project aimed at achieving a cost reduction of at least 30
percent for the finished core material as compared to current core materials, of which Balsa
wood is the cheapest. At the same time, the material developed should display mechanical
properties allowing for application in wind power, as the primary and most demanding of the
industries targeted. The consortium behind this project consisted of a group of leading
industrial end‐users of composite materials in combination with research groups with an
expertise in material science (see table 1.1). During this project CellMat was in charge of
leading Work Package 3 (WP3): “Foaming of nanocomposites”. An important part of the
research activity was focused on improving PU formulations supplied by the industrial partner
Recticel, by incorporating nanoclays. In addition, some of the research (mainly the analysis of
the dispersion of the particles) was carried out in collaboration with the Katholic University of
Leuven (KUL), which was one of the partners in this consortium.

Chapter 1: Introduction
| 6
Participant
name Country Main Activities
LM Glasfiber
A/S
(Coordinator)
Denmark
Requirement specification with regard to process, production and mechanical characteristics; demonstration and full‐scale testing; Consortium Management; integration of microcellular polymer
nanocomposite (MNPC) into a sandwich structure
Aalborg
University Denmark
Multi‐scale modeling and simulations of microcellular nano‐composites; integration of MNPC into a sandwich structure; Selection
of functionalized components of polymer nanocomposites
Recticel
Polyurethanes Belgium Development of polyurethane formulations. Fabrication of
polyurethane foams at industrial scale.
Katholieke
Universiteit
Leuven
Belgium Rheological characterisation of nanocomposites; multi‐scale modeling
and simulations of microcellular nano‐composites; integration of MNPC into a sandwich structure.
Universität
Kassel Germany
Industrial processing of microcellular nano‐composites; mechanical characterisation of foamed sandwich panels
University of
Valladolid Spain Production and characterisation of foams at lab scale; analysis of
foaming mechanism
Azimut‐Benetti
S.P.A. Italy Requirement specification with regard to process; integration of
MNPC into a sandwich structure; demonstration and full‐scale testing.
Centre of Molecular and Macromolecular
Studies
Poland Selection of functionalized components of polymer nanocomposites and elements of foaming processes; production and characterisation
of solids PP nanocomposites for foaming applications
Institute of Occupational Medicine
United
Kingdom Safety Issues of Nanoparticles from nanocomposites
Technical University of Denmark
Denmark Life Cycle Assessment of new core material
EconCore N.V. Belgium Integration of MNPC into a sandwich structure
FOCAL Limited United Kingdom
Requirement specification with regard to proces; integration of MNPC into a sandwich structure; demonstration and full‐scale testing
Sekisui Alveo
AG Switzerland Production of PP foamed nanocomposite at industrial scale
TABLE 1.1. Participants and main activities in FPVII Nancore project.
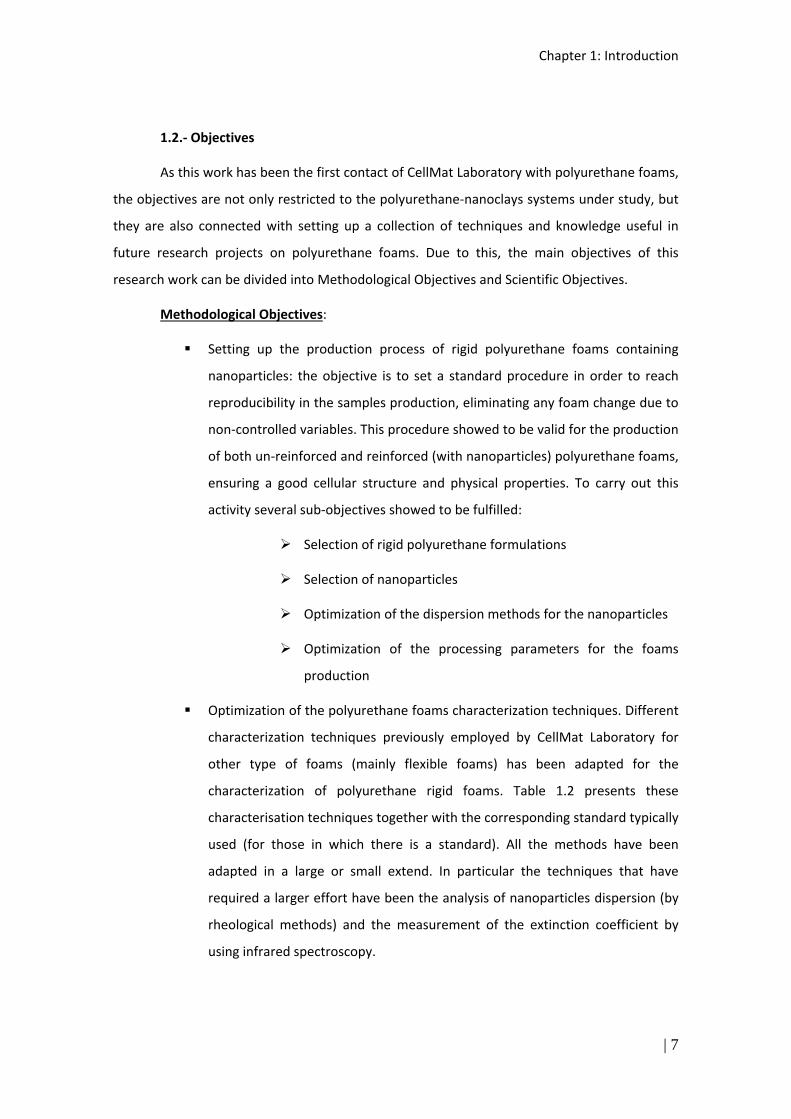
Chapter 1: Introduction
| 7
1.2.‐ Objectives
As this work has been the first contact of CellMat Laboratory with polyurethane foams,
the objectives are not only restricted to the polyurethane‐nanoclays systems under study, but
they are also connected with setting up a collection of techniques and knowledge useful in
future research projects on polyurethane foams. Due to this, the main objectives of this
research work can be divided into Methodological Objectives and Scientific Objectives.
Methodological Objectives:
Setting up the production process of rigid polyurethane foams containing
nanoparticles: the objective is to set a standard procedure in order to reach
reproducibility in the samples production, eliminating any foam change due to
non‐controlled variables. This procedure showed to be valid for the production
of both un‐reinforced and reinforced (with nanoparticles) polyurethane foams,
ensuring a good cellular structure and physical properties. To carry out this
activity several sub‐objectives showed to be fulfilled:
Selection of rigid polyurethane formulations
Selection of nanoparticles
Optimization of the dispersion methods for the nanoparticles
Optimization of the processing parameters for the foams
production
Optimization of the polyurethane foams characterization techniques. Different
characterization techniques previously employed by CellMat Laboratory for
other type of foams (mainly flexible foams) has been adapted for the
characterization of polyurethane rigid foams. Table 1.2 presents these
characterisation techniques together with the corresponding standard typically
used (for those in which there is a standard). All the methods have been
adapted in a large or small extend. In particular the techniques that have
required a larger effort have been the analysis of nanoparticles dispersion (by
rheological methods) and the measurement of the extinction coefficient by
using infrared spectroscopy.

Chapter 1: Introduction
| 8
Characterization technique Experimental facility Method
Density measurement Mettler Toledo AT261 ASTM D1622
Mechanical properties: compression
tests
Instron universal testing machine,
model 5500R6025 ASTM D1621
Mechanical properties: bending test Instron universal testing machine,
model 5500R6025 ISO 178:2010
Mechanical properties: torsion test TA‐instrument, Ares‐melts
rheometer ‐
Dynamic Mechanical Analysis (DMA) Mettler Toledo DMA/SDTA 861e ‐
Thermal Conductivity Holometrix Rapid K Heat Flow
Meter UNE12667
Thermal Conductivity Hot‐disk transient plane source
thermal constant analyser (TPS) ISO 22007‐2:2008
Infrared Spectroscopy (Determination
of the extinction coefficient)
Bruker Tensor 27 FTIR
spectrometer ‐
Scanning Electron Microscopy (SEM) JEOL JSM 820 ‐
Open cell measurement Eijkelcamp 08.06 Langer ASTM D6226
X‐ray tomography
X‐ray tube FXE‐ 160.50 source
from Feinfocus, detection system
PerkinElmer XRD 1620 CN3,
rotary stage from MICOS (UPR‐
160F AIR)
‐
Dispersion analysis ARES‐G2, TA Instruments
SAXS analysis Bruker Discover D8 equipped
with LynxEye detector ‐
TABLE 1.2.‐ Characterization techniques employed

Chapter 1: Introduction
| 9
Scientific Objectives:
Evaluating in detail the effect of the dispersion quality of the clays in the polyol
blend on the structure and properties of polyurethane foams filled with
nanoclays.
Evaluating in detail the effect of clays content on the cellular structure,
thermal and mechanical properties of polyurethane foamed nanocomposites.
Improving the thermal conductivity of polyurethane foams by using nanoclays
as nucleating agents and IR‐blockers.
Modelling the thermal conductivity of the developed foams, using as a basis a
detailed characterisation of the cellular structure and the experimental
determination of the extinction coefficient of the foams.
1.3.‐ Contents
The manuscript has been divided into six different chapters:
1. Introduction: it is the present chapter. The motivation of this research
work together with the objectives, the structure of the thesis, publications
from the thesis and presentations are presented.
2. Background and state of the art: basic concepts on polyurethane foams
and nanoclays and a detailed review of the state of the art of foamed
polyurethane nanocomposites filled with nanoclays are presented.
3. Materials and characterization techniques: the polyurethane formulations
and nanoclays employed, together with the methods to disperse the
particles and produce the foams are described. The characterization
techniques employed are also presented.
4. Influence of the formulation and dispersion technique used: different
dispersion techniques are characterised over different polyurethane
blends, with the objective of selecting the most sensitive formulation to
these different techniques. With the selected formulation polyurethane
foams with different dispersion qualities of the particles have been
produced and characterised in detail. The influence of the dispersion
quality on the structure and properties are discussed.

Chapter 1: Introduction
| 10
5. Influence of nanoclays concentration: The previously selected formulation
was employed for a complete study of the effect of the nanoclays
concentration over the structure and foams properties, including effects
on both mechanical properties and thermal conductivity. In addition the
modelling of the thermal conductivity of PU foams containing clays is
discussed.
6. Conclusions: the final conclusions obtained from this research are
presented, together with the different projects in which the generated
knowledge has been employed. Furthermore, possible future research
topics are proposed.
1.4.‐ Publications and presentations in conferences
During the development of the present work the next presentations in conferences
were produced:
M.A. Rodriguez‐Perez, J. Pinto, J. Escudero, A. Lopez‐Gil, E. Solorzano, C. Saiz‐Arroyo, S. Estravis, S. Pardo‐Alonso, Nano‐strategies applied to the production of cellular polymers with improved cellular
structure and properties. CellMat Conference, Dresden, Germany, 2012. (Talk)
S. Estravis , M.A. Rodriguez‐Perez, Polyurethane foam composites: relationship between mechanical properties and filler matrix chemical interaction, SPE Eurotec Conference, Barcelona, Spain, 2011. (Talk)
S. Pardo, S. Estravís, E. Solórzano, M.A. Rodríguez‐Pérez, J.A. de Saja, Effect of nanoadditves in rigid polyurethane foam nucleation monitored by X‐ray radioscopy, SPE Eurotec Conference, Barcelona,
Spain, 2011. (Talk)
S. Estravis , M.A. Rodriguez‐Perez, Modification of the mechanical properties of polyurethane composites by using wastes of flexible polyurethane and sawdust as additives, FOAMS 2010, Seattle,
EEUU, 2010. (Poster)
P. Álvarez, A. Echeverría, M.M. Petite, M.A. Rodríguez‐Pérez, J. Pinto, S. Estravis, M.A. Martines, J. Abenojar, Fabrication, characterization and modeling of sandwich panels with polyethylene
and polyurethane foams cores and aluminum skins, Comatcomp 09, San Sebastián, Spain, 2009. (Poster)
M.A. Martínez, J. Abenojar, M.A. Rodríguez‐Pérez, J. Pinto, S. Estravis, J. Ecenero, E. Aldanondo, P. Álvarez, Polyolefin and polyurethane foam‐aluminum joins: adhesion tests and modeling, X Congreso
de Adhesión y Adhesivos, Alicante, Spain, 2009. (Poster)
S. Estravis, J.A. de Saja, R. Verdejo, M.M. Bernal, M.A. Rodríguez‐Pérez, Improving the mechanical properties of rigid PU foams using nanofillers, XI Reunión del GEP, Valladolid, Spain, 2009. (Poster)
In addition, the next publications have been published or are close to be published:

Chapter 1: Introduction
| 11
S. Pardo‐Alonso, E. Solórzano, S. Estravis, M.A. Rodriguez‐Perez, J.A. de Saja, In‐situ Evidences of Nanoparticles Nucleating effect in Polyurethane‐Nanoclay Foamed Systems, Soft Matter
(2012) 8, 11262. DOI: 10.1039/C2SM259983D.
M. Bernal, I. Molenberg, S. Estravis, M.A. Rodriguez‐Perez, I. Huynen, M.A. Lopez‐Manchado, R. Verdejo, Comparing the effect of carbon‐based nanofillers on the physical properties of
flexible polyurethane foams, Journal of Material Science (2012) 47 (15) 5673‐5679.
S. Estravís, M. A. Rodríguez‐Pérez , J. Tirado, S. Pardo‐Alonso; Rigid polyurethane foams with infused nanoclays: relationship between cellular structure and thermal conductivity, Journal of
Polymer Science, 2014. (Submitted)
R. Van Hooghten, S. Gyssels, S. Estravis, M.A. Rodriguez‐Perez, P. Moldenaers, Understanding the effect of particle free energy on the structural and mechanical properties of clay‐laden
rigid PU foams, European Polymer Journal, 2014 (Submitted)
S. Estravís, R. Van Hooghten, M. A. Rodríguez‐Pérez, R. Cardinaels, P. Moldenaers and J. Vermant; Effect of dispersion quality on the structure and properties of polyurethane foams
infused with clays. (in preparation)
S. Estravís, R. Van Hooghten, M. A. Rodríguez‐Pérez, R. Cardinaels, P. Moldenaers and J. Vermant; Effect of nanoparticles concentration on the structure and properties of
polyurethane foams infused with nanoclays. (in preparation)
1.5.‐ Applicability of the obtained results in industrial processes
The knowledge generated in the present work has been employed to successfully
conclude the next projects with private partners:
▪ Polyurethane foams for the production of surf boards. Foam Asturblank (2009‐2010)
▪ Use of sepiolite nanoparticles to optimize the structure and properties of PS and PU based
foams. TOLSA S.A. (2012‐2013)
▪ Development of novel polyurethane foams with improved thermal insulation. BSH‐group
(Bosch and Siemens Home appliances Group) (2012‐2013).
Some additional information about these projects is induced in the conclusions of this
PhD thesis.
Chapter 1: Introduction
| 12
1 M.A. Rodríguez‐Pérez, Propiedades Térmicas y Mecánicas de Espumas de Poliolefinas, Thesis, University of Valladolid, (1999)
2 O. Almanza, Caracterización y Modelización de las Propiedades Térmicas y Mecánicas en Espumas de Poliolefinas, Thesis, University of Valladolid, (2000)
3 L.O. Arcos y Rábago, Propiedades Térmicas y Mecánicas de Espumas de Poliolefinas Fabricadas en un Proceso de Moldeo por Compresión, Thesis, University of Valladolid, (2002)
4 J.L. Ruiz‐Herrero, Impacto y Fluencia de Espumas con Base Polietileno, Thesis, University of Valladolid, (2004)
5 J.I. González‐Peña, Efecto de los Tratamientos Térmicos en Bloques de Espuma de Polietileno de Baja Densidad Producidos Mediante Moldeo por Compresión, Thesis, University of Valladolid, (2006)
6 M. Álvarez‐Laínez, Propiedades Térmicas, Mecánicas y Acústicas de Espumas de Poliolefina de Celda Abierta, Thesis, University of Valladolid, (2007)
7 J. A. Reglero Ruiz, Fabricacion y Caracterización de espumas de aluminio: aplicaciones en el sector aeronáutico, Thesis, University of Valladolid, (2007)
8 E. Solórzano, Aluminum foams: Foaming process, cellular structure & properties, Thesis, University of Valladolid, (2008)
9 F. Hidalgo‐González, Diseño Optimizado de los Parámetros de Proceso de Fabricación de Espuma de Poliolefina Reticulada mediante Moldeo por Compresión, Thesis, University of Valladolid, (2008)
10 S. Román‐Lorza, Fabrication and characterization of flame retardant halogen free polyolefin based cellular materials, Thesis, University of Valladolid, (2010)
11 R. Campo‐Arnáiz, Aplicación de Técnicas Espectroscópicas al Estudio de la Morfología Polimérica, Propiedades Térmicas y de Emisión de Espumas de Baja Densidad con Base Poliolefina, Thesis, University of Valladolid, (2011)
12 C. Saiz Arroyo, Fabricación de materiales celulares mejorados basados en poliolefinas. Relación procesado‐composición‐estructura‐propiedades, Thesis, University of Valladolid, (2012)
13 J. Lobos Martín, Improving the stiffness and strength of porous materials by enhancement of the matrix microstructure and cellular morphology, Thesis, University of Valladolid, (2013)
14 http://polyurethane.americanchemistry.com/
15 Polyurethane (PU) Foams Market by Types (Rigid & Flexible), End‐User Industries (Bedding & Furniture, Building & Construction, Electronics, Automotives, Footwear, Packaging, & Others), & Geography (North America, West Europe, Asia‐Pacific & Row) ‐ Global Trends & Forecasts to 2018, http://www.marketsandmarkets.com/Market‐Reports/polyurethane‐foams‐market‐1251.html
16 L. J. Lee, C. Zeng, X. Cao, X. Han, J. Shen, G. Xu, Polymer nanocomposite foams, Composites Science and Technology, 65(15–16), 2344‐2363, (2005)

Chapter 1: Introduction
| 13
17 S. Pavlidou, C.D. Papaspyrides, A review on polymer–layered silicate nanocomposites, Progress in Polymer Science, 33, 1119–1198, (2008)
18 R. Verdejo, C. Saiz‐Arroyo, J. Carretero‐Gonzalez, F. Barroso‐Bujans, M.A. Rodriguez‐Perez, M.A. Lopez‐Manchado, Physical properties of silicone foams filled with carbon nanotubes and functionalized graphene sheets, European Polymer Journal, 44, 2790–2797 (2008)
19 J.I. Velasco, M. Ardanuy, V. Realinho, M.Antunes, A.I. Fernández, J.I. González‐Peña, M.A. Rodríguez‐Pérez, J.A. de Saja, Polypropylene/clay nanocomposites: combined effects of clay treatment and compatibilizer polymers on the structure and properties, Journal of Applied Polymer Science, 102, 1213‐1223 (2006)
20 J. Weiss, P. Takhistov, D.J. McClements, Functional materials in food nanotechnology, Journal of Food Science, 71(9), R107‐R116, (2006)
21 Q. H. Zeng, A. B. Yu, G. Q. Lu, D. R. Paul, Clay‐based polymer nanocomposites: research and commercial development, Journal of nanoscience and nanotechnology, 5(10), 1574‐1592, (2005)
22 M. Modesti, A. Lorenzetti, S. Besco, D. Hrelja, S. Semenzato, R. Bertani, R.A. Michelin, Synergism between flame retardant and modified layered silicate on thermal stability and fire behaviour of polyurethane nanocomposite foams, Polymer Degradation and Stability, 93, 2166–2171, (2008)
23 H. A.Patel, R. S. Somani, H. C. Bajaj, R. V. Jasra, Nanoclays for polymer nanocomposites, paints, inks, greases and cosmetics formulations, drug delivery vehicle and waste water treatment, Bulletin of Materials Science, 29(2), 133‐145, (2006)
24 D. Shah, P. Maiti, D. D. Jiang, C. A. Batt, E. P. Giannelis, Effect of nanoparticle mobility on toughness of polymer nanocomposites, Advanced Materials, 17(5), 525‐528, (2005)
25 T. Kashiwagi, F. Du, J. F. Douglas, K. I. Winey, R. H. Harris, J. R. Shields, Nanoparticle networks reduce the flammability of polymer nanocomposites, Nature Materials, 4(12), 928‐933, (2005)
26 X. Cao, L. J. Lee, T. Widya and C. Macosko, Polyurethane/clay nanocomposites foams: processing, structure and properties, Polymer, 46, 775‐783, (2005)
27 T. Widya, C. W. Macosko, Nanoclay‐modified rigid polyurethane foam, J. of Macrom. Sci., Part B: Phys., 44(6), 897‐908, (2005)


CHAPTER 2:
BACKGROUND AND STATE OF THE ART


| 17
BACKGROUND AND STATE OF THE ART
2.1. Cellular materials
2.1.1. Description, advantages and types
A polymeric cellular material is a two‐phase structure. One of them (gas phase) has been
produced by a physical or chemical blowing agent and has been dispersed throughout the solid
phase (polymeric matrix)1 which is the second phase. Although a foamed material is a kind of
cellular material in which the cellular structure was created in the liquid state, in the
development of this work both expressions, cellular polymer and foam will be used to refer to
polymeric cellular materials.
The simplest cellular material that can be considered is a bi‐dimensional network formed
by polygons, with a structure that allows filling a plane. Fig. 2.1 shows an example, a
honeycomb panel.
FIGURE 2.1 Honeycomb panel
However, usually cellular materials are composed by cells, with polyhedral shape, that
fill the three dimensional space (Fig. 2.2).
(a) (b)
FIGURE 2.2. Three dimensional cellular structures: (a) Open cell structure, (b) closed cell structure
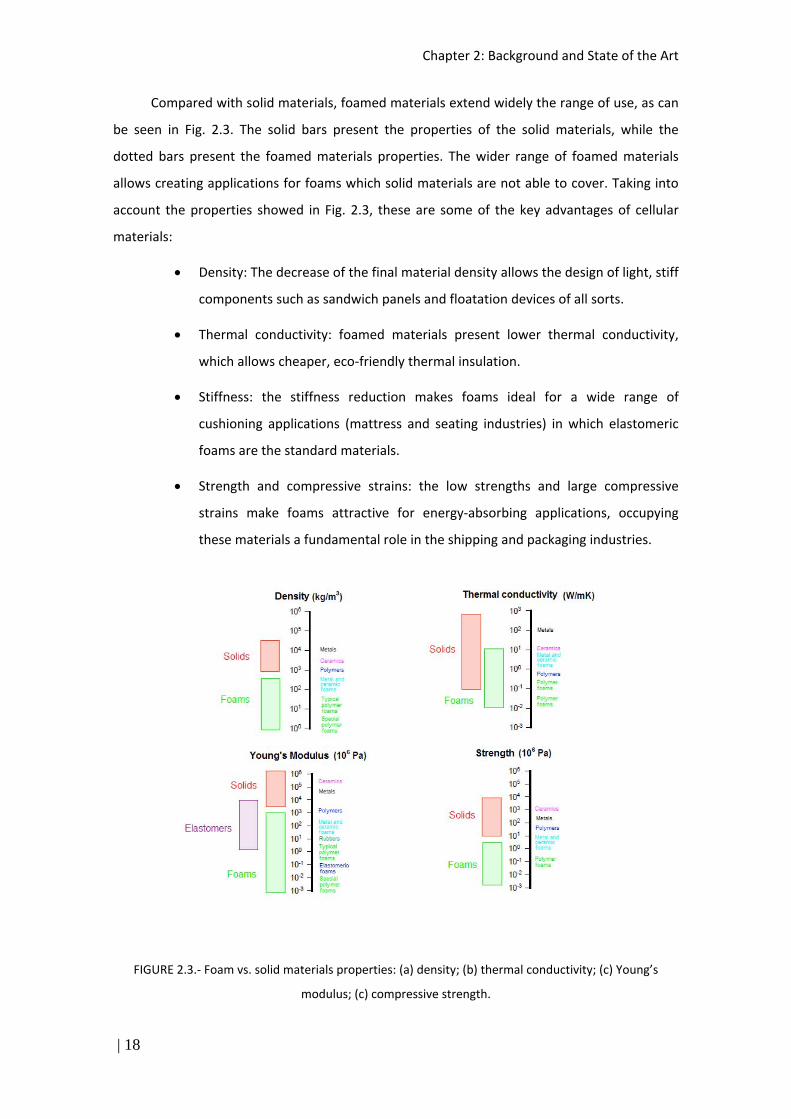
Chapter 2: Background and State of the Art
| 18
Compared with solid materials, foamed materials extend widely the range of use, as can
be seen in Fig. 2.3. The solid bars present the properties of the solid materials, while the
dotted bars present the foamed materials properties. The wider range of foamed materials
allows creating applications for foams which solid materials are not able to cover. Taking into
account the properties showed in Fig. 2.3, these are some of the key advantages of cellular
materials:
Density: The decrease of the final material density allows the design of light, stiff
components such as sandwich panels and floatation devices of all sorts.
Thermal conductivity: foamed materials present lower thermal conductivity,
which allows cheaper, eco‐friendly thermal insulation.
Stiffness: the stiffness reduction makes foams ideal for a wide range of
cushioning applications (mattress and seating industries) in which elastomeric
foams are the standard materials.
Strength and compressive strains: the low strengths and large compressive
strains make foams attractive for energy‐absorbing applications, occupying
these materials a fundamental role in the shipping and packaging industries.
FIGURE 2.3.‐ Foam vs. solid materials properties: (a) density; (b) thermal conductivity; (c) Young’s
modulus; (c) compressive strength.

Chapter 2: Background and State of the Art
| 19
Cellular materials can be classified using different criteria. A first classification can be
made referring to the cellular structure and the connectivity of the cells: the structure can be
open or closed, i.e. the gas volume forms a continuous phase (open cell structure, Fig.
2.1.1.2.a) or a discontinuous phase (closed cell structure, Fig. 2.1.1.2.b). Normally, it is easy to
find materials with an intermediate structure: fraction of the volume is formed by an open cell
structure while other fraction of the volume is formed by a closed cell structure1.
Other classification of cellular materials can be made attending to their density, which
highly determines the final properties, and consequently the final applications1, 2. In foamed
materials it is usual to employ the parameter “relative density” ( relative , Eq. 1), which is the
relationship between the foam density ( foam ) and the solid material density ( solid )1.
solid
foamrelative
(2.1)
According to their relative density, cellular solids can be classified in three different
groups¡Error! Marcador no definido.:
Low density cellular materials: relative density lower than 0.3.
Medium density cellular materials: relative density between 0.3 and 0.6.
High density cellular materials: relative density higher than 0.6.
The density of rigid polyurethane foams ranges between 10 and 1100 kg/m3, but the
most common densities both in industry and research ranges from 28 to 50 kg/m3 3, i.e.
relative density between 0.025 and 0.045. According to the previous classification these can be
considered low density cellular materials.
2.1.2. Cellular structure
The characteristics of the cellular structure play a key role on the final properties. Due
to this we briefly explain these characteristics in the following paragraphs:
Mean cell size: it is referred to the mean cell size of the cells that forms the
cellular material. The most common method for measuring this property is
presented in ASTM D3576 standard, based on the Intersections Method4.
In this work, an specific script developed on CellMat Laboratory has been
employed, based on Open Source Software ImageJ5. With this software, it
was possible to measure, together with the cell size, some cellular

Chapter 2: Background and State of the Art
| 20
parameter as the cellular density (i.e. number of cell per volume unit) or
the anisotropy ratio.
Influence of the cell size over thermal properties is a well‐known effect:
the reduction of the cell size implies a reduction of the thermal
conductivity for closed cell foams, due to a reduction of the radiation term
implied in the thermal conductivity. This effect is observed for relative
densities lower than 0.15.
Mechanical properties for low strains do not present a clear relationship
with cell size: studies for similar densities and different cell sizes have not
shown dependence between cell size and mechanical properties6‐8 at low
strains (i.e. stiffness and strength)
Cell size distribution: Although cell size has not a clear influence over the
mechanical properties at low strains, cell size distribution effect over these
properties is well‐known: a non‐uniform cell size distribution has a
negative influence over the final properties of the material2, 9‐11. Tipically, a
material with an inhomogeneous cell size distribution presents lower
mechanical properties than a material with a homogeneous cell size
distribution, due to a poor strain distribution in the entire volume1.
0,5%
Cell size (m)
100 150 200 250 300 350 400 450 500 550 600 650 700 750 >750
Rela
tive F
reque
cies
0,00
0,05
0,10
0,15
0,20
0,25
0,30
0,35
HistoGauss
FIGURE 2.4.‐ SEM image and histogram
For the study of a certain sample the use of a cell size histogram (Fig. 2.4)
could help to show what kind of cell size distribution is present in the
material. But for the comparison between large amounts of samples it is
easier to employ the standard deviation of the cell size distribution,
defined in Eq. 2.2, which gives the width of the distribution12, 13.

Chapter 2: Background and State of the Art
| 21
n
i
i
nSD
1
2 (2.2)
In this equation, n is the total number of cells, i is the cell diameter of cell
i and is the average cell size. A cell size distribution is more
homogeneous when the SD value decreases.
Open cell content: Fig. 2.2 shows two extremes related with the cellular
morphology of cellular materials: completely open cell and completely
closed cell. But other intermediate states are possible. The open cell
content can be defined as9:
volumegasTotal
volumecellstedInterconecOC (%) (2.3)
It can be determined with an air or gas pycnometer following the standard
ASTM D622614.
FIGURE 2.5.‐ Micrograph showing interconnection of cells for rigid PU foam
Open cell presence in cellular materials is positive for certain applications:
sound waves absorption, seating industry or filters. However, from the
mechanical and thermal insulation point of view, a certain grade of cellular
interconnection can suppose a drawback. Figure 2.5 shows the
interconnection of cells that is produced in rigid polyurethane foams.
Anisotropy: Some cellular materials present anisotropy, both in orientation
of the cellular structure (Fig 2.6) and in their properties11.

Chapter 2: Background and State of the Art
| 22
FIGURE 2.6. Micrographs of isotropic (left) and anisotropic (right) pores.
In those materials with a principal growing direction, it is possible to define
the Anisotropy Ratio (R, Eq. 2.4) as the quotient between the average
diameter of the cell in the growing direction and the diameter in the
perpendicular direction1.
2yx
zR
(2.4)
The orientation in the cellular structure usually implies an orientation in
the properties of the foams1, 11. This effect presents benefits in some
structural applications, with better properties in the preference
orientation direction with respect to the isotropic material. But for thermal
insulating it has a negative effect: the material presents higher thermal
conductivity in the direction of cellular orientation15.
Fraction of material in the struts (fs): the solid phase in cellular materials is
distributed between the components of cells: these are basically walls,
struts (also called plateau borders) and vertexes (or triple points). On
Figure 2.7 it is possible to observe an idealization of a 3D single cell, in
which vertexes can be considered as an extension of struts since they are
actually the junctions of these microstructures both components. Hence,
solid phase can be considered a combination of walls and struts. It is well
known that presence/absence of walls (closed/open cell) is a determinant
factor for the physical behavior of the materials regarding mechanical,
thermal, electrical or acoustic properties 1.
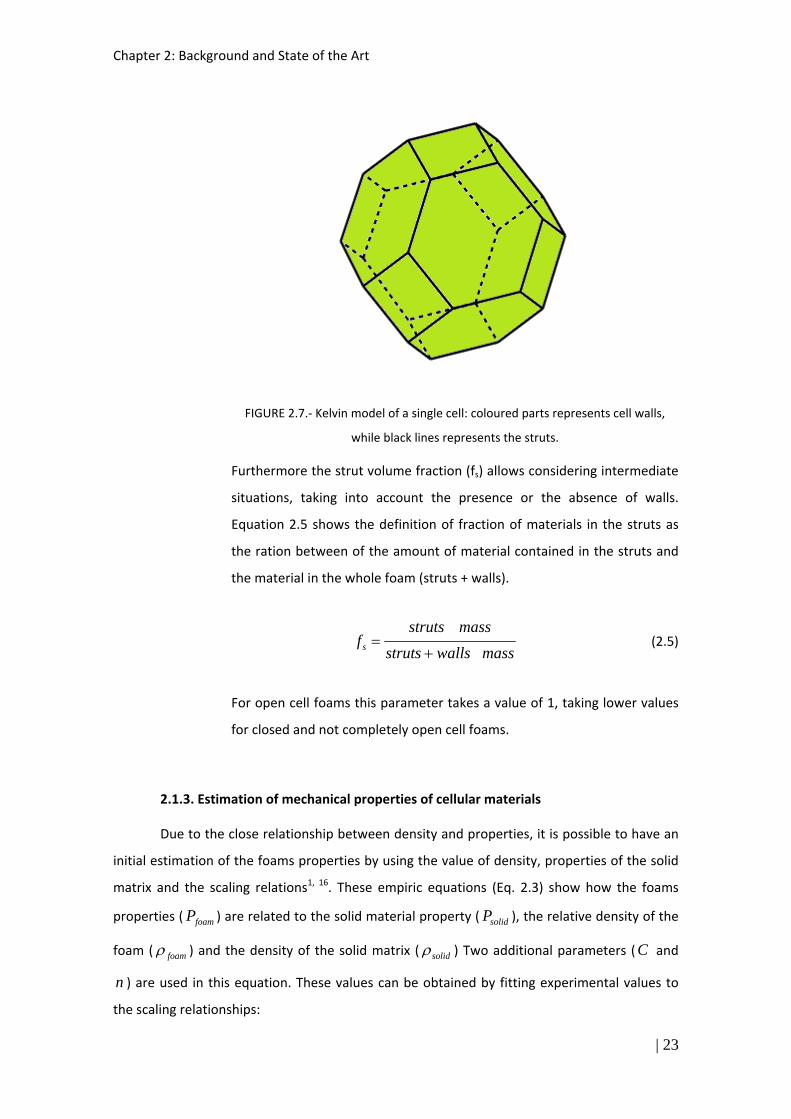
Chapter 2: Background and State of the Art
| 23
FIGURE 2.7.‐ Kelvin model of a single cell: coloured parts represents cell walls,
while black lines represents the struts.
Furthermore the strut volume fraction (fs) allows considering intermediate
situations, taking into account the presence or the absence of walls.
Equation 2.5 shows the definition of fraction of materials in the struts as
the ration between of the amount of material contained in the struts and
the material in the whole foam (struts + walls).
masswallsstruts
massstrutsfs (2.5)
For open cell foams this parameter takes a value of 1, taking lower values
for closed and not completely open cell foams.
2.1.3. Estimation of mechanical properties of cellular materials
Due to the close relationship between density and properties, it is possible to have an
initial estimation of the foams properties by using the value of density, properties of the solid
matrix and the scaling relations1, 16. These empiric equations (Eq. 2.3) show how the foams
properties ( foamP ) are related to the solid material property ( solidP ), the relative density of the
foam ( foam ) and the density of the solid matrix ( solid ) Two additional parameters (C and
n ) are used in this equation. These values can be obtained by fitting experimental values to
the scaling relationships:

Chapter 2: Background and State of the Art
| 24
n
solid
foamsolidfoam PCP
(2.6)
The C value is generally close to 1, (for high densities). The n value typically ranges
between 1 and 2, and it is close related with the property under study and the key
characteristics of the cellular structure1, 16.
Relative properties for cellular materials are defined as the ratio between that of the
foamed material and the same property for the solid material (eq. 2.7). Fig. 2.8 shows the
relative properties‐relative density relationship. It is possible to observe a linear relationship
between density and material properties when n=1, however, as n value increases, the value
of the property is reduced for a given density.
solid
foamrel P
PP (2.7)
FIGURE 2.8.‐ Relative properties vs. relative density for cellular materials
The vast majority of cellular materials present, for their main properties, an n‐value
higher than 1, which implies a non‐lineal relationship between relative properties and density.
For structural applications (in which typically it is necessary to improve stiffness and strength),
where the lowest properties reduction is desired, an n‐value closer to 1 is needed. Analysing
the elastic modulus and the collapse strength, some studies show that for isotropic foams

Chapter 2: Background and State of the Art
| 25
lower n‐values are obtained for closed cell structures with good cellular size homogeneity (low
values of SD, Eq 2.2; i.e. very homogenous cell size distributions)17. For other properties as the
impact strength, toughness or fatigue behaviour, it has been also proved that lower n‐values
are obtained for microcellular structures (cell sizes lower than 10 µm)10, 11, 18
2.1.4. Thermal conductivity of cellular materials
Among the thermal properties of cellular materials, thermal conductivity plays a
fundamental role in the foams world, as thermal insulation is one of the main commercial
applications of cellular materials.
The presence of two different phases on cellular materials makes impossible the
measurement of the thermal properties at microscopic scale, forcing to understand the
properties as a global, macroscopic property. Anyway, a theoretical approximation is possible:
individual properties of each phase (solid and gas) can be employed for the estimation of the
macroscopic conductivity. This is one of the most interesting problems and one of the most
studied topics in the polymeric foams field15, 19‐21.
Four mechanisms are involved in the thermal conductivity of cellular materials:
conduction along the cell walls and the struts of the solid polymer (λs), conduction through the
gas phase(λg), thermal radiation (λr), and convection within the cells (λc). The total heat flow
(λt) is a result of the four contributions and can be expressed by a superposition of each
mechanism taken separately 15, 19, 22‐25.
crgst (2.8)
The convective heat transfer can be assumed to be negligible15, 26 in the case of very
small cell size (lower than 1‐2 mm). The expression of gas and solid phase terms is shown in
equations 5 and 6, where Vg is the volume fraction of the gas phase (solidfoam 1 ), λg is the
thermal conductivity of the gas enclosed in the cells at a given temperature, Vs is the volume
fraction of polymer solidfoam , λs is the thermal conductivity of the solid polymer and fs is
the mass fraction in the struts of the cellular structure27.
ggg V (2.9)
ssss V
f )33
2( (2.10)

Chapter 2: Background and State of the Art
| 26
To calculate the radiation term, a simple approach is to estimate conductive terms of
the gas and the solid using Eq. 2.9 and 2.10, and subtract them from the experimental value of
the conductivity to obtain an “experimental” value of the thermal radiation term26. Anyhow a
theoretical approximation is also possible. In practical applications, radiation travels only a
short distance (mean free path) before being scattered or absorbed. The transferred energy
depends only on the intermediate vicinity of the position being considered. This approximation
is called diffusion approximation (in this process, the heat flux is proportional to the local
gradient of the potential, in this case the black body emissive power σT4), and the radiative
heat flux qr(x) can be expressed as follows28:
x
T
x
T
K
T
x
e
Kxq r
Re
b
Rer
,
3
, 3
16
3
4)( (2.11)
where λr is the radiative thermal conductivity. Foams used in real applications are usually thick
enough (several millimetres thick) to be considered optically thick; therefore, the radiative flux
can be approximated by Rosseland equation29 as follows:
Rer K
Tn
,
32
3
16 (2.12)
In this equation n is the effective refraction index and Ke,R is the Rosseland mean
extinction coefficient. For polymer foams, n is close to one30; this approximation will be valid in
this study because the foams under analysis have a volume of gas (porosity) higher than 95%.
The determination of the extinction coefficient using the Beer‐Lambert law is explained in
section 3.2.6.
2.2. Water Blown Rigid Polyurethane Foams
2.2.1. Chemistry of polyurethane
The origin of polyurethane foams can be situated in Leverkusesn, were Otto Bayer and
coworkers produced in 1937 the first polyurethane foam. The first commercial product was
introduced in 1950. Nowadays polyurethane foams are one of the most important materials in
the polymeric industry, with multiple uses in several industries as automotive, sports
equipment, furniture, construction, and much more. But the “word” polyurethane described a
significant amount of different materials, including rigid or flexible foams, elastomers,
adhesives, etc. Usually, the term polyurethane is used to refer the polyaddition of a

Chapter 2: Background and State of the Art
| 27
polyisocianate with a polyol to form a heterogeneous copolymer. As a result of this reaction,
urethane linkages between the polymeric chains are produced (Fig. 2.9).
FIGURE 2.9.‐ Urethane bond formation
The type of polyol and isocyanate and their ratio, the presence of catalysts, surfactants
and so on, and the reaction conditions have a strong influence on the properties of the
resulting polyurethane. Long, flexible segments presents in the polyol have as a result the
production of an elastic polymer (Fig. 2.10.a), characterized by phase separation between
amorphous urea rigid segments and flexible polyol segments31. On the other hand, rigid foams
are the result of a high degree of cross linking between short polymeric chains (Fig. 2.10.b).
a.‐

Chapter 2: Background and State of the Art
| 28
b.‐
FIGURE 2.10. Schematic drawing of polyurethane structure in a: a.) Flexible polyurethane foam, b.) Rigid
Polyurethane foam 31
Two main reactions can be considered in water‐blown rigid polyurethane foams,
polymerization reaction and water blowing reaction. Polymerization reaction, also sometimes
called gelation reaction, has been previously described (Fig. 2.5); this reaction produces the
urethane linkages that characterize the polyurethane. The heat of this reaction is reported to
be approximately 101 KJ/mol of urethane formed32. This reaction is usually characterized by
the OH/NCO molar ratio, which shows the excess or default of one of the reagents. The
desired OH/NCO molar ratio satisfies the equation33:
isocyanatepolyolPU
polyolpolyolratio EWWW
EWWM
)( (2.13)
where polyolW is the weight of the polyol, polyolEW is the equivalent weight of polyol, PUW is
the total weight of PU to be produced and isocyanateEW is the equivalent weight of the
isocyanate. The equivalent weight of the isocyanate is usually provided by the supplier. The
equivalent weight of polyol (in grams per mole of hydroxyl groups) can be determined using
the equation:
NumberOHNumberOH
KOHofweightmolecularEWpolyol
561101000
(2.14)
OH number is an index that allows polyols classification by their molecular weight, and which is
described in the polyurethane components section.

Chapter 2: Background and State of the Art
| 29
FIGURE 2.11.‐ 3 step water‐isocyanate reaction
Water blowing reaction is described in Fig. 2.11, where three different steps can be
observed34. In the first step, water and isocyanate react to produce carbamic acid. That is an
instable sub‐product that decomposes, in a second step, into an amine (R‐NH2) and CO2, which
acts as blowing agent. Finally, in a third step, amine reacts with another isocyanate group to
produce urea, which is a stable product. This reaction is exothermic, with a value of 86
KJ/mol35.
Although these reactions are the most characteristic of rigid, water blown
polyurethane foams, other reactions are produced, like the isocyanurate reaction36 or biuret
formation. As consequence of the disubstituted urea formation, biuret formation could be
produced as it is shown on Fig. 2.12.
FIGURE 2.12.‐ Biuret formation

Chapter 2: Background and State of the Art
| 30
FIGURE 2.13.‐ Isocyanurate reaction
In the case of isocyanurate, three isocyanate molecules produce an isocyanurate ring
(Fig. 2.13), which results in so‐called isocyanurate foams with greater thermal stability,
improved fire resistance and greater dimensional stability than simple polyurethane foams37,
38. Anyway, this kind of foams requires higher amounts of isocyanate, resulting in a more
expensive product. Also, temperature increase due to isocyanurate heat reaction can produce
fire hazard.
2.2.2. Polyurethane components
As previously discussed, polyurethane foams are the product of the polyol‐isocyanate
reaction. But there are other fundamental components that play a role in the production of
polyurethane foams. The main components involved in the polyurethane production are
described in the next paragraphs:
Polyols: polyols are polymers on their own and have on average two or more
hydroxyl groups per molecule. Most common polyols are a polyether and
polyester mix. In the case of rigid polyurethane foams the polyols used have
weights in of hundreds g/mol, while those used to make flexible polyurethane
have molecular weights up to ten thousand and more g/mol. Polyols can be
classified by functionality and molecular weight, which determines the rigid or
flexible behaviour of the final foam. KOH index or hydroxyl index is a well‐
known index that allows polyols classification by their molecular weight, as the
KOH index is inversely proportional to the molecular weight31. It is defined as
KOH mg needed to neutralize a polyol gram (ASTM D1957‐86). The KOH index
for a polyol with a molecular weight between 2000 and 10000 g/mol is
between 18 and 56, and will produce polyurethane flexible foams. On the

Chapter 2: Background and State of the Art
| 31
other hand, for a molecular weight between 250 and 700 g/mol the KOH index
will be between 300 and 700 KOH mg /g, and rigid foams will be produced.
Isocyanates are very reactive compounds, and different kinds are employed in
the polyurethane manufacture. Some of them are diphenilmethane
diisocyanate (MDI), toluene diisocyanate (TDI), hexamethylene diisocyanate
(HDI) or isophorone diisocianate (IPDI). Most of them present exactly two
isocyanate groups per molecule, but nowadays the employ of polymeric MDI
isocyanate (PMDI) is widespread, which presents a mixture of molecules with
more than two isocyanate groups. In polyurethane foams formulation, a
critical parameter is the isocyanate index (Eq. 2.15), which is the percentage of
isocyanate used regarding to the theoretical amount required (that can be
calculated with the Eq. 13).
neededisocyanateofamountTheorical
employedisocyanateofAmountindexNCO 100 (2.15)
This value is fundamental, as it variations produce changes in the final
chemical polyurethane composition, and, as consequence in the final material
properties36, 39. High values of NCO index will produce materials with higher
amounts of isocyanurate36, while low NCO values are employed in flexible
foams preparation40.
Additives: additives are usually included in polyol component, due to its lower
reactivity. Main additives employed are catalysts (for polymerization and/or
blowing reaction), other additives (like particles and nanoparticles, with the
aim to vary some properties) and surfactants (in order to control final cell size
and/or final density). One of the most employed surfactants are silicone
compounds, which can lower surface tension, emulsify incompatible
formulation ingredients, promote generation of bubbles during mixing, and
stabilize cell walls32. Among these functions, cell walls stabilization is the most
important. During foaming, the bubbles initially introduced by mechanical
mixing will grow. As the volume fraction of the gas bubbles exceeds 74%, the
spherical bubbles will distort into multisided polyhedrals and cell walls with
Gibbs Plateau Borders are formed. Due to capillary pressure, pressure inside
the plateau borders is lower than that in the cell walls. This pressure difference
will cause liquid in the cell walls to drain into the struts. Without adding
Chapter 2: Background and State of the Art
| 32
silicone surfactant, this drainage rate is very fast so that film ruptures and
bubble coalescences occur rapidly.
Chemical Blowing agents: The gas production in this kind of materials is
tipically due to a chemical reaction between the foaming agent and one of the
polyurethane reactives, usually isocyanate (Fig. 2.7). The most common
chemical blowing agent is water41, which as it has been previously explained,
reacts with isocyanate producing, over several consecutive reactions, CO2 and
urea [Fig. 2.7]. The employ of water as blowing agent has experience a
considerable growth in the last few years due to its ecological behaviour with
ozone, in comparison with older ozone‐depleting blowing agents42. But, it has
some drawbacks, as the high temperatures produced and the need of
increasing the amount of isocyanate employed43. These are critical points in
low densities, especially under 50 kg/m3 densities when insulating properties
are sought. Moreover, although the thermal conductivity of CO2 is lower than
the thermal conductivity of air, it diffusivity through the polymer matrix is
higher, which implies a significant and rapid increase of thermal conductivity
with time44 due to its substitution by atmospheric air with higher thermal
conductivity. For these reasons, physical blowing agents are sometimes used
together with water to produce polyurethane foams.
Physical blowing agents are usually materials with low temperature boiling
point, near to room temperature. The exothermic isocyanate‐polyol reaction
produces the vaporization of these materials. Some of them are 1,1,1,3,3‐
pentafluorobutane17, 41, 1,1,1,2,3,3,3‐heptafluoropropane17 ¡Error! Marcador
no definido., cyclopentane39, 45, 46, isopentante39, 46, HCFH 141b47. The 1987
Montreal Protocol set defined deadlines for certain compounds that were
determined to have high ozone depleting potential (ODP). Chloro‐
fluorocarbons (CFC)‐based formulations, in the early 1990s, were converted to
hydrochlorofluorocarbons (HCFC) with significantly lower ODP. HCFC blowing
agents were also phased out by the Montreal protocol, requiring that all
manufacturing be converted from HCFC’s no later than January 1st, 2010.
Accordingly, Dow Chemical has fully converted all its production of
STYROFOAM™ insulation board products (polystyrene foams) from HCFC‐142b
to hydrofluorocarbons (HFC) or hydrocarbons (HC) and CO2 in 200948.

Chapter 2: Background and State of the Art
| 33
TABLE 2.1. Physical and environmental properties of different blowing agents.
Table 2.149 shows some of the properties of the HFCs, which usability is also
uncertain due to environmental issues. This table includes environmental
values: Ozone Depletion Potential (ODP) and Global‐warming potential (GWP).
ODP can be estimated by the compound chemical structure, and GWP is a
relative measure of how much heat a greenhouse gas traps in the
atmosphere50. The U.S. market still uses high GWP blowing foaming agents,
while the most of the rest of the world uses pentane isomers as foam blowing
agents51 for polyurethane. Therefore, the use of HFC blowing agents for rigid
polyurethane in the U.S. should be replaced with lower GWP alternatives. In
fact, General Electric has recently started using cyclopentane for production of
its top refrigerator‐freezers52. Other options include R744 and HFO‐1234ze53,
HBA‐254 and a liquid blowing agent AFA‐L155. Hydrofluoroolefins (HFO’s) are
the latest generation of blowing agents; they have zero ODP but rather high
GWP. Main characteristics are shown in Table 2.256.
TABLE 2.2. Key HFO blowing agent properties

Chapter 2: Background and State of the Art
| 34
TABLE 2.3. Blowing agents for PU foams. Products with high ODP and suggested
substitutes.
Substitute (and blends including that
substitute)
Ozone‐depleting Substance (ODS) Being
Replaced
HCFC‐123 CFC‐11
HFC‐134a CFC‐11, HCFCs
HFC‐152a CFC‐11, HCFCs
HFC‐245fa CFC‐11, HCFCs
HCFC‐141b/HCFC‐123 Blends CFC‐11
Formic Acid CFC‐11, HCFCs
Saturated Light Hydrocarbons (C3‐C6)
CFC‐11; HCFC‐141b, HCFC‐142b, HCFC‐22
(not listed as a substitute in spray foam
applications)
Electroset Technology
CFC‐11; HCFC‐22, HCFC‐142b, and blends
thereof
Carbon Dioxide CFC‐11, HCFCs
Water HCFCs
Exxsol Blowing Agents HCFCs
Methyl Formate CFC‐11, HCFCs
Ecomate CFCs, HCFCs
HFO‐1234ze CFCs, HCFCs
HFC‐365mfc
HCFC‐141b; HCFC‐22, HFC‐142b, and
blends thereof (not listed as a substitute
in spray foam applications)
Blends of HFC‐365mfc and HFC‐245fa,
containing at least 5% HFC‐245fa
HCFC‐141b; HCFC‐22, HFC‐142b, and
blends thereof
Formacel® TI HCFC‐22, HCFC‐142b
Transcend™ Technologies as an additive
to SNAP‐approved blowing agents in
blends making up to 5% by weight of the
total foam formulation
CFCs, HCFCs
Trans‐1‐chloro‐3,3,3‐trifluoroprop‐1‐ene CFC‐11, HCFC‐141b
Formacel® Z‐6
HCFC‐22, HCFC‐142b, and blends thereof
(not listed as a substitute in spray foam
applications)

Chapter 2: Background and State of the Art
| 35
Recently, another non‐flammable expansion agent FEA‐110057 has been
proposed that has the added advantages of having low vapour thermal
conductivity and low global warming potential. According to U.S.
Environmental Protection Agency, Table 2.358 shows blowing agents
substitutes in rigid polyurethane: spray, commercial refrigeration, and
Sandwich Panels. Substitutes are reviewed on the basis of ozone depletion
potential, global warming potential, toxicity, flammability, and exposure
potential. Lists of acceptable and unacceptable substitutes are updated several
times each year, with the last update dating from August 2013.
2.2.3. Cell structure of PU foams
As it was previously discussed in the cellular materials section (Section 2.1), two types
of cellular structures can be observed for cellular materials (and also for polyurethane
materials) depending on the chemical composition of the polymer matrix and the foam
evolution: closed or open cell. Usually both types of cellular structures coexist, and the
nominal type of foam is the predominant one. The majority presence of one type or another of
cellular structure highly determines the final foam properties. In the case of PU based
materials, flexible polyurethane foams presents open cell structure, while rigid polyurethane
foams present closed cell structure. As a result, flexible foams have better ability to absorb and
damp sound, higher absorptive capacity for water and moisture and higher permeability to gas
and vapour. Meanwhile, rigid foams present lower thermal conductivities and high mechanical
properties2.
2.2.4. Foaming process
Foaming process is a fundamental stage that must be analysed, as foams final
properties are closely related with their cellular structure. For water blown rigid polyurethane
foams, foaming process can be described in terms of the following five characteristics stages
(Fig. 2.14), obtained from in situ analysis59:
Cream stage: In this point, when the CO2 generated as consequence of water
and isocyanate reaction reaches the solubility limit, nucleation occurs: this is
defined as the cream time. As the nucleation extends over a certain period of
time, bubbles will not have all the same size, and a distribution of cell sizes will
be produced60.

Chapter 2: Background and State of the Art
| 36
Rise stage: Foaming starts when CO2 from liquid phase (zones with higher
pressure) diffuses to previously created nuclei (zones with lower pressure). In
this stage the foam is still liquid, and presents a metastable state that evolves
dynamically due to several processes: macroscopic expansion, foam drainage
(liquid flows through the interstitial volume between bubbles, i.e. from the cell
walls to the struts), foam coarsening (due to gas exchange between bubbles)
and coalescence of cells.
Packing stage: generated CO2 rises the foam until a maximum height. The final
bubble structure is formed. Urethane and urea formation continues,
increasing the viscosity of the liquid phase until equilibrium with expansion
forces is reached.
Gelation stage: on this stage the foam reaches its final structure. Rigidity of the
fluid is enough to consider bubbles as cells. Final size of the bubbles is
reached, and no more drainage, coarsening, coalescence or expansion is
produced. The cellular structure is stabilized.
Solidification stage: this stage is reached when all the polymeric mass has
gelled. Final structure is obtained. Crosslinking finishes and foam starts a
curing period where cells become fully solidified.
FIGURE 2.14: Visualization scheme of the different stages during foams expansion together with typical
macroscopic expansion curve.

Chapter 2: Background and State of the Art
| 37
2.2.5.‐ Properties and applications
Polyurethane foams have been employed in a wide range of applications since their
invention. Nowadays these foams are a fundamental part of our lives, playing an important
role in many industries as insulation, automotive, sports, naval, furniture and much more61.
Wirpsza has situated polyurethane in the fifth position in the rank of production volume of
plastics62.
Rigid polyurethane foams present two main properties that determine their
applications: on one hand their good mechanical properties, even for low densities; on the
other hand their good insulating properties.
Due to their three dimensional cross linking that implies the presence of a three‐
dimensional network63 with considerable mechanical properties, polyurethane rigid foams
present a wide range of application in structural functions. This is also related with the high
stiffness and strength to weight ratio, which allows reducing final weight without a great
impact in the final mechanical properties. On this respect, the density of polyurethane rigid
foams can be easily tuned, allowing to have a wider range of applications. Thereby, final
density can be easily modified between 30 and 700 kg/m3 31.
Of all insulating materials, such as powders, fibrous boards, multilayer systems, and
vacuum panels, polymeric foams have the main advantages of being low‐cost and, in general
terms, easy to produce and maintain64. Because of these advantages, polymeric foams are the
most widely used insulators in engineering applications. Concretely, polyurethane foams are
the most popular foam insulators due to their low thermal conductivity, high strength‐to‐
weight ratio, good mechanical strength and low cost24, 25, 65, 66.
As it has been mentioned, these properties determine significantly the final application
of rigid polyurethane foams. For this reason, their applications are associated with their low
thermal conductivity in construction, refrigeration appliances, automotive and technical
insulation. Other applications are in sport and leisure sector, windows frames, core of
sandwich panels and so on31 due to the excellent mechanical properties at low weights.
2.3 Montmorillonites
2.3.1. Nanoparticles in polymer science
The use of organic or inorganic fillers has become a standard in polymeric industry.
Nowadays, polymer composites are manufactured commercially for a wide range of
Chapter 2: Background and State of the Art
| 38
applications, such as sporting goods, aerospace components, construction, etc. But in the last
25 years there has been a great emphasis on the development of polymeric nanocomposites.
In these materials at least one dimension of the filler is in the nanoscale range. In the early
1990s, Toyota Central Research Laboratories in Japan reported a work on a Nylon‐6
nanocomposite67, for which a very small amount of nano filler loading resulted in a
pronounced improvement of thermal and mechanical properties. But the change in the final
nanocomposite properties depends not only on the nature of the polymer and nanofiller, but
also on their morphology and interfacial characteristics68.
Concretely the use of nanofillers (carbon nanotubes, carbon nanofibers, graphenes,
nanosilicas, nanoclays, etc.) as aditive in foamed polymer systems is a hot topic involving
significant research activity in the last few years29, 69‐71. The main objective of this research
activity is to understand the physicochemical mechanisms associated with the polymer–
nanofillers interaction, responsible of the cellular structures changes and the potentially better
final properties. The addition of small amounts of well dispersed nanoadditives to traditional
cellular polymers may result in synergistic effects. The polymeric matrix is reinforced with
particles, and in addition the cellular structure might become strongly modified (reducing cell
size, improving cell homogeneity, etc). This can imply an increase of several properties, such as
the thermal insulation properties in rigid polyurethane foams infused with nanoclays studied
by Modesti et al.41, or the emergence of new properties, like the change from insulator to
semiconductor observed by Zheng el al.72 in PMMA infused with 1% expanded graphite, or the
synergy in flame retardancy of polyurethane foams, investigated by Modesti et al.73, between
phosphorus‐based flame retardant and layered silicates, obtaining that clays act through
physical effect constituting a barrier at the surface which is effective in preventing or slowing
the diffusion of volatiles and oxygen, while phosphinate and phosphonium are more effective
owing to their combined action in both condensed and gas phases. Furthermore, mechanical
properties can be improved, as it was observed by Kojima et al.74 in Nylon6 by modified
nanoclays addition, and by Zohu et al.75 in polyester‐based polyurethanes films reinforced with
nanosilica particles, obtaining an increase of some properties like hardness, abrasion
resistance, and tensile properties at lower concentrations.
2.3.2. Composition and structure of montmorillonites
Generally, layered silicates employed in the nanocomposites synthesis are natural or
synthetic minerals consisting of very thin layers that are usually bound together with counter‐
ions. Their basic building blocks are tetrahedral sheets in which silicon is surrounded by eight

Chapter 2: Background and State of the Art
| 39
oxygen atoms. The basic 2:1 structure with silicon in the tetrahedral sheets and aluminum in
the octahedrak sheet, without any substitution of atoms, is called pyrophyllite (Fig. 2.15). Since
the layers do not expand in water, pyrophyllite has only an external surface area and
essentially no internal one. If in the pyrophyllite structure the trivalent Al‐cation in the
octahedral layer is partially substituted by the divalent Mg‐cation, the structure of
monmorillonite is formed, which is the best‐known member of a group of clay minerals, called
smectites. In this case the overall negative charge is balanced by sodium and calcium ions,
which exist hydrated in the interlayer76. This structure presents the particular feature that
because the ions cannot fit in the tetrahedral layer, and these layers are held together by
relative weak forces, water and other polar molecules can enter between the unit layers,
causing the lattice expansion77. The general formula of montmorillonite is Mx(Al4‐
xMgx)Si8O20(OH)4 78, where M is a monovalent cation and x is the degree of isomorphous
substitution (between 0.5 and 1.3).
FIGURE 2.15. Structure of 2:1 phyllosilicates
Although basic structure of montmorillonites has been described, other levels of
organization are present on these nanocomponents (Fig. 2.16). Besides the single layer
structure, montmorillonites can be found forming particles and aggregates. Single layers are
equivalent to a platelet varying from 10 nm to 1 µm in size and a thickness of 1 nm (Fig.
2.16.a). These layers are flexible and deformable. Primary particles are composed from five to
ten stacked layers, with an average thickness of 10 nm (Fig. 2.16.b). Different layers are joined
by Van der Waals and electrostatic attraction forces between the cations and layers. The
stacking of these particles is perpendicular to the y direction. Finally, aggregates are the

Chapter 2: Background and State of the Art
| 40
association of primary particles oriented in all directions, sizes between 0.1 to 10 µm are
typically found (Fig. 2.16.c).
FIGURE 2.16. Phyllosilicate multi‐scale structure
Inter‐layer spacing or d‐spacing (d001), is the distance observed between two platelets
of the primary particle. This value does not entirely depend on the layer crystal structure, but
also on the type of the counter‐cation and on the hydration state of the silicate. For instance,
d001 = 0.96 nm for anhydrous montmorillonite with sodium as counter ion, but d001 = 1.2 nm in
usual conditions. This increase is linked to the adsorption of one layer of water molecules
between the clay platelets65.
The excess negative charge of layered silicates and their capability to exchange ions
can be quantified by a specific property known as the cation‐exchange capacity (CEC)
expressed in miliequivalent/g 79. This property is highly dependent on the nature of the
isomorphous substitutions in the tetrahedral and octahedral layers and therefore on the
nature of the soil where the clay was formed. This explains, for example, why montmorillonites
from different origins show differences in CEC, ranging from approximately 0.9–1.2
miliequivalent/g 77. The charge of the layer is not locally constant, as it varies from layer to
layer, and must rather be considered as an average value over the whole crystal
Three different types of morphology in case of polymer‐nanoclay composites are
shown in Fig. 2.17. When polymer is unable to intercalate between the clay sheets, a phase
separated microcomposites (Figure 2.17, a) is obtained. When there is partial intercalation of
extended chain in between the sheets an intercalated nanocomposite (Figure 2.17, b) is
obtained. Finally, when clay layers are completely dispersed in the polymer matrix an
exfoliated nanocomposite is produced (Figure 2.17, c). The type of composite that is formed
can be obtained by using X‐ray diffraction as it shown in fig 2.17. In the microcomposite it is
possible to identify the signal of original clay in the XRD pattern, in the intercalated

Chapter 2: Background and State of the Art
| 41
nanocomposite the signal is still present but at lower angles and with lower intensities. In the
exfoliated nanocomposites the clay signal has disappeared.
FIGURE 2.17.‐ Types of composites from polymer‐clay interactions79 and schematic depicting the
expected X‐ray diffraction patterns for their structures, replotted from Vaia et al.80
2.3.3. Functionalization
Since pure montmorillonites are only miscible with hydrophilic polymers, a surface
modification of them is required to obtain improved nanofillers, as a good polymer‐
montmorillonite interaction (exfoliated structure) implies better properties transfer. Cation
exchange is the most employed technique for this purpose, although techniques as the
organosilane grafting81, 82, the use of ionomers83 or block copolymers adsorption84 have been
also employed.
In the cation exchange technique, the alkali counter‐ions are exchanged with a
cationic‐organic surfactant (Fig. 2.18). Thereby, the inorganic, relatively small ions are
exchanged, as they are not structural parts, by more voluminous organic cations, with two
consequences: on one hand the surface energy of the silicate is lower, enabling polymer chains
to move in between them and improving wetting with the polymer matrix85, 86. Moreover, the
long organic chains of such surfactants, with positively charged ends, are linked to the surface
of the negatively charged silicate layers, resulting in an increase of the gallery height87 that
makes easier for polymers to diffuse between the layer and even separate them86, 88. On the

Chapter 2: Background and State of the Art
| 42
other hand, surface properties of each single sheet are changed from being hydrophilic to
hydrophobic89. The ionic substitution is performed into water because of the clay swelling,
which facilitates the organic cations insertion between the platelets90. Various commercially
available organo‐modified montmorillonites, which mainly differ from the nature of their
counter‐cation, are produced with this technique (e.g., Cloisite 15A, 20A, 30B from Southern
Clay Products).
FIGURE 2.18.‐ Representation of a cation‐exchange reaction between the layered silicate and an alkyl
ammonium salt.
One of the most employed salt for the ionic substitution is Alkylammonium ions,
although other “onium” salts can be used, such as sulfonium and phosphonium77, 79.
Sometimes, the alkylammonium cations may even provide functional groups that can react
with the polymer or initiate polymerization of monomers78. This fact makes possible the
intercalation of polymer molecules, as the microchemical environment in the galleries is
appropriate to it90. So, it is possible to conclude that the surface modification both increases
the basal spacing of clays and serves as a compatibilizer between the hydrophilic clay and the
hydrophobic polymer89.
Anyway, attempts to incorporate surface modified nano‐particles into a matrix
polymer using the ionic interaction with surfactant molecules gained only a moderate success.
One point to keep in mind is the natural agglomeration tendency of the nanoparticles and how
this led to thermodynamically unstable mixtures. For a better understand of these systems,

Chapter 2: Background and State of the Art
| 43
three components have to be considered: the particle (surface), the interfacial component
(surfactant) and the matrix polymer chains.
FIGURE 2.19.‐ In situ SAXS‐WAXS experiment of the melting/crystallization of a iPP‐clay
nanocomposite material. The intrinsic homogeneous and exfoliated material (absence of any small angle
reflection signal indicating a stacked layer packing of agglomerated clay sheets) changes almost
immediately after melting of the iPP crystals into a heterogeneous system (appearance of the small
angle signal). This small angle reflection is originated from a thermodynamic incompatibility of the
surface modified sheets and the polymer matrix, causing a (partly) re‐agglomeration of the clay sheet in
the melt.
Theoretical studies91 have shown that the interaction enthalpy between the surfactant
molecules and the polymer chains may be the key for a thermodyamically stable, homogenous

Chapter 2: Background and State of the Art
| 44
incorporation of nano‐particles into a polymer matrix. This is because the entropy loss of the
gap between single particles as a consequence of the penetrating polymer chains will be
approximately compensated by the entropy gain of the surfactant molecules in interaction
with polymer chains.
A lattice‐based mean field theory has been developed by Vaia91 to understand the
impact of the different interaction enthalpies onto the possibility of dispersion of particles in a
polymer matrix. Here three different interactions must be taken into account: polymer–
surfactant, surfactant–surface and polymer–surface interactions. Calculations of this theory
has shown that even when the surfactant chains are miscible with the matrix polymer, a
complete layer separation depends on the establishment of very favorable polymer–surface
interactions to get over the polymer confinement. When this is not possible, a good dispersion
of the particles may be reached by the help of strong shear forces during the preparation and
the processing of the nanocomposite materials, but the system nevertheless will be
thermodynamically unstable. This can be observed in the case of iPP or LLDPE nanocomposite
materials which were prepared by melt mixing of the polymers with surface modified natural
clay (ion‐exchanged with dimethydioctadecylammoinum ions) using high shear forces. If such a
mixture is heated (e.g. during processing) to temperatures above the melting temperature,
immediately a (partial) re‐agglomeration of the particles takes place (see fig. 2.19). A different
possibility of creating a homogeneous dispersion of surface modified nano‐particles within a
polymer matrix material is the decrease of the strength of the interactions surfactant–surface
and surfactant–polymer, which results in an increase of the interaction strength polymer–
surface, e.g. by the use of fluorinated surfactants.
2.4. Foamed polyurethane nanocomposite filled with nanoclays: State of the Art
Different aspects involved both in the production and characterization of foamed rigid
polyurethane nanocomposites can be found in a review of the most recent literature focused
on these materials. Between all, special attention has been given to the next items: blowing
agents and density, dispersion technique used to produce the nanocomposite, nanoclays
concentration, cellular structure, thermal conductivity and mechanical properties.
2.4.1. Density and Foaming Agents
Most of the publications made in this field are focused in low density foams, with
values between 30 and 110 kg/m3. Depending on the requirements of the final foam higher or
lower densities have been produced.

Chapter 2: Background and State of the Art
| 45
Figure 2.20 shows the different densities observed over a variety of studies (a total
number of 15 publications were found) focused on rigid polyurethane foams infused with
nanoclays. It can be observed that the vast majority of the articles are oriented to densities
between 25 and 75 kg/m3. Anyway, it is important to mention that density was not measured
in some of the articles studied17, 45, something that cannot be understood taking into account
the fundamental role that the density plays in the foams properties1. In most of the analysed
papers the change in density due to the clays addition was small, not higher than 5 kg/m3.
FIGURE 2.20.‐ Relative frequency of pappers published in different densities ranges
But in some cases, nanoparticles can produce a considerable change in final foam
density, as in the study performed by Bahrambeygi et al.92 where densities changed from 45
kg/m3 for the pure material to more than 90 kg/m3 for 1.5% of nanoclays. In addition, in the
study of Piszczyk et al.93, density varies from around 20 kg/m3 for pure material to around 40
kg/m3 for materials infused with bentonite. Although nanoclays are usually dehydrated in a
vacuum oven for several hours prior to their incorporation and dispersion in polyurethane
components, this do not always guarantee the complete absence of water in the nanoclays
that could act as chemical blowing agent. In this respect, the results obtained by Xu et al.94
confirm this, as foamed rigid polyurethane containing nanoclays were produced without any
blowing agent, only with the inclusion of nanoclays. In this study, organoclays were
dehydrated in an oven at 70ºC overnight before use. The observed behavior was due to the
presence of water on nanoclays: although the desorbed water molecules that absorb the
cations between interlayers of clay evaporate in the temperature range of 50–170ºC, the
Chapter 2: Background and State of the Art
| 46
dehydroxylation of bound water molecules from the crystal lattice of pristine clay occurs in the
temperature range of 450–900ºC95, 96. Then, the temperatures reached during overnight
dehydration are not enough to completely eliminate nanoclays water, and this could react
with isocyanate acting as a blowing agent.
Possible explanations of these density increase found in the papers by Bahrambeygi
and Piszczyk, and compatible with the previous one, and can be based first in that the density
of the nanofillers (e.g. Cloisite 30B ‐ 1.98 g/cm3) is usually higher than that of the polymeric
matrix (typically 1.2 g/cm3 for polyurethane). Secondly, the viscosity of the polyol mixture
containing nanofillers is higher than the viscosity of the mixture of the unmodified polyol. The
increase in viscosity of the polyol mixture could hinder the foaming process which results in
higher density foams97.
The blowing agents employed in the production of low density polyurethane foams is a
non‐trivial subject, as the thermal conductivity of this material presents a high dependence
with the thermal conductivity of the gas present inside its cells (see section 2.1.4). For this
reason, diffusivity of the foaming agent out of the foam is a fundamental key; if the gas
diffuses outside the foam the thermal insulation ability of the material will be deteriorated. On
this respect, the most used foaming gas has been trichlorofluoromethane (CFC), due to due to
its lowest diffusion coefficient and low thermal conductivity, but nowadays is banned (as it was
previously mentioned on section 2.2.2) by environmental reasons. Moreover, alternative gases
such as HCFC‐141b are also supposed to be banned after the year 2030 for the same reasons
as CFC98. Another foaming agent like water is environmentally friendly, but presents the
disadvantage that, although thermal conductivity of resulting CO2 is low (lower than that of
air), its diffusivity across the cell walls is really high and is quickly substituted by air99.
Anyway, the foaming agent employed in the vast majority of the publications is water.
In articles in which foams with densities lower than 50 kg/m3 are produced, both chemical
(water) and physical foaming agents are simultaneously employed, as the only addition of
water implies a high viscosity system and a large amount of heat (exotherm reaction) while
preparing the foam, which may lead to risk of fire and scorch the foam. Sometimes, the system
cost is high due to the increase in the use of excess of isocyanate43. Some of the additional
physical blowing agents employed are HCFC 141b44, cyclopentane39, 45, 46, isopentane39, 46, n‐
pentane94, 100, 101 and blends of 1,1,1,3,3‐ pentafluorobutane and 1,1,1,2,3,3,3‐
heptafluoropropane17, 74, 102.

Chapter 2: Background and State of the Art
| 47
2.4.2. Dispersion Techniques used to produce the polyurethane nanocomposite
foams
Nanoclays drying is a common procedure in practically all papers where this additive is
employed. For this subject it is usually employed a vacuum oven at 60‐70ºC, or a conventional
oven at 100‐110ºC. Drying time varies between 4‐6 hours and overnight, but as it was
previously mentioned, evaporating of water molecules (from the crystal lattice of pristine clay)
occurs in the temperature range of 450–900ºC, therefore not all moisture will be removed
from the nanoparticles by the typical drying processes used96, 97.
After drying, the first problem that emerges in the inclusion of nanoparticles in a
polyurethane matrix is how to disperse them and how to exfoliate them in an optimal way.
This is a crucial step in order to obtain a new material with improved properties, as much of
the benefits of nanoclays incorporation depend on achieving of a good dispersion and
exfoliation. As it had been previously commented, nanoclays functionalization can improve
dramatically the nanoclays‐polymer interaction, and moreover nanoclays exfoliation. What is
more, the use of a good dispersion technique can also affect not only this fact, but also the
improvement of the nanoparticles‐polymer surface contact by an increase in the dispersion.
As rigid polyurethane foams reactives are liquid, the inclusion of nanoparticles implies
their dispersion in a liquid media. Although alternative dispersion and exfoliation techniques as
microwaves processing103 have been investigated showing promising results (see below),
mainly two different techniques have been employed for this objective: shear mixing and
ultrasonication.
Shear mixing can be carried out at low (less than 1000 rpm103) or high speed (more
than 1000 rpm104, 105), although in the vast majority of the studied papers mixing speed is not
mentioned, and in the best of the cases adjectives as “vigorous”80 is provided. This dispersion
is inherently unstable and precipitation of clay occurs after 1 day or more105. In the majority of
the papers including this technique mixing time oscillates between some minutes46, 104, 106, 107
and several hours47, 108, 109.
Ultra‐sonication consists in applying ultrasound energy to agitate particles in a solution
for various purposes. In the laboratory, it is usually achieved using an ultrasonic bath or an
ultrasonic probe/ horn, also known as an ultrasonicator. This is the most frequently used
method for nanoparticles dispersion in liquids. This technique is based in the attenuated waves
induced in the molecules of the medium in which ultrasonication are propagated. The

Chapter 2: Background and State of the Art
| 48
production of these shock waves promotes the ‘‘peeling off” of individual nanoparticles
located at the outer part of the nanoparticle bundles, or agglomerates, and thus results in the
separation of individualized nanoparticles from the bundles. As drawback, high temperatures
are produced during ultra‐sonication, which can produce a degradation of the polyol or
isocyanate. For this reason a raw polyol is required, because commercial formulations include
additives like surfactants and catalyst that can be easily degraded.
An alternative dispersion technique was also found; the use of microwaves103.
Lorenzetti et al. employed a microwave treatment with a microwave oven (700W power, 2.45
GHz), on polyol and isocyanate, for 2 minutes. In particular, microwave processing was applied
through 15 s step, followed by intermediate cooling at 50 ºC using a water, ice and acetone
bath, because, on the contrary, a quick temperature increase was observed (without
intermediate cooling of the polyol or isocyanate temperature reached was 220 ºC). Although
good results of exfoliation were obtained in comparison with sonication technique, maybe the
parameters employed in both techniques were not the optimum to ensure an equal
comparison, at least for ultrasonication. Possibly shorter times of ultrasonication could have
produce similar effects, and one of the advantages of the new dispersion technique to
ultrasonication could have been omitted. Finally, another dispersion technique could been
suitable to be compared, providing a wider spectrum of dispersion power.
Comparing traditional techniques of high shear mixing and ultra‐sonication, Rhoney et
al.105 studied nanocomposites produced using two different types of organically modified
montmorillonite clays and a sample of fine particles of silicon nitride as a reference material.
Rheological techniques, wide angle X‐ray scattering measurements and dynamic mechanical
analysis were employed to perform this study. As conclusion, the dispersion with shear mixers
was inherently unstable and precipitation of clay took place over a period of 1 day or more; on
the other hand the sonicated samples produced dispersions that were stable for weeks or
more. The sonication process appears not only able to achieve a better but also a more stable
dispersion. Surprisingly, there were no marked differences in the Tg’s of the polyurethanes
with the dispersion method, and both methods of dispersion were able to provide a
reinforcing effect, albeit a slight one, on the final foams.
2.4.3. Nanoclays concentration
One of the theoretical advantages of employing nanoclays is the reduction of the
amount of material added to produce similar, or even better, results than when using classical,

Chapter 2: Background and State of the Art
| 49
micrometric size particles. The percentage by weight (mass fraction) of the nanoparticulates
introduced can remain very low (of the order of 0.5% to 5%) due to the low filler percolation
threshold, especially for the most commonly used non‐spherical, high aspect ratio fillers (e.g.
nanometer‐thin platelets, such as clays, or nanometer‐diameter cylinders, such as carbon
nanotubes). Table 2.4 compare different fillers comontly employed in a review by Ma et al.110:
TABLE 2.4. Dimension and corresponding number of particles in composites for different fillers
at equal volume concentration
Data on Al2O3 particles, carbon fibers, graphite nanoplatelets (GNPs) and CNTs are
given, they correspond to the number of particles in an uniform filler volume fraction of 0.1%
in a composite of 1.0 mm3 cube. Because there are large differences in dimension and
geometry of these four different reinforcements, the number of fillers contained for a given
filler volume fraction is also very different, as it can be seen in Table 2.4 and Fig. 2.21 (the
three dimensional representation of these fillers in a polymeric matrix). However, when GNPs
and CNTs are filled into the same volume of matrix, it is hard to disperse individual particles
uniformly. Considering the particle agglomeration due to the electrostatic interaction and Van
der Waals forces, the real distribution of nano‐scale fillers should be more complicated than
the schematics shown here.
FIGURE 2.21.‐ Distribution of micro‐ and nano‐scale fillers at the same 0.1 vol% in a reference volume of
1mm3 (A: Al2O3 particles, B: carbon fibers, C: GNP, D: CNT)

Chapter 2: Background and State of the Art
| 50
For polyurethane‐nanoclays composites, the relative frequencies of different
concentrations of nanoclays observed in scientific literature are present in Fig. 2.22. The study
has been performed over 26 publications. As it is shown, practically all studies are referred to
concentrations lower or equal to 5%. And there are two sub‐categories: from 0 to 1%, and
between 1 and 5%, with a higher amount of publications in the second one.
FIGURE 2.22.‐ Relative frequency of publications as a function of the weigth concentration of nanoclays
2.4.4. Cellular Structure and Thermal Conductivity
The thermal conductivity of foams present a clear dependence with the foam cell
size74, 111, so that a reduction of the cell size produces a reduction of the thermal conductivity.
As nanoclays can reduce the cell size of the foams due to a possible nucleating effect, a
thermal conductivity reduction can also be produced. Not many publications have been
focused on this subject; the most relevant are described on the following paragraphs.
Modesti, Lorenzetti and Besco studied the thermal behaviour with the presence of
nanoparticles41, observing the effect of different nanofillers (titanium dioxide, silica
nanopowder and three types of montmorillonites: pure, modified with enzyl‐dimethyl‐
hydrogenated‐tallow ammonium‐salt and modified with alkyl‐imidazolium salt) on the thermal
insulating properties of polyurethane nanocomposites foams. Two types of polyols were
employed: polyether polyol and polyether‐polyester polyol, and fillers were first dispersed in
polyol component by using sonication. Blowing agent employed was 1,1,1,3,3‐

Chapter 2: Background and State of the Art
| 51
pentafluorobutane (365mfc, Solvay) and water. A good degree of dispersion was achieved, and
in general the thermal conductivity of foams was slightly reduced. On the other hand, the
fillers could have brought in some cases an increase of the open cell content making the
diffusion rate of the blowing agents faster, which might result in worse thermal insulating
properties over time. Between the different types of nanoclays employed, best results were
obtained for benzyl‐dimethyl‐hydrogenated‐tallow ammonium‐salt modified montmorillonite,
observing a cell size and thermal conductivity reduction. Also, although a good degree of
dispersion was claimed, the XRD results for some polyether and polyether–polyester based
foams showed that a good exfoliation of nanoclays was not always achieved. Better exfoliation
results were obtained for both polyether and polyether‐polyester with organomodified
montmorillonites, with a higher separation between platelets for polyether‐polyester polyol.
Anyway, this study showed that chemical nature and viscosity of polyol plays an important role
as some clear positive effects on thermal conductivity can be obtained only for polyether–
polyester based foams; also it was observed that nanoparticles aspect ratio is not as important
as the nanoparticles functionalization. Due to the high number of formulation/nanoparticles
studied (see Fig. 2.23), the nanoclays effect on the final properties was not deeply studied.
Maybe, a more detailed characterization of the open cell content and the cellular structure
had cleared some of the experimental results obtained.
FIGURE 2.23.‐ List of samples and thermal conductivity measurements results.

Chapter 2: Background and State of the Art
| 52
Harikrishnan et al.47 performed other study of the nanoclays effect on thermal
properties of rigid polyurethane foams. In that publication, rigid and flexible foams infused
with nanoclays were studied with the main goal of observing the effect of nanoclays over the
open cell content. Blowing agents employed were HCFC 141b and water. It was found that
clays act as efficient cell openers in both rigid and flexible foams as a larger fraction of open
cells was obtained with increasing clays concentration. Modified clays were found to be more
efficient cell openers than the unmodified clay. Thermal conductivity of the rigid foams was
not significantly affected by clay addition. Although modified clays produced higher cell size
reduction (Fig. 2.24.a) which could produce a reduction of the thermal conductivity90, 99, they
also produced higher open cell content (Fig. 2.24.b), and finally best thermal properties where
produced for unmodified nanoclays (Fig. 2.24.c), with around 7% reduction with respect to
pure material. Again, the variety of samples studied prevented a more detailed
characterization, and different questions about the thermal conductivity variation by the
nanoclays addition were not solved.
FIGURE 2.24.‐ Some properties of the produced foams: a) Cell window area; b) Open Cell Content; c)
Thermal Conductivity
Kim et al.42 studied the effect of organoclay on the thermal insulating properties of
rigid polyurethane foams, using different eco‐friendly foaming agents: water, cyclopentane,
and HFC‐365mfc and HCFC‐141b. Organomodified nanoclays employed were Cloisite 30B,
which were dehydrated overnight previously to the dispersion (3%) in the isocyanate with and
without the help of ultrasonication. This technique was employed for 15 minutes at a

Chapter 2: Background and State of the Art
| 53
temperature of 50ºC, and nanoparticles were previously pre‐dispersed (3000 rpm) in the
isocyanate for 2 hours with the help of a mechanical stirrer. Density of the final foams was
around 50 kg/m3. The introduction of nanoclays produced a cell size reduction, regardless of
the type of blowing agent employed. Thermal conductivity of the produced foams was smaller
for the materials produced with HCFC‐141b, and ultrasonication showed also a reduction of
this property for all the blowing agents employed (Fig. 2.25). Moreover, the presence of
nanoclays produced a thermal conductivity reduction for all the foaming agents. Anyway,
three main aspects are missed in this article: a study of the final foam densities, a longer
explanation of the morphological changes produced on the cellular structure, and the effect of
chemical changes that can be produce in the isocyanate due to the aggressive, long term
nanoclays‐isocyanate mixing (e.g. isocyanurate formation36). In addition, there is no modelling
of the thermal conductivity of the foam.
FIGURE 2.25.‐ Thermal conductivity of neat PUF and PUF/clay nanocomposites with and
without applying ultrasound.
Other authors studied changes produced on thermal conductivity by the inclusion of
nanoclays, but this subject was not the main objective of their study. Kim, Lee et al.112
produced rigid polyurethane foams with clays (0.5, 1, 2 and 4%wt) which were intercalated
and exfoliated by neutralized dimethyol butanoic acid (DMBA). Blowing agent employed was
HFC 365mfc. The main objective of this article was a complete characterization of the effect of
this new organo‐modification over the final foams, and between the different characteristics
studied thermal conductivity and cell size were included, only some SEM images (see Fig. 2.26).
A minimum for both characteristics was observed for 2% nanoclays concentration, obtaining
an approximately 3% reduction with respect to pure material. No quantitative analysis of the
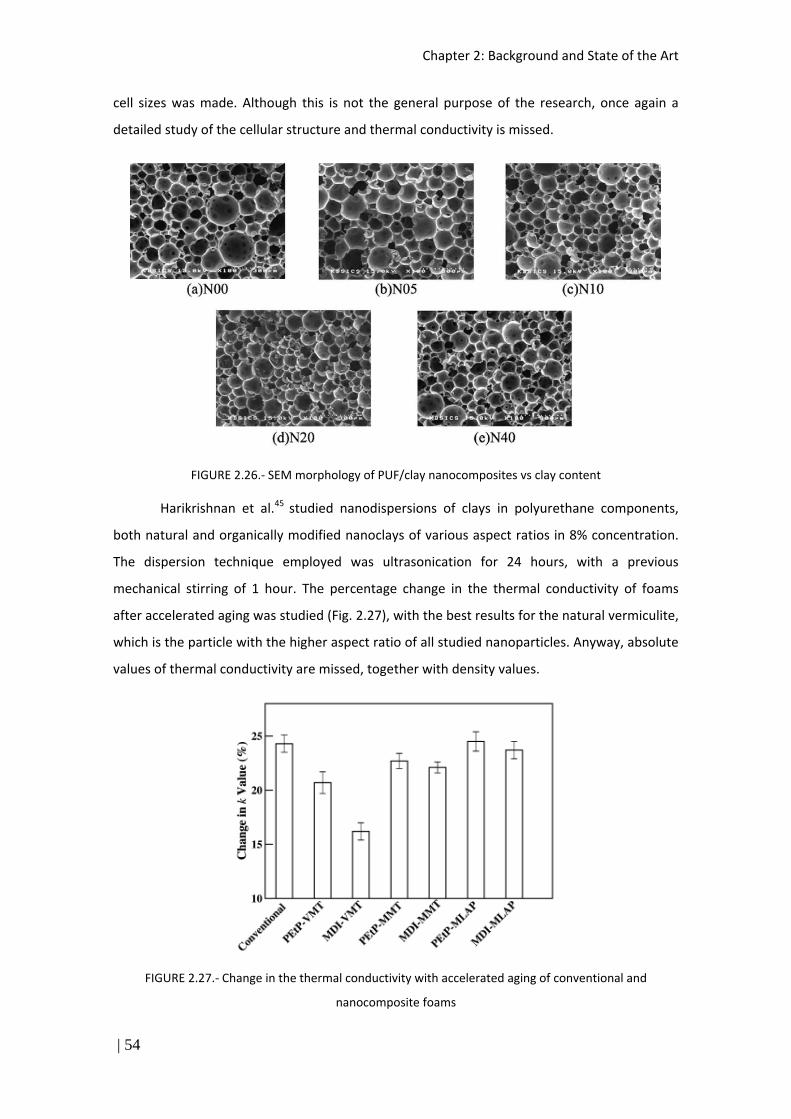
Chapter 2: Background and State of the Art
| 54
cell sizes was made. Although this is not the general purpose of the research, once again a
detailed study of the cellular structure and thermal conductivity is missed.
FIGURE 2.26.‐ SEM morphology of PUF/clay nanocomposites vs clay content
Harikrishnan et al.45 studied nanodispersions of clays in polyurethane components,
both natural and organically modified nanoclays of various aspect ratios in 8% concentration.
The dispersion technique employed was ultrasonication for 24 hours, with a previous
mechanical stirring of 1 hour. The percentage change in the thermal conductivity of foams
after accelerated aging was studied (Fig. 2.27), with the best results for the natural vermiculite,
which is the particle with the higher aspect ratio of all studied nanoparticles. Anyway, absolute
values of thermal conductivity are missed, together with density values.
FIGURE 2.27.‐ Change in the thermal conductivity with accelerated aging of conventional and
nanocomposite foams

Chapter 2: Background and State of the Art
| 55
Danowska et al102 investigate the effect of three different nanofillers on the properties
of rigid polyurethane foams. The reaction mixture consisted of the proper amounts of the
commercial oligoether polyol, catalysts, water, nanoclays, and polymeric diphenylmethane
diisocyanate. Three types of montmorillonite were used: Cloisite 30B, Laponite RD, and
Bentonite. Thermal properties of rigid polyurethane foams and nanocomposite foams were
investigated by dynamical thermal analysis, thermogravimetry, oxygen index, and thermal
conductivity measurements, obtaining in the case of thermal conductivity an increase of this
property in all the cases with exception of the 3% cloisite 30B foams. In this case a 20%
reduction was observed, and it was explained taking into account the cell size reduction by the
nanoclays addition (around 18% reduction). But also a significant change was observed in the
density, passing from 22 kg/m3 for pure material to 33 kg/m3 in the case of 3% cloisite 30B
foams (Table 2.5).
TABLE 2.5.‐ Foaming and Physical Properties of the Foam Samples
Two main conclusions can be obtained by the study of the state of the art in the
cellular structure and thermal conductivity of rigid polyurethane foams infused with nanoclays:
‐ A cell size reduction is produced by the inclusion of nanoclays in polyurethane rigid
foams. This reduction is usually explained by a reduction of the free surface energy
by the exfoliated clays that produces an increase of the nucleation sites. As the
amount of nucleation centers increases, the bubble size decreases and the number of
cells increase. This effect is growth with the amount of nanoparticles typically
reaching a minimum.
‐ A reduction of the thermal conductivity, conditioned to a non‐increase of the open
cell percentage.
Anyway, these studies do not analyse in detail the cellular structure of the materials,
the different mechanisms involved in the thermal conductivity and their weight on the final

Chapter 2: Background and State of the Art
| 56
conductivity value. A deeper analysis of the nanoclays effect over these different heat
conduction mechanisms could help to elaborate better models to predict the behaviour of
these foamed nanocomposites.
2.4.5. Mechanical Properties
Facing the shortage of references available related with the thermal conductivity of
rigid polyurethane foams infused with nanoparticles, a great number of studies are referred to
mechanical properties. In the different studies found in the literature the introduction of
nanoclays has produced mainly a decrease of the mechanical properties, but in some cases an
increase has been also observed. The most relevant publications are described below.
First, we will review some selected publications on which a reduction of the
mechanical properties was detected. Cao et al.46 observed a reduction of the mechanical
properties for the rigid foams in the study of polyurethane‐montomorillonite composites. To
exclude the density difference of the foam samples, the compressive strength and modulus
divided by the density of the foam sample were used to compare the mechanical properties of
the PU foams with different clays. As it has been commented on section 2.1.2, the relationship
between mechanical properties and density is given by Gibson and Ashby law1, and for these
density ranges, the relationship was not usually lineal. Anyway, considering a mechanical
dependence respect to the square of the density, no improvement is observed. Also, a possible
interaction mechanism between the existing H‐bonds between urethane groups (Fig. 2.28 (a))
and the functionalizated nanoclays was postulated. Lorenzetti et al.103, in the study of
alternative dispersion techniques for nanoclays in rigid polyurethane foams, concretely
microwave dispersion (see section 2.4.2), observed a good dispersion and a reduction of the
required dispersion time compared with ultrasonication, but also, they observed a reduction in
the mechanical performance due to a clay interference with H‐bond formation (Fig. 2.28 (b)).
(a) (b)
FIGURE 2.28 (a) Pure polyurethane structure: urethane groups and H‐bonds; (b) Polyurethane infused
with functionalized nanoclays: urethane groups, H‐bonds and nanoclays.

Chapter 2: Background and State of the Art
| 57
Then, an important conclusion of these papers is that the mechanical properties of PU
nanocomposite foams depend on the competition between the positive reinforcing effect of
clay and the negative effect related with hindering the H‐bond formation.
Widya and Mackosko39 incorporated different montmorillonite based organoclay
concentrations (1, 2, 3 and 5%wt, Cloisite 30B nanoclay) into rigid polyurethane foams with
ultrasonication dispersion, and studied the effect of these particles on different physical
properties of polyurethane foams. Isocyanate index was varied from 200 to 300. A cell size
reduction and cell number increase was observed even for the lower nanoclays concentration,
but clay loading did not result in increased mechanical strength of the rigid PU foams. Foams
produced with higher isocyanate index had higher compression strength and modulus, due to
the presence of more isocyanurate hard segments. However, the strength and modulus
decreased with clay loading for the 250‐index. The presence of clay may interfere with
isocyanurate formation, resulting in a weaker chemical structure of the foam. In the case of
the 300‐index samples, there were a reduction in compression strength and modulus despite
the decrease in cell size from 0.40 to 0.28mm.
Contrarily to these results, Xu et al.95 obtained a clear improvement of the mechanical
properties during the study of a novel method for preparing rigid polyurethane foam infused
with nanoclays (pure and organomodified) composites. Organomodified nanoclays employed
presented one‐tail octadecyl primary ammonium, which were dehydrated overnight previously
to the dispersion in the polyol with the help of ultrasonication. This technique was employed
for two hours at a temperature of 50°C, and nanoparticles were previously pre‐dispersed in
the polyol for 2 minutes with the help of a mechanical stirrer. The new method introduced in
the study is the absence of any physical or chemical blowing agent in the production of
nanoclays infused foams. The resultant foams with an appropriate content of the organoclay
had a finer cell structure than the pristine PU foams because the organoclay not only acted as
a nucleating agent as expected but also acted as a blowing agent of the PU foams; this could
be attributed to the bound water between the interlayers of the organoclay. The organoclay
content had a remarkable effect on the compressive and tensile strengths of the
nanocomposites. Both the compressive strength and tensile strength were increased
dramatically even with a small addition of the organoclay and reached the maximum value at 2
phr organoclay (around a 152% increase in the compressive strength and a 110% increase in
the tensile strength in comparison with the pure PU foams). This result is quite different from
those obtained by other researchers (see previous paragraph) that have suggested no
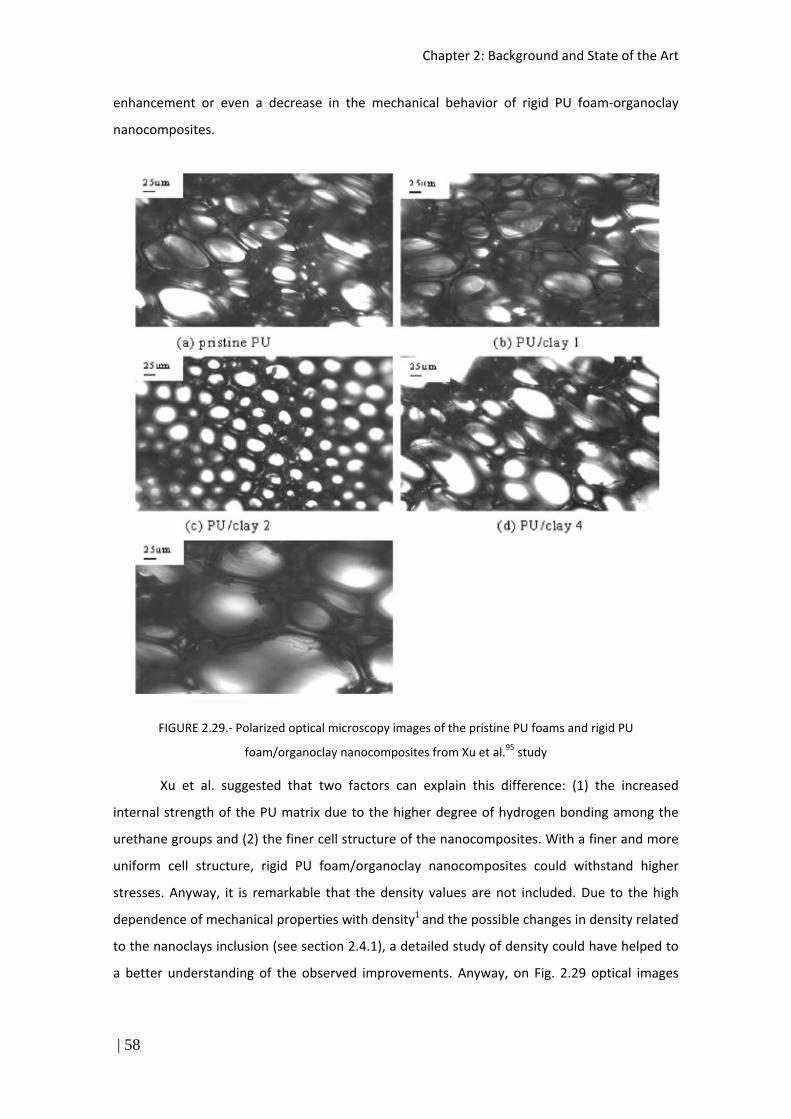
Chapter 2: Background and State of the Art
| 58
enhancement or even a decrease in the mechanical behavior of rigid PU foam‐organoclay
nanocomposites.
FIGURE 2.29.‐ Polarized optical microscopy images of the pristine PU foams and rigid PU
foam/organoclay nanocomposites from Xu et al.95 study
Xu et al. suggested that two factors can explain this difference: (1) the increased
internal strength of the PU matrix due to the higher degree of hydrogen bonding among the
urethane groups and (2) the finer cell structure of the nanocomposites. With a finer and more
uniform cell structure, rigid PU foam/organoclay nanocomposites could withstand higher
stresses. Anyway, it is remarkable that the density values are not included. Due to the high
dependence of mechanical properties with density1 and the possible changes in density related
to the nanoclays inclusion (see section 2.4.1), a detailed study of density could have helped to
a better understanding of the observed improvements. Anyway, on Fig. 2.29 optical images

Chapter 2: Background and State of the Art
| 59
show that 2 phr organoclay samples possibly present the higher density, which explains the
increase of the mechanical strength.
Danowska et al102 also observed and increase of the mechanical properties by
nanoclays addition to rigid polyurethane foams. As it has been mentioned in the previous
section, the effect of three different nanofillers on the properties of rigid polyurethane foams
were investigated, with three types of montmorillonites: Cloisite 30B, Laponite RD and
Bentonite. Great improvements were reported for mechanical properties, concretely a 300%
for the compression strength in the case of 9% Cloisite 30B foams. However, as in the thermal
properties, a large change was observed in the density, passing from 22 kg/m3 for pure
material to 56 kg/m3 in the case of 9% cloisite 30B foams, which could be the main origin of
these differences. Some calculus can be made accepting the Gibson and Ashby relationship1
between mechanical properties and density presented in section 2.1.2. Taking an n value equal
to 2, the initial increase of the nanoreinforced material is actually a decrease: 200 Pa∙m6/kg2 is
the value of the compression strength relative to the squared density for the pure material and
94 Pa∙m6/kg2 is the value of the same property for the 9% cloisite 30B foams.
Liang and Shi98 studied polyurethane foams fabricated from polymeric
diphenylmethane diisocyanate (pMDI) and soybased polyol, infused with nanoclay Cloisite 30B
(0.5 to 3% wt.). Nanoclays inclusion improved the compressive strength and modulus of the
polyurethane foams. The compressive strength and modulus of nanoclay polyurethane foams
were first increased with nanoclays loading at 0.5 php, then decreased as the nanoclays
loading increased. At 0.5 php nanoclay the compressive strength and modulus were increased
by 98 and 26%, respectively, as compared to the neat soy‐based polyurethane foam. This
increase is explained by the authors as a result of the higher density (from around 0.195 to
0.205 kg/m3) and smaller cell size of foam composites; the authors also explain that it was
easier to disperse uniformly the nanoclays into polyol resin at a low loading, resulting in more
uniform and smaller cell size. However, the viscosity of nanoclay polyol mixture was higher at
high nanoclay loading which made more difficult to disperse the nanoparticles. This would
cause less uniform and some larger cell size due to the excessive coalescene. Thus, the
compressive strength and modulus of nanoclay soybased polyurethane foam decreased when
the nanoclays loading increased.
In a Kim et al.42 paper, previously discussed on the thermal properties section, an
increase of the mechanical properties was also observed. In this paper it was studied the effect
of organoclay on the thermal insulating properties of rigid polyurethane foams, using different
eco‐friendly foaming agents. Organomodified nanoclays employed were Cloisite 30B, in a 3

Chapter 2: Background and State of the Art
| 60
%wt. concentration, dispersed with and without the help of ultrasonication technique. Density
of the final foams was set at 50 kg/m3. Between the foaming agents employed, water
produced the foams with highest tensile strength, property which also was better for
nanocomposites respect to pure materials, and between nanocomposites those that were
made with the help of ultrasonication were better too. No explanation to this increase is given;
only best performance of ultrasonication nanocomposites is explained by a possible best
dispersion. The increase with respect to pure material is high, around 30% for cyclopentane
foamed nanocomposites (passing from 0.35 MPa to 0.45 MPa of tensile strength). The best
results are obtained for water foamed nanocomposites, with a 20 % increase with respect to
pure material, passing from 0.5 MPa to 0.6 MPA
Zhu et al108 produced water‐blown, cellulose microfibers and nanoclays (pure and
organo‐modified; 2% wt) reinforced rigid polyurethane foams from soy‐based polyol, studying
their structure–property correlations. Morphology, mechanical, and thermal properties of final
foams were characterized. Physical properties of foams, including density and compressive
strength, were also determined. The cellular morphologies of foams were analyzed by SEM
and X‐ray micro‐CT and revealed that incorporation of microfibers and nanoclays into foam
altered the cellular structure of the foams, reducing the average cell size. Foam with Cloisite
93A had the smallest cell sizes and maximum number of small cells and provided the highest
compressive strength. Similarly with other nanoclays, the compressive strength improvements
followed the trend in accordance with cell sizes and their distributions. Moreover a
considerable increase of the density was also observed in some cases, although in the case of
cloisite 93A similar densities were produced (around 80 kg/m3), and a 50% of increase in the
compressive strength was observed. Anyway, the analysis of additional mechanical properties
(e.g. Young’s modulus) could have helped to confirm these improvements.
Finally, it is possible to conclude from the review of the different changes produced in
the mechanical properties by nanoclays that the more usual result is a reduction of the final
mechanical properties. In those papers in which an increase of these properties have been
observed a detailed study of density is not included. A possible interaction mechanism
between the existing H‐bonds linking urethane groups and the functionalized nanoclays is the
most proposed explanation of those mentioned in the literature for the reduction of the
mechanical properties when the clays are infused. Only in the soy‐based polyols a clear
increase has been produced by the nanoclays inclusion. In these papers the only increase of
density does not completely explains the observed changes.

Chapter 2: Background and State of the Art
| 61
2.4.6. Conclusions
Although the study of the different papers published to date in the field of
polyurethane foams infused with nanoclays has shown a high variety of results and
characterization techniques, a more systematic study of these materials is missed. Some
aspects, like the cellular structure, the dispersion, the modelling of the different properties and
so on must be taken into account to obtain a better understanding of these cellular materials
and the changes produced in their properties.
The present work considers all these aspects and presents a deeper study of
polyurethane‐nanoclays foams than those papers previously studied. The study is mainly
focused on:
1. Evaluating in detail the effect of the dispersion quality of the nanoclays in the
polyol component on the structure and properties of polyurethane foams
filled with nanoclays.
2. Evaluating in detail the effect of the clays content on the cellular structure,
thermal and mechanical properties of the foamed nanocomposites.
3. Improving the thermal conductivity of polyurethane foams by using nanoclays
as nucleating agent and IR‐blocker.
4. Modelling the thermal conductivity of the developed foams, using as a basis a
detailed characterisation of the different materials and the experimental
determination of the extinction coefficient.

Chapter 2: Background and State of the Art
| 62
1 L. J. Gibson, M. F. Ashby, Cellular solids: structure and properties, Pergamon Press, Oxford, (1988)
2 D. Klempner, V. Sendijarevic, Handbook of polymeric foams and foam technology, Munich: Hanser Publishers, (2004)
3 D. Randall, S. Lee, The polyurethanes book, J.Wiley, (2002)
4 ASTM D3576‐04. Standard test method for cell size of rigid cellular plastics. Annual Book of ASTM Standards, Vol 8.02, (2011)
5 J. Pinto, E. Solórzano, M. A. Rodriguez‐Perez, J. A. de Saja, Characterization of the cellular structure based on user‐interactive image analysis procedures, Journal of Cellular Plastics, 49(6), 555‐575 (2013)
6 M.A. Rodríguez‐Pérez, J. Lobos, C.A. Pérez‐Muñoz, J.A. de Saja, Mechanical Behaviour at Low Strains of LDPE Foams with Cell Sizes in the Microcellular Range: Advantages of Using these Materials in Structural Elements, Cellular Polymers 27(6), 347‐362, (2008)
7 M.A. Rodríguez‐Pérez, J. Lobos, C.A. Pérez‐Muñoz, J.A. de Saja, Mechanical Response of Polyethylene Foams with High Densities and Cell Sizes in the Microcellular Range, Journal of Cellular Plastics, 45(5), 389‐403, (2009)
8 J.E. Weller, V. Kumar, Solid State Microcellular Polycarbonate Foams. II. The Effect of Cell Size on Tensile Properties, Polymer Engineering and Science 50(11), 2170‐2175, (2010)
9 S. T. Lee, C. B. Park, N. S. Ramesh, Polymeric Foams: Science and Technology, CRC Press, Boca Raton‐Florida, (2007)
10 S.T. Lee, Foam Extrusion: Principles and Practice, Technomic Publishing Company, Lancaster‐Pennsylvania, (2000)
11 D. Eaves, Handbook of Polymer Foams, Rapra Technology, United Kingdom, (2004).
12 M.A. Rodríguez‐Pérez, O. Alonso, A. Duijsens, J.A. de Saja, Thermal Expansion of Crosslinked Closed‐Cell Polyethylene Foams, Journal of Applied Polymer Science 36(14), 2587‐2596, (1998)
13 W. Gong, J. Gao, M. Jiang, L. He, J. Yu, J. Zhu, Influence of Cell Structure Parameters on the Mechanical Properties of Microcellular Polypropylene Materials, Journal of Applied Polymer Science 122(5), 2907‐2914, (2011) 14 ASTM D6226 – 10: Standard Test Method for Open Cell Content of Rigid Cellular Plastics, ICS Number Code 83.080.01 (Plastics in general), DOI: 10.1520/D6226‐10
15 L.R. Glicksman, Heat Transfer in Foams, in Low Density Cellular Plastics‐Physics of Basics of Behaviour, Chapman and Hall, London, pp 107‐111, (1994)
16 M.A. Rodríguez‐Pérez, Propiedades Térmicas y Mecánicas de Espumas de Poliolefinas, Thesis, University of Valladolid, (1999)
17 S. Semenzato, A. Lorenzetti, M. Modesti, E. Ugel, D. Hrelja, S., Besco, R. Bertani, A novel phosphorus polyurethane FOAM/montmorillonite nanocomposite: Preparation, characterization and thermal behaviour, Applied Clay Science, 44(1), 35–42, (2009)

Chapter 2: Background and State of the Art
| 63
18 V. Kumar, Microcellular Polymers: Novel Materials for 21st
Century, Progress in Rubber and Plastics Technology 9: 54‐70, (1993)
19 J. Kuhn, H. P. Ebert, M. C. Arduini‐Schuster, D. Büttner, J. Fricke, Thermal transport in polystyrene and polyurethane foam insulations, International Journal of Heat and Mass Transfer, 35(7), 1795‐1801, (1992)
20 A. G. Leach, The thermal conductivity of foams. I. Models for heat conduction, Journal of Physics D: Applied Physics, 26 (5), 733, (1993)
21 P. G. Collishaw, J. R. G. Evans, An assessment of expressions for the apparent thermal conductivity of cellular materials, Journal of Materials Science, 29(9), 2261‐2273, (1994)
22 M.A. Rodríguez‐Pérez, O. Alonso, J. Souto, J. A. De Saja, Thermal conductivity of physically crosslinked closed cell polyolefin foams, Polymer Testing, 16(3), 287–298, (1997)
23 G. W. Ball, Proceedings IOM Polyurethanes Conf, 10, 257, (1994)
24 A. Cunningham, D. Sparrow, Rigid polyurethane foam: What makes it the most effective insulant?, Cellular polymers, 5(5), 327–342, (1986)
25 C. J. Tseng, M. Yamaguchi, T. Ohmori, Thermal conductivity of polyurethane foams from room temperature to 20 K, Cryogenics, 37 (6), 305–312, (1997)
26 O. A. Almanza, M. A. Rodríguez‐Pérez, J. A. De Saja, Prediction of the radiation term in the thermal conductivity of crosslinked closed cell polyolefin foams, Journal of Polymer Science Part B: Polymer Physics, 38(7), 993–1004, (2000)
27 S. Pardo‐Alonso, E. Solórzano, L. Brabant, P. Vanderniepen, M. Dierick, L. Van Hoorebeke, (3d) Analysis of the Progressive Modification of the Cellular Architecture in Polyurethane Nanocomposite Foams via X‐Ray Microtomography, European Polymer Journal, 49(5), 999‐1006, (2013)
28 R. Siegel; J. R. Howell, In Thermal Radiation Heat Transfer; Taylor & Francis: London, (1992)
29 S. Pavlidou, C.D. Papaspyrides, A review on polymer–layered silicate nanocomposites, Progress in polymer science, 33(12), 1119–1198, (2008)
30 D. Baillis, M. Arduini‐Schuster, J. F. Sacadura, Identification of spectral radiative properties of polyurethane foam from hemispherical and bi‐directional transmittance and reflectance measurements, Journal of Quantitative Spectroscopy and Radiative Transfer, 73(2), 297‐306, (2002)
31 R. Leppkes, Polyurethanes, material with many faces, Verlag Moderne Industrie AG; 4th edition, (2004)
32 R. Herrington, K. Hock, Flexible Polyurethane Foams, 2nd Ed., The Dow Chem Company, (1998)
33 S. S. Narine, X. Kong, L. Bouzidi, P. Sporns, Physical properties of polyurethanes produced from polyols from seed oils: I. Elastomers, Journal of the American Oil Chemists' Society, 84(1), 55‐63, (2007)
Chapter 2: Background and State of the Art
| 64
34 D. Niyogi, R. Kumar, K. S. Gandhi, Water blown free rise polyurethane foams, Polymer Engineering & Science, 39(1), 199‐209, (1999)
35 S. A. Baser, D. V. Khakhar, Modeling of the Dynamics of Water and R‐11 blown polyurethane foam formation, Polymer Engineering & Science, 34(8), 642‐649, (1994)
36 M. Modesti, A. Lorenzetti, An experimental method for evaluating isocyanate conversion and trimer formation in polyisocyanate–polyurethane foams, European polymer journal, 37(5), 949‐954, (2001)
37 K. C. Frisch, V. Sendijarevic et al., Proceeding of Polyurethane World Congress 1991, Nice, p. 850‐5, (1991)
38 C. Chittolini, Proceeding of Polyurethane World Congress 1997, Amsterdam, p. 655‐9, (1997)
39 T. Widya, C. W. Macosko, Nanoclay‐modified rigid polyurethane foam. Journal of Macromolecular Science, Part B: Physics, 44(6), 897–908, (2005)
40 D. Gerber, J. R. Derluyn, E. Huygens, U.S. Patent No. 5,521,225, Washington, DC: U.S. Patent and Trademark Office, (1996)
41 M. Modesti, A. Lorenzetti, S. Besco, Influence of nanofillers on thermal insulating properties of polyurethane nanocomposites foams, Polymer Engineering & Science, 47(9), 1351‐1358, (2007)
42 Y. H. Kim, S. J. Choi, J. M. Kim, M. S. Han, W. N. Kim, K. T. Bang, Effects of organoclay on the thermal insulating properties of rigid polyurethane foams blown by environmentally friendly blowing agents, Macromolecular Research, 15(7), 676‐681, (2007)
43 M. Thirumal, D. Khastgir, N. K. Singha, B. S. Manjunath, Y. P. Naik, Effect of foam density on the properties of water blown rigid polyurethane foam, Journal of Applied Polymer Science, 108(3), 1810‐1817, (2008)
44 S. N. Singh, Blowing agents for polyurethane foams (Vol. 12), iSmithers Rapra Publishing, (2002)
45 G. Harikrishnan, C. I. Lindsay, M. A. Arunagirinathan, C. W. Macosko, Probing Nanodispersions of Clays for Reactive Foaming, ACS applied materials & interfaces, 1(9), 1913‐1918, (2009)
46 X. Cao, L. J. Lee, T. Widya, C. Macosko, Polyurethane/clay nanocomposites foams: processing, structure and properties, Polymer, 46(3), 775‐783, (2005)
47 G. Harikrishnan, T. U. Patro, D. V. Khakhar, Polyurethane foam‐clay nanocomposites: nanoclays as cell openers, Industrial & Engineering Chemistry Research, 45(21), 7126‐7134, (2006)
48 S. Lee, et al., Zero Ozone‐Depleting Foaming Agent Technology for Extruded Polystyrene Foam, FOAMS 2009 Conference, Iselin, NJ (2009)
49 Costeux, Foams 2010 conference paper, (2010)
50 http://www.ipcc.ch/publications_and_data/ar4/wg1/en/tssts‐2‐5.html

Chapter 2: Background and State of the Art
| 65
51 DEFRA, Disposing of fridges and refrigeration equipment, Department for Environment, Food and and Rural Affairs (UK) (2003)
52 T. Herrera, GE to cut manufacturing plant’s emissions by 80%, GreenBiz.com (2011). http://www.greenbiz.com/news/2011/04/29/ge‐cut‐manufacturingplants‐emissions‐80‐percent?utm_source¼GreenBuzz&utm_campaign¼a0c54d5a62‐GreenBuzz‐2011‐05‐02&utm_medium¼email
53 EPA., Substitutes in rigid polyurethane, Appliance (2009). http://www.epa.gov/ozone/snap/foams/lists/applianc.html (Washington DC)
54 R. Fleischer, Advances in environmentally sustainable refrigerants and blowing agents, 5th International conference on Energy Efficiency in Domestic Appliances and Lighting (EEDAL’09), http://www.eedal.eu/index.php?id¼11575, Berlin, June 16e18, (2009)
55 B. Chen, J. Costa, P. Bonnet, M. Elsheikh, L. Abbas, Investigation of low GWP blowing agents, Appliance Magazine, January 2009, http://www.applianceMagazine.com (2009)
56 C. V. Vo, R. T. Fox, Assessment of Unsaturated Fluorocarbons as Insulating Blowing Agents For Extruded Polystyrene Foams, Foams 2012 conference paper, (2012)
57 Formacel. http://www2.dupont.com/Formacel/en_US/index.html (2011)
58 http://www.epa.gov/ozone/snap/foams/lists/comm.html
59 C. Torres‐Sánchez, J. Corney, Identification of formation stages in a polymeric foam customised by sonication via electrical resistivity measurements, Journal of Polymer Research, 16(5), 461‐470, (2009)
60 D. Niyogi, R. Kumar, K. S. Gandhi, Water blown free rise polyurethane foams, Polymer Engineering & Science, 39(1), 199‐209, (1999)
61 G. Woods, The ICI Polyurethanes Book, 2nd ed., Wiley, New York, p. 1, (1990)
62 Z. Wirpsza, Polyurethanes: Chemistry, Technology, and Applications, Ellis Horwood, New York, p. 3, (1993)
63 W. D. Callister, D. G. Rethwisch, Fundamentals of Materials Science and Engineering: An Integrated Approach, 3rd Edition, pp. 111, 561‐563, (2008)
64 H.R.N. Jones, In Radiation Heat Transfer, Oxford Science: Oxford, (2000)
65 D. Baillis, J.F. Sacadura, Thermal radiation properties of dispersed media: theoretical prediction and experimental characterization, Journal of Quantitative Spectroscopy and Radiative Transfer, 67(5), 327–363, (2000)
66 J. W. Wu, W. F. Sung, H.S. Chu, Thermal conductivity of polyurethane foams, International journal of heat and mass transfer, 42 (12), 2211–2217, (1999)
67 A. Usuki, M. Kawasumi, Y. Kojima, A. Okada, T. Kurauchi, O. J. Kamigaito, Swelling Behavior of Montmorillonite Cation Exchanged for V‐amino Acids by E‐caprolactam, Journal of Materials Research, 8 (5): 1174, (1993)

Chapter 2: Background and State of the Art
| 66
68 C. O. Oriakhi, Nano Sandwiches, Chemistry in Britain , 34(11), 59–62, (1998)
69 L. J. Lee, C. Zeng, X. Cao, X. Han, J. Shen, G. Xu, Polymer nanocomposite foams, Composites Science and Technology, 65(15–16), 2344‐2363, (2005)
70 R. Verdejo, C. Saiz‐Arroyo, J. Carretero‐Gonzalez, F. Barroso‐Bujans, M.A. Rodriguez‐Perez, M.A. Lopez‐Manchado, Physical properties of silicone foams filled with carbon nanotubes and functionalized graphene sheets, European Polymer Journal 44(9), 2790–2797 (2008)
71 J.I. Velasco, M. Ardanuy, V. Realinho, M.Antunes, A.I. Fernández, J.I. González‐Peña, M.A. Rodríguez‐Pérez, J.A. de Saja, Polypropylene/clay nanocomposites: combined effects of clay treatment and compatibilizer polymers on the structure and properties, Journal of Applied Polymer Science 102(2), 1213‐1223 (2006)
72 W. Zheng, S. C. Wong, Electrical conductivity and dielectric properties of PMMA/expanded graphite composites, Composites Science and Technology, 63(2), 225‐235, (2003)
73 M. Modesti, A. Lorenzetti, S. Besco, D. Hrelja, S. Semenzato, R. Bertani, R. A. Michelin, Synergism between flame retardant and modified layered silicate on thermal stability and fire behaviour of polyurethane nanocomposite foams, Polymer Degradation and Stability, 93(12), 2166‐2171, (2008)
74 Y. Kojima, A. Usuki, M. Kawasumi, A. Okada, Y. Fukushima, T. Kurauchi, O. J. Kamigaito, Mechanical properties of nylon 6‐clay hybrid, Journal of Materials Research, 8(05), 1185. (1993)
75 S. X. Zhou, L. M. Wu, J. Sun, W. D. Shen, Effect of nanosilica on the properties of polyester‐based polyurethane, Journal of Applied Polymer Science, 88(1), 189–193 (2003)
76 E. Manias, A. Touny, L. Wu, K. Strawhecker, B. Lu, T. C. Chung, Polypropylene/ montmorillonite nanocomposites, Review of the synthetic routes and materials properties, Chemistry of Materials, 13(10), 3516–23, (2001)
77 I. J. Chin, T. Thurn‐Albrecht, H. C. Kim, T. P. Russell, J. Wang, On exfoliation of montmorillonite in epoxy, Polymer, 42(13), 5947–52, (2001)
78 M. Alexandre, P. Dubois , Polymer–layered silicate nanocomposites: preparation, properties and uses of a new class of materials, Materials Science and Engineering: R: Reports, 28(1), 1–63, (2000)
79 G. Bhat, R. H. Hegde, M. G. Kamath, B. Deshpande, Nanoclay Reinforced Fibers and Nonwovens, Journal of Engineered Fibers and Fabrics, 3(3), 22‐34 (2008)
80 R. A. Vaia, S. Vasudevan, W. Krawiec, L. G. Scanlon, E. P. Giannelis, New polymer electrolyte nanocomposites: Melt intercalation of poly (ethylene oxide) in mica‐type silicates, Advanced Materials, 7(2), 154‐156, (1995)
81 F. Chivrac, E. Pollet, L. Avérous, Progress in nano‐biocomposites based on polysaccharides and nanoclays, Materials Science and Engineering: R: Reports, 67 (1), 1‐17, (2009)
82 J.C. Dai, J.T. Huang, Surface modification of clays and clay–rubber composite, Applied Clay Science, 15(1), 51–65, (1999)

Chapter 2: Background and State of the Art
| 67
83 Y. Ke, J. Lü , X. Yi, J. Zhao, Z. Qi, The effects of promoter and curing process on exfoliation behavior of epoxy/clay nanocomposites, Journal of Applied Polymer Science, 78(4), 808–815, (2000)
84 H.R. Fischer, L.H. Gielgens, T.P.M. Koster, Nanocomposites from polymers and layered minerals, Acta Polymerica, 50 (4), 122–126, (1999)
85 X. Kornmann, H. Lindberg, L. A. Berglund, Synthesis of epoxy–clay nanocomposites: influence of the nature of the clay on structure, Polymer, 42(4), 1303–10, (2001)
86 E. P. Giannelis, Polymer layered silicate nanocomposites, Advanced Materials, 8 (1), 29–35, (1996)
87 C. M. Kim, D. H. Lee, B. Hoffmann, J. Kressler, G. Stoppelmann, Influence of nanofillers on the deformation process in layered silicate/polyamide 12 nanocomposites, Polymer, 42(3), 1095–100, (2001)
88 A. S. Zerda, A. J. Lesser, Intercalated clay nanocomposites: morphology, mechanics and fracture behaviour, Journal of Polymer Science Part B: Polymer Physics, 39(11), 1137–46, (2001)
89 H. Fischer, Polymer nanocomposites: from fundamental research to specific applications, Materials Science and Engineering: C, 23(6), 763–72, (2003)
90 J. C. Huang, Z. K. Zhu, J. Yin, X. F. Qian, Y. Y. Sun, Poly(etherimide)/montmorillonite nanocomposites prepared by melt intercalation: morphology, solvent resistance properties and thermal properties, Polymer, 42(3), 873–7, (2001)
91 R. A. Vaia, E. P. Giannelis, Lattice model of polymer melt intercalation in organically‐modified layered silicates, Macromolecules, 30(25), 7990‐7999, (1997)
92 H. Bahrambeygi, A. Rabbi, K. Nasouri, A. M. Shoushtari, M. R. Babaei, Morphological and structural developments in nanoparticles polyurethane foam nanocomposite's synthesis and their effects on mechanical properties, Advances in Polymer Technology, 32(S1), E545–E555, (2012)
93 Ł. Piszczyk, M. Strankowski, M. Danowska, J. T. Haponiuk, M. Gazda, Preparation and characterization of rigid polyurethane‐polyglycerol nanocomposite foams, European Polymer Journal, 48(10), 1726‐1733, (2012)
94 Z. Xu, X. Tang, A. Gu, Z. Fang, Novel preparation and mechanical properties of rigid polyurethane foam/organoclay nanocomposites, Journal of Applied Polymer Science, 106(1), 439‐447, (2007)
95 J. Y. Lee, H. K. Lee, Characterization of organobentonite used for polymer nanocomposites, Materials Chemistry and Physics, 85(2), 410‐415, (2004)
96 D. García‐López, I. Gobernado‐Mitre, J. F. Fernández, J. C. Merino, J. M. Pastor, Influence of clay modification process in PA6‐layered silicate nanocomposite properties, Polymer, 46(8), 2758‐2765, (2005)
97 K. Liang, ShQ. Shi, Nanoclay filled soy‐based polyurethane foam, Journal of Applied Polymer Science, 119(3):1857–63, (2011)

Chapter 2: Background and State of the Art
| 68
98 U.S. Environmental Protection Agency (www.epa.gov), Federal Register, Vol. 65, No. 243, Rules and Regulations, page 78980, December 18 , (2000)
99 M. Modesti, A. Lorenzetti, C. Dall'Acqua, New experimental method for determination of effective diffusion coefficient of blowing agents in polyurethane foams, Polymer Engineering & Science, 44(12), 2229‐2239, (2004)
100 J. Njuguna, S. Michałowski, K. Pielichowski, K. Kayvantash, A. C. Walton, Fabrication, characterization and low‐velocity impact testing of hybrid sandwich composites with polyurethane/layered silicate foam cores, Polymer Composites, 32 (1), 6–13, (2011)
101 M. Danowska, Ł. Piszczyk, M. Strankowski, M. Gazda, J. T. Haponiuk, Rigid polyurethane foams modified with selected layered silicate nanofillers, Journal of Applied Polymer Science, 130(4), 2272‐2281, (2013)
102 A. Lorenzetti, D. Hrelja, S. Besco, M. Roso, M. Modesti, Improvement of nanoclays dispersion through microwave processing in polyurethane rigid nanocomposite foams, Journal of Applied Polymer Science, 115(6), 3667‐3674, (2010)
103 S. Pardo‐Alonso, E. Solórzano, M. A. Rodriguez‐Perez, Time‐resolved x‐ray imaging of nanofiller‐polyurethane reactive foam systems, Colloids and Surfaces A: Physicochemical and Engineering Aspects, 438, 119‐125, (2013)
104 I. Rhoney, S. Brown, N. E. Hudson, R. A. Pethrick, Influence of processing method on the exfoliation process for organically modified clay systems. I. Polyurethanes, Journal of applied polymer science, 91(2), 1335‐1343 (2004)
105 L. Madaleno, R. Pyrz, A. Crosky, L. R. Jensen, J. C. Rauhe, V. Dolomanova, J. Norman, Processing and characterization of polyurethane nanocomposite foam reinforced with montmorillonite‐carbon nanotube hybrids, Composites Part A: Applied Science and Manufacturing, 44, 1‐7, (2012)
106 R. Gu, M. M. Sain, Effects of Wood Fiber and Microclay on the Performance of Soy Based Polyurethane Foams, Journal of Polymers and the Environment, 21(1), 30‐38, (2013)
107 M. Zhu, S. Bandyopadhyay‐Ghosh, M. Khazabi, H. Cai, C. Correa, M. Sain, Reinforcement of soy polyol‐based rigid polyurethane foams by cellulose microfibers and nanoclays, Journal of Applied Polymer Science, 124(6), 4702‐4710, (2012)
108 T. U. Patro, G. Harikrishnan, A. Misra, D. V. Khakhar, Formation and characterization of polyurethane—vermiculite clay nanocomposite foams, Polymer Engineering Science, 48(9), 1778–1784, (2008)
109 P. Mondal, D. V. Khakhar, Rigid polyurethane–clay nanocomposite foams: Preparation and properties, Journal of Applied Polymer Science, 103(5), 2802‐2809, (2007).
110 P. C. Ma, N. A. Siddiqui, G. Marom, J. K. Kim, Dispersion and functionalization of carbon nanotubes for polymer‐based nanocomposites: A review, Composites Part A: Applied Science and Manufacturing, 41(10), 1345‐1367, (2010)
111 M.A. Rodríguez‐Pérez, J. I. González‐Peña, N. Witten, J.A. de Saja, The effect of cell size on the physical properties of crosslinked closed cell polyethylene foams produced by a high pressure nitrogen solution process, Cellular polymers, 21(3), 165‐194. (2002)

Chapter 2: Background and State of the Art
| 69
112 S. H. Kim, M. C. Lee, H. D. Kim, H. C. Park, H. M. Jeong, K. S. Yoon, B. K. Kim, Nanoclay reinforced rigid polyurethane foams, Journal of Applied Polymer Science, 117(4), 1992‐1997, (2010)


CHAPTER 3:
MATERIALS AND CHARACTERISATION TECHNIQUES


| 73
3. MATERIALS AND CHARACTERISATION TECHNIQUES
This chapter summarizes the selected materials for this thesis, the facilities employed for
the production and characterisation of the foams and the specific methodologies used for
producing and characterising the materials.
3.1. Materials
3.1.1. Polyurethane
Three different formulations of rigid polyurethane foam supplied by the industrial
partners BASF (1 formulation) and Recticel (2 formulations) were employed in this thesis. The
selection of these materials was conditioned by the NanCore project (see introduction chapter,
point 1.1: Motivations). The aim of this project was developing a microcellular nanocomposite
for substitution of Balsa wood and PVC core material. Because of this, the selection was
restricted to low densities and good initial mechanical properties (i.e. stiffness and strength)
for a given density.
TABLE 3.1. Main characteristic of the different polyurethane formulations employed in this research
Commercial name
Normal
density in
free foaming
(Kg/m3)
Pol./ Iso.
ratio (in
weigth)
Polyol
viscosity
(mPA.s)
Type of
polyol
Isocyanate
type
BASF (LV)
Polyol: Elastopor* H
1501/2
Isocyanate: IsoPMDI
92140
52 100/160 650
Poly‐
ether
polyol
MDI
Recticel low
viscosity
(MV)
‐ 120 100/74 1000 ‐ MDI
Recticel high
viscosity
(HV)
‐ 50 100/196 100000 ‐ MDI
BASF formulation was a commercial formulation, however Recticel formulations were
specifically designed for the project, as the company Recticel was a partner of NanCore.
Nominal density of BASF product is 52 Kg/m3, whereas Recticel materials have densities of 50

Chapter 3: Materials And Characterisation Techniques
| 74
and 120 Kg/m3. One important aspect taken into account in the selection of the formulations
was the polyol viscosity. Three different levels were selected.
All the employed blends were methylene diphenyl diisocyanate type (MDI) and the foam
was produced using water as blowing agent. Some of the main features of the different
formulations are shown in table 3.1, where the short name (related with the formulation
viscosity) that will be employed in the following sections is indicated. As it is shown in this
table the viscosity of the polyol of the different formulations varies from 650 to 100.000
mPA∙s, a wide range of values that will enable to observe a variety of behaviours as a function
of the dispersion technique employed.
3.1.2. Nanoclays
Cloisite 30b nanoclays were selected for this research. This is a natural
montmorillonite modified with a quaternary ammonium salt, purchased from Southern Clay
Products. These nanoclays are conventionally employed to improve various physical properties
of polymers, such as stiffness, strength, heat distortion temperature, linear thermal expansion
coefficient and barrier properties. Table 3.2 shows the main characteristics of this product
measured by the manufacturer.
TABLE 3.2. Main characteristics supplied by the material producer.
Moisture < 3%
Typical Dry Particle Size < 10 µm (d50)
Color Off White
Packed Bulk Density 365 g/l
Density 1.98 g/cm3
X‐Ray Results
(Interlamellar spacing) d001 = 1.85 nm
Two reason were taken into account in the selection of this type of clays: the manufacturer
recommendations and, as it has been shown in the state of the art section (section 2.4), their use in
previous articles on polyurethane foams infused with nanoclays. In the mentioned section, it is

Chapter 3: Materials And Characterisation Techniques
| 75
possible to observe how this type of nanoclays has produced an improvement in some characteristics
of polyurethane foams, such as cellular structure or thermal conductivity.
3.1.3. Foams production
Reactive foaming was used to produce the foams. This technique consists in the mixing of the
two reactive products that generate the final polyurethane foam. Some important details were
learned during this stage of the work:
Pre‐mixing of the polyol component is highly recommended: as polyol usually includes
a variety of components (see Background and state of the art section, 2.2.1.
Chemistry of the polyurethane section) with different densities, a reduction of
homogeneity can be produced over time. Usually, 90 second of premixing at 1200
rpm is enough to recover homogeneity of polyol, but this depends on the viscosity of
polyol and on the possible formation of separated solid phases at the bottom of the
cups used for mixing.
Reactives temperature: As the chemical reactions produced during polyurethane
polymerization/foaming are highly dependent on the temperature, it is also highly
recommended to use the polyol and the isocyanate at a constant temperature in
order to improve the reproducibility in the foams production. Otherwise, different
room temperature can produce changes in the structure and properties of produced
foams.
Polyol‐isocyanate mixing tools: IKA Eurostar Power control‐visc P1 (Fig. 3.1.a), and
Lenart Disc (Fig. 3.1.b) were selected due to the recommendation of different groups
which had previously worked in polyurethane foams field. The use of the Lenart Disc
must be matched to the use of a plastic, cylindrical shaped container to proceed to
polyol‐isocyanate mixing: thereby a more active mixing of both components is
produced.
Mixing tools must be cleaned completely immediately after foam production, other
way after the polymerization of the polyurethane it is much harder to clean the tools.
Acetone was employed for this purpose, submerging the mixing tools under it for
around 30 seconds.
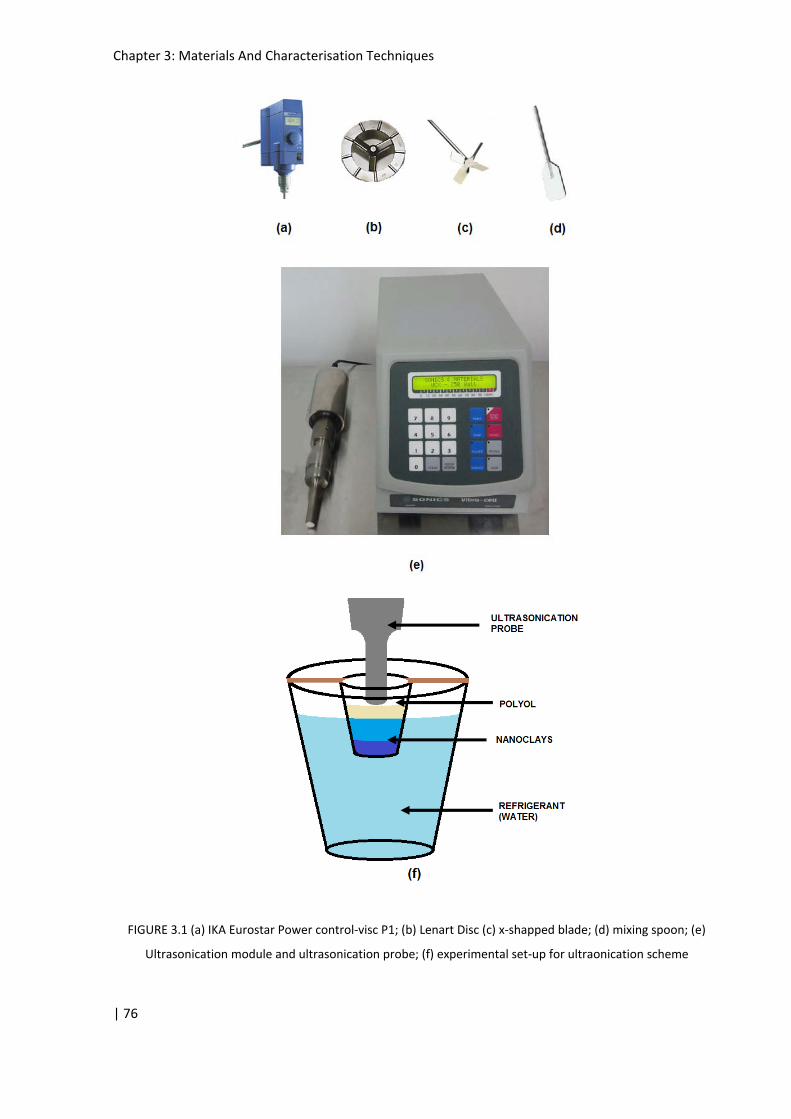
Chapter 3: Materials And Characterisation Techniques
| 76
FIGURE 3.1 (a) IKA Eurostar Power control‐visc P1; (b) Lenart Disc (c) x‐shapped blade; (d) mixing spoon; (e)
Ultrasonication module and ultrasonication probe; (f) experimental set‐up for ultraonication scheme

Chapter 3: Materials And Characterisation Techniques
| 77
For the production of foams using BASF formulation, polyol and isocyanate were mixed at 1200
rpm for 15 seconds in a plastic container. Immediately afterwards this mixture was transferred to a
paper mould in which the reaction and the foaming process was completed.
For the production of nanoclays infused polyurethane foams, an extra step is required previous
to isocyanate‐polyol mixing: the nanoclays dispersion into one of these reagents. This step has
supposed the learning of some details:
Dispersion of nanoclays must be done in the polyol: high reactivity of isocyanate
justifies this selection, as isocyanate is very reactive toward active hydrogen containing
compounds. Thereby, nanoparticles were dispersed in polyol component to avoid
possible secondary reactions between fillers and the dispersing medium during the
nanoclays dispersion. This is a critical point for ultrasonication, as an increase of
temperature in the components is produced during the use of this technique.
Nanoclays must be dehydrated previous to their dispersion: in order to avoid any
moisture, nanoclays were dehydrated overnight in a vacuum oven. Similar treatment
was observed in related literature. The motivation of this procedure is the high
reactivity of isocyanate with water, described in the background section. Some
previous tests showed a decrease in density of foams when in non‐dehydrated
nanoclays were used: the presence of water in this component should act as foaming
agent.
No compensation of the amount of isocyanate was required: although the
funcionalization of the nanoclays introduces an extra amount of hydroxyl groups (very
reactive with isocyanate, see background section), it is not required an increase in the
amount of isocyanate included. Some tests were performed to confirm this. The use of
an extra amount of isocyanate only produced an increase of the foam density with
respect to the material with a standard isocyanate amount, without any considerable
change in any of the mechanical or structural properties.
The main characteristics (mixing tool, mixing time and mixing speed) of the dispersion
techniques employed to introduce the nanoparticles are shown in Table 3.3. As it has been
commented, the dispersion was always performed in polyol. Other characteristics of these techniques
are showed below:
Hand mixing technique has the lower dispersion quality potential and was employed
due to the high sensitivity of the BASF polyol to the dispersion technique employed. For

Chapter 3: Materials And Characterisation Techniques
| 78
this purpose, a spoon (Fig. 3.1.(d)) was employed with the objective to obtain at least
an apparent good dispersion, trying to eliminate any kind of solid residues in the polyol‐
nanoclays mixture.
TABLE 3.3. Main characteristics of the dispersion techniques employed.
Low shear mixing employs an x‐shape mixing head (Fig. 3.1.c) that is rotated at low
speed (200 rpm) for 120 seconds. A macroscopic good distribution and dispersion of
the nanoclays in the polyol was produced (from visual examination), obtaining a polyol‐
nanoclays mixture where it was not possible to appreciate rest of isolated, macroscopic
nanoclays clusters.
Ultrasonication was performed with Sonics Vibra‐Cell VCX 750 (Fig. 3.1.a), composed by
two parts: the ultrasounds generator and the tip horn. This technique is based in the
production of high frequency vibrations (20 KHz) that interact with the nanoclays
agglomerates producing their separation. In order to optimize the ultrasonication
technique, hand premixing of nanoclays in all polyol volume was performed prior to
ultrasonication. Due to the high energy transferred from the ultrasonication tip to the
polyol‐nanoclays mixture, this technique produces an increase of the temperature. This
increase can affect polyol and its additives, in particular catalyst and foaming agent;
Dispersión technique Mixing tool Mixing time
(s)
Mixing speed
(rpm) Other characteristics
Hand Mixing (HM) Spoon (Fig. 3.1.d) ~30 30 ‐
Low shear mixing (LS)
IKA Eurostar Power
control‐visc P1,
equipped with a 4‐
bladed propeller stirrer
(Fig. 3.1.c)
120 200 ‐
Ultra‐sonication (US)
Sonics Vibra‐Cell VCX
750 (Fig. 3.1.e), 20 KHz,
cycles of 3 seconds of
sonication, 2 seconds
between cylce
1500 ‐
Hand premixing of
nanoclays in the
polyol component for
a better
ultrasonication

Chapter 3: Materials And Characterisation Techniques
| 79
therefore a good control of the temperature is required. For this reason, a water bath
at a temperature of 25°C was employed during ultrasonication, avoiding the over‐
heating of the polyol‐nanoclays mixture (Fig. 3.1.e). Furthermore, different test showed
that cycles of 3 second of ultrasonication with 2 seconds between cycles was the best
way to obtain an appropriate dispersion, avoiding at the same time polyol overheating.
To produce the nanoclays infused polyurethane foams, the next steps were carried out
(Fig. 3.2):
1. The exact amount of nanoclays for a given concentration in the final foam was
weighted in a plastic container. Then the exact amount of polyol was added.
2. Then nanoclays were dispersed in the polyol, using one of the different
dispersion techniques previously mentioned (table 3), trying to obtain an
optimal apparent dispersion.
FIGURE 3.2 Foams manufacture scheme
3. After that, the precise amount of isocyanate was added, in order to have a
ratio of 100:160 between polyol and isocyanate (BASF polyurethane, see table
1)
NANOCAYS
AFTER
DRYING
MIXING AT THE RIGTH
PROPORTION
POLYOL/ISOCYANATE
‐ HAND MIXING
‐ LOW SHEAR MIXING
‐ ULTRASONICATION
1200 rpm, 15 s

Chapter 3: Materials And Characterisation Techniques
| 80
4. Components were mixed at 1200 rpm for 15 seconds with an IKA Eurostar
mixer, equipped with a Lenart Disc (Fig. 3.1.b).
5. The mixed liquids were poured for foaming into a paper mould with
dimensions 110x110x80 mm3 in the case of samples for the dispersion quality
study, and 310x250x60 mm3 in the case of samples for the different nanoclays
concentrations study. Different mould sizes was selected taking into account
the final dimensions needed for testing. For other polyurethane formulations
(Table 3.1) the same procedure was used modifying the polyol/isocyanate
ratio following the indications of table 3.1.
FIGURE 3.3 Final foam sample and the axis orientation considered in the present work (y direction
corresponds to the growing direction)
3.1.4. Samples preparation
After the foaming and curing process (at least 48 hours at room temperature), samples
were cut from the main blocks to proper characterize them, removing any remaining skin in a
first. The cutting process is described in Fig. 3.4 and Fig. 3.5 (for both moulds sizes employed,
see previous section) and two different steps are represented. On Fig. 3.4.b it is shown the first
cut for the first type of mould, zone number 1 (a parallelepiped with a 5x5 cm2 basis) was cut
on further step (Fig3.4.c, a variable amount of material was removed in the vertical direction in
order to obtain a perfect cube of 5x5x5 cm3) for mechanical compression study. Zones 2, 3, 4
and 5, with a variable thickness depending on the amount of material eliminated in the
moment of removing the skin, were employed for the different characterization experiments.
x
y
z

Chapter 3: Materials And Characterisation Techniques
| 81
FIGURE 3.4. Cutting scheme for dispersion techniques study (y is the foaming direction): (a) Initial foam
(b) First cut (c) Second cut.
FIGURE 3.5. Cutting scheme for nanoclays concentrations study (y is the foaming direction): (a) Initial
foam (b) First cut (c) Second cut.
Fig. 3.5.b shows the first cut for the second type of mould, specific for thermal
properties measurements. Zone number 1 (a parallelepiped with a 20x20 cm2 basis) was cut on
x
y
z
x
y
z

Chapter 3: Materials And Characterisation Techniques
| 82
further step (Fig3.5.c, a variable amount of material was removed in the vertical direction in
order to obtain a parallelepiped of 20x20x2 cm3) for thermal conductivity study. Zones 2, 3, 4
and 5, with variable dimensions, were employed for the different characterization
experiments. Previous to this characterization any remaining skin was removed.
3.2. Macroscopic Techniques
3.2.1. Rheology
Rheology has been used previously as a complementary technique to probe the state of
dispersion, at least in a qualitative way1‐4. Recently, rheological methods have been extended
to be used in a more quantitative way5, 6. In the present work, rheological measurements were
performed on the polyol‐nanoclays mixtures with the aim of characterising dispersion quality,
trying to clarify the effect of the different dispersion techniques over different types of polyol.
Sample preparation protocol was as follows: nanoclays were dehydrated over night with the
objective to eliminate any moisture, then the precise amount of polyol was added and finally a
different dispersion process was carried out, as it is indicated in table 3.3.
FIGURE 3.6 Rheology facilities: a) Ares G2; b) APS
These experiments were carried out on a strain‐controlled rheometer (Fig. 3.6.a, ARES‐
G2, TA Instruments) equipped with a cone and plate geometry (diameter 50 mm, angle 0.02
rad). Temperature was controlled with an APS (Advanced Peltier System, Fig. 3.6.b) and
maintained at 23ºC. To avoid effects of loading and sample history, a fixed preshear protocol
was adopted. This protocol consists of continuously shearing at 1 s‐1 for 5 minutes and an
equilibration of 1500 s, after which the rheological test was performed. No significant increase

Chapter 3: Materials And Characterisation Techniques
| 83
in the dynamic moduli was seen after this equilibration period. Dispersion quality was analysed
by applying small sinusoidal shear strains to the sample in the linear viscoelastic regime. In this
regime, a fingerprint of the microstructure of the sample is obtained by slightly perturbing the
microstructure without disturbing it. A sinusoidal strain ε with angular frequency will results in
a sinusoidal shear stress σ with the same frequency, but with a different phase lag δ (Fig. 3.7).
FIGURE 3.7.‐ Relationship between strain (g) , stress (s) and time
The constant of proportionality is the complex shear modulus G* (Eq. 1 and 2).
*G (1)
´´´* iGGG (2)
The storage or elastic modulus G’ represents the in‐phase part of the stress and describes
the solid‐like response of the material, the storage of elastic energy. The loss or viscous
modulus G’’ represents the out‐phase part of the stress and characterizes the liquid‐like
behaviour of the material, the viscous dissipation.
Similarly, the complex viscosity η* (Eq. 3) is defined as the constant of proportionality
between the shear stress s and the shear rate ġ (Eq. 4). In this representation, η’ represents
the viscous response and η’’ represents the elastic response.
´´´* i (3)
* (4)
The frequency dependent moduli were measured between 0.01 and 100 rad s‐1 in the
linear regime where the moduli are independent of the strain amplitude g0. Both particle
concentration and dispersion quality of the particles are known to affect the dynamic moduli
G’ and G’’ as a function of frequency. The linear viscoelastic properties of nanoclay‐polyol

Chapter 3: Materials And Characterisation Techniques
| 84
dispersions can be employed to determine the response of a formulation to the dispersion
protocol.
FIGURE 3.8 Linear viscoelastic properties as a function of frequency for a PMDS matrix filled with different amounts of silica nanoparticles¡Error! Marcador no definido.. (a) Storage moduli (b) Loss moduli
FIGURE 3.9.‐ Winter Plot for different concentrations and dispersion techniques. The quality of the
dispersion can be related with the change in the slope, for a fixed concentration.
The effect of particle concentration and dispersion quality can be interpreted as an
increase in the effective volume fraction of the particles in the polymer matrix as particle
(weight) concentration and dispersion quality rises. As the effective volume fraction of the
particles increases, either by the addition of particles or by either at fixed concentration
increasing the dispersion quality, a percolating network can be formed, indicated by a plateau
in the low frequent moduli, characteristic for solid like materials. At high frequencies, the
Plateu at low frequencies

Chapter 3: Materials And Characterisation Techniques
| 85
matrix contribution dominates the response in the loss modulus G’’. The particles deform the
interstitial matrix leading to increase dissipation. The high frequency dependent response of
G’’ of the dispersions becomes parallel to the response of the matrix material. Both low
frequency as well as high frequency moduli can be used to quantify dispersion quality5, 6.
Fig.3.8 shows these changes in the rheological behaviour for silanized silica nanoparticles
(SiO2) dispersed in a polydimethylsiloxane matrix (PDMS)
To determine which material is the most sensitive to changes in the preparation
procedure, the so‐called Winter‐plot can be used7, 8, which allows a rapid and straightforward
comparison between different materials at a fixed concentration. In this plot, the modulus of
the complex viscosity |h*| is plotted versus the modulus of the complex shear modulus |G*|
(See Fig. 3.9). Winter, 2009 7 showed, by the rearrangement of the Cox‐Merz rule, the
equivalency of complex modulus in oscillatory experiments and the shear stress in steady
shear flow, which is very sensitive parameter to the material microstructure5. For a material
with a solid‐like behaviour (liquid with well dispersed particles) at low frequencies, the
complex viscosity will shoot up with decreasing complex modulus, which is in a normal
viscosity‐shear stress plot a clear indication of a yield stress5. This can be easily observed for
different concentrations and dispersion techniques in Fig. 3.9: for a fixed concentration a
greater change in the slope is observed for most powerful dispersion technique
(ultrasonication against mixing).
3.2.2. Density
Previous to density measurements, foamed samples were conditioned at 21±2 °C and
50% relative humidity for at least 48 h. Density measurements were performed in accordance
with ASTM D16229, as the quotient between mass and volume. Cubic samples were produced
in order to have a regular size which allowed an easy way to measure the volume. Samples
dimensions were measured with the help of a gauge tool, and samples mass was measured in
a precision balance model AT261 from Mettler Toledo (Fig. 3.10).

Chapter 3: Materials And Characterisation Techniques
| 86
FIGURE 3.10. Precision balance model AT261 from Mettler Toledo
3.2.3. Mechanical properties at low strain rates: compression, bending and torsion tests.
Compression and bending experiments at low strain rates and shear modulus
measurements were performed to characterize the mechanical behaviour (stiffness and
strength). Previous to mechanical characterisation, foamed samples were conditioned at 21±2
°C and 50% relative humidity for at least 48 h.
(a) (b)
FIGURE 3.11.‐ (a) Universal testing machine model 5500R6025 from Instrom; (b) Parallel plates system
employed for compression test

Chapter 3: Materials And Characterisation Techniques
| 87
For compression experiments, the stress (σ) strain (ε) curves were measured with an
Instron machine (model 5500R6025, Fig. 3.11.a) at room temperature and at a deformation
rate of 10 % min‐1, according to ASTM D162110, with a parallel plates system (Fig. 3.11.b).
Stress was applied in the foaming direction (y direction in Fig 3.3). The maximum static strain
was approximately 75% for all the experiments. Dimension of the samples was 50x50x50 mm3.
Two mechanical properties were obtained from these experiments, elastic modulus and
collapse strength.
A typical strain‐stress curve is shown in Fig. 3.12. The part of the curve before A point is
produced by small imperfections in the sample shape, that originate this behaviour prior to a
full contact between sample faces and universal testing machine plates. The slope of the initial
zone of the stress strain curve gives the elastic modulus (between A and B points). Collapse
strength was measured as the maximum of the curve (point C). No extensometers were
employed for these measurements.
FIGURE 3.12. Typical strain‐stress compression curve for a polyurethane foam with density of 50
kg/m3
The flexural properties were measured using an Instron universal testing machine (model
5500R6025, Fig. 3.11 (a)) under the three‐point loading scheme (Fig. 3.13), in accordance with
ISO 178:201011. Stress was applied in the foaming direction (y direction in Fig 3.3). Sample size
was 120 × 15 × 15 mm3. Stress (σ) strain (ε) curves were measured at 21±2 °C and 50% relative
humidity and at a deformation rate of 10 mm/min. Flexural modulus, flexural strength and
deformation at maximum strength (%) were obtained from these experiments.
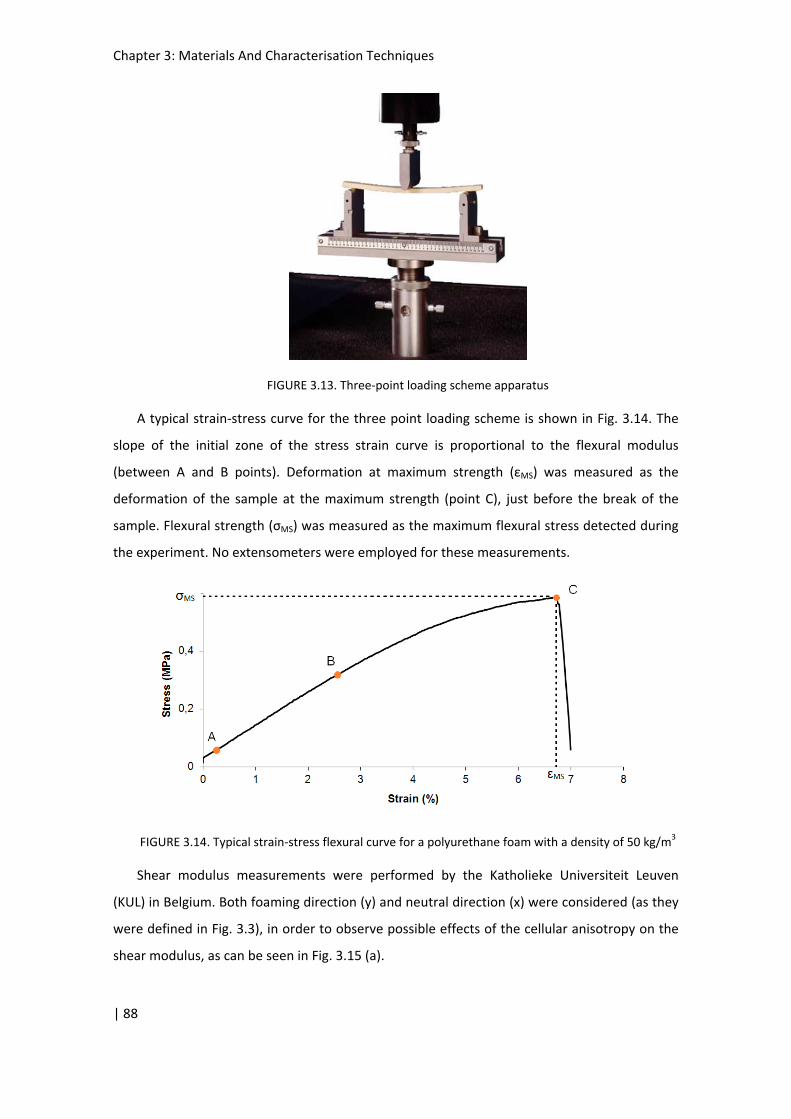
Chapter 3: Materials And Characterisation Techniques
| 88
FIGURE 3.13. Three‐point loading scheme apparatus
A typical strain‐stress curve for the three point loading scheme is shown in Fig. 3.14. The
slope of the initial zone of the stress strain curve is proportional to the flexural modulus
(between A and B points). Deformation at maximum strength (εMS) was measured as the
deformation of the sample at the maximum strength (point C), just before the break of the
sample. Flexural strength (σMS) was measured as the maximum flexural stress detected during
the experiment. No extensometers were employed for these measurements.
FIGURE 3.14. Typical strain‐stress flexural curve for a polyurethane foam with a density of 50 kg/m3
Shear modulus measurements were performed by the Katholieke Universiteit Leuven
(KUL) in Belgium. Both foaming direction (y) and neutral direction (x) were considered (as they
were defined in Fig. 3.3), in order to observe possible effects of the cellular anisotropy on the
shear modulus, as can be seen in Fig. 3.15 (a).

Chapter 3: Materials And Characterisation Techniques
| 89
FIGURE 3.15.‐ (a) Direction of the different cuts and cell anisotropy on them. (b) Support employed for
the measurements.
To perform these measurements, a torsion rectangular geometry was employed on
Ares‐melts rheometer (TA‐instrument, Fig. 3.15 (b)). Rectangular foam bars of 45x10x5 mm3
were clamped to a specific torque between two anvils with a torque screw driver (see Fig. 3.15
(b)). The sample is held in tension between the upper and lower tool. Sample dimensions are
measured with an accuracy of 0.01 mm with a vernier caliper.
Gl
JT T (5)
Shear modulus (G) emerge from generalized Hooke's law, and gives the relationship
between the torsion applied (T) and the deformation angle (θ), as it is shown in Eq. 5. Other
elements on this equation are JT which is the torsion constant of the section (depends on the
sample geometry and was calculated as it is shown in Fig. 3.16), and l which is the length of the
object that is being studied.
FIGURE 3.16.‐ Torsion constant for a solid rectangular section

Chapter 3: Materials And Characterisation Techniques
| 90
3.2.4. Dynamic Mechanical Analysis (DMA)
Dynamic mechanical analysis (DMA) is employed to measure the viscoelastic
properties of materials as a function of temperature, time and frequency when they are
subjected to a periodic stress. The types of materials that can be analyzed with this technique
include thermoplastics, thermosets, composites, elastomers, ceramics and metals. This
technique can be simply described as applying an oscillating force to a sample and analysing
the material response to that force (Fig. 3.7). For an applied stress varying sinusoidally with
time, a viscoelastic material will also respond with a sinusoidal strain for low amplitudes of
stress (Eq. 6 and 7, where ω is frequency of strain oscillation, t is time and δ is phase lag
between stress and strain).
The strain (ε) of a viscoelastic body is out of phase with the stress (σ) applied, by the
phase angle (δ). This phase lag is due to the excess time necessary for molecular motions and
relaxations to occur. For a perfectly elastic solid, the resulting strain and the stress will be
perfectly in phase. For a purely viscous fluid, there will be a 90 degree phase lag of strain with
respect to stress. Viscoelastic polymers have intermediate characteristics; therefore some
phase lag will occur during DMA tests.
The equations describing the basis concept of DMA testing are:
)sin(0 t (6)
)sin(0 t (7)
E moduli can be expressed as complex number:
EiEE (8)
The storage modulus (E ) measures the stored energy, representing the elastic
portion, and the loss modulus ( E ) measures the energy dissipated as heat, representing the
viscous portion. The storage and loss moduli are defined as follows:
cos0
0E (9)
sin0
0E (10)
And the phase angle:

Chapter 3: Materials And Characterisation Techniques
| 91
E
E
tan (11)
DMA experiences were carried out on a DMA/SDTA 861e, (Mettler Toledo, Fig. 3.17.a),
in the compression mode (Fig. 3.17.b). The samples were measured at a frequency of 1 Hz. The
storage modulus, (E′), loss modulus, (E″), and loss tangent or loss factor, (tan δ), were obtained
using a compression geometry in a parallel plate measurement system. All the experiments
were performed between 0°C and 190‐200°C at a heating rate of 3°C/min. The applied static
force to fix the sample was 18N and it was chosen a dynamic strain of 120% or 30 µm of
deformation, so that the DMA equipment applies a dynamic force until one of both conditions
is reached. Test specimens were prepared in a cylindrical shape with a diameter of 12 mm and
a thickness of 4 to 6 mm, approximately. At least three experiments were carried out for each
sample. Tests were carried out applying the stress in the growing direction of the foam (y
direction).
FIGURE 3.17. a) DMA/SDTA 861e; b) Compression clamp
3.2.5. Thermal conductivity
Two different equipments were employed in order to measure thermal conductivity: a
rapid K heat flow meter from Holometrix and a hot‐disk transient plane source thermal
constant analyser from Hotdisk (TPS). The selection of the technique to measure was made

Chapter 3: Materials And Characterisation Techniques
| 92
depending on the sample size available to perform the measurements. So, only in the samples
with enough amount of material (ideally a sheet of material with dimensions 300x300 mm)
Holometrix device was employed. In other cases, the TPS technique was selected.
3.2.5.1 Rapid K Heat Flow Meter
A Rapid K Heat Flow Meter from Holometrix (Fig. 3.18) was used for the thermal
measurements. Heat flow through the test sample (q) results from having a temperature
gradient (ΔT) across the material. The thermal conductivity λ is defined according to Fourier’s
equation:
d
TAq
(12)
Where A is the cross‐sectional area of the sample and d is the sample thickness.
FIGURE 3.18.‐ Rapid K Heat Flow Meter, from Holometrix
The heat flow meter is a thermopile which gives an output of 40 μV for a temperature
drop of 1ºC. It is a 100 mm side square which occupies the central portion of the cold face of
the equipment. The total face area is a square of 305 mm side, the remaining portion acts as a
shield that keeps the heat flown uniform in the central measurement section. The method is
not absolute, and therefore needs to be calibrated using a standard sample. Once this has
been done, the heat flow per unit area can be found from the reading of the heat flow
transducer, and the thermal conductivity of the sample can thus be calculated using the
previous equation.
Measurements were made under steady state heat flow conditions through the test
sample. These were done in accordance with UNE12667 method. A dispersion of less than 1%
in two consecutive readings was taken as a criterion to ensure that the measurements were
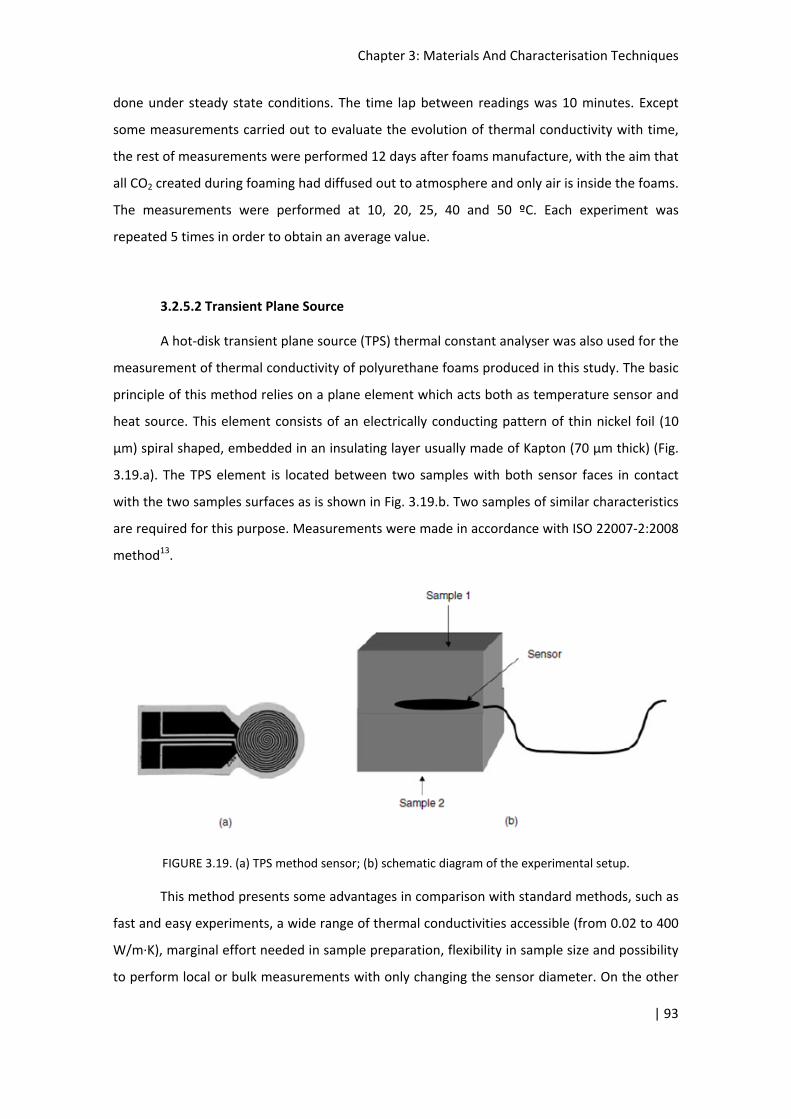
Chapter 3: Materials And Characterisation Techniques
| 93
done under steady state conditions. The time lap between readings was 10 minutes. Except
some measurements carried out to evaluate the evolution of thermal conductivity with time,
the rest of measurements were performed 12 days after foams manufacture, with the aim that
all CO2 created during foaming had diffused out to atmosphere and only air is inside the foams.
The measurements were performed at 10, 20, 25, 40 and 50 ºC. Each experiment was
repeated 5 times in order to obtain an average value.
3.2.5.2 Transient Plane Source
A hot‐disk transient plane source (TPS) thermal constant analyser was also used for the
measurement of thermal conductivity of polyurethane foams produced in this study. The basic
principle of this method relies on a plane element which acts both as temperature sensor and
heat source. This element consists of an electrically conducting pattern of thin nickel foil (10
µm) spiral shaped, embedded in an insulating layer usually made of Kapton (70 µm thick) (Fig.
3.19.a). The TPS element is located between two samples with both sensor faces in contact
with the two samples surfaces as is shown in Fig. 3.19.b. Two samples of similar characteristics
are required for this purpose. Measurements were made in accordance with ISO 22007‐2:2008
method13.
FIGURE 3.19. (a) TPS method sensor; (b) schematic diagram of the experimental setup.
This method presents some advantages in comparison with standard methods, such as
fast and easy experiments, a wide range of thermal conductivities accessible (from 0.02 to 400
W/m∙K), marginal effort needed in sample preparation, flexibility in sample size and possibility
to perform local or bulk measurements with only changing the sensor diameter. On the other

Chapter 3: Materials And Characterisation Techniques
| 94
hand, a drawback is that this is a contact method, so special care is needed in the experimental
procedure in order to obtain reliable, reproducible results.
As for the theory that underlies this technique, a constant electric power supplied to
the sensor results in an increase in temperature ΔT(t) which is directly related to the variation
in the sensor resistance R(t) by the equation:
)(1)( 0 tTRtR (13)
Where R0 is the nickel electrical resistance in the beginning of the recording (initial resistance),
α is the temperature coefficient of resistance of the nickel foil, and ΔT(t) is the temperature
increase of the sensor with time.
Assuming an infinite sample and the conductive pattern being in the XY plane of a
coordinate system, the temperature rise at a point (x, y) at t time is obtained by solving the
equation for the heat conduction, which relates temperature change with time. In the
particular case of the employed sensor geometry with n concentring ring sources, the spatial
average )(T can be obtained through the equation:
)()()( 1230 DaPT (14)
where P0 is a Bessel function, D(τ) is a geometric function characteristic of the number of “n”
concentric rings , and )(T is the temperature increase of the sensor expressed in terms of
the only variable τ, defined as:
/;)/( 221 at (15)
where t(s) is the measured time from the start of the transient heating, is the characteristic
time, which depends both on parameters of the sensor and the sample, a(mm) is the sensor
radius and κ (mm2/s) is the thermal diffusivity of the sample. The characteristic time needs to
be in the range from 0.5 to 1.5 to guarantee that the theoretical assumptions are kept, thus
the heat flow is an ellipsoid of neither too high nor too low sphericity.
Thermal conductivity can be obtained by fitting the experimental data to the straight
line given by equation (14); thermal diffusivity is calculated from equation (15) taking into
account the τ value determined in the previous fit.
Experiments were carried out at room temperature (21 ± 2 ºC). The measurements
were performed using two square samples of 40 mm side and around 30 mm thickness. A disk‐

Chapter 3: Materials And Characterisation Techniques
| 95
shaped TPS sensor with diameter 6.403 mm was used in all measurements. Due to the limited
amount of material available for this measurement and the requirement of a flat surface, the
TPS sensor was located in contact with the xy plane of the sample (see Fig. 3.3).
Measurements were performed enough time after foam production (more than one
month late) to ensure a time stability of them. So, the diffusion of the CO2 resulting from the
foaming reaction (with lower heat transfer coefficient than air) has been completed, and the
gas inside cells was air in all samples. Thereby, the measurements were made avoiding any
difference due to the kind of gas present inside the cells.
3.2.6. Extinction coefficient
Transmittance measurements in the infrared region where performed with 5 thin
samples, where the thickness (L) range was between 0.5 and 2.5 mm. Studied surface was in
the xy plane (see Fig. 3.3). The sample diameter and beam diameter were 12 and 1.5 mm,
respectively. Infrared spectra were collected with a Bruker Tensor 27 FTIR spectrometer (Fig.
3.20) with a DLATGS (deuterated L‐a‐alanine doped with tryglicine sulfate) detector in the
transmission mode, with a resolution of approximately 2 cm‐1.
FIGURE 3.20.‐ Bruker Tensor 27 FTIR spectrometer in the transmission mode
As the first stage of the measurement process, the background was registered to
eliminate H2O and CO2 contributions. Later, transmittance spectra were taken for samples of

Chapter 3: Materials And Characterisation Techniques
| 96
various thicknesses. The transmittance ( ,n) is the ratio of the intensity transmitted through
the sample [ )(xI ] to the intensity without the sample [ ,0I ]:
,0,
)(
I
xIn (16)
Transmission measurements were performed in the wave number infrared region from 4000
to 400 cm‐1. The data supplied by the software were a collection of 1865 values in this range.
With the measured data for samples with different thickness, it was possible to determine the
extinction coefficient of each foam using the calculation explained in section 5.3.2.3.
3.2.7. Reaction kinetics
Several chemical reactions and several ingredients are involved in the formation of
polyurethane foams. Infrared spectroscopy is usually employed for the study of this process14,
as polymerisation kinetics is able to be observed with this technique.
FIGURE 3.21.‐ Infrared spectra of PU sample at different reaction times illustrating the
evolution of (a) the carbonyl region and (b) the isocyanate absorbance band14
In the present work, one region has been observed for the analysis of the infrared
spectra of polyurethanes (Figure 3.21, b): the isocyanate absorbance band approximately at

Chapter 3: Materials And Characterisation Techniques
| 97
2270 cm‐1. The variation of the area under this curve respect to its initial value has allowed
studying the variation in the polymerization rate by the presence of nanoparticles.
3.3. Microscopic Techniques
3.3.1. SEM
Quantitative image analysis was used to quantify the cellular structure of the different
samples. For this purpose, cured foams were cut to provide a smooth surface, which, after
vacuum coating with gold, were examined by Scanning Electron Microscopy (SEM) using a JEOL
JSM 820 equipment (Figure 3.22).
ImageJ special software developed in the CellMat Laboratory15 was employed for cell
size quantification, and at least 100 cells were measured in each material. Cell size distribution,
average cell size and anisotropy ratio (quotient between the cell size in the growing direction
(y) and the average cell size in the perpendicular plane to the growing direction (xz plane))
were measured.
FIGURE 3.22 Scanning Electron Microscopy (SEM) JEOL JSM 820
The width of the cell size distribution was calculated using the normalized standard
distribution parameters (NSD):

Chapter 3: Materials And Characterisation Techniques
| 98
iii
ii
iiii
fm
ffmm
NSD
21
2)(
(17)
Where ni represents the number of cells with a size between ai and bi, n is the total number of
analysed cells, mi= (ai+bi)/2 and fi=ni/n. Data with a bimodal distribution will have a larger NSD
value than data with a mono‐modal distribution.
The asymmetry coefficient (AC) of the distribution was also calculated, based on the
cell size measurements, using Eq. 18. This coefficient gives information about the cell size
distribution asymmetry with respect to it mean value
3
21
i
i
s
xx
nn
nAC (18)
where n is the number of cells, s is the sample standard deviation and x is the average cell
size.
3.3.2. Open cell content
Open‐cell can be defined as the relation between the interconnected cells volume and
the total gas volume (Eq. 19).
volumegasTotal
volumecellstedInterconecOC (%) (19)
These measurements were performed with an air pycnometer (Eijkelcamp 08.06
Langer, Fig 3.23). The measured sample is placed in the vacuum bell. By means of a mercury
column an under‐pressure is created in the bell. Depending on the volume of gas in the bell,
more or less air will be withdrawn. The volume of air depends on the volume of the object to
be measured. The mercury column in the glass tube will drop along with lowering the level
vessel and will indicate the object’s volume on the calibrated scale. Volumes between 0 and
115 cm3 can be read directly from the scale, this is the apparent volume of the sample.

Chapter 3: Materials And Characterisation Techniques
| 99
FIGURE 3.23. Eijkelcamp 08.06 Langer pycnometer to measure the open cell content: external
aspect (left image); internal scheme (right image)
The following equation was used according to the ASTM D622616 to calculate the open cell
content:
pV
VVOC
Sample
PycnometerSample
(%) (20)
where the geometrical volume, SampleV (calculated from the specimen dimensions), is
subtracted from the total volume measured with the pycnometer ( PycnometerV ), and divided by
the volume of air contained in the sample, pVSample , where p is the sample porosity
calculated using
solid
foam
1 , in which foam is the foam density and solid is the density
of the polyurethane matrix, in this case solid = 1100 kg∙m−3.
Cubic samples with lateral dimensions of 30 mm were employed. A correction due to
cells cut present in the samples surface was made in accordance with ASTM D622617.
Therefore, the volume of cells at the surface was taken into account in order to eliminate their
effect in the final value of the open cell content.

Chapter 3: Materials And Characterisation Techniques
| 100
3.3.3. X‐ray tomography
Micro tomography scans were performed using a X‐ray customized equipment built at
the Centre for X‐ray Tomography at Ghent University (UGCT)18. These experiments were used
to experimentally obtain the mass fraction in the struts of the samples. This particular setup
consists in a microfocus X‐ray tube FXE‐ 160.50 source from Feinfocus (minimal spot size: 0.9
µm, Voltage: 20–160 kV, Current: 0–200 µA) with a maximum output power of 20 W, and a
detection system PerkinElmer XRD 1620 CN3 CS a‐Si flat panel with CsI screen (2048 x 2048,
200 µm pixel size). A rotary stage from MICOS (UPR‐160F AIR) was placed in between these
two basic components. It was mounted over a linear stage which allows for movement in a
wide gap (1.4 m approx.) in between the source and the detector varying the magnification
factor, M, as described in Eq. (21) (SDD: source detector distance, SOD: source‐object
distance). Some extra piezoelectric components facilitate the sample centring.
SOD
SDDM (21)
Two scanner settings were used for and SDD = 1388.28 mm with a SOD = 34.70 mm (M
= 40) and SOD = 17.35 (M = 80) used according to foam samples requirements. The higher
magnification choice permitted to resolve better the cell walls (double resolution) although
the field of view was also reduced by a factor of 2.
A tube voltage bellow 60 kV and tube currents ranging 160–170 µA were used, the
detector exposure time was 4000 ms, the rotation step size was 0.2° and the total scan time
was 2 h. Once the projections were acquired, the reconstruction of the tomogram was done
using the Octopus, server/client reconstruction package19.
The determination of the mass fraction in the struts starting from the micro‐
tomography measurements was performed using the method proposed in ref. 16.
3.3.4. X‐ray diffraction
In this technique the radiation from an X‐ray tube (with a λ wavelength) impacts over a
sample. The incident beam is reflected with an angle according with Bragg Law (see Eq. 22 and
Fig. 3.2.3), where n is an integer (diffraction order), λ is the wavelength of incident wave, d is
the spacing between the planes in the atomic lattice, and is the angle between the incident
beam and the scattered beam. A moving detector, varying the angle with respect to the
sample, detects the diffracted beam. With the help of the intensity as a function of the angle it
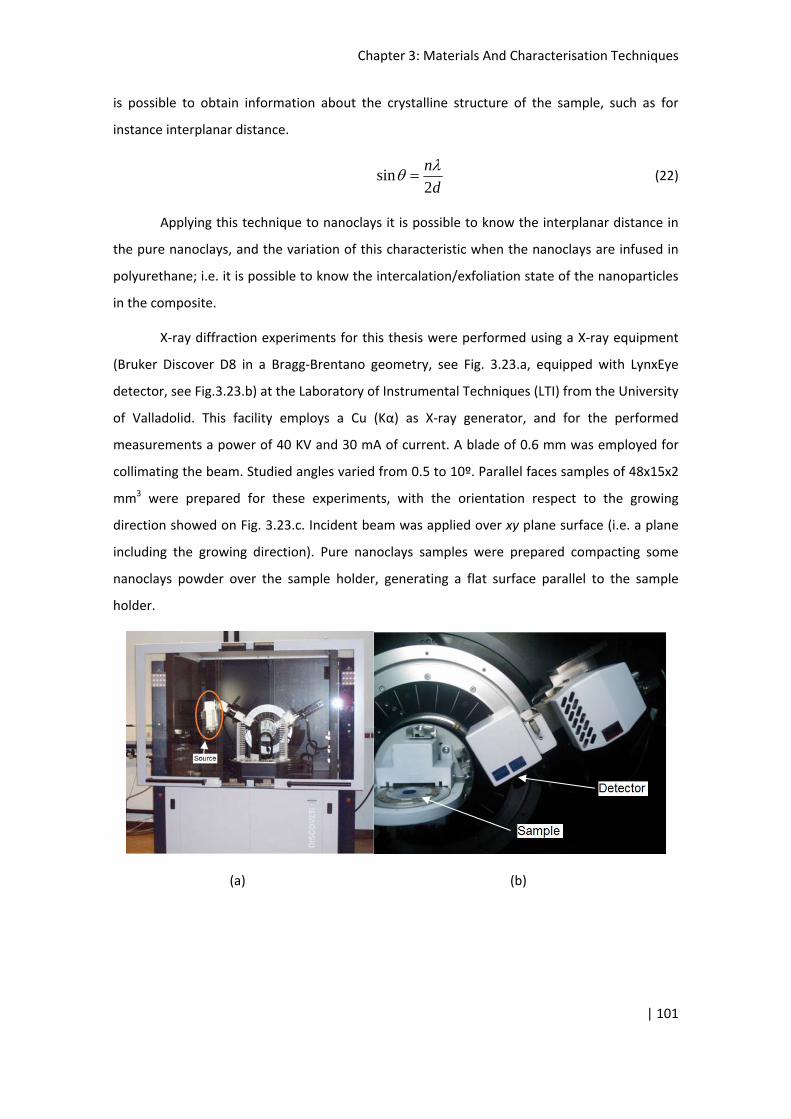
Chapter 3: Materials And Characterisation Techniques
| 101
is possible to obtain information about the crystalline structure of the sample, such as for
instance interplanar distance.
d
n
2sin
(22)
Applying this technique to nanoclays it is possible to know the interplanar distance in
the pure nanoclays, and the variation of this characteristic when the nanoclays are infused in
polyurethane; i.e. it is possible to know the intercalation/exfoliation state of the nanoparticles
in the composite.
X‐ray diffraction experiments for this thesis were performed using a X‐ray equipment
(Bruker Discover D8 in a Bragg‐Brentano geometry, see Fig. 3.23.a, equipped with LynxEye
detector, see Fig.3.23.b) at the Laboratory of Instrumental Techniques (LTI) from the University
of Valladolid. This facility employs a Cu (Kα) as X‐ray generator, and for the performed
measurements a power of 40 KV and 30 mA of current. A blade of 0.6 mm was employed for
collimating the beam. Studied angles varied from 0.5 to 10º. Parallel faces samples of 48x15x2
mm3 were prepared for these experiments, with the orientation respect to the growing
direction showed on Fig. 3.23.c. Incident beam was applied over xy plane surface (i.e. a plane
including the growing direction). Pure nanoclays samples were prepared compacting some
nanoclays powder over the sample holder, generating a flat surface parallel to the sample
holder.
(a) (b)

Chapter 3: Materials And Characterisation Techniques
| 102
(c)
FIGURE 3.24.‐ (a) Bruker D8 Discover; (b) Detail of the Lynx Eye detector; (c) Orientation of the
studied samples with x‐ray diffraction.
x
y
z

Chapter 3: Materials And Characterisation Techniques
| 103
1 J. Ren, A. S. Silva, R. Krishnamoorti, Linear viscoelasticity of disordered polystyrene‐
polyisoprene block copolymer based layered‐silicate nanocomposite, Macromolecules, 33,
3739‐3746, (2000)
2 M. J. Solomon, A. S. Almussallam, K. F. Seefeldt, A. Somwangthanaroj, P. Varadan, Rheology
of polypropylene/clay hybrid materials. Macromolecules, 34, 1864‐1872, (2001)
3 R. Wagener, T. J. G. Reisinger, A rheological method to compare the degree of exfoliation of
nanocomposites, Polymer, 44, 7513‐7518, (2003)
4 J. Zhao, B. Morgan, J.D. Harris, Rheological characterization of polystyrene‐clay
nanocomposites to compare the degree of exfoliation and dispersion, Polymer, 46, 8641‐8660,
(2005)
5 F. J. Galindo‐Rosales, P. Moldenaers, J. Vermant, Assessment of the dispersion quality in
polymer nanocomposites by rheological methods, Macromolecular Materials and Engineering,
296 (3‐4), 331–340, (2011)
6 J. Vermant, S. Ceccia, M. K. Dolgovskij, P. L. Maffetone, C.W. Macosko, Quantifying dispersion
of layered nanocomposites via melt rheology, Journal of Rheology, 52, 429‐450, (2007)
7 H.H. Winter, Three views of viscoelasticity for Cox–Merz materials, Rheologica acta, 48(3),
241‐243, (2009)
8 F. Li, K. Lania, X. Wang, G. Xue, H. H. Winter, Steric effects on the rheology of nanocomposite
gels of organoclay in dicarboxyl‐terminated polybutadiene, Soft Matter, 6, 2442‐2448, (2010)
9 ASTM D1622 – 08: Standard Test Method for Apparent Density of Rigid Cellular Plastics, ICS
Number Code 83.100 (Cellular materials), DOI: 10.1520/D1622‐08
10 ASTM D1621: Standard Test Method for Compressive Properties Of Rigid Cellular Plastics, ICS
Number Code 83.100 (Cellular materials), DOI: 10.1520/D1621‐10
11 EN ISO 178, Plastics – Determination of flexural properties, European Committee for
Standardization (CEN), (2010)

Chapter 3: Materials And Characterisation Techniques
| 104
12_UNE‐EN 12667:2002, Thermal performance of building materials and products.
Determination of thermal resistance by means of guarded hot plate and heat flow meter
methods, Products of high and medium thermal resistance, (2002)
13 ISO 22007‐2. 2008. Plastics‐Determination of Thermal Conductivity and Thermal Diffusivity—
Part 2: Transient Plane Heat Source (Hot Disc) Method.
14 M.M. Bernal, I. Molenberg, S. Estravis, M. A. Rodriguez‐Perez, I. Huynen, M. A. Lopez‐Manchado, R.
Verdejo, Comparing the effect of carbon‐based nanofillers on the physical properties of flexible
polyurethane foams, Journal of Materials Science, 47(15), 5673‐5679, (2012)
15 J. Pinto, E. Solórzano, M. A. Rodriguez‐Perez, J. A. de Saja, Characterization of the cellular
structure based on user‐interactive image analysis procedures, Journal of Cellular Plastics,
49(6), 555‐575, (2013)
16 ASTM D6226 – 10: Standard Test Method for Open Cell Content of Rigid Cellular Plastics, ICS
Number Code 83.080.01 (Plastics in general), DOI: 10.1520/D6226‐10
17 ASTM D6226 – 10: Standard Test Method for Open Cell Content of Rigid Cellular Plastics, ICS
Number Code 83.080.01 (Plastics in general), DOI: 10.1520/D6226‐10
18 S. Pardo‐Alonso, E. Solórzano, L. Brabant, P. Vanderniepen, M. Dierick, L. Van Hoorebeke,
(3d) Analysis of the Progressive Modification of the Cellular Architecture in Polyurethane
Nanocomposite Foams via X‐Ray Microtomography, European Polymer Journal, 49(5), 999‐
1006, (2013)
19 J. Vlassenbroeck, M. Dierick, B. Masschaele, V. Cnudde, L. Van Hoorebeke, P. Jacobs
Software tools for quantification of X‐ray microtomography at the UGCT, Nuclear Instruments
and Methods in Physics Research Section A: Accelerators, Spectrometers, Detectors and
Associated Equipment, 580(1), 442‐445, (2007)

CHAPTER 4:
INFLUENCE OF THE FORMULATION AND DISPERSION TECHNIQUE EMPLOYED


| 107
4. INFLUENCE OF THE FORMULATION AND DISPERSION TECHNIQUE EMPLOYED
4.1. Objectives
The first approach adopted to obtain a better understanding of nanoclays‐polyurethane
interaction has been to study the influence of different formulations and different dispersion
techniques on the final foam properties. For this reason, the properties of rigid PU foams filled
with nanoclays, and the effect of the use of different dispersion procedures have been studied.
The objective was to show which properties are suitable to be improved, as polyurethane has
a wide range of applications, and the possible influence of the dispersion procedure. For this
aim, an initial study with three different polyurethane blends (with different viscosities, as
polyol viscosity plays a fundamental role that could affect the dispersion effectiveness) was
performed in collaboration with the Katholic University of Leuven (KUL), under Professor
Moldenaers supervision, in order to select the most sensitive formulation to the dispersion
technique. Then, this formulation was selected and employed for production and
characterisation of foams. Properties of these materials have been studied analysing the
dependence of the final material properties with the used dispersion technique.
4.2. Rheological study for the different dispersion techniques and different polyol blends
4.2.1. Results
The polyol components of the three different rigid polyurethane foam formulations
introduced in the Materials and Characterization Techniques chapter (table 3.1) were
employed in this study. For the polyols with a lower viscosity BASF (LV) and Recticel (MV) two
different concentrations of clays (1 and 3% by weight) were used. For the material of higher
viscosity (HV) the analysis was conducted by adding 3% by weight of nanoclays.
Two different techniques were employed for the dispersion of the clays: low shear
mixing and ultrasonication, listed according to a theoretical increasing dispersion power1, 2.
Their main characteristics, parameters employed and the short name that have been used in
the tables and figures were presented in section 3.1 of chapter 3 (table 3.3). Dispersion quality
was analysed by performing strain sweep and frequency sweep measurements. The results are
presented for each type of polyol used.

Chapter 4: Influence Of The Formulation And Dispersion Technique Employed
| 108
BASF (LV)
Freq (rad/s)
0,01 0,1 1 10 100 1000
G' (
Pa)
0,001
0,01
0,1
1
10
100
1000
Pure1%3%
Freq (rad/s)
0,001 0,01 0,1 1 10 100 1000
G''
(Pa)
0,001
0,01
0,1
1
10
100
1000
Pure1%3%
(a) (b)
FIGURE 4.1: Frequency sweep at 23ºC, preshear of 1 s‐1 for 5 minutes followed by an equilibration
period of 25 minutes: (a) Storage modulus, (b) Loss modulus. Dispersions are prepared by shear mixing
at 200 rpm for 2 minutes.
The frequency sweep data for the BASF formulation are presented in figure 4.1 (shear
mixing dispersion technique) and 4.2 (ultrasonication dispersion technique). A large difference
is obtained between the two dispersion techniques used. The pure polyol from the BASF
formulation is a viscous liquid; G' is almost no measurable and G" is proportional to the
frequency across the complete frequency range studied. By incorporating nanoclays dispersed
with the low shear technique, both the elastic and viscous contribution rise, but the formation
of a low frequency plateau is lacking (Figure 4. 1). This indicates that although there is a clear
effect of the nanofillers, a percolating structure (indicating a well dispersed material) is not yet
formed in the material for a concentration of clays of 3%wt.
Freq (rad/s)
0,01 0,1 1 10 100 1000
G' (
Pa)
0,001
0,01
0,1
1
10
100
1000
Pure1%3%
Freq (rad/s)
0,001 0,01 0,1 1 10 100 1000
G'' (Pa)
0,001
0,01
0,1
1
10
100
1000
Pure1%3%
(a) (b)
FIGURE 4.2: Frequency sweep at 23ºC, preshear of 1 s‐1 for 5 minutes followed by an equilibration
period of 25 minutes: (a) Storage modulus, (b) Loss modulus. Dispersions are prepared by applying
ultrasonication for 25 minutes.
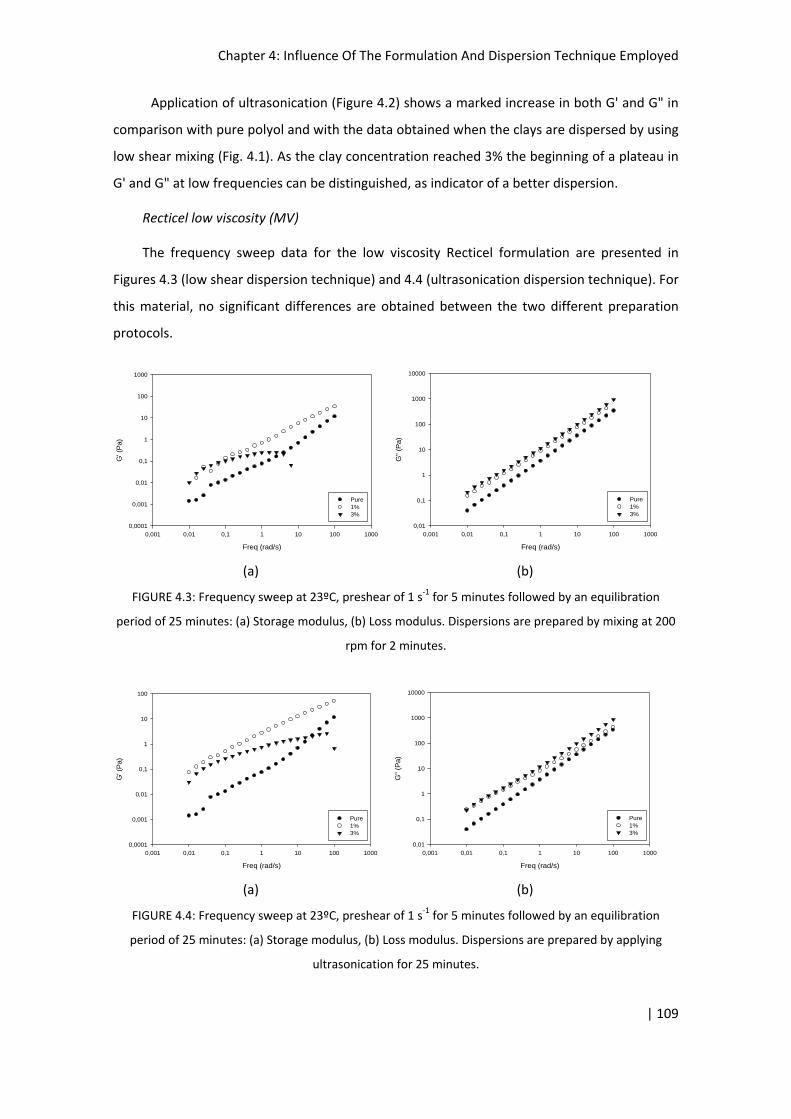
Chapter 4: Influence Of The Formulation And Dispersion Technique Employed
| 109
Application of ultrasonication (Figure 4.2) shows a marked increase in both G' and G" in
comparison with pure polyol and with the data obtained when the clays are dispersed by using
low shear mixing (Fig. 4.1). As the clay concentration reached 3% the beginning of a plateau in
G' and G" at low frequencies can be distinguished, as indicator of a better dispersion.
Recticel low viscosity (MV)
The frequency sweep data for the low viscosity Recticel formulation are presented in
Figures 4.3 (low shear dispersion technique) and 4.4 (ultrasonication dispersion technique). For
this material, no significant differences are obtained between the two different preparation
protocols.
Freq (rad/s)
0,001 0,01 0,1 1 10 100 1000
G' (
Pa)
0,0001
0,001
0,01
0,1
1
10
100
1000
Pure1%3%
Freq (rad/s)
0,001 0,01 0,1 1 10 100 1000
G''
(Pa)
0,01
0,1
1
10
100
1000
10000
Pure1%3%
(a) (b)
FIGURE 4.3: Frequency sweep at 23ºC, preshear of 1 s‐1 for 5 minutes followed by an equilibration
period of 25 minutes: (a) Storage modulus, (b) Loss modulus. Dispersions are prepared by mixing at 200
rpm for 2 minutes.
Freq (rad/s)
0,001 0,01 0,1 1 10 100 1000
G' (
Pa)
0,0001
0,001
0,01
0,1
1
10
100
Pure1%3%
Freq (rad/s)
0,001 0,01 0,1 1 10 100 1000
G''
(Pa)
0,01
0,1
1
10
100
1000
10000
Pure1%3%
(a) (b)
FIGURE 4.4: Frequency sweep at 23ºC, preshear of 1 s‐1 for 5 minutes followed by an equilibration
period of 25 minutes: (a) Storage modulus, (b) Loss modulus. Dispersions are prepared by applying
ultrasonication for 25 minutes.

Chapter 4: Influence Of The Formulation And Dispersion Technique Employed
| 110
The linear response of the pure material corresponds again to that of a viscous liquid (G"
is proportional to the frequency and G' is smaller than G" for the entire frequency range
studied). The addition of nanoclays leads to the expected increase in G", but the response
remains proportional to the frequency for both techniques (i.e. no plateau at low frequencies
is detected). The data of G' with increasing clay loading shows an interesting evolution, but it
can be concluded from the data that no good dispersion is obtained in the polyol component
with this Recticel formulation, independently from the dispersion technique employed.
Recticel high viscosity (HV)
Freq (rad/s)
0,01 0,1 1 10 100 1000
G' (
Pa)
0,01
0,1
1
10
100
1000
Pure3%
Freq (rad/s)
0,001 0,01 0,1 1 10 100 1000
G''
(Pa)
0,1
1
10
100
1000
10000
Pure3%
(a) (b)
FIGURE 4.5: Frequency sweep at 23ºC, preshear of 1 s‐1 for 5 minutes followed by an equilibration
period of 25 minutes: (a) Storage modulus, (b) Loss modulus. Dispersions are prepared by mixing at 200
rpm for 2 minutes.
Freq (rad/s)
0,01 0,1 1 10 100 1000
G' (
Pa)
0,01
0,1
1
10
100
1000
Pure3%
Freq (rad/s)
0,001 0,01 0,1 1 10 100 1000
G''
(Pa)
0,1
1
10
100
1000
10000
Pure3%
(a) (b)
FIGURE 4.6: Frequency sweep at 23ºC, preshear of 1 s‐1 for 5 minutes followed by an equilibration
period of 25 minutes: (a) Storage modulus, (b) Loss modulus. Dispersions are prepared by applying
ultrasonication for 25 minutes.

Chapter 4: Influence Of The Formulation And Dispersion Technique Employed
| 111
The frequency sweep data for the high viscosity Recticel formulation are presented in
figures 4.5 and 4.6. Once again, for this material, no significant differences are obtained
between the two different preparation protocols.
The linear response of the pure material corresponds to that of a viscous liquid (G" is
proportional to the frequency and G' smaller than G" for the entire frequency range studied).
The addition of nanoclays leads to the expected increase in G", but the response remains
proportional to the frequency. The data of G' also shows that no good dispersion is obtained in
the polyol component with this Recticel formulation. Even a worse dispersion than for Recticel
low viscosity formulation is observed for both dispersion techniques, as any remainder of the
existence of a plateau at low frequencies is observed.
4.2.2. Discussion
The data obtained from the previous measurements can be plotted as in figure 4.7, where
the modulus of the complex viscosity η* is plotted as a function of the complex modulus G*
(Winter‐plot, see section 3.2.1). This representation enables to make a comparison between
the two preparation techniques and between the three different formulations. A variation in
the curve slope implies a better dispersion, so a higher variation in the slope implies a much
better dispersion3. This is a consequence of the Cox and Merz rule4, an empirical relationship
between steady state shear viscosity (at a given shear rate) and the dynamic viscosity (at the
same frequency). This rule can be used in an analytical sense, as a measure of the materials
microstructure from the degree to which they follow to the rule. In order to make a better
comparative between the three formulations, only the data for a 3%wt. nanoclays are
represented in the Figure 4.7.
For the BASF formulation, a difference in preparation technique is visible, with a rise of
nearly two orders of magnitude in the modulus of the complex viscosity as compared to the
pure polyol material between the material prepared with high shear mixing and the one
prepared with ultrasonication. For both Recticel formulations, almost no difference in
preparation technique can be observed in Fig. 4.7. Compared to the BASF formulation, the rise
in the modulus of the complex viscosity is modest.
The dispersion state of nanoclays is highly dependent on the preparation protocol for
the BASF‐formulation. Ultrasonication proves to be a better technique to disperse nanoclays in
the case of the BASF formulation. However, when compared to literature data (Galindo‐
Rosales et al.2 showed how the rheological signature of the particles is especially visible in the

Chapter 4: Influence Of The Formulation And Dispersion Technique Employed
| 112
elastic properties at low frequencies, see Fig. 3.8), we should expect a larger increase in the
dynamic mechanical properties G' and G" for the concentration of nanoclays under study. This
is an indication that the nanoclays are not exfoliated during the dispersion and that still native
or intercalated tactoids exists in the sample (see results of SAXS experiments (section 4.3.1.3)).
(a) (b)
(c)
FIGURE 4.7: Modulus of complex viscosity η* versus modulus of the complex modulus G*. Data obtained
from a frequency sweep at 23ºC, preshear of 1 s‐1 for 5 minutes followed by an equilibration period of
25 minutes: (a) BASF formulation (b) Recticel low viscosity formulation (c) Recticel high viscosity
formulation.
The second observation is that, though the nanoclays indeed give rise to an increase G'
and G" for the Recticel formulation, the increase is significantly lower than for the BASF
formulation. As the physical parameters (concentration, preparation protocol, measurement
protocol,...) are the same, the difference should be due to a different chemical nature of both
formulations and as consequence a different interaction between the polyol component and
the nanoclays and/or to the different viscosities of each formulation.

Chapter 4: Influence Of The Formulation And Dispersion Technique Employed
| 113
4.3. Foams characterization
After the rheological study, the BASF formulation (LV) was selected to produce foamed
materials because its polyol component was the most sensitive to the different dispersion
techniques used. With this formulation, different foams were produced. The two previously
studied dispersion techniques were used, and another new one was added. Hand mixing
technique (HM, see section 3.1), with an expected lower dispersion quality than the previous
ones2, was also employed trying to widen the spectra of the dispersion qualities. Nanoclays
concentration was set in 3% wt for all the produced foams.
4.3.1. Structural characterization
4.3.1.1. Density
Density results are shown in table 4.1. The nanofillers inclusion produced a small density
reduction only in the low shear mixing technique foam. However, in general terms the
macroscopic density tends to have a slight increase when nanoclays are added. The reason for
this slight growth could be connected with higher viscosity of the initial blend when clays are
infused5, 6 (see previous section), combined with the fact that nanofillers density (Cloisite 30B ‐
1980 Kg/m3) are higher than that of the reference foam (around 50 kg/m3).
TABLE 4.1. Density of the manufactured materials
Material Density
(kg/m3)
Standard
deviation
(kg/m3)
LV Pure 53.37 0.92
LV 3% HM 56.77 6.75
LV 3% LS 51.64 0.39
LV 3% US 54.63 1.9
Anyway, these density changes are small and with a high dispersion (specially for the
foams produced by hand mixing), as polyurethane foam density is very sensitive to small
changes in environmental conditions, like moisture and temperature, and even to small
changes in mixing times7.

Chapter 4: Influence Of The Formulation And Dispersion Technique Employed
| 114
4.3.1.2 Cellular structure
SEM micrographs of the different samples can be observed in figure 4.8. Images show that
the addition of nanofillers implies a reduction of cell size, as is shown in the cell size
distribution histograms (Fig. 4.9). This result was observed independently from the dispersion
technique employed. For the pure material, the cells have sizes in the range between 400 and
500 µm, whereas in the case of nanoclays this range starts at lower sizes and is wider. This
different dispersion of the cell sizes can be also observed in the SEM images; in the pure
material the cell size is more homogeneous than in the materials infused with nanoclays.
a) b)
c) d)
FIGURE 4.8. SEM images: (a) Pure material, (b) 3wt% nanoclays, dispersion technique: HM, (c) 3wt%
nanoclays, dispersion technique: LS, (d) 3wt% nanoclays, dispersion technique: US.
Analysis of SEM images also provides quantitative information, which can be observed
in Figure 4.9 and in Table 4.2. Figure 4.9 shows the cell size distributions of the different
materials in a plane containing the growing direction (y direction). It is possible to corroborate
the qualitative observations over the SEM images previously mentioned. The inclusion of
nanoclays produces a reduction of the average cell sizes. But the study of these histograms can
x
y
x
y
x
y
x
y

Chapter 4: Influence Of The Formulation And Dispersion Technique Employed
| 115
give some extra information. Gaussian fitting of the data allows observing a wider distribution
when the clays are added.
Pure
Cell size (m)
100 150 200 250 300 350 400 450 500 550 600 650 700 750 >750
Rela
tive
Fre
quec
ies
0,00
0,05
0,10
0,15
0,20
0,25
0,30
0,35
HistoGauss
HM
Cell size (m)
100 150 200 250 300 350 400 450 500 550 600 650 700 750 >750
Rel
ativ
e F
requ
ecie
s
0,00
0,05
0,10
0,15
0,20
0,25
0,30
HistoGauss
LS
Cell size (m)
100 150 200 250 300 350 400 450 500 550 600 650 700 750 >750
Rela
tive F
requ
eci
es
0,00
0,05
0,10
0,15
0,20
0,25
0,30
HistoGauss
US
Cell size (m)
100 150 200 250 300 350 400 450 500 550 600 650 700 750 >750
Rela
tive F
requ
eci
es
0,00
0,05
0,10
0,15
0,20
0,25
HistoGauss
FIGURE 4.9. Cell size histograms: Pure material and 3wt% nanoclays for the three different dispersion
techniques.
Table 4.2 shows numerical values of the cellular structure characterisation. A cell size
reduction between 9 and 12 % for different samples is observed, as consequence a slight
increase of cell density is detected. No significant difference in the anisotropy of the cells is
observed between pure material and material with nanoclays, where y is referred to the
growing direction. Besides the reduction of the cell size, the inclusion of nanoclays implies a
higher dispersion of the cell sizes values, as is shown in the NSD values. Asymmetry coefficient
is reduced when clays are added indicating a more symmetric distribution for the foamed
nanocomposites. Open cell percentage presents variations with the inclusion of nanoclays, but
in any case more than 5% with respect to pure material.

Chapter 4: Influence Of The Formulation And Dispersion Technique Employed
| 116
TABLE 4.2. Cellular data of the manufactured materials
Material Average cell
size (μm)
Anisotropy
R (y/x)
Asymmetry
coefficient
(AC)
NSD
Cell density
(nº
cells/m3)
Open
cell
(%)
% reduction of
cell size with
respect to the
pure material
LV Pure 440 1.20 2.073 0,191 2,15∙1010 8.0
LV 3% HM 396 1.25 1.769 0,321 3,06∙1010 5.6 9.9
LV 3% LS 388 1.10 1.018 0,274 2,85∙1010 3.1 11.7
LV 3% US 396 1.36 1.343 0,292 2,97∙1010 9.7 9.7
The reduction of the cell size without a remarkable density change could be a
consequence of two simultaneous effects: filler could act as nucleating agent for the cells, and
also as stabilizer of the cell walls. Nucleating effect, which can be explained by the classical
nucleation theory8, 9, is the consequence of a reduction of surface energy by the inclusion of
particles that allows the creation of additional cells10. The effect of nanoclays as stabilizer of
the cell walls could reduce coalescence, promoting a higher cell density and lower cell size.
Anyway, recent studies have shown that principal role of nanoclays in this system is as
nucleating agent11.
Table 4.3 shows the cell size reduction in different polyurethane foams infused with
different kinds of nanoparticles. The data have been obtained from previous works developed
in CellMat laboratory and literature. As it can be observed, the cell size variation depends
highly on the particle employed and its concentration. Moreover, the same kind of
nanoparticle with different functionalization produces dramatically different changes in cell
size. It can be seen in Harikrishnan et al. article14, where it was observed a 3% of increase in
cell size in the case of pure nanoclays and a 58% of cell size reduction in the case of Cloisite
20A, for the same concentration of nanoclays. It is possible to observe in Table 4.3 the effect of
the polyol type employed13, and how for the same nanoparticle and concentration the effect
over the cell size can be completely different.

Chapter 4: Influence Of The Formulation And Dispersion Technique Employed
| 117
TABLE 4.3. Polyurethane data from the literature. (‐) means that cell size is reduced when the particles
are added, (+) means that cell size is increased when the particles are added.
Material Reference Nanoparticle Cell size variation with respect
pure material (%)
PU + 1% Sepiolite CellMat
Laboratory Organomodified Sepiolite ‐6.6
PU + 3% Sepiolite CellMat
Laboratory Organomodified Sepiolite 10.7
PU + 5% nanoclays (12) MMT‐OH (Cloisite 30B) ‐23
PU + 5% nanoclays (12) MMT‐Tin (Cloisite 30B modified) ‐19
PU + 2% nanoclays (13) Purified natural montmorillonitePolyether based: 26
Polyether‐polyester based: ‐3
PU + 2% nanoclays (13)
Benzyl‐dimethyl‐hydrogenated‐
tallow ammonium‐
salt‐modified natural
montmorillonite
Polyether based: 19
Polyether‐polyester based: ‐25
PU + 2% nanoclays (13) Alkyl‐imidazolium salt natural
montmorillonite
Polyether based: 79
Polyether‐polyester based: 14
PU + 2% nansilica (13) Silica nanopowder Polyether based: 28
Polyether‐polyester based: ‐11
PU + 2% Titanium
dioxide (13) Titanium dioxide nanopowder
Polyether based: ‐14
Polyether‐polyester based: ‐20
PU + pure nanoclays (14) Natural montmorillonites
1% Nanoclays: ‐6
2.3% Nanoclays: 3
3.6% Nanoclays: ‐5
PU + Cloisite 25A (14)
hydrogenated tallow
alkylmethyl‐(2‐
ethylhexyl)ammonium salts
modified natural
montmorillonite
1% Nanoclays: ‐8
2.3% Nanoclays: ‐52
3.6% Nanoclays: ‐44
PU + Cloisite 20A (14)
dimethyl, dehydrogenated
tallow, quaternary ammonium
salts modified natural
montmorillonite
1% Nanoclays: ‐64
2.3% Nanoclays:‐58
3.6% Nanoclays: ‐66
PU + Cloisite 93A (14)
methyl, dehydrogenated tallow
alkylammonium salts modified
natural montmorillonite
1% Nanoclays: ‐28
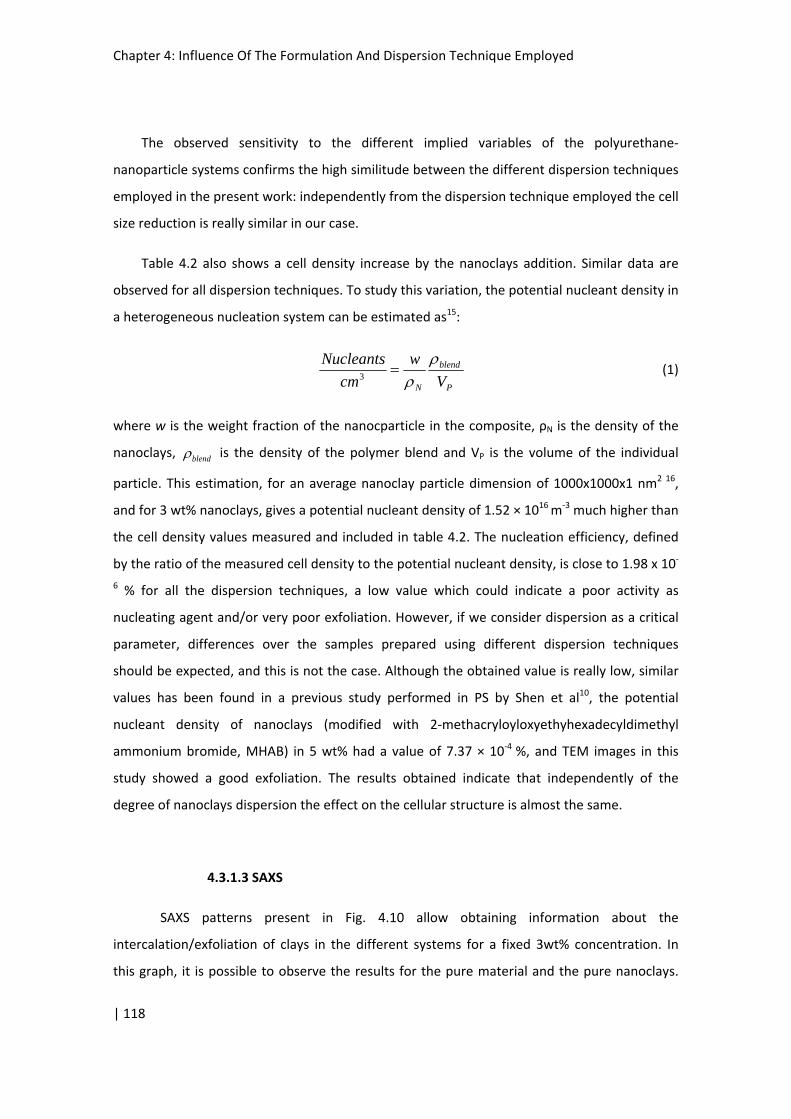
Chapter 4: Influence Of The Formulation And Dispersion Technique Employed
| 118
The observed sensitivity to the different implied variables of the polyurethane‐
nanoparticle systems confirms the high similitude between the different dispersion techniques
employed in the present work: independently from the dispersion technique employed the cell
size reduction is really similar in our case.
Table 4.2 also shows a cell density increase by the nanoclays addition. Similar data are
observed for all dispersion techniques. To study this variation, the potential nucleant density in
a heterogeneous nucleation system can be estimated as15:
P
blend
N V
w
cm
Nucleants
3
(1)
where w is the weight fraction of the nanocparticle in the composite, ρN is the density of the
nanoclays, blend is the density of the polymer blend and VP is the volume of the individual
particle. This estimation, for an average nanoclay particle dimension of 1000x1000x1 nm2 16,
and for 3 wt% nanoclays, gives a potential nucleant density of 1.52 × 10¹⁶ m‐3 much higher than
the cell density values measured and included in table 4.2. The nucleation efficiency, defined
by the ratio of the measured cell density to the potential nucleant density, is close to 1.98 x 10‐
6 % for all the dispersion techniques, a low value which could indicate a poor activity as
nucleating agent and/or very poor exfoliation. However, if we consider dispersion as a critical
parameter, differences over the samples prepared using different dispersion techniques
should be expected, and this is not the case. Although the obtained value is really low, similar
values has been found in a previous study performed in PS by Shen et al10, the potential
nucleant density of nanoclays (modified with 2‐methacryloyloxyethyhexadecyldimethyl
ammonium bromide, MHAB) in 5 wt% had a value of 7.37 × 10‐4 %, and TEM images in this
study showed a good exfoliation. The results obtained indicate that independently of the
degree of nanoclays dispersion the effect on the cellular structure is almost the same.
4.3.1.3 SAXS
SAXS patterns present in Fig. 4.10 allow obtaining information about the
intercalation/exfoliation of clays in the different systems for a fixed 3wt% concentration. In
this graph, it is possible to observe the results for the pure material and the pure nanoclays.

Chapter 4: Influence Of The Formulation And Dispersion Technique Employed
| 119
For the pure nanoclays it is detected the characteristic diffraction peak due to the lamellar
structure of the nanoclays, for a 2θ value close to 4.7 degrees. According to Bragg equation
presented in Chapter 3 (Eq. 22), and taking into account that experiments were performed
using a X‐ray tube with λ= 1.5406 Å, it is possible to obtain a value for the inter‐lamellar space
in Cloisite 30B of 18.8 Å, close to the 18.5 Å data supplied by Southern Clay Products, Inc. (See
table 3.2)
0 2 4 6 8 10 12
Nor
mal
ized
inte
nsi
ty
0,0
0,1
0,2
0,3
0,4
0,5
0,6
0,7
PURE HM LS US C30B
FIGURE 4.10. SAXS patterns for polyurethane foams prepared with different dispersion techniques and
for pure Cloisite 30B nanoclays.
The results show a decrease of the same peak for the different dispersion techniques,
and an increase in its width, together with the presence of a higher peak at around 2.2°. In the
case of the hand mixing technique, a shifting to higher angles (that implies a decrease in the
inter‐lamellar space) has been observed. The increase in the width of the peak at 4.7° and the
presence of a new peal at 2.2° confirms the intercalation of the nanoclays, even with a non‐
optimal dispersion technique. The intercalation is related with a good interaction between the
polymeric matrix and nanoparticles17, promoted mainly by a compatible organomodification
with the polyurethane matrix. So, although intercalation is not probably reached during

Chapter 4: Influence Of The Formulation And Dispersion Technique Employed
| 120
nanoclays dispersion in polyol as it can be concluded from the rheological study, isocyanate
addition and polymerization reaction lead to a nanoclays intercalation even in the worst of the
dispersion cases. On the other hand, the results clearly show that the clays are not exfoliated
by any of the mixing processes used.
4.3.2. Macroscopic characterization
4.3.2.1. Dynamic Mechanical Analysis
Fig. 4.11 (a) shows the evolution of the storage modulus (E’) with the temperature, for
pure material and nanoclays‐filled samples. E’ decreases slowly and progressively with the
temperature for all samples below 80 °C. Then it shows a very strong decay between 80 and
180 °C, correlated with the transition from the glassy to the rubbery state. At temperatures
below the glass transition, a slight increase of E’ value is observed by the inclusion of nanoclays
for the HM and the LS samples, for the US sample there is a slight decrease of E’. For a better
understanding of the nanoclays effect and the different mixing techniques, the relative storage
modulus (the quotient of the values for the different dispersion techniques with respect to the
pure material) is plotted as a function of temperature in Fig. 4.11(b). In the glassy region,
nanoclays produce a small (and none for US mixing technique) rise in E’. In the glass transition
region, the values increase between 200% and almost 400% near 160 ºC. This increase is
observed for all dispersion techniques. This improvement in storage modulus suggests a
favourable interfacial interaction between the nanofillers and the polyurethane matrix18, 19. In
particular, the mobility of the polymer molecule chains near the glass transition temperature
(Tg) is markedly restricted, giving rise to an abrupt increase in storage modulus in this
temperature region.
As expected in the glass transition region, energy dissipation increases greatly as the
loss factor (tan δ) tends to a maximum while the temperature at the maximum in this curve is
considered the glass transition temperature (Tg) associated with the α relaxation of the
polyurethane foams nanocomposites. Both Tg and tan δ are connected with the mobility of
polymer molecule chain segments. As presented in Fig. 4.12, the apparent Tg and tan δ of pure
polyurethane foam are 157 ºC and 0.60, while the Tg shifts to 160, 164 and 167 ◦C for LS, HM
and US nanocomposites and tan δ is reduced to 0.44, 0.42 and 0.42, respectively.
(a)

Chapter 4: Influence Of The Formulation And Dispersion Technique Employed
| 121
(b)
FIGURE 4.11. Temperature dependence of storage modulus (a) and relative storage modulus (b).
The value of tan δ at the peak is reduced by a 28%, a value much higher than the 3% by
weight of filler used. Therefore the result cannot be understood using the mixing’s rule.

Chapter 4: Influence Of The Formulation And Dispersion Technique Employed
| 122
Nanoclays inclusion produced a clear increase in Tg and a clear decrease in tan δ,
demonstrating the stiffening effect of these nanofillers, i.e. the presence of nanoclays highly
impedes the polymer chain mobility via strong interfacial interactions and acts as a ‘physical
crosslink’ during the glass transition20, 21, which improves the heat resistance of the
nanocomposites. Due to the high interfacial interaction between the polyurethane matrix with
a two‐dimensional geometrical morphology, and its clear effects on the variation (respect to
materials with conventional aspect ratio) of the Tg and tan δ in previous studies22 (where the
measured values for Tg and tan δ of pristine polyurethane rigid foam were 185 ◦C and 0.6,
while the Tg shifts to 201 and 199 ◦C for graphene nanosheets and carbon nanotubes
nanocomposites and tan δ shifts to 0.4 and 0.5), it is possible to conclude that a similar grade
of interaction between the particles and the matrix is reached in the present study.
FIGURE 4.12. Temperature dependence of the loss factor (tan δ).
4.3.2.2. Mechanical properties in compression and shear
Figure 4.13 shows an example of the compression experiments, where different slopes in
the linear elastic region and collapse stresses can be observed for the different materials (pure

Chapter 4: Influence Of The Formulation And Dispersion Technique Employed
| 123
material, and foamed nanocomposites with 3 wt% of clays dispersed using different methods).
Final results (obtained from the stress‐strain curve using the methods explained in section
3.2.3) are summarized in table 5.
Strain (%)
0 10 20 30 40 50
Str
ess
(MP
a)
0,0
0,1
0,2
0,3
0,4
0,5
0,6
PureHMLSUS
FIGURE 4.13. Examples of the stress‐strain curves for the different materials
It is possible to detect a slight improvement of the Elastic Modulus of the foams with the
inclusion of nanoclays, for all dispersion techniques, without large differences between them.
Collapse strength also shows a small increase with the addition of the nanofillers for the hand‐
mixing technique (with a large dispersion), and the same value or even a decrease for the
ultrasonication and the low‐shear mixing technique, respectively.
Taking into account that fillers addition has produced some density changes, the previous
comparisons are not precise enough as long as foams with different densities are compared.
Material produced with HM technique requires special attention: it presented (table 4.1) a
high standard deviation for the density measurements, and consequently it also presents a
high deviation for the mechanical properties measured.

Chapter 4: Influence Of The Formulation And Dispersion Technique Employed
| 124
TABLE 3. Compressive mechanical properties of the manufactured materials
Material E (MPa)
Standard
deviation
(MPa)
Collapse
Strength (MPa)
Standard
deviation
(MPa)
LV Pure 11.09 0.23 0.34 0.009
LV 3% HM 13.84 1.93 0.37 0.081
LV 3% LS 11.88 0.54 0.32 0.001
LV 3% US 12.39 1.38 0.34 0.028
In order to make a better comparison of the material properties the scaling law proposed
by Gibson & Ashby for cellular materials was used23
n
s
f
s
f CP
P
(2)
In this equation, as it was presented previously in section 2.1.3, Pf is the property of the
foamed material, Ps is the same property for the same solid material, and C and n are fitting
constants, C being usually close to 1 and n depending on the cellular structure and typically
close to 2 for low density foams23 and properties such as the Elastic Modulus and Collapse
Strength. Therefore, values of Elastic Modulus and collapse strength were normalized by the
square of the density allowing a better comparison between the properties of materials with
different densities (Figure 4.14 and Figure 4.15).
A small increase with the addition of nanoclays was observed for the relative Elastic
Modulus (9% for HM technique, 14% for LS technique and 7% for US tehcnique), but this
increase was not correlated with improvements in the dispersion quality. Instead of this, for
the ultrasonication dispersion, which is the most optimal technique of dispersion (see section
4.2.1), the lowest improvement in the mechanical properties was obtained. Similar results
were observed for both hand mixing and low shear dispersion techniques.

Chapter 4: Influence Of The Formulation And Dispersion Technique Employed
| 125
LV Pure LV HM LV LS LV US
Modulus (KPa·m6/kg2)
0
1
2
3
4
5
FIGURE 4.14 Relative Elastic Modulus, (E/ρ2) for materials produced using different dispersion
techniques.
LV Pure LV HM LV LS LV US
Rela
tive
Colla
pse
Str
engt
h (
Pa·m
6/k
g2)
0
100
120
FIGURE 4.15. Relative Collapse Strength (σc/ρ2) for materials produced using different dispersion
techniques.

Chapter 4: Influence Of The Formulation And Dispersion Technique Employed
| 126
Other factor that must be taken into account is the anisotropy in the cellular structure,
concretely the anisotropy ratio (R) defined in Chapter 2 (section 2.1.2). This cellular property
has a clear effect over the final mechanical properties23, as it is shown in Eq. 3.
RCEES
Sy
2
(3)
In this equation Ey represents the Elastic Modulus measured in the y direction, R is the
anisotropy ratio (Table 4.2), ES is the modulus of the solid phase, C is a constant with values
close to one.
In order to eliminate the possible influence of the different anisotropies in the results,
the values of the relative modulus 2E were divided by the anisotropy ratio. Figures 4.16
and 4.17 show the results of this new normalization.
LV Pure LV HM LV LS LV US
Rel
ativ
e E
last
ic M
odu
lus
(kP
a·m
6 /kg2 )
0
1
2
3
4
5
FIGURE 4.16 Relative Elastic Modulus to density and anisotropy (E/C∙ρ2), for materials produced
using different dispersion techniques
The obtained results and trends observed are similar to the ones seen in Figures 4.14 and
4.15 indicating that the reason for the different properties of the materials with different
dispersions are not related with variations in the anisotropy ratio.

Chapter 4: Influence Of The Formulation And Dispersion Technique Employed
| 127
LV Pure LV HM LV LS LV US
Rela
tive
Colla
pse
Str
engt
h (
Pa·m
6/k
g2)
0
80
100
FIGURE 4.17 Relative Collapse Strength to density and anisotropy (σc/C∙ρ2), for materials produced using
different dispersion techniques.
Average cell size and cell size distribution are other cell properties that can be related
with changes in the mechanical properties. Anyway, previous works24, 25 have shown the small
effect of these changes in properties such as the Elastic Modulus or the Compression Strength.
Furthermore, an increase in the dispersion of the cell sizes could have a negative effect in the
mechanical properties, as it was commented in the state of the art chapter, section 2.1.2.
Therefore the slight increase in the elastic modulus of the materials containing clays cannot be
related with the increase in the dispersion of cell sizes presented by the clays addition.
A reduction of the relative collapse strength was obtained with the addition of nanoclays
for all the dispersion techniques. For this property, the lowest reduction was produced for the
low‐shear mixing technique, and for the other two techniques the results were very similar,
with a reduction respect to pure material close to 6%. An explanation for these results are
included in the discussion section (section 4.3.3).
Shear modulus results for perpendicular plane to foaming direction (y‐direction) and its
perpendicular (x‐direction) are summarized in Table 4. For y‐direction a small increase of the
modulus was observed again for the worst dispersion technique, while a small decrease was
obtained for the more powerful dispersion techniques.

Chapter 4: Influence Of The Formulation And Dispersion Technique Employed
| 128
TABLE 4. Shear properties of the manufactured materials
Material G y‐direction
(MPa)
Standard
deviation (MPa)
G x‐direction
(MPa)
Standard
deviation (MPa)
LV Pure 5.4 0.2 4.6 0.3
LV 3% HM 5.7 0.3 4.6 0.1
LV 3% LS 4.7 0.2 4.5 0.3
LV 3% US 5.0 0.3 5.1 0.2
For x‐direction similar results were obtained for all dispersion techniques, with exception
for the US technique which presents a slight increase. Differences between x and y‐direction
results could be related to the cellular anisotropy showed in table 4, as it is well known there is
a dependency of the mechanical results with the cellular anisotropy23, 26.
LV Pure LV HM LV LS LV US
Rela
tive
She
ar M
odul
ud
(kP
a·kg
2/2
/m6 )
0,0
0,5
1,0
1,5
2,0
2,5
Gy/
Gx/
FIGURE 4.17. Shear modulus relative to the squared density.

Chapter 4: Influence Of The Formulation And Dispersion Technique Employed
| 129
In order to have a better comparison of the material properties, it is necessary to employ
the scaling law proposed by Gibson & Ashby23 for cellular materials previously used in the case
of the compression properties. With the help of this relationship it is possible to reduce the
influence of the material density in the final mechanical properties. Fig. 4.17 shows the shear
properties relative to the square of density
2G . Figure 4.17 shows the reinforcement for
the material produced with the hand mixing dispersion technique, while for the others
techniques similar properties were observed.
The differences in the material properties detected in shear modulus for different planes
of measurement can be analysed in more detail using the equations proposed by Gibson and
Ashby23. The shear modulus ratio in the two different planes is a fraction of the anisotropy
ratio with a slight dependence given by equation 4:
RG
G
x
y
1
2 (4)
Where iG is the shear modulus measured in the plane defined by a vector in the i
direction and R is the anisotropy ratio of the cellular structure.
2/(1+R)
0,84 0,86 0,88 0,90 0,92 0,94 0,96
G* y/
G* x
1,14
1,16
1,18
1,20
1,22
1,24
1,26
1,28
1,30
LV PureLV 3% HMLV 3% LSLV 3% US
FIGURE 4.16.‐ Correlation between shear modulus and anisotropy, for the different dispersion
techniques.

Chapter 4: Influence Of The Formulation And Dispersion Technique Employed
| 130
As all the elements in Eq. 4 have been measured during the characterisation of the
produced materials, it is possible to analyse if our results are correlated with this equation, as
it is shown in Fig. 4.16. No clear correlation is observed, so other properties (as density
dependence) beyond the anisotropy should to be taken into account.
Other calculations for the shear modulus can be made employing Eq. 521; that relate the
Elastic Modulus and the Shear Modulus.
)1(2 i
ii
EG
(5)
Where Gi is the shear modulus in the plane perpendicular to the i direction, Ei the elastic
modulus in the i direction and νi is the Poisson’s ratio relative to this direction, which is the
negative ratio of the lateral to the axial strain23. With the previously obtained experimental
data is possible to calculate the Poisson’s ratio with Eq. 4 for the different dispersion
techniques, and compare these results with the literature for polyurethane foams.
TABLE 5. Estimation of the Poisson’s ratio for the different materials
Material Poisson’s ratio
LV Pure 0,026
LV 3% HM 0,214
LV 3% LS 0,263
LV 3% US 0,239
Table 5 shows the calculation of the Poisson’s ratio for the different dispersion
techniques. It is possible to observe that for all these techniques its value is in the majority of
the cases close to 1/3, a typical value for foams as it can be seen in Figure 4.18.

Chapter 4: Influence Of The Formulation And Dispersion Technique Employed
| 131
FIGURE 4.18.‐ Data for Poisson’s ratio of foams as function of relative density (ρ*/ρs). Poisson’s ratio is
independent of the relative density. The average value of the data is around 1/3 (extracted from Gibson
et al.23).
Finally, it is possible to conclude that for the shear properties a cross effect of the
different studied characteristics are influencing the results. There is an effect of the changes in
the final density of the nanocomposites, and also there is an effect of the cellular anisotropy
changes. But all these effects are not enough to completely explain all the observed changes,
and modifications of the polyurethane solid matrix by the nanoclays presence should be also
taken into account (section 4.3.3).
4.3.2.3. Mechanical properties in compression: Comparison with previous
results
Collaboration of CellMat Laboratory in different research projects (mentioned in
Chapter 1) allow us the production and characterisation of several polyurethane
nanocomposites foams based on other polyurethane systems. Concretely, NanCore project,
oriented to the improvement of the mechanical properties, has given us a wide collection of
results related with the mechanical properties of polyurethane foams. Thereby, a comparison
with different materials is presented in this section, with the aim of placing the relative to the
square of the density compression properties of BASF nanocomposites against other
nanocomposites. In all cases we used nanoclays cloisite 30B as nanoparticles and the low shear
mixing technique as the method to disperse in each polyol. The preparation and

Chapter 4: Influence Of The Formulation And Dispersion Technique Employed
| 132
characterisation method was the same as those used for the polyurethane based foams of this
thesis.
Rect.1 pure Rect.1 3% BASF Pure BASF3%HM BASF3%LS BASF3%US Rect.2 Pure Rect.2 3% Rect.3 Rect.3 3%
Rela
tive M
odu
lus
(kP
a·m
6/k
g2)
0
1
2
3
4
5
FIGURE 4.19.‐ Elastic Modulus relative to squared density, BASF formulation against different Recticel
formulations.
Rect.1 pure Rect.1 3% BASF Pure BASF3%HM BASF3%LS BASF3%US Rect.2 Pure Rect.2 3% Rect.3 Rect.3 3%
Rela
tive
Col
laps
e S
treng
th (
Pa·
m6/k
g2)
0
20
40
60
80
100
120
140
FIGURE 4.20.‐ Collapse Strength relative to the square of density, BASF formulation against different
Recicel formulations.
It is possible to observe in Fig. 4.19 the Elastic Modulus relative to the square of
density for different formulations and particles. The formulation studied in the present work,
from BASF, it is represented without nanoparticles and with 3% nanoclays concentration, and
with the three different dispersion techniques. Beside these samples, three different Recticel
blends are also included, without nanoparticles and with 3% Nanoclays (Cloisite 30B). Recticel
formulations named as MV and HV were the same employed for the dispersion techniques
study, and the other Recticel formulation (Recticel 1) one extra with a free foaming density of

Chapter 4: Influence Of The Formulation And Dispersion Technique Employed
| 133
150 kg/m3. Thereby, it is possible to observe that between the represented formulations, the
BASF blend presents better properties, with and without nanoclays. It is also possible to
conclude that the improvement over the final properties as consequence of the nanoclays
inclusion is always very small, independently from the employed formulation.
Analogous results can be observed in Fig. 4.20 for the Collapse Strength relative to the
squared density. Again, it is possible to observe that relative properties of the present work
formulation presents very good values even for the unfilled material, and also that the
inclusion of nanoclays in polyurethene foams produce a reduction of the collapse strenght.
4.3.2.4. Thermal conductivity
Thermal conductivity measurements were performed with a hot‐disk transient plane
source (TPS) thermal constant analyser. A disk‐shaped TPS sensor with diameter 6.403 mm
was used in all measurements. Table 7 shows the results of thermal conductivity
measurements. The experimental procedure followed in these tests was explained in section
3.2.4.2. A small decrease of the thermal conductivity by the introduction of nanoclays was
measured, even if a higher density is typically obtained for the nanocomoposite foam. Best
results were obtained for the low shear mixing dispersion technique, with a 3.1% reduction
with respect to the pure material.
TABLE 7.‐ Thermal conductivity results
Material Thermal conductivity
(mW/m∙k)
Standard deviation
(mW/m∙k)
Insulation improvement with
respect to the pure material
LV Pure 38.40 0.22 ‐
LV 3% HM 37.34 1.32 2.7 %
LV 3% LS 37.20 0.23 3.1 %
LV 3% US 37.91 0.24 1.3 %
Again, a considerable dispersion is obtained for HM technique, consistent with the
density measurements. However, small differences between different techniques show that a
good dispersion of the fillers does not imply an improvement of the insulation properties, i.e.,
a thermal conductivity reduction. A reduction of the thermal conductivity can be achieved with

Chapter 4: Influence Of The Formulation And Dispersion Technique Employed
| 134
the addition of nanoclays and a poor dispersion. Part of these changes could be explained by
the cell size reduction and open cell content variation, as will be discussed in the following
section.
4.3.3. Discussion
A general change in the cell size distribution with a clear reduction of the cell size has
been produced by the addition of the nanoclays. The change in the cell size distribution can be
explained by the nucleation effect of nanoclays, the particles act as nucleation centres due to
their low surface energy. The presence of a wider size distribution with a higher cell density
could be related with a double generation of cells along the foaming process: the standard
nucleation, which occurs in the polyurethane without nanoclays, and the nanoparticles
nucleation, which is produced by the presence of nanoparticles. If cells are not nucleated at
the same time, the cell growth will be different and a wide cell size distribution will appear.
On the other hand, Dynamic Mechanical Analysis studies suggest a clear interaction
between nanoclays and polymer matrix. These facts have been corroborated by the SAXS
study, where the peak associated to the basal plane of nanoclays shifts to lower angles
indicating an increase in the inter‐lamellar space, i.e. the nanoclays intercalation. These results
were similar for all dispersion techniques employed, no significance difference has been
observed for the materials produced with different dispersion techniques. So, although a
variation of the dispersion quality in the polyol has been observed in the rheology
characterization of the different dispersion techniques, these variations did not affect the
nanoclays intercalation. All these results are in agreement with a theoretical result studied
during the state of the art in Chapter nº 2, the theory developed by Vaia17. Calculations
showed that a complete layer separation in clays will occur only for very favourable polymer–
surface interactions, to get over the polymer confinement. When this is not possible, the
employment of high shear forces of the particles during the preparation and the processing of
the nanocomposite materials can produce a good dispersion, but the system nevertheless will
be thermodynamically stable, and it will come back to the initial stage. Something similar is
observed in the studied formulations: a good interaction between organo‐modification and
isocyanate reactive produces intercalation, but this intercalation is independent from the
dispersion technique employed. The presence of hydroxyl groups in the nanoparticles
functionalization, which have a great affinity with isocyanate, have a great influence in the
intercalation: the power of the dispersion technique employed only affects to the quality of
the dispersion but not to the intercalation. Moreover, although the employment of a high

Chapter 4: Influence Of The Formulation And Dispersion Technique Employed
| 135
effective dispersion technique does not have a clear effect in the exfoliation/intercalation (see
Fig. 4.21), it has it in the dispersion as it was observed in the initial section of this chapter.
FIGURE 4.21. Dispersion quality and exfoliation
However, despite the intercalation achieved for all dispersion techniques, and the good
dispersion for some of the methods used (and the reduction of cell size), mechanical
properties were not significantly improved. As a matter of fact, best results are not obtained
for the materials showing a better dispersion, more likely the opposite relationship has been
observed: a better dispersion implies worse properties. This could be explained by a chemical
interaction between the urethane groups and nanoclays12, 17 (see Figure 4.22). H‐bonds
between urethane groups are largely responsible of mechanical properties of pure
polyurethane, as they are highly present on the final material structure. Nanoclays could
interact with these bonds, reducing the final number of them. So the expected increase in
mechanical properties due to nanoclays is compensated by the lost in the mechanical
properties due to the H‐bonds that were not formatted. And hence a better dispersion could
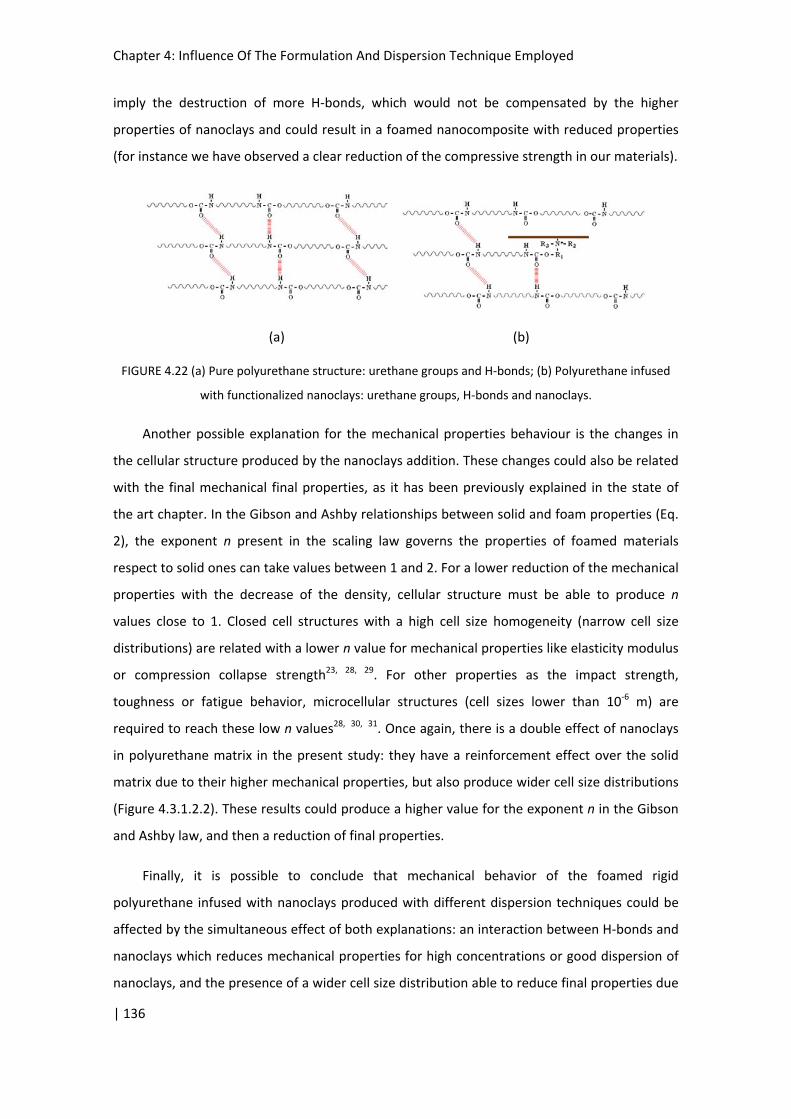
Chapter 4: Influence Of The Formulation And Dispersion Technique Employed
| 136
imply the destruction of more H‐bonds, which would not be compensated by the higher
properties of nanoclays and could result in a foamed nanocomposite with reduced properties
(for instance we have observed a clear reduction of the compressive strength in our materials).
(a) (b)
FIGURE 4.22 (a) Pure polyurethane structure: urethane groups and H‐bonds; (b) Polyurethane infused
with functionalized nanoclays: urethane groups, H‐bonds and nanoclays.
Another possible explanation for the mechanical properties behaviour is the changes in
the cellular structure produced by the nanoclays addition. These changes could also be related
with the final mechanical final properties, as it has been previously explained in the state of
the art chapter. In the Gibson and Ashby relationships between solid and foam properties (Eq.
2), the exponent n present in the scaling law governs the properties of foamed materials
respect to solid ones can take values between 1 and 2. For a lower reduction of the mechanical
properties with the decrease of the density, cellular structure must be able to produce n
values close to 1. Closed cell structures with a high cell size homogeneity (narrow cell size
distributions) are related with a lower n value for mechanical properties like elasticity modulus
or compression collapse strength23, 28, 29. For other properties as the impact strength,
toughness or fatigue behavior, microcellular structures (cell sizes lower than 10‐6 m) are
required to reach these low n values28, 30, 31. Once again, there is a double effect of nanoclays
in polyurethane matrix in the present study: they have a reinforcement effect over the solid
matrix due to their higher mechanical properties, but also produce wider cell size distributions
(Figure 4.3.1.2.2). These results could produce a higher value for the exponent n in the Gibson
and Ashby law, and then a reduction of final properties.
Finally, it is possible to conclude that mechanical behavior of the foamed rigid
polyurethane infused with nanoclays produced with different dispersion techniques could be
affected by the simultaneous effect of both explanations: an interaction between H‐bonds and
nanoclays which reduces mechanical properties for high concentrations or good dispersion of
nanoclays, and the presence of a wider cell size distribution able to reduce final properties due

Chapter 4: Influence Of The Formulation And Dispersion Technique Employed
| 137
to a lower mechanical behavior. These two effects contribute in the direction of having a
discrete improvement of the Elastic Modulus and a slight reduction of the collapse strength.
Thermal conductivity has been reduced by the addition of nanoclays. This reduction is
an expected result due to the relationship between cell size and thermal conductivity that is
explained in the following paragraph. Four mechanisms are involved on thermal conductivity
of polymeric foams: conduction along the solid polymer (qs), conduction through the gas (qg),
thermal radiation (qr), and convection within the cells (qc). The total heat flow (qt) is a result of
the four contributions and can be expressed by a superposition of each mechanism taken
separately 32‐37:
crgst qqqqq (6)
The convective heat transfer is assumed to be negligible35, 38 because of the very small cell
size (350‐500 μm). Foaming agent and solid polymer conductivity can be considered in a first
approximation the same for all manufactured samples. So the reduction of thermal
conductivity must be produced by the variation of the thermal radiative term. In the diffusion
approximation (in this process, the heat flux is proportional to the local gradient of the
potential, in this case the black body emissive power σT4), the radiative heat flux qr(x) can be
expressed as follows39:
x
T
x
T
K
T
x
e
Kxq r
Re
b
Rer
,
3
, 3
16
3
4)( (7)
where λr is the radiative conductivity. Foams used in real applications are usually thick enough
(several millimetres thick) to be considered optically thick; therefore, the radiative flux can be
approximated by Rosseland equation35 as follows:
Rer K
Tn
,
32
3
16 (8)
Where n is the effective index of refraction and Ke,R is the Rosseland mean extinction
coefficient. For polymer foams, n is close to one. This approximation is valid in this study
because the foams under analysis have a volume of gas higher than 95%. Glicksman and co‐
workers35, 40‐42 proposed an equation to predict the extinction coefficient of closed–cell
polyurethane foams. They considered pentagonal dodecahedral cells and an isotropic foam as
a set of randomly oriented blackbody struts. They neglected scattering by cell walls. The strut

Chapter 4: Influence Of The Formulation And Dispersion Technique Employed
| 138
cross section was constant and occupied two‐thirds of the area of an equilateral triangle
formed at the vertices; the Glicksman extinction coefficient (KG, Eq. 6) is a function of the cell
diameter ( ), the foam density (ρf), and the solid polymer density (ρs):
Ws
fS
s
fS
G Kf
f
K
)1(10.4 (9)
Where fS is the mass fraction in the struts, 4.10 is a constant related to the cell geometry
and Kw is the extinction coefficient of the solid polymer. As it has been previously mentioned,
all terms in this expression except the cell size can be considered in a first approximation the
same for the materials with or without nanoclays using different dispersion techniques. So, a
reduction of the cell size produces an increase of K, which produces a reduction of λr and with
a reduction of the total value of λ. KG can be estimated for the different dispersion techniques.
Assuming a fixed mass fraction in the struts of 0.7 11 and an extinction coefficient on solid
polymer of 60000 m‐1 35. The extinction coefficient has been calculated using equation 9. The
results are showed in table 8.
TABLE 8.‐ Glicksman extinction coefficient for the different dispersion techniques.
Material KG (cm-1)
LV Pure 25,9
LV 3% HM 29,0
LV 3% LS 27,6
LV 3% US 28,2
These values show how the reduction of the cell size, that is the only parameter that has
been changed for the different techniques in this estimation, has a clear impact over the
Glicksman extinction coefficient.
Figure 4.23 confirms this relationship between cell size variations and thermal
conductivity reduction: a decrease in the cell size implies a decrease in the thermal

Chapter 4: Influence Of The Formulation And Dispersion Technique Employed
| 139
conductivity. The only material that does not completely fit with this trend is the produced by
ultrasounds.
LV Pure LV 3% HM LV 3% LS LV 3% US
Cel
l Siz
e (µ
m)
380
390
400
410
420
430
440
450
The
rmal
Con
duct
ivity
(m
W/m
·k)
37,0
37,2
37,4
37,6
37,8
38,0
38,2
38,4
Cell SizeThermal Conductivity
FIGURE 4.23. Thermal conductivity and cell size, for the different nanoclays concentration
At this point, other cellular characteristics could be playing an important role. Some
calculations can be done at this respect: if a prediction of the thermal conductivity radiative
term is made only increasing the KG value from 25 to 28 cm‐1, a variation of the conductivity of
only 0.25 mW/m∙K is produced, showing that this change does not completely explains the
change of the measured conductivity. Other cellular characteristics could be playing an
important role. The open cell content will be studied now as a possible factor.
Open cell content has a high weight in the thermal conductivity properties of polymeric
foams14, as it has been observed in the state of the art chapter. The presence of a high amount
of open cells (in polyurethane foams with a foaming agent inside their cells with a thermal
conductivity lower than air) can produce a significant increase of the final thermal conductivity
by the rapid exchange of the foaming agent with atmospheric air43. But also, the presence of
higher amounts of open cells imply that the infrared radiation can find simpler and quicker
paths through the foam, resulting in a lower extinction coefficient (Ke,R) and as a consequence
in a high thermal conductivity.

Chapter 4: Influence Of The Formulation And Dispersion Technique Employed
| 140
As it has been explained in the experimental chapter, thermal conductivity measurements
were conducted a long time after foams production. The foaming agent used in the studied
material was water, which react with the isocyanate producing CO2, with lower thermal
conductivity than air (25.3 mW∙m‐1∙k‐1 at 20°C for air versus 14.5 mW∙m‐1∙k‐1 at 20°C for CO2).
As a drawback, CO2 diffusion in polyurethane foams is really quick, in fact only 40 days after
material production a complete gas exchange between atmospheric air and CO2 has been
produced35. This will be shown in the next chapter, in which a study of the thermal
conductivity evolution with time is presented. For this reason, and taking into account that the
thermal conductivity measurements were made at least 2 months after materials production,
it can be concluded that all the materials presented only atmospheric air inside the cells, when
thermal conductivity test were performed.
Open Cell Content(%)
2 4 6 8 10 12
The
mal
Con
duct
ivity
(m
W/m
·k)
37,0
37,2
37,4
37,6
37,8
LV 3% HMLV 3% LSLV 3% US
FIGURE 4.23.‐ Thermal conductivity vs open cell content for foamed nanocomposites produced using
different dispersion techniques
Comparing the experimental thermal conductivity and open cell content of the nanocomposite
foams, it is possible to observe a clear relation between both properties. So, it is possible to
conclude that although inclusion of nanoclays produces a cell size reduction that produces a
thermal conductivity decrease, differences between the thermal conductivities of the samples
performed with different dispersion techniques could also be related with the open cell
content. As it was shown in Table 4.2 the open cell content of HM (5.6%) and LS (3.1%)

Chapter 4: Influence Of The Formulation And Dispersion Technique Employed
| 141
materials was lower than that of US materials (9.7%). Therefore, as these three materials have
very similar cell sizes distributions, the thermal conductivities are related with the open cell
content as it is shown in Fig. 4.23.
4.4.‐ Summary and conclusions
This chapter has been focused in evaluation the effect of the dispersion quality of the clays
in the polyol blend on the structure and properties of polyurethane foams filled with 3%wt. of
nanoclays. The main results obtained for each property are:
Density measurements: the inclusion of nanoparticles in polyurethane foams produced
a measurable change in final foams density. Nanofillers inclusion produced a small
density reduction only in the low shear mixing technique foam, but in general terms
the macroscopic density tends to increase when nanoclays are added.
Cell size: The presence of nanoclays produce a reduction in the cell size, independently
from the dispersion technique used. The average cell size reduction is close to 10%
with respect to the pure material.
Cellular anisotropy: no clear effects on cellular anisotropy were obtained (around a
10% variation with respect to the pure material) for the different dispersion
techniques.
Open cell content: No clear changes in the open cell content have been observed with
the inclusion of nanoclays, independently from the dispersion technique employed.
Cell size distribution: The normalized standard deviation (NSD) of the cell size
distribution experienced a clear increase (approx. from 0.2 for pure material to 0.3 for
the different techniques). The asymmetry coefficient presented a small reduction
when the clays were added.
Nucleation efficiency: nucleation efficiency of nanoclays was studied for the different
dispersion techniques, showing poor efficiency in comparison with the results
obtained by other authors.
Nanoclays intercalation: X‐ray diffraction experiments performed over the
polyurethane samples produced with different techniques showed an intercalation of
the nanoclays in the polymeric matrix. DMA studies corroborated this result, showing

Chapter 4: Influence Of The Formulation And Dispersion Technique Employed
| 142
a clear effect of nanoclays over the polymeric chains mobility, as it can be concluded
by the increase in Tg and the decrease of tan δ in the glass transition region.
Compression properties (relative to the square of the density): the presence of
nanoclays in polyurethane foams has supposed a small increase of the elastic modulus
(not correlated with the dispersion quality) and a decrease of the compression
strength (near to 6% with respect to the pure material for the ultrasonication
dispersion technique). These effects seem to be connected with two possible facts: the
modification of the cellular structure, with an increase in the width of the cell sizes
distribution, and the relationship between the dispersion quality of the particles and a
possible chemical interaction of nanoclays and polyurethane matrix. This interaction
implies a destruction of H‐bonds between polymeric chains (which have a significant
impact on the mechanical properties of unfilled foams) by the nanoclays presence.
Then, as a powerful dispersion technique implies a better dispersion, a powerful
dispersion technique will also imply a higher interaction between the nanofillers and
the PU matrix, and this will result in worse mechanical properties. As it has been
proven that intercalation of the nanoclays is achieved independently from the
dispersion technique employed, a better dispersion will imply a higher filler‐matrix
interaction and as consequence a reduction of the matrix properties.
Shear properties: small changes has been observed in the value of the shear modulus
with the inclusion of nanoclays, and a clear difference between foaming direction
value (higher value) and perpendicular to foaming direction value (lower value) has
been observed, showing the importance for the analysed materials. There is a clear
correlation between the measured shear modulus and the cellular anisotropy.
Thermal conductivity: Thermal conductivity has been reduced by the addition of
nanoclays. This reduction is an expected result due to the relationship between cell
size and thermal conductivity. An increase of the extinction coefficient has been
observed, but it does not completely explain the changes in the thermal conductivity.
Other factors as the open cell content have an influence over the observed changes.
Finally, it can be concluded from this study the independence of nanoclays inclusion from
the dispersion technique employed. For this reason, low shear dispersion technique was
selected in order to realise a study on the nanoclays concentration effect over the
polyurethane foams final properties. The results of this study will be presented in the next
chapter, playing special attention to the thermal properties and their modelling.

Chapter 4: Influence Of The Formulation And Dispersion Technique Employed
| 143
1 I. Rhoney, S. Brown, N. E. Hudson, R. A. Pethrick, Influence of processing method on the
exfoliation process for organically modified clay systems. I. Polyurethanes, Journal of applied
polymer science, 91(2), 1335‐1343 (2004)
2 F. J. Galindo‐Rosales, P. Moldenaers, J. Vermant, Assessment of the dispersion quality in
polymer nanocomposites by rheological methods, Macromolecular Materials and Engineering,
296 (3‐4), 331–340, (2011)
3 H. H. Winter, Three views of viscoelasticity for Cox–Merz materials, Rheologica acta, 48(3), 241‐243, (2009)
4 M. S. Wang, T. J. Pinnavaia, Clay‐polymer nanocomposites formed from acidic derivatives of
montmorillonite and an epoxy resin, Chemistry of Materials, 6(4), 468‐474 , (1994)
5 K. Liang, ShQ. Shi, Nanoclay filled soy‐based polyurethane foam, Journal of Applied Polymer Science, 119(3):1857–63, (2011)
6 Ł. Piszczyk, M. Strankowski, M. Danowska, J. T. Haponiuk, M. Gazda, Preparation and
characterization of rigid polyurethane‐polyglycerol nanocomposite foams, European Polymer
Journal, 48(10), 1726‐1733, (2012)
7 M. Thirumal, D. Khastgir, N. K. Singha, B. S. Manjunath, Y. P. Naik, Effect of foam density on
the properties of water blown rigid polyurethane foam, Journal of Applied Polymer Science,
108(3), 1810‐1817, (2008)
8 J. S. Colton, N. P. Suh, The nucleation of microcellular thermoplastic foam with additives: Part
I: Theoretical considerations, Polymer Engineering & Science, 27(7), 485‐492, (1987)
9 M. Mitsunaga, Y. Ito, S. S. Ray, M. Okamoto, K. Hironaka, Intercalated polycarbonate/clay
nanocomposites: nanostructure control and foam processing, Macromolecular Materials and
Engineering, 288(7), 543‐548 (2003)
10 J. Shen, C. Zeng, L. J. Lee, Synthesis of polystyrene–carbon nanofibers nanocomposite foams,
Polymer, 46(14), 5218‐5224, (2005)
11 S. Pardo‐Alonso , E. Solórzano , S. Estravís , M. A. Rodríguez‐Perez, J. A. de Saja, In situ evidence of the nanoparticle nucleating effect in polyurethane–nanoclay foamed systems, Soft Matter, 8(44), 11262‐11270 (2012)
12 X. Cao, L. J. Lee, T. Widya, C. Macosko, Polyurethane/clay nanocomposites foams: processing,
structure and properties, Polymer, 46(3), 775‐783, (2005)
13 M. Modesti, A. Lorenzetti, S. Besco, Influence of nanofillers on thermal insulating properties
of polyurethane nanocomposites foams, Polymer Engineering & Science, 47(9), 1351‐1358,
(2007)

Chapter 4: Influence Of The Formulation And Dispersion Technique Employed
| 144
14 G. Harikrishnan, T. U. Patro, D. V. Khakhar, Polyurethane foam‐clay nanocomposites:
nanoclays as cell openers, Industrial & Engineering Chemistry Research, 45(21), 7126‐7134,
(2006)
15 P. Spitael, C. W. Macosko, R. B. McClurg, Block copolymer micelles for nucleation of
microcellular thermoplastic foams, Macromolecules, 37(18), 6874‐6882 (2004)
16 X. Han, C. Zeng, L. J. Lee, K. W. Koelling, D. L. Tomasko, Extrusion of polystyrene
nanocomposite foams with supercritical CO2, Polymer Engineering & Science, 43(6), 1261‐
1275, (2003)
17 R. A. Vaia, E. P. Giannelis, Lattice model of polymer melt intercalation in organically‐modified
layered silicates, Macromolecules, 30(25), 7990‐7999, (1997)
18 S. Vadukumpully, J. Paul, N. Mahanta, S. Valiyaveettil, Flexible conductive graphene/poly
(vinyl chloride) composite thin films with high mechanical strength and thermal stability,
Carbon, 49(1), 198‐205. (2011)
19 A. M. Diez‐Pascual, M. Naffakh, M. A. Gomez, C. Marco, G. Ellis, M. T. Martınez, A. Ansón, J.
M. González‐Domínguez, Y. Martínez‐Rubic, B. Simardc, Development and characterization of
PEEK/carbon nanotube composites, Carbon, 47(13), 3079‐3090, (2009)
20 R. Verdejo, F. Barroso‐Bujans, M. A. Rodriguez‐Perez, J. A. de Saja, M. A. Lopez‐Manchado, Carbon nanotubes provide self‐extinguishing grade to silicone‐based foams, Journal of Materials Chemistry, 18(33), 3933‐3939 (2008)
21 H. S. Xia, M. Song, Preparation and characterization of polyurethane–carbon nanotube
composites, Soft Matter, 1(5), 386‐394 (2005)
22 D. Yan, L. Xu, C. Chen, J. Tang, X. Ji, Z. Li, Enhanced mechanical and thermal properties of rigid polyurethane foam composites containing graphene nanosheets and carbon nanotubes, Polymer International, 61(7), 1107‐1114. (2012)
23 L. J. Gibson, M. F. Ashby, Cellular solids: structure and properties, Pergamon Press, Oxford, (1988)
24 M.A. Rodríguez Pérez, J. Lobos Martín, C. Pérez Muñoz, J. S. Sáez, L. M. González Gutierrez,
M. D. Carpio, Mechanical Behaviour at Low Strains of LDPE Foams with Cell Sizes in the
Microcellular Range: Advantages of Using these Materials in Structural Elements, Cellular
Polymers, 27(6), 347‐362, (2008)
25 M.A. Rodríguez‐Pérez, J. I. González‐Peña, N., Witten, J. A. de Saja, The effect of cell size on
the physical properties of crosslinked closed cell polyethylene foams produced by a high
pressure nitrogen solution process, Cellular Polymers, 21(3), 165‐194, (2002)
26 A. T. Huber, l. J. Gibson, Anisotropy of foams, Journal of Materials Science, 23(8), 3031‐3040, (1988)

Chapter 4: Influence Of The Formulation And Dispersion Technique Employed
| 145
27 A. Lorenzetti, D. Hrelja, S. Besco, M. Roso, M. Modesti, Improvement of nanoclays dispersion
through microwave processing in polyurethane rigid nanocomposite foams, Journal Of Applied
Polymer Science, 115(6), 3667‐3674, (2010)
28 D. Eaves, Handbook of Polymer Foams, Rapra Technology, United Kingdom, (2004)
29 E. Solórzano, Espumas de Aluminio: Proceso de Espumado, Estructura Celular y Propiedades,
PhD. Thesis, Universidad de Valladolid, (2008)
30 V. Kumar, Microcellular Polymers: Novel Materials for 21st
Century, Progress in Rubber and
Plastics Technology, 12(3), 207‐223, (1993)
31 S.T. Lee, Foam Extrusion: Principles and Practice, Technomic Publishing Company, Lancaster‐
Pennsylvania, (2000)
32 A. Cunningham, D. Sparrow, Rigid polyurethane foam: What makes it the most effective
insulant?, Cellular polymers, 5(5), 327–342, (1986)
33 C. J. Tseng, M. Yamaguchi, T. Ohmori, Thermal conductivity of polyurethane foams from
room temperature to 20 K, Cryogenics, 37 (6), 305–312, (1997)
34 J. Kuhn, H. P. Ebert, M. C. Arduini‐Schuster, D. Büttner, J. Fricke, Thermal transport in polystyrene and polyurethane foam insulations, International Journal of Heat and Mass Transfer, 35(7), 1795‐1801, (1992)
35 L. R. Glicksman, In Low Density Cellular Plastics: Physical Basis of Behaviour; Hilyard, N. C.; Cunningham, A., Eds.; Chapman & Hall: London, Chapter 5, (1994)
36 M.A. Rodríguez‐Pérez, O. Alonso, J. Souto, J. A. De Saja, Thermal conductivity of physically crosslinked closed cell polyolefin foams, Polymer Testing, 16(3), 287–298, (1997)
37 G. W. Ball, Proceeding of IOM Polyurethanes Conference 1994, 10, 257 (1994)
38 O. A. Almanza, M. A. Rodríguez‐Pérez, J. A. De Saja, Prediction of the radiation term in the thermal conductivity of crosslinked closed cell polyolefin foams, Journal of Polymer Science Part B: Polymer Physics, 38(7), 993–1004, (2000)
39 R. Siegel, J. R. Howell, Thermal Radiation Heat Transfer; Taylor & Francis: London, (1992)
40 L. R. Glicksman, M. Torpey, Proceedings of Polyurethane World Congress, Aachen, Germany,
(1987)
41 L. R. Glicksman, Heat transfer and ageing of cellular foam insulation, Cellular Polymers, 10(4), 276‐293, (1991)
42 M. A. Schuetz, L. R. Glicksman, A basic study of heat transfer through foam insulation, Journal of Cellular Plastics, 20(2), 114‐121, (1984)

Chapter 4: Influence Of The Formulation And Dispersion Technique Employed
| 146
43 C. J. Hoogendorn, Thermal ageing, Low Density Cellular Plastics, Cunningham, A., Hilyard, N.C., Eds.; Chapman and Hall: London, (1994)


CHAPTER 5:
NANOCLAYS CONCENTRATION: EFFECTS ON MECHANICAL PROPERTIES AND
THERMAL CONDUCTIVITY

| 149
5. NANOCLAYS CONCENTRATION: EFFECTS ON MECHANICAL PROPERTIES AND THERMAL
CONDUCTIVITY
5.1. Objectives
The main objective of this chapter is to analyse the effect of nanoclays concentration
on the structure, thermal and mechanical properties of a rigid polyurethane system. A
particular formulation, a specific type of functionalized nanoclay and a given dispersion
technique of the nanoparticles have been selected, with the objective of reaching a deeper
compression of this system. A complete morphological characterization has been performed,
with special attention to the cellular structure, an aspect not studied in detail on previous
publications as it was mentioned in chapter 2. With all the data obtained from the
characterisation and with the use of different theoretical models, the origin of the changes in
the thermal conductivity will be identified, to establish the influence of the different
parameters that have been modified by the nanoclays presence. In addition, the material
properties in compression and shear have been also analysed in detail.
5.2. Materials
The following materials have been used in this section:
BASF formulation (see table 3.1)
Nanoclays Cloisite 30B (see table 3.2)
The concentrations of nanoclays selected were 0.5, 1, 3 and 5%, and the employed
dispersion technique was low shear mixing (see table 3.3). In this study the size of the used
mold was 310x250x60 mm3, which is a longer mould than the one used in the previous chapter
(110x110x80 mm3). This change was originated by the sample size required by the Holometrix
Heat Flow Meter, that allows accurate measurements of the thermal conductivity (see section
3.2.4.1). This modification together with the use of a different polyurethane batch, could be
the origin of the differences between some of the properties measured for the materials
containing 3wt% nanoclays in this chapter with respect to the properties of materials with the
same nominal composition included in the previous chapter. The foams were produced using
the methodology described in section 3.1.3.

Chapter 5: Nanoclays Concentration Effects
| 150
5.3 Characterization
5.3.1. Structural characterization
5.3.1.1. Density
The density of the foams is presented in table 5.1. The density behaviour with the
amount of nanoclays in the final foams is similar to the behaviour observed in the study of the
different dispersion techniques of Chapter 4. As it can be observed the macroscopic density
tends to increase when nanoclays are added. As it was previously discussed, the reason for this
slight growth could be connected with higher viscosity of the initial blend when clays are
infused1, 2, combined with the fact that nanofillers density (Cloisite 30B ‐ 1980 kg/m3) is higher
than that of the reference foam (around 50 kg/m3). This agrees with the fact that the density
increases with the amount of nanoclays infused in the foams. Furthermore, despite nanoclays
were dehydrated in a vacuum oven for several hours prior to their incorporation and
dispersion in the polyol blend (see section 3.1), this do not always guarantee the complete
absence of water in the nanoclays that could act as chemical blowing agent. Although the
desorbed water molecules that absorb the cations between interlayers of clay evaporate in the
temperature range of 50–170ºC, the dehydroxylation of bound water molecules from the
crystal lattice of pristine clay occurs in the temperature range of 450–900ºC3, 4. Anyway, the
consequences of a possible small amount of absorbed water in the clays is not observed in our
results and probably only play a role for lower nanoclays concentrations, where the effect of
the viscosity and the nanoclays higher density is small.
TABLE 5.1. Density of the manufactured materials
Sample (nanoclays concentration %wt.)
Density (Kg/m3) Standard
deviation (Kg/m3)
0 52,96 0,23
0.5 53,78 0,95
1 54,13 1,40
3 55,09 0,30
5 56,10 0,94
Finally, as it was also commented in the previous chapter, these changes in density (4%
variation with respect to the pure material for the sample containing 5% nanoclays) are small,

Chapter 5: Nanoclays Concentration Effects
| 151
as polyurethane foam density is very sensitive to small changes in environmental conditions,
like moisture and temperature, and to small changes in mixing times5.
5.3.1.2. Cellular structure
Figure 5.1 shows examples of micrographs of the samples with different nanoclays
concentration.
a) b)
c) d)
e)
FIGURE 5.1 SEM images: (a) Pure material, (b) with 0.5% nanoclays, (c) with 1% nanoclays, (d) with 3%
nanoclays, (e) with 5% nanoclays
On these
images it is possible to observe a reduction of the cell size when the clays are added. This
y
x
y
x
y
x
y
x
y
x

Chapter 5: Nanoclays Concentration Effects
| 152
effect is clear even for the lower nanoclays concentration, and apparently for higher amounts
of clays the effect is even higher. Another easily observable effect is cellular anisotropy.
Anisotropy can be observed for pure material and materials with lower nanoclays
concentration, with larger cells in the growing direction (y direction). As the amount of clays is
increased, this effect is hardly observed.
Pure
Cell size (m)
100 150 200 250 300 350 400 450 500 550 600 650 700 750 >750
Rel
ativ
e F
requ
eci
es
0,00
0,05
0,10
0,15
0,20
0,25
0,30
HistoGauss
0,5%
Cell size (m)
100 150 200 250 300 350 400 450 500 550 600 650 700 750 >750
Rel
ativ
e F
requ
eci
es
0,00
0,05
0,10
0,15
0,20
0,25
0,30
0,35
HistoGauss
1%
Cell size (m)
100 150 200 250 300 350 400 450 500 550 600 650 700 750 >750
Rela
tive
Fre
queci
es
0,00
0,05
0,10
0,15
0,20
0,25
0,30
HistoGauss
3%
Cell size (m)
100 150 200 250 300 350 400 450 500 550 600 650 700 750 >750
Rela
tive
Fre
queci
es
0,00
0,05
0,10
0,15
0,20
0,25
0,30
HistoGauss
5%
Cell size (m)
100 150 200 250 300 350 400 450 500 550 600 650 700 750 >750
Rela
tive
Fre
queci
es
0,00
0,05
0,10
0,15
0,20
0,25
0,30
0,35
HistoGauss
FIGURE 5.2 Cell size distributions : Pure material and materials containing different nanoclays
concentrations
Analysis of SEM images provides quantitative information, which can be observed in
Figures 5.2 and 5.3. Figure 5.2 shows the cell size distribution of the different materials in a
plane containing the growing direction. It is easy to corroborate the qualitative observations

Chapter 5: Nanoclays Concentration Effects
| 153
previously mentioned. The inclusion of nanoclays produces a reduction of the average cell size
(figure 3 shows this trend). In addition, a Gaussian fitting of the data allows observing a wider
cell size distribution as the amount of nanoclays is increased. Even for the higher nanoclays
concentration (5%) a double population of cells is detected.
The reason for this cell size reduction could be related with the nucleation effect of the
nanoclays, already mentioned in Chapter 4. Nucleating effect is the consequence of a
reduction of surface energy by the inclusion of particles that allows the creation of additional
cells. This is a phenomenon that could also explain the double population of cells. This possible
explanation, also introduced in Chapter 4, is that there are two nucleation mechanisms: the
standard nucleation, which occurs in the polyurethane without nanoclays, and the
nanoparticles nucleation, which is produced by the presence of nanoparticles. If both
nucleations do not occur at the same time, the cell growth will be different and a double
population of cells will appear.
nanoclays concentration (% wt)
0 1 2 3 4 5 6
cell
size
(µ
m)
100
200
300
400
500
600
FIGURE 5.3 Average cell sizes for the materials under study
Another effect that can be observed is that the reduction of the cell size showed in Fig.
5.3 does not imply a remarkable change in density. In fact cell size change by around 24% but
density is only modified by 4%. This could be a consequence of two simultaneous effects: filler

Chapter 5: Nanoclays Concentration Effects
| 154
could act as nucleating agent for the cells, and stabilizer of the cell walls. The effect of
nanoclays as cell walls stabilizer could reduce coalescence, promoting a higher cell density and
lower cell size. Anyway, a recent study on the same system has shown that the principal role of
nanoclays in this system is as nucleating agent6.
TABLE 5.2 Main cell characteristics of the manufactured materials
Sample (nanoclays
concentration %wt.)
Cell size (µm)
Cell anisotropy R (x/y)
Asymmetry coefficient
(AC) NSD
Cell density (nº cells/m3)
Open cell content (%)
fs7
Reduction of cell size respect pure
material (%)
0 468 1,69 1,33 0,20 1,78×10¹⁰ 6,65 0,67 ‐
0,5 399 1,31 0,78 0,19 2,87×10¹⁰ 6,50 0,62 14,76
1 392 1,12 2,35 0,36 3,11×10¹⁰ 8,24 0,66 16,22
3 354 1,40 1,94 0,35 4,1×10¹⁰ 8,52 0,78 24,36
5 369 1,04 4,93 0,62 3,71×10¹⁰ 8,30 0,76 21,03
Table 5.2 shows the values of cell size, cell anisotropy, asymmetry coefficient, NSD, cell
density, open cell content and mass fraction in the struts (fs 7). As it was previously mentioned,
a cell size reduction is observed with the increase in the amount of nanoclays, with a maximum
reduction for 3wt% nanoclays concentration (around 24% reduction). The anisotropy data
confirms SEM images observations. As the amount of clays is increased the cellular anisotropy
decreases (with the exception of the material with 3% of nanoclays). This behaviour could be
also related with a possible slow down in the polymerization process that will be discussed
again below, and with the increase in the viscosity due to nanoclays addition, which produces
low elongation and stretching of foam cells in the rise direction, reducing the cell anisotropy8.
Asymmetry coefficient presents variations with the amount of clays: a slight reduction for
small amounts and a clear increase for the higher concentrations which is a consequence of
the presence of a bimodal cell size distribution. NSD values show an increase with the amount
of nanoclays added. The high value of NSD for 5% wt nanoclays concentration also
corresponds to a possible bimodal distribution, as it has been shown in Figure 5.2. Cell density
presents a clear increase with the nanoclays presence: even a 60% increase with respect to the

Chapter 5: Nanoclays Concentration Effects
| 155
pure material for the lower concentration, reaching a maximum increase for 3% concentration
with a 130% increase in this specific characteristic. Open cell content of the samples shows a
small increase with the addition of nanoclays, but unlike cell size observations, this variation is
observed for concentration of nanoclays of 1% or higher. The effect of nanoclays as cell opener
is perfectly expectable from other studies9, 10.
Finally, the addition of clays increases the mass fraction in the struts for clays content
above 3% by weight. This effect could be related with the fact that the presence of nanoclays
could slow down the polymerization process11 permitting on the one hand an easier bubble re‐
accommodation (and thus reducing anisotropy) and on the other hand, due to the longer time
between blowing and gelling reactions, giving more time to capillary forces to enhance
drainage in the cell walls and then increasing the strut volumetric fraction. This change in the
kinetics of foams has been analysed by using FTIR (see section 3.2.7 for the experimental
details) and the results are showed in Fig. 5.4 and Table 5.4.
0 100 200 300 400 500-0,05
0,00
0,05
0,10
0,15
0,20
0,25
0,30
0,35
0,40
p (
isoc
yana
te c
onve
rsio
n)
time (s)
p pure p c30b
FIGURE 5.4.‐ Isocyanate conversión for Pure PU and 3wt% C30B infused PU
Figure 5.4 shows the results of a study over the isocyanate conversion, obtained from
a FTIR study of the polymerization reaction. Although the polyurethane employed in this study
is different from the one employed in the present PhD work, results are applicable due to the
similitude between the composition and final densities of both formulations. The isocyanate
conversion data was calculated using the equation:

Chapter 5: Nanoclays Concentration Effects
| 156
0
1A
Ap NCO
NCO (1)
where ANCO indicates the area under the characteristic isocyanate peak in the FTIR spectra
(located at 2270 cm‐1 11) and A0 is the value of this peak at the initial stage of polymerization. In
the time evolution of the isocyanate conversion it is possible to observe a lower degree of
conversion for a given time with the inclusion of nanoclays.
Furthermore, conversion data can be fitted to different kinetics orders (n):
1n Ctkp 0)1ln( (2)
2n Ctkp
01
1 (3)
3n
Ctkp
021
1 (4)
where p is the isocyanate conversion, k0 is the kinetic constant, t is the time value and C is an
integration constant. Table 5.3 shows the fitting of the data of Figure 5.4 to the different
kinetics equations. It is observed a clear reduction of the kinetic constant for all the fitting
equations, as a consequence of the nanoclays inclusion.
TABLE 5.3.‐ Different order kinetics for Pure PU and 3wt% C30B infused PU.
Sample 1st order 2nd order 3rd order
k r2 k r2 K r2
Neat 7,73E‐04 0,9242 1,06E‐03 0,9553 2,92E‐03 0,9773
C30B 5,05E‐04 0,8936 6,32E‐04 0,9212 1,59E‐03 0,9439
This reduction of the polyurethane chemical reaction rate with the inclusion of
nanoparticles has been also studied in previous publications12, 13, and it has been related not
only with the increase of the viscosity due to the nanoparticles presence, but also with a
possible interaction of nanoparticles functionalization and tin catalyst.
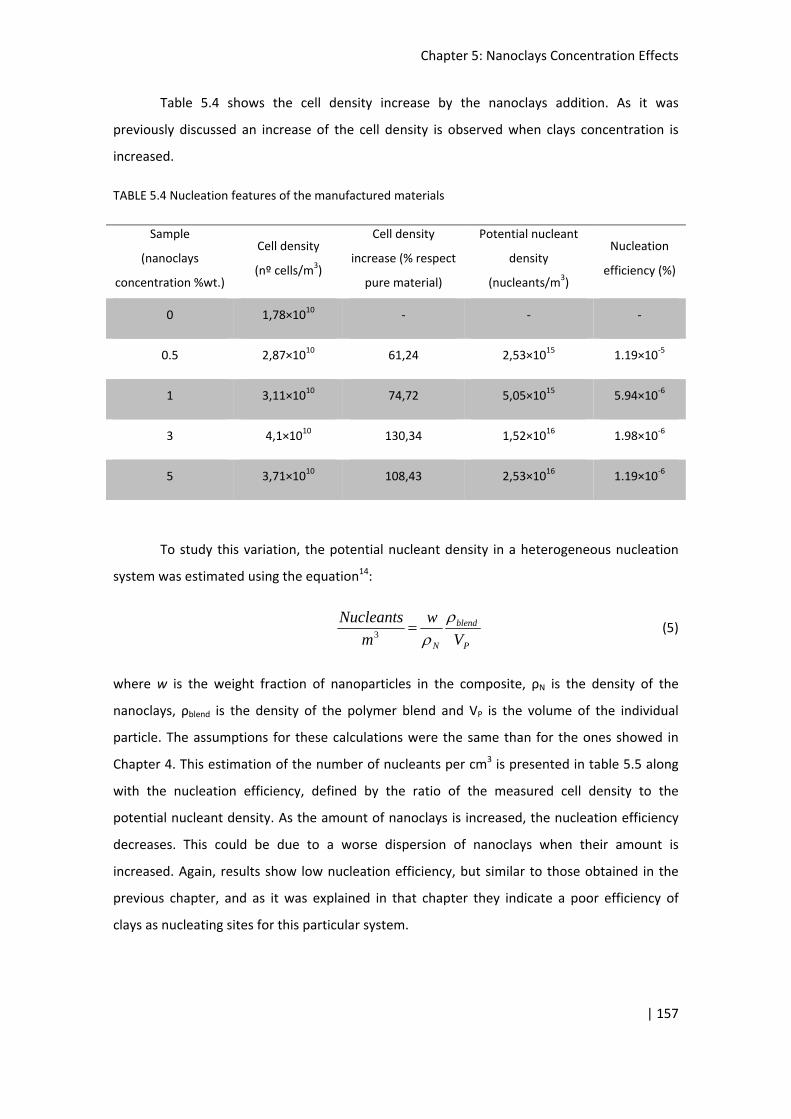
Chapter 5: Nanoclays Concentration Effects
| 157
Table 5.4 shows the cell density increase by the nanoclays addition. As it was
previously discussed an increase of the cell density is observed when clays concentration is
increased.
TABLE 5.4 Nucleation features of the manufactured materials
Sample
(nanoclays
concentration %wt.)
Cell density
(nº cells/m3)
Cell density
increase (% respect
pure material)
Potential nucleant
density
(nucleants/m3)
Nucleation
efficiency (%)
0 1,78×10¹⁰ ‐ ‐ ‐
0.5 2,87×10¹⁰ 61,24 2,53×10¹⁵ 1.19×10‐5
1 3,11×10¹⁰ 74,72 5,05×10¹⁵ 5.94×10‐6
3 4,1×10¹⁰ 130,34 1,52×10¹⁶ 1.98×10‐6
5 3,71×10¹⁰ 108,43 2,53×10¹⁶ 1.19×10‐6
To study this variation, the potential nucleant density in a heterogeneous nucleation
system was estimated using the equation14:
P
blend
N V
w
m
Nucleants
3
(5)
where w is the weight fraction of nanoparticles in the composite, ρN is the density of the
nanoclays, ρblend is the density of the polymer blend and VP is the volume of the individual
particle. The assumptions for these calculations were the same than for the ones showed in
Chapter 4. This estimation of the number of nucleants per cm3 is presented in table 5.5 along
with the nucleation efficiency, defined by the ratio of the measured cell density to the
potential nucleant density. As the amount of nanoclays is increased, the nucleation efficiency
decreases. This could be due to a worse dispersion of nanoclays when their amount is
increased. Again, results show low nucleation efficiency, but similar to those obtained in the
previous chapter, and as it was explained in that chapter they indicate a poor efficiency of
clays as nucleating sites for this particular system.

Chapter 5: Nanoclays Concentration Effects
| 158
5.3.1.3. SAXS
SAXS patterns present in Fig. 5.5 allow obtaining information about the
intercalation/exfoliation of clays in the different systems with different clays concentration. In
this graph, it is also possible to observe the results for the pure material and the pure
nanoclays. As it was presented in the previous chapter, for the pure nanoclays it is detected
the characteristic diffraction peak due to the lamellar structure of the nanoclays, for a 2θ value
close to 4.7 degrees. According to Bragg equation presented in Chapter 3 (Eq. 22), it is possible
to obtain a value for the inter‐lamellar space in Cloisite 30B of 18.8 Å, close to the 18.5 Å data
supplied by Southern Clay Products, Inc. (See table 3.2)
0 2 4 6 8 10
Nor
mal
ized
inte
nsity
-0,1
0,0
0,1
0,2
0,3
0,4
0,5
0,6
0,7
Pure0.5%wt1%wt3%wt5%wtC30B
FIGURE 5.5. SAXS patterns for polyurethane foams prepared with different dispersion techniques and
for pure Cloisite 30B nanoclays.
The results for the different concentrations show a decrease of this peak, and an
increase in its width, together with the presence of a higher peak at around 2.2°. The
variations in the peaks intensities can be explained by the differences in the nanoclays
concentrations. In the case of the 5 %wt concentration, a small shifting to lower angles (that
implies an increase in the inter‐lamellar space) has been observed. The increase in the width of
the peak at 4.7° and the presence of a new peak at 2.2° confirms the intercalation of the

Chapter 5: Nanoclays Concentration Effects
| 159
nanoclays, independently form the nanoclays concentration. On the other hand, the results
clearly show that the clays are not exfoliated by any of the mixing processes used.
5.3.2. Macroscopic characterization
5.3.2.1. Mechanical properties: compression, bending and shear
Figure 5.6.a and 5.6.b show examples of the compression and bending experiments
respectively, where different slopes and compression/bending stresses can be observed for
the different nanoclays concentrations.
Strain (%)
0 2 4 6 8 10 12 14
Str
ess
(MP
a)
0,0
0,1
0,2
0,3
0,4
0,5
Pure0,5 %1 %3 %5 %
(a)

Chapter 5: Nanoclays Concentration Effects
| 160
Strain (%)
0 5 10 15
Str
ess
(MP
a)
0,0
0,2
0,4
0,6
0,8
Pure0,5 %1 %3 %5 %
(b)
FIGURE 5.6. Stress‐strain curves for the different materials: (a) Compression mode; (b) Bending
mode.
These results are summarized in Tables 5.5 and 5.6. It is possible, for the compression
properties, to detect an improvement of the Elastic Modulus of the foams with the inclusion of
nanoclays, with a maximum (around a 20% improvement) for 3 wt% concentration. Collapse
strength also shows a similar improvement with the nanofillers percentage variation, but in
this case the improvement is near 5% for a 5wt % of nanoclays.
Flexural modulus presents a small increase with the presence of nanoclays, similar for all
the percentages of material except for the 5%, which present a higher value (around 11%
higher than pure material). Deformation at maximum strength presents a clear reduction as
the amount of nanoclays added is increased; this is especially significant for clay contents over
3%. Flexural strength presents a slight decrease with respect to pure material for all nanoclays
concentrations.

Chapter 5: Nanoclays Concentration Effects
| 161
TABLE 5.5. Compressive mechanical properties for the manufactured materials
Material
Elastic
Modulus
(MPa)
Standard
Deviation
(MPa)
Collapse
Strength (MPa)
Standard
Deviation
(MPa)
Pure 10,73 0,47 0,35 0,04
0.5 % 10,99 0,11 0,33 0,04
1 % 11,70 0,16 0,34 0,07
3% 12,85 0,13 0,38 0,02
5% 12,16 0,21 0,37 0,04
TABLE 5.6. Flexural mechanical properties for the manufactured materials
Material
Flexural
modulus
(MPa)
Standard
Deviation
(MPa)
Deformation at
maximum strength
(%)
Standard
Deviation
(%)
Flexural
strength
(MPa)
Standard
Deviation
(MPa)
Pure 10,64 0,98 13,98 0,98 0,73 0,04
0.5 % 10,53 0,35 10,06 7,12 0,65 0,04
1 % 10,17 0,33 10,50 1,14 0,65 0,01
3% 10,62 0,22 6,66 2,28 0,58 0,01
5% 11,84 0,29 6,18 1,57 0,63 0,05
Taking into account that there is also some variation in densities due to the nanofillers
addition, the previous comparisons are not precise enough as long as foams with different
densities are compared. In order to compare the properties of materials with different
densities, the values of Elastic Modulus, Collapse Strength, Flexural Modulus and Flexural
Strength were normalized by the square of the density (Figure 5.7, Figure 5.8, Figure 5.9 and
Figure 5.10), considering the Gibson and Ashby relationship between properties and density in
foams15 (equation 2 of chapter 4).

Chapter 5: Nanoclays Concentration Effects
| 162
Nanoclays Concentration (%wt)
0,0 0,5 1,0 3,0 5,0
Rela
tive E
last
ic M
odul
us
(KP
a·m
6 /kg2 )
0
3
4
FIGURE 5.7 Elastic Modulus divided by the square of density, as function of clays concentration
Nanoclays Concentration (%wt)
0,0 0,5 1,0 3,0 5,0
Rel
ativ
e C
olla
pse
Str
engt
h (P
a·m
6/k
g2)
0
80
100
120
140
160
FIGURE 5.8 Collapse Strength divided by the square of density, as function of clays concentration

Chapter 5: Nanoclays Concentration Effects
| 163
Nanoclays Concentration (%wt)
0,0 0,5 1,0 3,0 5,0
Rela
tive
Fle
xura
l Mod
ulus(
kPa·
m6/k
g2)
0
3
4
FIGURE 5.9 Flexural Modulus divided by the square of density, as function of clays concentration
Nanoclays Concentration (%wt)
0,0 0,5 1,0 3,0 5,0
Rel
ativ
e F
lexu
ral S
tgre
ngt
h (
Pa·m
6 /kg2 )
0
150
200
250
300
FIGURE 5.10 Flexural Strength divided by the square of density, as function of clays concentration

Chapter 5: Nanoclays Concentration Effects
| 164
A clear increase with the addition of nanoclays was observed for the relative Young’s
modulus, but it was not correlated with the amount of nanoclays added. Instead of this, best
result was obtained for the 3 wt% nanoclays value, (12.3 % of increase with respect to pure
material). For 5 wt% nanoclays addition, results decreased to similar values than those
obtained for 1 wt% nanoclays.
Relative collapse strength presents a smooth decrease in comparison with the pure
material. This decrease is slightly higher as nanoclays concentration is increased. Decrease
with respect to the pure material goes from 1% to 5% approximately.
Relative flexural modulus presents a slight reduction with the addition of nanoclays with a
minimum for 1 wt% nanoclays (around 8% reduction respect pure material) and similar results
for 5 wt% nanoclays. Anyway, these must be considered taking into account the decrease of
the deformation at maximum strength: the final material presents better modulus but with a
decrease in deformation capabilities.
Relative flexural strength presents a considerable decrease with the increase of the
amount of nanoclays, with a minimum value for 3% (around 27% of decrease respect pure
material), and then experiments a small recuperation for 5wt% of nanoclays concentration
(23% of decrease respect pure material), but with values even distant from the 0.5wt%
concentration (13% of reduction respect pure material, lowest value for nanoclays infused
materials).
TABLE 5.7.‐ Shear modulus results for the plane perpendicular to foaming direction (x‐direction) and for
the plane parallel to foaming (y‐direction) direction
Material G x‐direction (MPa) Standard deviation
(MPa) G y‐direction (MPa)
Standard
deviation (MPa)
Pure 4.7 0.2 4.1 0.2
0.5 % 4.7 0.4 4.1 0.2
1 % 4.6 0.3 4.2 0.3
3% 4.9 0.3 4.3 0.3
5% 4.7 0.2 4.2 0.2

Chapter 5: Nanoclays Concentration Effects
| 165
Shear modulus results for foaming (x‐direction) and perpendicular to foaming (y‐
direction) directions are summarized in Table 5.7. For x‐direction, an increase was observed
again for the 3 wt% concentration, while a small decrease was obtained for the 1wt% and no
variation for the rest of the samples. For y‐direction similar results were obtained for all the
samples. In general it can be concluded that modifications on this property are only marginal.
Differences between x and y‐direction results can be related to the cellular anisotropy showed
in Table 5.2,
In order to have a better comparison of the material properties, we have used again the
scaling law proposed by Gibson & Ashby15 for cellular materials previously used in the case of
the compression properties (Eq. 2 of chapter 4). With the help of this relationship it is possible
to reduce the influence of the material density in the final mechanical properties. As a result,
Fig. 5.11 shows the shear properties relative to the square of the density. This figure shows
that there is still a difference between the foaming direction and its perpendicular direction
and that shear modulus is not affected by the clays addition.
Nanoclays Concentration (%wt)
0 0,5 1 3 5
Rela
tive
She
ar M
odu
lud (
kPa·
kg2/
2 /m6 )
0,0
0,2
0,4
0,6
0,8
1,0
1,2
1,4
1,6
1,8
Gy/
Gx/
FIGURE 5.11. Shear modulus relative to the square of density for materials containing different
ammounts of clays.
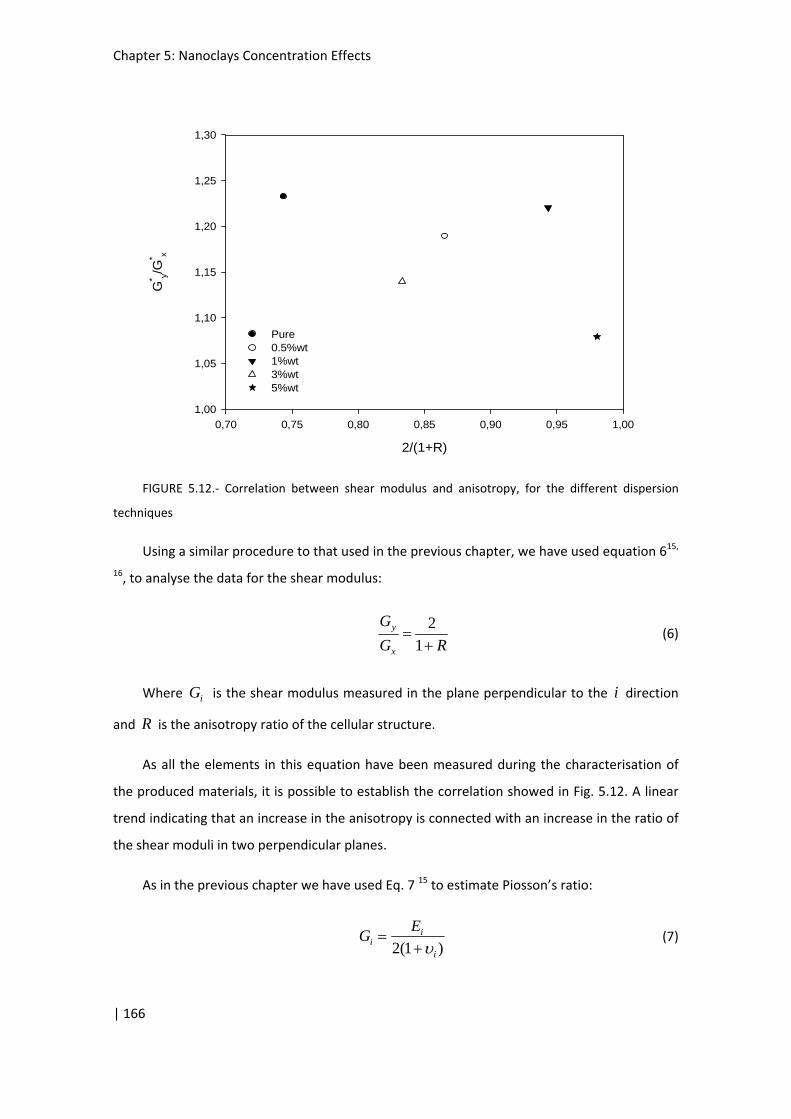
Chapter 5: Nanoclays Concentration Effects
| 166
2/(1+R)
0,70 0,75 0,80 0,85 0,90 0,95 1,00
G* y/
G* x
1,00
1,05
1,10
1,15
1,20
1,25
1,30
Pure0.5%wt1%wt3%wt5%wt
FIGURE 5.12.‐ Correlation between shear modulus and anisotropy, for the different dispersion
techniques
Using a similar procedure to that used in the previous chapter, we have used equation 615,
16, to analyse the data for the shear modulus:
RG
G
x
y
1
2 (6)
Where iG is the shear modulus measured in the plane perpendicular to the i direction
and R is the anisotropy ratio of the cellular structure.
As all the elements in this equation have been measured during the characterisation of
the produced materials, it is possible to establish the correlation showed in Fig. 5.12. A linear
trend indicating that an increase in the anisotropy is connected with an increase in the ratio of
the shear moduli in two perpendicular planes.
As in the previous chapter we have used Eq. 7 15 to estimate Piosson’s ratio:
)1(2 i
ii
EG
(7)

Chapter 5: Nanoclays Concentration Effects
| 167
Where Gi is the shear modulus in the plane perpendicular to the i direction, Ei the elastic
modulus in the i direction and νi is the Poisson’s ratio relative to this direction, which is the
negative ratio of the lateral to the axial strain15.
TABLE 5.8. Experimental calculations for Poisson’s ratio
Nanoclays
concentration (%) Poisson’s ratio
0 0,141
0.5 0,169
1 0,271
3 0,311
5 0,293
Table 5.8 shows the calculation of the Poisson’s ratio for the different materials analysed.
It is possible to observe that there is an increase of the Poisson’s ratio when the amount of
clays is increased, which should be related with the modification of the cellular structure
induced by the clays presence.
The results for the shear modulus indicate that clays do not have a significant influence in
this property. The expected reinforcement of the clays is not observed probably because the
polymer matrix is weaker when the clays are added (number of H‐bonds is reduced) and the
cellular structure is more heterogeneous.
5.3.2.2. Thermal conductivity
Three different points of view were used in the thermal conductivity characterization: the
conductivity evolution with time, the conductivity evolution with temperature and the
conductivity evolution (at 20 ºC) with the amount of nanoclays added. Thereby, time
parameter was firstly characterized to study their effects on the thermal conductivity, after
that effect of temperature was analysed and finally an in‐depth study of the effect of
nanoclays concentration on the thermal conductivity was performed.

Chapter 5: Nanoclays Concentration Effects
| 168
Days
0 10 20 30 40 50
The
rmal
cond
uctiv
ity (
mW
/m·k
)
24
26
28
30
32
34
36
0%wt0.5%wt1%wt3%wt5%wt
FIGURE 5.13. Thermal conductivity as a function of time for foams with different nanoclays
concentration
Time evolution of thermal conductivity can be observed in Fig. 5.13, where the initial
value corresponds to experiments performed 2 days after manufacturing, when a significant
amount of the blowing agent (CO2) was still present inside cells. Other measurements were
made 12 days and 40 days after these first measurements. The increase in the thermal
conductivity can be explained by the diffusion of the foaming agent (CO2; thermal conductivity
at 20ºC: 14.5 mW∙m‐1∙k‐1) outwards the foam, and it substitution by atmospheric air, which has
a higher thermal conductivity coefficient than CO2 (thermal conductivity at 20ºC: 25.3 mW∙m‐
1∙k‐1). As it will be shown in the prediction of the thermal conductivity section, the contribution
of the gas phase has a high weight in the final value of the thermal conductivity (around 70%
of the final value) and small changes in the conductivity of this phase has a clear effect on the
final thermal conductivity. Anyway, Figure 5.13 shows that the changes in the thermal
conductivity between 12 days and 40 days after manufacturing are really small, so it can be
concluded that foaming agent has been completed substituted by air and the foam has
reached a stationary state 12 days after production.
The temperature dependence of the thermal conductivity is shown in figure 5.14.
These data were obtained at least 12 days after foam production. The thermal conductivity
increases linearly with temperature for all the material studied. The parameters of a linear

Chapter 5: Nanoclays Concentration Effects
| 169
fitting for these experimental data are summarised in Table 5.9. The slope of the curve
decreases with the amount of nanoclays. As it will be shown later the inclusion of clays
promotes an increase of the extinction coefficient, parameter that is directly related with the
dependence of radiative term of the thermal conductivity with temperature (see Eq. 8 of
Chapter 4)
TABLE 5.9.‐ Linear fit parameters for the experimental thermal conductivity versus temperature
Sample
(nanoclays%, λ=AT+B) A (mw/m∙K2) B (w/m∙K) r2
0 0.1794 30.62 0.9781
0,50 0.1703 30.74 0.9813
1,00 0.1660 30.16 0.9946
3,00 0.1604 30.56 0.9932
5,00 0.1581 31.05 0.9899
Temperature (°C)
0 10 20 30 40 50 60
The
rmal c
ondu
ctiv
ity (
mW
/m·K
)
30
32
34
36
38
40
42
Pure0.5%wt1%wt3%wt5%wt
FIGURE 5.14.‐ Thermal conductivity as a function of temperature

Chapter 5: Nanoclays Concentration Effects
| 170
The evolution of the thermal conductivity with the amount of nanoclays (measured at
20ºC and for times longer than 40 days after production) can be observed in Figure 5.15.a: a
clear decrease of the thermal conductivity by the introduction of nanoclays is observed, with a
higher reduction for 1% nanoclays concentration. Different parameters control the final
thermal conductivity of foams; one of them with relative importance is the foam cell size17, 18.
Regarding the data of Figure 5.15a and Table 5.2, at least for lower concentrations of
nanoclays, it is possible to observe how a reduction of the cell size is in agreement with a
reduction of the thermal conductivity. This effect reaches a minimum of thermal conductivity
for 1% of nanoclays, but for higher concentrations the conductivity presents an increase, while
the cell size continues its reduction. Others contributions to the thermal conductivity, like the
thermal conductivity of the polymer matrix (that can be affected by the inclusion of highs
amounts of nanoclays) or changes in the cellular structure at other levels (mass fraction in the
struts, open cell content, anisotropy, and so on) can be the origin of this particular behaviour.
a.)
Nanoclays Concentration (%wt)
0 1 2 3 4 5 6
Ther
mal c
ond
uct
ivity
(m
W/m
·k)
33,7
33,8
33,9
34,0
34,1
34,2
34,3
34,4
b.)

Chapter 5: Nanoclays Concentration Effects
| 171
Nanoclays Concentration (%wt)
0,5 1 3 5
Var
iatio
n w
ith r
espe
ct p
ure
mat
eria
l (%
)
-10
-8
-6
-4
-2
0
2
TC Increase respect pure material at 2 daysTC Increase respect pure material at 40 days
FIGURE 5.15. a.) Thermal conductivity at 20ºC as a function of nanoclays concentration, 40 days after
manufacturing, b.) Thermal conductivity variation with respect to pure material for the different
nanoclays concentration, 2 days and 40 days after manufacturing.
Moreover, the effect of the nanoclays over the thermal conductivity presents a better
performance for shorts times after manufacturing: Figure 5.15.b shows how for only two days
after foam productions thermal conductivity of 1wt% foam present a 8% reduction with
respect to pure material. The lower value of the gas conduction term for short times and as
consequence the higher weight of the radiative term explains this result. Anyway, these
considerations will be analyzed in detail in the modelling of thermal conductivity section.
5.3.2.3. Extinction coefficient
Different models have been used in the theoretical study of the thermal conductivity
of polymeric foams. Several authors have modelled the final foam conductivity from the
conductivity of a continuous solid phase and the conductivity of a continuous or discontinuous
gas phase16, 19‐21. For this purpose four physical mechanisms have to be taken into account:
conduction through the solid phase, conduction through the gas phase, convection and
radiation. The extinction coefficient can be used to estimate this last term22, and it can be
calculated theoretically and also measured in the laboratory. Figure 5.16 shows part of the

Chapter 5: Nanoclays Concentration Effects
| 172
experimental set up employed in the Brunker FTIR device for the extinction coefficient
measurement. The experimental method was previously described in Chapter 3 (Section
3.2.6).
Figure 5.16.‐ Holder and sample for FTIR measurements
For the application of different theoretical models aiming at predicting the thermal
conductivity it is necessary a previous characterisation and data treatment of some properties
of the foams. Data such as density, cell size or the amount of material in the struts has been
previously obtained. In this section the spectral extinction coefficient will be calculated from
experimental data. The spectral extinction coefficient (Ke,λ) for thin samples can be obtained by
using Beer’s law23‐28:
)(
,0
,
L
e dxK
n e
(8)
For homogeneous samples, under the assumption that Ke,λ is independent of the
sample thickness, it is possible to write the following expression:
LK n
e
)ln( ,,
(9)
Where L is the sample thickness, and the transmittance ( ,n ) is
,0,
)(
I
xIn (10)
With ,0I as the background spectra and )(xI is the sample spectra
The spectra for different thickness are represented on Fig. 5.16, for the pure polyurethane foam sample:
L

Chapter 5: Nanoclays Concentration Effects
| 173
Wave number (cm-1)
1000200030004000
t n,
0,00
0,05
0,10
0,15
0,20
0,25
0,30
0,61 mm1,17 mm1,751,9 mm2,42 mm
FIGURE 5.16.‐ Transmittance values for different sample thickness (0.61, 1.17, 1.75, 1.9 and 2.42 mm).
Pure polyurethane foam.
By means of a linear fitting (Ln(τe,λ) vs. L), Ke,λ can be obtained (Fig. 5.17) as the slope of
this curve for each λ. Fig 5.18 shows one example of this type of linear fittings.
L (mm)
0,4 0,6 0,8 1,0 1,2 1,4 1,6 1,8 2,0 2,2 2,4 2,6
Ln
()
-6
-5
-4
-3
-2
-1
y = -2,1054x - 0,2579R² = 0,9801
FIGURE 5.17.‐ Linear regression of Ln(τ) vs. sample thickness, for pure material and a wave number of
3996 cm‐1

Chapter 5: Nanoclays Concentration Effects
| 174
TABLE 5.10.‐ Average R2 for the different waves number and for the different samples
Sample (nanoclays %) R2
0 0.988
0.5 0.996
1 0.995
3 0.985
5 0.990
The linear fittings were performed for all the wave numbers in the spectral region
under study. Table 5.10 shows the average of the R2 values for all the linear regressions carried
out. The values are close to 0.99 probing a good correlation in the ,eK versus L fittings.
wave number (cm-1)
01000200030004000
Ke, (
mm
-1)
1,5
2,0
2,5
3,0
3,5
4,0
4,5
5,0
Pure3%wt
FIGURE 5.18 Ke,λ as a function of the wavenumber, for the sample containing 0 and 3 wt% nanoclays, and
some characteristic peaks.
(a) (b) (c)

Chapter 5: Nanoclays Concentration Effects
| 175
Figure 5.18 shows Ke,λ as a function of the wavenumber, for the pure polyurethane
sample and the one containing 3%wt nanoclays. As expected, the extinction coefficient is
clearly higher for the wave numbers at which the base polymer absorbs more energy. There
are plenty of peaks as is usual in polyurethane foams; some of the most notable, from a
compositional point of view, are for example 2270 cm‐1 (isocyanate peak, (b)), 2970 cm‐1 (CH
stretch, reference group in polyurethane (a)), and 1725 cm‐1 (free urethane group (c))29, 30. It is
also interesting that the material containing the clay particles show higher values in all the
spectral region under study.
Calculation of the Rosseland Extinction Coefficient: Ke,R or K
In practical applications, radiation travels only a short distance (mean free path) before
being scattered or absorbed. The transferred energy depends only on the intermediate vicinity
of the position being considered. This approximation is called diffusion approximation (in this
process, the heat flux is proportional to the local gradient of the potential). In this case the
radiative heat flux qr(x) can be expressed as in Eq. 1126 where σT4 is the black body emissive
power, σ is the Stefan‐Boltzmann constant, T is the temperature and λr is the radiative
conductivity:
x
T
x
T
K
T
x
e
Kxq r
Re
b
Rer
,
3
, 3
16
3
4)( (11)
Foams used in real applications are usually thick enough (several millimetres thick) to be
considered optically thick; therefore, the radiative flux can be approximated by Rosseland
equation31 as follows:
Rer K
Tn
,
32
3
16 (12)
Where n is the effective index and Ke,R is the Rosseland mean extinction coefficient. For
polymer foams, n is close to one32. As it was mentioned in Chapter 4, this approximation is
valid in this study because the foams under analysis have a volume of gas (porosity) higher
than 95%.
The Rosseland approximation is valid when the medium absorbs and scatters
isotropically. Under these conditions, Ke,R can be obtained with the following equation23, 27, 28:

Chapter 5: Nanoclays Concentration Effects
| 176
0
,
,
0 ,
,
1
1
dT
e
dT
e
K
K b
b
e
Re
(13)
Where ,be is the spectral black body emissive power and is the wavelength.
TABLE 5.11 Experimental results of the Rosseland extinction coefficient
Sample (nanoclays %) Ke,R (cm‐1)
0 23.18
0.5 25.47
1 30.42
3 33.68
5 27.31
Therefore, the Rosseland mean extinction coefficient is an average value of ,eK
weighed by the local spectral energy flux. Once ,eK is measured, it is possible to obtain ReK ,
(or K) using equation 7. The Rosseland mean extinction coefficient (Ke,R) for the samples under
study are calculates using Eq. 13 and summarized in Table 5.11. A preliminary analysis of these
results shows that the extinction coefficient increases when the clays are added, showing a
maximum for a 3% clays concentration.
5.3.3. Modelling of the thermal conductivity
5.3.3.1 Modelling the Extinction Coefficient
Glicksman and coworkers16, 19, 33, 37 proposed an equation to predict the extinction
coefficient of closed–cell polyurethane foams. They considered pentagonal dodecahedral cells
and an isotropic foam as a set of randomly oriented blackbody struts. They neglected
scattering by the cell walls. The strut cross section was constant and occupied two‐thirds of the
area of an equilateral triangle formed at the vertices; the Glicksman extinction coefficient (KG)
depends on the cell size ( ), foam density ( f ) and solid polymer density ( s ):

Chapter 5: Nanoclays Concentration Effects
| 177
s
fS
G
f
K 10.4 (14)
where 4.10 is a constant related to the cell geometry and fS is the mass fraction in the struts.
Glicksman et al. also included the absorption of the cell walls (KHKw, where Kw is the
extinction coefficient of the solid polymer). This contribution was then combined with that of
the struts to yield the overall extinction coefficient of the foam (equation 16)
WHedgesG KKKK (15)
Ws
fS
s
fS
G Kf
f
K
)1(10.4 (16)
The cell wall term, which is valid for foams with thin cell walls (δ < 30 μm), includes the
hypothetical extinction coefficient for a uniform material occupying the entire volume of the
foam and having the same attenuation as thin cell walls. As it has been mentioned Kw is the
extinction coefficient of the solid polymer, and the value for PU (60000 m‐1) was obtained from
literature22.
Nanoclays Concentration (%wt)
0 0,5 1 3 5
K (
cm-1
)
0
10
20
30
40
ExperimentalGlicksman
FIGURE 5.19.‐ Glicksman model / experimental correlation for the extinction coefficient

Chapter 5: Nanoclays Concentration Effects
| 178
The results obtained when K is calculated using Equation 16 and the experimental
extinction coefficients (Table 6) are shown in Figure 5.19 as a function of nanoclays
concentration. Similar values and a similar trend as a function of the clays content are
observed for the Glicksman model and the experimental results. In both cases K increases
when the clays are added, with an increase up to 3% nanoclays concentration, and then a
slight reduction.
The average difference between the K theoretical and experimental values can be
observed in Table 5.12, with a variation of ±5‐10%. But this difference is not constant and
there are changes with the amount of nanoclays. In general terms, there are modifications in
the extinction coefficient behaviour by the addition of the nanoclays that cannot be explained
only by a reduction of the cell size or a modification of the mass fraction in the struts, as both
terms are included in the Glicksman model. In fact, the data of figure 5.20 show that Glicksman
model predict smaller changes in K than the ones experimentally measured. The two
components of Glicksman equation include information about the cellular structure and about
the material that forms the cells; then if the Glicksman model is taken as valid, the difference
with the experimental data could be associated to a change in Kw due to the introduction of
nanoclays.
TABLE 5.12 Extinction coefficients: experimental values calculated from the Glicksman model. Difference
between them and extinction coefficient of the solid material obtained from Eq. 16 and experimental
data.
Sample
(nanoclays
concentration %wt.)
K (exp.) (cm‐1) K Glicksman
(cm‐1) Variation %
Kω (m‐1) exp.
(Calculated
using Eq. 16)
0 23.18 25.40 9.56 46266
0.5 25.47 28.53 11.99 42946
1 30.42 28.91 ‐4.94 68945
3 33.68 29.59 ‐12.14 97505
5 27.31 28.93 5.95 46488
The higher Kω are obtained for the materials containing 1 and 3 wt% clays, the value
for 3wt% clays is two times higher than the one calculated for the pure polymer. These results
suggest that clays could act as IR blockers, contributing to reduce the heat flow by radiation.

Chapter 5: Nanoclays Concentration Effects
| 179
5.3.3.2 Prediction of Thermal Conductivity
It is well known that the thermal conductivity of polymer foams is due to four
mechanisms: conduction along the cell walls and the struts of the solid polymer (λs),
conduction through the gas phase (λg), thermal radiation (λr), and convection within the cells
(λc). The total heat flow (λt) is a result of the four contributions and can be expressed by a
superposition of each mechanism taken separately22, 34‐38:
crgst (17)
The convective heat transfer is assumed to be negligible22, 39 because of the very small cell size
(350‐500 μm) of the foams under study. In a first approximation, it is possible to consider
conductive terms of the gas (Eq. 18) and the solid (Eq. 19), and subtract them from the
experimental value of the conductivity to obtain an experimental value of the thermal
radiation term39. The expression of these conductive terms is shown in equations 12 and 13,
where Vg is the volume fraction of the gas phase (sf 1 ), λg is the thermal conductivity of
the gas at a given temperature, Vs is the volume fraction of solid (sf ), λs is the thermal
conductivity of solid polyurethane (0.26 W∙m‐1k‐1)36 and fs is the mass fraction in struts. The
contribution to the thermal conductivity from the gas phase (eq 18) depends on the own
nature of the gas. In our case, the gas is air at atmospheric pressure for which the conductivity
at 20 ºC has been taken as 25.3 mW∙m‐1k‐1. The contribution of the solid PU to the thermal
conductivity has been considered constant with the temperature.
ggg V (18)
ssss V
f )33
2( (19)
The last expression can be modified to introduce the effect of cellular anisotropy, as it is
shown below:
41
)1(23 b
af
b
af
Vss
sss (20)
where a is the cell size in the direction of the temperature gradient, and b is the cell size in the
perpendicular direction to the heat flow.

Chapter 5: Nanoclays Concentration Effects
| 180
a.‐
Nanoclays Concentration (%wt)
0 0,5 1 3 5
% o
ver
the
final
val
ue
0
10
20
30
40
50
60
gas
solid
radiative
b.‐
Nanoclays Concentration (%wt)
0 0,5 1 3 5
% o
ver
the
final
val
ue
0
20
40
60
80
gas
solid
radiative
FIGURE 5.20 Weight of the different contributions in the thermal conductivity, for different nanoclays
concentration: a.‐ two days after manufacturing; b.‐ 40 days after manufacturing

Chapter 5: Nanoclays Concentration Effects
| 181
Using Equations 18 and 19 and the characteristics of the cellular structure in each foam
it is possible to calculate the weight of each term on the thermal conductivity of the measured
foams: Figure 5.20.a,b show the results of these calculations for the gas phase conductive term
and the solid phase conductive term, assuming the radiative term as the difference between
the experimental conductivity and the above two, as it can be obtained from Eq. 17. With
these calculations, it is possible to observe that the conductivity of the gas phase is responsible
of around 50% of the final conductivity of the foam a short time after manufacturing, while Fig.
5.20.b shows that 40 days after manufacturing is responsible of around 70%. This information
confirms the data from Fig. 5.15.b, where it is observed a higher reduction of the thermal
conductivity for short times: this reduction is confirmed by the lower weight of the gas phase
term at short times, and corroborates the time evolution of the total conductivity (Fig. 5.13),
as the air (25.3 mW∙m‐1∙k‐1 at 20ºC) presents a higher thermal conductivity than the CO2 (1.45
mW∙m‐1∙k‐1 at 20ºC), and the CO2 originally present inside the cells as result of the foaming
reaction diffuses out the foam and is substituted by atmospheric air.
Nanoclays Concentration (%wt)
0 0,5 1 3 5
% o
ver
the
final
val
ue
0
20
40
60
80
gas
solid
radiative
FIGURE 5.21. Weight of the different contributions in the thermal conductivity, for different
nanoclays concentration, including the cellular anisotropy correction (Eq. 20).

Chapter 5: Nanoclays Concentration Effects
| 182
Assuming the anisotropy corrections (Eq. 20), some changes are observed in Fig. 5.21
with respect to Fig. 5.20.b, mainly in the solid and radiative terms. A decrease of the radiative
term is clearly observed, while an increase of the solid phase weight is observed. As expected,
the growing direction increases the solid contribution.
Trying to have a better understanding of the radiative term, Equation 21, the
Rosseland equation, has been used to calculate the radiative term, where Ke,R is the extinction
coefficient, σ is the Stephan‐Boltzmann constant and T is the temperature. The value of Ke,R
can be the experimental one or a theoretical value calculated with the Glicksman expression
(Table 5.13).
Re
r
K
T
,
3
3
16 (21)
If we assume the validity of the Rosseland equation, the total conductivity (λt) can be
estimated by using the equation 22:
Ress
sgg
t
K
TV
fV
,
3
3
16)
33
2(
(22)
This expression can be modified in the case of high anisotropy (Eq. 20), as it is shown
below:
Ress
ssgg
t
K
T
b
af
b
af
VV
,
341
3
16)1(2
3
(23)
Once the total thermal conductivity is measured, it is possible to predict the radiative term
using Eq. 22 and Eq. 23:
gstrad .exp. (24)
This equation has been used in Figure 5.22.a, where the experimental value of the
radiative contribution is compared with the values obtained using the Roseland equation with
the two possible data for the extinction coefficient. It is possible to observe similar trends for
the experimental values and these obtained using the Rosseland equation (Figure 5.22.b) for
low nanoclays concentration, but also a different trend for the higher values of nanoclays
concentrations.
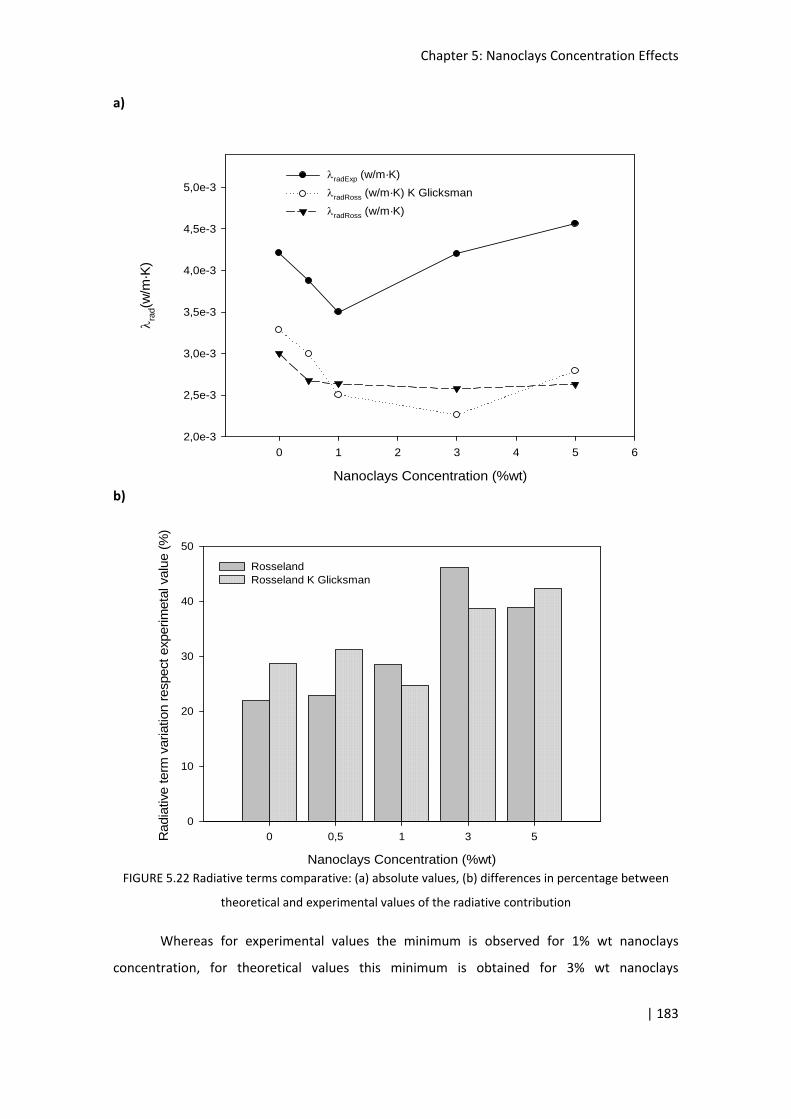
Chapter 5: Nanoclays Concentration Effects
| 183
a)
Nanoclays Concentration (%wt)
0 1 2 3 4 5 6
rad(w
/m·K
)
2,0e-3
2,5e-3
3,0e-3
3,5e-3
4,0e-3
4,5e-3
5,0e-3radExp (w/m·K)
radRoss (w/m·K) K Glicksman
radRoss (w/m·K)
b)
Nanoclays Concentration (%wt)
0 0,5 1 3 5Radi
ativ
e term
var
iatio
n re
spect
exp
erim
etal
val
ue
(%)
0
10
20
30
40
50
RosselandRosseland K Glicksman
FIGURE 5.22 Radiative terms comparative: (a) absolute values, (b) differences in percentage between
theoretical and experimental values of the radiative contribution
Whereas for experimental values the minimum is observed for 1% wt nanoclays
concentration, for theoretical values this minimum is obtained for 3% wt nanoclays

Chapter 5: Nanoclays Concentration Effects
| 184
concentrations. It can be also observed how for 3 and 5% wt nanoclays concentration the
differences in the predictions are higher.
a)
Nanoclays Concentration (%wt)
0 1 2 3 4 5 6
rad
(w/m
·K)
2,0e-3
2,5e-3
3,0e-3
3,5e-3
4,0e-3
4,5e-3
5,0e-3
radExp (w/m·K)
radRoss (w/m·K) K Glicksman
radRoss (w/m·K)
b)
Nanoclays Concentration (%wt)
0 0,5 1 3 5Rad
iativ
e te
rm v
aria
tion
resp
ect ex
perim
eta
l valu
e (%
)
0
10
20
30
40
50
RosselandRosseland K Glicksman
FIGURE 5.23 Radiative terms comparative with cellular anisotropy corrections: (a) absolute values, (b)
relative to experimental values variations
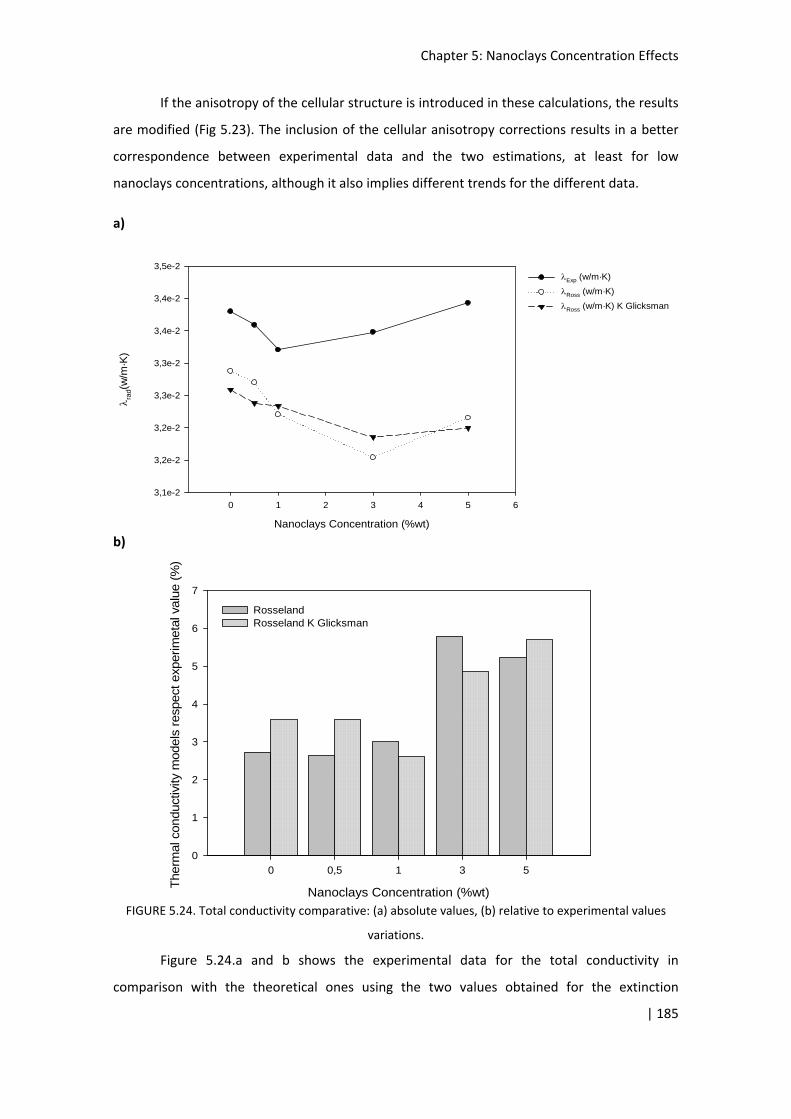
Chapter 5: Nanoclays Concentration Effects
| 185
If the anisotropy of the cellular structure is introduced in these calculations, the results
are modified (Fig 5.23). The inclusion of the cellular anisotropy corrections results in a better
correspondence between experimental data and the two estimations, at least for low
nanoclays concentrations, although it also implies different trends for the different data.
a)
Nanoclays Concentration (%wt)
0 1 2 3 4 5 6
rad(
w/m
·K)
3,1e-2
3,2e-2
3,2e-2
3,3e-2
3,3e-2
3,4e-2
3,4e-2
3,5e-2Exp (w/m·K)
Ross (w/m·K)
Ross (w/m·K) K Glicksman
b)
Nanoclays Concentration (%wt)
0 0,5 1 3 5
The
rmal
con
duct
ivity
mod
els
res
pect
exp
erim
eta
l valu
e (%
)
0
1
2
3
4
5
6
7
RosselandRosseland K Glicksman
FIGURE 5.24. Total conductivity comparative: (a) absolute values, (b) relative to experimental values
variations.
Figure 5.24.a and b shows the experimental data for the total conductivity in
comparison with the theoretical ones using the two values obtained for the extinction

Chapter 5: Nanoclays Concentration Effects
| 186
coefficient. The predictions are close to the real values (difference lower than 7%), being the
theoretical values lower than the real ones. The two theoretical results are very close each
other. Another observation is that while the experimental data presents a minimum at 1wt%
clays, the theoretical ones have the minimum at 3wt% nanoclays concentration.
a)
Nanoclays Concentration (%wt)
0 1 2 3 4 5 6
(w
/m·K
)
3,2e-2
3,2e-2
3,3e-2
3,3e-2
3,4e-2
3,4e-2
3,5e-2Exp (w/m·K)
Ross (w/m·K)
Ross (w/m·K) K Glicksman
b)
Nanoclays Concentration (%wt)
0 0,5 1 3 5
The
rmal c
ond
uct
ivity
mod
els
resp
ect exp
erim
etal v
alu
e (%
)
0
1
2
3
4
5
6
RosselandRosseland K Glicksman
Figure 5.25 Total thermal conductivity comparative including cellular anisotropy correction: (a) absolute
values, (b) % difference in comparison with experimental values.

Chapter 5: Nanoclays Concentration Effects
| 187
Once more, introducing anisotropy corrections, a better correlation is observed,
showed in Fig. 5.25. In addition, a more similar trend between the experimental and the
estimated values is observed.
5.4 Discussion
Two different topics will be discussed in the present section: mechanical properties
and thermal conductivity. The nanoclays effect of adding nanoclays over these properties are
considered.
First of all, we will focus on the mechanical behaviour. Despite the good dispersion and
the possible intercalation achieved, mechanical properties were not significantly improved. As
matter of fact, best results were achieved for a 3 wt% nanoclays concentration for the relative
compression elastic modulus, with a reduction for higher concentrations. Our explanation is
similar to the one given in Chapter 4: limited improvement or even the reduction of several
mechanical properties could have its origin in the chemical interaction between urethane
groups and the functionalization of nanoclays40, 41. H‐bonds between urethane groups are
largely responsible of mechanical properties of pure polyurethane. The nanoclays
functionalization could interact with these bonds, reducing the final number of them. So the
expected increase in mechanical properties due to nanoclays is limited or cancelled (see Fig.
4.21 in Chapter 4).
In the previous chapter, it was observed that a better dispersion could imply the
destruction of more H‐bonds, and a larger reduction of the mechanical properties, due to a
higher interaction between nanoclays and H‐bonds. In the present case, a higher
concentration of nanoclays could imply a similar result than a good dispersion: a higher
interaction between nanoclays and H‐bonds. Due to this, good results are obtained for lower
nanoclays concentration, for which reinforcement of the polyurethane matrix by the nanoclays
compensates the negative effect on the mechanical properties of nanoclays interaction with H‐
bonds. However, this effect of reinforcement does not appear for higher concentrations,
where a decrease in the mechanical properties is observed.
On the other hand, cellular structure changes produced by the nanoclays addition could
be also related with the final mechanical properties. As it has been explained in the state of
the art Chapter, closed cell structures and with a high cell size homogeneity (narrow cell size
distributions) are related with better mechanical properties such as elasticity modulus or
collapse strength15, 42, 43. Again, there is a double effect of nanoclays depending on their

Chapter 5: Nanoclays Concentration Effects
| 188
concentration: they have a reinforcement effect for lower concentrations, but for higher
concentrations (5% wt.) wider cell size distribution are produced (Figure 5.2) and a much
higher value of NSD is obtained (Table 5.2). These results could also contribute in the observed
reduction of the mechanical performance at higher filler loadings.
Therefore, it is possible to conclude that mechanical behavior of polyurethane foams
with different amounts of nanoclays could be affected by the simultaneous effect of both
explanations: an interaction between H‐bonds and nanoclays which reduces mechanical
properties for high concentrations or good dispersion of nanoclays, and the presence of a bi‐
modal, wider cell sizes reduce final properties. These effects seem to compensate or even are
stronger than the potential reinforcement offered by the nanoparticles.
In order to have a complete understanding of thermal conductivity behaviour, it is
necessary the analysis of the different heat conduction mechanisms. As it has been mentioned,
for the range of cell sizes under study there are three different contributions to the thermal
conductivity: conduction through the gas, thermal radiation and conduction along the cell
walls and struts of the solid polymer. The discussion is focused in each mechanism.
Conduction through the gas phase: This term, as can be seen in Figure 5.20 and 5.21, is the
most significant in the final value of the thermal conductivity, with a weight between 71‐
72%. For this reason, small changes in the thermal conductivity of the gas phase of the
foam can produce significant changes in the conductivity. This has been shown on Figure
5.13, where time evolution of the thermal conductivity can be observed. Gas present
inside the cells changes from CO2 (14.5 mW∙m‐1∙K‐1) to atmospheric air (25.3 mW∙m‐1∙K‐1)
due to the diffusion through the polymeric matrix. Some calculations can be made with the
reference model (equations 22 and 23); assuming that conduction through the solid and
radiation conductivity are time independent. The contribution to thermal conductivity of
the gas phase in the first measurement (t=2 days) can be calculated subtracting from the
experimental value of λ the solid phase and the radiation term contributions. Considering
Eq. 18, these calculations show that for the initial value of the thermal conductivity (t=2
days) the value of the gas phase conductivity (λg∙Vg) is between 18 and 20 mW∙m‐1∙K‐1
(Figure 5.26) while 40 days after is close to 27. These data are in accordance with Fig.
5.21.a and b, where it can be observed that the lower conductivity of the gas phase results
in a lower weight of this term on the final conductivity.

Chapter 5: Nanoclays Concentration Effects
| 189
Initial values of the thermal conductivity of the gas inside the cells can be calculated as
a mixture of CO2 and air using as a first approximation the Wassiljeva equation44:
n
in
jijj
iim
Ay
y
1
1
(25)
Where m is the thermal conductivity of the mixture, i is the thermal conductivity of
pure component i , iy and jy are the mole fractions of components i and j and ijA is a
function of the binary system that is typically equal to 1. With this equation is possible to
observe that for the initial thermal conductivity measurement, approximately a 40% of CO2
present on the cells has been substituted by air (Figure 5.27). Although first measurements
were made around 48h after foams manufacture, influence of high temperatures of foams
during and just after polymerization over the diffusion laws must be taken into account to
explain these results. Moreover, insulating properties of polyurethane increase the time
that the foam is at high temperature, increasing the diffusion rate of the CO2 outside the
final material.
Nanoclays Concentration (%wt)
0 1 2 3 4 5 6
Gas
pha
se c
ontr
ibut
ion
(g·V
g)
to the
the
rmal
con
duct
ivity
(m
W/m
·K)
16
18
20
22
24
26
28
30
2 days12 days40 days
FIGURE 5.26. Thermal conductivity of the gas phase (λg∙Vg) in the initial measurements of the thermal
conductivity (2, 12 and 40 days after production)

Chapter 5: Nanoclays Concentration Effects
| 190
Nanoclays Concentration (%wt)
0 0,5 1 3 5
%
0
20
40
60
80
100CO2
Air
FIGURE 5.27. Concentration of gases present in the cellular structure two days after foams production
Nanoclays Concentration (%wt)
0 0,5 1 3 5
Gas
phas
e co
ntr
ibut
ion v
aria
tion
resp
ect
after
man
ufac
turin
g(%
)
0
10
20
30
40
50
60
12 days after manufacturing40 days after manufacturing
FIGURE 5.28.‐ Change in the gas conductivity (%) respect to initial value
Analogue calculations can be made for measurements performed 12 days and 40 days
after foam production, obtaining 100% air concentration which confirms the asymptotical

Chapter 5: Nanoclays Concentration Effects
| 191
behaviour of the time evolution. Moreover, Figure 5.28 shows the change in the thermal
conductivity of the gas phase with respect to its initial value measured 2 days after
manufacturing. It is possible to observe that the higher change in this term was produced
between 2 days and 12 days after manufacturing, while between 12 and 40 days small
changes are produced.
The differences observed as a function of clays concentration could be due to
inaccuracies in the determination of the gases contribution and/or different diffusion rates
due to nanoclays presence. In order to perform a more detailed analysis of this topic,
experiments at different times (between 2 and 12 days) should be performed. Other factor
that can affect the conduction through the gas phase, and that was studied in the previous
Chapter, is the open cell content. However, this effect seems to be negligible, because the
inclusion of nanoclays only increase the open cell content in a 2%, except for the 0.5%
nanoclays concentration, where similar values than for the pure material are obtained.
Radiation contribution: This term experiments substantial changes by nanoclays presence.
Considering Eq. 21, changes in radiation conduction are deeply related with changes in the
extinction coefficient (higher extinction coefficient implies lower conductivity). In turn,
accepting Glicksman model, extinction coefficient is also related with the solid polymer
absorption coefficient (Kω), the cell size and the mass fraction in struts.
Comparing experimental values for extinction coefficient and theoretical values (taking
into account only the measured changes produced by nanoclays: cell size reduction and
variation in mass fraction on struts), both present a maximum for 3% nanoclays, but
completely different values (table 5.13). This difference between experimental data and
modelling data makes necessary to consider a possible change in the extinction coefficient
of the solid polymeric matrix (Kω) produced by the inclusion of the nanoclays, in order to
have a better agreement between model and experimental values. It has been proved that
the cells size and mass fraction on struts variations are not enough to completely explain
the changes produced in the radiation conduction term. A change in the solid material
properties should be considered: therefore we should assume that nanoclays play a role as
IR‐blockers in polyurethane foams.
Conduction through the solid phase: Nanoclays presence could affect the conductivity of
the solid phase. Differences between experimental and theoretical data observed in
Figures 5.24 and 5.25 could be due to this variation. A different trend between

Chapter 5: Nanoclays Concentration Effects
| 192
experimental and theoretical values is observed: models present a minimum for thermal
conductivity at 3 or even 5 wt% nanoclays concentration, whereas for experimental data
the minimum is reached at 1 wt%. Other properties with a considerable influence on the
thermal conductivity also present a minimum for 3%wt nanoclays concentration, as the
cell size.
Considering a variation of the conduction through the solid phase is a possible way to
explain this difference in behaviour. As it was carried out for thermal conductivity of the
gas phase, theoretical values of the solid polymer can be extrapolated. Figure 5.29 shows
how the calculated values (the value was calculated to obtain a perfect match between
experimental and theoretical values) vary with the amount of nanoclays with respect to
the pure material. A clear growing dependence with the nanoclays concentration is
observed for 3 and 5%wt. For 0.5%wt, and even more for 1%wt nanoclays concentration, a
reduction is observed. This increase in the cconductivity of the solid material could be
related with the creation of a percolation network for clays contents around 3% by
weight45‐47. Rheological characterization could help to clarify this subject48, 49, showing
where the percolation threshold is located for these materials.
Nanoclays Concentration (%wt)
0 0,5 1 3 5
Sol
id p
hase
con
trib
utio
n (
s·V
s)
to the
rmal
con
dutiv
ity (
mW
/m·K
)
0
100
200
300
400Solid material contributionSolid material contribution with anisotropy corrections
FIGURE 5.29. Solid polymer conductivity contribution (λs∙Vs) calculated using Eq. 23.
Chapter 5: Nanoclays Concentration Effects
| 193
Finally, assuming a good approach of the Glicksman model to the experimental data, it is
possible to assume that the changes produced in thermal conductivity by the inclusion of
nanoclays in different concentrations are due not only to morphological changes in the cellular
structure, as the cell modification in size, mass fraction in struts and anisotropy, but also to
changes in the thermal properties of the polymeric matrix and in the extinction coefficient of
the solid polymer.
5.5.‐ Summary and conclusions
This chapter have been focused on evaluating the effect of nanoclays concentration on the
structure and properties of polyurethane foams filled with nanoclays. The different properties
and the main results obtained are:
Density measurements: the inclusion of nanoparticles in polyurethane foams produced
a measurable change in final foams density. A small reduction for the lower value of
the infused nanoclays was measured, however in general terms the macroscopic
density tends to increase when nanoclays are added. Similarly to the case of the
dispersion techniques study, the reason for this slight growth could be connected with
a higher viscosity of the initial blend when clays are infused, combined with the fact
that nanofillers density (Cloisite 30B ‐ 1980 kg/m3) is usually higher than that of the
reference foam (around 50 kg/m3).
Cell size: The presence of nanoclays reduces the average cell size. This cell size
reduction has been explained by an increase in the nucleation due to the nanoclays
presence. Cell size presents a reducing general trend with nanoclays concentration
until 3%wt, which presents the highest reduction (24% reduction respect pure
polyurethane foam). A small increase in cell size is observed for the highest clays
concentration (5wt%, 21% of cell size reduction respect pure material).
Cellular anisotropy: It was observed a variation in the anisotropy of the cellular
structure with the nanoclays concentration. The pure foams and the materials with
low filling amounts have an anisotropic cellular structure, with cells oriented in the
growing direction. As the amount of clays is increased a general trend is observed with
a reduction in the anisotropy value.
Open cell content: Open cell content does not present significant changes by the
nanoclays presence, with similar values to the pure material for the nanoclays infused

Chapter 5: Nanoclays Concentration Effects
| 194
foams. An average value of 6.5% was observed for the pure materials and 0.5%wt
nanoclays concentration samples, while an average value around 8.5% was observed
for the rest of the samples.
Mass fraction in the struts: Considerable changes were observed in the mass fraction
in the struts with the increase of nanoclays in: from a value of 0.67 for the pure
material, small variations were observed until 1wt% of nanoclays (0.62 for 0.5%wt and
0.66 for 1wt%), increasing then to 0.78 for 3wt% and to 0.76 for 5wt%. These
considerable changes in the mass distribution in the cellular structure have clear
effects on the extinction coefficient and thermal conductivity. The origin of the
modification of fs could be related to changes produced in the viscosity of the polyol‐
nanoclays mixture as the nanoclays amount is increased, fact which can be vital during
the cell formation and stabilization. Another possible explanation of this result is
associated with a modification of the reaction kinetics. The clays could modify the
blowing reaction kinetics, the gelling reaction kinetics or both. Initial experiments on
this area have showed a delay of the reactions kinetics when clays are added.
Cell size distribution: The normalized standard deviation (NSD) of the cell size
distributions experiences a clear increase when clays are infused. In fact, a bimodal cell
size distribution was detected for high amounts of clays (0.62 of NSD value for 5wt%,
clearly higher than the 0.20 measured for pure material). The asymmetry coefficient
showed an increase when the clays were added.
Nucleation efficiency: nucleation efficiency of nanoclays was studied for the different
nanoclay concentrations, showing a clear reduction as the amount of nanoclays was
increased. Comparing these results with the observed in the studied bibliography, it is
possible to conclude that poor nucleation efficiency has been achieved.
Compression properties: the presence of nanoclays in polyurethane foams has
supposed not only a small improvement of the elastic modulus (around 12% of
increase with respect to the pure material for 3wt% nanoclays), but also a decrease of
the compression strength (between 1 to 5% of decrease with respect to the pure
material). A correlation with the possible interaction of nanoclays and the
polyurethane matrix has been proposed: a destruction of H‐bonds between chains
(which have a significant impact on the mechanical properties of unfilled polyurethane
foams) by the nanoclays presence could the responsible of the slight improvements or

Chapter 5: Nanoclays Concentration Effects
| 195
even the reduction (σ) of the mechanical. The increase in the nanoclays added has not
supposed an increase of the compression properties, even a reduction of them.
Flexural properties: a decrease of the deformation at maximum strength has been
observed, with more than a 50% reduction with respect to the pure material for the
higher clays concentrations. Flexural modulus presents an initial increase of 12% with
respect to the pure material for the lower concentration (0.5%wt.), lower
improvements for 1 and 3 wt% concentrations and a 20% increase for the 5%wt
sample. Flexural strength presents a significant decrease in its absolute values by the
addition of nanoclays (from 0.73 MPa for pure material to an average value of 0.65
MPa for the nanoclays infused materials).
Shear properties: small changes has been observed in the shear modulus with the
inclusion of nanoclays, with a clear difference between plane perpendicular to the
foaming direction (higher value) and its perpendicular (lower value). It has been
observed a correlation between the cellular anisotropy measured with SEM technique
and the measured shear modulus.
Improving the thermal conductivity of polyurethane foams by using nanoclays as
nucleating agents and IR‐blockers: Time evolution of the different samples was
studied, showing an increase of this property as the diffusion of the blowing agent
(CO2) from the cells to the atmosphere was produced. After 12 days from the material
production, a stable value was measured, reaching the stationary state. For the final
values of thermal conductivity in stationary state, it was observed a reduction with the
addition of nanoclays. This improvement can be considered as a secondary effect of
the cell size reduction (thermal conductivity presents a high dependence with the cell
size) that has been produced by the addition of nanoclays. The higher decrease of the
thermal conductivity was observed for 1wt% of nanoclays. The increase of the amount
of nanoclays further than 1wt% did not produce a higher reduction of the thermal
conductivity; moreover, worse results than for the pure material were obtained.
Higher reduction of the cell size was observed with higher amounts of nanoclays, but
the thermal conductivity reduction stops at 1 wt %. In order to have a better
understanding of this behaviour, a detailed modelling was conducted. It was also
measured the temperature evolution of the thermal conductivity for the different
samples, observing a linear increase with the temperature for all the materials studied.
The slope of the curve, consequence of the linear fit, shows a decrease with the

Chapter 5: Nanoclays Concentration Effects
| 196
amount of nanoclays. As the cell size is related with the inclusion of nanoclays, this
change can be explained taking into account the change in the cell size.
Modelling the thermal conductivity of the developed foams, using as a basis the
experimental determination of the extinction coefficient of the foams: Besides cell
size, extinction coefficient and the percentage of mass in the struts are critical
parameters which experimented changes with the modifications in the nanoclays
concentration and that have a clear influence over the thermal conductivity. Thereby,
the modelling of the different heat transfer mechanisms involved has helped to better
understand the thermal behaviour of the polyurethane‐nanoclays system. For the
range of cell sizes under study there are three different contributions to the thermal
conductivity: conduction through the gas, thermal radiation and conduction along the
cell walls and struts of the solid polymer. These are the results for each of them:
Thermal conductivity through the gas phase: it is the most significant mechanism
over the final value of the thermal conductivity (71‐72 % contribution). This
contribution does not present significant changes due to the nanoclays addition.
Moreover, the biggest change observed in this term is due to the effect of the
foaming gas (CO2) diffusion and it substitution by atmospheric air.
Thermal radiation: this contribution experiments clear changes by the nanoclays
presence. Considering Rosseland model (eq. 5.21), this term is deeply related with
changes in the extinction coefficient (higher extinction coefficient implies lower
conductivity by radiation). In turn, accepting Glicksman model (eq. 5.14),
extinction coefficient is also related with the cell size, density, mass fraction in
struts and the optical properties of the solid phase. Comparing experimental
values for extinction coefficient and theoretical values taking into account the
changes produced by nanoclays (cell size reduction and variation in mass fraction
in struts), both present a maximum for 3wt% nanoclays, but completely different
values (table 5.13). The cells size and mass fraction in struts variations are not
enough to completely explain the changes produced in the radiation conduction
term: a possible change in the optical properties of the solid material has been
considered. This could be related with the reflexion/absorption of IR radiation by
the clay platelets, which seem to contribute from this point of view.
Conduction through the solid phase: for this term, experimental data do not agree
with the modelling data. The creation of a percolation network by the nanoclays

Chapter 5: Nanoclays Concentration Effects
| 197
could be the reason; this will increase the thermal conductivity of the solid phase.
This network could have a percolation threshold between 1 and 3wt%, so its effect
would begin to be detected for a content of 3wt% or higher.
In summary, the modelling carried out allows concluding that the changes produced in
thermal conductivity by the inclusion of nanoclays in different concentrations are due
to a combination of morphological changes in the cellular structure (as the cell size and
mass fraction in struts), changes in the optical properties of the polymeric matrix (clay
acting as IR‐blockers) and modifications of the thermal conductivity of the solid phase
(clays increasing this conductivity).

Chapter 5: Nanoclays Concentration Effects
| 198
1 K. Liang, ShQ. Shi, Nanoclay filled soy‐based polyurethane foam, Journal of Applied Polymer
Science, 119(3):1857–63, (2011)
2 Ł. Piszczyk, M. Strankowski, M. Danowska, J. T. Haponiuk, M. Gazda, Preparation and
characterization of rigid polyurethane‐polyglycerol nanocomposite foams, European Polymer
Journal, 48(10), 1726‐1733, (2012)
3 J. Y. Lee, H. K. Lee, Characterization of organobentonite used for polymer nanocomposites,
Materials Chemistry and Physics, 85(2), 410‐415, (2004)
4 D. García‐López, I. Gobernado‐Mitre, J. F. Fernández, J. C. Merino, J. M. Pastor, Influence of
clay modification process in PA6‐layered silicate nanocomposite properties, Polymer, 46(8),
2758‐2765, (2005)
5 M. Thirumal, D. Khastgir, N. K. Singha, B. S. Manjunath, Y. P. Naik, Effect of foam density on
the properties of water blown rigid polyurethane foam, Journal of Applied Polymer Science,
108(3), 1810‐1817, (2008)
6 S. Pardo‐Alonso , E. Solórzano , S. Estravís , M. A. Rodríguez‐Perez, J. A. de Saja, In situ
evidence of the nanoparticle nucleating effect in polyurethane–nanoclay foamed systems, Soft
Matter, 8(44), 11262‐11270 (2012)
7 S. Pardo‐Alonso, E. Solórzano, L. Brabant, P. Vanderniepen, M. Dierick, L. Van Hoorebeke, (3d)
Analysis of the Progressive Modification of the Cellular Architecture in Polyurethane
Nanocomposite Foams via X‐Ray Microtomography, European Polymer Journal, 49(5), 999‐
1006, (2013)
8 H. Bahrambeygi, A. Rabbi, K. Nasouri, A. M. Shoushtari, M. R. Babaei, Morphological and
structural developments in nanoparticles polyurethane foam nanocomposite's synthesis and
their effects on mechanical properties, Advances in Polymer Technology, 32(S1), E545–E555,
(2012)
9 G. Harikrishnan, T. U. Patro, D. V. Khakhar, Polyurethane foam‐clay nanocomposites:
nanoclays as cell openers, Industrial & Engineering Chemistry Research, 45(21), 7126‐7134,
(2006)
10 R. Gu, M. M. Sain, Effects of Wood Fiber and Microclay on the Performance of Soy Based
Polyurethane Foams, Journal of Polymers and the Environment, 21(1), 30‐38 (2012)

Chapter 5: Nanoclays Concentration Effects
| 199
11 M. Bernal, M. A. Lopez‐Manchado, R. Vedejo, In situ foaming evolution of flexible
polyurethane foam nanocomposites, Macromolecular Chemistry and Physics, 212(9), 971‐979
(2011)
12 A.C. Draye, J.J. Tondeur, Kinetic study of organotin‐catalyzed alcohol–isocyanate reactions:
Part 1: Inhibition by carboxylic acids in toluene, Journal of Molecular Catalysis A: Chemical,
138(2), 135‐144, (1999)
13 M. Bernal, M. Martin‐Gallego, L. J. Romasanta, A. C. Mortamet, M. A. López‐Manchado, A. J.
Ryan, R. Verdejo, Effect of hard segment content and carbon‐based nanostructures on the
kinetics of flexible polyurethane nanocomposite foams, Polymer, 53(19), 4025‐4032 (2012)
14 P. Spitael, C. W. Macosko, R. B. McClurg, Block copolymer micelles for nucleation of
microcellular thermoplastic foams, Macromolecules, 37(18), 6874‐6882 (2004)
15 L. J. Gibson, M. F. Ashby, Cellular solids: structure and properties, Pergamon Press, Oxford,
(1988)
16 M. A. Schuetz, L. R. Glicksman, A basic study of heat transfer through foam insulation,
Journal of Cellular Plastics, 20(2), 114‐121, (1984)
17 M. Modesti, A. Lorenzetti, S. Besco, Influence of nanofillers on thermal insulating properties
of polyurethane nanocomposites foams, Polymer Engineering & Science, 47(9), 1351‐1358,
(2007)
18 M.A. Rodríguez‐Pérez, J. I. González‐Peña, N., Witten, J. A. de Saja, The effect of cell size on
the physical properties of crosslinked closed cell polyethylene foams produced by a high
pressure nitrogen solution process, Cellular Polymers, 21(3), 165‐194, (2002)
19 L.R. Glicksman, M. Torpey, Proceedings of PolyurethaneWorld Congress, Aachen, Germany,
(1987)
20 L. R. Glicksman, A. Marge; J. D. Moreno, Developments in Radiative Heat Transfer, 203, 45‐
54, (1992)
21 D. Doermann, J.F. Sacadura, Heat transfer in open cell foam insulation. Journal of heat
transfer, 118(1), 88‐93, (1996)
22 L. R. Glicksman, In Low Density Cellular Plastics: Physical Basis of Behaviour, Hilyard, N. C.,
Cunningham, A., Eds., Chapman & Hall: London, Chapter 5, (1994)
23 H.R.N. Jones, In Radiation Heat Transfer, Oxford Science: Oxford, (2000)

Chapter 5: Nanoclays Concentration Effects
| 200
24 J. W. Wu, W. F. Sung, H.S. Chu, Thermal conductivity of polyurethane foams, International
journal of heat and mass transfer, 42 (12), 2211–2217, (1999)
25 C. J. Tseng, K. T. Kuo, Thermal radiative properties of phenolic foam insulation, Journal of
Quantitative Spectroscopy and Radiative Transfer, 72(4), 349‐359, (2002)
26 R. Siegel, J. R. Howell, In Thermal Radiation Heat Transfer, Taylor & Francis: London, (1992)
27 F. Kreith, M. S. Bohn, In Principios de Transferencia de Calor, 6th ed., Thomson Paraninfo:
Madrid, Spain, (2002)
28 J. P. Holman, In Heat Transfer, 9th ed.; McGraw‐Hill: New York, (2002)
29 M. Modesti, A. Lorenzetti, An experimental method for evaluating isocyanate conversion and
trimer formation in polyisocyanate–polyurethane foams, European polymer journal, 37(5),
949‐954, (2001)
30 M. M. Coleman, D. J. Skrovanek, J. Hu, P.C. Painter, Hydrogen bonding in polymer blends. 1.
FTIR studies of urethane‐ether blends, Macromolecules, 21(1), 59‐65, (1988)
31 S. Pavlidou, C.D. Papaspyrides, A review on polymer–layered silicate nanocomposites,
Progress in polymer science, 33(12), 1119–1198, (2008)
32 D. Baillis, M. Arduini‐Schuster, J. F. Sacadura, Identification of spectral radiative properties of
polyurethane foam from hemispherical and bi‐directional transmittance and reflectance
measurements, Journal of Quantitative Spectroscopy and Radiative Transfer, 73(2), 297‐306,
(2002)
33 L. R. Glicksman, Heat transfer and ageing of cellular foam insulation, Cellular polymers,
10(4), 276‐293, (1991)
34 A. Cunningham, D. Sparrow, Rigid polyurethane foam: What makes it the most effective
insulant?, Cellular polymers, 5(5), 327–342, (1986)
35 C. J. Tseng, M. Yamaguchi, T. Ohmori, Thermal conductivity of polyurethane foams from
room temperature to 20 K, Cryogenics, 37 (6), 305–312, (1997)
36 J. Kuhn, H. P. Ebert, M. C. Arduini‐Schuster, D. Büttner, J. Fricke, Thermal transport in
polystyrene and polyurethane foam insulations, International Journal of Heat and Mass
Transfer, 35(7), 1795‐1801, (1992)
37 M.A. Rodríguez‐Pérez, O. Alonso, J. Souto, J. A. De Saja, Thermal conductivity of physically
crosslinked closed cell polyolefin foams, Polymer Testing, 16(3), 287–298, (1997)

Chapter 5: Nanoclays Concentration Effects
| 201
38 G. W. Ball, Proceeding of IOM Polyurethanes Conference 1994, 10, 257 (1994)
39 O. A. Almanza, M. A. Rodríguez‐Pérez, J. A. De Saja, Prediction of the radiation term in the
thermal conductivity of crosslinked closed cell polyolefin foams, Journal of Polymer Science Part
B: Polymer Physics, 38(7), 993–1004, (2000)
40 X. Cao, L. J. Lee, T. Widya, C. Macosko, Polyurethane/clay nanocomposites foams:
processing, structure and properties, Polymer, 46(3), 775‐783, (2005)
41 A. Lorenzetti, D. Hrelja, S. Besco, M. Roso, M. Modesti, Improvement of nanoclays dispersion
through microwave processing in polyurethane rigid nanocomposite foams, Journal Of Applied
Polymer Science, 115(6), 3667‐3674, (2010)
42 D. Eaves, Handbook of Polymer Foams, Rapra Technology, United Kingdom, (2004)
43 E. Solórzano, Espumas de Aluminio: Proceso de Espumado, Estructura Celular y Propiedades,
PhD Work, University of Valladolid, (2008)
44 R.C. Read, J.M. Prausnitz, T.K. Sherwood, The properties of gases and liquids, 3rd
edn.,McGraw‐Hill, NY, (1977)
45 F. H. Gojny, M. H. G. Wichmann, B. Fiedler, I. A. Kinloch, W. Bauhofer, A. H. Windle, K.
Schulte, Evaluation and identification of electrical and thermal conduction mechanisms in
carbon nanotube/epoxy composites, Polymer, 47(6), 2036‐2045, (2006)
46 J. N. Coleman, S. Curran, A.B. Dalton, A.P. Davey, B. McCarthy, W. Blau, R. C. Barklie,
Percolation‐dominated conductivity in a conjugated‐polymer‐carbon‐nanotube composite,
Physical Review B, 58(12), R7492‐R7495, (1998)
47 C. Lin, D.D.L. Chung, Nanoclay Paste as a Thermal Interface Material for Smooth Surfaces,
Journal of electronic materials, 37(11), 1698‐1709, (2008)
48 I. Novák, I. Krupa, I. Chodák, Relation between electrical and mechanical properties in
polyurethane/carbon black adhesives, Journal of materials science letters, 21(13), 1039‐1041,
(2002)
49 R. Krishnamoorti, K. Yurekli, Rheology of polymer layered silicate nanocomposites, Current
Opinion in Colloid & Interface Science, 6(5), 464‐470, (2001)


CHAPTER 6:
CONCLUSIONS AND FUTURE WORK


| 205
6.‐ CONCLUSIONS AND FUTURE WORK
During the development of the present work, a complete study of a foamed
polyurethane system containing nanoclays has been performed: the effect on the structure
and properties of different dispersion techniques and different amount of nanoclays has been
studied. For this purpose, rheological studies of the nanoclays dispersion in the polyol
component were performed in order to characterise the different dispersion techniques,
extending this study to different polyurethane commercial formulations. These studies allowed
selecting the most sensitive formulation to the dispersion techniques employed, and then this
blend was used for the production and characterization of foamed polyurethane samples
without and with nanoclays, dispersed with different techniques and in different
concentrations.
According to the objectives initially presented, and in correspondence to the order in
which they were presented, the present work allows obtaining the following conclusions for
both methodological and scientific objectives:
Methodological Objectives
Setting up of the polyurethane foams production technique: a procedure for
the production of polyurethane foams and polyurethane foams containing
nanoclays has been set up. Various facilities have been purchased and their
use optimized. Among them, an ultrasound probe, a low shear mixer and a
high‐shear mixer. To complete this activity other sub‐objectives were fulfilled:
Selection of polyurethane formulations: the polyol blends
from three different formulations were studied with
rheological techniques for the selection of the most sensitive
formulation with respect to the different dispersion
techniques employed. Due to the high sensitivity of the low
viscosity blend, this material was selected for the production
and characterization of rigid polyurethane‐nanoclays foams
Selection of nanoparticles: Cloisite 30B nanoclays were
selected due to their specific functionalization for
polyurethane reagents, and their use in the related literature
of polyurethane nanocomposites foams.

Chapter 6: Conclusions and Future Work
| 206
Optimization of the dispersion methods: Three different
dispersion techniques (hand mixing, low shear mixing and
ultrasonication) have been used and their dispersion
capabilities analysed.
Optimization of the processing parameters: Different
parameters have been taken into account to establish a robust
and reproducible process to produce foamed nanocomposites
based on polyurethane. Some of them are: mixing time,
temperature, moisture, size of the sample and so on.
Optimization of the polyurethane characterization techniques: The
experimental techniques used at CellMat for the characterization of polymer
foams have been adapted to obtain a reliable and precise characterization of
rigid polyurethane foams and rigid polyurethane foams reinforced with
nanoclays.
Scientific Objectives
Evaluating in detail the effect of the dispersion quality of the clays in the polyol
blend on the structure and properties of polyurethane foams filled with
nanoclays: Samples with a constant amount of nanoclays (3 %wt) dispersed in
the polyol with different dispersion techniques (hand mixing, low shear mixing
and ultrasonication) were manufactured in order to characterise the effect of
the different techniques on their density, structure, mechanical and thermal
properties. The formulation with a lower viscosity of the polyol was the most
sensitive to the different dispersion techniques employed. The measured
properties, besides the exfoliation characterization, showed that even for the
powerless dispersion techniques (hand mixing), nanoclays intercalation was
produced. Our analysis indicated that low shear mixing presented the best
balance between mixing time, power used and final properties. A detailed
review of the different properties studied is summarized in the following
paragraphs:
Density measurements: the inclusion of nanoparticles in polyurethane
foams produced a measurable change in final foams density.
Nanofillers inclusion produced a small density reduction only in the
low shear mixing technique foam, but in general terms the

Chapter 6: Conclusions and Future Work
| 207
macroscopic density tends to increase when nanoclays are added. The
reason for this slight growth could be connected with a higher viscosity
of the initial blend when clays are infused, combined with the fact that
nanofillers density (Cloisite 30B ‐ 1980 kg/m3) is usually higher than
that of the reference foam (around 50 kg/m3).
Cell size: The presence of nanoclays reduces the average cell size.
Regarding to the different dispersion techniques, no clear effect on the
cell size has been observed, obtaining an average reduction close to
10% with respect to the pure material.
Cellular anisotropy: no clear effects on cellular anisotropy were
obtained (around a 10% variation with respect to the pure material)
for the different dispersion techniques.
Open cell content: Open cell content does not present significant
changes by the nanoclays presence, with similar values for nanoclays
infused foams than for pure materials. Measured values were always
under 10% independently from the dispersion technique employed.
Cell size distribution: The normalized standard deviation (NSD) of the
cell size distributions experienced a clear increase (approx. from 0.2
for pure material to 0.3 for the different techniques). The asymmetry
coefficient presented a small reduction with respect to the pure
material.
Nucleation efficiency: nucleation efficiency of nanoclays was studied
for the different dispersion techniques, showing a similar value to
what it is found in the studied bibliography.
Nanoclays intercalation: X‐ray diffraction experiments performed over
the polyurethane samples produced with different formulations
showed an intercalation of the nanoclays in the polymeric matrix. This
effect was observed for all the dispersion methods used, showing that
intercalation can be achieved even for the poorest dispersion (high
viscosity blend). DMA studies over the samples manufactured with
BASF material and different dispersion techniques corroborated this
result, showing a clear effect of nanoclays over the polymeric chains
Chapter 6: Conclusions and Future Work
| 208
mobility, as it can be concluded by the increase in Tg and the decrease
of tan δ.
Compression properties (relative to the square of the density): the
presence of nanoclays in polyurethane foams has supposed a small
increase of the elastic modulus (not correlated with the dispersion
quality) and a decrease of the compression strength (near to 6% with
respect to the pure material for the ultrasonication dispersion
technique). These effects seem to be connected with two possible
facts: the modification of the cellular structure, with an increase in the
width of the cell sizes distribution, and the relationship between the
dispersion quality of the particles and a possible chemical interaction
of nanoclays and polyurethane matrix. This interaction implies a
destruction of H‐bonds between polymeric chains (which have a
significant impact on the mechanical properties of unfilled foams) by
the nanoclays presence. Then, as a powerful dispersion technique
implies a better dispersion, a powerful dispersion technique will also
imply a higher interaction between the nanofillers and the PU matrix,
and this will result in worse mechanical properties. As it has been
proven that intercalation of the nanoclays is achieved independently
from the dispersion technique employed, a better dispersion will imply
a higher filler‐matrix interaction and as consequence a reduction of
the matrix properties.
Shear properties: small changes has been observed in the value of the
shear modulus with the inclusion of nanoclays, and a clear difference
between foaming direction value (higher value) and perpendicular to
foaming direction value (lower value) has been observed, showing the
importance of anisotropy for the analysed materials.
Thermal conductivity: Thermal conductivity has been reduced by the
addition of nanoclays. This reduction is an expected result due to the
relationship between cell size and thermal conductivity. An increase of
the extinction coefficient has been observed, but it does not
completely explain the changes in the thermal conductivity. Other
factors as the open cell content have an influence over the observed
changes.

Chapter 6: Conclusions and Future Work
| 209
Evaluating in detail the effect of the clays content on the cellular structure,
thermal and mechanical properties of the foamed composites: Samples with
different amounts of nanoclays (0.5, 1, 3 and 5 %wt), dispersed in the polyol
with low shear mixing technique, were manufactured in order to characterise
the effect of the different techniques on the density, structure, mechanical
and thermal properties of polyurethane foams. The main results obtained are
summarized in the following paragraphs:
Density measurements: the inclusion of nanoparticles in polyurethane
foams produced a measurable change in final foams density. A small
reduction for the lower value of the infused nanoclays was measured,
however in general terms the macroscopic density tends to increase
when nanoclays are added. Similarly to the case of the dispersion
techniques study, the reason for this slight growth could be connected
with a higher viscosity of the initial blend when clays are infused,
combined with the fact that nanofillers density (Cloisite 30B ‐ 1980
kg/m3) is usually higher than that of the reference foam (around 50
kg/m3). Regarding to the small decrease for lower concentrations,
despite nanoclays were dehydrated previously to their incorporation
and dispersion in polyurethane polyol, this do not always guarantee
the complete absence of water in the nanoclays that could act as
chemical blowing agent. This amount of water must be considerably
small and could be compensated by the increase of the viscosity as the
amount of clays is increased.
Cell size: The presence of nanoclays reduces the average cell size. This
cell size reduction has been explained by an increase in the nucleation
due to the nanoclays presence. Cell size presents a general reducing
trend with nanoclays concentration until 3%wt, which presents the
highest reduction (24% reduction with respect to the pure
polyurethane foam). An increase in cell size is observed for highest
concentration (5%wt sample, with 21% of cell size reduction with
respect to the pure material).
Cellular anisotropy: It was observed a variation in the anisotropy of the
cellular structure with the nanoclays concentration. In general the cells
were larger in the growing direction of the foam. For instances the
Chapter 6: Conclusions and Future Work
| 210
anisotropy ratio was 1.69 for the pure material. As the amount of clays
is increased a general trend is observed, with a reduction in the
anisotropy value.
Open cell content: Open cell content does not present significant
changes by the nanoclays presence, with similar values to the pure
material for the nanoclays infused foams. An average value of 6.5%
was observed for pure and 0.5%wt nanoclays concentration samples,
while an average value around 8.5% was observed for the rest of the
samples.
Mass fraction in the struts: Considerable changes were observed in the
mass fraction in the struts with the addition of nanoclays in the foams:
from a value of 0.67 for the pure material, small variations were
observed until 1 %wt of nanoclays (0.62 for 0.5%wt and 0.66 for 1%),
increasing this value to 0.78 for 3% and to 0.76 for 5%. This significant
change of the mass distribution in the cellular structure has clear
effects on the extinction coefficient and thermal conductivity. The
origin of these changes could be related to modifications produced in
the viscosity of the polyol‐nanoclays mixture as the nanoclays amount
is increased, fact which can be very important during the cell
formation and stabilization. Another possible explanation of this result
is associated with a modification of the reaction kinetics. The clays
could modify the blowing reaction kinetics, the gelling reaction kinetics
or both. Initial test by using FTIR on the reaction kinetics when clays
are added indicate that the reaction rates are reduced.
Cell size distribution: The normalized standard deviation (NSD) of the
cell size distribution experienced a clear increase when the
nanoparticles are added. In fact, a bimodal cell size distribution was
detected for high amounts of clays (0.62 of NSD value for 5%wt,
against 0.20 for pure material). In addition, the asymmetry coefficient
also increases when the particles are infused.
Nucleation efficiency: nucleation efficiency of nanoclays was studied
for the different nanoclay concentrations, showing a clear reduction as

Chapter 6: Conclusions and Future Work
| 211
the amount of nanoclays was increased. In general, the nucleation
efficiency of the particles was small.
Compression properties: the presence of nanoclays in polyurethane
foams has supposed not only a small improvement of the elastic
modulus (around 12% of increase with respect to the pure material for
3wt% nanoclays), but also a decrease of the compression strength
(between 1 to 5% of decrease with respect to the pure material). A
correlation with the possible interaction of nanoclays and the
polyurethane matrix has been proposed: a destruction of H‐bonds
between chains (which have a significant impact on the mechanical
properties of unfilled polyurethane foams) by the nanoclays presence
could the responsible of the slight improvements or even the
reduction (σ) of the mechanical. The increase in the nanoclays added
has not supposed an increase of the compression properties, even a
reduction of them.
Flexural properties: a decrease of the deformation at maximum
strength has been observed, with more than a 50% reduction with
respect to the pure material for the higher clays concentrations.
Flexural modulus presents an initial increase of 12% with respect to
the pure material for the lower concentration (0.5%wt.), lower
improvements for 1 and 3 wt% concentrations and a 20% increase for
the 5%wt sample. Flexural strength presents a significant decrease in
its absolute values by the addition of nanoclays (from 0.73 MPa for
pure material to an average value of 0.65 MPa for the nanoclays
infused materials).
Shear properties: small changes has been observed in the shear
modulus with the inclusion of nanoclays, with a clear difference
between plane perpendicular to the foaming direction (higher value)
and its perpendicular (lower value). It has been observed a correlation
between the cellular anisotropy measured with SEM technique and
the measured shear modulus
Improving the thermal conductivity of polyurethane foams by using nanoclays
as nucleating agents and IR‐blockers: Time evolution of the different samples

Chapter 6: Conclusions and Future Work
| 212
was studied, showing an increase of this property as the diffusion of the
blowing agent (CO2) from the cells to the atmosphere was produced. After 12
days from the material production, a stable value was measured, reaching the
stationary state. For the final values of thermal conductivity in stationary state,
it was observed a reduction with the addition of nanoclays. This improvement
can be considered as a secondary effect of the cell size reduction (thermal
conductivity presents a high dependence with the cell size) that has been
produced by the addition of nanoclays. The higher decrease of the thermal
conductivity was observed for 1wt% of nanoclays. The increase of the amount
of nanoclays further than 1wt% did not produce a higher reduction of the
thermal conductivity; moreover, worse results than for the pure material were
obtained. Higher reduction of the cell size was observed with higher amounts
of nanoclays, but the thermal conductivity reduction stops at 1 wt %. In order
to have a better understanding of this behaviour, a detailed modelling was
conducted. It was also measured the temperature evolution of the thermal
conductivity for the different samples, observing a linear increase with the
temperature for all the materials studied. The slope of the curve, consequence
of the linear fit, shows a decrease with the amount of nanoclays. As the cell
size is related with the inclusion of nanoclays, this change can be explained
taking into account the change in the cell size.
Modelling the thermal conductivity of the developed foams, using as a basis
the experimental determination of the extinction coefficient of the foams:
Besides cell size, extinction coefficient and the percentage of mass in the struts
are critical parameters which experimented changes with the modifications in
the nanoclays concentration and that have a clear influence over the thermal
conductivity. Thereby, the modelling of the different heat transfer mechanisms
involved has helped to better understand the thermal behaviour of the
polyurethane‐nanoclays system. For the range of cell sizes under study there
are three different contributions to the thermal conductivity: conduction
through the gas, thermal radiation and conduction along the cell walls and
struts of the solid polymer. These are the results for each of them:
Thermal conductivity through the gas phase: it is the most significant
mechanism over the final value of the thermal conductivity (71‐72 %
contribution). This contribution does not present significant changes

Chapter 6: Conclusions and Future Work
| 213
due to the nanoclays addition. Moreover, the biggest change observed
in this term is due to the effect of the foaming gas (CO2) diffusion and
it substitution by atmospheric air.
Thermal radiation: this contribution experiments clear changes by the
nanoclays presence. Considering Rosseland model (eq. 5.21), this term
is deeply related with changes in the extinction coefficient (higher
extinction coefficient implies lower conductivity by radiation). In turn,
accepting Glicksman model (eq. 5.14), extinction coefficient is also
related with the cell size, density, mass fraction in struts and the
optical properties of the solid phase. Comparing experimental values
for extinction coefficient and theoretical values taking into account the
changes produced by nanoclays (cell size reduction and variation in
mass fraction in struts), both present a maximum for 3wt% nanoclays,
but completely different values (table 5.13). The cells size and mass
fraction in struts variations are not enough to completely explain the
changes produced in the radiation conduction term: a possible change
in the optical properties of the solid material has been considered. This
could be related with the reflexion/absorption of IR radiation by the
clay platelets, which seem to contribute from this point of view.
Conduction through the solid phase: for this term, experimental data
do not agree with the modelling data. The creation of a percolation
network by the nanoclays could be the reason; this will increase the
thermal conductivity of the solid phase. This network could have a
percolation threshold between 1 and 3wt%, so its effect would begin
to be detected for a content of 3wt% or higher.
In summary, the modelling carried out allows concluding that the changes
produced in thermal conductivity by the inclusion of nanoclays in different
concentrations are due to a combination of morphological changes in the
cellular structure (as the cell size and mass fraction in struts), changes in the
optical properties of the polymeric matrix (clay acting as IR‐blockers) and
modifications of the thermal conductivity of the solid phase (clays increasing
this conductivity).

Chapter 6: Conclusions and Future Work
| 214
The study of the different concentrations of nanoclays has shown that the inclusion of
these nanofillers requires reaching an equilibrium between different factors, as nanoparticles
concentration, dispersion and exfoliation. Without this equilibrium it is easy to obtain a final
foam with worse properties than the pure material. It is necessary a low nanoparticles
concentration, 1 wt % or less, in order to avoid an increase of the mass fraction in the struts
and the formation of a percolation network, effects that have a negative consequence on
thermal properties. Moreover, it has been observed that mechanical properties present a
maximum for values around 3%wt of nanoclays concentration. For this characteristic it would
be important to have a relatively good dispersion of the nanoparticles to obtain higher
nucleation rates, but it is also important to control this good dispersion to promote a higher
interaction between the polymeric matrix and the nanoclays, which reduce final mechanical
properties.
The obtained results have two different implications. On one hand, it is easy to achieve
good results with the inclusion of a low wt % of nanoclays without the use of a powerful, time‐
spending dispersion technique (ultrasounds are not needed). On the other hand, the small
improvement, or even the decrease, on the final mechanical properties obtained for the higher
nanoclays concentrations shows that the interaction between matrix and nanofillers plays an
essential role in the PU rigid foams under study. As the polyurethane matrix H‐bonds alteration
could be the reason, it is necessary to optimize the nanoparticles aspect ratio and the surface
chemistry to the polymeric matrix employed to achieve higher improvements, at least from a
mechanical point of view. Other properties (such as thermal conductivity) related with
morphological characteristics (such as cell size) are suitable to be optimized by the nanoclays
used in this research, since nanoclays are able to reduce cell size with a simple mixing
technique.
Another aspect that could play a key role is the modification of the kinetics of the
chemical reactions (blowing and gelling) by the addition of these types of particles.
Understanding these effects should be very helpful to make a better use of nanoparticles.
In conclusion, a correct understanding of the different alterations produced are
necessary not only to find the optimal nanoparticle and concentration for this specific
polyurethane material, but also to find a methodology which could be applied to different
polyurethane systems with different nanoadditives. From this point of view, this work presents
a collection of characterization techniques, both experimental and theoretical, that can clearly
help to reach this objective.

Chapter 6: Conclusions and Future Work
| 215
Furthermore, it is necessary to mention that this work has helped to a better
understanding of rigid polyurethane foams‐nanoclays system, and also has supposed the
starting‐point of a new research topic in CellMat Laboratory. Beyond the results, this study has
set a collection of procedures for future studies, starting with a better understanding of the
different dispersion techniques and ending with a complete modelling of the thermal
conductivity.
This work has also generated knowledge that has been employed in several projects
with private partners:
Project 1: Polyurethane foams for surfboards manufacture, funded by Foam
Asturblank (2009‐2010). The knowledge acquired in the dispersion techniques
was fundamental. In this project, the objective was the optimization of
commercial polyurethane blends for the production of PU foams for surf
boards. The recent close down of Clark Foam manufacturer, a reference in surf
world, motivated to manufacture a new material with similar properties. For
this aim, different commercial surf boards were studied (Clark Foam, TSF,
Safari), identifying the critical properties which made the Clark Foam
surfboards the surfer’s favourite. With these values, different additives were
introduced in a polyurethane formulation for surf boards to adapt the physical
properties to the demanding requirements of this application. Foamed
polyurethane materials containing different type of fillers were produced, both
at lab scale and industrial scale. The materials were produced and
characterised using the techniques set‐up during this PhD research.
Project 2: Development of novel polyurethane foams with improved thermal
insulation, Funded by Bosch and Siemens Home Appliances (BSH) Group (2012‐
2013). In this project, funded by the German Company BSH, the aim was
reducing the thermal conductivity of the rigid polyurethane foam used in the
production of fridges. The knowledge acquired during this PhD thesis about
the effect of particles in the thermal conductivity of polyurethane foams,
together with the experimental studies (extinction coefficient) and the
modelling of thermal conductivity, allowed obtaining a 4‐5% reduction of the
thermal conductivity for this specific rigid polyurethane foam. Therefore, a
better performance and lower energy consumption of commercial fridges was
reached.

Chapter 6: Conclusions and Future Work
| 216
Project 3: Use of sepiolite nanoparticles to optimize the structure and
properties of PS and PU based foams, funded by the major producer of
sepiolites in Europe, TOLSA S.A. (2012‐2013). In this project, the effect of ????
sepiolites, a kind of nanoclays with fibrous morphology, on the structure and
properties of rigid polyurethane foams was studied. For this purpose the
production and characterisation methods developed in this research work
were employed.
FUTURE WORK
After the work performed, several interesting research topics will be the focus of
CellMat in the following years. Here we summarize some of our ideas:
1. Performing a similar study but with a more appropriate selection of the raw
materials. Taking into account the conclusions of this thesis a better selection
of the polyurethane system and the clay functionalization can be done in order
to obtain better improvement in this kind of materials with the help of
nanotechnology:
The selection of a polyurethane blend formulation with less
dependence of their mechanical properties on the H‐bonds is highly
recommended. So, a higher improvement of the mechanical
properties could be obtained with the use of nanoclays.
Selection of the nanoparticles type: the use of nanoparticles with a
different morphology and surface chemistry could help to obtain
better results in the mechanical properties. Moreover, the nucleation
effect could be maintained. Anyway, a study of other type of
nanoparticles over the extinction coefficient could be desirable, as the
aspect ratio of the particles could play an important role in this
mechanism.
2. Establishing a methodology to analyse the kinetics of both the blowing and
gelling reactions. This methodology should combine experimental techniques
such as FTIR, thermography, x‐ray radioscopy and optical expandometry. The
key concept would be to acquire a better understanding of the effect of the
particles during the foaming process.

Chapter 6: Conclusions and Future Work
| 217
3. To clarify several aspects of the modelling of thermal conductivity. In particular
the change of the optical properties of the base polymer and the effect of clays
presence on the thermal conductivity of the solid phase.
4. To develop procedures that could produce a better dispersion and a better
exfoliation of the nanoparticles.