census atlas, part ix, series-22, west bengal
TRANSCRIPT

CENSUS OF INDIA 1971
Series-22
WEST BENGAL
Part-IX
CENSUS ATLAS
Direct Supervision and Analytical Notes-First Draft: D. P. CHATTERJEE, M.Sc., ASST. DIRECTOR (Technical)
Over-all Supervision and Analytical Notes: M. C. DATTA, of the West Bengal Civil Service Dy. DIRECTOR
General Direction: B. GHOSE of the Indian Administrative Service DIRECTOR OF CENSUS OPERATIONS WEST BENGAL

Foreword
It was in 1961 for the first time in the history of Indian census that a Census of India atlas series was brought out on various census themes as also non-census statistics for India and a number of states and union territories. These atlases received wide recognition. During 1973-74, the'Indian Census Centenary Atlas was brought out by the office of the Registrar General, India. The 1961 atlas was exhibited at the International Geographical Congress (1968) in New Delhi. A folio of the 1961 atlas comprising ten selected maps was distributed among the 1,500 delegates to the congress. The centenary atlas was exhibited at the United Nations world population conference (1974) in Bucharest.
Maps from the tahsil to the national level appear in most 1971 census table volumes, reports and publications. As part of the 1971 census taking, jurisdictional maps (basic census map documents) and urban land use schematic maps were prepared to enrich the district census handbooks, the town directories and other census publications, The jurisdictional maps at talukal district levels were combined in a volume known as Administrative Atlas for each state with additional demographic information and published for six states. Others are likely to come out in course of time. These are the latest subject maps with reference -to the 1971 census. This upholds the tradition of the census office of producing the largest number of latest maps in the country.
The tabulation plan of the 1971 census aimed at presenting information based on various types of census data. The 1971 Census of India atlas series projects census data in thematic maps. The 1971 atlas programme has been planned in a way that helps comparability with the 1961 data in areas like density of popUlation, sex, religion and literacy. The atlas series, which forms part IX in the census publication series will provide correlation of census data with noncensus statistics and help in the analysis and evaluation of socio-economic problems at different administrative levels.
Planning of census atlases began along with pre-census preparations in ]969-70. A national conference was organised in April 1970 in the office of the Registrar General in which scholars like Prof. G. S. Gosal, Prof. V. L. S. P. Rao, Prof. Mansoor Alam, Dr. M. P. Thakore, Dr. L. S. Bhatt and Mr. H. M. Jones participated. It discussed the themes and techniques for the maps to be included in 1971 atlas. This scheme was sent to a large number of universities and institutions and valuable suggestions were received from Prof. O. H. K. Spate, Prof. John E. Brush, Prof. John W. Dickay, Prof. R. M. Prothero and Prof. B. J. Garner. The scheme was then examined at conferences of directors of census operations at Courtallam (1970) and at Pahalgam (1972).
The' atlas series has been planned in such a way that a complete demographic profile for different administrative units in the country is available from the maps appearing in the atlases of states and union territories and in the national volume. Generally, atlases of states and union territories include eight maps .which give the geographical personality of the region, followed by population, sex and age, urbanisation, migration, agriculture, census industrial categories, electricity, transport & communications, trade & commerce and services. There are also maps devoted to scheduled castes and tribes, religion, education, housing and ~~. .
There has been a slight deviation in the all-India volume fo reduce tne bulk of the atlas by combining themes on the maps. Certain insets are added to provide more information on the subject. Diagrams, graphs, and tables based on quantitative measurements of themes help in. interpretations of each plate.
In the present aU-India atlas, 80 plates are included in four sections. Eleven plates show administrative boundaries and physical aspects. In the section on demographic structure and trends, 35 plates cover distribution of popUlation, density and growth, sex and age and urbanisation. The economic aspects based on census industrial categories are shown in 13 plates. The socio-cultural aspects accounting for 20 plates to scheduled castes and tribes, religion and education. A plate on the physio~geographic~l regions of India h!ls been included to enable the users to co-ordinate variables III terms of such regIOns.
(iii)

(iv)
This atlas programme has been executed under the direction of Dr. B. K. Roy, Assistant Registrar General (Map). When Dr. Roy went on an U.N. assignment for two years, the work was carried on by the Map division in DeIhl under the supervision of Dr. R. R. Tripathi, now Map Officer. I congratulate all the members of Map division in our Delhi office and the members of map units in the offices of directors of census operations of states/union territories on their excel~ent teamwork and their dedication which contributed to the success of this venture.
NEW DELHI; Gandhi J ayanti 2 October, 197.1.
R. B. CHARI REGISTRAR GENERAL, INDIA .
. EX-OFFICIO CENSUS COMMISSIONER, INDIA.
PREFACE
A Census of India Atlas series was brought out for the first time in 1961 'On various census themes as also non-census dat3. for India and a number of states. For various reasons the Atlas of West Bengal could not be published at the time. The Census Atlas of West Bengal is now being published for the time as a part of the 1971 series. .
The Atlas series of 1971 \\-as planned in such a way that a complete demo~graphic picture of each state was available in the volumes. We had, however, to make some deviations from the original plan for West Bengal and reduce the :number of maps. The basic features of the Atlas have, nevertheless, been preserved as originally planned. Analytical notes, which are by no means exhaustive and are in the nature of introductions, have also been added for each map. I hope that the volume will be of use to scholars, administrators and planners.
I must place on record my deep appreciation of the tireless and dedicated ,york put in by the officers and members of the staff of my office to prepare and bring out the Atlas. My thanks are also due to the Registrar General, India and Asstt. Registrar General (Map) and other officers and staff of the Map Division of the Registrar General's Office for the advice and help extended to us.
.11-1-78, CALCUTTA.
BHASKAR GHOSE DIRECTOR OF CENSUS OPERATIONS
WEST BENGAL.
(v)

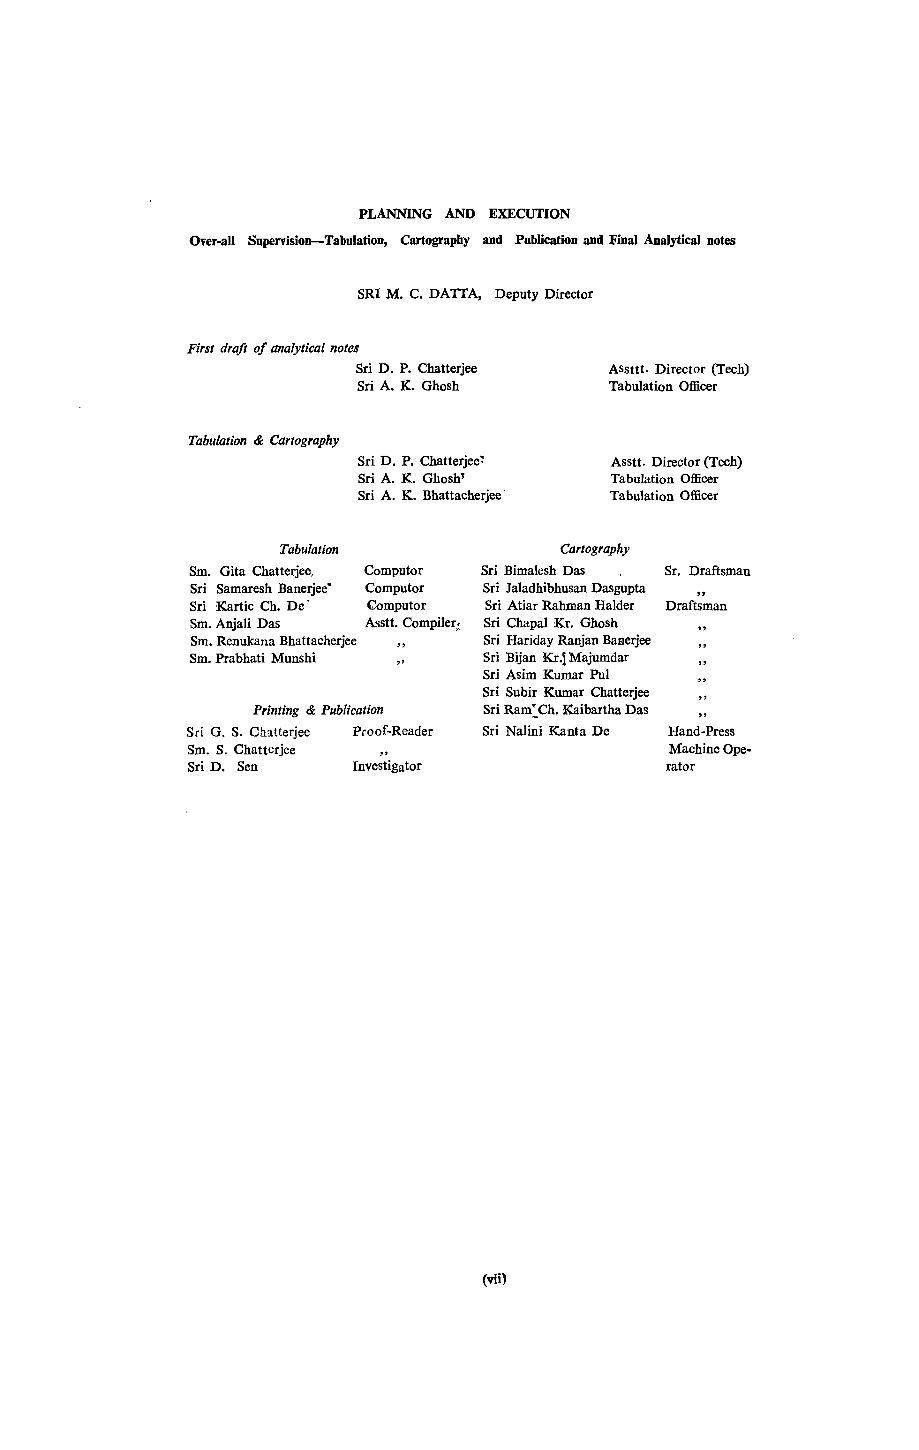
PLANNING AND EXECUTION
Over-all Supenision-Tabulation, Cartography and Publication and Final Analytical notes
SRI M. C. DATTA, Deputy Director
First draft of analytical notes
Tabulation & Cartography
Sri D. P. Chatterjee Sri A. K. Ghosh
Assttt. Director (Tech) Tabulation Officer
Sri D. P. Chatterjee'l Sri A. K. Ghosh1
Asstt. Director (Tech) Tabulation Officer Tabulation Officer Sri A. K. Bhattacherjee'
Tabulation
Sm. Gita Chatterjee, Sri Samaresh Banerjee" Sri Kartic Ch. De' Sm. Anjali Das Sm. Renukana Bhattacherjee Sm. Prabhati Munshi
Computor Computor Computor Asstt. Compiler,~
" "
Printing & Publication
Sri G. S. Chatterjee Proof-Reader Sm. S. Chatterjee " Sri D. Sen Investigator
Cartography
Sri Bimalesh Das Sri laladhibhusan Dasgupta Sri Atiar Rahman Halder Sri Chapal Kr. Ghosh Sri Hariday Ranjan Baaerjee Sri Bijan Kr.i Majumdar Sri Asim Kumar Pul Sri Subir Kumar Chatterjee Sri Ram: Ch. Kaibartha Das
Sri Nalini Kanta De
(vii)
Sr. Draftsman
" Draftsman
" " " " " "
Hand-Press Machine Operator
NOTE
© Government of India Copyright, 1978.
(i) The external boundaries of all maps in this volume are "Based upon Survey of India Map with the permission of the Surveyor General, India".
(ii) The territorial waters-of India extend into the Sea to a distance of twelve nautical miles measured from the appropriate base line.
(viii)

CONTENTS
Map No. Title of the map
A ORIENTATION
1 Position of West Bengal in India
2
3
4
5
6
7
8
9
10
11
12
13
14
15
16
17
18
19
20
21
22
23
24
25
26
27
28
29
30
31
32
Administrative Divisions 1971
Changes in Administrative Boundaries 1961-71
B PHYSIOGRAPHY
Relief and Drainage .
Normal Monthly and Annual Rainfall 1961-70 ,
Soils .
Forests
C. DEMOGRAPHIC STRUCTURE AND TRENDS
Distribution, Density and Growth Character
Distribution of Population 1971
Density of Population 1971
Change in Population 1961-71
Growth of Population 1961-71
Fertility 1971
Sex and Age Structure
Sex Ratio 1971 .
Rural Sex Ratio 1971
Urban Sex Ratio 1971
Sex, Age Structure and Marital Status 1971
Youthfulness of Population 1971 •
Change in Youthfulness of Population 1961-71
Males in Working age 15-59 1971
Females in Working Age 15-59 1971
Urban in Working Age 15-59 1971
Rural Males in Working Age 15-59 1971 .
Urban Females in Working Age 15-59 1971
Rural Females in Working Age 15-59 1971
Urbanisation
Urban Population 1971
Change in Urban Population 1961-71
Rural Population 1971
Urban COncentration 1971 •
Growth of Urban Population 1961-71
Degree of Urbanisation 1971
Functions of Class I and II Urban Centres 1971
Functions of Class III and IV Urban Centres 1971 •
(ix)
•
Page No.
2
3
4
5
6
7
8
9
10
11
12
13
14
15
16
17
18
19
20
21
22
23
24
25·
26
27
~8
29
30
31
32
(X)
Map No. Title of the map
33
34
35
36
37
. 38
39
40
41
42
43
44
D MIGRATION
In-Migrants 1971
Inter District Migration 1971
Migrants in Class I Urban Centre 1971
Migrants Residing Up To 4 Years 1971
Migrants Residing 5 to 9 Years 1971
Migrants Residing 10 Years and Above 1971 •
Working and Non-Working Migrants in Class I Urban Centres Educational Levels 1971
Classification of Working Migrants 1971
E ECONOMIC ASPECTS
The 1971 Census Industrial Categories
Workers and Non-Workers 1971
Rural Workers and Non-Workers 1971
Urban Workers and Non Workers 1971
Rural Male Workers in Age 15-59 1971
45 ' Urban Male Workers in Age 15-59 J971
46
47
48
49
50
51
52
53
54
55
56
57
Rural Female Workers in Age 15-59 1971
Urban Female Workers in Age 15-59 1971 •
Workers and Non-Workers in Employable Population in Age 15-59 1971
Classification of Male and Female Workers 1971
Classification of Rural Male and Fema,le Workers 1971
Classification of Urban Male and Female Workers 1971
Population Employed in Cultivation, Agricultural Labour, Livestock, Forestry, Fishing, Hunting and Plantation, Orchards and Allied Activities
Cultivators in Total Workers in Age 15-59 1971 . Cultivators in Rural Population 1971
Male Cultivators in Male Workers in Age 15-59 1971 '"
Female Cultivators in Female Workers inAge 15-59 1971
Agricultural Labourers in Total Agricultural Workers in Age 15-59 1971
Non-Agricultural Workers in Primary Sector 1971
Page· No.
33
34
35
36
37
38
39
40
41
42
43
44
45
46
47
48
49
50
51
52
53
54
5S
56
57
Population Employed in Mining and Quarrying, Household Industry Manufacturing,
58.
59
60
61
62
63
64
. 65
66
Processing, Servicing and Repairs
Workers in Manufacturing Processing Servicing and Repairs 1971
Household Industries by Types and Size of Employment 1971
Factories by Types and Size of Employment 1971 .
Factories and Work-shops by Size of Employment 1971
Castf%' and Tribes
Scheduled Castes 1971 i
F SOCIO":::"CULTURAL ASPECTS
Scheduled Tribes 1971
Ten Numerically Major Scheduled Castes 1971
Ten Numerically Major Scheduled Tribes 1971
Religions
Major Religions 1971 •
58
59
60
61
62
63
64
65
66

(xi)
-Map No. Title of the map
67
68
69
70
71
72
-. Education
Literacy 1971
Change in Literacy 1961-71
Male Literacy 1911
Female Literacy 1971 .
Primary School Enrolment of Boys 1971
Primary School Enrolment of Girls 1971
Page No.
67
68
69
70
71
72

1
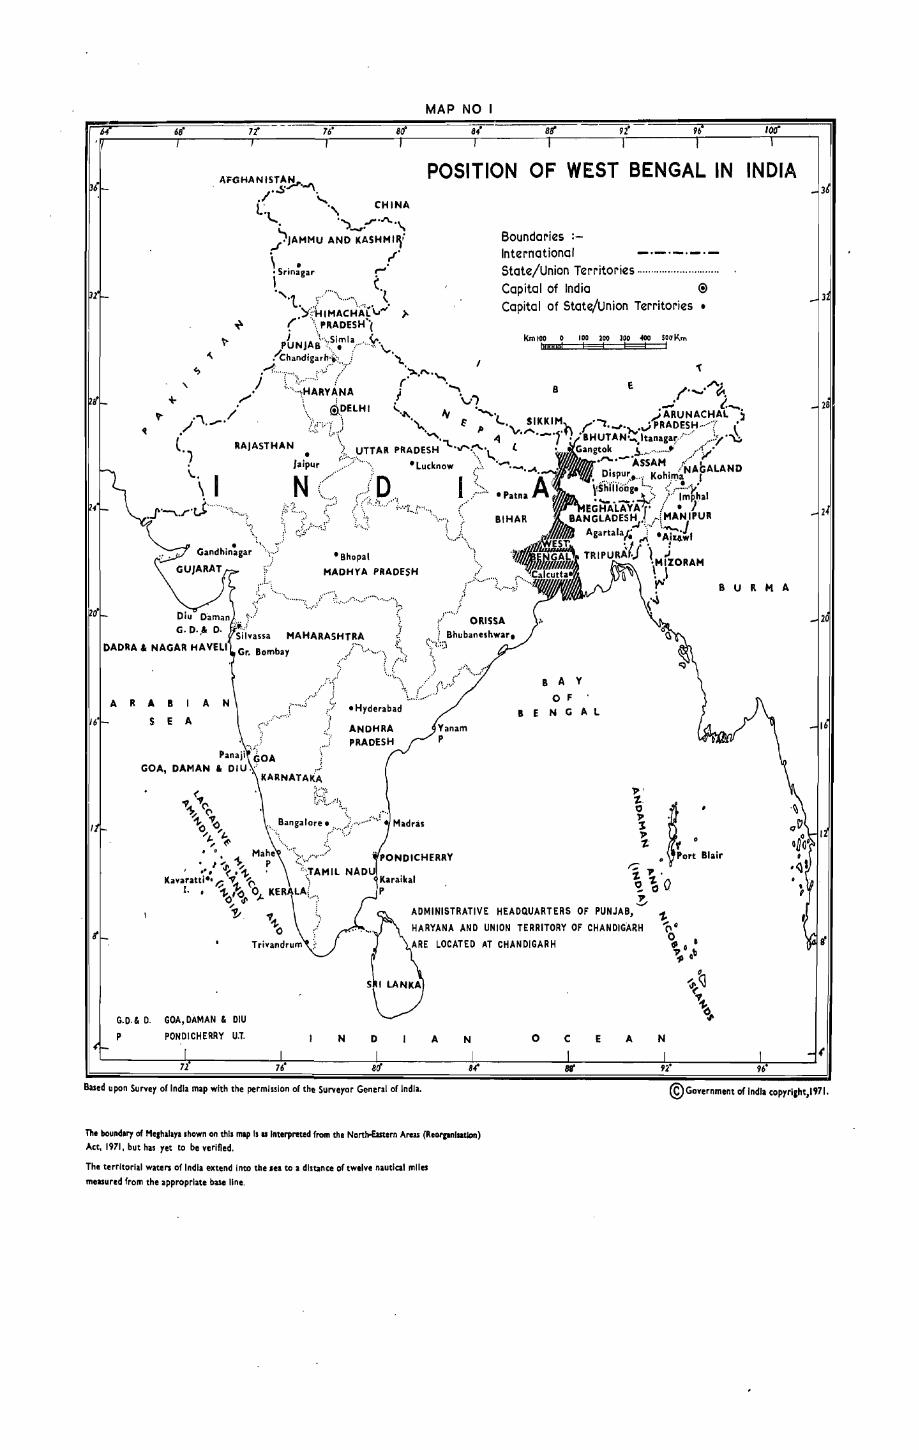
The state of West Bengal was carved out of the province of Bengal and came into existence on 15 August, 1941. The state was then just about two-fifths of the undivided province in area. It has grown into its present size with the accession of territories on three occasions, namely, merger of the former princely state of Cooch Behar in 1950 and of the former French settlement of Chandernagore in 1954 and transfer of parts of Manbhum and Purnea districts of Bihar in 1956. The state covers an area of 87,853 Km2 at present. .
West Bengal is situated ·between latitudes 27° 13' 15" and 21 0 25' 2" north and longitude 85° 49' 20" and 89 c 53' 04" east. It is bounded on the north by the state of Sikkim and the kingdom of Bhutan; on the east by district Goalpara of Assam and Bangladesh; on the south by the Bay of Bengal and on the west by Singhbhum, Ranchi, Hazaribagh, Santhal Parganas and Purnea districts of Bihar and the kingdom of Nepal.
The state occupies only 2.67 % of the total area of. India but supports a population of 44.3 million which constitutes 8.08 % of the population of the country. The density of population in the state is as high as 504 per Km2
• Kerala (549 per Km2
) is the only state which has a higher density"than West Bengal.
AREA OF WEST BENGAL IN INDIA
INDIA
3 2~7782 KII'
POPULATION Of WEST BENGAL IN INDIA
INDIA
548'16.
MAP NO I
POSITION OF WEST BENGAL IN INDIA
A R A B
SEA
A
• Bhopal MADHYA PRADESH
Boundaries :-International _.-._._._
State/Union Territories ........................... ..
Capital of India ® Capital of State/Union Territories •
KmlOO 0 I 00 ~oo 100 0400 soa Krn
BAY o F
BENGAL
"I •
BUR M A
~ ,
• Port Blair ~ 1. .., . o 1. 0 .. 0 . .!-
ADMINISTRATIVE HEADQUARTERS OF PUNJAB,
HARYANA AND UNION TERRITORY OF CHANDIGARH
LOCATED AT CHANDIGARH
G.D.& D.
P
GOA, DAMAN & DIU
PONDICHERRY U.T. N D
Based upon Survey of India map with the permission of the Surveyor General of India.
A N
The boundlry of Meshalaya shown on this map Is u Interpreted from the Nortlt-Eastern Areas (ReorpnISltlon) Act. 1971. but has yet to be verified.
The territorial waters of India extend Into the .ea to a distance of twelve nautical miles
measured from the appropriate base line.
o c E A N
Government of India copyrl,ht,1971.
2
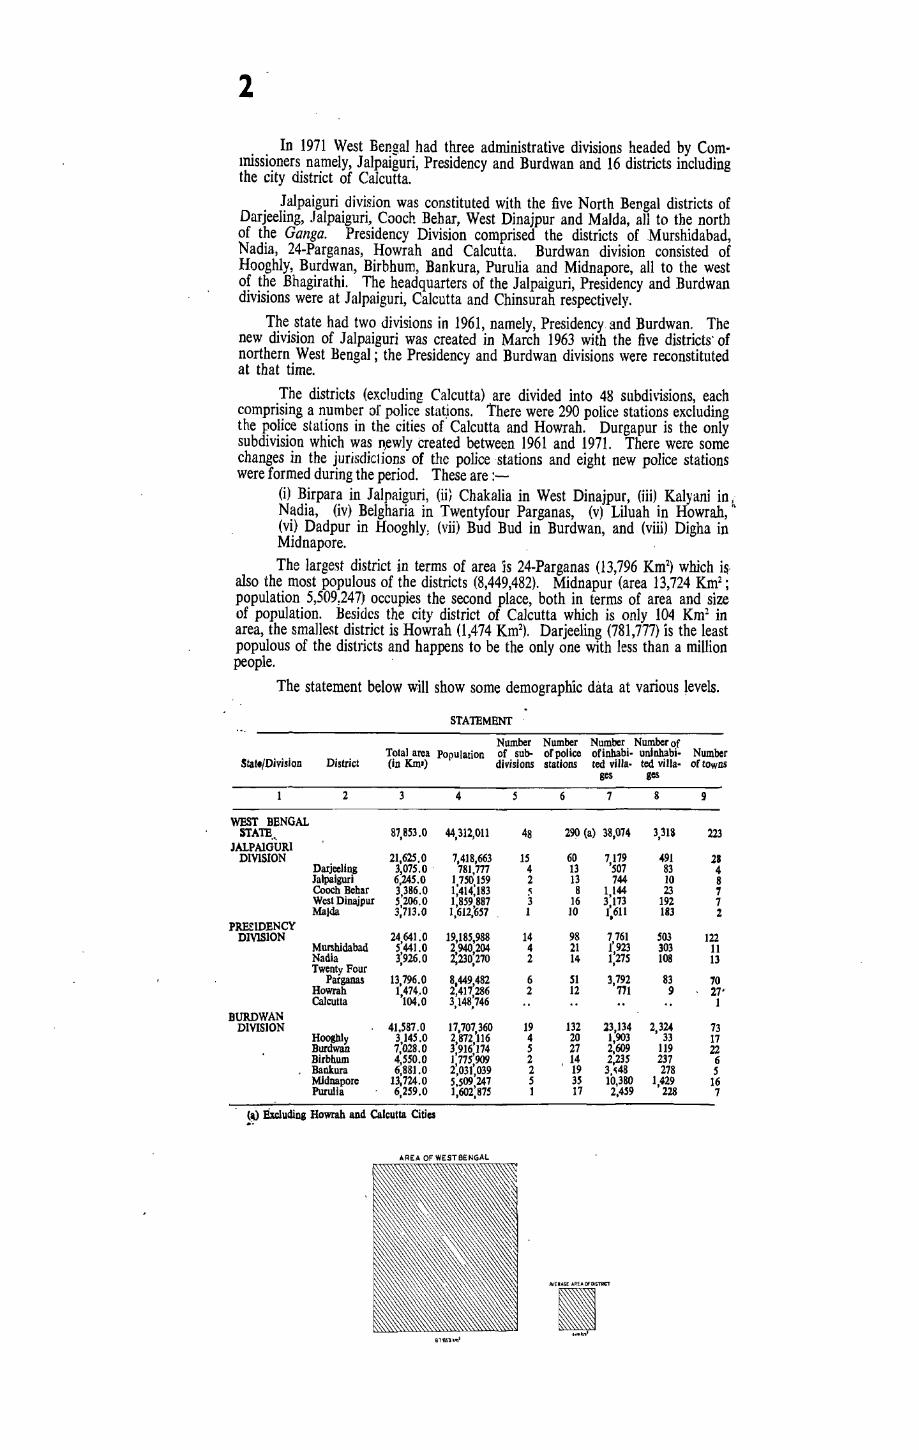
In 1971 West Bengal had three administrative divisions headed by Commissioners namely, Jalpaiguri, Presidency and Burdwan and 16 districts including the city district of Calcutta.
Jalpaiguri division was constituted with the five North Bengal districts of Darjeeling, Jalpaiguri, Cooch Bebar, West Dinajpur and Maida, all to the north of the Ganga. Presidency Division comprised the districts of Murshidabad, Nadia, 24-Parganas, Howrah and Calcutta. Burdwan division consisted of Hooghly, Burdwan, Birbhum, Bankura, Purulia and Midnapore, all to the west of the .Bhagirathi. The headquarters of the Jalpaiguri, Presidency and Burdwan divisions were at Jalpaiguri, Calcutta and Chinsurah respectively.
The state had two divisions in 1961, namely, Presidency and Burdwan. The new division of Jalpaiguri was created in March 1963 with the five districts' of northern West Bengal; the Presidency and Burdwan divisions were reconstituted at that time.
The districts (excluding Calcutta) ,are divided into 48 subdivisions, each comprising a number of police statjons. There were 290 police stations excluding the police stations in the cities of Calcutta and Howrah. Durgapur is the only subdivision which was n,ewly created between 1961 and 1971. There were some changes in the jurjsdiclions of the police stations and eight new police stations were formed during the period. These are :-
(i) Birpara in Jalpaiguri, (iii Cbakalia in West Dinajpur, (iii) Kalyani in i Nadia, (iv) Belgharia in Twentyfour Parganas, (v) Liluah in Howrah," (vi) Dadpur in Hooghly; (vii) Bud Bud in Burdwan, and (viii) Digha in Midnapore. The largest district in terms of area is 24-Parganas (13,796 Km2) which is,
also the most populous of the districts (8,449,482). Midnapur (area 13,724 Km2 ;
population 5,509,247) occupies the second place, both in terms of area and size of population. Besides the city district of Calcutta which is only 104 Km2 in area, the smallest district is Howrah (1,474 Km2). Darjeeling (781,777) is the least populous of the districts and happens to be the only one with less than a million people.
The statement below will show some demographic data at various levels.
STATEMENT
Number Number Number Number of Total area Population of sub- of police ofinhabi- uninhabi- Number
Statt/Division District (in Kml) divisions stations ted villa- ted villa- of towns ges gcs
2 3 4 5 6 7 8 9
WEST BENGAL STATE" 81,853.0 44,312,011 48 290 (a) 38,074 3,31a 223
JALPAIGURI 7119 491 DIVISION 21,625.0 7,418,663 15 60 28
Darjeeling 3,075.0 ' 781,777 4 13 '507 83 4 Jalpaiguri 6,245.0 1750159 2 13 744 10 8 Coach Behar 3386.0 1'414'183 5 8 1144 23 '1 West Dlnajpur 5;206.0 1;859;887 3 16 3'173 192 7 Malda 3,713.0 1,612,657 . 1 10 1:611 183 2.
PRESIDENCY 98 7761 503 122 DIVISION 24641.0 19,185,988 14
Murshidabad 5'441.0 2940 204 4 21 1',923 303 11 Nadia 3;926.0 2'230'270 2 14 1,275 108 13 Twenty Four ' ,
Parganas 13,796.0 8,449,482 6 51 3,792 83 '10 Howrah 1,474 .• 0 2,417,286 2 12 771 9 2.7' Calcutta 104.0 3148746 1 , ,
BURDWAN 19 132 23,134 2,324 73 DIVISION 41.587.0 17,707,360
Hooghly 3,145.0 2872 116 4 20 1,903 33 17 Burdwan 7,028.0 3'916'174 5 27 2,609 119 22 Birbhum 4,550.0 1'775'909 2 14 2,235 237 6 Bankura 6,881.0 2'031' 039 2 19 3,~48 278 5 Mldnapore 13,724.0 5;509'247 5 35 10,380 1,429 16 Purulia 6,259.0 1,602;875 1 17 2,459 228 7
(~ Excluding Howrah and Calcutta Cities .'_
AVERAGE AFIEA OfOiSTAICT
I

WEST BENGAL ADMINISTRATIVE DIVISIONS
1971
A Dhanlakh.l,
Polba D.dpur
kmlO
kill 16 o 16 32 48 64 80
Reg. No.718IHE'79-S30'80.
lased upon Survey 01 India map with the permission of thE Surveyor eGn" .. 1 of Indi~
T"" "',ritor;., waters of India e"t,,,d into the cea to • distllnce of twelvg nautical mil<!S
,"_urgd (r.m the .ppropriacli bue lin.
MAP NO 2
a.. w
r
DARJEELING
Su.khiapokri
WEST DINAJPUR
8-3m~ngoJa·
MURSHIOAIIAD
N A o A
Krishn.g.nj
Kanskhan
TWENTYFOUIl PARGANAS
IlARRACKPOp.e
Ia.r~nagu
9 Corden Reach
10 Metl.bru,
II SWirupnaxar
12
13
Hasnabad
Hm,al,anl.,,_
HibwRAH
14 Ud'yna"y.npur
BURDWAN
JALPAIGURI DIVISION
BURDWAN DIVISION
PRESIDENCY DIVISION
POINTI'O AT TH' 101 (H.L.O .. \ P .... " .. G GoouP Of Su.v", 0' INOI~.
© Government of India copy,i,ht, 1979.
3
In 1961 there were only two administrative divisions in the state, namely, Presidency and Burd\\ an. The northern districts of Darjeeling, J alpaiguri, Cooch Behar, West Dinajpur and MaIda which formed part of Presidency Division were constituted into the new division of Jaipaiguri with headquarters at Jalpaiguri in 1963. The Presidency and Burdwan divisions were also reconstituted simultaneously. Presidency division now comprises the districts of Murshidabad, Nadia, 2"'- Parganas, Howrah and Calcl~tta while Burdwan division covers Hooghly. Burdwan, Birbhum, Bankura, Midnapore and Purulia. The headquarters of these two divisions remained unchanged.
No new district was formed during the period 1961-71 and the state boundary has not also undergone any change.
A new subdivision, namely, Durgapur was created during the decade with parts of the Sadar and Asansol subdivisions of Burdwan.
Th~re were a number of changes at the police station level as -8 new police stations were formed during the period. These are:
(i) Birpara taken out from P.S. Madarihat in J alpaiguri, (ii) Chakalia from P.S. Goalpokhar in West Dinajpur, (iii) Kalyani from P.S. Chakdaha in Nadia, (iv) Bclghoria from P.S. Baranagar in Twentyfour Parganas, (v) Liluah from P.S. Bally in Howrah, (vi) Dadpur from Polba in Hooghly, (vii) Bud Bud from police stations Ausgram and Galsi in Burdwan, and (viii) Digha from P.S.- Ramnagiu in Midnapore.
, There were slight changes in the boundaries of a number of police stations
due to transfer of a few mauzas either entirely or partly from or to the adjoining police stations. The effected police stations are Santipur, Ranaghat and Chakdah 'in Nadia, Arambagh, Mogra and Balagarh in Hooghly, Raina in Burdwan and Puncha and Manbazar in Puruna. These changes have not, however, been shown in the map.

MAP NO 3
i SIKKIM r' ., ~ ~ I '\ ,-.-.~, Q It
CHANGES IN ADMINISTRATIV~ \·~-·-~:·:'LING J (J .,. ~ BOUNDARIES 1961-71 « \ ~._ ,,-.J ~.", tv
A
\. \
/ /
./ (
HOOGHLY
HOWRAH
Polba
.' :.)
.~~I~I~:~ i \
-,-0 ".) j
/' i i
.'~' I TWENTY FOUR .\ PARGANAS
"
i
~ 1 , ,• l .:r.,--< J r' f.>
Z k .'\. JALPAIGURI I. w
o ~ o~., \ CO-·_o_ .(1)
.. r,JoJ
\ l ~". \·to\ /('''. .-." ..-."'-'7) v '.1"'" !_lI'"'- -~. , .J en
/.r r'i 8 D ~L· P .J" .,,' j Ct:·r·\"·""'·_J'~8D COOCH8EH.A4< .h.
. ..( .r· OJ ~ a C \'-" 8 D o~, c:.,' ':110 r ..... -/ "' ~ M~oalPokhar ,,) .\
J I ·"'·""~.I' _, ~Ii.~l 0c ., .~ . \» ( ." ',-' ". NEW POLICE STATIONS i
. ~ \'l Z ALIGNMENT OUT IN \
,./.-i wm OIN~~·:.V·"1 1:·;1··, "" \', "". cr:) .(("V . -" . .. , .... t. ~
f" ~ -,_.- '-.~. j "" MALDA J G) ,
) 'rLS' ,J\ .t' . . f' ~ \. . . 'Y" ( .
~·-l ,
,.
1964
1965
1967
8(j', .,
~'\'", OLD POLICE STATIONS IN t ._........ D
r' \ .~."-.\ 0 , 1961 CALCUTTA AND NEIGHBOURHOOD \') •
_. _J ~ 10 km ~ , (MURSHIDABAD ..
".",,-./,\"" r /-1 m NEW SUBDIVISION
,,', \ ('/ .. ..j I( ALIG_NMENT OUT IN """, (,', \ ( .,
"." '-.l '"1., BIRBHUM '-. ~ f',;~' en 1968 ~ ': \.,: . /........ J
km 10 S o
\
.-. -#... _( \. . -:-so • ~"_ .J"..J .')-._. ~. 0 <: t. NADIA {.
S t r '-( D~'- ",. ___ ) ~ \:I: ~ ..... ' ,'\,or' rJ' ".~~;/US9?1I __ ',1 ''-j- POLICE STATION TOLLYGUNGE
) MilIf-. ..... _ .. :·.:_, . j IS RE-NAMED AS POLICE STATION I ( .... Galsl '., 8UROWAN 0 <. JADAVPUR SINCE 1963 \.. PURULIA BANKURA" ...... ,. \ ~_. \,r" I \ )_. I - '-,
I ',,_,~ N ~. / 0 '~. I.~/r-·_· )~'~~~~d~ A jl!'" _. --,.., I' \)' .'. . .' . I r-
c' // ro
r' ."",. ___ . A ... ~ ... I ) / .,,0'" ....... \__. oJ '"",
(. . t<: /,..... . \...... HOOGHLY ,;
'\,0/ "-. .. J '\ r· ., " "'., 0 '\ • \.. • ., .. :-.l .5 • ~',\ '\' HOWRAH 1
(',~ . ·t.·, L " I MIDNAPORE .
BOUNDARIES ~
"" .$\ o t·
.. _,,_._.- ,.~. International .. . State ............ '" ... _._._._ ~ District ., ...... ' ... _._._._._ Subdivision ........... ______ _ POlice station ............................. .
B Pocket Of Bir bhum district C " Cooch Behar dislrict B 0 " "Ban9la d .. sh
km 16 0 16 32 48 64' 80 . 96 km
".g. No. 7181 HE'19 - 530 '80.
8 A
Based upon Survey of India map with the permission of the Surveyor General of India.
The territorial waters of India extend into the sea to a distance of twelve nautical miles measured (rom the appropriate base line.
F BEN G P.II.no AT '''1101 IH.l.o.) PaINTING G.ouP o.SU .... Of '''UIA.
© Government 01 India copyright. 1979.

4
The state may be divided into two distinct natural divisions, the Himalayan and Sub Himalayan North consisting of the districts of DarjeeIing, Jalpaiguri and Cooch Behar and the Bhagirathi delta in the south.
The greater part of DarjeeJing comprising the subdivisions of DarjeeJing, Kurseong and Kalimpong is in the lap of the Himalayas. The district records a maximum elevation of about 4,000 metres. Darjeeling, the headquarters of the district and the "queen" of hill stations is at an altitude· of about 2,500 metres. Siliguri subdivision of Darjeeling and the districts of J alpaiguri and Cooch Behar are below the foothills and consist mainly of low-lying plains. A number of streams and rivers originating in the Himalayas like the Tista, T orsha, J aldhaka and Raidak etc. traverse the region.
The plains to the south of the Ganga are mainly formed by the Hhagirathi and its tributaries like the Mayurakshi, the Damodar, the Ajay, the Kasai and the Rupnarayan. Of these rivers Bhagirathi is the only one which does 110t depend Oil rains. It branches off the Ganga just as the latter enters west Bengal and flows in a south-easterly direction through Murshidabad, Nadia, Howrah and 24 Parganas. In its lmver reaches it is known as the Hooghly. Between the Ganga and the Himalayan-sub-Himalayan North are the two districts of West Dinajpur and MaIda which are also traversed by a number of rivers, namely, Atrayi, Punarbhaba, Mahananda etc.
The districts of Birbhum, Bankura, Purulia and a portion of Burdwan which lie to the west of the Bhagirathi form a part of the foreland of the Deccan peninsula. The Damodar and its tributaries flow across the foreland and join the river Bhagirathi in the south. To the north of the Damodar basin a number of streams like the Dwarka, the Brahmani and the Bakkeswar flow from the west to the east till they join together to form -the river Dwarka which falls i.nto the Bhagirathi. The Ajoy flows in between the Damodar and the Dwarka and also falls into the Bhagirathi further south. The Rupnarayan, the Haldi aned their tributaries viz., Dwarakeswar, the Silai and the Kasai form another river system to the south of the Damodar system and falls into the estuary of the Hooghly.

RELIEF AND DRAINAGE
BOUNDARIES i-
ALTITUDE SCALE
IN METRES
1--
CONTOURS ARE APPROXIMATE
InternationaL ...... ~-.-.-Stat ................... _._._._
B Pocket 01 Bir bhum diltric:t C .. "Cooch Behar diltrict BD " .. Bangladelh
kill 16 0 16 32 48 64 80
Reg. No. 7181 HE'79-S30'80
'-~~ . "-'t' - ....
8.se6 upon Survey 01 Indi. mop with the permission I)' the Surveyor Gellerl' of 'ndia.
The territorial waters of ~"dia extend into the lea to a distanc. of twelve nautical ... no. meMured from the appropr,ate base line.
MAP NO.4
......J
« Q_
LU
9
. , \ . fi OJ
11 • C!I
U ._
' .... UD AT TH( 101 \H.L.O.) ' ..... TO ... G CO.cu> Of SUO"" Of INDI ••
© Gove.II .... nt 01 Indio copyriaht, 1979.

5
West Bengal is one of the few states where rainfall is hea-;y and fairly wiele-spread and more or less evenly distributed over space. Agriculture in the state depends almost wholly on rainfall. The south-west monsoon currents from the Bay of Bengal and from the Arabian Sea converge over the state and cause heavy rains in the summer months of June to September. Occasional heavy rainfall also occurs due to tropical cyclones originating in the Bay of Bengal. The average rain-fall in the state is about 1,800 mm, the maximum precipitation being in the monsoon months of June to September.
The state may be divided into two broad rainf~l1 regIon: 0) The Himalayan and sub-Himalayan North comprising the districts of Darjeeling. Jalpaiguri and Coach Behar and also the northern half of West Dinajpur; and (2) the remaining parts of the state comprising the central Gangetic plains and the western districts which form the eastern foreland of the Deccan peninsula. In the first region rainfall is very heavy (above 3,000 mm) in the foot-hills extending from Kurseong in the west to Kumargram in the east. To the north and south of this wettest belt rainfall decreases almost in parallel lines. The second region may again be divided into three sub-regions. In the districts of 24 Parganas, Howrah, Calcutta and coastal areas of Midnapur annual rainfall is between 1,500 mm and 2,000 mm. Rainfall is low and less than 1,250 mm in the region comprising eastern Purulia, almost the entire districts of Bankura, Burdwan and Murshidabad, south-eastern part of Birbhum and north-western part of Murshidabad. The average rainfall varies between 1,250 mm and 1,500 mm in MaIda, south-western part of West Dinajpur, the northern areas of Murshidabad, Birbhum and Burdwan, the eastern part of Purulia and most of the areas in Nadia, Hooghly and Midnapore.

NORMAL MONTHLY AND ANNUAL RAINFALL
....
(AVERAGE 1961 -70)
ANNUAL RAINFALL IN
MILLIMETRES
J 000
2000
1500
1250
I
BOUNDARIES;'- ,J Itrternational ........ _.-._._ )
State ...... '" ... " .... -'-'~-.,s',)
B Poc:ket 01' Blrbhum district t' C " Cooch Behar district ''\., BD " "Bongladesh -.
,) ,~ "" (" , . ~
16 32 48 64 80 96
"-I.ND. 718IHE'7'-530 81 •
•• 40
30
200
100
'Baled upon Survey 01 India map wIth th. permission of the Surveyor General ot India
The territorial wat6f"'S of It'ldiC'l extend into the '-' to a distance of twelye nautical mil .. measured from thfil appropriare balE line.
MAP NO 5
~, ~ r ..... :
~'
400
300
200
100
r
""""'" AT _101 (H.L.O.J ..... ,_ G'OU~."Su!Ml'" IoDA..
© (ioftmment 01 India capyri&ht, .919.
L ~ .
6
Soils of the state have been classified under ten major groups, viz., (i) red loamy, (ii) red sandy, (iii) laterite, (iv) red & yellow, (v) mixed red and black, (vi) deltaic alluvium, (vii) alluvial - recent, (viii) terai, (ix) brown hill (on sandstones & stales), (x) saline & alkaline.
Alluvial and red soils cover about 28.77% and 22.97% respectively of the total area of the state (87853 km1
). Mixed red and black soils are found in a small area only which make for a mere 1.12 % of the total area.
The greater parts of Cooch Behar, West Dinajpur, Nadia, Howrah and some portions of the districts of MaIda and Twenty Four Parganas consist mostly of alluvial soils. The entire district of Hooghly is alluvial. Deltaic alluvial sO"il is found only in two districts viz., in Midnapore and Twenty Four Parganas along the northern coast of the Bay of Bengal. It covers 17.07 % of the total area of :the state including the areas under the forest divisions of Twenty Four Parganas.
Red soil (Red Loamy and Red Sandy) is found extensively in the districts of MaIda, Bankura, Birbhum and Purulia. The type of soil is also found in the western end of Burdwan and southern part of West Dinajpur.
As already stated, the area covered by the mixed red and black soils is almost insignificant being found in 3 police stations only, viz., Banduan and Manbazar of district Purulia and Binpur of district Midnapore. Laterite soil is found in large tracts of Midnapore and in some parts of Burdwan and Birbhum.
The whole of Darjeeling district except a part of Kalimpong police station and the northern fringes of the police stations of Mal, Mitiali, Maynaguri, N agrakata, Dhubguri and Madarihat in Jalpaiguri district consist of brown hill soils. Saline & alkaline soils together cover 7.40% of the total area of the state.

SOILS
~ RED LOAMY
• RED SANDY
III LATERITE
• RED AND YELLOW
~ MIXED RED AND BLACI<
[[[[ill DELTAIC ALLUVIUM
. ~ ALLUVIAL SOILS-RECENT
r++++l ~ TERAI
DIIIJ BROWN HILL q-(ON SANDSTONES AND SHALES)
B SALINE AND ALKALI
\
...... -r! BOUNDARIES;- 0 International. L\ StQt. . ...... ~_._.~l'" Di.trict···· ......... ··.-0_._.-~ pock~t· ~ ·~i~j,h·u-;;';;;i;;··-··-
" .. Cooch Behar district
/
BD " "Bonglad .. h
kill 16 !
o , '16 32 4B ...., , 64 80 96 kill ·Y ,
MAP NO 6
S IKKIM
(J If
-l
{J 7"
'(
AI ,., Q.
I.U
2
? . I \ •
z
r
,l>
CJ
rn

7
The total area under forests in West Bengal is about 11,837 Km2 which constitutes about 13.5 per cent of the state's geographical area. The three principal forest zones are, (i) forests in the Himalayas and Duars covering the'districts of Darjeeling, J alpaiguri and Cooch Behar; (ii) forests in the laterite zone of the west comprising the districts of Birbhum., Burdwan, Purulia, Bankura and Midnapore; and (iii) forests at the Bay mouth. Besides the above, there are scattered· natural and man-made forests also in the districts of Murshidabad, Nadia, MaIda and West Dinajpur. According to experts, a country should have a minimum of 33 per cent forest cover in order that the population may fully derive the direct and indirect benefits of forests. In West Bengal the coverage is not only .too smilll but the distribution of the areas under forests is also irregular. .
In the Himalayan region vegetation changes with altitude. From the plain upto 300 metres grO\lIl figs, dates, wallichis, caryotides, marlea, sisn, sessiuJ, mihlosa etc. From 300 to 1,500 metres are found gordonia, pandnus, sal, toon, teak, peach, pine etc. They are succeeded at 1,500 to 2,000 metres by alder, oak maple, birch, cryptomina, bucklandia, walnut etc. From 2,000 to 2,500 metres are found oak, chestnut, magnolia, olive, michelia, raspberry etc. At a height from 2,500 to 3,000 metres are found magnelia, maple, rhodlldendron, laurel, lime, hydrangia etc. From 3,000 to 3,500 metres are found oak, chestnut, magnelia, rhododendron, champa, fir hemlock, barberry, celastrus etc. Dwarf rhododendron, juniper, holly, cherry, pear, geranium, veronica etc. are found b~yond 3,500 metres. '
In the western forest belt in the districts of Birbhum, Burdwan, Bankura, Midnapore and Purulia tropical dry deciduous forests (including sal and teak) occur. The importance of this forest belt consists more in its extensiveness and proximity to the industrial area rather tha!} in the value of the forest produce. Large scale plantrltions are now being raised with eucalyptus acacia etc. Besides, gamar, peasaI, .\emul, sal, teak, bamboos etc. are also being raised. Casuarina is being tried in the coastal belts.
In the third forest belt, viz., Sunderbans in the Hooghly estuary of the 24 Parganas grow poor quality of mangrove forests of goran, gewa, sundri, bean etc. Forests in the other districts, such as in Nadia, Murshidabad, MaIda and West Dinajpur belong to the tropical moist deciduous, consisting of sal, teak, sessu, babul and semul. Kadam and eucalyptus etc. are being raised in the lowlying areas which are subjected to annual inundation.
87853Km2
WEST BENGAL
PERCENTAGE OF AREA UNDER EACH TYPE OF FOREST
60
50
40
30
20
10
o

FORESTS
TYPE OF FORESTS
T"OPICAL WET EVUGREEN
D T"OPICAL SEMI EVERGREEN
LITTORAL ANO SWAMP (Including Mongrowes)
TROPICAL MOIST DECIDUOUS
TROPICAL DRY DECIDUOUS (Including Soland Teak)
~ SUB-TROPICAL BROAD-LEAVED HILL
[[J MONTANE WET TEMPERATE
F· ->~ .. ~ ... ·1 HIMALAYAN MOIST TEMPERATE
MOIST ALPINE
, f':i~ ' ,. :F ' t' _. -.. ~
.'V .• ~.
( ... \. .. -.~ ' ~..J •• t'. ". ~ . t·t. ,.: .. ~.
BOUN)ARIES i-Intemational ........ _._._._ State .................. _._._._ District ............... _ ._._ ._,_
B Pocket of Blrbllum district C .. 'J Cooch Sehar district 8D " .. Banll'adesh
ul6 0 16 32 48 64 80
Re,. No.71SIHE'79-530'ao. ...... upon S,,"III' 01 India map .. i~" rh. permiuion 0' the Su,..,.yor C." .... , 0( '"dia
n.. Cll'rltorIal wagn of India extend into the •• a to a distance of twelve nautial miles 111_ .... rrom the ..-propria,e bu. line.
MAP NO 7
<l a.. w
Z
\. )
.oJ
( )
<
SIKI(IM ,. . . . r-._.~ - / . . '-'" ~. ,
• y •
»
. ,. l.,,;·""",-,'" '-. ".. :-. . " • 1 •• • '. (-.~.-·-A.~ . .
. '.. I • I
.~ G)
" } .
. '\:' .~ ,/ . ( . \ .r .
!
o F
»
8 E
CJ)
" ( • , • ,
""'IOTa> AT _101 (H.L.O.) fIa, .. flNC eoaoup III'SlMYlY o. INDIA.
© Government 01 India copYri,ht. 1979 •

8
West Bengal had a total population of 44.3 million in 1971 of which 10.96 million or 24.75 % lived in the cities and towns. This is quite a high degree of urbanisation for a state. For the country as a whole, the proportion of the urban to the total population was 19.91 %. The states of Maharashtra, Gujarat, Tamil Nadu 11ad larger proportions of urban population than West Bengal.
The distribution of the urban population in the state is extremely uneven. The largest concentration of the urban popUlation is in Calcutta and the surrounding areas along the banks of the Hooghly. Calcutta urban ag~l()lneration comprises 74 urbaon units and had a total popUlation of 7.03 million which constitute 64.11 % of the total urban population of the state. The other such concentration of the urban population is in the Asansol-Durgapur region in Burdwan. In the districts of North Bengal urbanisation has made little headway. The situation is the same in the western districts of Bankura, Purulia and Midnapur.
The distribution of the rural population of the state is also uneven, though not to the extent the urban popUlation is. There is a heavy concentration of the rural popUlation all along the Bhag'irathi-Hooghly which comprises the districts of Murshidabad, Nadia, 24 Parganas, Howrah and Rooghly. Rural settlements are thick also along the North Bengal rivers Tista, Tersha, Ialdhaka and Mahananda in the districts of I alpaiguri, Coach Behar and MaIda. The fringes of the towns of the Calcutta and Asansol-Durgapur industrial belts are also thickly populated. The laterite soil zone of the westernmost districts and the regions of high altitudes in Darjeeling have relatively sparse popUlation.

DISTRIBUTION OF POPULATION 1971
.A
o. A o ~
........ "'r':. . .. . • ).r . ."-,,,-,,:-.. 0 •
~......, '\_ ...... o 0 • •
o •
. .. . . : ,-.
o 0
CALCUTTA AND
km 10 S
o
'0
~ 8~~=:!~~t _._._._ I State .................. _._._._ District .. ' ..... ' ...... _._._._._ B Pocket of BirbhuIII district C Cooch Behar district 80" Bangladesh
lUll 16 o 16 32 48 64 80
RIC. No. 7IBIHE'79-530'BO.
/
96 kill
IUed upon Survey 01 India map wit" the p.rmission Qf th" Surveyor Genera' or India
Th. territorial water, of Indil\ extend into the sea to " distance 01 twelve nautical miles
measured 'rom thQ appropriate bu. line.
MAP NO.8
« 0..
W
POPUL~JION SIZE
r CLASS I 500. odo &. ABOVE
. C~ASS ~. ··10.0. 0.00-499 999
CLASS II· 50 GO.O - 99999·
CLASS m 20 GOO _ 49999
CLASS nz: 10.0.0.0. 19999···
5000 9999·
CLASS III BELOW 500.0·
EACH ~OT REPRESENTS
5000 RURAL POPULATION
". ~
• .. .
PRINTS) AT T1'4Ii 101 \H.L.O.) ""NflfOG GROU' OF SuRvtT Of 1_.
© Government 01 India copyri,ht, 1979.

9
West Bengal had in 1971 an average density of 504 persons per Km2 which is second only to that of Kerala (549). The state is in fact more thickly populated than most parts of the country and the world.
Density of population varies appreciably from region to region within the state and also from police station to police station within the regions. In all the five districts of northern Bengal (Darjeeling, Cooch Behar, Jalpaiguri, West Dinajpur, and MaIda) and also the four western districts of Purulia, Bankura, Birbhum and Midnapur the density is below the state average. The remaining seven districts which are all in the Central Gangetic plains and belong mostly to the Calcutta and Asansol-Durgapur industrial belts have heavy densities of above the state average. The city district of Calcutta has a enormous density of 30276 persons per Km2. In the Himalayan district of Darjeeling, on the other hand, the density is below 150 per Km2
• These are Sukhiapokri (122) and Garubathan Purulia which has a low density of 256.
The map has grouped the 290 police stations of the state into seven ranges as shown below:
Number Density!Knit of police
stationS" 5000+ 9
3000--4999 15 1$00-2999 11 500-1499 88 350- 499 71
150- 349 94 Below 150 • 2
Outside the cities of Calcutta and Howrah the highest densities of population are to be found in Baranagar (15657), Belghoria (15457) and Garden Reach (11962) police stations, all belonging to the district of 24 Parganas and comprised within Calcutta industrial belt. Beyond the Calcutta metropolitan area and the Asansol-Durgapur industrial belt the highest density for any police station is to be found in Nabadwip (1542) in district Nadia. There are 2 police stations in which the density is below 150 per Km2
• These are Sukhiapokri (122) and Garubathan '{72), both in district Darjeeling.
Within a district again the variation of densities in the police stations is the widest in 24-Parganas. In the industrialized areas of the district density shoots up to 15657 per Km2 in Baranagar PS while in the newly settled deltaic south it plunges to 157 only in the police station of Sagore. The range of variation is narrower in all the northern and western districts.

DENSITY OF POPULATION
1971
CALCUTTA AND NE'GHBOURHOOD
kmlO 5 0 10~m
'l-
\
9
"" 1":.. -BOUNDARIES:- • '-.-International. ....... _..--._.-State .................. -._._._ Oistrict ............... _._._._._ Subdivision ........... ______ _ police station ............................. .
B pocket of Blrbhum district C " Coach Behar district BO " "Bangladesh
km 16 0 16 32 48 64 eo 96 km
MAP NO 9
S I K KIM
.J
~
I:L w
Z
,..
~
"..
CP
OF /It. L.
81f (J .,..
AI At
C) DENSITY OF
POPULATION PER km
ABOVE 5000
3000-4999
1500-2999
\
'\ (' , , \ ,
.nnm 500-1499
.wID S A -504
~!llll~lliljl 350-499 o 150-349
[IJ '-us THAN ISO
10
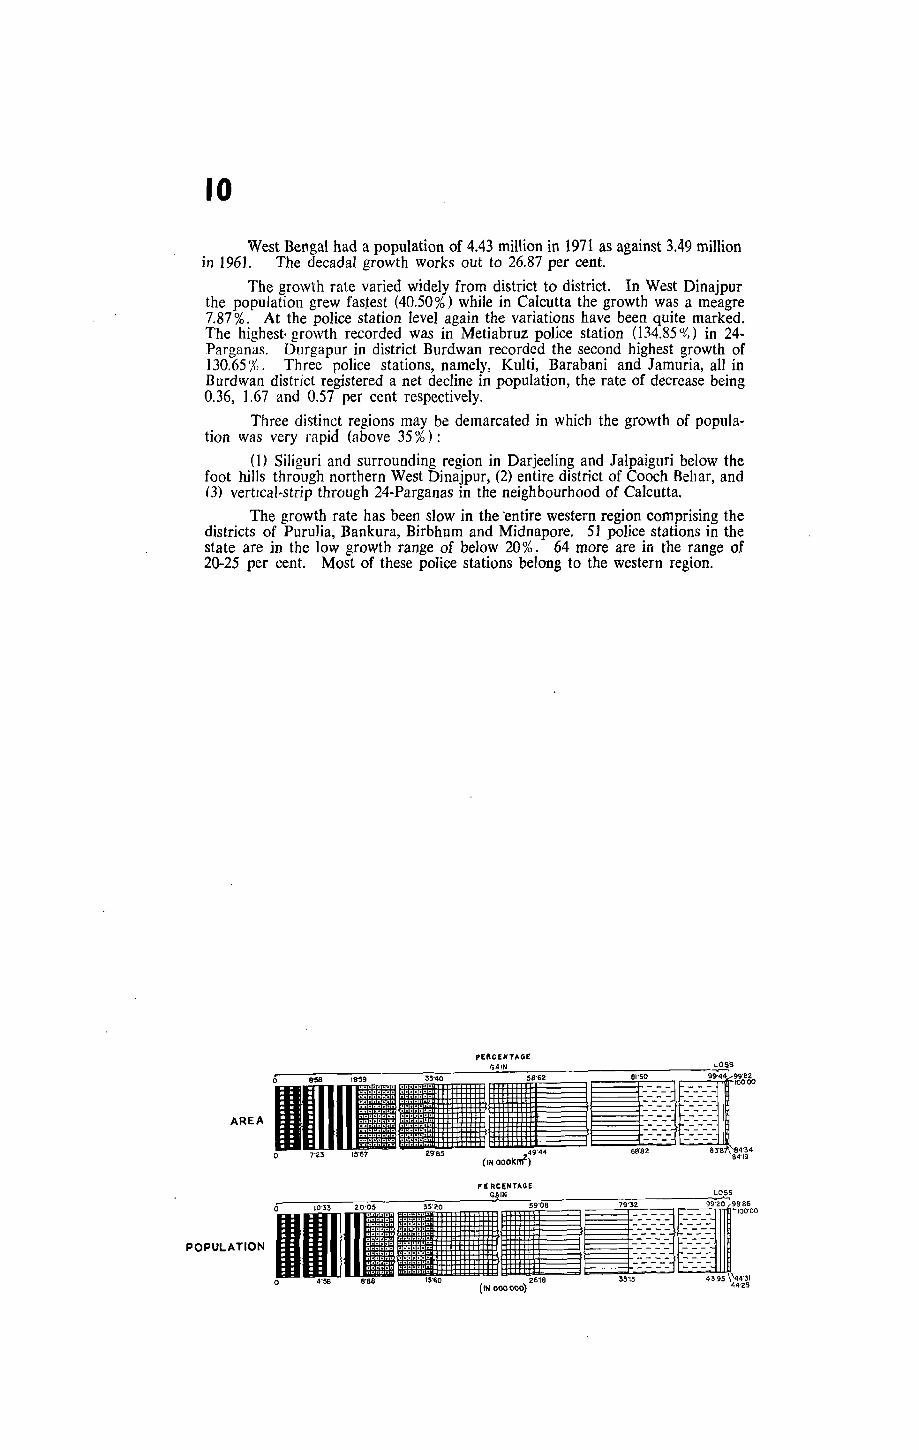
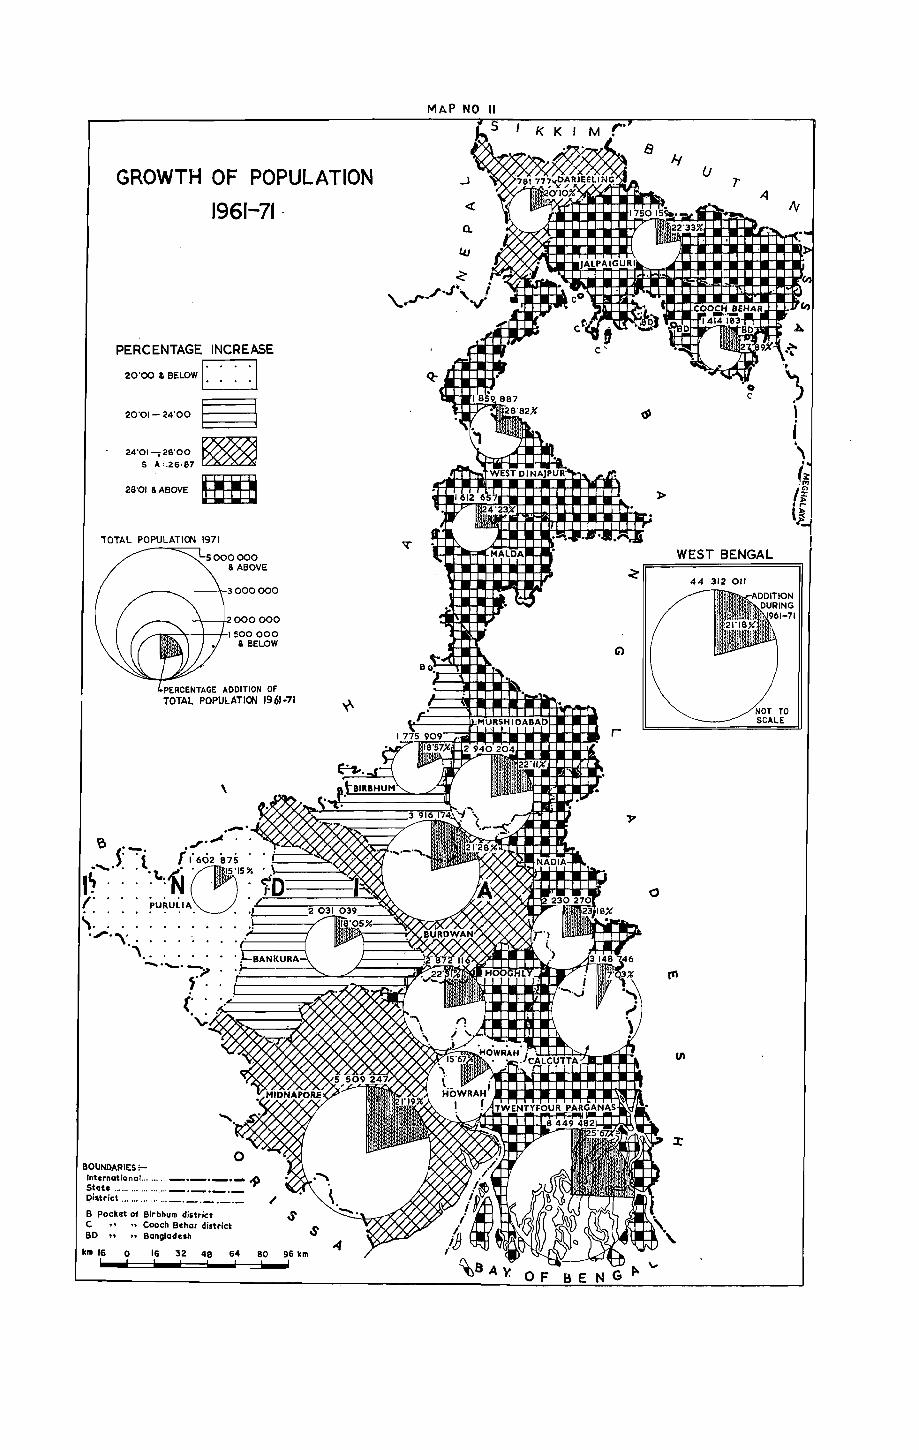
West Bengal had a population of 4.43 million in 1971 as against 3.49 million in 1961. The decadal growth works out to 26.87 per cent.
The growth rate varied widely from district to district. In West Dinajpur the population grew fastest (40.50%) while in Calcutta the growth was a meagre 7.87 %. At the police station level again the variations have been quite marked. The highest· growth recorded was in Metiabruz police station (134.85 0
/,,) in 24-Parganas. Durgapur in district Burdwan recorded the second highest growth of ] 30.65 ~{). Three police stations, namely, Kulti, Barabani and Jamuria, all in Burdwan district registered a net decline in population, the rate of decrease being 0.36, ] .67 and 0.57 per cent respectively.
Three distinct regions may be demarcated in which the growth of population was very rapid (above 35%) :
(I) Siliguri and surrounding region in DarjeeIing and Jalpaiguri below the foot hills through northern West Dinajpur, (2) entire district of Cooch Rehar, and (3) vertIcal-strip through 24-Parganas in the neighbourhood of Calcutta.
The growth rate has been slow in the 'entire western region comprising the districts of PuruIia, Bankura, Birbhum and Midnapore. 51 police stations in the state are in the low growth range of below 20%. 64 more are in the range of 20-25 per cent. Most of these police stations belong to the western region.
AREA
o
POPULATION
pEIICENTAGE
49'44
(IN oool<rtf)
26'18 (IN 000000)

CHANGE POPULATION
IN 1961-71
CALCUTTA AND NEIGHBOURHOOD
km 10 5
km 16 0 16 32 48
r-
\ .\ . \
PERCENTAGE CHANGE II .~
J~
GAIN
ABOVE 39'99; l
[UJ]]
• • ~ I-----J 1_-_-_-_ I
35 '00-39'99
30'00 -34'99
S. A. 26'87 25'00-29'99
20'00-24'99
t:~ SELOW 20'00
LOSS
ii ABOVE roo
.~
• roo AND BELOW

I I
The average decadal percentage increase of population of the state, as already observed, was 26.87 during 1961-71. In 10 out of 16 districts the percentage increase was higher than the state average. West Dinajpur recorded the highest growth of + 40.50 % followed closely by Cooch Behar (+ 38.67 ~O. The city district of Calcutta registered a small increase of + 7.57 % only.
The map shows the districts shaded in different grades according to their percentage growth. It also presents an additional feature of the growth--the net percentage addition to the population with reference to the population of 1971. These latter percentages are depicted by the pie-diagrams super imposed on each district. The size of each circle is proportionate to the size of population of the district as in 1971. The shaded portions of the circles represent the decadal accretions of population 0961-71) expressed as percentage of the 1971 population of the districts.
The figures of percentage increase and net addition are shown below:
State/District
1
WEST BENGAL
West Dinajpur
Cooch Behar
24 Parganas
Maida.
Nadia
Jalpaiguri · Hooghly
Murshidabad
Burdwan
Midnapur · Darjeeling · Birbhum
Bankura
Howrah
Purulia
Calcutta
AREA
o
Percentage increase
2
26.87
40.50
38.67
34.53
31.98
30.14
28.76
28.72
28.39
27.04
26.89
25.16
22.80
22.02
18.58
17.86
7.57
PERCENTAGE
50'95
44'76 (IN 000 km2)
PERCENTAGE
Percentage addition
,3
21.18
28.82
27.89
25.67
24.23
23.18
22.23
22.21
22.11
21.28
21.19
20.10
18.5',
18.05
15.67
15.15
7.03
713'07 91'OB 100'00
66'59 80'OZ 87'135
o 60'61 83'60 91'02 100'00
POP:~1:'!= ~~'-71 n u u u un n U U IfIIa .. ·1 o 56'BS
(IN 00000)
78'46 85'43 93'136
GROWTH OF POPULATION
1961-71 .
PERCENTAGE INCREASE
20'00 & BELOW D 20'01-24'00 ~
24'01-;28'00 ~ 5 A'.26·S7 ~
28'01 & ABOVE ~
TOTAL POPULATION 1971
000000 & ABOVE
____ -+--+2000 000
--"-<--+--1--1500000 & BELOW
''''~'''''A''-~ ADDITION OF TOTAL POPULATION 1961-71
\
BOUNDARIES :-International ... .... , _ .. ~._._ ~ Stote .................. _._._._ ()istricl ............... _._._._._ /
S Pocket of Blrbhum district C .. "Cooch Behar district SO " "Bangloduh
km 16 0 16 32 48 64 80 96 km
MAP NO "
« Q.
r
8
o
(J
4
WEST BENGAL
12
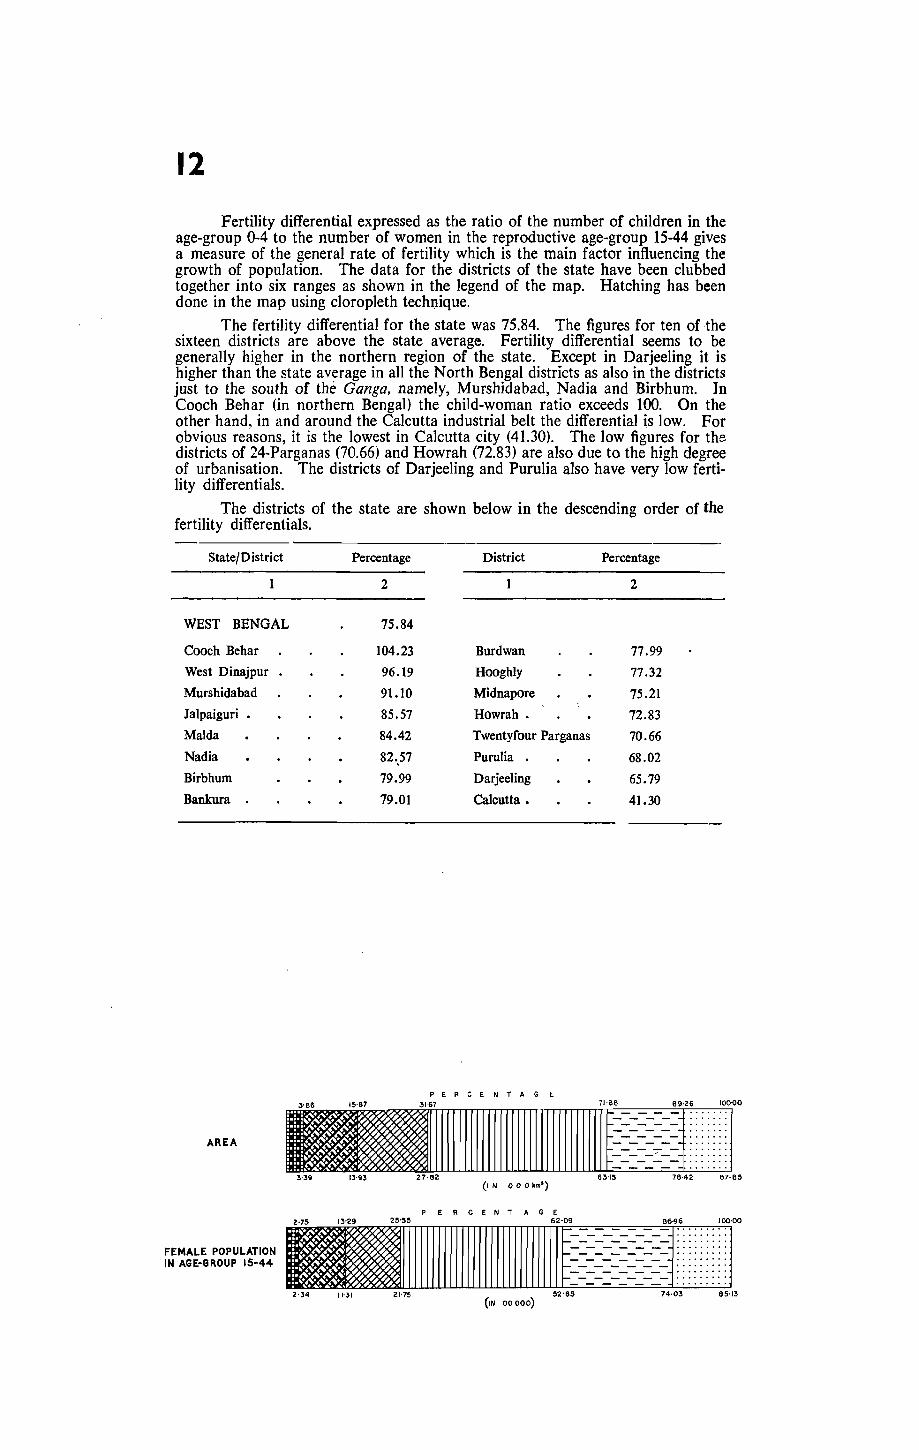
Fertility differential expressed as the ratio of the number of children in the age-group 0-4 to the number of women in the reproductive age-group 15-44 gives a measure of the general rate of fertility which is the main factor influencing the growth of population. The data for the districts of the state have been clubbed together into six ranges as shown in the legend of the map. Hatching has been done in the map using cloropleth technique.
The fertility differential for the state was 75.84. The figures for ten of the sixteen districts are above the state average. Fertility differential seems to be generally higher in the northern region of the state. Except in Darjeeling it is higher than the state average in all the North Bengal districts as also in the districts just to the south of the Ganga, namely, Murshidabad, Nadia and Birbhum. In Cooch Behar (in northern Bengal) the child-woman ratio exceeds 100. On the other hand. in and around the Calcutta industrial belt the differential is low. For obvious reasons, it is the lowest in Calcutta city (41.30). The low figures for the districts of 24-Parganas (70.66) and Howrah (72.83) are also due to the high degree of urbanisation. The districts of Darjeeling and Purulia also have very low fertility differentials.
The districts of the state are shown below in the descending order of the fertility differentials.
State/District Percentage District Percentage
1 2 2
WEST BENGAL 75.84
Cooch Behar
West Dinajpur
Murshidabad
JaJpaiguri •
MaIda
Nadia
Birbhum
Bankura .
AREA
FEMALE POPULATION IN AGE-GROUP 15-44
104.23 Burdwan 77.99
96.19 Hooghly 77.32
91.10 Midnapore 75.21 85.57 Howrah • 72.83 84.42 Twentyfour Parganas 70.66
82.,57 PuruIia 68.02 79.99 Darjeeling 65.79 79.01 Calcutta. 41.30
PERCENTAGt
.. 11111111111111111111111111111 r~~~~~~~ ~L i 'J' 3·39 13'93 27· 82 63'15 78·42 87· 85
(I N 00 0 ~"')
PERCENTAGE
.Illlllllllllllllllllllllllm~~~~~~~~~l· i: iT 52'85 74·03 85'13 2'34 11'31 21'75
(IN 00000)

. FERTILITY 1971
PROPORTION OF CHILDREN (0-4)
PER HUNDRED WOMEN (15-44)
100'01 & ABOVE
BO'OI- 90·Oo.
7S·?I- 80'00
5 A: 75·84
70·01 - 75'00
r::::::::l 70'00 & BELOW
L3
d \ _,.~:::-JJ ,., ,'-' i' ... , ...... .
....... j::( ,::::::::::::
I~: : ; : : : :':~<: : : : :N : : : : : ,: : : : : : : : ~~~~L'I~: : : •• : : : :
(: : : : : : : : . 68·02 . : : : : : : : :1 , . ............... " ... .
.~.,;-< ; ; ; ; ~ ; ; ; ; ; ; ~ ~ ......,_..'-:-,....:.._ . •••. J
t'U{1 .~~
I BANKURA
79·01
MAP NO 12
.1l11l1· BIRBHUH
79-99
(..,. S I I( I( I M r' '. (.
( : \.- - ~'''::'-:-:-: •• '1. •• ' .......... " •• , . ; •• J ~ . . . . . . ~ . . . . . . . . . . ............ '" ..
..J : .............. . \OAAJ'EElIN(;: : : .. .
~ , : :65·79 :. • . \ ...... .
z
t BURDWAN
77-99
HIDNAPORE 75'21
BOUNDARIES::- 0 InternationaL. , ... , _._. ___ ._ State ......... , ....... _._ .. _,_ District ........ , ., .... _._._._._
B Pocket of Birbhum district C " .. Cooch Behar district Bo " "Bongladesh
km 16 0 16 32 48 64 BO 96 km
r
,..
o
m

13
Of the total population of 44.31 million of the state 23.43 million are males and 20.88 are females. The males outnumber the females by 2.55 million. The 'sex ratio for the state or the number of females per 1,000 males comes to 891 which is one of the lowest among the states and is considerably below the all-India ratio of 930.
The map shows the sex ratio for the total popUlation of each police station. The ratio at the police station level has been grouped into seven ranges which have been hatched into different shades. The area where the sex ratio exceeds 1,000 has been hatched red.
The sex ratio is the highest in police station lore Bungalow (1010, of Darjeeling district. This is the only place where the ratio exceeds unity. The ratio is the lowest in Calcutta city (636); in Howrah city it is just a little higher at 679. Besides the two cities, ten of the police stations, namely Siliguri, Jagatdal, Barrackpore, Titagarh, Khardah, Garden Reach, Matiabruz, Bawria, Bally and Bhadreswar belong to the lowest range of sex ratio (below 750). All of them except Siliguri are within the Calcutta metropolitan area. Sex-selective migration to the industrial-commercial belts has distorted the sex ratio in these areas.
The distribution of the police stations in the seven ranges of sex ratio is shown below:
AREA
Sex Ratio (Females per 1,000 males)
1000 and above 975-999. 95~-974 • 900-949. 850-899 • 750-849. Below 750
PERCE'NTAGE
..
Number of Police Stations
1 30 87
108 31 21 12
',r0" "." "." .,." "." r' 1111111111111111111111111111111111111111111111111111111IIIIIIIIIIIIIf
OO
0'-0"15 9"85 39"68 72"01 81"28 \'84"34 (IN 000 km2..l 83"62.
o 0"10 8"41 35-81 Pt:RCENTAGE 72"99 82'58 90'13 100-00
FEMALE POPULATION
11111111111111111111111111111111111111111111111111111111111111111 ~~=~:J o 0'02 1'76 7'48 (IN 000000) 15'2.4 11'2.4 18'82 20'S8

MAP NO 13
• SI~f(IM!"·
SEX RATIO 1971
FEMALES PER 1000 MALES
1000 AND ABOVE
km 10 5 0
8 Pocket 01 Bir bhum district C " "Cooch Bchar district BO " "Bangladesh
km 16 0

14
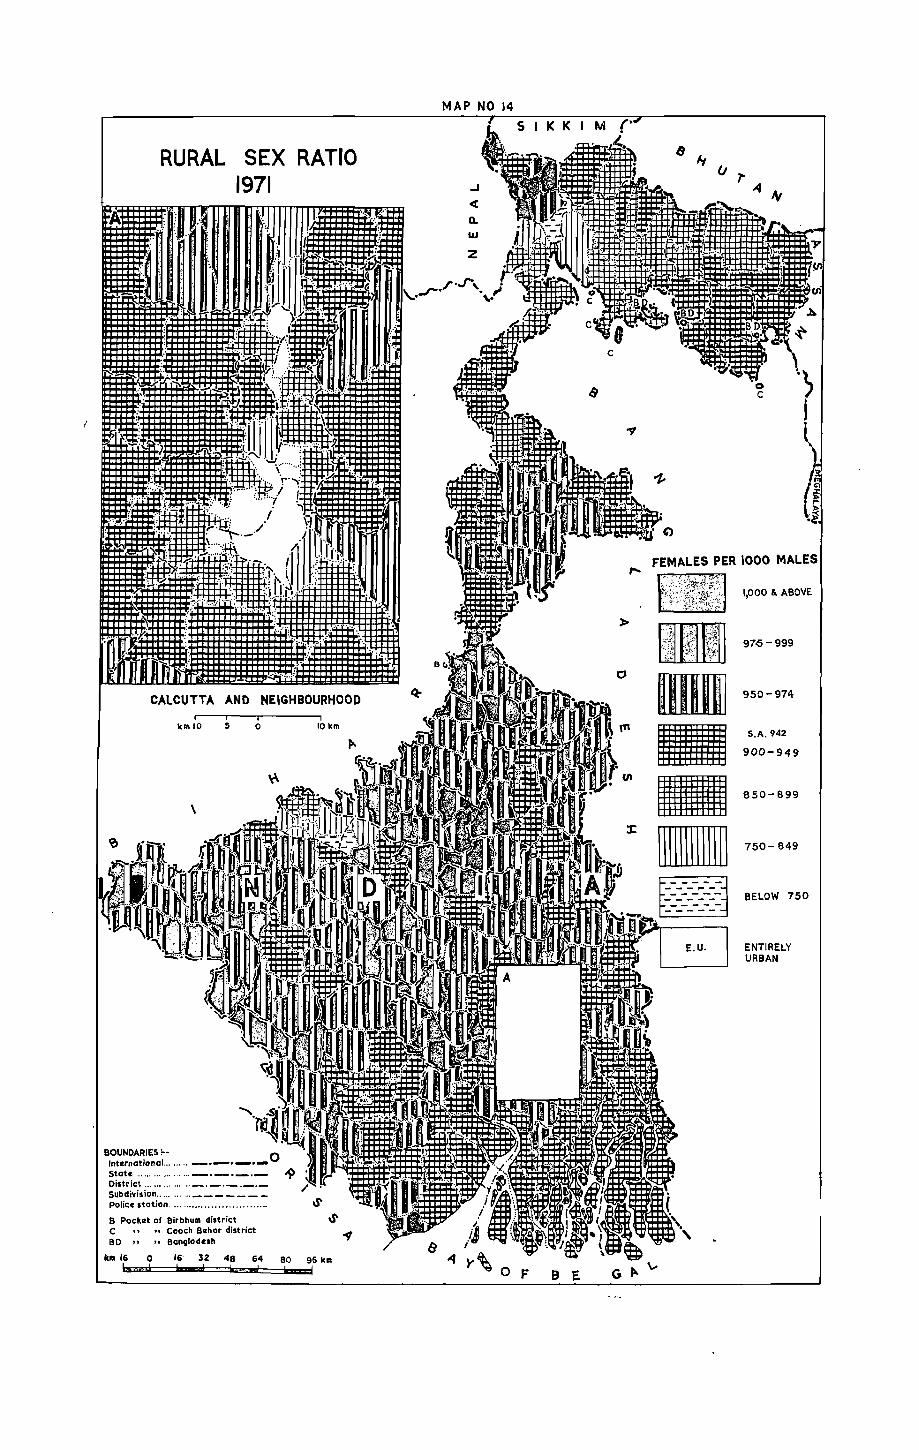
The sex ratio among the rural population of the state in 1971 was 942. The map shows the sex ratio in the rural population of each police station.
The sex ratios for all the police stations except those which are entirely urban have been grouped in seven ranges as shown in the legend of the map. The all-urban police stations have been left without any hatching and the word "E.U" is written on them. There are ten such in the state-6 in 24 Parganas and 1 each in Howrah, Hooghly, Midnapore and Purulia.
F or rural areas, the sex ratio exceeds 1,000 in only one police station, namely, Jore Bungalow in Darjeeling, the figure being 1,010. There are 3 police stations where the rural sex ratios are below 750. These are Siliguri in Darjeeling and Raniganj and Ondal in Burdwan. It is also seen that only 40 of the police stations have low sex ratios of below 900 in their rur~I areas, in all the remaining 240 police stations the ratio is 900 and above. .
The distribution of the police stations in the different ranges of sex ratios for their rural components is as under:
1000 and above 975-999 . 950-974. 900-949. 850-899. 750-849 • Below 750
AREA
RURAL FEMALE POPULATION
1 35
101 103 27 10 3
PERCENTAGE
(I~ 000 000)
RURAL SEX RATIO 1971
.:.:! I.
.! /i .
I-!
.... ~ , ..
r.~ .....
1-t'l \i
.j ....... I '''1--._./ .:~
.i'.~ ( . ,
CALCUTTA AND NEIGHBOURHOOD
km 10 5 0 10 km
BOUNDARIES:-- 0 International. .. ..... ---_ .. _.-State .................. _._._._ -9 ~ Oistrict ............... _._._._._ Subdivision ........... ______ _ police station. ... ................ .... ...... d' B Pocket of 8irbhum district d' c .. .. Cooch Behar district BO .. ,,8angladesh
km 16 0 16 32 48 64 80 96 km kl§fdl d ! ! 1. .. ...1 ! !
MAP NO 14
4 w
. i'''' J:
~ ~ W~~~ , c~ ,~.~~
c
I!J
~.i-I"i'G
',-.., ~
"
,..
J.
': I? 1:1 •• -t-
0 c
FEMALES PER 1000 MALES ,..
»
o
E.U.
i'
1,000 &. ABOVE
97.:5-999
950-974
S.A.942
900-949
850- 899
750- 849
BELOW 750
ENTIRELY URBAN

15
The sex ratio in the urban population of the state is considerably lower than among the rural people due, mainly, to distortions caused by sex-selective migration to most urban areas. The urban sex ratio was 751 as against the rural ratio of 942.
The map shows the sex ratio in the urban population of the state at police station level. The police stations which are entirely urban or have been components have been grouped into six ranges according to the sex ratios in their urban population. There are 134 such police stations. The police stations which are entirely rural have been left without any hatching.
Besides the citie~ of Calcutta and Howrah which have very low sex ratios of 636 and 679 respectively, 16 of the police stations belong to the lowest sex ratio range of oelow 750. The ratio is low in the industrial belts of Calcutta and Asansol-Durgapur. In the northern and western regions of the state where the degree of urbanisation is low and industrialisation is insignificant the sex ratio is quite high in most urban areas. Siliguri in District Darjeeling is an exception in the northern region. So is Sutahata (Dt. Midnapore) in the western region. The sex ratio in Sutahata was 653 only, the emergence of the port town of Haldia being responsible for the depression in the ratio.
The distribution of the 134 urban or partly urban police stations of the state according to the ranges of their sex ratios is given below:
975-999 • 2
. 950-974.
900-949.
850-899.
750-849.
Below 750
8
34
36
38
16
AREA IlUii 1111111111111111 iil~ 1IIIIIIIIIIIIIiiiill[iilllllllllllllllllllllllbH~~~il OtO'14 1'42 S'SI 9'94 15'56 19'50
URBAN FEMALE POPULATION
(IN 00 km 2) ,
I"'''''~ "M """'~\, "'00
.IIIIIIIIIIIIIIIIIIIIIIIIIIIIIIIIIIIIIIIIIIIIIIf~ ~~ t:l~~_~}-~: [~~_~:i~ 00'10 1'04 6"94 13'94 as'59 47'05
(IN 00 000)

URBAN SEX RATIO 1971
A
.. ' .....
CALCUTTA AND NEIGHBOURHOOD
kill 10 5 .0 10 kill
\
BOUNDARIES :-International ........ _ .. _._.-. ) State ................ ,,-.-'_'_ 0 District .......... , .... _._._._._ SUbdivision ....... , ... _____ - -police station .. , .......................... .
B Pocket Of Blrbhlim distric.t . C .. "Coach Behar dIStrIct BO " "Bangladuh
km 16 0 16 32 48 64 80 96 kill
MAP NO 15 SIKKI M.
e E
'" f:::=~==:~ '.10. 750
lI' D Enlir"IY Rural

16
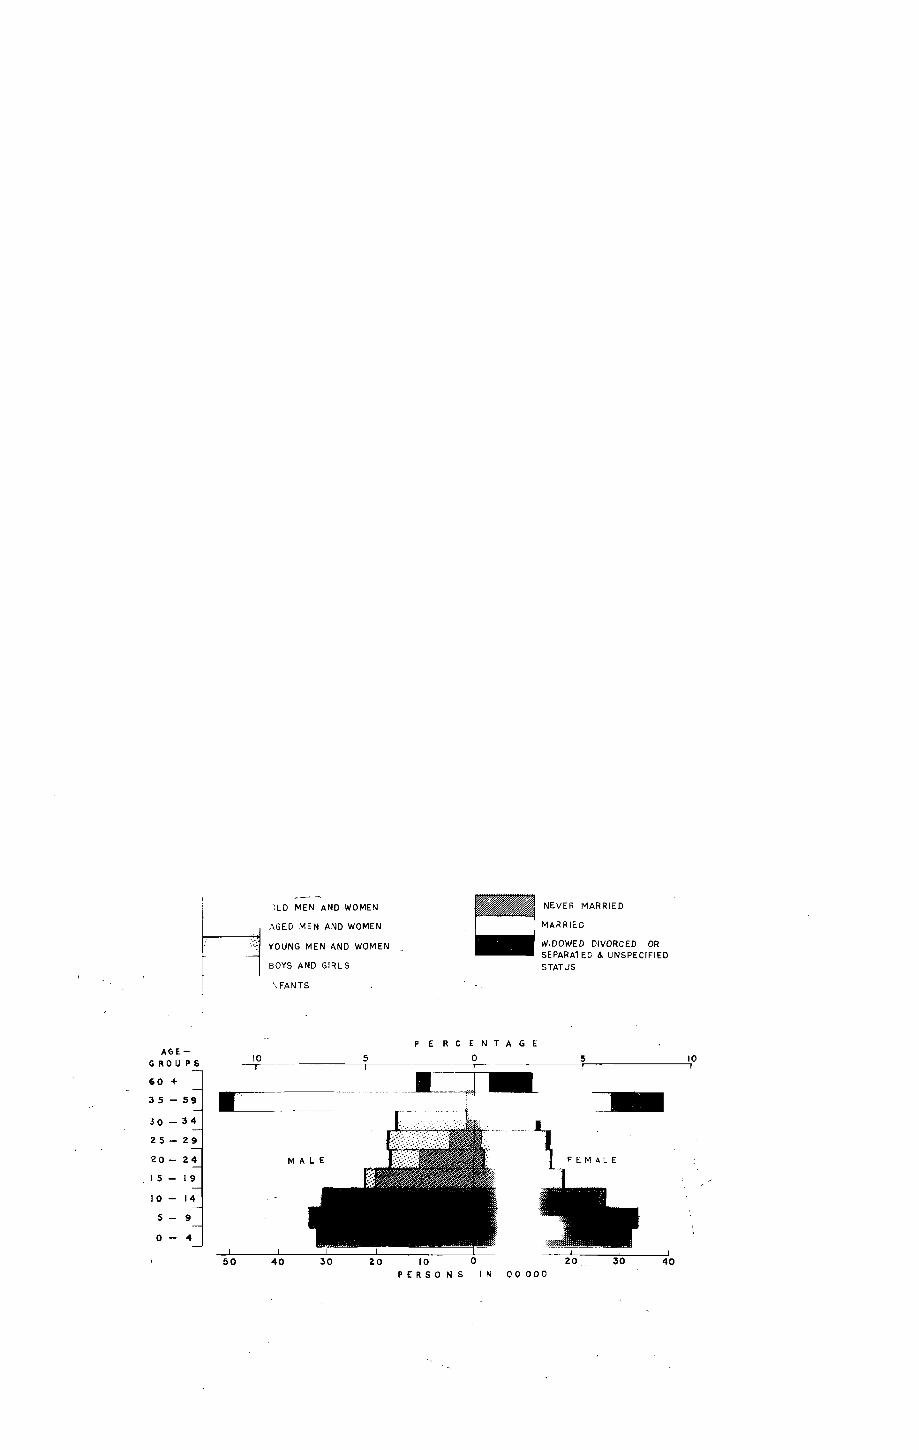
The map shows the composition of. the .population by sex, age and marital status for each district of the state. .
The population has been divided into nine broad age-groups for both the sexes. The age period 0-34 is divided into seven quinquennial age-groups starting with Q-4. The remaining period is divided into two unequal groups of 35-59 and 60 +. Each age-group has been shown in the map by a horizontal bar. The bars again are sub-divided into three parts each to show the marital status (i) never married, (ii) married, and (iii) widowed, divorced or separated and unspecified.
The population is also classified according to the age-group as infants (0-4), boys and girls (5-14), young men and women (15-34), aged men and women (35-59) and the old men and women (60 +). They are shown in the map by light red colour with various grades of hatching.
The bars should normally follow a diminishing trend and form a pyramid of the shape of an isoceles triangle. But because of various distortions in the age returns and the influence of migration smoothness is disturbed and the expected isoceles triangle is not available for many of the districts. In the present map, however, the pyramid could not form at all because of unequal grouping of age.
As already observed, the proportions of the population (of both sexes) in each quinquennial age-group declines in all the districts till the· age-group 30-34. A continuous and steady high birth rate coupled with a steady decline in rates of mortality has made for a high proportion of infants and children (age group 0-14) in the total population for the state as a whole and most of the districts. Most districts have, of course, more of children (5-9) than of infants (0-4) for both sexes. On the other hand the pouplation in the working age-group 15-59 especially among males has reached a high level in some district like Calcutta and Howrah.
A very remarkable feature of the age composition of almost all districts is that the infants (0-4) constitute a high proportion of the total population. While the state average was 14.56% the disrict of West Dinajpur had the highest proportion of infants (18.20%). in its population. The proportion was the lowest in Calcutta (7.91 %).
The boys and girls of age gro~p 5-14 constitufes 28.33% of the total population of the state. The highest proportion for them was 31.17% in MaIda and the lowest was 21.39% in Calcutta. .
The young working age-group 15-34 contributed 31.15% of the total population for West Bengal as a whole. Calcutta, naturally, has the highest proportion in this age-group (38.86 %). Cooch Behar came at the end of the list with a figure of 27.94% only. .
The population in the age-group 35-59 which is considered as the matured part of the productive people con,stituted 20.51 % of the total popUlation of the state. As expected, Calcutta leads the other districts with the percentage of 26.60. MaIda (08.43) comes at the end.
The old people of 60 and above are found in the largest proportion in Nadia (5.31 %). In Darjeeling the proportion is the lowest (4.33%).
As in the country as a whole, marriage is almost universal and the age of marriage low in the stat.e of .West Bengal. !here is not much of a differel?-ce between the two sexes 1D thIS regard. WhIle the percentage of the marned among the males of age group 30-34 reaches the highest (94.77) in MaIda it is a relativelY low figure of 75.75 only in Calcutta. For the state as a whole the proportion for the age group is 87.60%.
For the fair sex the proportion of the married in the age-group 20-24 for the state 'Was 85.03 %. In Cooch Behar it exceeded 92 % while in Calcutta it stood at 62.94 %. The next higher age-group the proportion was still higher-89.45 % for the state. It rose to 95.47% in Cooch Behar and also in MaIda. For both the age-groups the hill district of Darjeeli~g showed relatively s~aller p~oportion of the married amo~g the fema~es-63.72 %. and. 79.27 % respectIvely whIch is indicative of a slightly different socio-cultural sItuatIon. , -

h t
AGE -GROUPS 10
60 + 35
20 -
15
10
5 9
0
50
lLD MEN AND WOMEN
AGED MEN AND WOMEN
YOUNG MEN AND WOMEN
BOYS AND GIRLS
N FANTS
40 PER SO N S IN
TAG E
NEVER MARRIED
MARRIED
WIDOWED DIVORCED OR SEPARATED &. UNSPECIFIED
STATUS
5
-=-
40 00000
10

SEX AGE STRUCTURE AND MARITAL STATUS
1971 AGE
G~OUPS
60 + ~S-S9
15-34 5-14 0-4
"'G[GROUPS 60+ ~~- 59
30- 34
25- Z9 20-24
15-19 10-14
S - 9 0-4
AGECROUPS
60 +. 35 -30 -
25 -
10 - I
~ - 9 o - 4
6 0
km 16 o 16
AGEGROUPS
60 + ~5 -:19
30 - 3~
250 -29 lO - 24 15 - 19 10 - 14 5 - 9 0-4
BOUNDARIES ;-International... ..... _.-._.-State .......... ,. , .. ... _._._.-District .. ' ............ _._._._.-B Pocket of Birbhum district C Cooch Behor district 80 " ,. 8angladesh
32 48 64 80
Reg. No. 718IHE'79-530'SI.
BOiled upon Survey of Indil mlP with the permil5ion of the SUNeyor General of India.
MAP NO 16
AGEGROUPS 60+ 35 -59 30- 34
25-29 ~o- 24 ,,-,9 10-14
5-9 0- 4
A y
w
c
ENG A L
P.IHTID AT TNIIOI (H.L.O.) ..... NTlNG G!oOUP Of SU'Vll Of INO'A.
© Government of India copyri,ht, 197,).
The tl!rritorial wlterl of India extend intD the I" to I distance of twelve nautical milas moasured frDm the sppropriate base line.
17
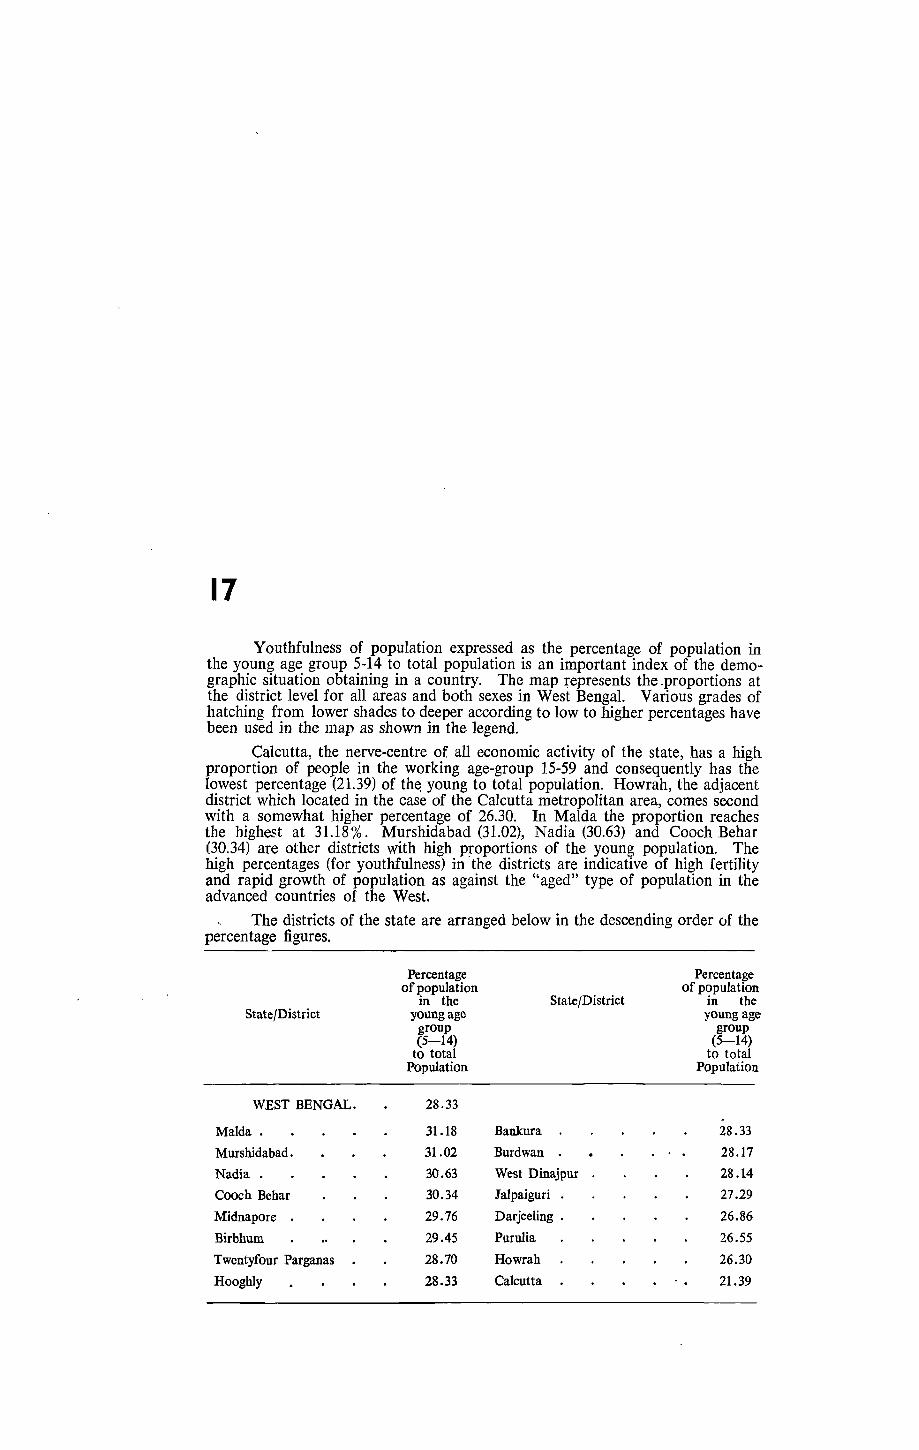
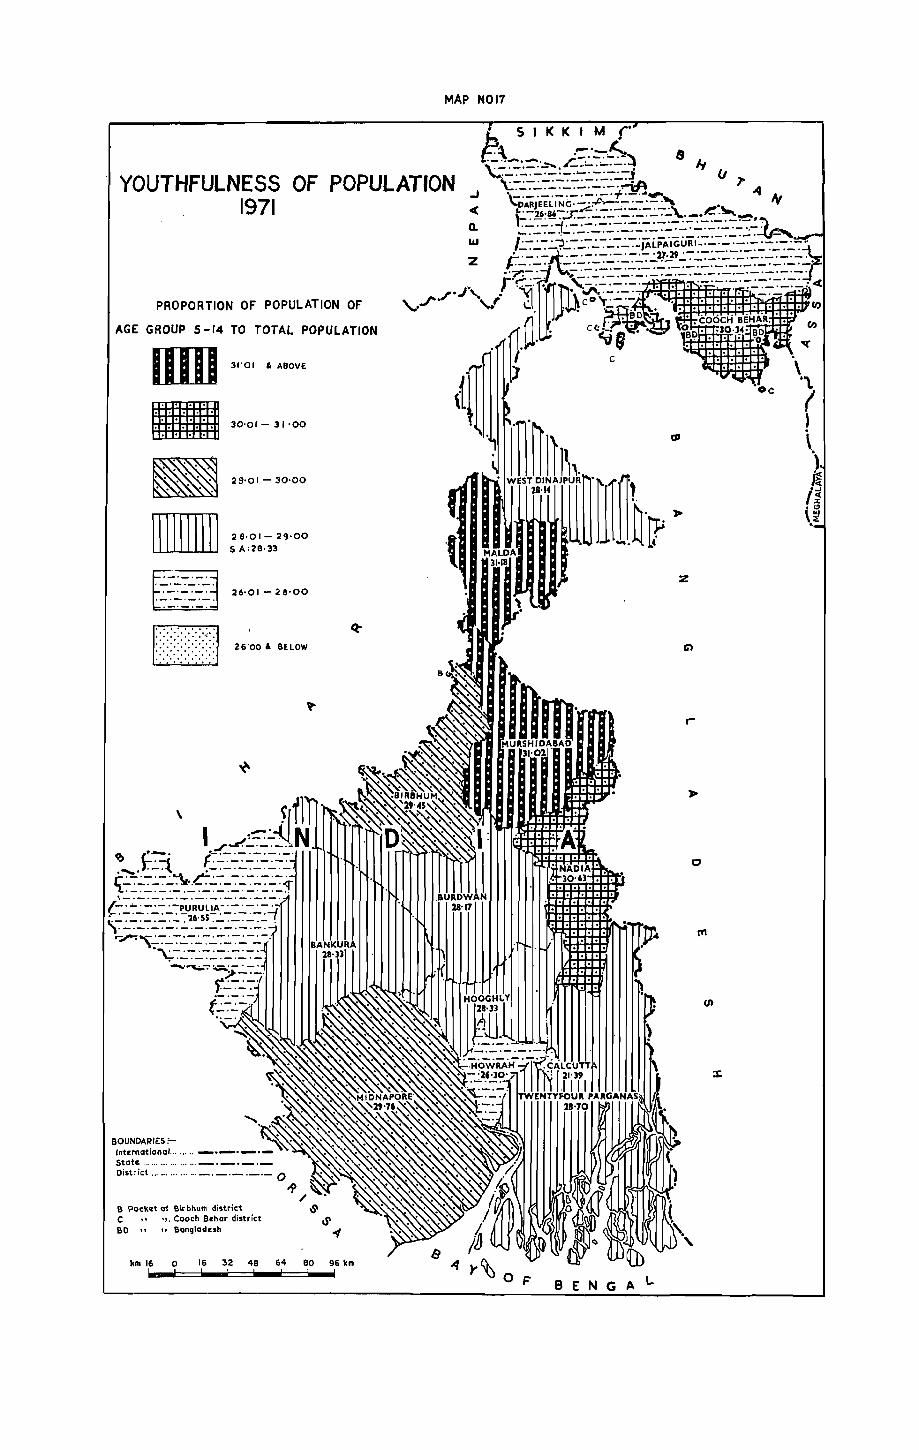
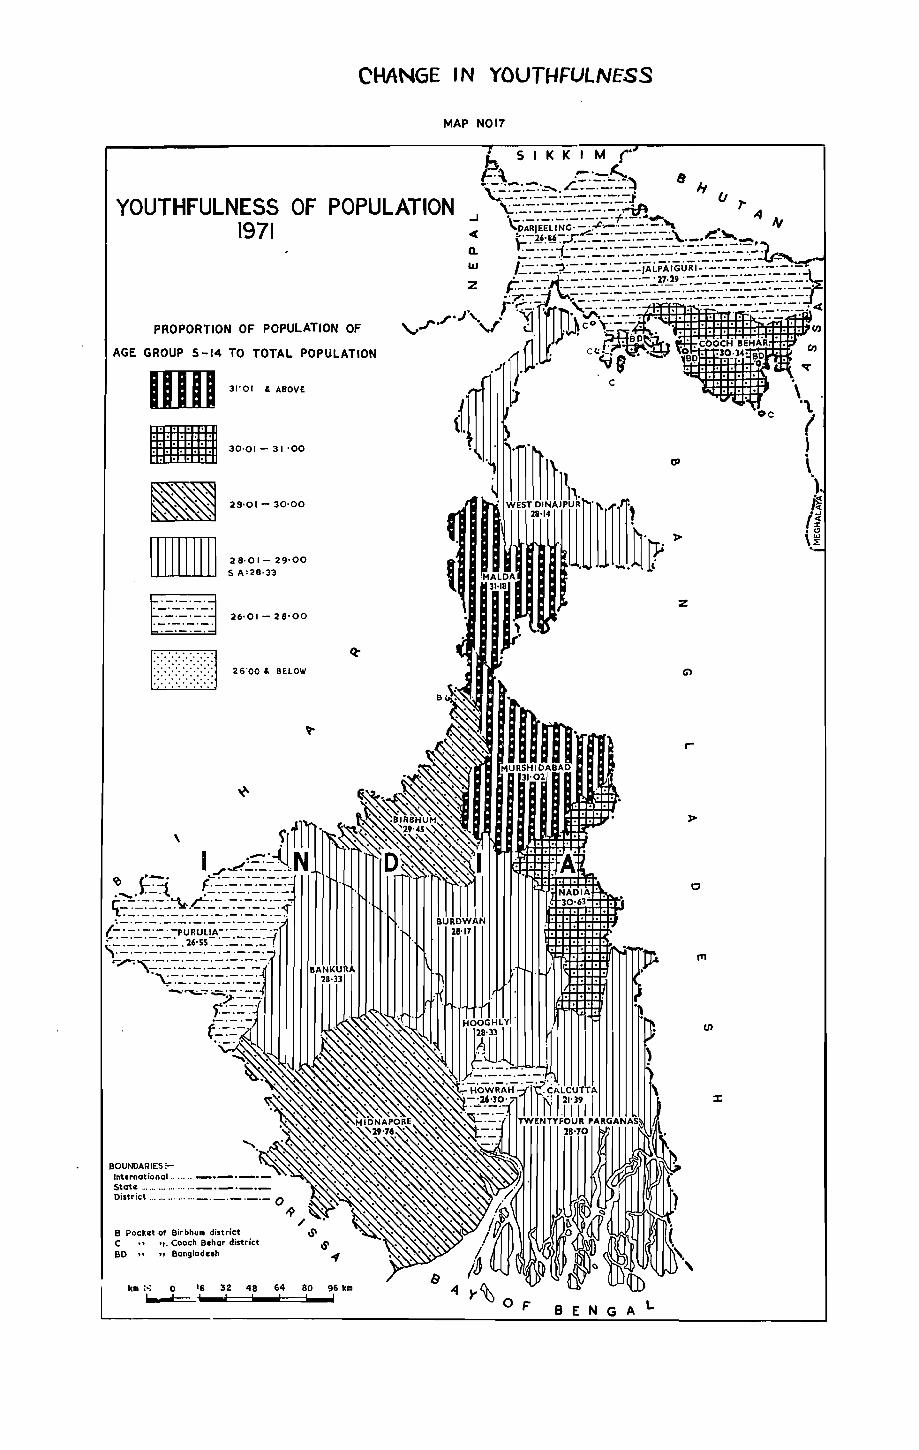
Youthfulness of population expressed as the percentage of population in the young age group 5-14 to total population is an important index of the demographic situation obtaining in a country. The map J;'epresents the .proportions at the district level for all areas and both sexes in West Bengal. Various grades of hatching from lower shades to deeper according to low to higher percentages have been used in the map as shown in the legend.
Calcutta, the nerve-centre of all economic activity of the state, has a high proportion of people in the working age-group 15-59 and consequently has the lowest percentage (21.39) of th~ young to total popUlation. Howrah, the adjacent district which located in the case of the Calcutta metropolitan area, comes second with a somewhat higher percentage of 26.30. In MaIda the proportion reaches the highest at 31.18%. Murshidabad (31.02), Nadia (30.63) and Cooch Behar (30.34) are other districts with high proportions of the young popUlation. The high percentages (for youthfulness) in the districts are indicative of high fertility and rapid growth of population as against the "aged" type of population in the advanced countries of the West.
The districts of the state are arranged below in the descending order of the percentage figures.
State/District
WEST BENGAL.
MaIda.
Murshidabad.
Nadia.
Cooch Behar
Midnapore .
Birbhum
Twentyfour Parganas •
Hooghly
Percentage of population
in the young age ~roup 5-14)
to total Population
28.33
31.18
31.02
30.63
30.34
29.76
29.45
28.70
28.33
Percentage of population
State/District in the young age
group (5-14)
to total Population
Bankura 28.33
Burdwan 28.17
West Dinajpur 28.14
Jalpaiguri . 27.29
Darjeeling . 26.86
Purulia 26.55
Howrah 26.30
Calcutta 21.39
MAP NOl7
YOUTHFULNESS OF POPULATION 1971
PROPORTION OF POPULATION OF
AGE GROUP 5 -14 TO TOTAL POPULATION
urn III · .
· .
. · .
• ,
, ,
,
~ l2d
\
3"0' "ABOVE
30'01 - 31 '00
29'01 - 30·00
2 8,0' - 29·00 5 A:2B,33
26,01 - 28'00
26'00 & BELOW
S Pocket oi Sir bhum district C " ", Cooch Bchar district SO " "Bongladesh
km 16 0 16 32 48 64 80
z
r
o

18
The two maps which show the proportions of young boys and girls of agegroup 5-14 to total population of each district as observed in 1961 and -in 1971 will indicate a growing youthfulness of the popuhition in all areas of the state.
. The proportions of young persons have been calculated for the two census years. The percentage values have then been grouped into six suitable intervals in the descending order of percentages. The districts have been shaded with various grades of hatching. Two maps, one for 1961 and the other for 1971 have been placed side by side to emphasize the changing pattern of youthfulness.
The average for the state has gone up from 25.89% in 1961 to 28.33% in 1971 which indicates a higher growth rate either by way of a higher natural increase or due to migration factors during the decade. This will also forewarn about the growing numbers that will join the working force in the coming years -an alarming prospect for the future.
The upward trend in the ratio is observed in all parts of the state. The movement is most pronounced in Cooch Behar, the district which recorded the highest growth of population. The fact emphasizes the content of the growth which, as is well known, was mostly due to exodus of whole families from across the borders. The district of Birbhum has also recorded a significant upward trend but for reasons which are yet to be .probed. Calcutta has remained at the same level of youthfulness as in 1961.
The percentage figures for the two census years for each district is shown below arranged in the descending order.
1971 1961
District Percentage District Percentage
WEST BENGAL 28.33 WEST BENGAL 25.89
Maida. . 31.18 Murshidabad · 28.83
Murshidabad • 31.02 Maida · 28.61
Nadia. • 30.63 Nadia. · 27.38
Cooch Behar • 30.34 Twentyfour Parganas · 26.76
Midnapore . • 29.76 Darjeeling · 26.65
Birbhum · 29.45 Midnapore . 26.33
Twentyfour Parganas • 28.70 Hoogbly · 26.27
Hooghly · 28.33 West Dinajpur 26.15
Bankura • 28.33 Bankura 26.01
Burdwan • 28.11 Birbhum 25.80 West Dinajpur • 28.14 Jalpai'guri · 25.54
Jalpaiguri • 27.29 Cooch Behar · 25.54 Darjeeling · 26.86 Burdwan · 24.81
Purulia · 26.55 Howrah · 24.80 Howrah · 26.30 Purulia 25.44 Calcutta · 21.39 Calcutta 21.25

1961
• PERCENTAGE
AREA )nl_lllllllllllm~mmf~ o 905 12'98 (IN OOOkm') 58'/31 7299 8775 ........... 87135
PERCENTAGE o 3~'24 41'13 64'54 75'39 93'12 10000
;NO:~~A;~~: 11111111111111~1111111~~~mili~~j I '0 3277 3746 ) 58~ 68'16 84'19 90'11
(IN 00 000
1971
PERCENTAGE ~OOO
, . AAEA jlll_lllllllllli~~~~~f~r o 9'05 IZ'98 (IN 000 k(1l2) 511'BI 72'99 B7'~7'B5
PERCE NTAGE
f3P~G~A~'_~~ 11111'.IIIIIIIIIIIIIIIIIIIIIIlIIIIIlOO~~~~m~~tfN o 1'41 Z'IO B'2B liN 000000) 971 WBB 1255
CHANGE IN YOUTHFULNESS
MAP NOl7
YOUTHFULNESS OF POPULATION 1971 ct
PROPORTION OF POPULATION OF
AGE GROUP 5-14 TO TOTAL POPULATION
1m] 31'01 &. ABOVE
.. 30'01-31'00
~ 29'01 - 30'00
•
2B·01-29·00 S A:28·33
~ ".0' - ,..aO
· 26'00 &. BELOW . · . ·
,
km:'; 0 16 32 4B b'
BANKUI\A 28·33
HALDA
3101),
to
mm' MURSHIDABAD 31'02
• • 0
'oc
z
o

OF POPULATION
YOUTHFULNESS OF POPULATION 1961
PROPORTION OF POPULATION OF AGE GROUP 5-14 TO TOTAL POPULATION
lIllIJ ,S'" • 'SOV,
III . · .
• . . . 27'01-28'00
"26'01- 27·00
•
25'01-26'00 SA 25·89
· · · · · ·
24'00 .. BELOW
km 16 0 16 32 48 64 80 96 km
,961"1971
rtf HURSHIDABAO
28:83
.,..

, 19
As in case of the country as a whole, the age-structure in West Bengal has been characterised by a predominance of the young through the decades. On the other hand, the proportion of the working age-group 15-59 in the total population has dec1ined steadily since 1941. The proportion has come down to the all-time low of 51.8% in 1971. It was 54.1 % in 1961. The decline is a natural corollary of the steady rise in the birth rate from decade to decade. Migration is also an important factor bearing upon the phenomenon in case of West Bengal.
Among males, too, the same downward trend is observed as in the total population. In 1961 the proportion"'of males in the working age-group was 56.13 ; it has slided down to 53.66 % in 1971 for the state as a whole. Variations in the districts have also been quite sharp. Areas which have attracted inmigration of the working males have higher proportions. In Ca1cutta, the only metropolis in eastern India and the largest single employer among the districts, the percentage is the highest (67.77), Howrah (58.03), Jalpaiguri (56.31) and Darjeeling (56.03), all of which have sizeable number of in-migrants among the labour force in their industries and plantations have also recorded high percentages. So have Burdwan (54.03), 24/ Parganas (53.47) and Hooghly (53.21). Purulia is another district with a high proportion of 53.47 % of males in the working age. Purulia is not known to have attracted in-migration but the proportion is high in the district. A persistent low growth rate and the consequent reduction in the proportion of the child popUlation may have brought about the situation.
The map shows the proportions of the working males by districts. The circles on each district in the map is proportionate to the size of the male population. The shaded portion of each circle represents the percentage of the males in the age group 15-59. In addition the districts have also been hatched according to the percentages.
PERCENTAGE
W~ ilfllJ": ].IIIIIIIIII.IIIIlIIIII.IIIIIIIII11MI11I11I1]1
6sliB-J
87'65 (IN 000 Km&)
PERCENTAGE
! t °11111006!81~212'717111111111'601'6~8 ~~~~i[i[~ _&LE"~'tlON 100'00
-IN WORkiNG AGEl
JS--5~.
o _ ~ 000 goo __J ;2'57

MALES IN WORKING AGE
1971
PERCENTAGE OF MALE POPULATION IN WORKING AGE-GROUP (5-59 TO
TOTAL MALE POPULATION
111m ~ 11111111.
UIIIID F=:====1 ~
59·01 &. ABOVE
56·01-59·00
53·01-56'00
SA: 53·66
50,01- 53'00
50·00 &. BELOW
,_ ,.s' BOUNDARIES ;International.
r:- -_ -.-.-.-~---; State ....... .
District .. ' ... .
B Pock~t at Birbhum district C .. Cooch a.har district 80 " " Bangladesh
o . . -'9 \;..('
/ -S s
16 0 16 32 48 64 80 95 km ! ! ~ . ,d ~e 4 Ie _ ,
-<I
MAP NO 19
15-59 ...J
« a.. UJ
z
S I «
»
z
IJ Iy (j .,.
\.\ r . )
TOTAL MALE POPULATION 1971
- - 4500000 - - 4000000
- - 3000000
-2000000
- 1000000
- - 500000
Mal. Population 1M Working AQe·group
15-59 1971
FIGURES AT THE TOP OF THE CIRCLES INDICAT E THE TOTAL
MALE POPULATION 1971
1924505
CALCUTTA

20 The proportion of females in the working age-group 15-59 to the total
female population was 49.41 % for West Bengal as a whole in 1971. The figure is appreciably lower than among males. Higher incidence of mortality among women of the young reproductive age is the main reason for the lower proportion. The fact that the biological superiority and natural resilience of females to mortality is observed only in the advanced ages makes for a higher proportion of females in the age group 60+ which consequently pulls down the proportion in the working age group.
The percentage of females in the age group 15-59 varies widely from district to district. In Calcutta it is 58.68 due mainly, to the opportunities for employment and higher education etc. provided by the metropolis. It is high also in° Purulia (53.73), Darjeeling (53.21), Howrah (50.19), 24 Parganas (50.11) and Burdwan (49.76). The proportion is low in the districts of North Bengal and also in western Bengal which are almost entirely agricultural and the least urbanised. The lowest proportion is to be found in Cooch Behar (42.76%).
As in the preceding map, the districts have been hatched in this map also according to the percentages of the females in the working age. Circles have been placed on the districts, drawn proportionate to total female population of the districts and areas covered by female population of the working age have been shaded in each circle. The absolute female population figures are also written at the top of the circles.
PERCENTAGE
.R" [ ·.1111111111111111111111111111111111111111 1111111111111111111 ~:j ;
°
12
10°75 1[1 9615 ~ooo
°10 9°Q4 8447 8785 (IN 000 Km")
PERCENTAGE
o 6°97 12°96 14.43 97°2010000
~~:~~:~~nON l111111l1111111111111111111111111111111111111111111111111111~lo o an ·1"34 • 168 10 210"31
(JIll 000 OOQ.)

FEMALES AGE
IN WORKING 15-59
1971
PERCENTAGE OF FEMALE POPULATION IN WORKING AGE-GROUP IS-59 TO
TOTAL FEMALE POPUl.ATION
-~
-DIlJ]] r-====l ~
,
54-0 I & ABOVE
51-01 - 54-00
SA: 49-41 48-01-51-00
45·01 - 48-00
45-00 & BELOW
BOUNDARIES ;-International .. '" . _._._._ State District ... .,_ ... " . .,._. ______ _
B Pock~t Of Sir bhum district C " Coach Behar district BD " " Bangladesh
..s'
lcm 16 0 16 32 48 64 80 96 km
""I
MAP NO 20
z
r
o F BEN
TOTAL FEMALE POPULATION "1S17'
3500000
A L
2500000
- 1500000
- 1000000
- 500000
- 250000
IN \IIORKJNG AGf .. GROlIP IS-59 1Q71
1224241
CALCUTTA
FIGURES AT THE TOP OF THE CIRCLES INDICATE THI;: TOTAL FEMALE POPULATION 1971

21
The map depicts the percentages of urban male population in working age 15-59 to total male population in urban areas in the state at the district level.
The proportion of males of the working age to the total male population in the state as a whole was, as already observed, 53.66 %. The proportion in the urban areas 'is much higher due mainly to the job opportunities offereg by the towns and cities and the fact that it is the males who come there in larger numbers. The percentage for the state as a whole is 63.03; but it varies wid,ely from district to district. The variation obviously is dependent on the degree of urbanisation and the functional characteristics of the urban areas in the districts. The districts in the Calcutta industrial belt have natuarlly the highest percentages of working age males in the total male popUlation. Calcutta tops the list with an impressive figure of, 69.77% and is followed by Howrah (64.57%), Hooghly (62.77%) and 24 Parganas (60.67%). In Darjeeling (60.29%) and Burdwan (60.06 %) aIm t.he proportions are fairly high. In case of Burdwan it is the miningindustrial belt which has pushed up the percentage. In Darjeeling the high proportion is largely due to the predominance which the newly emerging urban centre of Siliguri commands in the urban scene in th~ district.
In the remaining districts of the stelte which are all in the predominantly agricultural regions of northern and Western Bengal the proportions vary between 57.81 % (Jalpaiguri) and 53.89% (West DinajpurJ. In all these districts the urban centres are mostly of the residential type with only some commercial activity in some of them. Industrialisation is yet to make any headway an~here precluding any possibility of a large scale rural-to-urban sex-selective migration. It is, therefore, natural that the percentages of males of the working age group in the total male popUlation in the urban areas in these districts should be low.
The proportions for the 16 districts are shown below:
State/District
WEST BENGAL
Calcutta Howrah Hooghly Twent yfour Parganas Darjeeling Burdwan Jalpaiguri Cooch Behar Midnapore . Purulia Birbhum Nadia MaIda. Bankura Murshidabad West Dinajpur
AREA
0
URBAN MALE POPULATION
IN WORKING AGE 15-59
o
"
PERCENTAGE
19'25' &2'21
(IN 00 ~m2) 12'13
PERCEWTAGE
43'76 50'47
17'27 19'92
(IN 00 000)
Percentage of urban male population of the working age (15.59) in total Urban males
63.03
69.17 64.54 62.17 60.67 60.29 60.06 57.81 57.27 56.38 55.88 55.77 55.46 55.00 54.61 53.92 53.89
85'08
33'58
100'00

URBAN MALES IN WORKING AGE 15-59
1971
PERCENTAGE OF MALE POPULATION IN WORKING AGE-GROUP 15-59
IN URBAN AREAS
64'01 & ABOVE
SA:63,03
61'01 - 64'00
58'01- 61'00
55'01 - 58'00
55'00 &. BELOW
\
km 16 0 16 32 48 64 BO 96 km
MAP N021
.J
~
Q.
&LI
Z
F B E N G
lJ Iy lJ .,.
~
~\ .\
A 1924505
CALCUTTA
TOTAL URBAN
( I ( \ .-
-2000000
-1000000
- 500 000
-200000
FIGURES AT THE TOP OF THE CIRCLES INDICATE TOTAL
URBAN MALE POPULATION
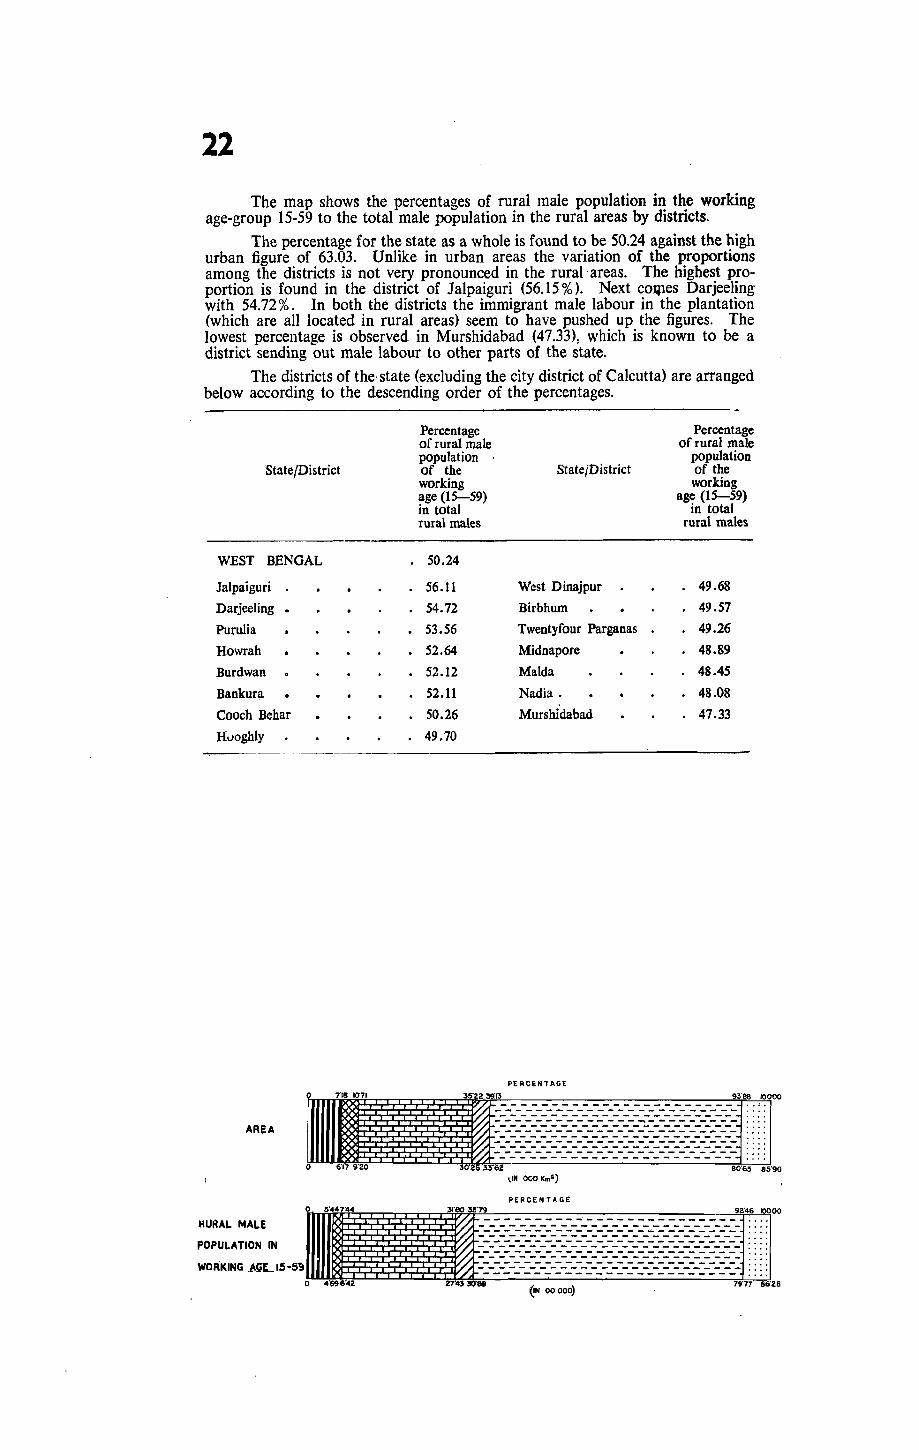
22
The map shows the percentages of rural male population in the working age-group 15-59 to the total male population in the rural areas by districts.
The percentage for the state as a whole is found to be 50.24 against the high urban figure of 63.03. Unlike in urban areas the variation of the proportions among the districts is not very pronounced in the rural, areas. The highest proportion is found in the district of J alpaiguri (56.15 % ). Next COij1es Darjeeling with 54.72 % . In both the districts the immigrant male labour in the plantation (which are all located in rural areas) seem to have pushed up the figures. The lowest percentage is observed in Murshidabad (47.33), which is known to be a district sending out male labour to other parts of the state.
The districts of the· state (excluding the city district of Calcutta) are arranged below according to the descending order of the percentages.
State/District
WEST BENGAL
Jalpaiguri
Darjeeling •
Purulia
Howrah
Burdwan
Bankura •
Cooch Behar
Huoghly
AREA
7'18 10"71
o 6'179'20
· ·
· · ·
Percentage Percentage of rural male of rural male population
State/District population
of the of the working working age (15-59) age (15-59) in total in total rural males rural males
50.24
56.11 West Dinajpur 49.68
54.72 Birbhum · 49.57
53.56 Twentyfour Parganas · 49.26
52.64 Midnapore · 48.89
52.12 MaIda 48.45
52.11 Nadia. · 48.08
50.26 Murshidabad 47.33
49.70
PERCENTAGE
35"22 11"13 93'88 100"00
~t:====::::-::::::::::::::::::::::::::::::::::::::-::::-::::::::: : ~: "0 :--------------------------------------------- : :: ~ ::::::::::::::::::::::::-5-::::::~:::::::-_:::::::::::::::::_~:::::::::::-- : ~:
-------- ~------------- ... 30': ~6 33'62 80'65 85'90
\IN 000 Km')
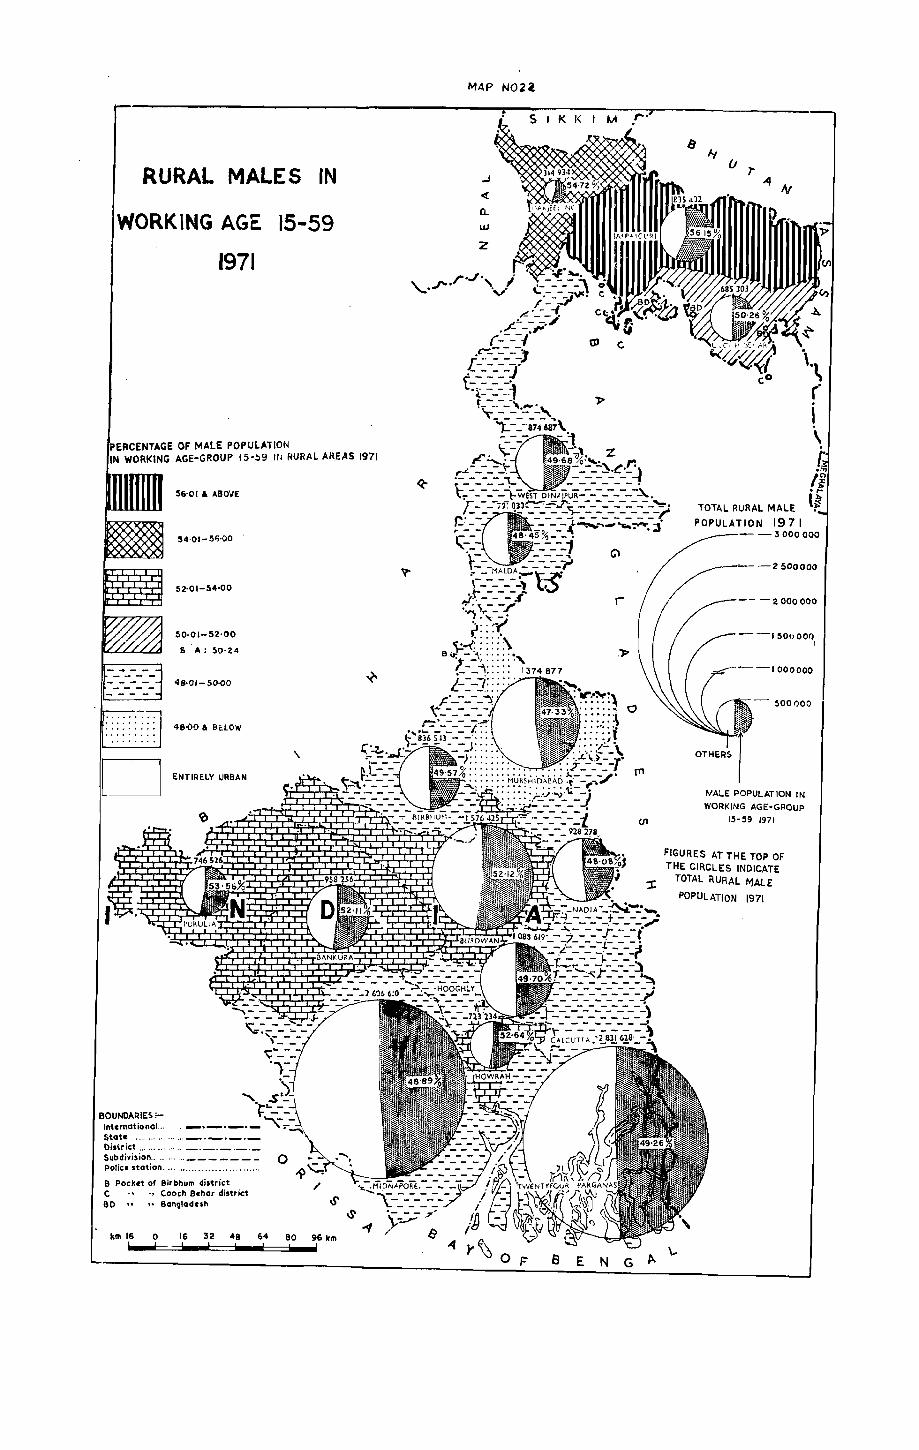
RURAL MALES IN
WORKING AGE 15-59
1971
ERCENTAGE OF MALE POPULATION WORKING AGE-GROUP 15-09 ItJ RURAL AREAS 1971
BOUNDARIES ;International. ..
56'01 6. ABOVE
54'01- 51;'00 .
52'01-54'00
50·01-52·00
SA: 50·24
4Q·OI-SOo()O
46·00" BElOW
ENTIRELY URBAN
State ................ _._._._ District .............. _._._._._ Subdiyision .......... ______ _
police station. " ........................ .
B Pocket of 6irbhum district C .. Cooch eehar district 80 " to Bangladesh
km 16 0 16 32 48 64
\
o
80
MAP N02i
..J
~
0-w
z
s E N G
lJ
TOTAL RURAL MALE
POPULATION 1971 - -3000000
----2500000
-- -2000000
--150()OOq I
'·--1000000
MALE POPULATION IN
WORKING AGE-GROUp
U1 IS-59 1971
FIGURES AT THE TOP OF THE CIRCLES INDICATE
:I: TOTAL RURAL MALE
POPULATION 1971

23
The percentages of urban females of age group 15-59 to total urban female population by district is shown in the map. The manner of presentation is the same as in the earlier maps 19 to 22.
The average percentage of female population in the urban areas (54.89) is much below the percentage among the males (63.03). The dominance of the males in the socio-economic structure of the state is too obvious a factor to be emphasized in this connection. The percentages among females again vary from district to district; but the variation is not as marked as in case of males.
With its opportunities for employment, higher education etc., the metropolitan city district of Calcutta naturally claims the highest percentage of females of the working age-group. The figure for the city district (58.68 %) does not, however, rise far above the state average. As in case of the urban males the proportions for the females, too, are fairly high in the districts of the Calcutta metropolitan area, namely, Hooghly (55.41), Howrah (54.86) and 24 Parganas (54.46). For Darjeeling also the proportion is high (54.54) due mainly to the relatively higher proportion of female workers in the urban areas of the district, especially in the hill subdivisions. The lowest percentage is observed in West. Dinajpur (48.71). It is low also in the other agricultural and predominantly rural districts like Maida (50.99), Murshidabad (51.02), Jalpaiguri (50.64). and Cooch Behar (51.55).
PERCENTAGE
AREA 11111111111111111111111111111'''111111111 [Ii'r o ro4 900 15l!O t 950
URBAN FEMALE POPULATION 1N WORKING
AGE 15- 59
o
.. (INOO km2) 1895
PERCENTAGE
TI8
URBAN FEMALi:: POPULATION (IN 00000 J
73·25
18·92
69·07
t 25"82 25·43
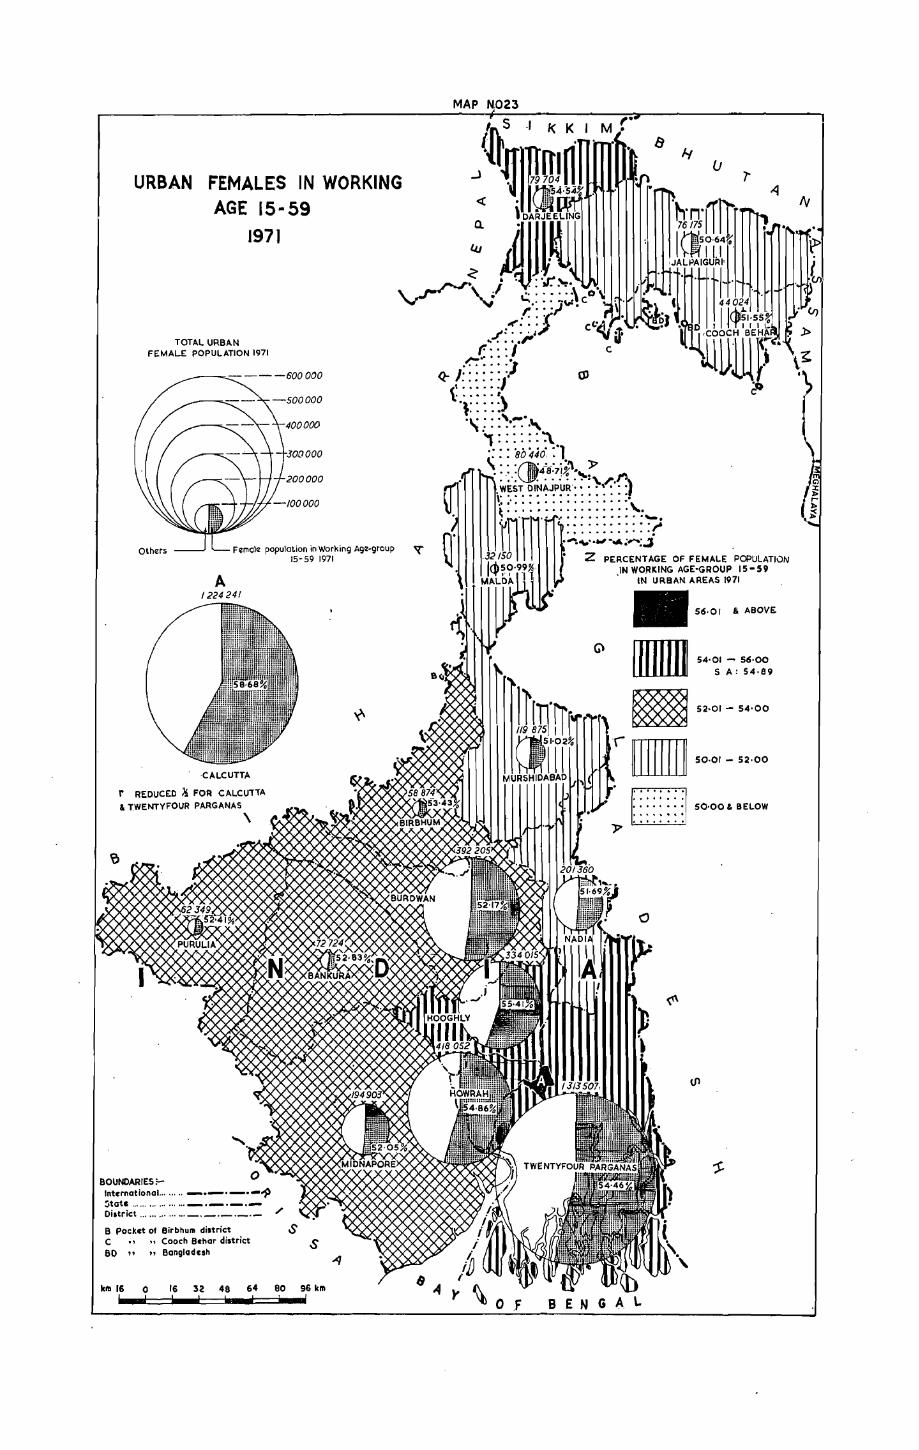
URBAN FEMALES IN WORKING AGE 15 .. 59
1971
TOTAL URBAN FEMAL.E POPULATION 1971
-500000
400000
300000
200000
Fernol~ population in Working A9~'9roup 15-59 1971
A 1224241
·CALCUTTA
r REDUCED}i FOR CALCUTTA & TWENTYFOUR PARGANAS
\
BOUNOARIE5l-International ........ _.-._._..p ~tat ......... , , ..... ... _"_--,-District .. , ... ,., ., .... _._._._._ '"
B pocket Of Birbhum district C " Cooch Behar district 80 " " Bangladesh
s
km 16 0 16 32 48 64 eo 96 km
MAP
J
« a.
lJ.J
., fJ
I-t
UIIIill m '. EJ · · · J:> ....... .
O.F BENG.4.\.
u .,. -4
54'01 - 56·00 5 A: 54·89
52·01 - 54'00
50·01 - 52·00
50·00 & BELOW
tv
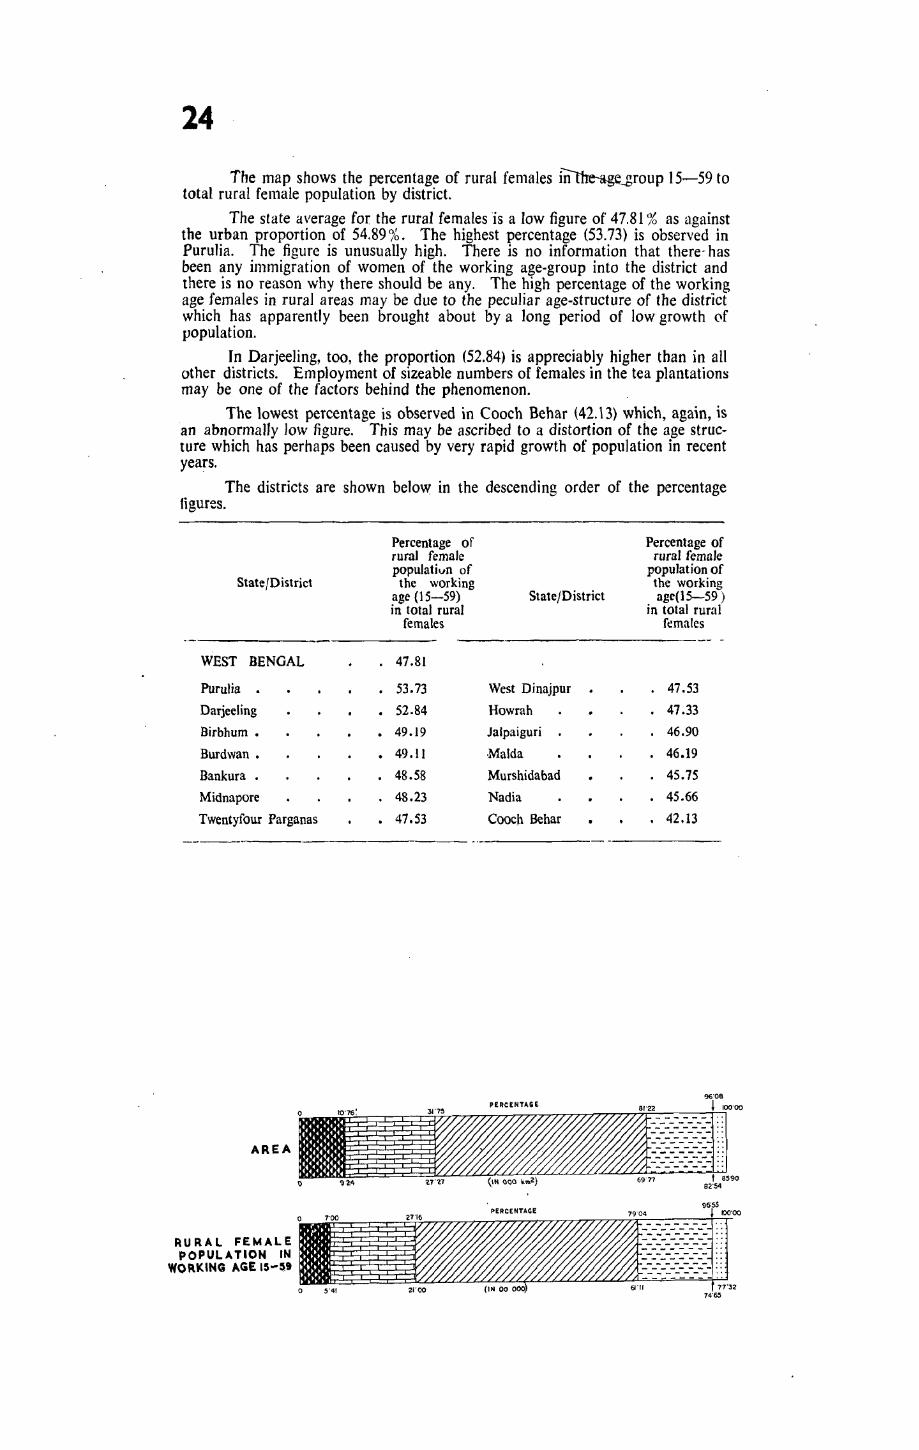
24
The map shows the percentage of rural females ~__group 15-59 to total rural female population by district.
The state average for the rural females is a low figure of 47.81 % as against the urban proportion of 54.89%. The highest percentage (53.73) is observed in Purulia. The figure is unusually high. There is no information that there- has been any immigration of women of the working age-group into the district and there is no reason why there should be any. The high percentage of the working age females in rural areas may be due to the peculiar age-structure of the district which has apparently been brought about by a long period of low growth of population.
In Darjeeling, too, the proportion (52.84) is appreciably higher than in all other districts. Employment of sizeable numbers of females in the tea plantations may be one of the factors behind the phenomenon.
The lowest percentage is observed in Coach Behar (42.13) which, again, is an abnormally low figure. This may be ascribed to a distortion of the age structure which has perhaps been caused by very rapid growth of population in recent years.
The districts are shown below in the descending order of the percentage figures.
State [District
WEST BENGAL
Purulia •
Darjeeling
Birbhum •
Burdwan.
Bankura .
Midnapore
Twentyfour Parganas
· · · · · ·
·
Percentage of rural female populativn of the working
age (15-59) in total rural
females
47.81
53.73 52.84
49.19
49.11
48.58
48.23
47.53
------,--------------
Percentage of rural female
population of
State/District the working age(lS-S9 )
in total rural females
West Dinajpur · 47.53
Howrah · 47.33
Jalpaiguri · 46.90
Maida · 46.19
Murshidabad · 45.75
Nadia · 45.66
Coach Behar · 42.13
%'06
,PERCENTAGE 81'22 ~ 100'00
AREA If!:!: i!!! f_~~~iU~~~lll ~ ';l~4 'll"ll (III ()()O ~ .. Z) 6971 I 8590 v . 92'54
. 96'55
w~u~~t·;~MC~~ IIi l iii: i r_~~~~~~=~~~!r o 5'41 21'00 (IN 00 000 61'" 74.,},7'32

RURAL FEMALES IN WORKING AGE 15-59
1971
TOTAL RURAL FE.MALE POPULATION 1971
_---==--- . -- J 000 000
500000
lE POPULATION IN WORKING AGE-GROUP
15-,59 1971
t' FIGURES AT THE TOP OF THE CIRCLES INDICATE TOTAL RURAL FEMALE POPULATION I!HI
\
I
o BOUNDARIES:- -9 InternationaL, ". " _._._.- / State " .. " , ..... " .... _._._._ District ", ..... ' ," , .. _._._._._ oS
0$' '1
B Pocket of Birbhum district C " .. Coach Behar district BD " "Bangladesh
km 16 0 16 32 48 64 80 96 km
MAP
_, « IL I.&J
:z
N024
S
IJ ,.., lJ .,.
-4 tv
Wb~ PERCENTAGE OF W&4FEMALE POPULATION ", IN WORKING AGE-GROUP
15-59 IN RURAL AREAS 1971
-r 50'51 & ABOVE'
> m 48'51 - 50'50
o Wl1 D illITJ]
:to
BENGA\..
46' 51 - 48'50 SA: 47·BI
44'51 - 46'50
44'50 & BEL.OW
ENTIREty URBAN

2S
24.75 % of the population of the state live in the urban areas. The proportions of the urban to total population vary sharply from district to district. Apart from CaJcutta, which is entirely urban. Howrah has the highest percentage of the urban population (41.93) among the districts. The degree of urbanisation is high also in the two other districts of the Calcutta metropolitan area, namely, 24 Parganas (35.15) and Hooghly (26.47). In fact, Calcutta and the three neighbouring districts together account for as much as 71.97% of the total urban population of the state. Burdwan is another district with a high proportion (22.78 %) of urban population.
MaIda in northern Bengal is the least urbanised of all districts with only 3.22 % of the population in the urban areas. In Jalpaiguri (9.60), Cooch Behar (6.83), West Dinajpur (9.34), Murshidabad (8.45), Birbhum (7.03), Bankura (7.47), Midnapur (7.63) and Purulia (8.26) the percentages of the urban population are below 10.
If urbanisation is uneven in the districts there is wide variation in the proportions of urban population from police station to police station within the districts. Out of 290 police stations (excluding those of Calcutta and Howrah cities) in the state 10 are entirely urban, 124 are partly urban and 156 entirely rural. In 12 of the police stations (4 in Cooch Behar and 1 each in West Dinajpur, Murshidabad, Nadia, 24 Parganas and Howrah and 3 in Midnapur) the proportions of urban population are below 5 % each. Besides Purulia town and Kharagpur town most of the police stations which are entirely or nearly entirely urban are located in the Calcutta and Asansol-Durgapur industrial belts. In· the other districts the police stations in which the district and subdivisional towns are located usually have high proportion of the urban in the total popUlation, for the centres of district or subdivisional administration are often large urban centres too.
The map presents the proportions of the urban to total population in the state at the police station level. The entirely urban police stations have been hatched complete dark, the rural police stations are left blank without any hatching and those which are partly urban have been classified into six ranges according to the proportion of the urban popUlation and hatched in different patterns.
PERCENTAGE
AREA

A : ....
.....
kill 10 5 o
MAP N02S
..J
~
Q.
III
B
ENTIRELY URBAN
50'00- 99·99
35,00- 49·99
25'00-34·99
15·00-24·99 SA 24'75
5'00-14·99
BELOW 5·00
ENTIRELY RURAL
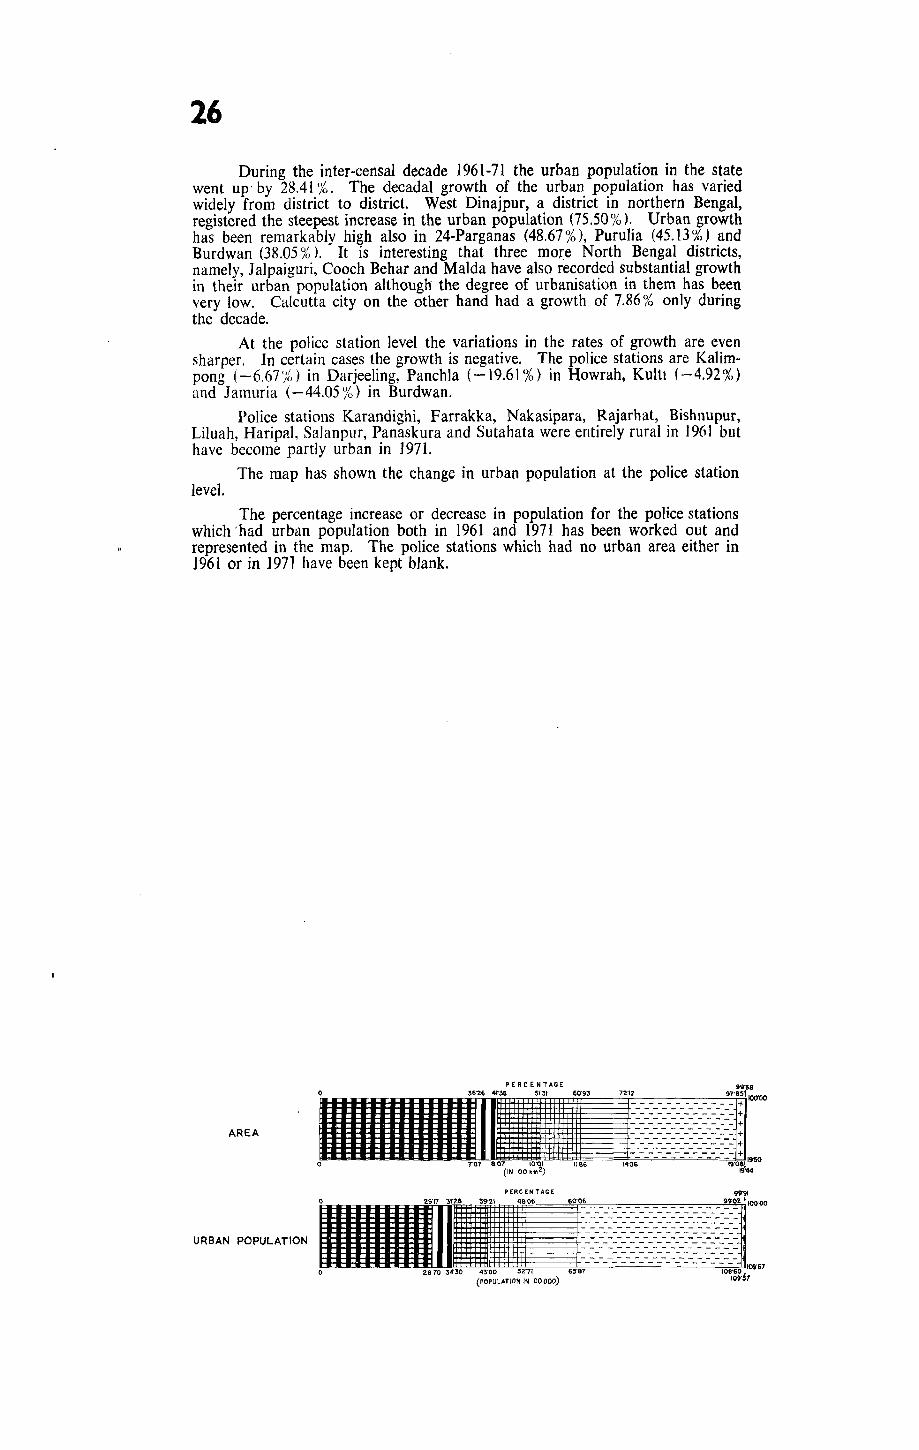
26
During the inter-censal decade 1961-71 the urban population in the state went up' by 28.41 %. The decadal growth of the urban population has varied widely from district to district. West Dinajpur, a district in northern Bengal, registered the steepest increase in the urban population (75.50%). Urban growth has been remarkably high also in 24·Parganas (48.67 %), Purulia (45.13'j{,) and Burdwan (38.05 % ). It is interesting that three more North Bengal districts, namely, Jalpaiguri, Coach Behar and MaIda have also recorded substantial growth in their urban population although the degree of urbanisation in them has been very low. Calcutta city on the other hand had a growth of 7.86 % only during the decade.
At the police station level the variations in the rates of growth are even sharper. In certain cases the growth is negative. The police stations are Kalimpong (-6.67'}{,) in Darjeeling, Panchla (-19.61 %) in Howrah, Kultt (-4.92%) and J amuria (- 44.05 %) in Burdwan.
Police stations Karandighi, Farrakka, Nakasipara, Rajarhat, Bishnupur, Liluah, Haripal, Salanpur, Panaskura and Sutahata were entirely rural in 1961 but have become partly urban in 1971.
The map has shown the change in urban population at the police station level.
The percentage increase or decrease in population for the police stations which 'had urban population both in 1961 and 1971 has been worked out and represented in the map. The police stations which had no urban area either in 1961 or in 1971 have been kept blank.
AREA
PERCENTAGE 99'68
1IIIIIIIIIIIm~~lilllljllllllllrl(ff~:~~;i~r o 7'07 8'07 10'01 II"S6 14"06 19'081
19"50
(IN 00 km 2) 19"44
PERC EN TAGE 911'91
1111111111 n 1I1111 ~~ T : ___ ~~ ):_:~~;_:~~::~:}ir~ o 28"10 34"30 43"00 52'71 65'87 108'60 ! 10967
(POPULATION IN 00000) 109'57
URBAN POPULATION

MAP N026
CHANGE IN URBAN POPULATION 1961-71
A
m
20'00 AND ABOVE
BELOW 20'00
ENTIRELY RURAL
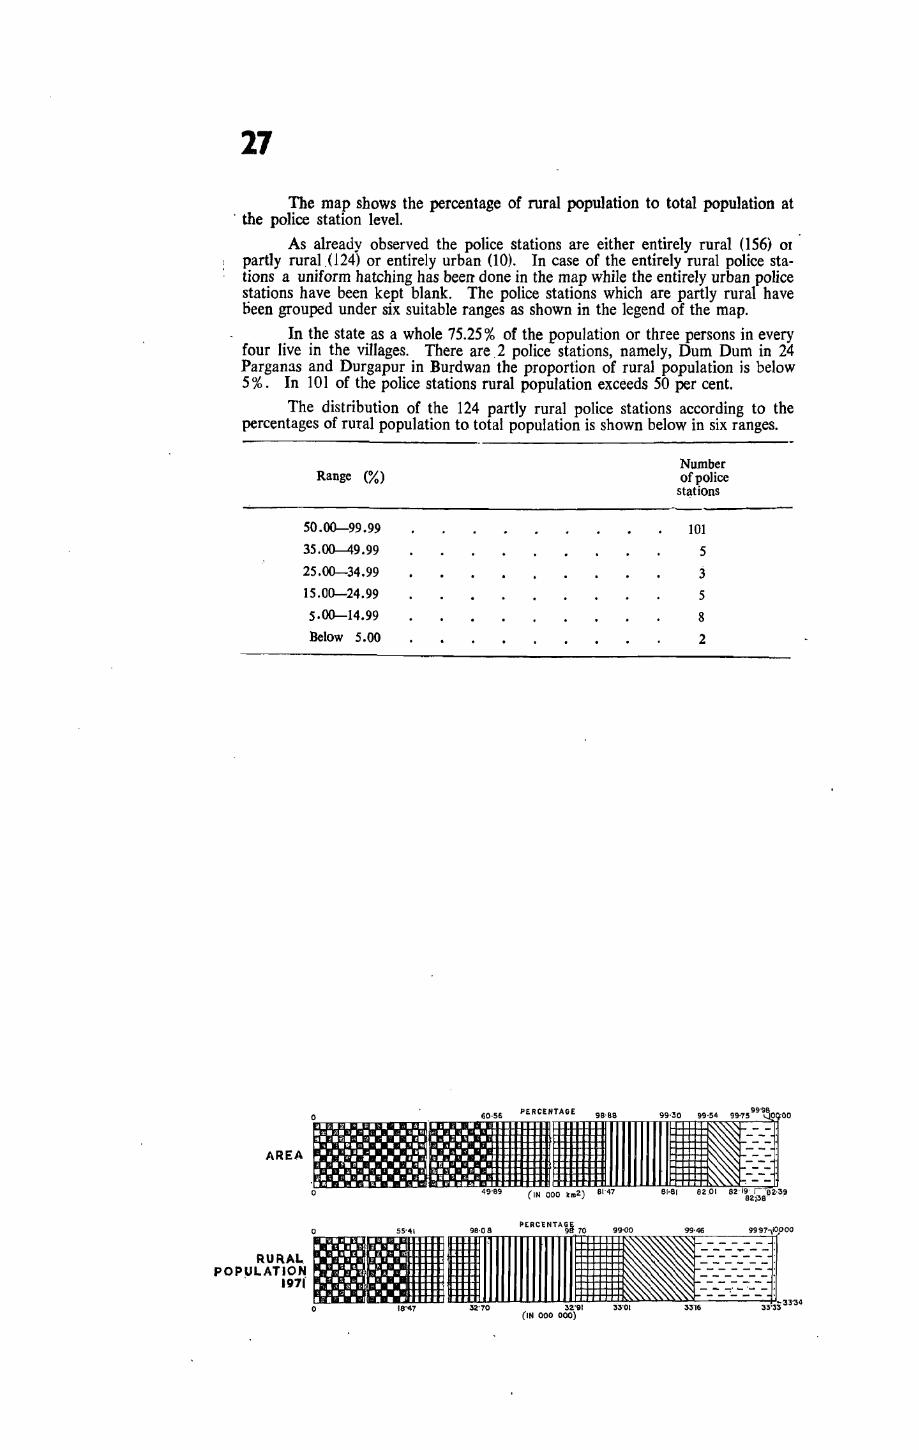
27
The map shows the percentage of rural population to total population at , the police station level.
As already observed the police stations are either entirely rural (156) ot partly rural.(l24) or entirely urban (10). In case of the entirely rural police stations a uniform hatching has been done in the map while the entirely urban police stations have been kept blank. The police stations which are partly rural have oeen grouped under six suitable ranges as shown in the legend of the map.
In the state as a whole 75.25 % of the population or three persons in every four live in the villages. There are 2 police stations, namely, Dum Dum in 24 Parganas and Durgapur in Burdwan the proportion of rural population is below 5 % . In 101 of the police stations rural population exceeds 50 per cent.
The distribution of the 124 partly rural police stations according to the percentages of rural population to total population is shown below in six ranges.
Number Range (%) of police
stations
50.00-99.99 101
35.00-49.99 5
25.00-34.99 3
15.00-24.99 5
5.00-14.99 8
Below 5.00 2
0 60,56 PERCENTAGE 9B'QB 99,30 99,54 99'75 99'~0 '00
.~ 1---
~ 1---
AREA I- - -'
~ I-_-_- : f-:--
0 49'89 (IN 000 km2) 81'47 61,81 8291 82' ~2~e~2'39
POPY~:Ti~~ "llllllliij'liIiiilrllllr.~~-=~~~~~~[. o 18'<17 32'70 32'91 33'01 33'16 33'33
3J
(IN 000 000)

RURAL POPULATION 1971
.•. i_ •..••. . " r •• . ,i'.· ••
CALCUTTA AND NEIGHBOURHOOD
kmlO 5 o 10 km
\
'" -
MAP N027
&s ~-.
J( J( , M r'~ •
" _t. I.
•
G)m r- . III
IIIIIIJ am ~ ~d
' ........ ' r::::::l .... : .;:. Ld .tt!~~O(ltJOoO().t1.oml=fi~lnttl4-Jo(~f:Uw!CmumU:1r:r.. (Jl' , , , , ,
' ..
ell
...
ENTIRELY RURAL
S A: 75·25
50'00 - 99'99
35'00 -49'99
25'00 - 34'99
'5'00 - 24'99
5'00 - '4'99
BELOW 5'00
ENTlREI..Y URBAN

<II Z iii' ~ ... 0 II: w III ::E :::> Z
28
The urban p.opulation of the state is concentrated in two dh:tinct regions, the Calcutta metropolitan area and the Asansol-Durgapur mining-industrial belt. As many as 96 towns of various sizes cluster on both banks of the Hooghly constituting what is known as the Calcutta metropolitan area. Calcutta urban agglomeration alone comprises 74 urban units with a population of 7.03 million. 68.20% of the total urban population are accounted for by the two areas- of high urban concentration~ Calcutta and Asansol-Durgapur belts. Another urban concentration is coming up in recent years in Siliguri and surrounding areas in North, Bengal.
As already mentioned, the degree of urbanisation is also high in the districts surrounding Calcutta and also in the district of Burdwan. 137 of the towns and cities are located in these districts.
For this map which shows the degree of urban concentration in the ~tate the percentages of urban population to total population for the police stations have been plotted and then joined by isopleths using suitable intervals as shown in the legend. Different types of hatching have been used to show each interval. The cities and towns of the state have also been shown with violet spheres of various sizes according to their population.
The isopleths drawn for the interval 50 % -75 % are found mostly in Ca1cutta and the adjoining areas. This is apparent from the inset map of Calcutta and its neighbourhood.
The urban concentration of the third interval (25 % to 50%) is spread an over the state with the major parts coming under Presidency and Burdwan divisions. The thinner range of 5 % to 15 % is found widely distributed.
The lowest concentration of below 5 % is observed only in the north eastern sides of Jalpaiguri and Cooch Behar and in some areas of southern Twentyfour Parganas. These are known to be underdeveloped areas.
1 so " 1'1 :0 0
'" z ~ Q 1'1
o~ r-l>C (/1:0 "'01
l> oz ... ..." 00 :E;g zr-"'l> ...
0 Z
~
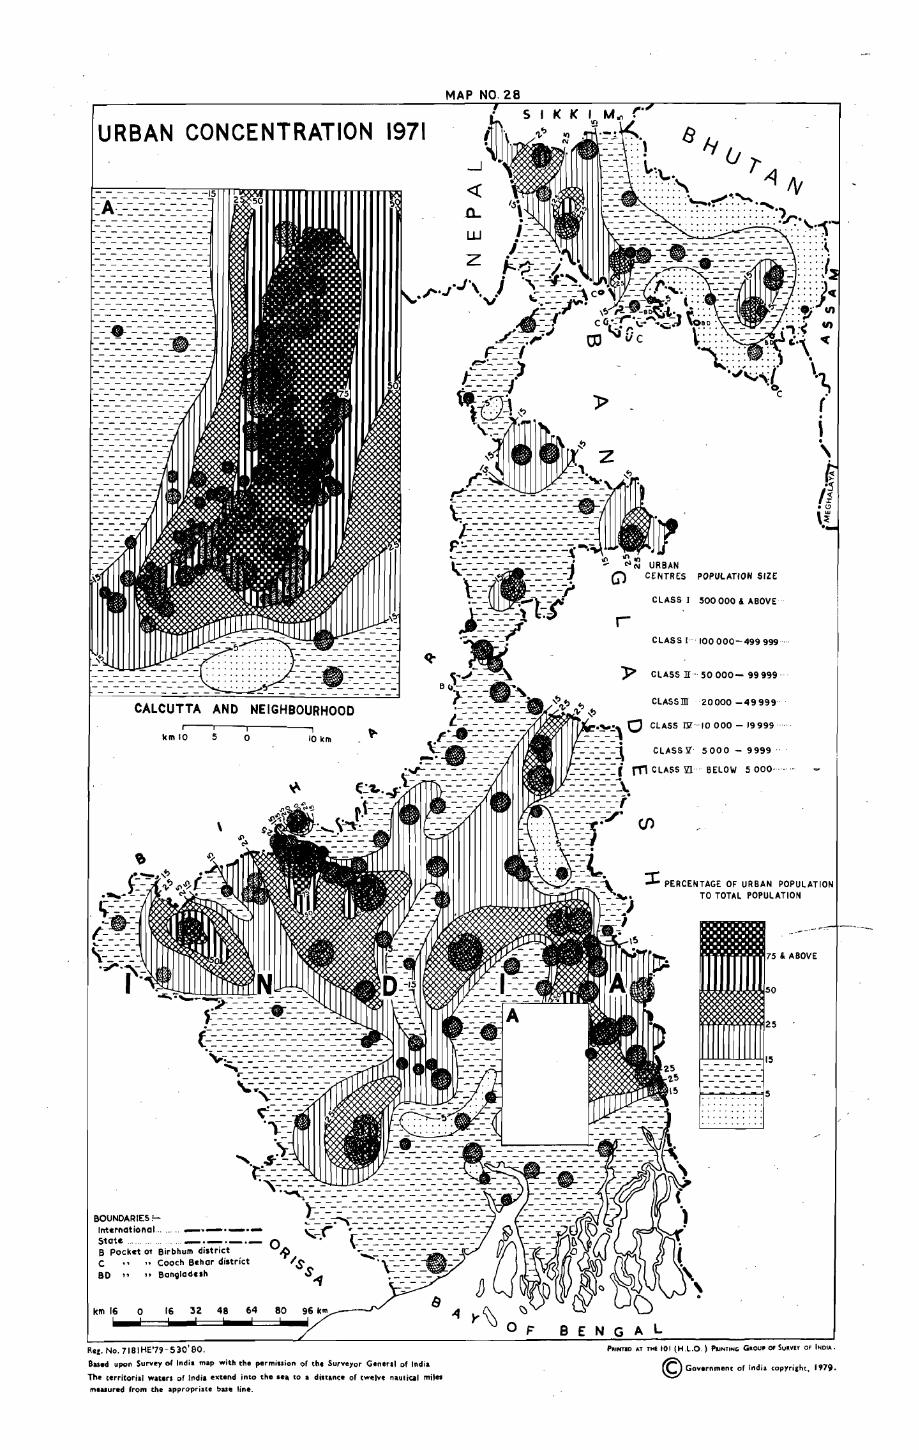
URBAN CONCENTRATION 1971
UJ
z .- - -I-------
L--~---z· ,-..,.; - -. . - -_.;:,.., .J', J ,-----y-- -. /,,".J •• ~_-_-_-_=,Co
V '!.=--.,f""' ::::.~ "'j
CALCUTTA AND NEIGHBOURHOOD
km 10 5 o 10 km
\
BOUNDARIES :-Int.rnational .. _ .. -._.-. State ............... _._._._ B pocket aT Birbhum district C " Coach Behar district BD " "Bangladesh
km 16 0 16 32 48 64 80
Re,. No. 7IBIHE'79-S30'SO.
Based upon Survey 0' India map with the permission of tht Surveyor Genera' of India
The territorial woe.rs of India extend inco the se", to a distance of twelve nautical miles mluured from the appropriate base line.
4t--f CCi·.:1""'·i:,-/- - -;.1 co ~ 0 C
.. _., en
.. "f/ ':< CI) c:,\ ~ ~ - -.,.
F"----I "eoo:.. ----)
t~-=-=-=~: t .. ------# \lP.-- • l .
~\.
8 E N
POPULATION SiZe:
500000 & ABOVE
r CLASS r·· 100000-499999 .
\" ,. . , \
J::' C LASS IT SO 000 - 99 999
CLAssrn 20000 -49999
:t PERCENTAGe: OF URBAN POPULATION TO TOTAL POPULATION
11111""" & ABOVE
~ I ---- -" _ -=-=-: -,- - - - -
.........
A L PRINTED AT THE 101 (H.l.O,) PlINTlNG GROUP or: SUII.'iEY OF INDIA.
© Government of India copyright. 1979.
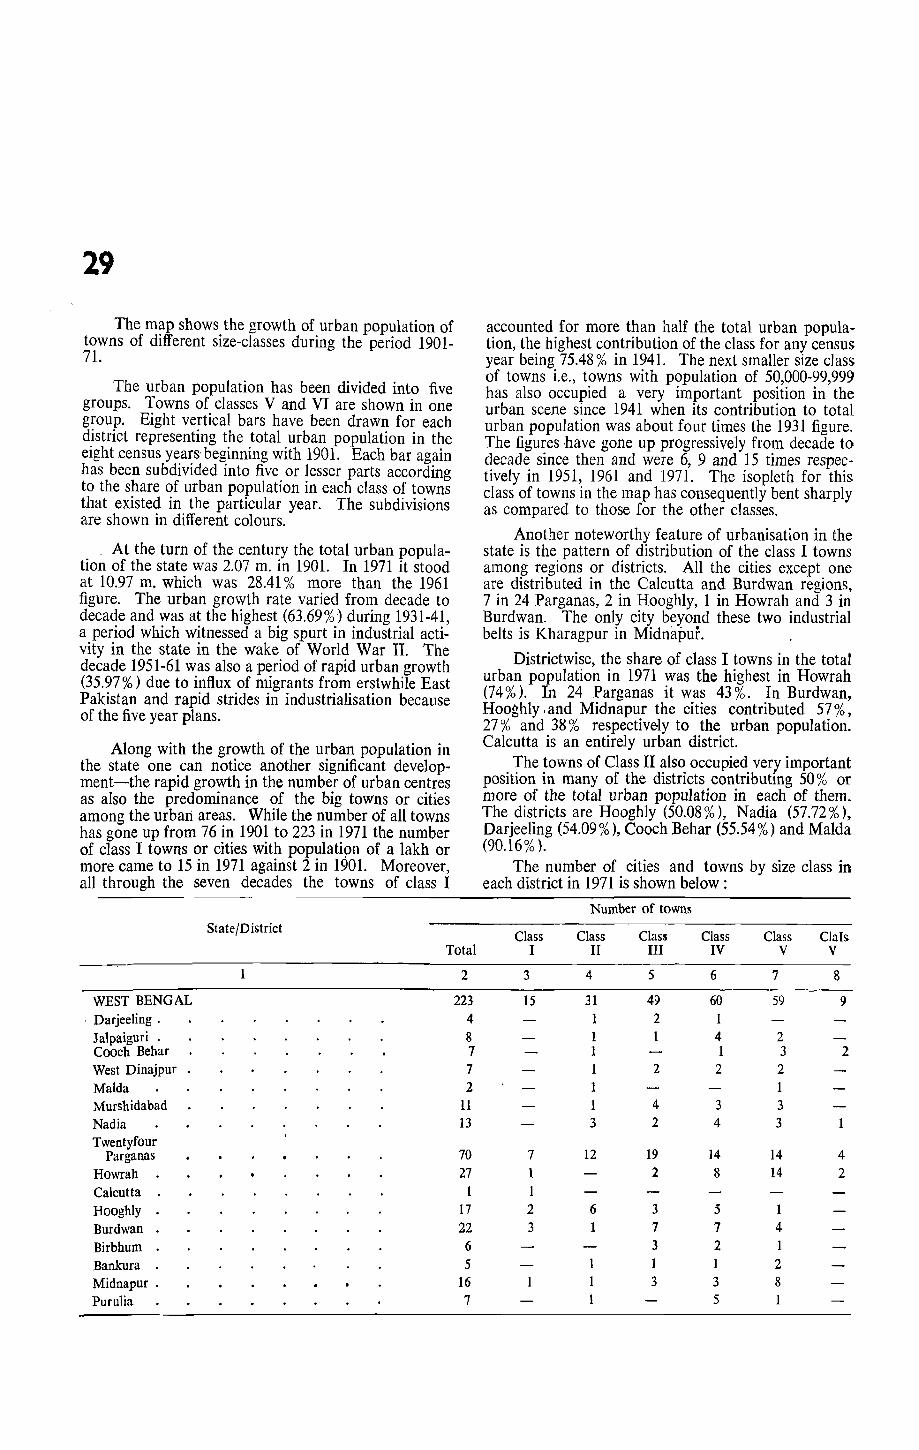
29
The map shows the growth of urban population of towns of different size-classes during the period 1901-71.
The urban population has been divided into five groups. Towns of classes V and VI are shown in one group. Eight vertical bars have been drawn for each district representing the total urban population in the eight census years' beginning with 1901. Each bar again has been subdivided into five or lesser parts according to the share of urban population in each class of towns that existed in the particular year. The subdivisions are shown in different colours.
At the turn of the century the total urban population of the state was 2.07 m. in 1901. In 1971 it stood at 10.97 m. which was 28.41 % more than the 1961 figure. The urban growth rate varied from decade to decade and was at the highest (63.69%) during 1931-41, a period which witnessed a big spurt in industrial activity in the state in the wake of World War II. The decade 1951-61 was also a period of rapid urban growth (35.97 %) due to influx of migrants from erstwhile East Pakistan and rapid strides in industrialisation because of the five year plans.
Along with the growth of the urban population in the state one can notice another significant development-the rapid growth in the number of urban centres as also the predominance of the big towns or cities among the urbari areas. While the number of all towns has gone up from 76 in 1901 to 223 in 1971 the number of class I towns or cities with populatipn of a lakh or more came to 15 in 1971 against 2 in 1901. Moreover, all through the seven decades the towns of class I
State/District
Total
1 2
WEST BENGAL 223 Darjeeling . 4 Jalpaiguri . 8 Cooch Behar 7 West Dinajpur 7 MaIda 2 Murshidabad 11 Nadia 13
Twentyfour Parganas 70
Howrah 27 Calcutta 1 Hooghly 17 Burdwan 22 Birbhum 6 Bankura 5 Midnapur . 16 Purulia 7
accounted for more than half the total urban population, the highest contribution of the class for any census year being 75.48 % in 1941. The next smaller size class of towns i.e., towns with population of 50,000-99,999 has also occupied a very important position in the urban scene since 1941 when its contribution to total urban population was about four times the 1931 figure. The figures have gone up progressively from decade to decade since then and were 6, 9 and 15 times respectively in 1951, 1961 and 1971. The isopleth for this class of towns in the map has consequently bent sharply as compared to those for the other classes.
Another noteworthy feature of urbanisation in the state is the pattern of distribution of the class I towns among regions or districts. All the cities except one are distributed in the Calcutta and Burdwan regions, 7 in 24 Parganas, 2 in Hooghly, 1 in Howrah and 3 in Burdwan. The only city beyond these two industrial belts is Kharagpur in Midnapuf. .
Districtwise, the share of class I towns in the total urban population in 1971 was the highest in Howrah (74%). In 24 Parganas it was 43%. In Burdwan, Hooghly I and Midnapur the cities contributed 57 %, 27 % and 38 % respectively to the urban population. Calcutta is an entirely urban district.
The towns of Class II also occupied very important position in many of the districts contributing 50 % or more of the total urban popUlation in each of them. The districts are Hooghly (50.08 %), Nadia (57.72 %), Darjeeling (54.09 %), Coach Behar (55.54 %) and MaIda (90.16% ).
The number of cities and towns by size class in each district in 1971 is shown below:
Number of towns
Class Class I II
7 1
2 3
12
6 1
1
Class V
2 3
2 1 3 3
14 14
1 4 1 2 8 1
ClaIs V
8
2
4 2


GROWTH OF URBAN POPUL"TION 1901-11
0r-___ ',O ____ ,20.-___ 3,O ____ 4,O _____ srO ____ 6,O __ . __ 7,O _____ BrO ____ 9,O ____ ',OO ____ ~"OL"'HS
D CLASS ,
D CLASS
/ D CLASS "'
0 CLASS 'V
0 tt..ASl VIII'
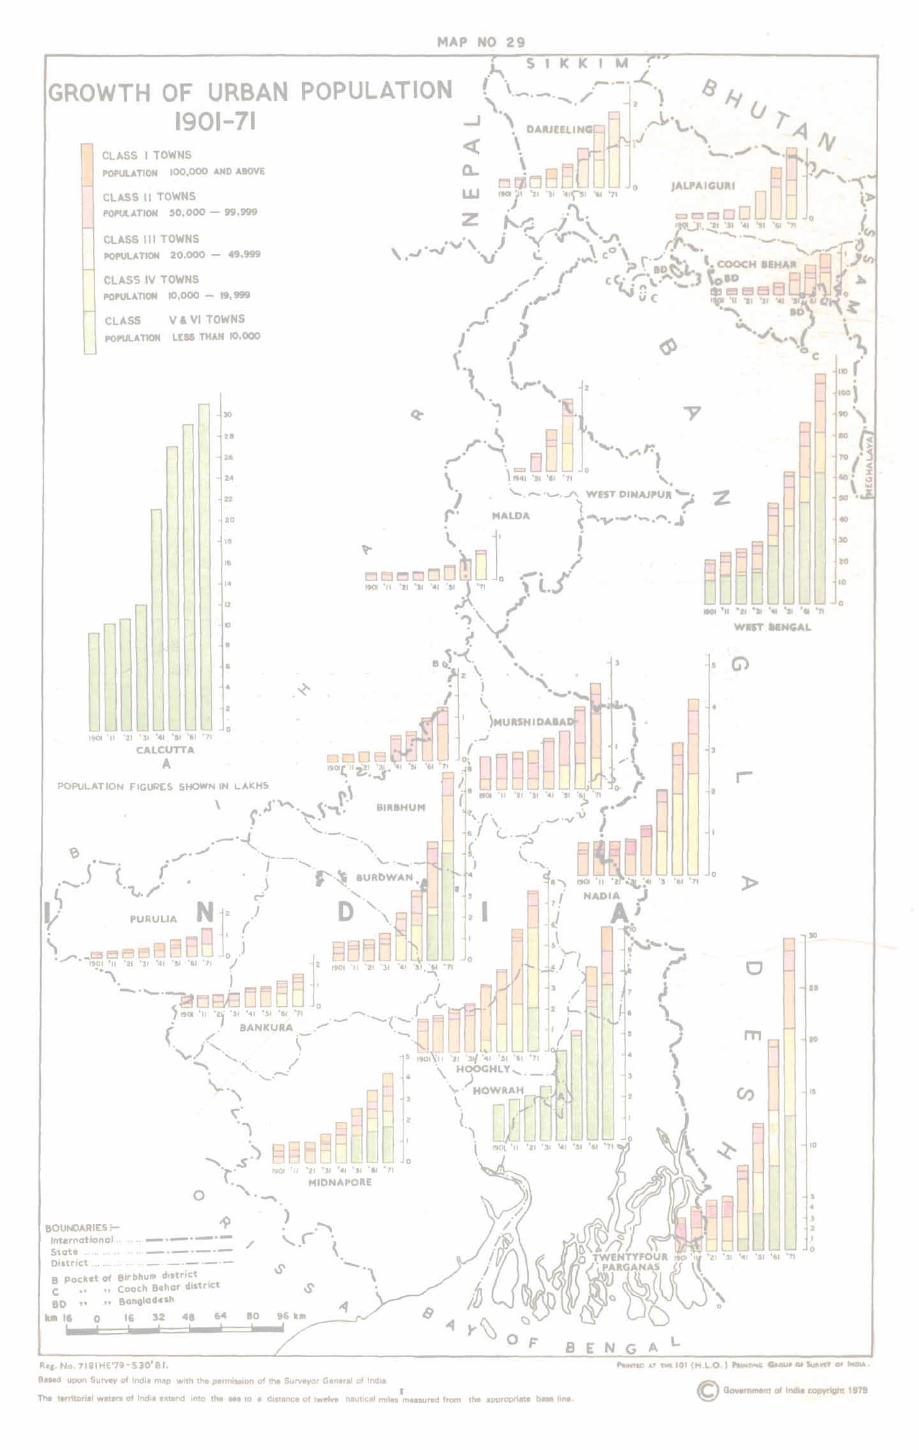
MAP NO 29
GROWTH OF URBAN POPULATION 1901-71
CLASS I TOWNS
POPULATION 100,000 AND ABOVE
CLASS II TOWNS POPUlATION SO,OOO - GG,999
CLASS III TOWNS POPULATION 20,000 - 49,999
CLASS IV TOWNS POPUlATION 10,000 - 19,999
CLASS V& VI TOWNS
POPULATION LESS THAN 10,000
o
BOUNDARIES :-International ........ _._._.- / State .................. _._._.-District ........ , ...... _._.-._.-
B pocket of Birbhum d'5trj~t . C ,. "coach Bilhar dllotrlct
SD " "Bangladesh
kill 16 0 16 32 48 64 80
Rei. No. 7ISIME'n-S30'SI.
eased upon Survey of India map with the permission ot the Surveyor General of India. I
o F
The t.rrltorill waters of India eKtend into the se8 to 8 distance of twelve nautical miles measured from the appropriate base line.
2
WIST IENGAL
»
'51 '61 ~11
15
10
4
3 2
.I o
.30
20
10
I)
""'NTID .. T TH' lot (H.L.O.) ...... 1I .. ~ Gaou_ OJ Suo .. V 0' tNO''''
© Government of India copyright 1979.

30
This map shows the extent of influence of the urban agglomerations, cities and towns on the adjoining areas.
Circles of various sizes have been drawn to represent six groups of urban centres. The influence of these urban centres extends to all the areas within the radii as shown below from the centre of the towns (or the core towns in Case of urban agglomerations)'.
Class of town! urban agglomeration
(1) Class I
(2) Class I
(3) Class I
(4) Class II . (5) Classes III & IV
(6) Classes V & VI
Population range
1 million and above
500,000-999,999 .
100,00~99,999 .
50,000-99,999 .
10,000--49,999
Below 10,000 .
Extent of urban
influence (radius)
50 Km. • 40 Km.
30 Km.
20 Km . 10 Km.
Dots
This indicates that urban centres of the first type will attract people residing within a radius of 50 Km. The weakest pull is of the last type, the small towns of below 10,000. Apart from attracting immigrants and commuters the urban units are also radiating their influence in many directions, influencing the outlying areas socially, culturally and economically and in many other ways and affecting even the entire way of life of the people. The total urbanising effect is obviously dependent on the nature and characteristics of the urban centres.
Calcutta urban agglomeration is the only urban area in the state belonging to category (0. 11 cities and a large number of towns of various sizes on both sides of the Hooghly are included in the Calcutta urban agglomeration. There is no city of, the second type in the state. Asansol U.A. and 3 other cities, viz., Durgapur, Burdwan and Kharagpur are of the 3rd type. Asansol U.A. comprises Asansol citY', ,Burnpur and Outer Burnpur (non-municipal town) which are all known for their industrial activity. Durgapur is essentially an industrial city; Burdwan city may be considered as a service-cum-commercial-cum-industrial town. In case of the towns of the third type the urban influence may extend beyond the radius of 30 km. from the core town depending on facilities of commutation, the functional characteristics of the units etc., Durgapur and Asansol U.A. are two urban centres which attract people from far greater distances.
There are 18 (eighteen) urban centres of the 4th type of which 7 are urban agglomerations. Many of the district headquarters towns and a few subdivisional towns come under this category. Siliguri, Krishnagar, Barasat U.A., Basirhat and Bongaon etc., are a few instances of this category. Siliguri stands apart from the 'Jther towns. While the latter are essentially service-cum-commercial towns Siliguri is coming up as a multi-functional urban centre of tremendous importance and potential. The urbanising influence of the town may extend beyond 20 Km.
There are 73 urban centres under the fifth type including four small urban agglomerations of Krishnapur, Bauria, Uluberia and Kulti. In the last group of urban centres represented by dots in the map, the extent of urban influence is limited to the peripheries only. There are 37 such towns in the state.
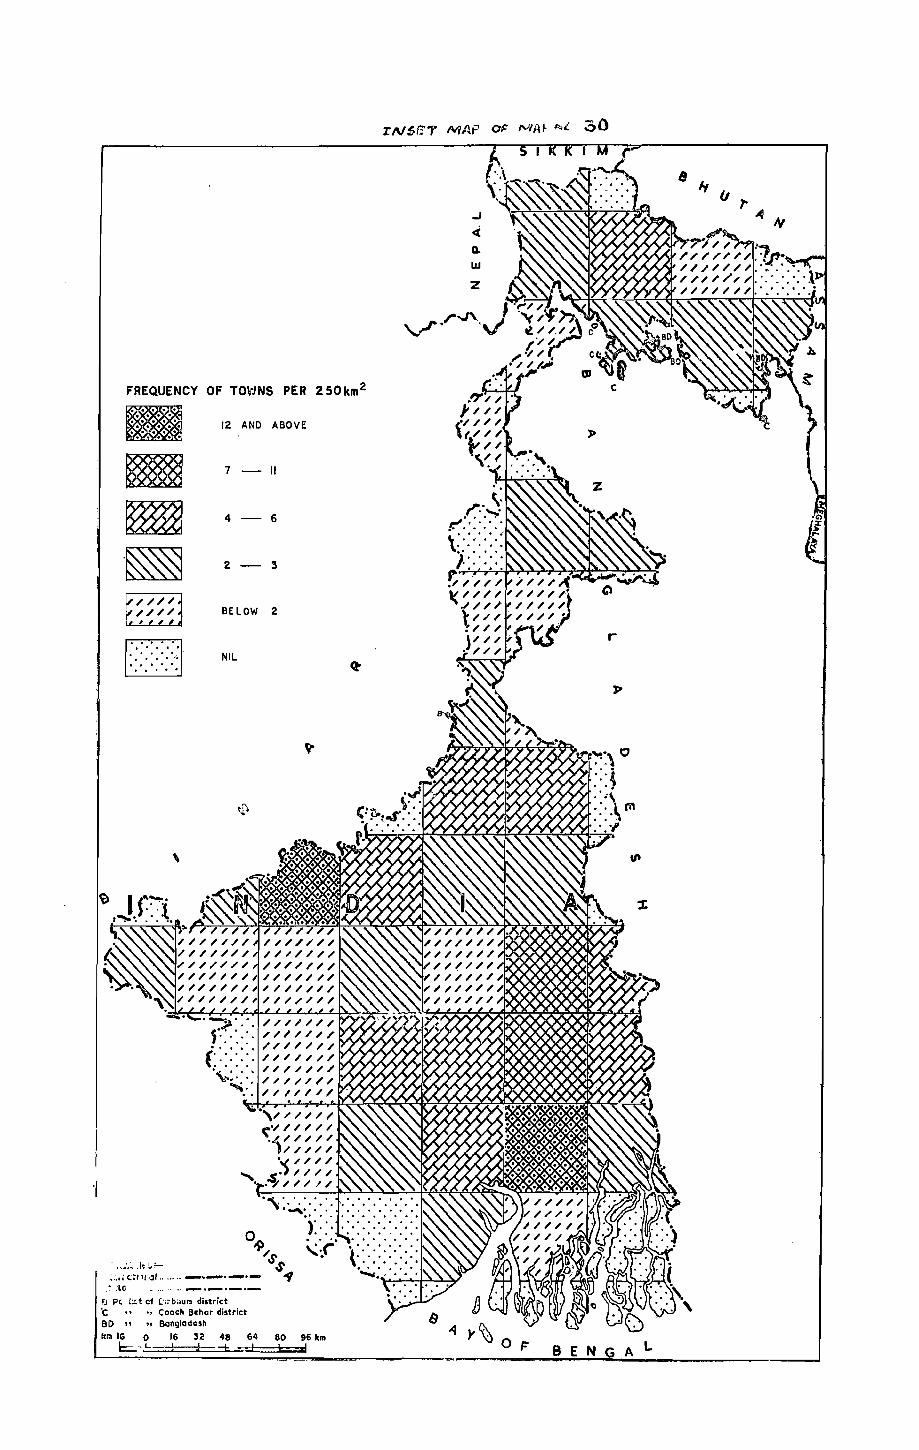
FREQUENCY OF TOWNS PER 250km2
12 AND ABOVE
7 -II
4 - 6
2 - :s
BE l OW 2
D NIL
\
D p, (;.ct cf Ci~b"ur.! district "C .. "Cooch Bchor district
CL IIJ
80 " "Bangladc:sh kr.! IG 0 16 32 48 64 80 96 km .q )' ~
l__~~~'=~==~!~J~~b=;=d:=~t;:::d________________ 0 F BEN GAL

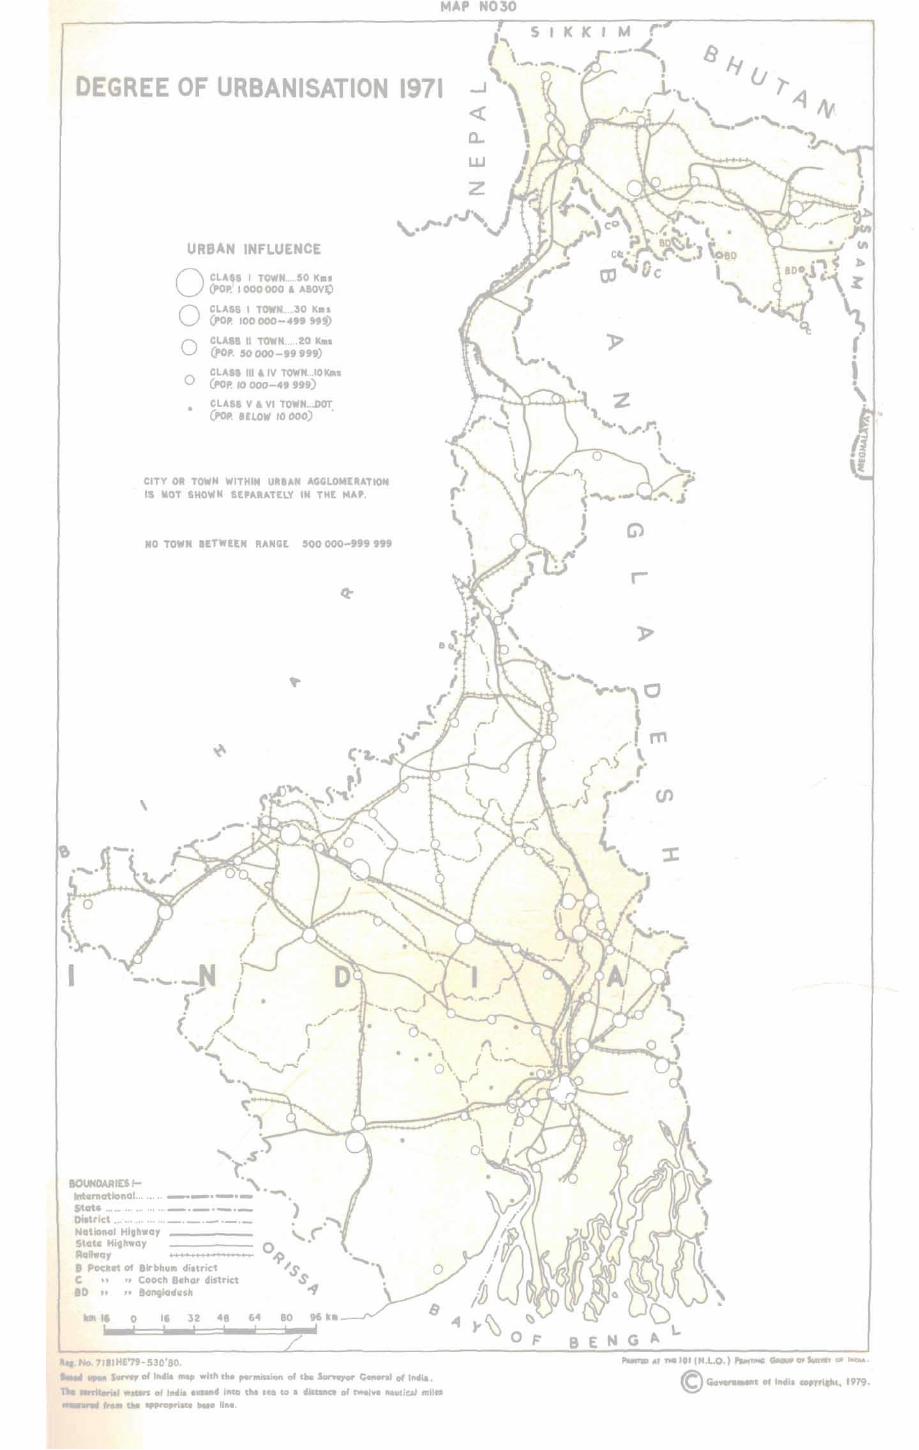
MAP N030
I
DEGREE OF URBANISATION 1971
URBAN lNFLUENCE
O CL~'S I TOwN ..... 50 Kills (POP. '000 000 , ABOV~
o CLASS I TOWN ..... 30 KillS (fOP. 100000-4" 9'9)
O CLASS II TOWN ..... 20 Kills (POP. 50000-99999)
O CLASS III , IV TOWN ... IO KIlls (poP. 10 000-49 999)
• C.LASS V & VI TOWN .. .DOT (poP. BElOW '0 000) .
CITY OR TOWN WITHIN URIAN AGGLOMERATION · IS MOT SHO'liN SEPAttATElY IN THE MAP.
NO tOWN BITWElN RANGE 500000-999 999
,
" s' t· BOUNDARIES:- ""-'."-'0 l~amationQI... ..... -_._._ State. ....... ~ .. " ... '" ___ . ._,_ District " ............. _._._._._ National Hillhway ____ _
State Hillh.ay Rallw(lY B POcket Of BirbhulII district C .. .. Cooch Behar district aD ,. "Bonglaclesh
km 16 0 16 32 48 64
1.,. No. 7ISIHE'79-530'SO. ..... upon Su .... ey 01 India map with the permission of tM Surve,.or General of In4lia.
n.. &errltorial waon oll"di. edMIt into the sea to a distance 01 twelve nauli~1 mil. "' ....... from tile appropriate bu. line.
a.. LU
z
o F'
l . Z ~, .. r: .,. ) .
.....,., AT ,..101 (H.L.O.) ....,,_ ~o,5uAVlY Of '''bOA.
© Governmen' of India copyrllht. 1979.

31
The map shows the urban centres of classes I and II by their functional characteristics.
The nine industrial categories of workers have been broadly grouped into six sectors as under:
Sector Category and Description of worker
(1) Primary I Cultivators
II Agricultural labourers
(2) Mining.
(3) Industrial
III Livestock, forestry, fishing, hunting and plantations, orchards and allied activities
IV Mining & Quarrying
V (a) Household Industry
(b) Other than Household Industry.
VI Construction
(4) Commercial •
(5) Transport
VII Trade & Commerce
(6) Services
VIII Transport, Storage and Communication
IX Other Services
The urban centres i.e. urban agglomeration or city or town are shown as belonging to one of the six sectors or a combination of two or three of them. The following criteria have been adopted for determining the functional classification of the towns.
(i) If more than 40% of the total working population of an urban centre is employed in one single sector the -t.::rban centre is placed in that particular predominant category and designated as an industrial or commercial or transport town and so on as the case may be.
(ii) Where the percentage under anyone of the industrial categories is less than 40 the functional classification is determined by a combination of two industrial categories if the total of their shares reaches 60 % . Such towns are _called industrial-cum-service towns or commerce-cum-transport towns and so on as the figures may indicate.
(iii) If the combined shares of any two sectors does not come up to 60 % then the third predominant industrial category is also taken into account and as the three categories make up for 60% of the working population the town is considered multi-functional and designated as industrial-cum--service-cum-transport town and so on.
There are 5 urban centres of class I and 18 of class II in the state. All the Class I urban centres except Burdwan city are mono-functional. Calcutta urban agglomeration comprising 11 cities and 63 other towns is categorised as "industrial", the percentage share of the industrial sector being 41.20. Asansol U.A. also comes under the functional category "industrial". 42.30 % of the total working popUlation of the agglomeration was engaged in the industrial sector. Durgapur too belongs to the same category. Kharagpur city (District Midnapore) which is the only town of class I beyond the Calcutta and Burdwan belts is a transport town. Burdwan is multi-functional, being classified as service-cu m-commecial-cu m-industrial.
Out of 18 Class II urban centres only two, namely, Budge Budge and Santipur may be designated as "industrial". Two other towns, namely, Midnapore and Jalpaiguri are monofunctional, both being "service" towns. The remaining 14 urban centres are all multifunctional-5 of them are bi-functional and 9 tri-functional.
Circles have been drawn proportionate to the population size for each of the urban centres in the map. Six distinguishing screens have also been used to represent the six sectors which determined the functional character of the urban centres.

FUNCTIONS OF CLASS I AND CLASS n
A . : ..... \ ......
URBAN 1971
'.
_. _,. _, .
. ..__J-t ( ~ • \,. rpURULIA
BA I /'
CENTRES
MAP NO 31
\"-.,, ) •• \ (' ,. ...... .._,-J.
_,,-,~ i .-( (/ I f ( N /.r./· ................ \. Q(J '..,.",.""",. __ / r-A-I-~'flA ( .. i _. "'-.,1, \ . . ..... _, '\,.1 "-. A \ J' •. ""....... . " .... • - ........ --J . .
"",\ '\(J) MIONAPUR
~ , ., . t, U.A. URBAN AGGLOMERATION \. UR I
" .s" t· BOUNDARIES;- '"\ • _ International. .. ,,,., --.-._.- • State .................. _._._._ ) Oistrict ............... _._.-._._ 0 . ."",
~ /"r \ s . S -4 ....... \ B Pocket of 8irbhurn district
C .. .. Coach Bchar district BO " "Bangladesh
__ 200 000 - 499 999
199999 - 75 000 99 999 ,0-- 50 000 - 74 999
PRIMARY
INOUSTRIAL
COMMERCIAL
TRANSPORT
SERVICES

32
The map shows the functional characteristics of Class III and class IV urban centres.
There were 34 urban centre.s of class III (population range 20,000-49,999) and 30 of class IV (population range 10,000-19,999) in the state in 1971. About one third of the total number of towns therefore belonged to the population range of 10,000-49,999.
Of the 34 class III units, (including 4 urban agglomerations), 12 had single function. Budge Budge U.A. in the outskirts of Calcutta metropolitan area was mono-functional. .
10 out of the 34 units of class IV had single predominant functions. The remaining 24 were multifunctional in character.
PERCENTAGE
CLASS JI1
(WORKERS IN a 000)
PERCENTAGE
CLASS N
(WORKERS IN 0000) 74
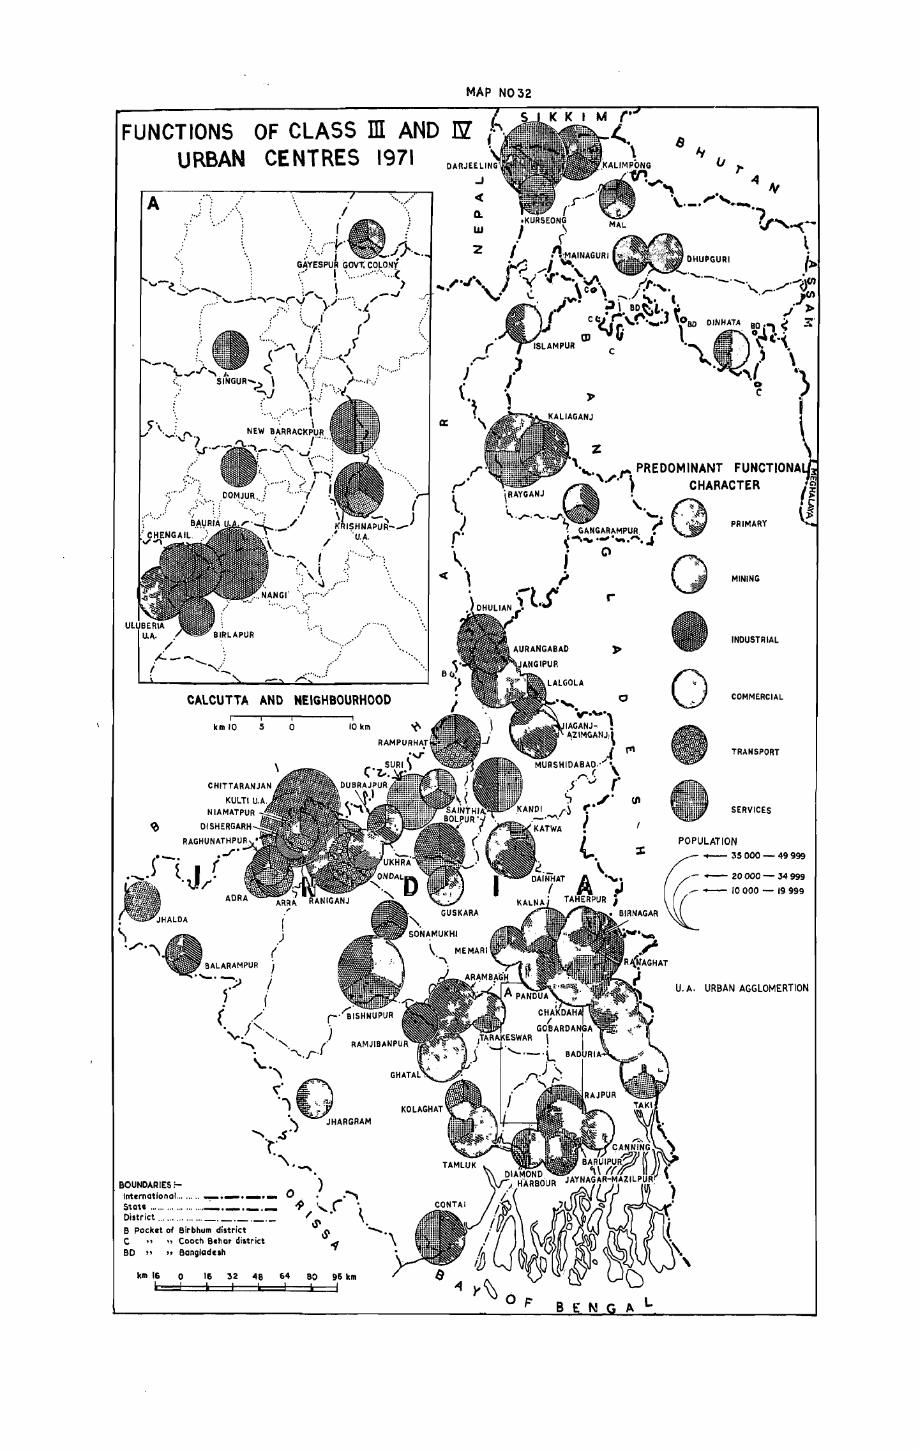
MAP N032
FUNCTIONS URBAN
OF CLASS m AND TIl CENTRES 1971
A ,' . ........
.. , ... ?_ .. Fi
/
:~~~)i ................. ;:
....... \ ,.". ·'0 ..
....................
. ' !'" ........ :
CALCUTTA AND NEIGHBOURHOOD
km 10
RAGHUNATHPUR. .. /" f-' ' , t J ( .. r
5
( )
( 8ALARAMPUR I ."-...... .
:.:> I f .
o 10 km
...
. I (./ r''8ISHNUPUR . J' . '\".. ". ) """" . , · ........ II
\.,~ ~ '")U
" :, ~ 'JHARGRAM
"'" ,s'} or ',. -. BOUNDARIES :-International. ..... ,' ~._._._
;~:~~c'l'::: ::: ::'. ::: :::'=:::-_:_-::= B pocket of Birbhum district C " "Cooch Behar district BO " "Bangladuh
km 16 0 16 32 48 64 80 96 km
.....
'. " .
DARJEELI
.J
c(
Q.
UJ
z
"(
I!J Iof
I.J ,.
OHUPGURI
z "~' r. PREDOMINANT FUNeT
,,,. ) CHARACTER
PRIMARY
MINING
I'"'
INDUSTRIAL
"". """", IAGANJ· ,
o COMMERCIAL
~2'MGANJI~
MURSHIDABA~ .. A\ f'I fr-·._; ,.
TRANSPORT
~ ./' (II /.~ ~'
~;:~ I SERVICES
I POPULATION
~. X ~+--35000_49999 ._ \ DAINHAT A '". - - 20000 - 34999
I ,J --- - 10 000 - 19 999 TAHERPUR I
BIRNAGAR
U. A. URBAN AGGLOMERTION

33
The map shows the extent of migration according to place of birth i.e. the number of people who were born elsewhere than at the place of enumeration. The data are presented at the district level.
The total number of in-migrants by place of birth are shown for each district by proportionate circles. Inside each circle the percentages of in-migrants by sex along with rural and urban break-up are also shown. The districts have been hatched in different shades according to the percentages of in-migrants to their total population
The percentage of in-migrants to total population for West Bengal as a whole was 30.22 in 1971. Districtwise, the proportion was the. highest in J aipaiguri (40.320/.,) and the lowest in Murshidabad (21.74%).
The fol1owip.g statement shows the percentages of in-migrants for the districts.
Jalpaiguri
Nadia.
Cooch Behar
Calcutta
24 Parganas
Burdwan
WEST BENGAL
40.32
38.35
35.18
33.45
33.13
33.00
30.22
West Dinajpur
Midnapore
Howrah
Bankura
Purulia
31.16
26.31
26.08
25.02
24.87
Birbhum 24.71
Darjeeling . 31.84 MaIda 24.44
Hooghly 31.32 Murshidabad 21.74
Apart from the usual social and economic factors in-migration from across the international borders played a very important role in pushing up the proportion of in-migrants in districts like Jalpaiguri, Nadia, Cooch Behar, 24 Parganas and West Dinajpur etc.
Except in Calcutta, Darjeeling and Jalpaiguri females outnumber males among in-migrants in all districts. In the westernmost agricultural districts of Bankura, Purulia and Midnapore the proportions of fymales to total in-migrants are as high as 78.65 %, 76.04 % and 75.52 % respectively. In Calcutta, Darjeeling and J alpaiguri, on the other hand, the percentage are less than 50 each. Calcutta is credited with the lowest percentage (29.27 %) because of the fact that the individuals born outside the city district only have been considered as in-migrants.
Males are preiJonderant among the in-migrants in Calcutta, Darjeeling and Jalpaiguri for obvious reasons. The proportion of males among the total inmigrants are quite high in the districts of Burdwan (45.73 %) and 24 Parganas (42.25 %) also due to the sex-selective in-migration of labour to their industrial and mining areas.
STATES/UNION TERRITORIES
BIHAR
UTTAR PRADESH
ORISSA
ASSAM
o
II .
SIKKIM ~
IN-MIGRANTS TO WEST BENGAL STATE ACCORDING TO
TYPES OF MOVEMENT
(IN 00000)
II
RURAL TO RURAL
URBAN TO RURAL
URBAN TO URBAN
OTHER STATES AND UNION TERRITORIES
-.----~~. 8m. OTH.RS
12

IN-MIGRANTS 1971
PSACENTAGE OF IN-MIGRANTS TO TOTAL POPULATION
• ABOVE 35'00
D 33'01-35'00
~ ~O'01-33'00 ~SA30'22
~ 25'01-30'00
• BELOW ·25'01
FIGURES AT TOP OF' CIRCLE INDICATE ~
TOTAL IN-MIGRANTS FIGURES INSIDE OR
AGAINST SECTORS INDICATE PERCENTAGE
OF URBAN/RURAL AND MALE/FEMALE
IN-MIGRANTS
o 'BOUNOA~IES:- ~ International ........ _.-._._ State , ..... """ ...... _._._._ Diltrict ............ "'_'_'_'-:-'_
B Pocket Of elrbhum district C " "Coach Behor district BD .. "Bangladcah
I ~.
~
MAP N033
8 A
..J
-c Q.
LIJ
2
E. NGA\..
MIGRANTS ABOVE
2000000
----- 2000 000
----~. 1000000 --SOOOOO
M-MALE
F-FEMALE

34
The extent of inter-district migration according to place of birth is represented in the map.
The number of persons who were born outside the district 9f enumeration are the in-migrants to the district. People born in the district but enumerated elsewhere in some other district of the state are the emigrants or out-migrants. The sum of in-migrants and out-migrants. represents the gross migrants. Circles have been drawn proportionate to the number of gross migrants for each district in the map. Each of the circles is again divided into two parts, the shaded one representing the in-migrants and the other part the out-migrants. The rural-urban break-up of in-migrants and out-migrants is also shown in the map. Moreover, the districts have been hatched according to the percentage gain or loss of migrants (Le. In-migrants-Out-migrants) to total population.
In Jalpaiguri, West Dinajpur, Twentyfour Parganas, Hooghly' and Burdwan the in-migrants outnumbered the out-migrants. While the gains in 24-Parganas, Burdwan and Hooghly are partly due to the employment opportunities offered by these districts. The case of West Dinajpur and Darjeeling is somewhat different. The gains are largely, because of the preponderance of settlers who came from beyond the international borders.
The highest percentage gain is observed in the district of Burdwan (3.17 % ). In J alpaiguri the percentage gain is the lowest 0.35 % ). All the remaining districts including Calcutta recorded net loss of migrants. The percentage loss is found to be the highest in Bankura (-3.40%). The number of in-migrants in the district were 72,408 while the out-migrants numbered 141,493 against the total population of 2,031,039. The district is purely agricultural and offers little Of no attraction for in-migrants.
The net percentage gain or loss of migrants to total population is shown districtwise in the statement below:
District
Burdwan
Hooghly
Twentyfour Parganas
West Dinajpur
Jalpaiguri
TYPES OF MOVEMENT 0
Percentage-gain/loss
Gain
+3.17%
+2.77%
+2.12%
+1.36%
+1.35%
2
District
Bankura
Calcutta
Darjeeling . Midnapore
Birbhum
Nadia.
Howrah
Purulia
Murshidabad
Cooch Behar
MaIda
IN-MIGRANT (IN 00000)
3
Loss
· -3.40%
· -2.07%
· -1.93%
· -1.69%
• -1.69%
• -1.65%
• -1.52%
• -1.44%
• -1 19%
· -0.55%
• -0.53%
4 5 6 (BY PLACE OF BIRTH) ...-----.-----..,-------,-----r-----,--------,
URBAN TO RURAL
_ MALE.
URBAN TO URBAN Wffitil FEMALE
OTHERS
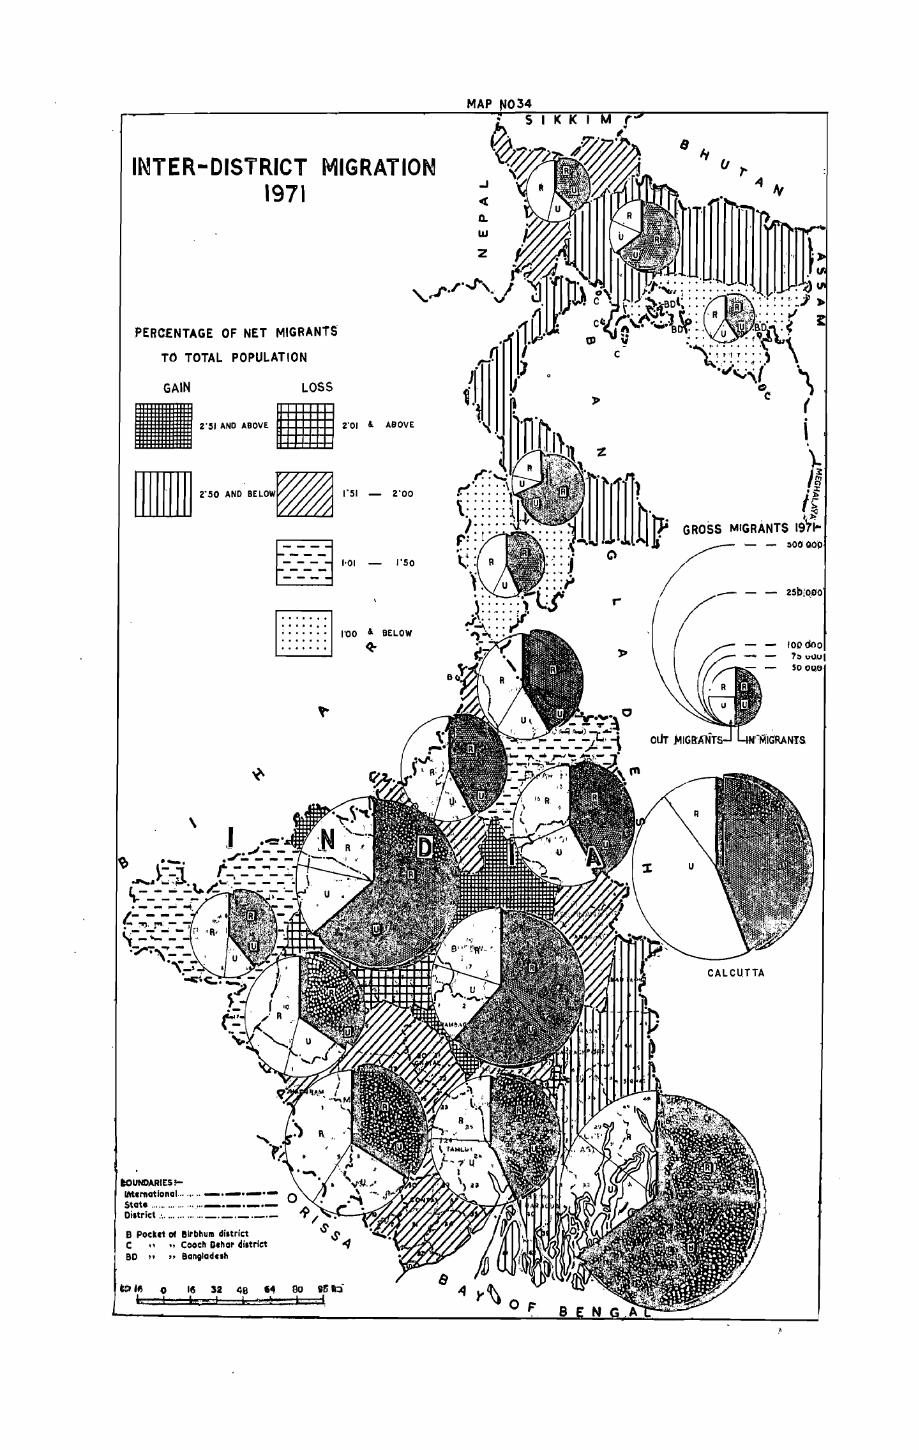
INTER-DISTRICT MIGRATION 1971
,PERCENTAGE OF NET MIGRANTS
TO TOTAL POPULATION
GAIN LOSS
III,·" "" '"'''' III ,." · "'" _ ,.,0 'NO "LO'~ ,." - 2"0'
\
~J=~. "-__ ... _-__ ~ ._ - ... ....t.
/_- - --.~ "', r": ~ 'l-----
.-:.--., '"'!'_ .,-, .~'".
toUNDARIES~
B'··' D'··
lIIt.motionoi ... " ... _._._._ Stat ............. , ...... _._._.-Oiltrict : ..... 00' ...... _._._._,_
B Pocket 01 BlrbhulII diltric:t C " .. Cooch D.hClr diltric:t BO " "Bonglodesh
~~ 0 ~ H q ~ ~ ~b l. I '=1 h .... ~ I
1'50
& BELOW
~
.J
< Q.
UJ
2

35 The map ·shows the jn~migrants according to their place of last residence
in the urban centres of class I i.e. with population of 100,000 and above.
For each urban centre the total in~migrants are shown by a proportionate circle. Each circle is shaded in different grades of hatching for the four categories of in-migrants. The categories are :
A. Resided in India: (a) Migrants from elsewhere in the district of enumeration. (b) Migrants from other districts of .the state. (c) Migrants from other states of India.
B. Resided outside India: In addition, each of the districts has been hatched according to the percentage of in~migrants in the urban areas to total in-migrants in the district.
There are five urban centres of Class I in the state. These are: (i) Calcutta Urban Agg10meration comprising 11 cities and 63 other
towns; (ii) Asanso] Urban Agglomeration;
(iii) Durgapur city; (iv) Burdwan city; and (v) Kharagpur city. For Calcutta u.A. the in~migrants from elsewhere in the district of enume
ration have not been shown in the diagram. As is well~known, Calcutta U.A. is comprised of Calcutta city and many of the cities and towns of the districts of Howrah, Hooghly, Nadia and 24 Parganas.
The city of Burdwan has a heavy percentage of in·migrants (26.08 %) coming from outside the city but within district. On the other hand, the inmigrants to Durgapur city are mainly from other districts of the state and the share of such people in the total in~migrants in the city was as high as 43.27 % . It is pertinent to mention that during 1961-71 Durgapur expanded vigorously and the growth of population was 395.58 % which was the highest growth rate recorded by any town in the state during the decade. People from many other districts of the state have obviously moved into the city in large numbers because of the expansion of employment opportunities during the period.
People from outside the state constitute the bulk of the in-migrants in the city of Kharagpur. They are as much as 53.24% of total jn-migrants to the city. In Calcutta urban agglomeration in~migrants from other states constitute 44.45 % which means a tremendous absolute figure of 1,012,135 persons.
The percentages of persons who resides last in places outside India but who were enumerated in these five class I urban centres are also quite heavy. In Calcutta U.A. the proportion is 32.80 % and in Burdwan it is 31.18 % . The figures come down gradually to 17.24 % in Asansol, 13.38 % in Kharagpur and 10.50% an Durgapur. In-migrants from erstwhile East Pakistan now Bangladesh obviously constitute the overwhelming bulk of such persons.
The following statement shows the percentage of in-migrants into urban areas of the districts to total in~migrants.
WEST BENGAL 31.05 Calcutta 100.00 Murshidabad 12.48 Howrah 45.32 Purulia 12.30 24 Parganas 45.08 Jalpaiguri 12.14 Hooghly 36.39 Birbhum 10.43 Darjeeling 32.09 Midnapore . 10.06 Burdwan 29.42 Coach Behar 9.00 Nadia . 20.34 MaIda 6.94 West Dinajpur 15.03 Bankura 6.87
Evidently, the higher the degree of urbanisation the higher is the proportion of in~migrants into urban areas to total in~migrants of a district. As marriage migration is by and large the main constituent of total migration in the prevailing socio~economic conditions the bulk of in~migrants flows towards the rura:l areas. The percentage 9f in-migrants to urban areas in the total in-migrants have necessarily to be low.
- . . MIGRANTS IN CLASS I URBAN CENTRES ACCORDING TO
LAST RESIDENCE 1971 MIIiRANTS (IN 0000)
z 3 4 j f r LAST RESIDENCE 1 I I I -
WI6~I~N~~E:A~6~ [illmmmlllilltlllllllllllillmlllll~ i BSY&Ji:1~~R~~i~' mllW111111111111111111111111111111II11111111111111111111lllllllllllllllllllilmllllllllllilif
OUTSIDE INDIA lllillllllllllllllllllllllllllllllllll!11111111111II :: 2: I
Ie
illIillIill MALE
I ~"M'"

MIGRANTS IN CLASS I URBAN CENTRES 1971
TOTAL MIGRANTS 1971
-----200000
-----100000
FROM
ELSEWHERE IN} DISTRICT OF ENUMERATION
FROM OTHER J DISTRICTS OF STATE A
'-----STATES II FROM OTHER}
IN INDIA
B-OUTSIDE INDIA
A-RESIDED IN INDIA
FIGURES AT TOP OF CIRCLE INDICATE TOTAL MIGRANTS IN CITY, FIGURES INSIDE SECTORS INDICATE PERCENTAGE OF RESPECTIVE MIGRANTS TO TOTAL MIGRANTS
POPULATION CIRCLE OF CALCUTTA U.A. V NOT DRAWN AS PER SCALE
r," \1
\
q]z..)ffi]1 ,~i WJ III iliilliil
RGAPUR CI
e
~ . . ._.f . t l . ~ 'hml
11 PURULIA
~r.~ r
-.~.-;>
f (I
BOUNDARIES:-- KHARtPUR CITY
ES:":'~': ~:~:-:-:= 0 ~ ,m~, II oS .~.~
B Pocket of 8irbhum district .s. c " "Cooch 8th or district '1 BD " "Bangladesh lJ
km 16 0 16 JZ 4B 64 80 96 km
..J
'(
Q.
UJ
2
»
'" 'X
1
'1 z
irr""rn Ili~~J.J!fur
. " PERCENTAGE OF URBAN MIGRANTS
TO TOTAL MIGRANTS
r m ABOVE 50'00
m 40'00 - 50'00
. . . .... 20'01 - 40'00
. . . . ... ... ... . . . . .. • '0'0'-20'00
~ BELOW '0'0'
:r.
CALCUTTA
\
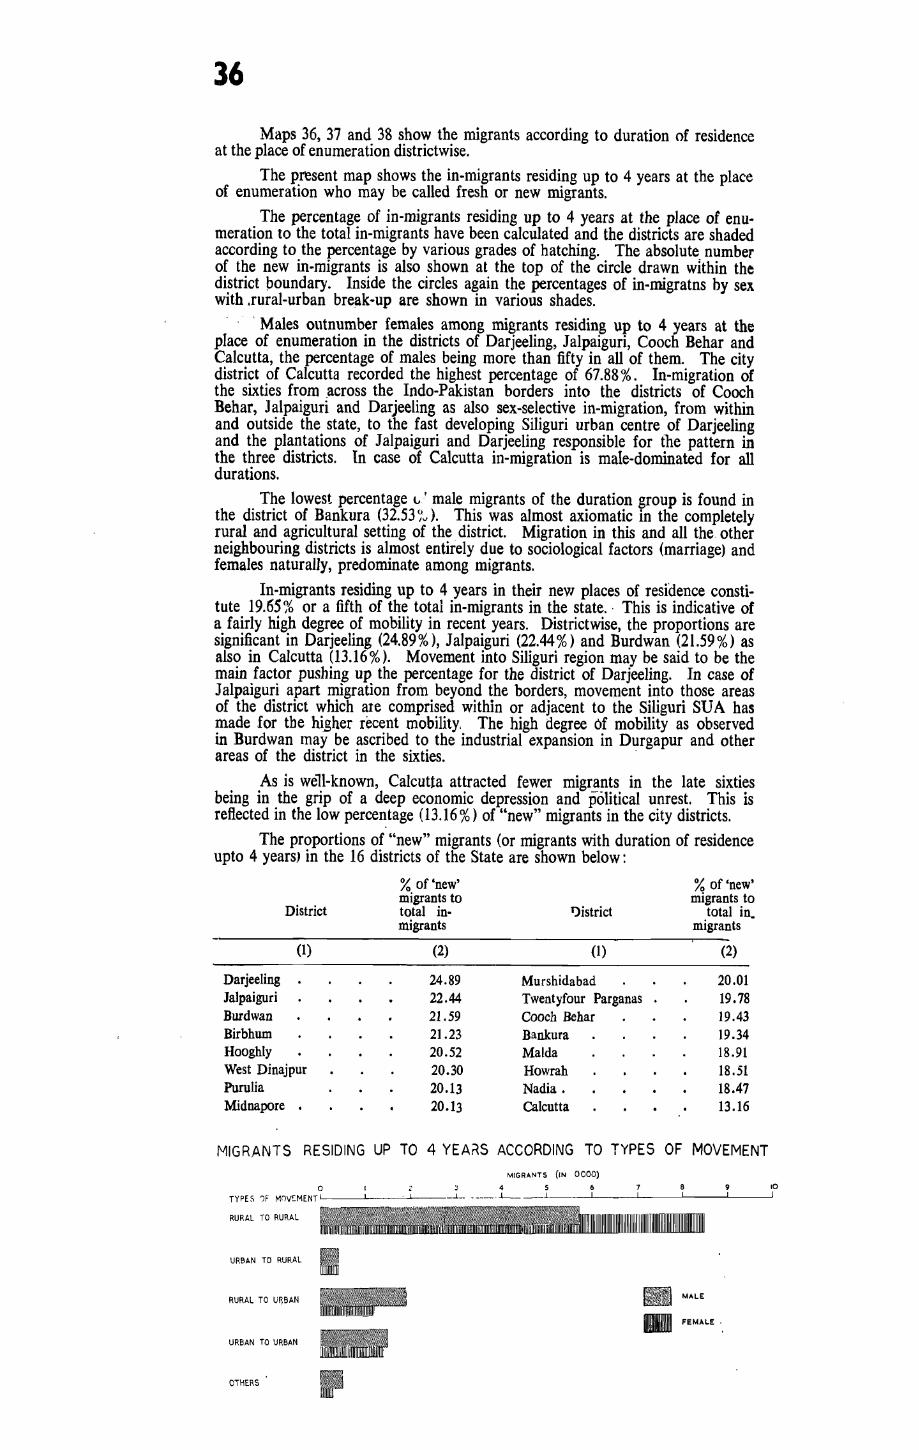
36
Maps 36, 37 and 38 show the migrants according to duration of residence at the place of enumeration districtwise.
The present map shows the in-migrants residing up to 4 years at the place of enumeration who may be called fresh or new migrants.
The percentage of in-migrants residing up to 4 years at the place of enumeration to the total in-migrants have been calculated and the districts are shaded according to the percentage by various grades of hatching. The absolute. number of the new in-migrants is also shown at the top of the circle drawn within the district poundary. Inside the circles again the percentages of in-migratns by sex with .rural-urban bre~k-up are shown in various shades.
, Males outnumber females among migrants residing up to 4 years at the place of enumeration in the districts of Darjeeling, Jalpaiguri, Cooch Behar and Calcutta, the percentage of males being more than fifty in all of them. The city district of Calcutta recorded the highest percentage of 67.88 %. In-migration of the sixties from across the Indo-Pakistan borders into the districts of Cooch Behar, Jalpaigurl and Darjeeling as also sex-selective in-migration, from within and outside the state, to the fast developing Siliguri urban centre of Darjeeling and the plantations of Jalpaiguri and Darjeeling responsible for the pattern in the three districts. In case of Calcutta in-migration is male-dominated for all durations.
The lowest percentage l,.' male migrants of the duration group is found in the district of Bankura (32.53~:..,). This was almost axiomatic in the completely rural and agricultural setting of the. district. Migration in this and all the. other neighbouring districts is almost entirely due to sociological factors (marriage) and females naturally, predominate among migrants.
In-migrants residing up to 4 years in their new places of residence constitute 19.65% or a fifth of the total in-migrants in the state., This is indicative of a fairly high degree of mobility in recent years. Districtwise, the proportions are significant in Darjeeling (24.89 %), J alpaiguri (22.44 %) and Burdwan (21.59 %) as also in Calcutta (13.16%). Movement into Siliguri region may be said to be the main factor pushing up the percentage for the district of Darjeeling. In case of Jalpaiguri apart migration from beyond the borders, movement into those areas of the district which ate comprised within or adjacent to the Siliguri SUA has made for the higher recent mobility. The high degree Of mobility as observed in Burdwan may be ascribed to the industrial expansion in Durgapur and other areas of the district in the sixties. .
As is we11-known, Calcutta attracted fewer migrants in the late sixties being in the grip of a deep economic depression and political unrest. This is reflected in the low percentage (13.16%) of "new" migrants in the city districts.
The proportions of "new" migrants (or migrants with duration of residence up to 4 years) in the 16 districts of the State are shown below:
% of 'new' % of 'new' migrants to migrants to
District total in- 1)istrict total in_ migrants migrants
(1) (2) (1) (2)
Darjeeling 24.89 Murshidabad 20.01 Jalpaiguri 22.44 Twentyfour Parganas 19.78 Burdwan 21.59 Cooch Behar 19.43 Birbhum 21.23 Bankura 19.34 Hooghly 20.52 MaIda 18.91 West Dinajpur 20.30 Howrah 18.51 Purulia 20.13 Nadia. 18.47 Midnapore . 20.13 Calcutta 13.16
MIGRANTS RESIDING UP TO 4 YEArtS ACCORDING TO TYPES OF MOVEMENT
o TYPES ,)F M()V[MENTL---~--'-..i.--
RURAL TO RURAL
URBAN TO RURAL I RURAL TO U~BAN
URBAN TO URBAN
OtHERS
MIGR"NTS (IN 0000)
6
.. MALE
• FEMALE,
9 10
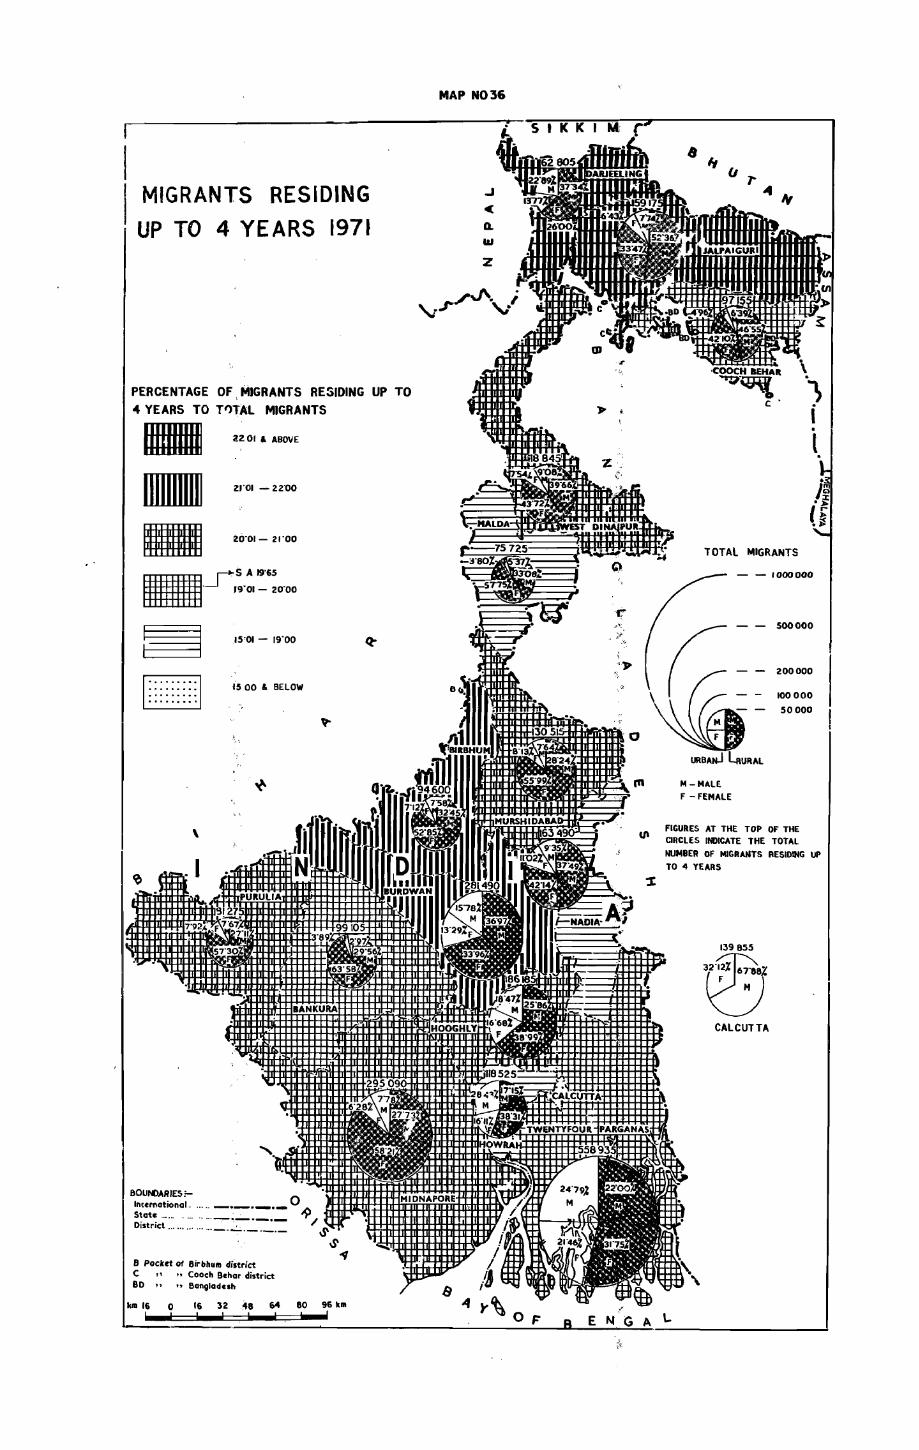
MIGRANTS RESIDING
UP TO 4 YEARS 1971
PERCENTAGE OF, MIGRANTS RESIDING UP TO
4 YEARS TO Tt)TAl MIGRANTS
- 2201 & ABOVE
- 2'"01 - l2ll0
- 20-01 - 21-00
,..,.5 A 19'65
_ __J '9'01 - 20'00
15'01 - 19-00
IS 00 & BELOW
\
I
8 Pocket of BirbhulIl district C " .. Coach Bchor district BD " "Bangladesh
kill 16 0 16 32 48 64 80 96 kill
MAP N036
z
_ ".../\ ; ,,~ "
TOTAL MIGRANTS
- - 1000000
M-MALE. F -FEMALE
200000
100000
50000
FIGURES AT THE TOP OF THE CIRCLES INDICATE THE TOTAL
NUMBER OF MIGRANTS RESIDING UP TO 4 YEARS
139 BSS
CALCUTTA

37
The map shows the in-migrants of 5 to 9 years duration for each district. The manner of presentation is the same as in map number 36.
As in case of "new" migrants the proportion of males to the total inmigrants of 5 to 9 years' duration of residence exceeds 50% in the districts of Darjeeling, Jalpaiguri and Calcutta. In Cooch Behar, however, the percentage of males is. below fifty. The proportion of males reaches the highest in Calcutta (71.90 %) and the lowest in the district of Bankura (3.53 %). In case of Calcutta predominance of males among all in-migrants is too well-known to be re-emphasized. Sex-selective movement towards the plantations as also to the Siliguri region explain the high proportions of the males among the in-migrants of the duration-group in Jalpaiguri and Darjeeling. In case of Bankura and other districts with similar agriculture backgro!lnd, mobility among males are minimal.
In-migrants with 5 to 9 years of residence in their new homes ·constitute 16.73 % of total in-migrants in the state. Districtwise, their proportion is the highest in Burdwan (19.11 %) and the lowest in Calcutta (13.29%). The proportions are quite high in Darjeeling (18.43%), Jalpaiguri (17.69%), and Nadia (17.32 %) which may be attributed to the movement of the early sixties into the industrial belt of Burdwan (Durgapur etc.) and into the newly emerging Siliguri region of Darjeeling. In case of Jalpaiguri, Nadia, Twentyfour Parganas and Cooch Behar etc., the movement from across the international borders in the early sixties will explain, partly, the fairly high proportions of the in-migrants of the duration range.
The percentages of the in-migrants of 5 to 9 years of duration of residence are indicated for each district in the following statement.
State/District
WEST BENGAL
Buedwan Darjeeling . Jalpaiguri Nadia. 24 Parganas • Cooch Behar Hooghly West Dinajpur
Percentage of in-migrants (5-9 yes) to total
in-migrants
17.73
19.11 18.43 17.69 17.32 17.24 17 23 17.15 16.80
State/District
Murshidabad Maida Howrah Purulia Midnapore Birbhum Bankura Calcutta
Percentage of in-migrants (5-9 yrs)
to total in-migrants
16.56 16.54 16.37 16.29 15.86 15.61 15.22 13.29
MIGRANTS RESIDING 5 TO 9 YEARS ACCORDING TO TYPES OF MOVEMENT
MIGRANTS (IN 0000)
o 4 5 6 7 If TYPES OF MOVEMENT L..! __ l....-_--L-__ .t___--L-! __ .L' __ .L' __ .L' __ J...___....L _ __J.
RURAL TO RURAL
URBAN TO RURAL
RURAL TO URBAN [.f.~ MALE
iIllIllIII1IIII FEMALE IlililliIlU URBAN TO URBAN
OTHERS ,

6 I
MIGRANTS RESIDING 5 TO 9 , YEARS 1971
,-~.r PERCENTAGE OF MIGRANTS RESIDING FROM 5 TO 9
0
i : 16 0
YEARS TO TOTAL MIGRANTS
U1IIlllJ
• 1&
• §
I
16 I
I I
· · ·
I
32 I
16 32 48
"
19'01 , ABOVE
18·01 - 19·00
17'01 - 1800
16'01- 17'00
IS'OI - 16'00
15·00 & 8ELOW
48 64 I I
I 8'0 916 KILOMETRES 64
M.AP N037
..J
~
Q.
UJ
2
r
0
TOTAL MIGRANTS
500 000
~~- 200 000
~-~~~ 100 000
50000
URBANJ LRURAL
M-MALE F-FEMALE
FIGURES AT THE TOP OF THE CIRCLES INDICATE THE TOTAL NUMBER OF MIGRANTS RESIDING FROM 5 TO 9 YEARS

38
Th~ map snows the in-~igra~ttf residing for 10 years and abo;'e in the place of enumeration. The pTesentation is in the same manner as in .maps 36 and 37.
As in case of the two other duration rang~ the proportio!' c:t males to total migrants residing for 10 years and above is the highest in the district of Calcutta (71.16%). In DarjeCling, too, the males outnumber females at!'ong migrants of this duration range, the proportion of ma~es being 53.30%. ~~ percentage of males is the 10w\oSt in the district of Bankura (15.73,,).
In-migrants residing for 10 years and above at the place of enumeration constitute 55.37% of the wtal in-mil!fants f('r l~le state as a whole The statement below shows their percentage distriCtwise.
StatcJDistrict
WEST BENGAL.
Cakotta Nadia • Cooch Debar
Midnapore •
Pcnzutagc ofmigmnt:S (10 yrs. aabove) to total re-miAWlts
SS.37 61.04 SS.41 58.11 57.73 57.27 56.88 56.66 Sfi.6S
StatefDist.:icl
MurshIaaoad Bilbhum • la~guri • 24 Parganas HoogbIy
Howrah
Burdwan DarjcdiDg •
• • • • •
• •
• • • • •
M~RAN1S RESIDING 10 YEARS AND ABOVE
ACCORDING TO TYPES Of MOVEMENT
JI 7
• •
• • •
•
t'ero:ntage of mit'l'3Jlfs (10 yrs &: above). total in-
mi,tm".nts
56.14 5(;.OS 54.So; 53.91 53.68 Sl.20 SO.79 SO.7S
TYPES Of iM1)VIEMENV "----'-----"----''----__.__----"------''---"-----''-- _..Jl__-l
I1l!lAI TO lliIBAIL
OTIHI£RS

MIGRAN'fS RESIDING 10 YE,6RS AND ABOVE
1971
PERCENTAGE OF MIGRANTS RE'SIDING SO YEARS AND ABOVf TO TOTAL MIGRANTS
• A.OVE .0·00
H 5.01 - ~o·",o,
~ CJ , .
\
I! 1'IoIdr!" __ lliistrid
5&"Of - !U'OO
Co .. c-ch:, bIIG" 4Id:rric:
eo .. "" 1!hIn!I~
MAP NO 38
..1
< Q.
III
z
FI G'URiE;;, ~T ll'1it" ll'aF" O'F T HiE CIR.CLE ,1J~O:I;C'!\:l'li TWi< lTOTA-L rWMBE'R OfF MI'GR'IIJ)l;rS RE!Hllll'l'& F RoOM 10 1I1E A!I<l<S' /(·!W] All'C1l'1t E
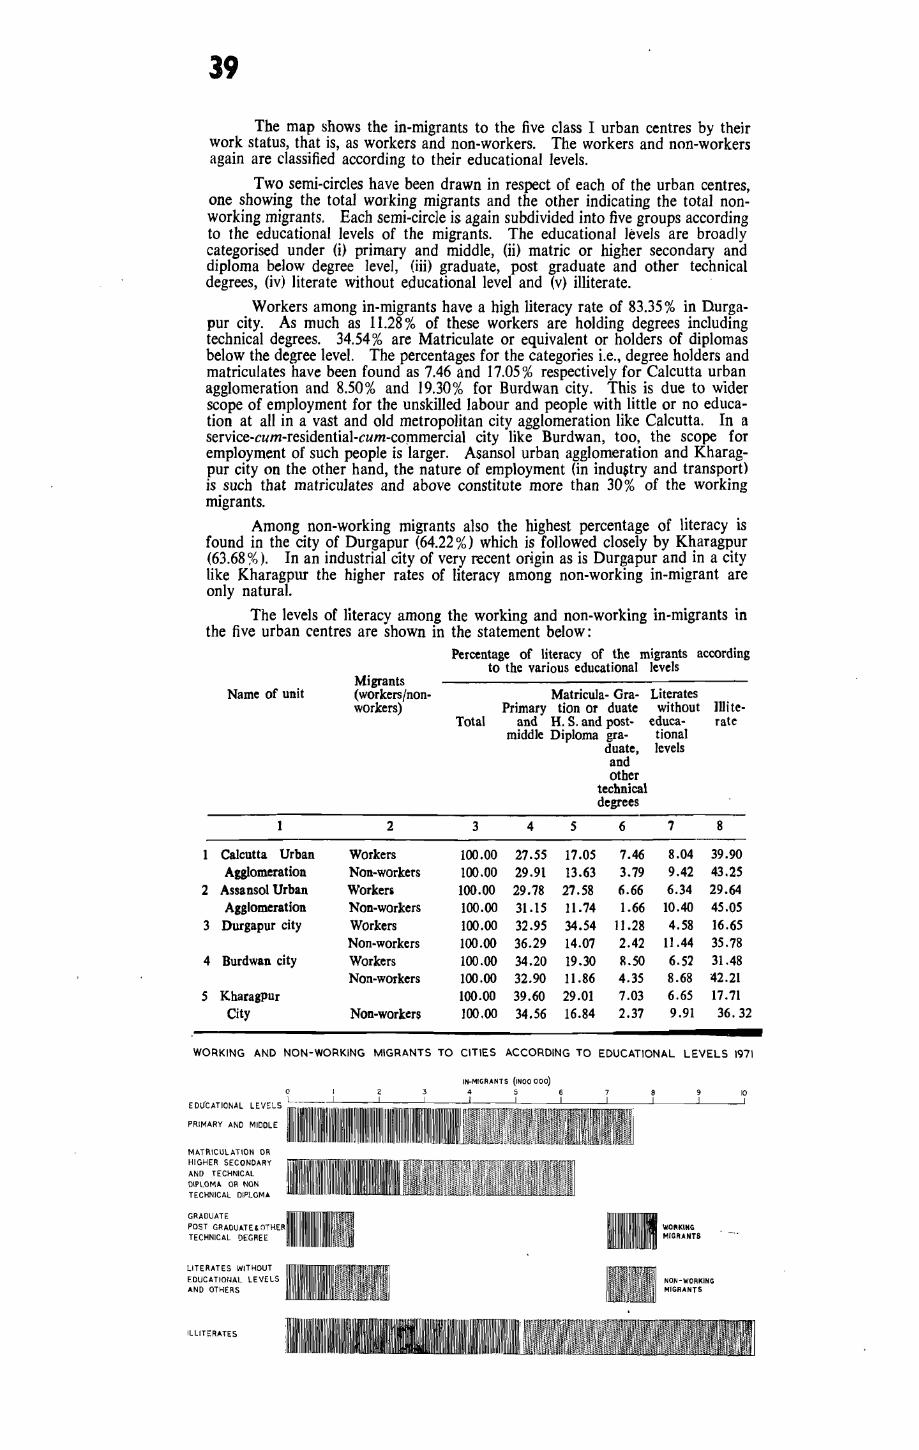
39
The map shows the in-migrants to the five class I urban centres by their work status, that is, as workers and non-workers. The workers and non-workers again are classified according to their educational levels.
Two semi-circles have been drawn in respect of each of the urban centres, one showing the total working migrants and the other indicating the total nonworking migrants. Each semi-circle is again subdivided into five groups according to the educational levels of the migrants. The educational levels are broadly categorised under (i) primary and middle, (ii) matric or higher secondary and diploma below degree level, (iii) graduate, post graduate and other technical degrees, (iv) literate without educational level and (v) illiterate. .
Workers among in-migrants have a high literacy rate of 83.35 % in Durgapur city. As much as 1l.28 % of these workers are holding degrees including technical degrees. 34.54 % are Matriculate or equivalent or holders of diplomas below the degree level. The percentages for the categories i.e., degree holders and matriculates have been found as 7.46 and 17.05 % respectively for Calcutta urban agglomeration and 8.50% and 19.30% for Burdwan city. This is due to wider scope of employment for the unskilled labour and people with little or no education at all in a vast and old metropolitan city agglomeration like Calcutta. In a service-cum-residential-cum-commercial city like Burdwan, too, the scope for employment of such people is larger. Asansol urban agglomeration and Kharagpur city on the other hand, the nature of employment (in indu~try and transport) is such that matriculates and above constitute more than 30 % of the working migrants.
Among non-working migrants also the highest percentage of literacy is found in the city of Durgapur (64.22%) which is followed closely by Kharagpur (63.68 %). In an industrial city of very recent origin as is Durgapur and in a city like Kharagpur the higher rates of literacy among non-working in-migrant are only natural.
The levels of literacy among the working and non-working in-migrants in the five urban centres are shown in the statement below:
Percentage of literacy of the migrants according to the various educational levels
Migrants Name of unit (workers/non- Matricula- Gra- Literates
workers) Primary tion or duate without I1lite-Total and H. S. and post- educa- rate
middle Diploma gra- tional duate, levels and other
technical degrees
1 2 3 4 5 6 7 8
1 Calcutta Urban Workers 100.00 27.55 17.05 7.46 8.04 39.90 Agglomeration Non-workers 100.00 29.91 13.63 3.79 9.42 43.25
2 Assansol Urban Worken 100.00 29.78 27.58 6.66 6.34 29.64 Agglomeration Non-workers 100.00 31.15 11.74 1.66 10.40 45.05
3 Durgapur city Workers 100.00 32.95 34.54 11.28 4.58 16.65 Non-workers 100.00 36.29 14.07 2.42 11.44 35.78
4 Burdwan city Workers 100.00 34.20 19.30 R.50 6.52 31.48 Non-workers 100.00 32.90 11.86 4.35 8.68 42.21
5 Kharagpur 100.00 39.60 29.01 7.03 6.65 17.71 City Non-workers 100,00 34.56 16.84 2.37 9.91 36.32
WORKING AND NON-WORKING MIGRANTS TO CITIES ACCORDING TO EDUCATIONAL LEVELS 1971
PRIMARY AND MIDDLE
MATRICULATION DR HIGHER SECONDARY AND TECHNICAL DIPLOMA OR NON TECHNICAL DIPLOMA
GRADUATE POST GRADUATE& ()T
TECHNICAL DEGREE
LITERATES WITHOUT EDUCATIotJAL LEVELS AND OTHERS
ILLITERATES
3
IN-MIGRANTS (INOO 000)
4 5 9
WOIII<ING MIGRANTS
10
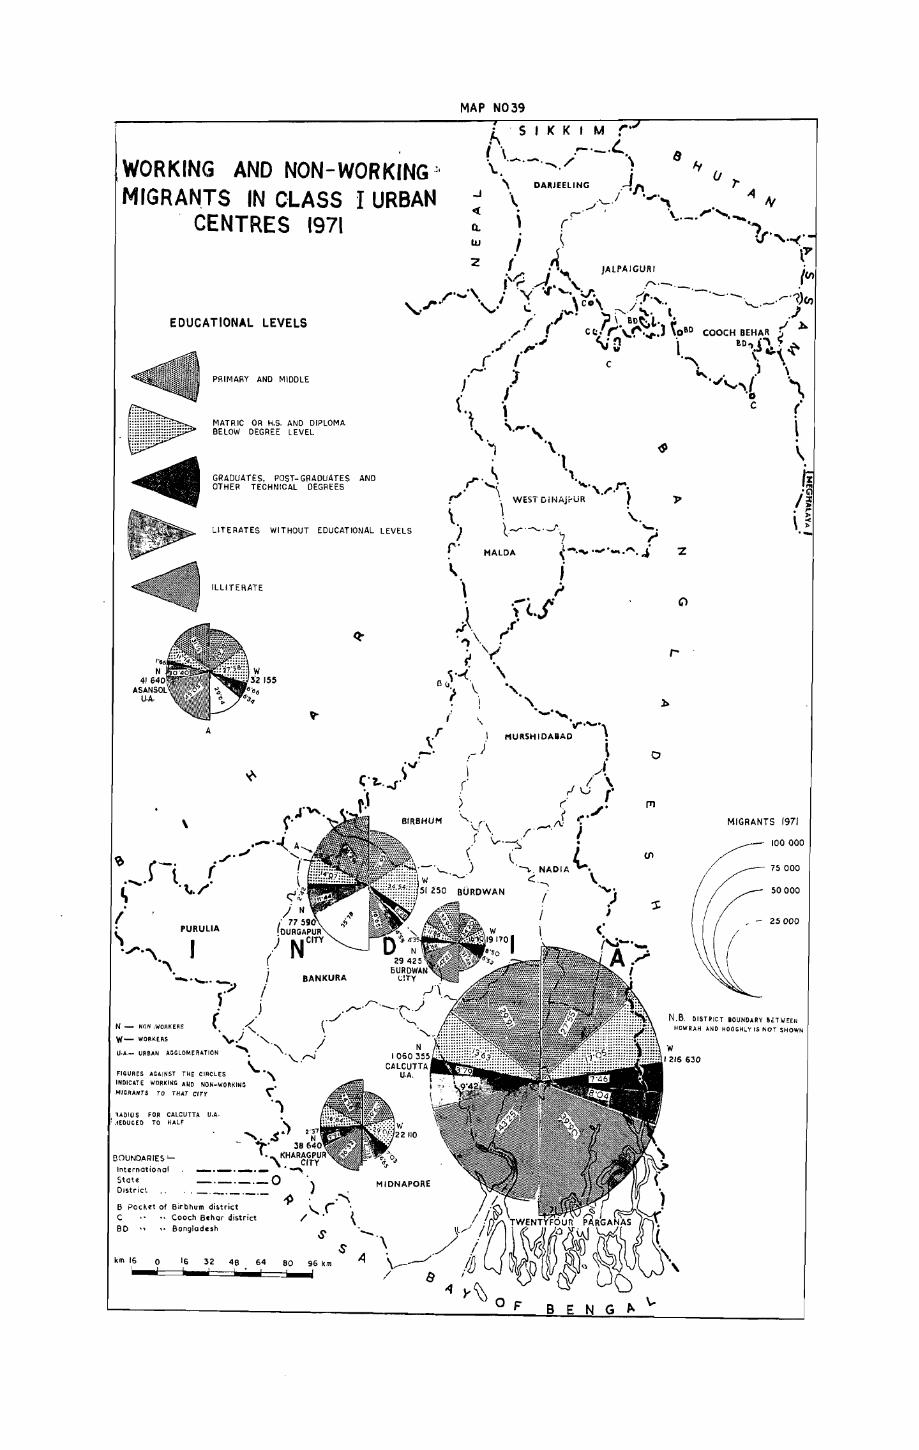
MAP N039
~ S I K KIM r'
WORKING AND NON-WORKING:' MfGRA~TS IN CLASS I URBAN
CENTRES 1971
; "' ....... _.L.. lJ L ......... -. / \ '7 \....... . lJ
" DARJEELING ~~ .,. AI ..J \. .... ./'\~/ ...... '" ,....... Iv : \ (: \_._. . ...... '-") ..
lU • ( \/",.-('
EDUCATIONAL LEVELS
PRIMARY AND MIDDLE
MATRIC OR H.S. AND DIPLOMA BELOW DEGREE LEVEL
GRADUATES. POST-GRADUATES AND OTHER TECHNICAL DEGREES
I . ~ . A ' l . " JAlPAIGURI ,'(/)
J'~ A. "".-.._ . / .... ;\ ·'V'of '-. V". ,..;,. .-._._. _ . ...-·1)en .r \ .. I. \co\ j' ,., ""__' . .1
" ...... \.. I''''' ~:"'.,." l ,:. r. \ 81l~L, .. ,I ~ I'" . ( c c:. r\ .. t.'.~J \~I\D COOCH BEH~R <
,,'." \i n \ I!.D~ 1'\· .~ ." .1" " . \ ~,'\' rIc '"\ ) \
,''_' .'J ""'J'"" ( '"" . J '0 "
l't ) C (\' " '\,"",
z
. '\ ~ \ 'j '1 ... L "
"." "'\ ,
,.,' ...... \ WEST DiI.jAJi'U~·'\·~·r). . \ \. ,. LITERATES WITHOUT EDUCATIONAL LEVELS ) t_"'· ___ ·J'7 '?
ILLITERATE
A
\
PURULIA
I _._o-..,
155
I I
BANKURA
r' MALDA {-.~ '_"'_," • .i
" I '\ ~ \ ',1..)
,:r\ .f' . \ f' "). .
• \..1 r .~
l'-'(_'. \ fl (\ \ "
r ',\
l r
\'
._ ....... '.,..",.,
I I1U RSH IOAIiAO ,
!-;' t \
\ ... J ( !0' \ . . f ) ~ ~'
r-'
\.. ( ~' BIRBHUM "r /\.: '
" \. 1"-' I \r.~ •
(~ NADIA t, t:::_ \
, '", ,J I
) . /"-,.r-._.,,./ ( ,,/ (.J ."" ......
r N - NON ,WORKERS • j '-. \ " w- WORKERS \'."""'. j '~mmm\Hl)!0 U·A.- URBAN AGGLOMERATION ""',- "'. \... ./"'oJ'
FIGURES AGAINST THE CIRCLES ."
INDICATE WORKING AWD NON-WORKING , MIGRANTS TO THAT CtTY ,
.)
"" . .$:) 1':' 38
'ADIU S FOR CALCUTTA U.A· ~ ,tEDUCED TO HALF
BOUNDARIES ~ International Stat.
0, _._.---.- .~,
_·_·_.-0 District " ,,_._._._._ 1) B Pocket of Birbhum diHrict C .. Coach Bchor district BO " .. Bangladesh
km 16 o 16 32 48 64 80 96 km
MIONAPORE
o
o F BEN G ,.. \,.
z
MIGRANTS 1971
~ /
100 000
75000
50 000
N.B. DISTRICT BOUNDARY BOTWEEN HOWRAH A.NO HOOGHL.Y IS NOT SHOWN

The map shows the working in-migrants by sex and classified according to the industrial categories of workers for the districts.
The total number of ir-migrants ill each category of woders for the two sexes hose been shown by bars drawn horizontally for each district. Two scales, one showing the absolute numbers and another showing the percentages, have been used. Difft"eDl types of screens have also been used for the nine categories ot workers as indicated in the' legend of the I.lap.
The pattern of dlstribution of the male working migrants under the nine categories follows the pattern of the total working force in most districts, the exceptions being the districts like Calcutta, 24 Parganas, Howrah and Burdwan. The pro{'Ortion of cultivators among the in-migrant workers is naturally quite large in the predominantly agricultural <fistricts of NorJt Bengal and Western Bengal. The highest percentage of in-migrants being employed as culti"ator is in Cooch Behar (69.46%), In Birbhum the proportion of agricultural labour among the working in-migrant.> is as big as 33.31 %. About a fourth of the workers among
the male in-mtgrants in ]alpaiguri was engaged in plantations etc.. (Cah.>goty flU. This is only natural, for it is well-known that plantations of the district have attracted migrants frol.l outside for long. In Burdwan as much as 21.53% or one in every 5 working in·migrants i engaged in mining and quarrying etc. K ~tegory IV) whieh is an attraction of Burdwan for inmigrants. As expected, manufacturing and precessing (Category V) accounts for almost half (47.041» of the male workers among in-migrants in How-ab. The highest proportions of the in-migrant workers iL the other industrial categories viz.. VI-COnstruction, VII -Trade and Commen:e, VIII-Transport, Storage and Communication and IX-Otl1er services for any district are observed in Murshidabad (3.86%), Calcutta (2S.55%), Calcutta (16.38%) and Darjeeling (30.40%} re..'"peCtively. Trade and Commerce and Transport etc._ together account for 45% of the working migrants in Caleutta which indicates the pattern of migration' to the city district
The districts with the highest .percentage of male working in-migrants in each of the nine categories of workers are shown below:
Categories of workers -------------------------------------
Couch Behar (S9.46%)
II
2
Birbhum
(33.31%>
IU
3
]aJpaigwi (24.t~/.)
IV
" Burdwan (21.53%)
v 5
Howrah (47.04%)
Categories of workers
VI
6
Murshidabad (3.86%)
VII
7
Calcutta (28_55"/.)
Among female working migrants employment as agricultural labour is found to be the I-jghest in Bankura, as much as 69.4& % of them being employed in the industrial category. In Jalpaiguri 78.62% of the workers among in-rnigram" Jre working in plantations etc. (Category III). Four OI,t of every five working female migrants in Calcutta ;,re engaged in category
VIII
8
Calcutta (16.3S%)
IX
9
Datjeeling (30.40%)
IX -other services. It is also interesting to observe that 5.gg % of the. working females among migrants are working in trade and commerce in Calcutta A statement for the nine categories in respect of fema!es is given below "howing the highest percentages for any district
Categories of workers
DaJjeeling (28.95%)
VI
6
D3Ijcc1ing Twentyf"oar Parganas
(OS1°/.)
&..!.!:t RESIDENCE
RURAL
URB/.N
UNCLASSIFIED
n 2
Bankura (69.48%)
IU
3
JaJpaiguri (78.62%)
Categ.Jries of wor~ers .
VII
7
Calcutta (5.88%)
hi
4
Burdwan (5.41%)
VIII
8
Howrah (5.96%)
v 5
Murshidabad (33.65%)
IX
9
Calcutta (81.83%)
CLASSIFICATION OF WORKING MIGRANTS 1971
(IN 000(0)
-Pr •• MARY S£CONDAftY TfRTIAftY

CLASSIFICATION OF WORKING MIGRANTS
1971
I' rUL TIVATflRS
II AGRICULTURAL LABOURERS. PR,MARY
1
111 LIVESTOCK FORESTRY FI$HING I-IUf\'TING &. PLANTATlfJNS
ORCHARDS &. AlUED ACTIVITIE~
,IV MINING & QUARRYING.
S£COI~OAFl:Y \
V MANCFACTURING tlROCES$ING StRVIC1NG & REPAIRS
1 VI CONSTRUCTION
TE1HIARY LI { Vir TRADE &. COMMERCE.
vln TR.ANSPORT STORAGE & COMMUNICAriONS.
IX' OTHER SE.RVICES
M -MALE
F -F(MA.E
\
.. _._._._ ~ Int.,national .. State " Dist,ict , .. .,. __ . _o_ '_'_ B Pocket Of Birbhum district C " Coach Bchor district BD " .. Bangladesh
/
o 16 32 48 80 96 km
40
\. I
r'
MAP NO 40
« a.. LU
BEN G A L

41
The map shows the percentage of workers and non-workers by sex to total population of each district in 1971. It also depicts the participation rare for all the districts of the state.
The percentages of workers to total popUlation have been calculated at the district level and the 16 districts are hatched in various grades as shown in the legend of the map. The pie-chart in each district shows the percentage of workers and non-workers to total population. The non-shaded portion in the circle represents non-working population of the district.
A bar diagram showing the figures at the state level is also shown in the map.
Ca1cutta had the distinction of recording the highest percentage of workers to total population (37.0%). Darjeeling is not far behind with a percenta~e of 36.1 which is largely due to larger participation of females in the working force. The hill district had, in fact, the highest percentage of female workers 00.1 %) for all districts. The highly urbanised area of Howrah, on the other nand, had the 10west percentage of 0.6 only.
. The proportions of female workers to total population of the remaining districts have not even reached 5 % in any district. At its highest (besides DarjeeIing) the percentage is 4.7 in Jalpaiguri. In 24-Parganas and Coach Behar it is below 1 %, the exact figures being 0.9% and 0.8 % respectively. '
Percentage Percentage of workers of workers
State/District to total State/Distict to total population population
WEST BENGAL 27.9 Maida 27.1 Calcutta 37.0 Hooghly 27.0 Darjeeling 36.1 Midnapore 26.7 Jalpaiguri 31.1 Howrah 26.6 Purulia 31.1
Birbhum 26.6 Bankura 28.3 West Dinajpur 28.0 Murshidabad 25.9
Burdwan 27.9 wentyfour Parganas 25.9
Cooch Behar 27.6 Nadia. 24.8
H RCENTAGE
AREA lllllllllllillallllllllllllllllirlillill/llllillmir o 15·68 22'56 64·79 B3·93 67·85
PERCENTAG E
rom WMKERS lllllllllllllrf.llllllllllllllllllll!1 [I I I I I 1,1 11[11~'1 roo o 24-91 30·66 55·0a 8a.69 IIB'16 123'69
(IN 00000 )

WORKERS AND NON-WORKERS
1971
PERCENTAGE OF
WORKERS TO TOTAL POPULATION
• • · · · · ·
~
• • D · · ·
\
BOUNDARIES;'-
30'1 AND ABOVE
28'1 - 30'0
SA: 27·9
27·1 _ 28·0
26·1 -- 2H)
25'1 - 26'0
25·0 AND BELOW
International .. , ..... _"'_..,._._ State ........... , ...... _._._._ Oistrict ............... _._._._._
B Pocket of Bir bhum district C " Cooch Behar district BO .. .. Bangladesh
km 16 0 16 32 48 64 80 96 km
MAP NO 41
S I K KIM
2
11 It (J .,.
TOTAL POPULATION 1971 ·B 500 000 & ABOVE
·-5500000
'·-4500000
._·2500000 r-.. ----I 500 000
~ • ""500 000
FIGURES AT THE TOP OF THE CIRCLES INDICATE TOTAL POPULATION
FIGURES AGAINST THE SECTORS INDICATE THE PERCENTAGE OF MALE (M) AND FEMALE (1')
-FEMALE

42
The map depicts the workers and non-workers by sex in the rural population of each district.
The districts have been hatched from high to low grades according to the percentage of workers to total rural population. Circles have been drawn proportionate to total rural population of the districts to show the percentage figures with the help of pie-diagrams. The diagrams show the working and non-working population by sex. The unshaded area in a circle indicates the non-workers of the district.
Leaving aside the city district of Calcutta the percentage of workers to total rural popularion is found to be the highest in Darjeeling (38.1 %). Purulia comes next with a figure of 31.6 % . The percentage of female workers to total rural population in the two districts are 12.3 % and 4.8 % respectively. Participation of females in the hill district is high and it is higher in its rural areas.
The state average percentage of workers to total rural population is 27.2n;~ which cuts the 15 districts into two halves comprising of 8 districts in the upper half and the rest in the lower.
The districts having rural areas are arranged below in the descending ordeI of participation of females in the working force.
Percentage Percentage of workers of workers
State/District to total State/District to total rural po- rural po-pulatifln pulation
WEST BENGAL. 27.2 MaIda 27.2
Darjeeling 38.1 Midnapore • 26.8
Purulia 31.6 Birbhum 26.7
Jalpaiguri 31.5 Booghly 26.2
Bankura 28.6 Murshidabad 26.0
West Dinajpur 28.4 Twent~four Parganas 25.3
Burdwan 28.0 Nadia. 25.0
Cooch Behar . 27.7 Howrah 23.5
P EIICEHT,6,G E
AREA Imlmmlilililil:I:!:'.'1111111111111111'11111111111ImT o 15'40 27·~7 4)015 7~4 80.7]1 85.90'
(IN 000 klft Z ) . ,
PERCENTAGE
RUAAL WORKERS ~llIIlIllil!I!I .• '[ 11111111111111 rfff 11111111111111'1": ! ! r o 1I'9~ u-o"" 3&-39 6t9S ~B2;S3 90-66
~N coooo) ..

RURAL ~/ORKERS NON-WORKERS AND I
197
F WORKERS PERCENTAGE °L POPULATION TO TOTAL RURA .
• 25·1 - 26·0
0···· · .... . · .... . · .... .
nd 8~low 25·0 a 'r
: BOUNDA~IES; .. _._._._ Internatlona ..... _._._.= State ............... _._._._ District ........ ' .
a. llJ
r·
WEST BENGAL
(\lOT TO SCALE)
POPULATION TOTAL RURAL 5 500_l.-vO A'IL 71~ABOVC. 19 . 50000)0 :t _ ~
/'
1/ ~ 4000000
( 3000000
M -"!ALE F - FEMALE
district ~
Pocket of Birbh:~'hor district.., BEN GAL
B "Cooc h :~~::::_------~~~ __ _!_~~..::..:o.... __
~D :: .. Bongladcs 64 80 96 km
~_~~16~~32~4~8::~~:: km I~ 0
I I
---_j
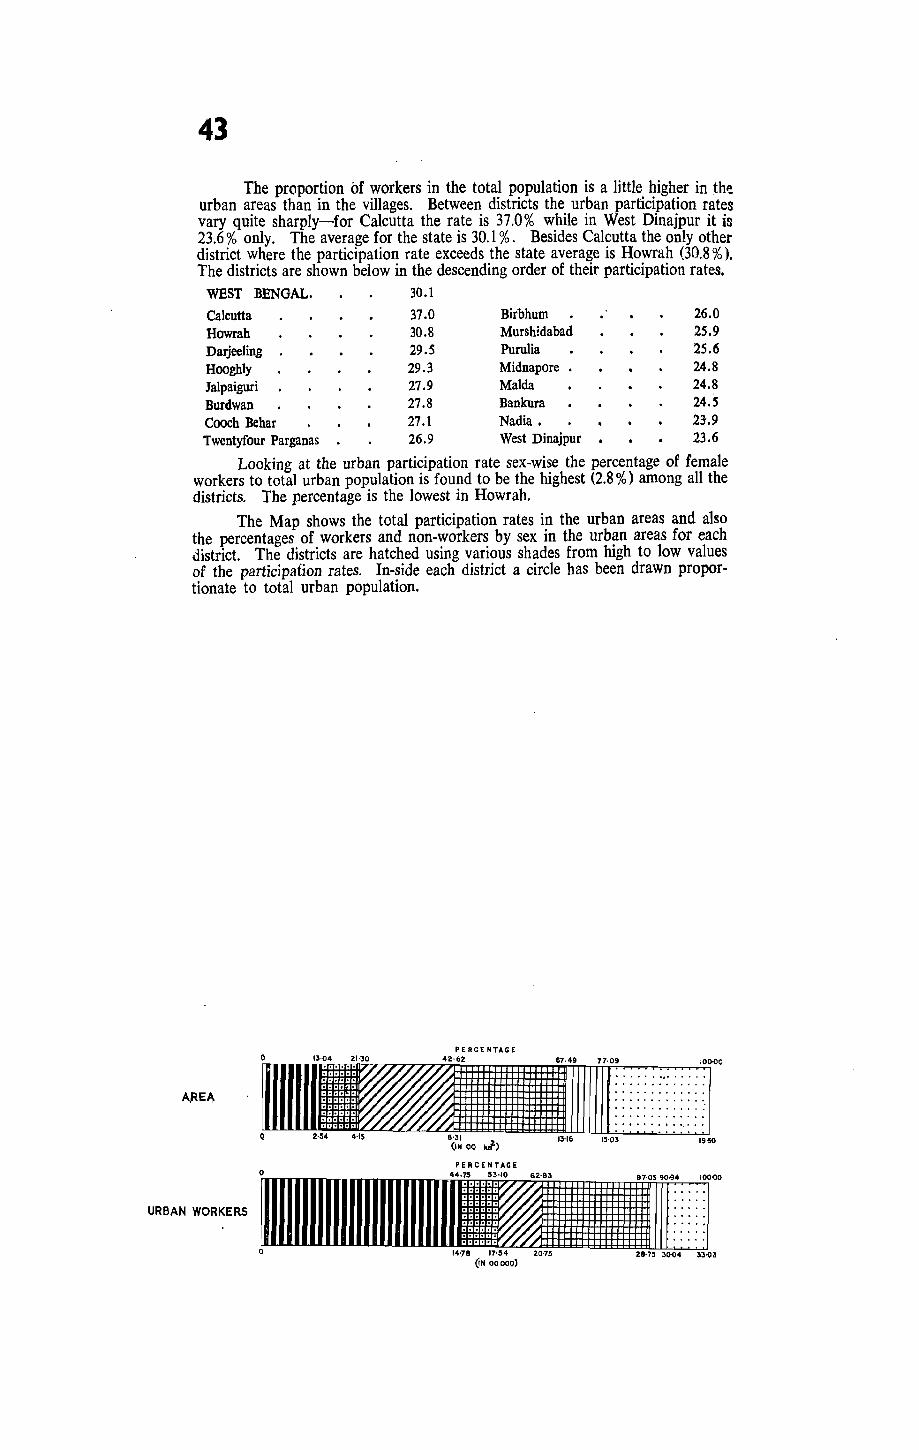
43
The proportion of workers in the total population is a little higher in the urban areas than in the villages. Between districts the urban participation rates vary quite sharply-for Calcutta the rate is 37.0% while in West Dinajpur it is 23.6 % only. The average for the state is 30.1 %. Besides Calcutta the only other district where the participation rate exceeds the state average is Howrah (30.8 %). The districts are shown below in the descending order of their participation rates.
WEST BENGAL. 30.1
Calcutta 31.0 Birbhum 26.0 Howrah 30.8 Murshidabad 25.9 Darjeeling 29.5 Purulia 25.6 Hooghly 29.3 Midnapore • 24.8 Jalpaiguri 21.9 Malda 24.8 Burdwan 27.8 Bankura 24. S Cooch Behar 27.1 Nadia • 21.9 Twentyfour Parganas • 26.9 West Dinajpur • 23.6
Looking at the urban participation rate sex-wise the percentage of female workers to total urban population is found to be the highest (2.8 %) among all the districts. The percentage is the lowest in Howrah.
The Map shows the total participation rates in the urban areas and al~o the percentages of workers and non-workers by sex in the urban areas for each district. The districts are hatched using various shades from high to low values of the participation rates. In-side each district a circle has been drawn proportionate to total urban population.
PE CE NTAGE
~EA 1111"'1.1111I1I111I11I1I[111I1[[r':! iii i'i'!' ,"I' 8'31 , >. 13'16 15'03 19-50 (IN 00 kJIr)
PERCENTAGE
URBAN WORKE~ 111111111111111111111111111~11'1!1'~lllllllllllllll rr~ ~ .. iii r 1<\'78 17'54 20'75 28·75 3~4 33O()~
(iN 00000)
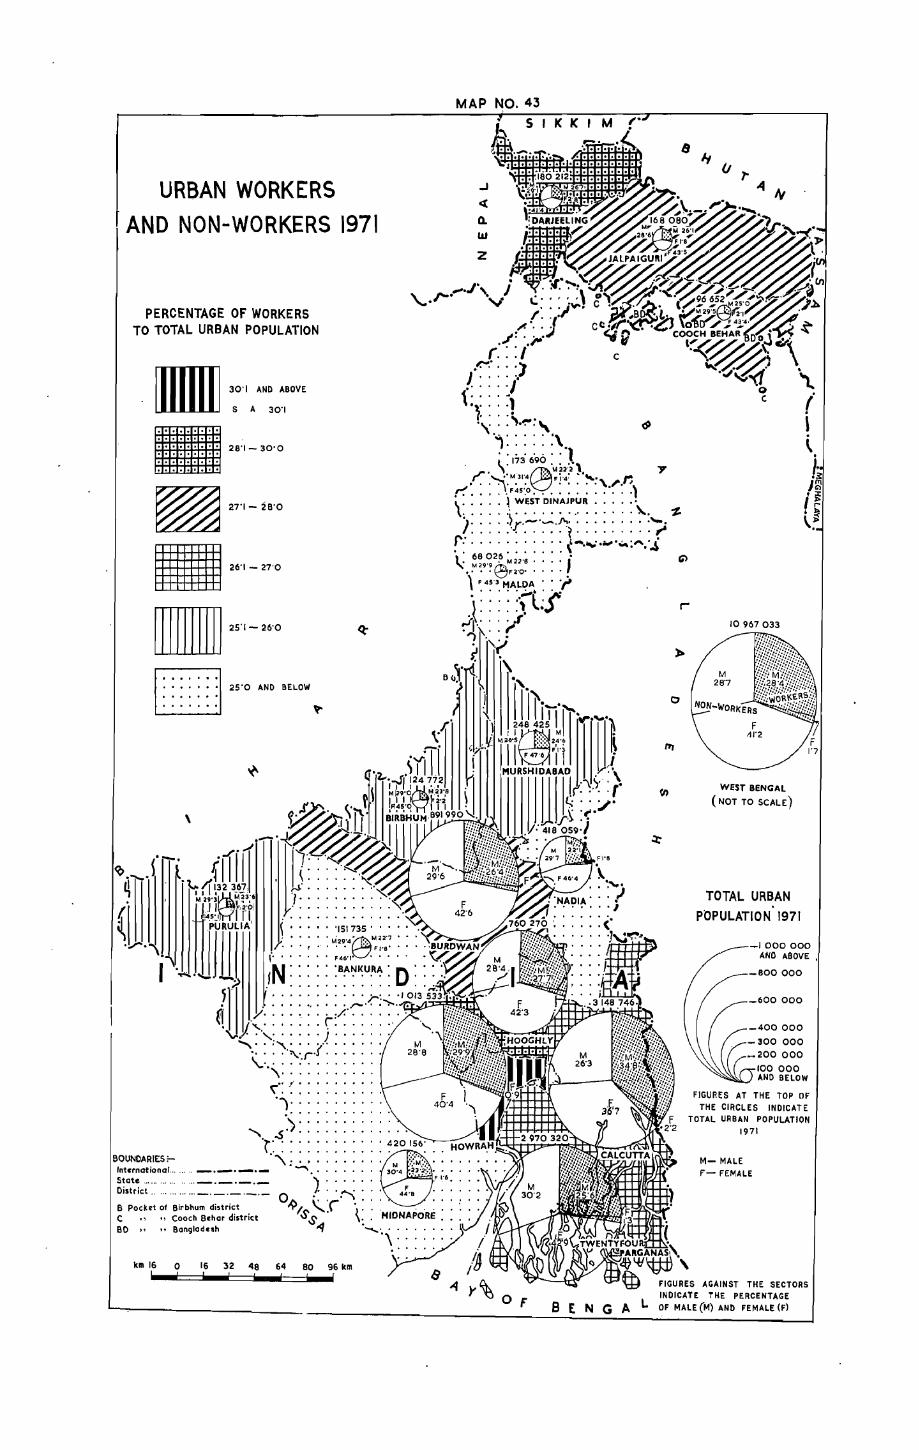
URBAN WORKERS
AND NON-WORKERS 1971
rITIllTl 30'1 AND ABOVE
llU1lU S A 30'1
28'1- 300 • . ,
.
.
~ 27"1-"·0
• "·,-,,.0
.".'-".0
<Q. __ J q
(L., I
\
BOUNOARIESi- ._._ InternationaL, " __ = __ ._ State ............ . Oistrict ........... .
. bhum district B Pocket Of Bir h Behar district , "Cooc C· Bangladesh eo " "
km 16 0 16 32 48 64 80 96 km
MAP NO. 43
S I
10967033
WEST BENGAL
(NOT TO SCALE)
TOTAL URBAN
POPULATION' 1971
-1000000 AND ABOVE,
_BOO 000
_600000
-400000
-300 000 _200 000
100000 AND BELOW
FIGURES AT THE TO~ OF
THE CIRCLES INDICATE L UR BAN POPULATION TOTA
1971
M- MALE
F'- FEMALE
GAINST THE SECTORS FIGURES A THE PERCENTAGE
L ~~D~:~: eM) AND FEMALE (F) BEN G A

44 The map shows the proportion of workers group to total male population
in the age group 15-59 at the police station level for the rural areas.
The percentages calculated at the police station Iev~I have been grouped into six ranges keeping the state average at the middle. Hatching has been done from deep to low according to higher percentages to lower. The entirely urban police stations are 'U' and kept blank.
The proportion of workers in the age group to total male population of the age group was 84.21 %. Variation between districts are not very sharp as the following statement will indicate.
State/District Percentage State/District Percentage
WEST BENGAL. 84.21
West Dinajpur 88.31 Twentyfour Parganas 84.52 Murshidabad 88.25 Burdwan 83.25 Maida. 87.63 Bankura 81.24 Cooch Behar 87.54 Hooghly 82.13 Purulia 97.27 Darjeeling 80.48 Birbhum 85.28 JaJpaiguri 87.65 Nadia. 84.63 Howrah 76.22 Midnapore 84.63
Looking at the situation at the police station level it will be seen that in only 27 of them (5 in Cooch Behar, 8 in West Dinajpur, 2 in Murshidabad, 5 in Twentyfour Parganas, 1 in Birbhum, 2 in Midnapore and 4 in Purulia) the proportions are in the range of "above 90.00%". The participation rate is found to be higher in those dreas of the State where agriculture is the principal means of livelihood, J S police stations are within the lowest range of "below 75.00%". These are led by Kumargram in Jalpaiguri district (54.38 %). Maynaguri (Dt. Jalpaiguri) and lore Bungalow (Dt. Darjeeling) are two other police stations in which the proportions are less than two thirds of the male population of their age-group,
In the rural areas which are within or adjacent to Calcutta Metropolitan Development Area the percentage of workers in the male population of the working age group are found to be considerably low.
AREA ~11111111111111111111111111r o 8'74 30'89
PERCENTAGE
(IN 000 km&)
PERCENTAGE
ON 00000)
: Illllllllllll~~~~r 4'03 4'35 69'9872"'40

RURAL MALE WORKERS IN AGE 15-59
197,1
CALCUTTA AND NEIGHBOURHOOD
kill 10 5 a
B pocket Of Blrbhum district C .. ,,!=ooch Behar district aD " "Bangladesh
til 16 0 16 32 48, 64 eo 96 km ! ! ! ! bmwJ f .. WId
MAP NO 44
Q.
I&J
r
o
rn
• U'I
L
15-59 II .0·0'. '"OV,
_ "·"-'000
~SA "'1.1 ~ 82'51 - 86'Z:S
II ,..,._" .. 75'01 -78'75

45
The map shows the proportion of workers in the total male population of the working age group (15-59) in the urban areas of the state at the police station level in the same manner as the preceding map presented for the rural areas.
The proportion of workers in the urban male population of the working age-group was 74.60% for the state. The districts are arranged below according to these percentages.
State/District
WEST BENGAL •
Calcutta • Ja]paiguri Howrah • Hooghly • Burdwan. Purulia . Darjeeling Birbhum • Murshidabad • Cooch Behar • Bankura • MaIda
Percentage of workers in total Urban mare population of age-group
IS-59 74.60 76.96 76.10 75.73 75.06 74.92 74.73 74.24 74.02 73.77 73.60 73.30 72.12
Twentyfour Parganas 72.01 Midnapore 71. 57 ~adia 70.61 West Dinajpur 70.32
There are 10 entirely urban police stations and 124 police stations having both rural and urban population besides 2 cities in the state. These units may be arranged according to the groups of the percentages as under:
Range (percent)
8S.01-above 80.01-85.00 75.01-80.00 70.01-75.00 65.01-70.00 65.00 & below
~urnber of police stations
5 21 39 43 25 3
The five police stations in the highest range are· Islampur and Karandighi in West Dinajpur, Farakka and Suti in Murshidabad and Sutahata in Midna· pore. Balurghat in West Dinajpur, Habra in Twentyfour Parganas and Midna, pore in Midnapore district are the three police stations in the lowest range.
ARI;A
URBAN MALE
WORKERS IN
02'26
00'44
o O'SA 1'65
PfRCENTAGE 22'24
4 4
AGE GROUP 15·59 'ttj;ij1W-WJLWlllillWJLilllliillLWilll~W'..L.L..£.LL.L.I.':...L.t...£J_~f'"'-'-'Z'iffiJZl l!;l'115 2'2$
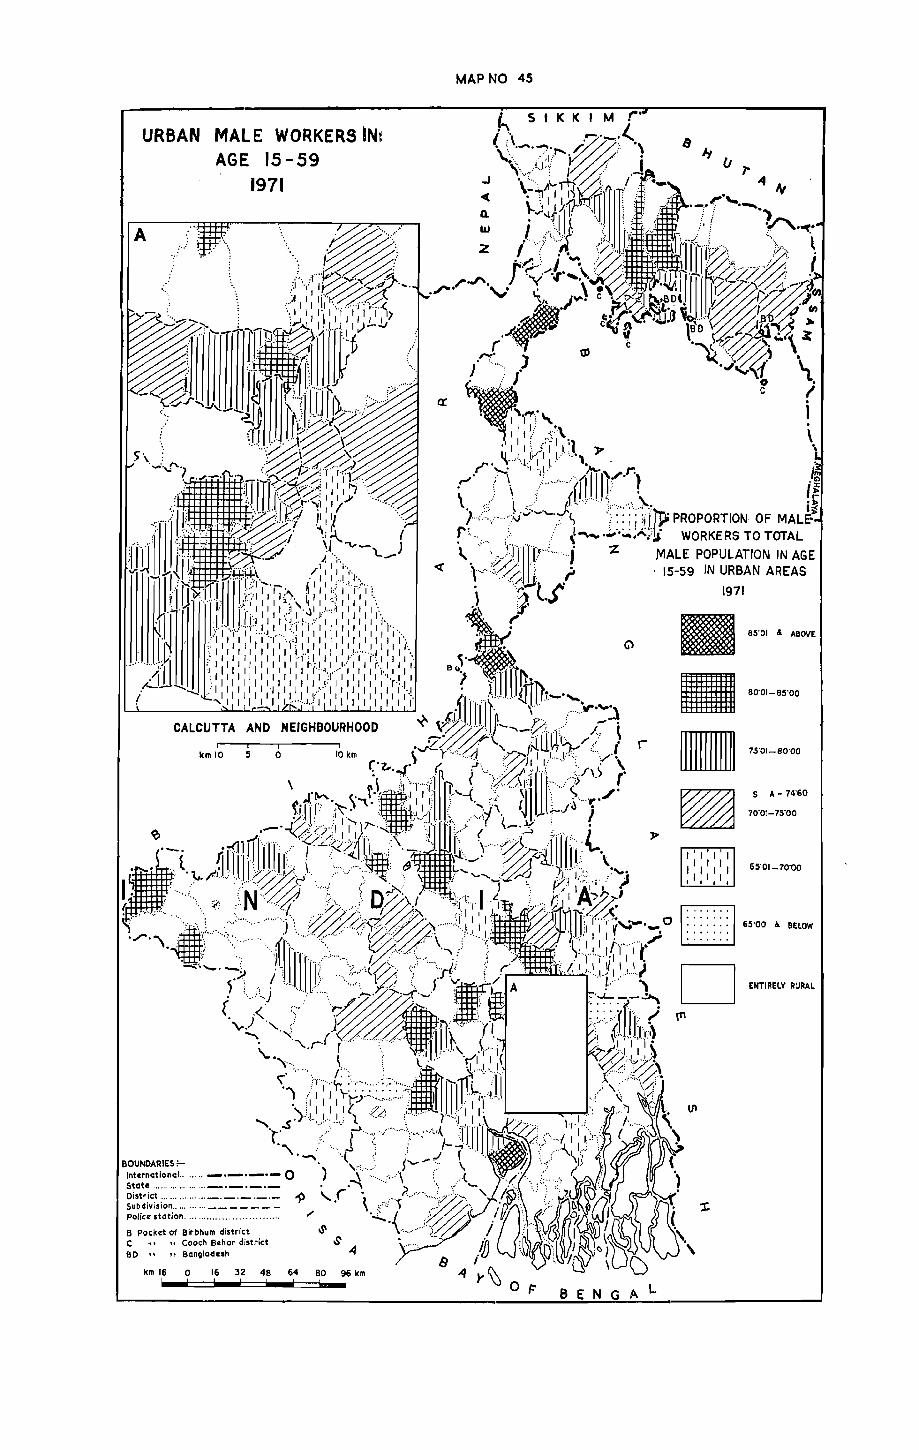
URBAN
A
MAL E WORKERS IN! AGE 15 -59
1971
MAP NO 45
• 80'01-85'00
• 75'01-80'00
S A - 74'60
70'01-75'00

46
This map shows the percentage of workers to total female popUlation in the age-group 15-59 in the rural areas of the state. The presentation is the same as in. maps 44 and 45.
There are 10 entirely urban police stations and 2 cities. The remaining police stations may be grouped as under according to the percentage values:
Range
25.01 & above 20.01-25.00
Number of pOlice stations
23 18
10.01-20.00 50 50.01-10.00 56 2.26- 5.00 64 2.25 & below 69
Female participation rates are generally, and quite appreciably high in the ,hill and plantation areas of Darjeeling and Jalpaiguri and also in the Western fringes of Midnapore and in Purulia and Bankura.
Participation rates among females of the age-group are shown below at the district level.
State/District
WEST BENGAL. Darjeeling Jalpaiguri Purulia Banlrura Burdwan Midnapore Hooghly
Participation rate of
rural females of age group 15-59
8.41 43.82 21.43 15.71 15.16 10.24 9.21 9.64
Birbhum MaIda
State/D istrict
West Dinajpur Murshidabad Nadia. Cooch Behar Twentyfour Parganas Howrah
Participation rate of rural femles of age
group 15-59
7.76 6.02 4.88 4.20 2.96 2.93 2.24 1.57
The trend is the sam,e at the police station level also. Out of 13 police stations of Darjeeling are within the highest range. The second range covers 18 police stations which are spread over the four districts of Darjeeling, Hooghly, Midnapore and Purulia.
Most of the police stations close to Calcutta and its surroundings and the police stations of Cooch Behar, Nadia and Murshidabad are within the lowest ranges of "2.26%-5.00%" and "2.25% & below".
o 10'01
AREA
o
PERCENTAGE
(IN oookmZ)
PERCENTAGE
(IN 0000)
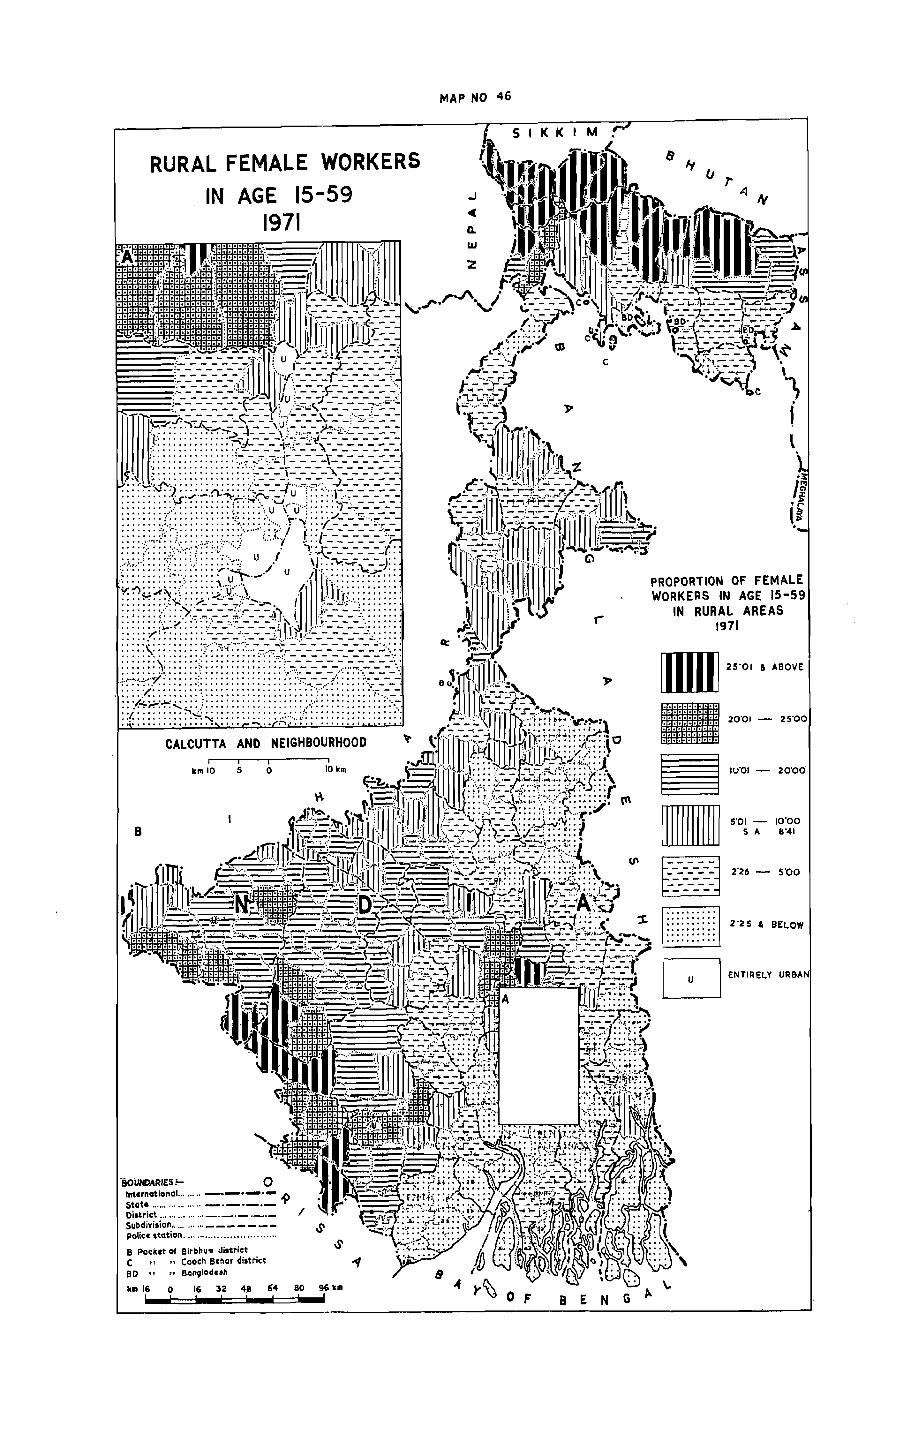
RURAL FEMALE WORKERS IN AGE 15-59
1971
CALCUTTA AND NEIGHBOURHOOD
km 10 5 o 10 kill
B
'BOUNDARIES:- 0 International ........ ~-.-.- 09 State .................. _._.-.-Oittrict ............... _._._._._ I Subdivision .......... _ - - _ - - -police station ............................. .
B Pocket Of Birbhum di.tric:t C " "Caoch Behar diltrict B 0 " "Banglodesh
~~ 0 ~ ~ ~ « 00 ~u
MAP NO 46
..J
C Q.
LtJ
s
r
o F BEN
lJ It (j
7"4 tv
\
PROPORTION OF FEMALE WORKERS IN AGE 15-59
IN RURAL AREAS 1911
[IIIIJl ,,·01 • ABOVE
II '0·01-'
~ IO~1 - '0"00
mmnrrn 5'01 - 10'00 ll.ll1UllllJ 5 A 8'41
D ,.,,- 5"00
D '."RELY OR
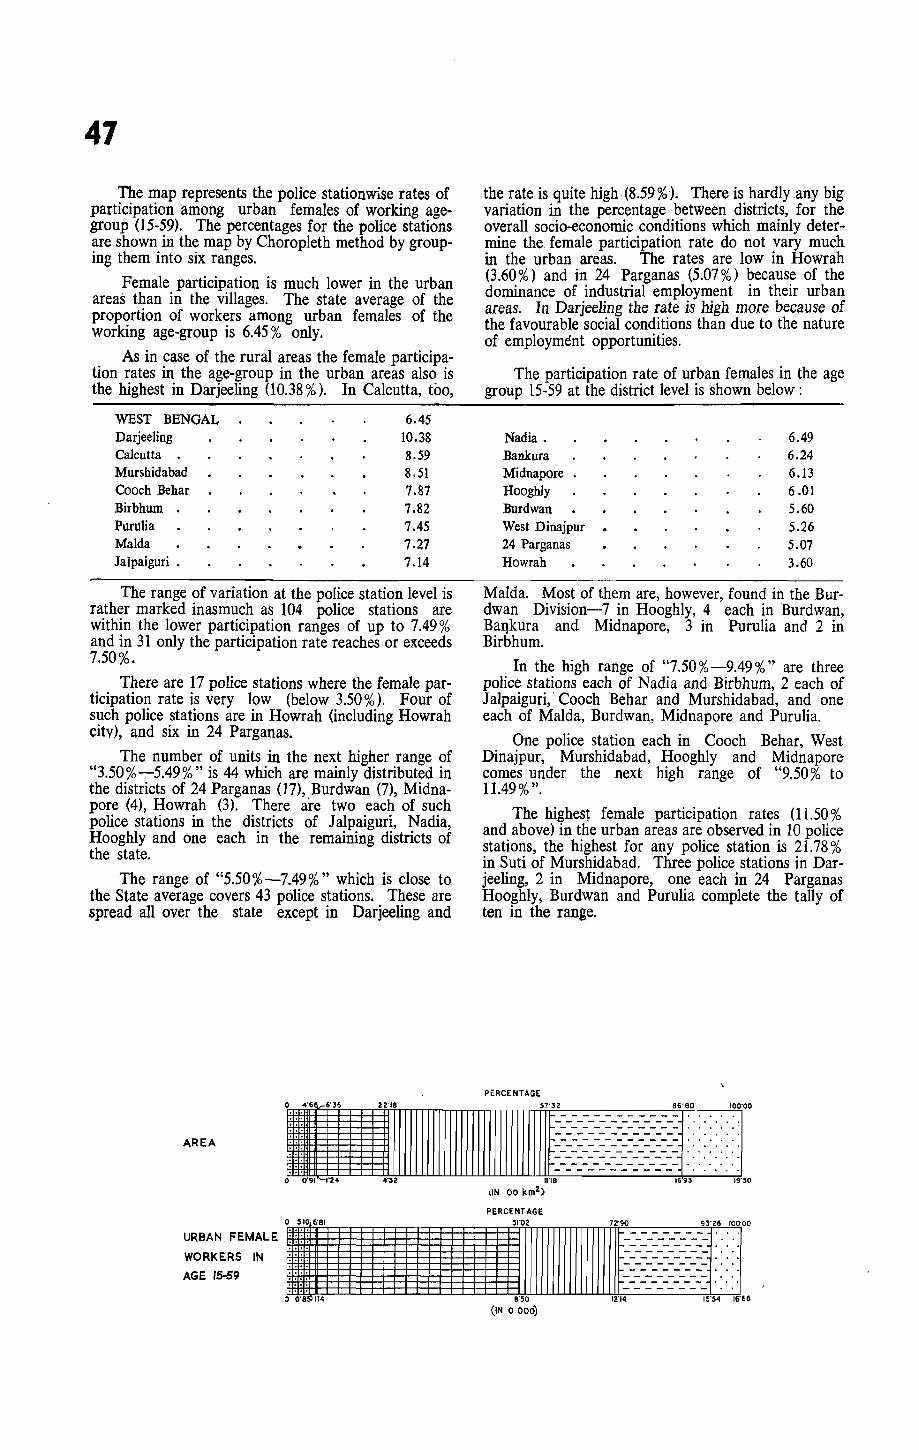
47 The map represents the police stationwise rates of
participation among urban females of working agegroup (15-59). The percentages for the police stations are shown in the map by Choropleth method by grouping them into six ranges.
Female participation is much lower in the urban areas than in the villages. The state average of the proportion of workers among urban females of the working age-group is 6.45% only.
As in case of the rural areas the female participation rates in the age-group in the urban areas also is the highest in Darjeeling (10.38 %). In Calcutta, too,
WEST BENGAL 6.45 Darjeeling 10.38 Calcutta . 8.59 Murshidabad 8.51 Cooch Behar 7.87 Birbhum 7.82 Purulia 7.45 MaIda 7.27 JaJpaiguri . 7.14
The range of variation at the police station level is rather marked inasmuch as 104 police stations are within the lower participation ranges of up to 7.49% and in 31 only the participation rate reaches or exceeds 7.50%.
There are 17 police stations where the female participation rate is very low (below 3.50 %). Four of such police stations are in Howrah (including Howrah city), and six in 24 Parganas.
The number of units in the next higher range of "3.50%-5.49%" is 44 which are mainly distributed in the districts of 24 Parganas (17), Burdwan (7), Midnapore (4), Howrah (3). There are two each of such police stations in the districts of Jalpaiguri, Nadia, Hooghly and one each in the remaining districts of the state.
The range of "5.50%-7.49%" which is close to the State average covers 43 police stations. These are spread all OVer the state except in Darjeeling and
the rate is quit~ high ,(8.59%). There is hardly any big variation in the percentage between districts, for the overall socio-economic conditions which mainly determine the female participation rate do not vary much in the urban areas. The rates are low in Howrah (3.60 %) and in 24 Parganas (5.07 %) because of the dominance of industrial employment in their urban areas. In Darjeeling the rate is high more because of the favourable social conditions than due to the nature of employment opportunities.
The participation rate of urban females in the age group 15-59 at the district level is shown below:
Nadia. 6.49 Bankura 6.24 Midnapore . 6.13 Hooghiy 6.01 Burdwan 5.60 West Dinajpur . 5.26 24 Parganas 5.07 Howrah 3.60
MaIda. Most of them are, however, found in the Burdwan Division-7 in Hooghly, 4 each in Burdwan, BaIlkura and Midnapore, 3 in Purulia and 2 in Birbhum.
In the high range of "7.50%-9.49%" are three police stations each of Nadia and Birbhum, 2 each of J alpaiguri, 'Cooch Behar and Murshidabad, and one each of MaIda, Burdwan, Midnapore and Purulia.
One police station each in Cooch Behar, West Dinajpur, Murshidabad, Hooghly and Midnapore comes under the next high range of "9.50% to 11.49% ".
The highest female participation rates (11.50 % and above) in the urban areas are observed in 10 police stations, the highest for any police station is 21.78 % in Suti of Murshidabad. Three police stations in Darjeeling, 2 in Midnapore, one each in 24 Parganas Hooghly, Burdwan and Purulia complete the tally of ten in the range.
PERCENTAGE
AREA 1111111'1111 'rl'[lllllllllllllllllllllllllrr~~-==-~-}- ~-~;=-r <: J o 0'91 1"24 4"32 InB 16'93 19'50
(IN 00 km2)
PERCENTAGE , '1" ""' "" "." ',",00
:?:;:rl~LE 1!IJ:lflllllllllllllllllll/IIIIIIIII/Ii///F--===~=~+ :/ ~ 0'8 1"14 8'50 12'14 15'54 16'66
(IN 0 000)

MAP NO 47
m "'0-'-"
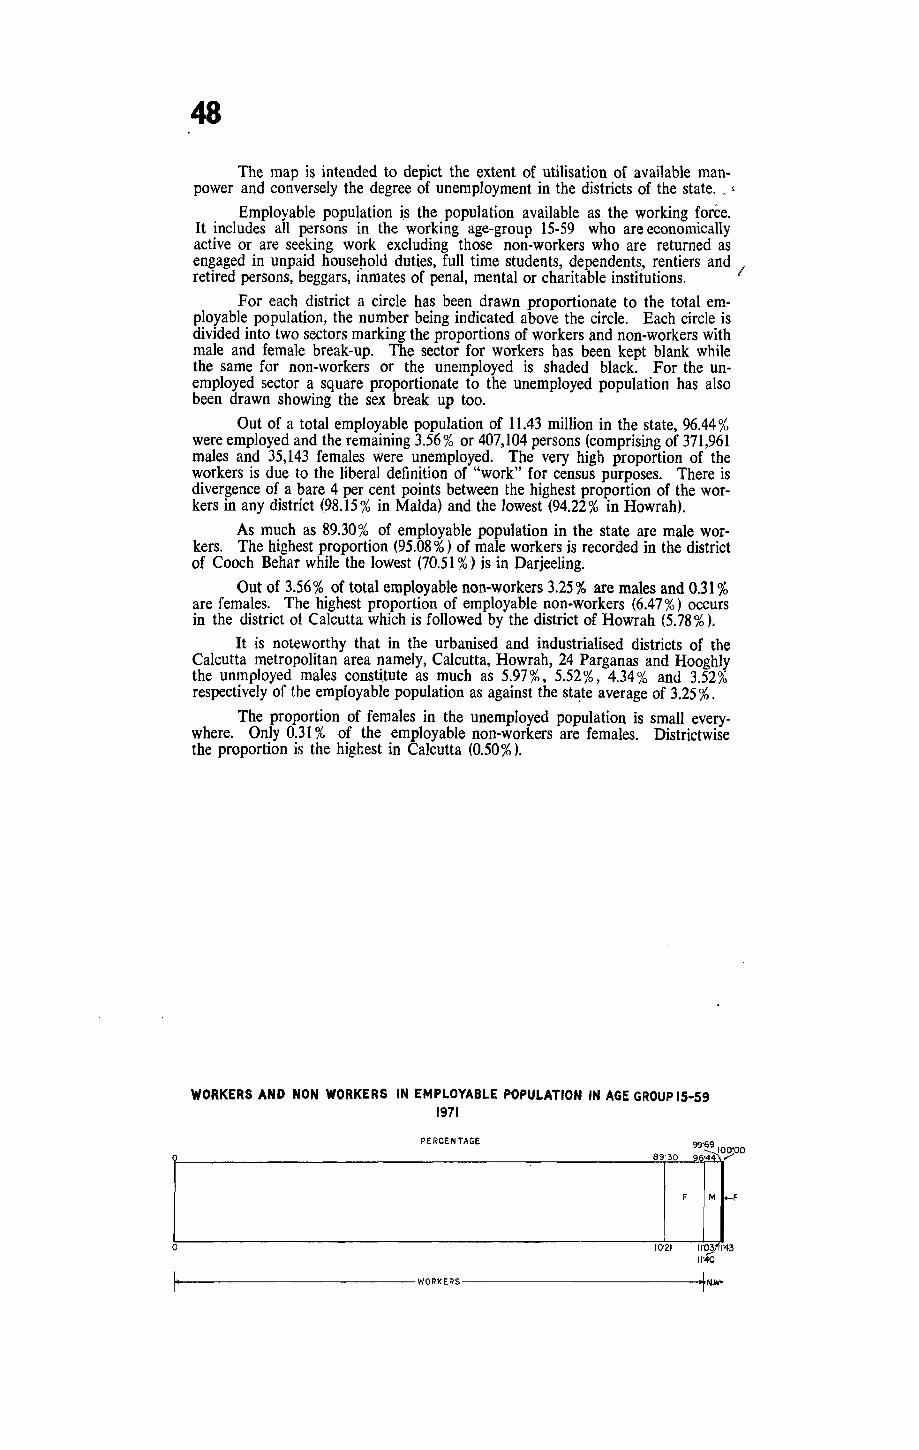
0
0
48
The map is intended to depict the extent of utilisation of available manpower and conversely the degree of unemployment in the districts of the state. ,. I
Employable population is the population available as the working force. It includes all persons in the working age-group 15-59 who are economically active or are seeking work excluding those non-workers who are returned as engaged in unpaid house~old duties, full time students, dependent~, rentiers and I retired persons, beggars, inmates of penal, mental or charitable institutions.
For each district a circle has been drawn proportionate to the total employable population, the number being indicated above the circle. Each circle is divided into two sectors marking the proportions of workers and non-workers with male and female break-up. The sector for workers has been kept blank while the same for non-workers or the unemployed is shaded black. For the unemployed sector a square proportionate to the unemployed population has also been drawn showing the sex break up too.
Out of a total employable population of 11.43 million in the state, 96.44 % were employed and the remaining 3.56% or 407,104 persons (comprising of 371,961 males and 35,143 females were unemployed. The very high proportion of the workers is due to the liberal definition of "work" for census purposes. There is divergence of a bare 4 per cent points between the highest proportion of the workers in any district (98.15 % in MaIda) and the lowest (94.22 % in Howrah).
As much as 89.30% of employable population in the state are male workers. The highest proportion (95.08 %) of male workers is recorded in the district of Cooch Behar while the lowest (70.51 %) is in Darjeeling.
Out of 3.56% of total employable non-workers 3.25% are males and 0.31 % are females. The highest proportion of employable non-workers (6.47%) occurs in the district of Calcutta which is followed by the district of Howrah (5.78 % ).
It is noteworthy that in the urbanised and industrialised districts of the Calcutta metropolitan area namely, Calcutta, Howrah, 24 Parganas and Hooghly the unmployed males consti.tute as much as 5.97%, 5.52%, 4.34% and 3.52% respectively of the employable population as against the st~te average of 3.25 %.
The proportion of females in the unemployed population is small everywhere. Only 0.31 % of the employable non-workers are females. Districtwise the proportion is the highest in Calcutta (0.50%).
WORKERS AND NON WORKERS IN EMPLOYABLE POPULATION IN AGE GROUP 15-59 1971
PERCEN TAGE
89·30
F
10'21
99'69 100'00 ~? 9E'
M ~ F
11'0/1'4 :3 11'40
..,_------------WORKERS-------------IN.w1
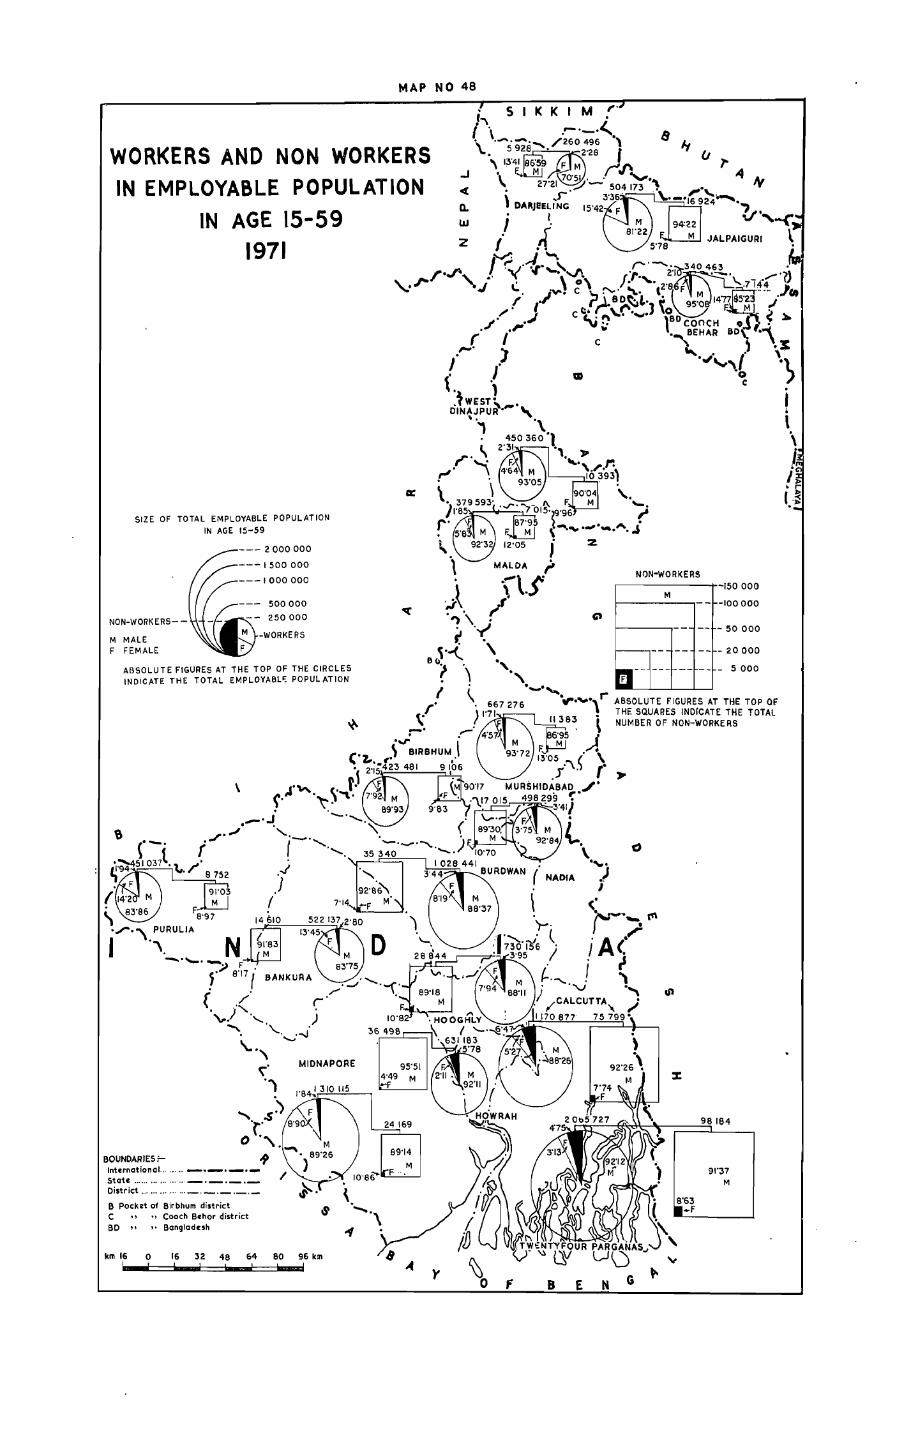
MAP NO 48
WORKERS AND NON WORKERS IN EMPLOYABLE POPULATION
IN AGE 15-59 1971
SIZE OF TOTAL EMPLOYABLE POPULATION
IN AGE 15-59
NON-WORK ERS-
M MALE F FEMALE
-- 2000000
-- 1500000
--1000000
500000
ERS
ABSOLUTE FIGURES AT THE TOP OF THE CIRCLES INDICATE THE TOTAL EMPLOYABL<: POPULATION
\
,..I ]
f 7'14 " 92'S6\
0 ,_/""'-C
,/" . r )
MIONAPORE
BOUNDARIES ;-
e Pocket of Birbhum district
" C " .. Cooch echor district eo " ,. 8angladesh
km 16 0 16 32 48 64 80 96 km
')
M
..J
« Q.
UJ
,.' 8 Iy
(J .,..
!\tON-WORKERS r-------+-~150 000
M -100000
-- - 50 000
-- - 20000
-- --- -- -- - 5 000
C)
NADIA
IS'
:c
98184
91'37 M
G t-8 E N

49
The map shows the percentage distribution of total workers at the district level by SClt and indu~trial categories.
For the purpose of this map the nine industrial categories are grouped into three sectors as under:
(a) Primary-I Cultivators.
11 Agricultural labourers. III Livestock, forestry, fishing, hunting and plantations, orchards and
allied activities. IV Mining and quarrying;
(b) Secondary-V Manufacturing, processing, servicing and repairs
(a) Household industry, (b) Other than household industry.
VI Construction; (c) Tertiary-
VII Trade & Commerce. VIII Transport, storage & communications.
IX Other services. In each district pyramidal diagrams have been drawn to show the number
of workers engaged. in each industrial category. The horizontal bars on the left hand side indicate the number of male workers and those on the right indicate the female workers. The industrial categories to which the bars relate are denoted by Roman figures inserted between two vertical lines in the middle of the diagram.
Except in the city district of Calcutta and in Howrah the primary sector claims a major part of the workers, especially the males, throughout the state. Cultivation is, in fact, the largest single industrial category for male workers. In some of the districts quite a number of females too, are engaged in this sector.
The secondary sector is important in the districts of 24 Parganas, Howrah, Hooghly, Ca1cutta and Burdwan. Fema1e participation rate is very low in this sector. The claim of the tertiary sector in the tota1 employment is next to the primary sector's. The sector occupies a very important position in the city idistrict of Ca1cutta.
About 62.30% of the workers in the state are engaged in primary activities. In the primary sector, again, 91.72% • of the workers are males. The absolute number of female workers in the sector comes to 6.38 lakh only. In nine of the 16 districts more than 75 % of the workers are engaged in primary activities. In Calcutta the proportion is 0.49% only.
The secondary sector engages 15.07% of the workers of the state. As much as 95.11 % of the secondary sector workers are males. It is remarkable that more than two-thirds (67.90%) of the workers in this sector have been enumerated in the district of Howrah, Calcutta, 24 Parganas and Hooghly. In the district of !towrah 35.87% and 25.16% respectively of male and female workers are engaged in category V.
In the state as a whole 22.63 % of the total workers are engaged in the tertiary sector. The proportions of male and female workers in tertiary activities are respectively 93.03 % and 6.97 % in the state. Nearly half of the total workers in the tertiary sector (46.18 %, to be precise) are engaged in category IX-other services of which 40.66 % are males and only 5.82 % are females. Not only the category IX occupies an important position in Calcutta the proportion of females to total workers in category IX is alsP the highest in the city district.

CLASSIFICATION OF MALE
AND FEMALE WORKERS 1971
INDUSTRIAL STRUCTURE 1971
I .. CULTIVATORS 11.. AGRICULTURAL LABOURERS III.. LIVESTOCK, FORESTRY, FISHING,
HUNTING AND PLANTATIONS, ORCHARDS So. ALLIED ACTIVITIES
o IV .. MINING & Q.UARflYING
V •. MANUfACT~RING, PROCESSING,
SERVICING & REPAIRS (a) HOUSHOLD INDUSTRY (b) OTHER THAN HOUSEHOLD INDUSTRY
VI •• CONSTRUCTION
VII .. TRADE & COMMERCE VIII.. TRANSPORT, STORAGE So.
COMMUNICATIONS
IX .. OTHER SERVICES
ABSOLUTE AND PERCENTAGE SHARE OF PERSONS IN DIFFERENT INDUSTRIAL CATEGORIES ARE SHOWN BY THE SCALE ABOVE AND BELOW THE BAR-DIAGRAM RESPECTIVELY
P. C. PERCENTAGE
BOUNDARIES ;-International .... , ... _.._ •. _._ Stat •.................. ___ ._._ District .. , .... , ....... _._._._._ B pocket 01 81rbhum district C .. ". Cooch Behar district BD " "8anliladuh
~~ 0 ~ ~ ~ " ~ ~U
IN 000 200 I~O 100
MAP NO 49
MALE
:;. t ~
" ~C. '"
,; ') \
OF
20 10
C/I
IV III II I ,.....,...,.
o 0 4080 P. c.
CALCUTTA

50
The map shows the economic activity of the rural population by sex and industrial categories in the districts of the state. The presentation is the same as in the preceding map.
The primary sector employs the great bulk of workers in the rural areas in all districts. Agriculture alone (that is, categories I and II taken together) claims more than three-fourths of the rural workers in the districts of Cooch Behar, West Dmajpur, Nadia, 24 Parganas, Murshidabad, Birbhum, Bankura, Midnapur and Purulia. In Darjeeling and J alpaiguri category III occupies an important place. Category IV is of great importance in the district of Burdwan. Cultivators (category I) constitute the majority of workers in "Agriculture" in all districts except 24 Parganas, Howrah, Burdwan and Birbhum where agricultural labour (category II) out-numbers the cultivators.
The secondary sector is rarely of any importance in the rural areas in any district except in a small way in Murshidabad, Nadia, 24 Parganas, Howrah, Hooghly and Burdwan. Household industries and small scale industries are of some prominance in these districts.
As the diagram in the map shows, category IX-Other services occupies a fairly important place in the tertiary sector in the districts especially for male workers. As much as 14.51 % of the rural male workers in Darjeeling are engaged in Other services which is the highest for any district. Participation of females in the tertiary sector is insignificant in most districts. In Howrah, however, more than a quarter (28.19%) of the female workers are found engaged in Other services. The proportion is quite high in Nadia (19.97%) and 24 Parganas (19.89%) also.
u
"
'£COHDA""
I - OARJEEUNG
2 - J"'LPAIGURI
3 - COOCH 8EHAR
4 - WEST OINAJPUR
, - MALOA
, - ,",UR$HIDAaAD
7 - NADIA
8 - TWENTVFOUR PARGANAS
9 - eURDWAN
10 - "laHUl<
JJ - 'ANKU'U
12 - MIDNAPOR£

INDUSTRIAL STRUCTURE OF RURAL POPULATION 1971
MAP NO 50
..J
« Q.
UJ
Z (::., ~, ~,~~~~,
P.C.40 30 ,,0.';10 ~~. .,SOP.C. SO 40 30 4.ct..I.~.O 0 90.
r·r, I 'V .., '-. :.A .I -._ ........ _. "..I"" ',,' ..: . \ CO\ '" r.r· ...... IN 000 IN 000 _JV'>" • ../ .....
300 2S0 200 'SO 100 SO a a 50 I' ,.r -;3 \ BD~I.. >-----I ~ • cc: J ,...... ".. )
IX ,'./ i.v n " ...... INDUSTRIAL STRUCTURE,1971
I ...... CULTIVATORS
k~T'T'7'~~1 il ...... AGRiCULTURAL LABOURERS
III ...... LIVESTOCK, FORESTRY, FISHING,
HUNTING AND PLANTATIONS,
ORCHARDS &. ALLIED ACTIVITIES
IV. .... MINING &. QUARRYING
V .. MANUFACTURING. PROCESSING,
SERVICING&. REPAIRS
(0) HOUSEHOLD IN DUSTRY
(P) OTHER THAN HOUSEHOLD INDUSTRY
VI . CONSTRUCTION
'''''''''''''''''''''''''''''' ..... 1 VII ..... TRADE &. COMMERCE VIIL .. TRANSPORT, STORAGE&.
COMMUNICATIONS
IX ...... OTHER SERVICES
ABSOLUTE AND PERCENTAGE SHARE OF PERSONS IN DIFFERENT INDUSTRIAL CATEGORIES ARE SHOW'" BY THE SCALE ABOVE AND 'BELOW THE BAR-DIAGRAM
RESPECTIVELY
P.C. PERCENTAGE
CALCUTTA DISTRICT - ENTIRELY URBAN
NO DIAGRAM IS SHOWN
\
IN 000 250 200 150 100
I I I I
P.C.
o~ eOUJlCARIES;- I' ..s' International ........ _._._._ ..s'
~~~ttr~c't : .... ::: ::'. :.: ::'. = =_:_~~= 'f e Pocket Of Blrbhum district C .. Cooch Behar district eo " "Bangilldesh
•• '6 0 16 32 4B
V)J1./ .r cV
\!II .I VI ]
FEMALE ~c.
.' , ~ , ...... , '\
40 30 20 10 0 Q 100 Poc.·, ~ l WEST DINA. JPUR
INOOO .... " , 200 ISO 100 ~o a 0 SO IN 000 '",. r:
,., r----i ,.,. • t • IX
\..
o
64 80 BE:NGA\..
"() .J~
FEMALE' .. ; ~ c:.~ ~
\ . "\ (' (
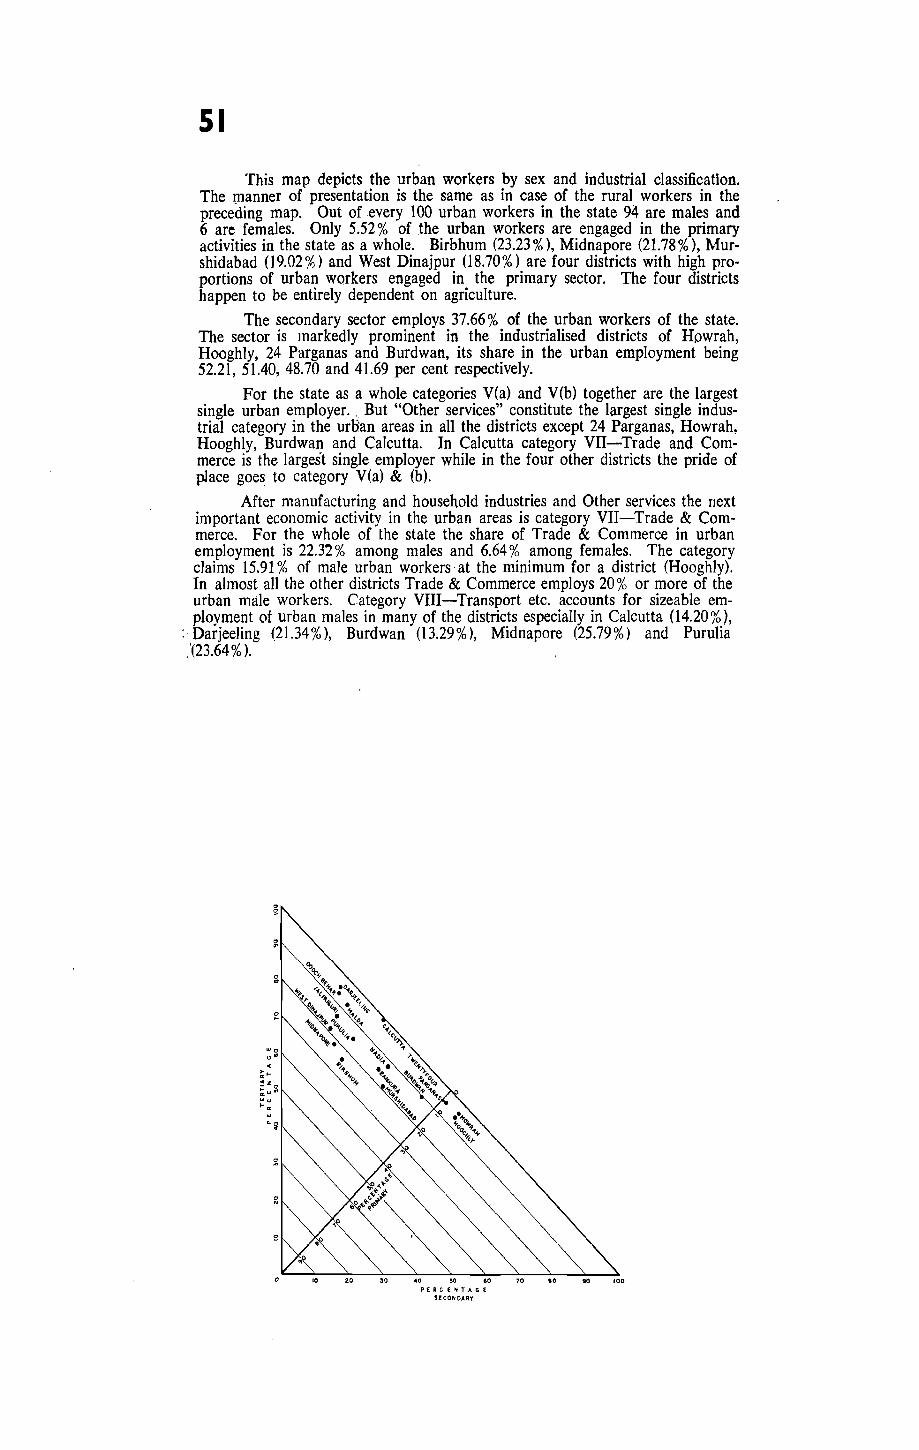
51
This map depicts the urban workers by sex and industrial classification. The tnanner of presentation is the same as in case of the rural workers in the preceding map. Out of every 100 urban workers in the state 94 are males and 6 are females. Only 5.52 % of the urban workers are engaged in the primary activities in the state as a whole. Birbhum (23.23 %), Midnapore (21.78 %), Murshidabad (19.02%) and West Dinajpur (18.70%) are four districts with high proportions of urban workers engaged in the primary sector. The four districts happen to be entirely dependent on agriculture.
The secondary sector employs 37.66% of the urban workers of the state. The sector is markedly prominent in the industrialised districts of Howrah, Hooghly, 24 Parganas and Burdwan, its share in the urban employment being 52.21, 51.40, 48.70 and 41.69 per cent respectively.
For the state as a whole categories V(a) and V(b) together are the largest single urban employer. " But "Other services" constitute the largest single industrial category in the urBan areas in all the districts except 24 Parganas, Howrah, Hooghly, Burdwan and Calcutta. In Calcutta category VIJ-Trade and Commerce is the largest single employer while in the four other districts the pride of place goes, to category V(a) & (b).
After manufacturing and household industries and Other services the next important economic activity in the urban areas is category VII-Trade & Commerce. For the whole of the state the share of Trade & Commerce in urban employment is 22.32 % among males and 6.64 % among females. The category claims 15.91 % of male urban workers· at the minimum for a district (Hooghly). In almost all the other districts Trade & Commerce employs 20% or more of the urban ma.le workers. Category VIII-Transport etc. accounts for sizeable employment of urban males in many of the districts especially in Calcutta (14.20 %),
:- Darjeeling (21.34%), Burdwan (13.29%), Midnapore (25.79%) and Purulia ,'(23.64 %).

CLASSIFICATION OF URBAN MALE AND FEMALE WORKERS
INDUSTRIAL STRUCTURE 1971
CULTIVATORS
AGRICULTURAL LABOURERS
LIVESTOCK. fORESTRY. FISHING,
HUNTING AND PLANTATIONS. ORCHARDS & ALLIED ACTIVITIES
MINING & Q.UARRYING
MANUFACTtJRING. PROCESSI~G. SERVICING & REPAIRS IP) HOUSEHOLD INDUSTRY (~ OTHER THAN HOUSEHOLD INDUSTRY CONSTRUCTION
IVIl. TRADE & COMMERCE
VIII. TRANSPORT, STORAGE &
COMMUNICATIONS
IX. OTHER SERVICES
ABSOLUTE AND PERCENTAGE SHARE OF PERSONS IN DIFFERENT I~OUSTRIAL CATEGORIES ARt SHOWN BY THE SCALE ABOVE AND BELOW THE BAR- DIAGRAM RESPECTIVELY
P.C. PERCENTAGE
\
~ . • ') MALE !:.4~"""'1
"" ,so':) t l°"\.~
0-9 ,eoUt-I)A.RI£S:- .... .S' .r
International ........ __ o_._ 'f State ...... ' .. , ........ _._._o_ Oistrict." ..... , ...... _._._.-._ 8 Poc:kct of Sir bhulII district C .. "Cooch Behar district 80 " ,,8an9laduh
k. 16 0 16 32 48 64 80 96 kill
MAP NO 51
(J .,..
..J
,...
IN'COO
CALCUTTA
L
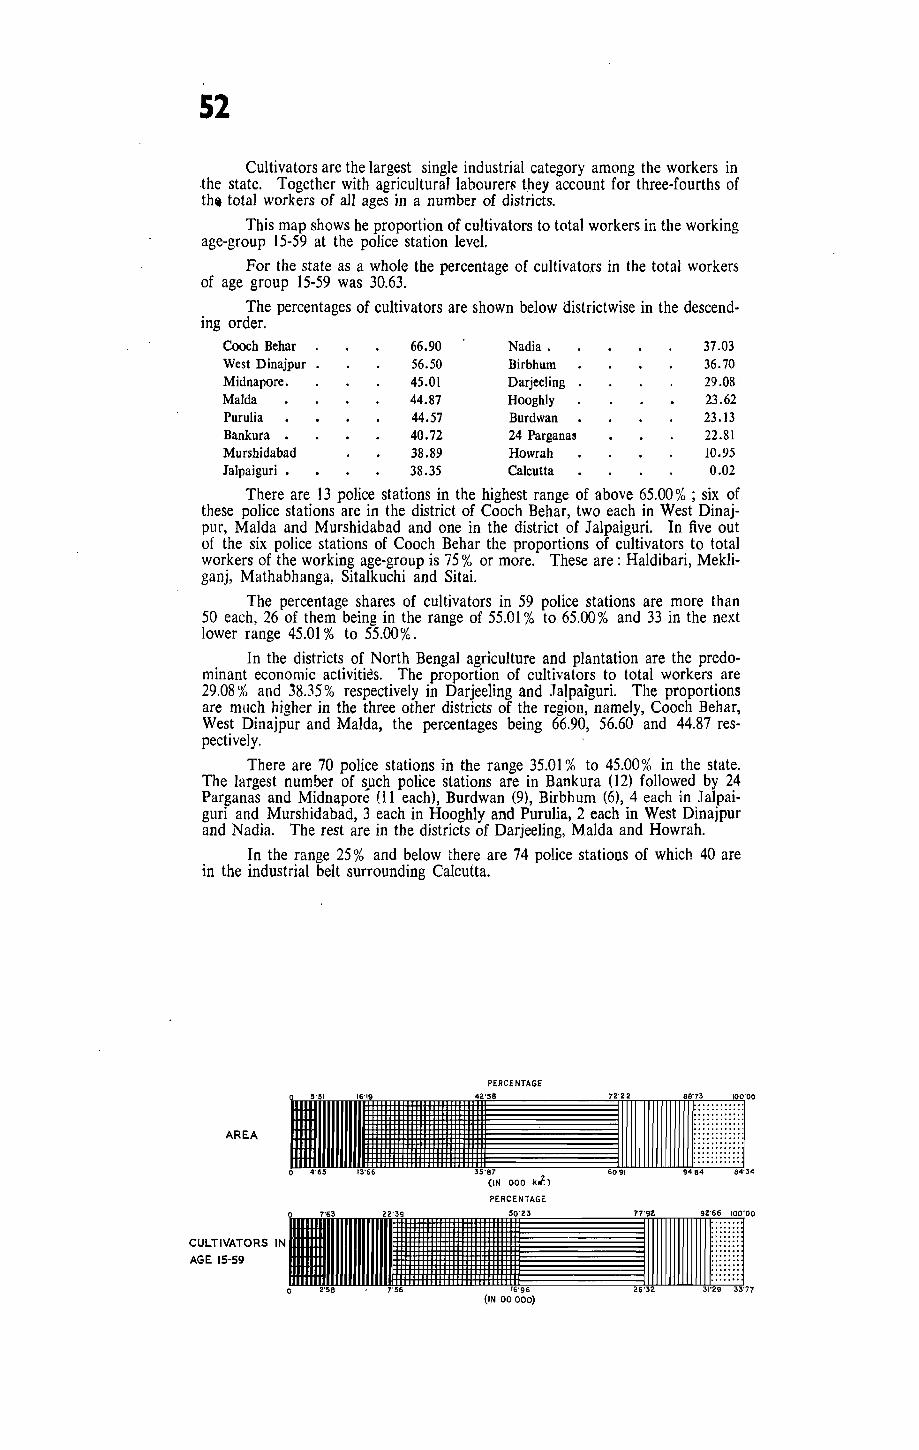
52
Cultivators are the largest single industrial category among the workers in .the state. Together with agricultural labourers they account for three-fourths of tht total workers of all ages in a number of districts.
This map shows he proportion of cultivators to total workers in the working age-group 15-59 at the police station level.
For the state as a whole the percentage of cultivato.rs in the total workers of age group 15·59 was 30.63.
The percentages of cultivators are shown below aistrictwise in the descending order.
Coach Behar West Dinajpur Midnapore. Maida Purulia
66.90 56.50 45.01 44.87 44.57
Nadia. Birbhum Darjeeling Hooghly Burdwan
37.03 36.70 29.08· 23.62 23.13
Bankura . 40.72 24 Parganas 22.81 Murshidabad 38.89 Howrah 10.95 Jalpaiguri • 38.35 Calcutta 0.02
There are 13 police stations in the highest range of above 65.00 % ; six of these police stations are in the district of Cooch Behar, two each in West Dinajpur, MaIda and Murshidabad and one in the district of Jalpaiguri. In five out of the six police stations of Cooch Behar the proportions of cultivators to total workers of the working age-group is 75 % or more. These are: Haldibari, Mekliganj, Mathabhanga~ Sitalkuchi and Sitai.
The percentage shares of cultivators in 59 police stations are more than 50 each, 26 of them being in the range of 55.01 % to 65.00% and 33 in the next lower range 45.01 % to 55.00%.
In the districts of North Bengal agriculture and plantation are the predominant economic activities. The proportion of cultivators to total workers are 29.08 % and 38,35% respectively in Darjeeling and Jalpaiguri. The proportions are much higher in the three other districts of the region, namely, Cooch Behar, West Dinajpur and MaIda, the percentages being 66.90, 56.60 and 44.87 respectively.
There are 70 police stations in the range 35.01 % to 45.00% in the state. The largest number of s_.uch police stations are in Bankura (12) followed by 24 Parganas and Midnapore (11 each), Burdwan (9), Birbhum (6), 4 each in Jalpaiguri and Murshidabad, 3 each in Hooghly and Purulia, 2 each in West Dinajpur and Nadia. The rest are in the districts of Darjeeling, MaIda and Howrah.
In the range 25 % and below there are 74 police stations of which 40 are in the industrial belt surrounding Calcutta.
AREA
PERCENTAGE I" "" .. " 111111111111111111111111111111111111111
o 4·65 13'66 35'87
(IN 000 kJ.)
PERCENTAGE
~~~ T:~:ORS IN 11111111111111111111111111111111111111111 ijl" o 2'58 ' 7·56 16·96
(IN 00000)
"ll[lIlllIlIllllfl1'J or 60·91 94'84 B4'34

CUL TIVATORS 1971
MAP NO 52

The map shows the proportion of cultivators to total rpral population for each police station in West Bengal. .The percentages of cultivators to total rural population in the police stations are shown in the map by ehoropleth method, the figures having been grouped into six ranges.
. . Cultiyators are. the main industrial category in the rural areas in most dis. tncts. TheIr proportIons to the rural population, however, vary sharply from region to region. The districts of North Bengal are all above tIle state average of 11.71 %, one of them, namely, Cooch Behar being at the top of the list with a proportion of 20.08 % . The second place also goes to another district of the northern region, viz., West Dinajpur (17.38 %). The districts in the western part of the state except Birbhum also contain high proportions of cultivators in the rural areas, In Birbhum, though a purely agricultural district, has a relatively smaller percentage of cultivators in the rural popUlation (10.50) due to the high incidence of agricultural labour. The four industrialised districts of 24 Parganas. Hooghly, Burdwan and Howrah have low proportions of cultivators, the Iastnamed district coming at the bottom with lowest proportion of 5.33 %.
The districts are shown below in ,the descending order of the percentages. Percentage
of cultiva-tors in rural population
State/District State/District
WEST BENGAL 11.71
Cooch Behar 20.08 Nadia. West Dinajpur 17.38 Murshidabad Purulia 15.13 Birbhum Darjeeling • 14.19 Twentyfour Parganas JaJpaiguri . 13.46
Percentage of cultiva
tors in rural population
11.33 11.04
10.50
9.54
Midnapore 13.12 Hooghly 8.97 MaIda 12.87 Burdwan 8.51 Bankura . 12.65 Howrah 5.33
Only two police stations, viz., Pulbazar (29,04 %) and Kalimpong .(25.66 %), both in the district of Darjeeling, have recorded more than 25 % of then population as cultivators.
As indicated in the above statement, in 46 out of 60 police stations of North Bengal the proportions of cultivators are above the state average of 11.71 %.
A total of 110 police stations throughout the state are in the range of 9.01 %-13.00%. As many as 20 police stations of 24 Parganas, mostly far away from the industrial areas are in this range. Almost similar is the situation in Burdwan where 13 police stations which are all outside the industrial belt come nnder this range.
The percentage share of cultivators in the total rural population of 74 police stations are below 10%,44 of them are. in the .range of 5.00%--:-9.00% and 30 in the range of below 5.00%. These polIce statIOns are mostly In the most densely populated parts of the state where cultivable land is scarce and is costlier than in other areas. The major parts of these police stations are either urbanised or are very close to the urban industrial belts. The low proportion of cultivators is only' natural in these areas.
PERCENTAGE
AREA 1111""1111111 ~1111111111111111111r o 3'95 11'70 37'31
RURAL CUL.TIVATORS'
5'72
(IN 000 ki)
PERCENTAGE
19'09
(IN 00000)
~ll11l1l1l1[1" r 70'56 19'25 82"39
88'Sl 97'83100'00
34'68 38'2 39'04

CUL TIVATORS
1.971
km 10 5
BOUNOARIE5:-
aD "
km /6 0 80 96 km L .I Ie .1
MAP NO 53
<3;
Q.
. I . ,
CULTIVATORS
r U,,·o, - ,o·00
.130 01 _ 170
00
~SA1I"71 ~rOI_13°00
o .50
01_ 9"00
D ENTIRELY URBAN
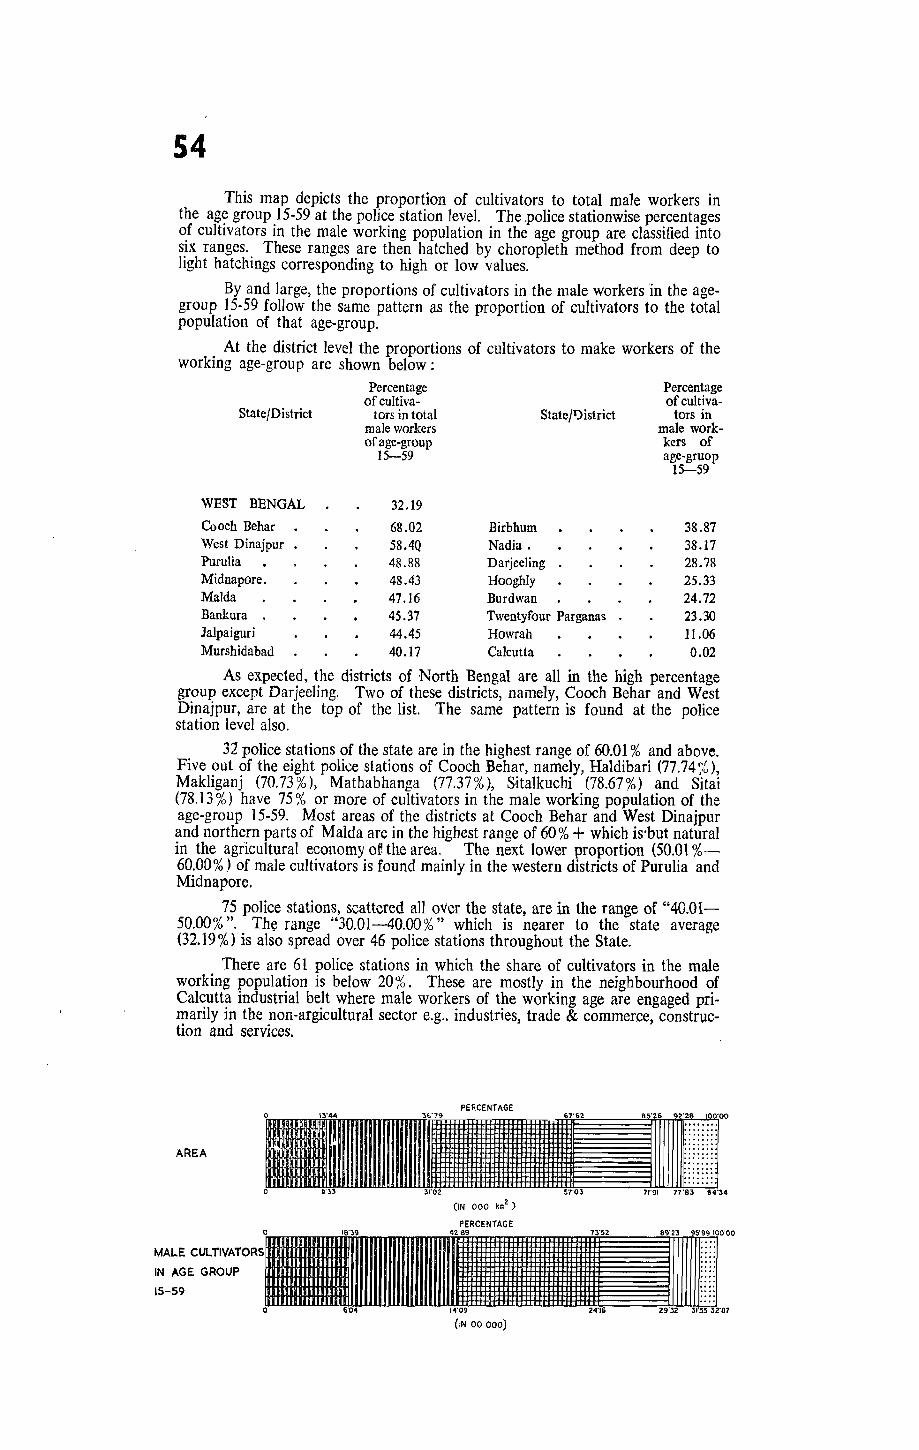
S4
This map depicts the proportion of cultivators to total male workers in the age group 15-59 at the police station level. The police stationwise percentages of cultivators in the male working population in the age group are classified into six ranges. These ranges are then hatched by choropleth method from deep to light hatchings corresponding to high or low values.
By and large, the proportions of cultivators in the male workers in the agegroup 15-59 follow the same pattern as the proportion of cultivators to the total population of that age-group.
At the district level the proportions of cultivators to make workers of the working age-group are shown below:
State/District
WEST BENGAL
Cooch Behar West Dinajpur • Purulia Midnapore. MaIda Bankura . Jalpaiguri Murshidabad
Percentage of cult iva
tors in total male workers of age-group
15-59
32.19
68.02 58.4Q 48.88 48.43 47.16 45.37 44.45 40.17
Statej1)istrict
Birbhum Nadia. Darjeeling Hooghly Burdwan Twentyfour Parganas Howrah Calcutta
Percentage of cultiva
tors in male workkers of aee-gruop
15-59
38.87 38.17 28.78 25.33 24.72 23.30 11.06 0.02
As expected, the districts of North Bengal are all in the high percentage group except DarjeeJing. Two of these districts, name1y, Cooch Behar and West Dinajpur, are at the top of the list. The same pllttern is found at the police station level also.
32 po1ice stations of the state are in the highest range of 60.01 % and above. Five out of the eight poli~e stations of Cooch Behar, namely, Haldibari (77.74 /~), Makliganj (70.73%), Mathabhanga (77.37%), Sitalkuchi (78.67%) and Sitai (78.13 %) have 75 % or more of cultivators in the male working population of the age-group 15-59. Most areas of the districts at Cooch Behar and West Dinajpur and northern parts of MaIda are in the highest range of 60% + which iS'but natural in the agricultural economy of, the area. The next lower proportion (50.01 %-60.00 %) of maJe cultivators is found mainly in the western districts of Purulia and Midnapore.
75 police stations, scattered all over the state, are in the range of "40.01-50.00%". The range "30.01-40.00%" which is nearer to the state average (32.19 %) is also spread over 46 police stations throughout the State.
There are 61 police stations in which the share of cultivators in the male working popUlation is below 20%. These are mostly in the neighbourhood of Calcutta industrial belt where male workers of the working age are engaged primarily in the non-argicultural sector e.g .. industries, trade & commerce, construction and services.
PERCENTAGE
AREA .1I111111111111.IIIIIIIIIIJr o Irl~ 31'02 57'03 7,.91 77'83 64'34
(IN 000 k",2)
PERCENTAGE
~::~~::;;ORs.i~"III~IIIII""~ll~llllllllllllllllllIrr 'lllll~I"lr o 6'04 14'09 24'1~ Z932 31'55 32'07
(IN 00 000)

MAP NO 54
MALE CULTIVATORS IN MALE WORKERS IN AGE 15-59
1971
~A ~ :,;' \i)It .. F.JWl!!!1.J =;'j ':':>;'::j:::::::;+:~4: .
. ' r ,..:;::: :L·: .. :.: ;';':'.:.;.:.;~
~>~~ l~(H:~@<IW:~~ !
-~fd:>::::: ·t~f,tfm;,J;- ," ,. -m:' Y[: ii [: [, :(~H~(' t: i: i fj IJ I
S'.' , ......••..••.....••• ; ....•. \ ........ '\ Y;: ~ . .J.~~:'::::::::::::: ::~::::: :/. ... :.:.: .. :.: .. :.~.:: .......... ;. .•...• '\..":\ .... .. H.: ....•. . : •... '11 .
" . . : :.~ ......
: ~ ~ ~ i. .~
40'01 - 50'00
30'01 - 40'00

55
The police stations-wise proportions of cultivators fo total female wqrkers in age-group 15-59 are shown in the map in the same manner as for males in the preceding map.
The proportion of cultivators among female workers is strikingly high in the district of Darjeeling and Cooch Behar as also in Purulia and West Dinajpur. This follows by and large, the trend among male workers. The following statement shows the districts according to the percentages of cultivators in the total female workers of the age-group 15-59.
Percentage of cult iva-
State/District tors in female workers of age-
State/District
Percentage of cultiva
tors in female workers of age-
WEST BENGAL.
Darjeeling . Coach Behar
group 15-59
11.08
29.85 28.96
Nadia. MaIda
group 15-59
8.75 8.58
Purulia 19.12 24 Parganas 8.34 West Dinajpur 18.40 Howrah 6.07 Murshidabad 12.62 Burdwan 5.92 Birbhum . 12.03 Jalpaiguri 5.71 Bankura . 11.78 HOoghly 4.60 Midnapore 10.72 Calcutta 0.02
Police sfation-wise, the ,highest proportions of cultivators in the female working population df age-group 15-59 are found in 3 police stations of Darjeeling, viz., Pulbazar (64.51 %), Kalimpong (64.34%) and Garubathan (61.37%). As in case of the males, Cooch Behar has high proportions of female cultivators. In 4 out of 8 police stations of. the district there are 40%-50% of cultivators among the females workers. There are 5 more police stations which are spread over Murshidabad, 24 Parganas and Midnapore where similar high proportions of female cultivators are observed.
The proportions of female cultivators are uniformly high in the police stations of the Contai subdivision of Midnapore also.
In, the police stations adjacent to the Calcutta and Asansol-Durgapur industrial belts the proportions of cultivators in the female working popUlation are among the lowest in the state, heing in the range of 5 % and below.
PERCENTAGE
AREA 11111~~~lIlllIlIlIlIlr o 9'69 23'76 3~'97
(IN a 000 k .. 2 )
PERCENTAGE
l~:-:::---=:--:---:r' :~. r -- ------- ....... . ---------- ....... . - - - - -._ - - - ..... . " __________ ••••• '0,
---- .... - -- ..... '" -----_--- ....... . _-__ -_,...._-_W<f:--_-_- ::::: ::: -- _ .... _---- ....... , 56'OB 74'63 84',34
~~1:TO~ 1111111111111111111111111111111111" 1111~11111~ml ~r o 25'25 38'86 ~1'93 70'90 64'54 90'52
(IN 000)

FEMALE CULTIVATORS IN FEMALE WORKERS
MAP NO 55
20'01 30'00
IS'OI 20'00
10'01 15'00 5 A 11'18
5'01 10'00
5'00 " Bnow
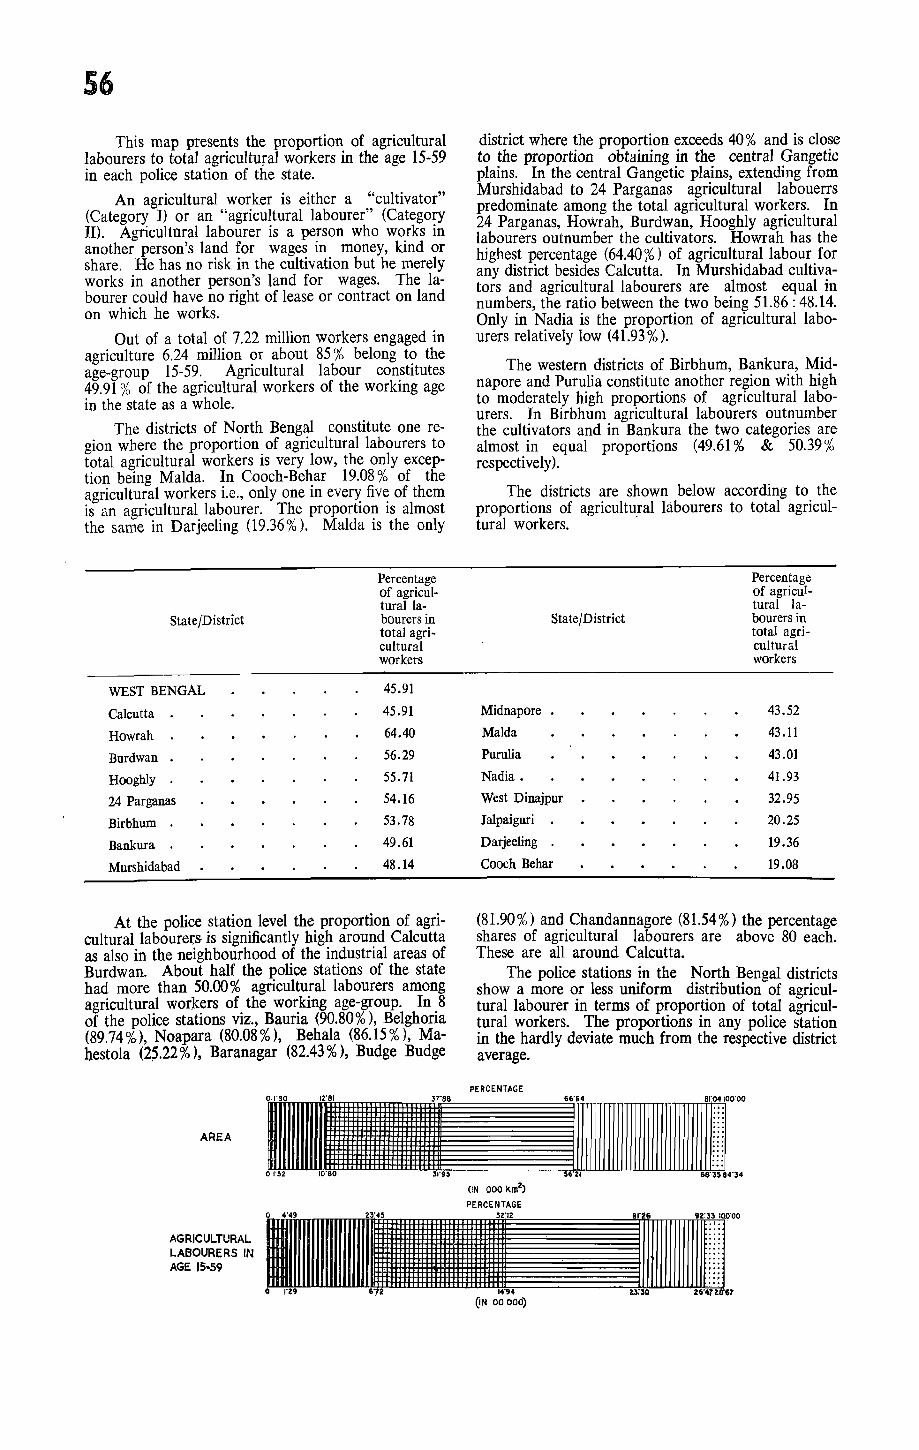
56
This map presents the proportion of agricultural labourers to total agricultural workers in the age 15-59 in each police station of the state.
An agricultural worker is either a "cultivator" (Category l) or an "agricultural labourer" (Category II). Agricultural labourer is a person who works in another person's land for wages in money, kind or share. He has no risk in the cultivation but he merely works in another person's land for wages. The labourer could have no right of lease or contract on land on which he works.
Out of a total of 7.22 million workers engaged in agriculture 6.24 million or about 85 % belong to the age-group 15-59. Agricultural labour constitutes 49.91 % of the agricultural workers of the working age in the state as a whole.
The districts of North Bengal constitute one region where the proportion of agricultural labourers to total agricultural workers is very low, the only exception being MaIda. In Cooch-Behar 19.08 % of the agricultural workers i.e., only one in every five of them is an agricultural labourer. The proportion is almost the same in Darjeeling (19.36%). MaIda is the only
State/District
WEST BENGAL
Calcutta
Howrah
Burdwan
Hooghly
24 Parganas
Birbhum .
Bankura .
Murshidabad
Percentage of agricul-tural la-bourers in total agri-cultural workers
45.91
45.91
64.40
56.29
55.71
54.16
53.78
49.61
48.14
At the police station level the proportion of agricultural laboureJ;:8- is significantly high around Calcutta as also in the neighbourhood of the industrial areas of Burdwan. About half the police stations of the state had more than 50.00% agricultural labourers among agricultural workers of the working age-group. In 8 of the police stations viz., Bauria (90.80%), Belghoria (89.74 %), Noapara (80.08 %), Behala (86.15 %), Maij,estola (2~.22 %), Baranagar (82.43 %), Budge Budge
AREA 11I~""~lllllllllllllllllllllllllr o r52 10·80 3r9~
district where the proportion exceeds 40 % and is close to the proportion obtaining in the central Gangetic plains. In the central Gangetic plains, extending from Murshidabad to 24 Parganas agricultural labouerrs predominate among the total agricultural workers. In 24 Parganas, How-rah, Burdwan, Hooghly agricultural labourers outnumber the cultivators. Howrah has the highest percentage (64.40%) of agricultural labour for any district besides Calcutta. In Murshidabad cultivators and agricultural labourers are almost equal in numbers, the ratio between the two being 51.86: 48.14. Only in Nadia is the proportion of agricultural labourers relatively low (41.93 %).
The western districts of Birbhum, Bankura, Midnapore and Purulia constitute another region with high to moderately high proportions of agricultural labourers. In Birbhum agricultural labourers outnumber the cultivators and in Bankura the two categories are almost in equal proportions (49.61 % & 50.39% respectively).
The districts are shown below according to the proportions of agricultural labourers to total agricul-tural workers.· .
Percentage of agricul-tural la-
State/District bourers in total agri-cultural workers
Midnapore 43.52
MaIda 43.11
Purulia 43.01
Nadia. 41.93
West Dinajpur 32.95
Jalpaiguri . 20.25
Darjeeling 19.36
Cooch Behar 19.08
(81.90%) and Chandannagore (81.54%) the percentage shares of agricultural labourers are above 80 each. These are all around Calcutta.
The police stations in the North Bengal districts show a more or less uniform distribution of agricultural labourer in terms of proportion of total agricultural workers. The proportions in any police station in the hardly deviate much from the respective district average.
PERCENTAGE
(IN 000 Km2)
PERCENTAGE
"111111111111111111111111111111 f~ r 56'21 68'·3$ 84'34
~~~~~ 11"'"II'"'IIIIlIlllllllllllllllllllllllllllllf' rZ9 672 In4 'llllll~llll~r
23,'30 26'47 ZG'67 QN 00000)
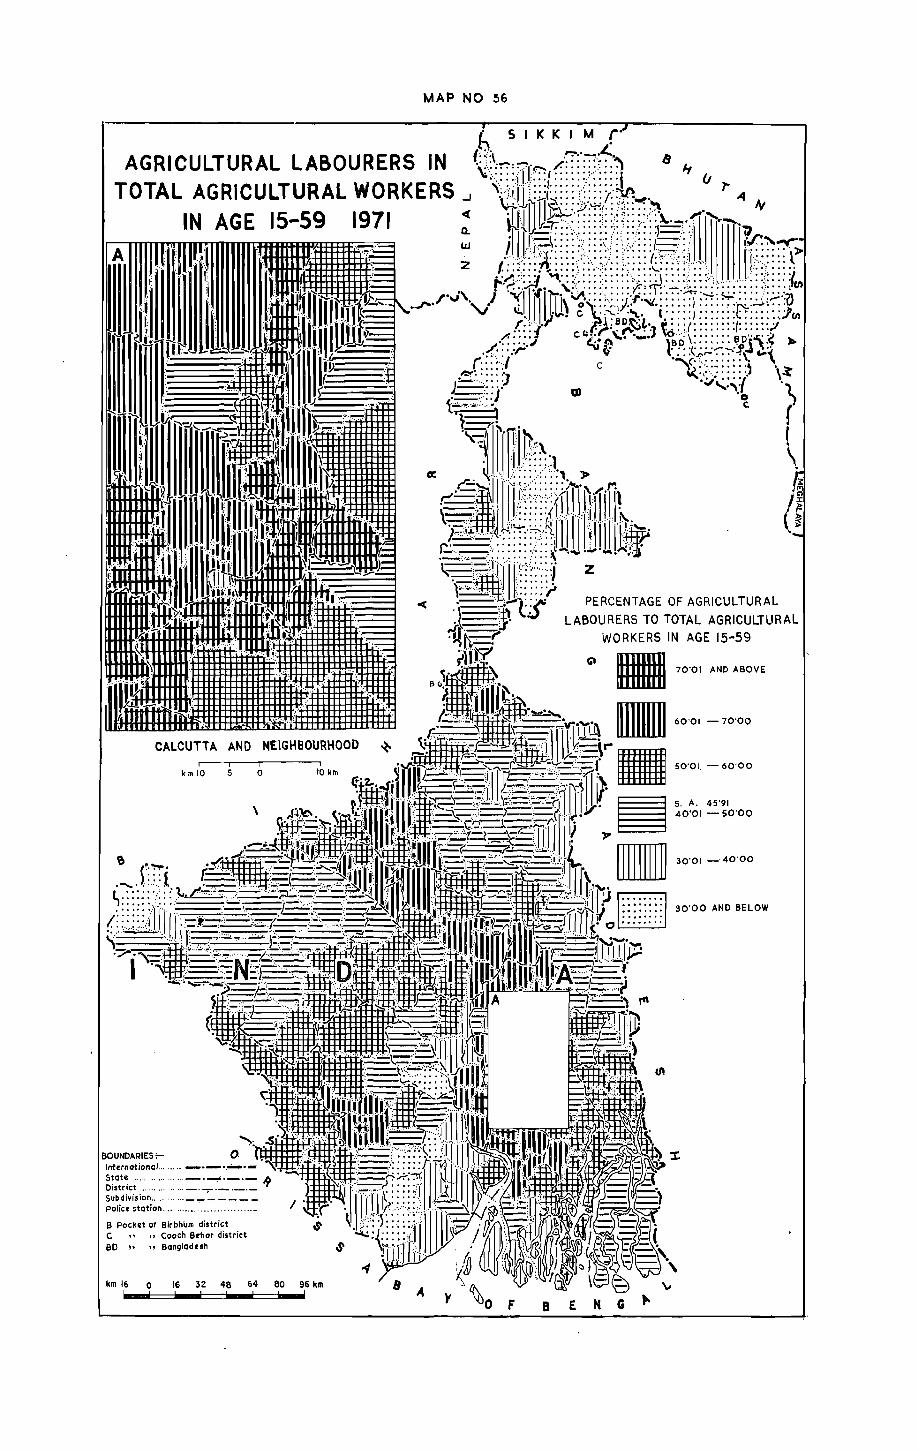
MAP NO 56
(i\ DIIIIID 70'01 AND ABOVE
km 10 5 0
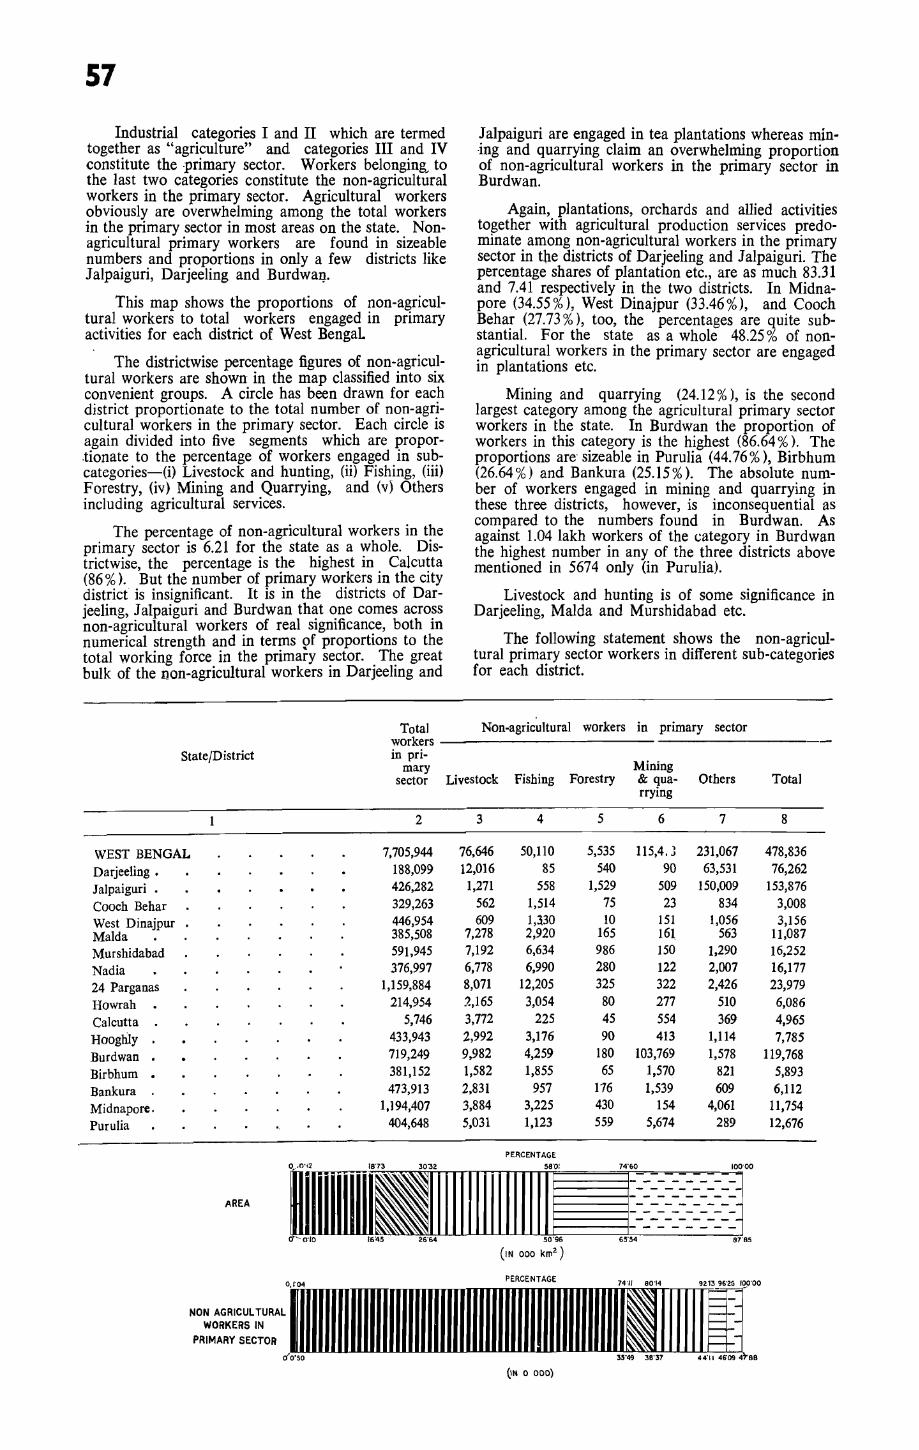
57
Industrial categories I and II which are termed together as "agriculture" and categories III and IV constitute the .primary sector. Workers belonginK to the last two categories constitute the non-agricultural workers in the primary sector. Agricultural workers obviously are overwhelming among the total workers in the primary sector in most areas on the state. Nonagricultural primary workers are found in sizeable numbers and proportions in only a few districts like J alpajguri, Darjeeling and BurdwaI)..
This map shows the proportions of non-agricultural workers to total workers engaged in primary activities for each district of West Bengal
The districtwise percentage figures of non-agricultural workers are shown in the map classified into six convenient groups. A circle has been drawn for each district proportionate to the total number of non-agricultural workers in the primary sector. Each circle is again divided into five segments which are proportionate to the percentage of workers engaged in subcategories-(i) Livestock and hunting, (ii) Fishing, (iii) Forestry, (iv) Mining and Quarrying, and (v) Others including agricultural services.
The percentage of non-agricultural workers in the primary sector is 6.21 for the state as a whole. Districtwise, the percentage is the highest in Calcutta (86 % ). But the number of primary workers in the city district is insignificant. It is in the districts of Darjeeling, J alpaiguri and Burdwan that one comes across non-agricultural workers of real significance, both in numerical strength and in terms pf proportions to the total working force in the primary sector. The great bulk of the non-agricultural workers in Darjeeling and
Total
Jalpaiguri are engaged in tea plantations whereas mining and quarrying claim an overwhelming proportion of non-agricultural workers in the primary sector in Burdwan.
Again, plantations, orchards and allied activities together with agricultural production services predominate among non-agricultural workers in the primary sector in tbe districts of Darjeeling and J alpaiguri. The percentage shares of plantation etc., are as much 83.31 and 7.41 respectively in the two districts. In Midnapore (34.55%), West Dinajpur (33.46%), and Cooch Behar (27.73 %), too, the percentages are quite substantial. For the state as a whole 48.25 % of nonagricultural workers in the primary sector are engaged in plantations etc.
Mining and quarrying (24.12 %), is the second largest category among the agricultural primary sector workers in the state. In Burdwan the proportion of workers in this category is the highest (86.64 %). The proportions are' sizeable in Purulia (44.76%), Birbhum (26.64%) and Bankura (25.15%). The absolute number of workers engaged in mining and quarrying in these three districts, however, is inconsequential as compared to the numbers found in Burdwan. As against 1.04 lakh workers of the category in Burdwan the highest number in any of the three districts above mentioned in 5674 only (in Purulia).
Livestock and hunting is of some significance in Darjeeling, MaIda and Murshidabad etc.
The following statement shows the non-agricultural primary sector workers in different sub-categories for each district.
Non-agricultural workers in primary sector workers --------------------
State/District
WEST BENGAL Darjeeling • Jalpaiguri . Cooch Behar West Dinajpur MaIda Murshidabad Nadia 24 Parganas Howrah • Calcutta Hooghly Burdwan • Birbhum • Bankura Midnapore. Pllrulia
AREA
in primary
sector Livestock Fishing Forestry
2
7.705,944 188,099 426,282 329,263 446,954 385,508 591,945 376,997
1,159,884 214,954
5,746 433,943 719,249 381,152 473,913
1,194,407 404,648
3
76,646 12,016
1,271 562 609
7,278 7,192 6,778 8,071 .2,165 3,772 2,992 9,982 1,582 2,831 3,884 5,031
4
50,110 85
558 1,514 1,330 2,920 6,634 6,990
12,205 3,054
225 3,176 4,259 1,855
957 3,225 1,123
PERCENTAGE
~rlllllllllIlflllllllllllll If[' o'~ 0"0 '&'15 26'64 50'96
(IN 000 km2 )
5
5,535 540
1,529 75 10
165 986 280 325
80 45 90
180 65
116 430 559
Mining & quarrying
6
115,4. J 90
509 23
151 16l 150 122 322 277 554 413
103,769 1,570 1,539
154 5,674
Others
7
231,067 63,531
150,009 834
1,056 563
1,290 2,007 2,426
510 369
1,114 1,578
821 609
4,061 289
Np:~§=~t~:AIIIIIIIIIIII"IIIII""IIIIIII"lirliijillll""I"11,jllil IIi.: QH 0 000)
Total
8
478,836 76,262
153,876 3,008 3,156
1I,087 16,252 16,177 23,979 6,086 4,965 7,785
119,768 5,893 6,112
11,754 12,676
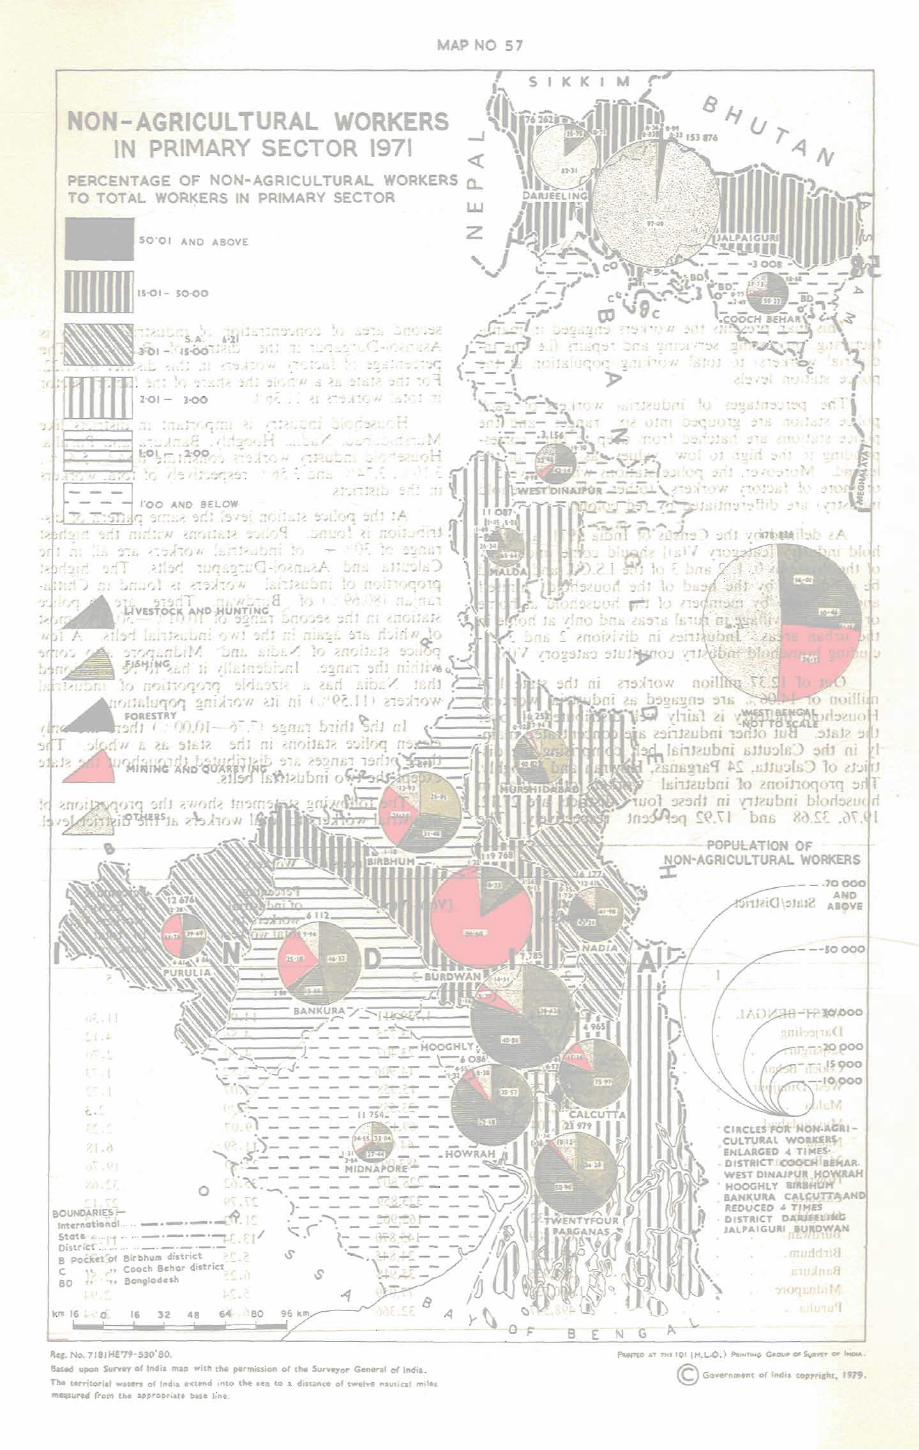
MAP NO 57
NON-AGRICULTURAL WORKERS IN PRIMARY SECTOR 1971
PERCENTAGE OF NON-AGRICULTURAL WORKERS a.. TO TOTAL WORKERS IN PRIMARY SECTOR
50'01 AND ABOVE
."..". '0-00
~::.~'~'-'-: :S .. A~.'~,6~~I · ~ .. :::~':;':f·":~ _~', ; • . ~~-]~I- . ~~.~ "'_:~ _ ;'" ~', .. " • .• ~
... , • ",''':._ "', ... _ ... f ':. • .; . - I'~ -' ,~-
_ (
.,.
t.. \ ,;._ - - - - - - - .;.. ; ::.. -. ."'\ _____ II 754. _ - __
'
"0 ' .• ,,--------~:...-----f,] ____ . ,. ' __
""" .:!:_ _ __ .P' 1·... _ _ • , • f)
w z
t·.-!:. - - - - ;;::DNAPORE:'- - -.~- - - - - - ~ ... -::-r~ - - -o . . -... - - - - - -. _~ - - - -
~ -r ~~ ~~ • - - - - ~ ~7~~ - -eOUNO ..... RIES~:... • I - )- - - - - ..J. ....... - -
-d rJ9 .r • - .-- - - -.) ~;;r:- - -Intctft'ation L ... _.-- .. _. ___ -.i - ' ""\ " .-----Stat~ ·:~ · t .. · · ·-·-·-·~'. :::I / . ~- - ':"',;{";"':.,..I.- -Oistnct ........... _._ ._·_·- ,- - - --B poCi'rt'Qf eirbhum distric.t . _ ~. ;. oS ......... \:..:,.:_ .;..::_ - _ -C " "Coo~h Behor dlstuct. €\' : r
~ , II ".. r- } U .~:.. -60 ,,'" BOl29lodCS - •
r
km 16 ~, rL 16 32 48 64 \ 80
Ree. No. 7U)fHE79-530'SO.
6ased upon SUNey 0( Iftd il map with the permission of the Sun.yor General of Illdia.
The territorial wa.ters of India ev;tend tnto the sea to a distance of twelve nautical m11es measured (rom t.be ap~,.oprta.t~ baSe line.
S I( KIM
81t 151876 l..J
~1:;:>l1()\l/
-.i A .~
~.:\.? :. \_;._ ~
l .-.c, .. .(
h :;'5~';~fl::J -ell:> . 0 [lUlil, !1'7'" ~.fl~I> •. (1 ~; , .~T~~"G]o\"'l({~"':') ~ " • ... c. • '-IiIt5t''t~ '51 A~ ..... i:i iji-:JWD!1i l::lr!JO JiJ~ :'}.11)j):J
I£i1J?ubni l>Hu·.)I.fi~) :;;nl (Ii sfl£21BQ ~s:. _dllJ:;Ii:;') 10 d-.; h;il12ubni '10 Inoi11CK}P"'!Q :;;
1.)m~~.:.J·'tuol :)?:)cft oi 'nJ?ub{li blocl:Jt!J( rl J(t5~:Jq ~Q.\ I . bOB XdS[ .(W, 1
B N
-- -POPULATION OF ~ON~AGRICULTURAL WORKERS
--.70000 AND
ABOVE
- --50000
p'lQ'.ooO
:1,(1
.l" lOp<>O
-~- .!S90°
--I~POO ~ .
•. I
· CIRCLES FOR ·NON.ACIUCULTURAL WOUERS,'
· ENLARGED 4 TIMES.' • DISTRICT ·COOOH8ft1AR.
WEST DINAJPUit ,H.O;N.RAH • HOOGHL Y aIR8Holot' I
• BANKURA REDUCED DISTRICT
• JALPAIGURI n!;,!jRD_~!tN
ffiUrirj. H
'''AW)1 "'f ()LLri ,,.
PluHnD AT TH. 101 (H.L-O.) ""'", ... " G."". OF s""ylY 01' '-.
© Government of India copyri,"'t, 1979.

58
This map presents the workers engaged in manufacturing, processing, servicing and repairs (i.e. the industrial workers) to total working population at the police station levels.
The percentages of industrial workers of each police station are grouped into six ranges and the police stations are hatched from deep to light corresponding to the high to low values as shown in the legend. Moreover, the police stations which have 5 % or more of factory workers (other than household industry) are differentiated by red colour.
As defined by the Census of India 1971, a household industry [category V(a)] should come under any of the divisions 0, 1, 2 and 3 of the l.S.C.l. and should be conducted by the head of the household himself and/or mainly by members of the household at home or within the village in rural areas and only at home in the urban areas. Industries in divisions 2 and 3 excluding household industry constitute category V(b).
Out of 12.37 million workers in the state 1.74 million or 14.06 % are engaged as industrial workers. Household industry is fairly well distributed all over the state. But other industries are concentrated mainly in the Calcutta industrial belt comprising the districts of Calcutta, 24 Parganas, Howrah and Hooghly. The proportions of industrial workers other than in household industry in these four districts are 27.12, 19.76, 32.68 and 17.92 per cent respectively. The
State/District
WEST BENGAL Darjeeling Jalpaiguri Cooch Behar .' West Dinajpur MaIda . Murshidabad . Nadia 24 Parganas • Howrah. Calcutta Hooghly Burdwan Birbhum. Bankura Midnapore Purulia .
1
Total Workers
2
12,368,944 282,442 544,686 390,502 520,375 436,873 761,704 552,548
2,185,539 642,347
1,165,542 775,132
1,093,809 473,231 574,936
1,470,732 498,547
second area of concentration of industrial activity is Asansol-Durgapur in the district of Burdwan. The percentage of factory workers in this district is 11.22. For the state as a whole the share of the factory sector in total workers is 11.36 % .
Household industry is important in districts like Murshidabad, Nadia, Hooghly, Bankura and Purulia. Household industry workers constitute 6.84 %, 5.41 %, 3.10%,3.74% and 3.56% respectively of total workers in the districts.
At the police station level the same pattern of distribution is found. Police stations within the highest range of 30 % + of industrial workers are all in the Calcutta and Asansol-Durgapur belts. The highest proportion of industrial workers is found in Chitta~ ranjan (80.69 %) of Burdwan. There are 46 police stations in the second range of 10.01 %-30.00% most of which are again in the two industrial belts. A few police stations of Nadia and Midnapore also come within the range. Incidentally it has to be mentioned that Nadia has a sizeable proportion of industrial workers (11.59 %) in its working population.
In the third range (7.76-10.00%) there are only eleven police stations in the state as a whole. The three other ranges are distributed throughout the state except the two industrial belts.
The following statement shows the proportions of industrial workers to total workers at the district leveL
Industrial Workers
Percentage Percentage [V(a)+V(b)] of industrial of factory
workers to workers V(a) total workers to total
workers
.. 3 4 5
1,739,411 14.06 11.36 13,725 4.86 4.12 23,407 4.30 2.70 14,906 3.82 1. 73 15,958 3.07 1.72 23,558 5.39 2.3 69,122 9.07 2.23 64,013 11.59 6.18
483,095 22.10 19.76 228,807 35.62 32.68 323,859 27.79 27.12 162,902 21.02 17.92 145,870 13.34 11.22 24,845 5.25 2.73 35,918 6.25 2.51 77,059 5.24 2.94 32,366 6.49 2.94
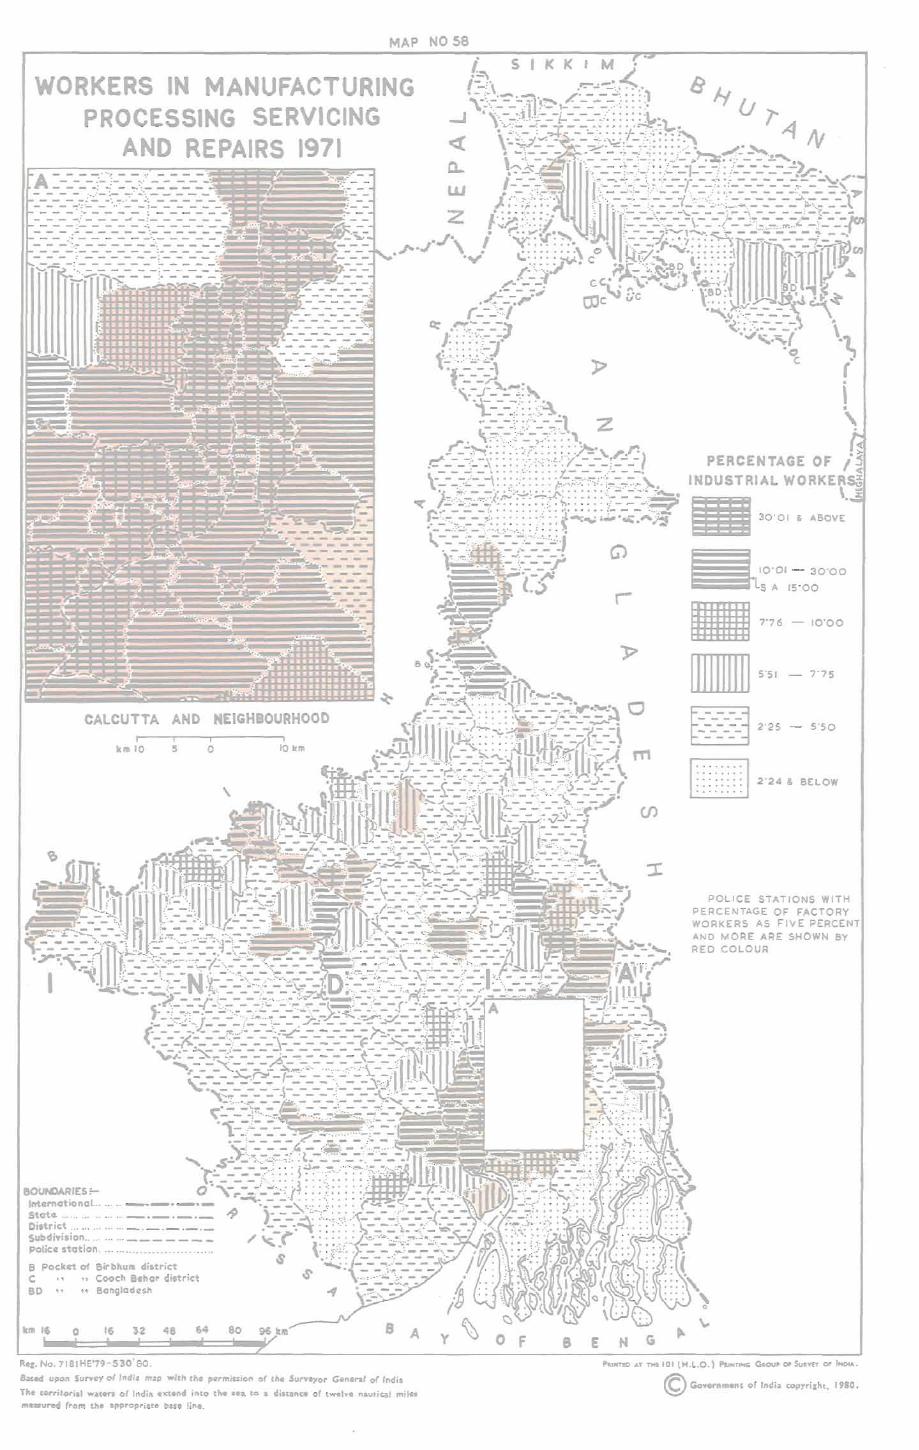
MAP NO 58
WORKERS IN MANUFACTURING PROCESSING SERVICING
AND REPAIRS 1971
kmlO 5 o
Rec. No. 7ISIHE'19-S30'SO.
SaH upon SUl'Yey of India map with tit. permission G( the Surveyor General of India
The cerrilor;al ..... ,.rs of Indi .. extltt\d into the sea to a distance of twe've naulical miles m .. ured (rom the appropriate bas. line.
~ 2'25 - 5'50
~
r:::::::l 2'24 & BELOW Ed
POLlCE STATIONS WITH PERCENTAGE OF FACTORY WORKERS AS FiVE PERCENT AND MORE ARE SHOWN BY REO COLOUR
hINTED AT ..... 101 (H.l.O.) PaINT""" Gtoow Of Su1tvn c# IND<A.
© Govemmen, of India copyr;cht. 1980.

59
This map shows the distribution of eight types of household industries. according to their size of employment in each district of the state. The types of household industries cover the minor codes of National Industrial Classification, 1970 as under:-
lAgro-based (007, 008,010-019,202,204-207, 209, 210-218, 220-229). II Forest-based (050-509,270-279,280-283).
III Livestock and Fish-based (020-029, 040, 060-063, 069, 200, 201, 203,. 290-296, 299).
IV Textile (230-236,239,240-249,250-253,259-263). V MIneral-based (320-329,330-336,339,340-345.349).
VI Engineering (350-359, 360. 370-379). VII Chemical (208, 300-307, 310-319).,
VIII Miscellaneous (284-289, 380-387, 389, 390-399).
For each district eight vertical bars proportionate to the number of workers employed in each type of household industry have been drawn which are arranged in order of the size of employment from high to low. The different shades inside the bars and the roman numericals below each bar along the horizontal axis indicate the types of household industries. Figures at the top of the bars indicate tbe total number of workers employed in each industry. Absolute and percentage scales are shown respectively on left and right sides of the bar diagrams.
In the state as a whole 33.55 % of total workers in household industrIes areemployed in textile industries, 23.68 % in agro-based industries, 15.~6 % m forestbased industries, 12.59 % in mineral-based industries, 6.42 % in livestock and fish-based, engineering and chemical industries and 7.90% in the miscellaneous industries.
Textiles industry based on cotton, jute, wool, silk and other fibres is themost developed household industry in the districts of Nadia (59.60%), Howrah (5l.47%), Twentyfour Parganas (47.02%), Hooghly (43.24%), Bankura (34.37%), Midnapore (34.37% L Burdwan (24.66%) and Calcutta (19.93 %). It is impor.tant in Murshidabad, Darjeeling and Coach Behar also.
Some of the important agro-based industries are: production of rice by milling, husking and processing of paddy by rice mill, parching of grains, production of pulses, oil pressing by 'Kolhu' or small machines etc., Tobacco industry
;' (bidi and choroot making) is the most developed in the districts of Murshidabad (58.62 %), Coach Behar (35.41 %), Birbhum (34.34 % ), West Dinajpur (28.06 % ): and MaIda (27.34%).
Extraction of Jac, gum, production of resin, collection of herbs, wild fruits, berries etc., sawing of wood, making wooden furniture etc., are some of the important forest-based industries. Sizeable number of workers are engaged in these industries in J aJpaiguri (35.53 %), Darjeeling (23.12 %) and Purulia (24.82 ~£ ). They are mainly engaged in the manufacture of structural wooden goods (including treated) wooden and cane boxes, bamboo and cane furniture and fixtures etc.
Among the. mineral-based industries of manufacture of earthen ware and earthen pottery "manufacture of metal utensils-cutlery and kitchenware" are' important in MaIda (26.37%), Purulla (22.61 %), Calcutta (18.12%), Nadia (15.27%) and Howrah (13.58%),.
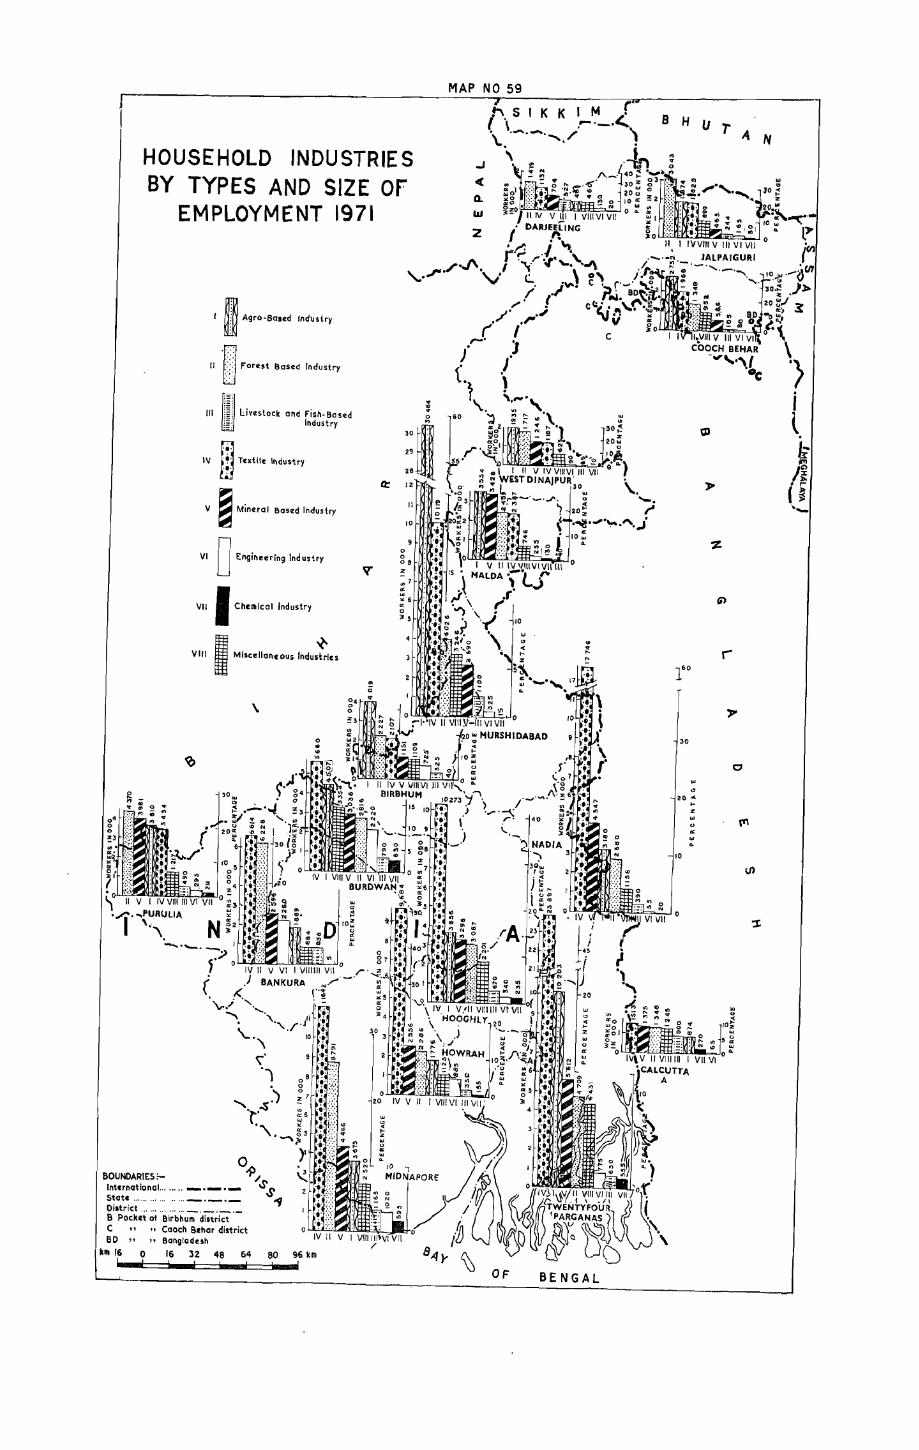
HOUSEHOLD INDUSTRIES BY TYPES AND SIZE OF
EMPLOYMENT 1971
I Agro·Based Industry
II .~ !'"orest !lased Industry
1/1 ~ l.:.ivestock and Fisli· Bo sed UiI (ndust ry
'"
:; .. 0
"
1\/ ill Textile Industry 2~ :
\/ ~ Mineral Basl!d Industry
VI 0 Engineering Industry
\/11 I Chemical Industry
VIII I Miscellaneous Industles
\
o . .. '"
Q::
V'
28 :
12
II
10
0 0 08
~ '" 7
'" "' " 6 0: 0
35
~
.~.
.~
MAP NO 59
Q.
2
"' .. ao~
20:
lOA ~~o.;.#I~~o· .. )
10
'" " .. .... z
.. " "
20
'" " '" .. "'0
\..
... "'0 30 z ~o I
.. 0"
B
-.
H
30
.. 20 '" ..
10
" ... " '"
(J
" 3:_ ~ 0 ~I V~V~IIU:Vtlll::l;II"'II;!\1j, ·V·llbV;;,..)'
R ;; ~ tAL~UTTA o .. Ii" !:I to
", ,. i' ~!i!~)~!.~ :1 ').~ . (:' x}r
80UNDARIES :-IntcrnatiDnlll ........ _._._ State ................. _._._ District .............. ,_._._._ 8 Pocket of Birbhum district C " Cooch Schar district eD ,. "Bangladuh
kill 16 0 16 32 48 64 80 96 km 8-4y ~ G CJ OF BENGAL
r A N
; t . i
(I ~-

60
The map shows eight types of non-household industries according to their size of employment in each district of the state in 1971.
Histograms have been drawn for each district proportionate to the total employment strength of each type of industry. The bars are arranged according to the size of employment from highest to lowest and shaded according to the category of industrial activities as shown in the legend of the map. The absolute and percentage scales are shown respectively on the left and right sides of the bar diagrams respectively.
Textile industry occupies the premier position (31.93 % ') in the state as a whole as well as in the districts of Nadia (42.96%), Twentyfour Parganas (46.21 %), Howrah (41.88 %), Booghly (51.06%) and Midnapore (20.21 %). In the districts of MaIda (18.01 %), Murshidabad (26.57%) and Birbhum (15.96%) also textiles industry occupies important place. Most of the textiles workers are engaged in cotton spinning, cotton textiles in mills and in. handlooms (other than Khadi) ; Jute and mesta-spinning and weaving; manufacture of jute bags and all types of textiles, garments including weaving apparel.
Mineral-based industries occupy the next important position employing 16.68 % of the workers in non-household industries in the state. Burdwan leads the districts with as much as 51.06 % of non-household industrial workers being engaged in mineral-based industries.
The iron and steel industries of Durgapur-Asansol are the main employers in the category. Manufacture of structural clay products, earthen pottery and glass & glass products is important in the districts of Nadia, Twentyfour Parganas. Hooghly and Midnapore etc.
Engineering industries also are 'equally important as the third largest employer (15.84%). These are located mainly in Twentyfour Parganas (16.96%), Howrah (18.68%), Hooghly (14.15%), Burdwan (19.40%), Midnapore (13.64%). and Calcutta (17.43 %). In Twentyfour Pargamis, Howrah and Calcutta manufacture of machine tools, parts and repair of non-electrical machinery etc., are the main engineering industries while in Hooghly automobiles and spares are the most important. Manufacture of locomotives, bicycles, cycle-rickshaws are likewise important industries of the category in Burdwan and Midnapore.
Agro-based industries occupy the premier position in the districts of Jalpaiguri (43.98%), West Dinajpur (2.24%), Maida (29.34%), 'Murshidabad (44.57%), Birbhum (51.34%), Bankura (24.34%) and Purulia (45.31 %).
W 0 R K E R SIN 00000
0 2 5
IV
V
VI
VIII 145624
I 132249
II
VII
0 ~ 10 15 20 .25 30 35
PERCENTAG E
1 g.i:22t@ ) ............ J II '. '':.' .:.',' .: ..........••.
,. ',' ., ..... ,., ..... , ... III ijijjjji@@ii@@!!i!@i! AGRO-BASED INDUSTRIES FOREST-BASED INDUSTRIEs LIVESTOCK "
FISH-BASl D INDUSTRES TEXTILE INDUSTRIE S
V '/////~ VIIL",_ ___ -l VII VIII 11111111111111 II MINERAL-BASED INDUSTRIES E~GINEERING INDUSTRIES CHEMICAL INDUSTRIES MISCELLANEOUS INDUSTRIES
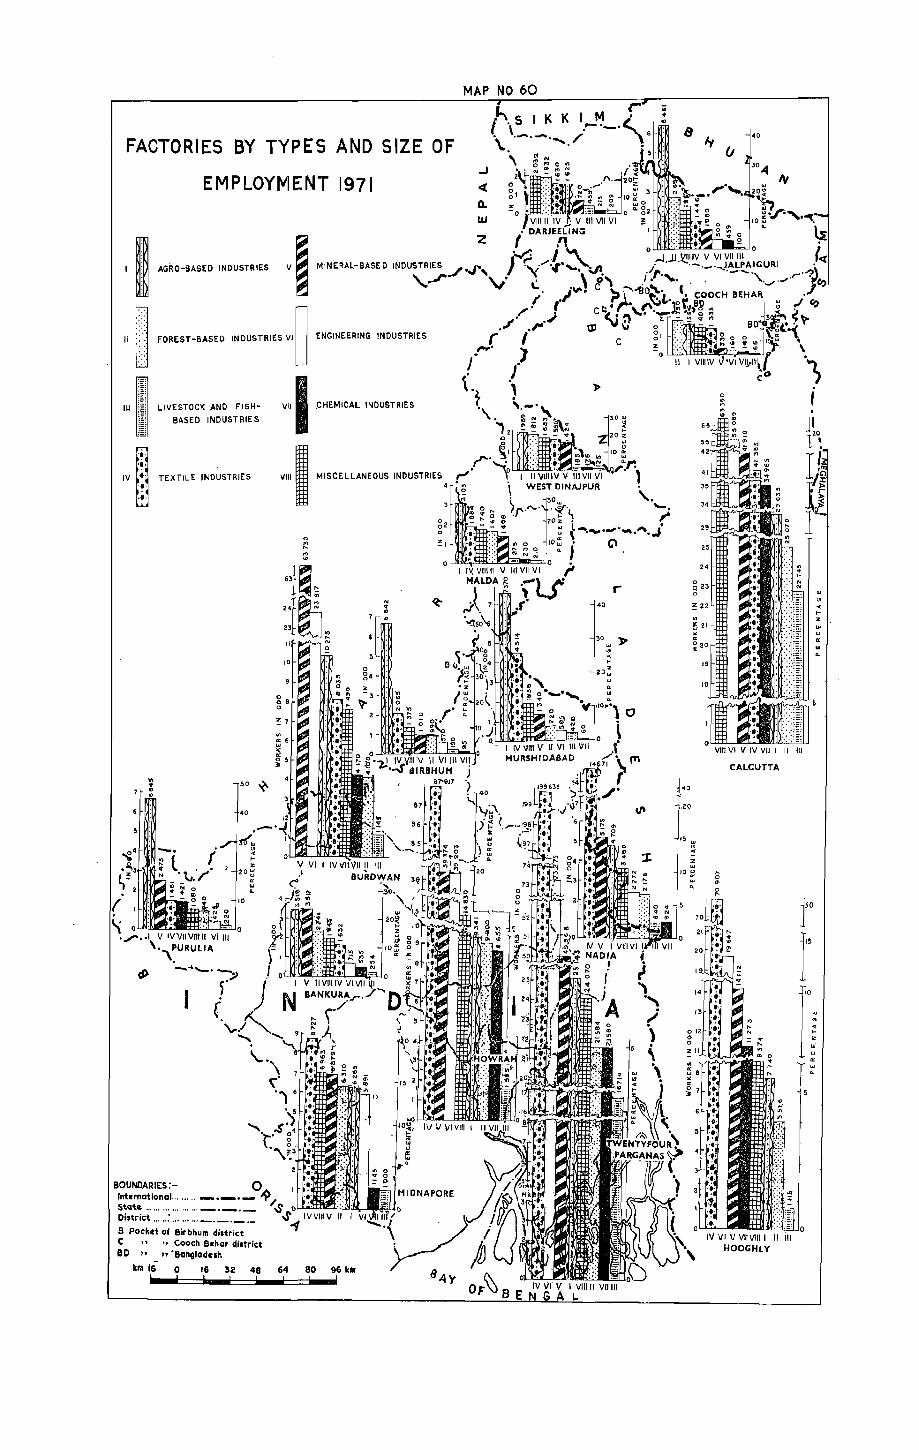
FACTo.RIES BY TYPES AND SIZE OF
EMPLOYMENT 1971
AGRO-BASED INDUSTRIES
FOREST-BASED ENGINEERING INDUSTRIES
LIVESTOCK AND FISH
BASED INDUSTRIES
.CHEMICAL INDUSTRIES
. IV TEXTILE IND~STRIES ~ .
50 ~
40
.-' ~'"
<.'>
" I-z
·20~
'" '" ..
BOUNDARIES:- 0 International ... " ... _._._ ~/ State .................. _ • _. _ oS o.w...clIlE::C;,J~.-
Oittrict .. , .. :... ... ... oS IV VIII V II
B Pocket 01 Birbhu:~ist~;:;'- -1 C .. Cooch Bchor di$tritt 80 " " '8ongladnll
km 16 0 16 32 48 64 80 96 kill
N .. ..
o
MAP NO 60
.J
«
UJ
I IV. VIII II V III VII VI HALDA 12.
,).7 ., 50\
r-40
30 ~ "' <.'> -< I-
20~
2~
24
0 q 23 0
~ 22
21
20
19
18
" o en
CALCUTTA
IV VI V VII VIII I II ill HOOGHlY
'" <.'>
'" I-
u a:
t r r~ ..
'" ..
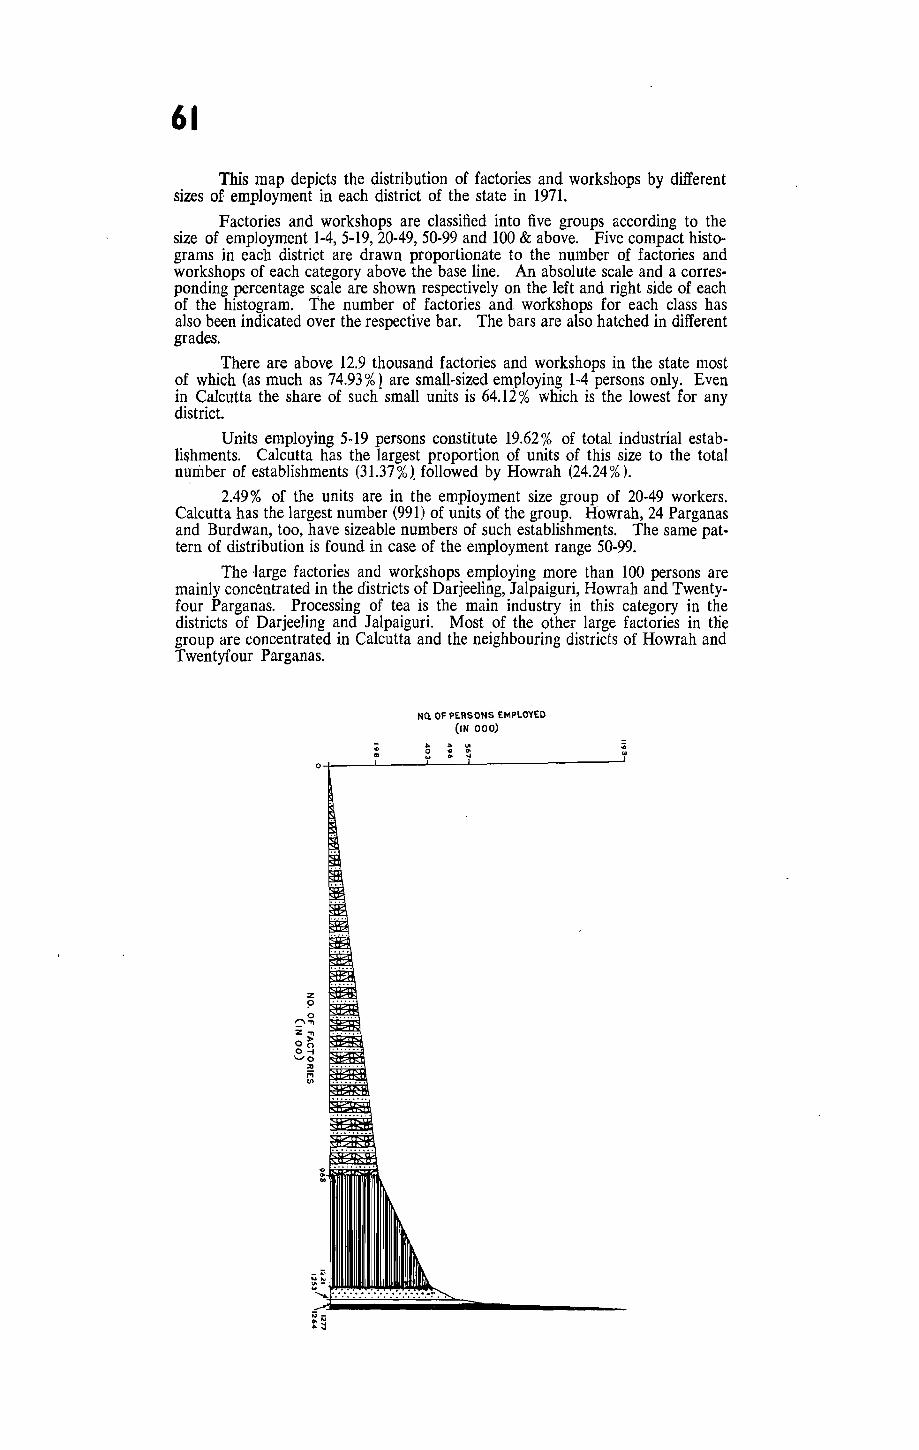
61
This map depicts the distribution of factories and workshops by different sizes of employment in each district of the state in 1971.
Factories and workshops are classified into five groups according to the size of employment 1-4,5-19,20-49,50-99 and 100 & above. Five compact histograms in each district are drawn proportionate to the number of factories and workshops of each category above the base line. An absolute scale and a corresponding percentage scale are shown respectively on the left and right side of each of the histogram. The number of factories and workshops for each class has also been indicated over the respective bar. The bars are also hatched in different grades.
There are above 12.9 thousand factories and workshops in the state most of which (as much as 74.93%) are small-sized employing 1-4 persons only. Even in Calcutta the share of such small units is 64.12 % which is the lowest for any district.
Units employing 5-19 persons constitute 19.62 % of total industrial establi~hments. Calcutta has the largest proportion of units of this size to the total number of establishments (31.37 %). followed by Howrah (24.24 % ).
2.49% of the units are in the employment size group of 20-49 workers. Calcutta has the largest number (991) of units of the group. Howrah, 24 Parganas and Burdwan, too, have sizeable numbers of such establishments. The same pattern of distribution is found in case of the employment range 50-99.
The -large factories and workshops employing more than 100 persons are mainly concentrated in the districts of Darjeeling, Jalpaiguri, Howrah and Twentyfour Parganas. Processing of tea is the main industry in this category in the districts of Darjeeling and Jalpaiguri. Most of the other large factories in the group are concentrated in Calcutta and the neighbouring districts of Howrah and Twentyfour Parganas.
z !=> o
0" z.., o~ O-i '-'0
:0 iT; 1/1
NQ. OF PERSONS EMPLOYED (IN 000)

FACTORIES AND WORKSHOPS BY SIZE OF EMPLOYMENT
.. .. a :r .. " II a ]:
o Z
"
" :e .. .. I
20
" 0( ]:
... Q
" Z UJ 0( ~ i( o 0 ... 0
I 0 ~ ~ u 0
" ~ z ... -10 o a:
'" .. :!
" z
"! ~ ~ ~ + - Il'I 0 6 g .. '" -
PERSONS
SIZE OF EMPLOYMENT
WESt BENGAL
., "
l~ \
{70
a: a
.. lI)
~ .. a
a o o
:
I ~~./ C (30 ~
}
50
l1l'i l • UJ
:i! .~/ u 20 II
PURULI ~
FACTORIES/WORKSHOPS WITH UNSPECIFIED NO. OF PE RSON S ARE NOT SHOWN IN THE MAP
1971
., " o
km 16 0 16 32 48 64 80 9& km
a a a z
.. L~
'" '"
..J
~
0. w
z
1
6S
BO
75 .. " i! z
20 '" <.J It
.. N
+ o
r " " 20>-z UJ u
" "'
.. .. .. ::: fCI
.. (/)
22
10
21
.., '" en CJ'I
~ J j ~ N 41) ~
PERSONS
CALCUTTA
A,
60
.. " 0(
... z
..

62 Scheduled castes occupy a very important position in tne demographic and
social scene in West Bengal. Every fifth person in the state belongs to a scheduled castes .. They are scattered with varying thickness throughout the state with sizeable concetrtrations in some areas as in the two North Bengal districts of Cooch Behar and J alpaiguri and also in the districts of Bankura and Birbhum in the western region. The largest numerical concentration of the scheduled castes is, however, found in the district of 24 Parganas, although their proportion to the total population in the district (22.60~~) is not as impressive.
In all the districts of the state except Calcutta the scheduled castes constitute more than 10 % of the population. Their proportion is the highest in the district of Coach Behar (47.03 %). In the neighbouring district of Jalpaiguri, too, the proportion is very high (34.02 %). The city district of Calcutta has the lowest percentage of 3.78 only. The following statement will show the percentage of scheduled castes in the total population in the district.
State/District
WEST BENGAL.
Coach Behar Jalpaiguri Birbhum Bankura Burdwan . West Dinajpur Twentyfour Parganas . Nadia
Percentage of S.C. in
total popUlation
19.09
47.03 34.02 30.00 28.22 24.01 23.10 22.60 21.32
State/District
Hooghly MaIda Purulia Midnapore . Darjeeling . Murshidabad Howrah Calcutta
Percentage of S.C. in
total population
19.08 16.48 14.99 13.57 12.57 12.48 12.31 3.78
If the proportion varies widely from district to district it varies even more sharply from police station to police station within the districts. The proportions have been divided into seven ranges and the police stations are shown grouped against these in the following statement.
NumBer Range (per cent) of police
stations
Above-35.00 • • • • • 0 36
30.01-35.00 36 25.01-30.00 42 20.01-25.00 32
15.01-20.00 33
10.01-15.00 52
10.00 & below 6
There are 36 police stations in the highest range of 35 % +. They include all the eight police stations of Coach Behar. 5 of the police stations of J alp aiguri, 3 of West Dinajpur, 2 of Nadia and a few more of southern 24 Parganas, Burdwan and Bankura. The highest percentage of scheduled castes in a police station is observed in Mekliganj (70.20 % ') of Coach Behar which is followed closely by its neighbour Sitai (69.08 %). As the map indicates the scheduled castes are sparsely distributed in Maida, Murshidabad, Calcutta, Midnapore and Purulia.
The map shows the percentage of scheduled castes to total popUlation at ~he police station level in the state. The percentages are grouped into seven ranges which are shown by seven different types of hatching by choropleth technique.
PERCENT~GE •
• REA .11 IIi" lill] I III 111111[~~~r~~~~E~=:~r::: j j.::: :::::::j: ::'J o 9'82 16"51 21"89 29'01 41"eO 62'63 84'34
(IN 000 km')
PERCENTAGE
o 31'73 49'21 60'66 72'84 86',65 91'911()O'00
SCHEDULED TRIBES .. 11111111111 1IIIIIIIIIIIIIIIIIIIIIIIr~:f:1 o 804 1247 1537 18'45 21'95 24'80 25'33
~N 00 000)

, SCHEDULED CASTES . 1971
NEIGHBOURHOOD
o
""~.I· .$11·' BOUNDARIES:- ,. Intlrnational " • Stat. . ....... _....-.._.-Di.trict·· .... · .. · .. · ... _._._.- ) -subdivi.i~~"'" ...... _. _._ ._._O ----policCitati·~~·. ::: ::: ~ - - - - - - .p ;._ -.(" ...................... / '. B pocket of BirbhulD di.trict .s ~o " .. Cooch Behar di.trict .s
" "Bangladesh kill 1& 0 1& 32 '1 LCiSn J !. J "8 64 80 96 kID _ _ L d I !
MAP NO. ~21
..J
-< Q.
UJ
'0 c
PERCENTAGE OF SCH I TO TOTAL POP~~~~~NCASTES
35'01 & ABOVE
30'01 - 35'00
25'01 ---' 30'00
20'01 - 25·00
S.A.12·90
15'01 - 20'00
10'01 - 15'00
10.90 & BELOW
BENGAL

63
The map shows the proportions of scheduled tribes to total population in each police station of the state. The percentages have been worked out for each police station and then arranged under seven groups as shown in the legend of the map. Seven different types of hatching by choropleth method have been used in the map. The police stations which have no scheduled tribe population have been left blank.
The scheduled tribes constitute 5.72 % of the population of West Bengal. As the map reveals the proportions of scheduled tribes are quite heavy along the northern fringe of J alpaiguri, in some parts of the north-eastern MaIda and in the westernmost districts of Midnapore and Purulia .• The statement below shows the number of police stations grouped under seven ranges of the percentages.
Range (per cent)
25.00 and above 20.00-24.99 15.00-19.99 10.00-14.99 5.00- 9.99 1.00- 4.99
Number of police
stations
25 11 14 19
43 18
Less than 1.00 92
The highest percentage of scheduled tribes in the total population for any police station is found in Mitiali in district Jalpaiguri (53.15 %). Banduan in Purulia district hasl the next highest percentage of 51.86. There is a third police station where the percentage of scheduled tribes exceeds 50. This is N agrakata in district Jalpaiguri (51.14%). Only 3 police stations namely, Chapra in Nadia and police stations Kulpi and Mandir Bazar in 24 Parganas do not have any scheduled tribe population at all.
Districtwise, J alpaiguri has the highest proportion (24.49 %) of scheduled tribes in the population. In Calcutta the proportion is the lowest (0.08 % ). Being tied to the soil in the rural areas and because, of their economic and educational backwardness it is only natural that the scheduled tribes are confined mostly to the rural areas and are rarely seen in the industrialised and urbanised areas like Calcutta or Howrah as will be illustrated by the inset map of the Calcutta metropolitan area.
The proportions of the scheduled tribes to total population in the districts are shown below in the descending order.
Percentage of S.T. to
State/District total po-pulation
State/District
Percentage of S.T. to total po. ,pulation
WEST BENGAL. . 5.72
Jalpaiguri . Purulia Darjeeling . West Dinajpur Bankura Maida Midnapore. Birbhum .
AREA
SCHEDUI.ED CASTES
24.49 19.58 13.89 11.90 10.28 8.11 8.04 1.05
Burdwan Hooghly Twentyfour Parganas • Nadia. Murshidabad Cooch Behar Howrah Calcutta
PERCENTAGE
5.84 3.48 1.64 1.43 1.32 0.15 0.14 0.08
111111_111111111111~lllllllrr~~F.···.···:·.!.!.! ••••• ·.'J o 12'15 23'70 37'29 46'37 55'67 70"91 84'3<1
(IN OOOKmZ)
PERCENTAG£
[111111111111_1111I11!1~11111'~~~~~i'.·.J o 22'6' 38"81 53"28 63'81 71'95 81'29 88'15
<IN 00000)
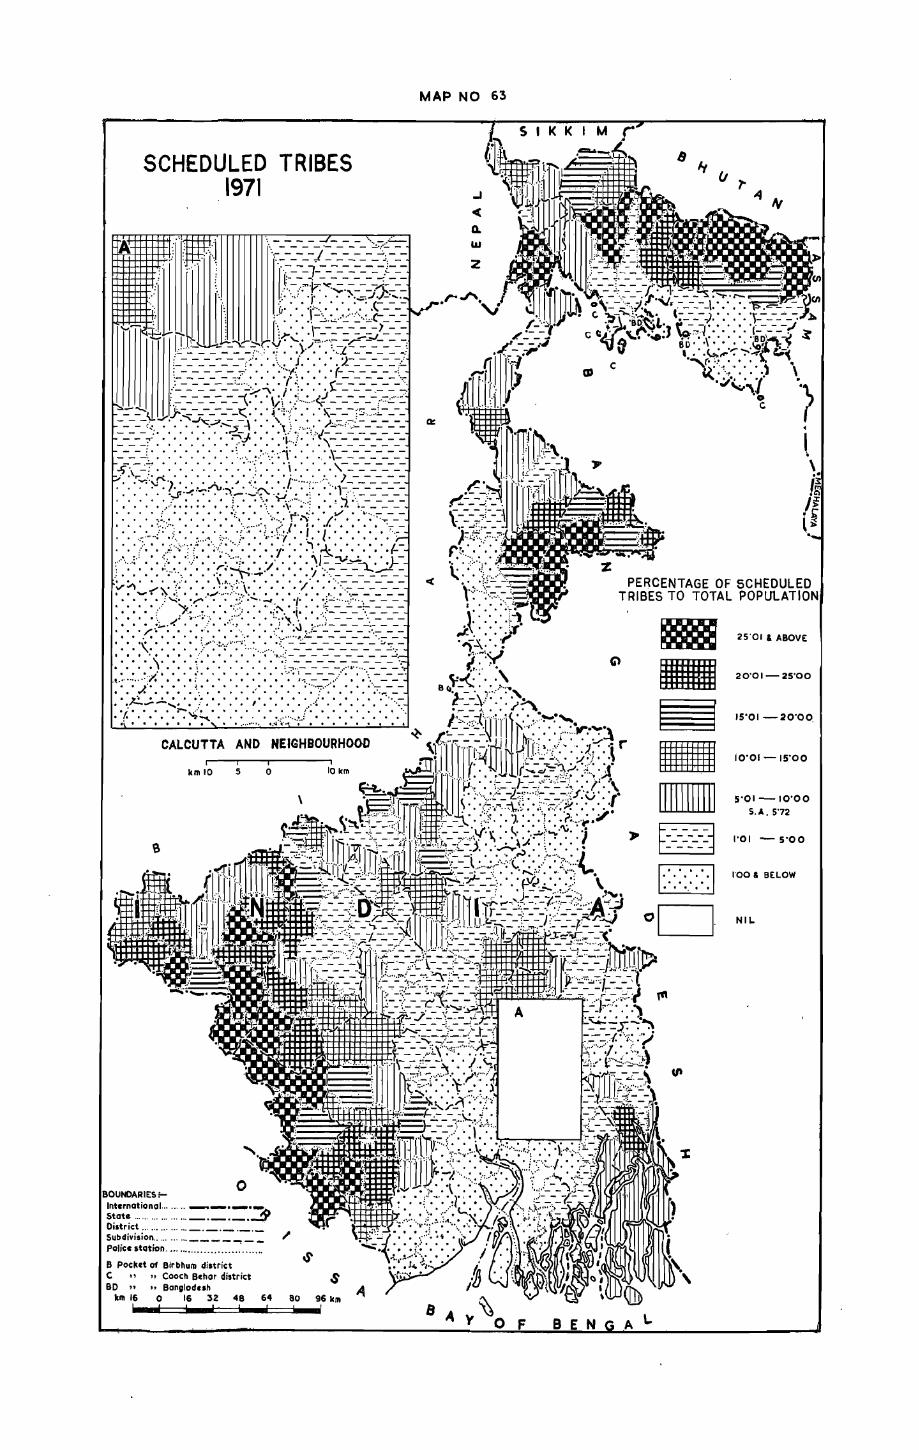
SCHEDULED TRIBES 1971
kmlO
BOUNDARIES !-o
InternationaL ...... --'-'3 State .................. _._._. . District ............... _._._._._ " Subdivision .... , ...... ____ .... __
Police Itation ............................. .
8 Pocket of Bir bhum district C " "Coach Behar district $ 80 " "Bangladuh
km 16 0 16 32 48 64 80 96 km
MAP NO 63
4-I,&J
2
BEN Al..
1& III §
1&1
-F::J ~
25'01 & ABOVE
20'01- 25'00
15'01 - 20'00.
iO'OI - 15'00
5'01-10'00 S.A.5·72
1'01 - 5'00
1'00 & BELOW
NIL.
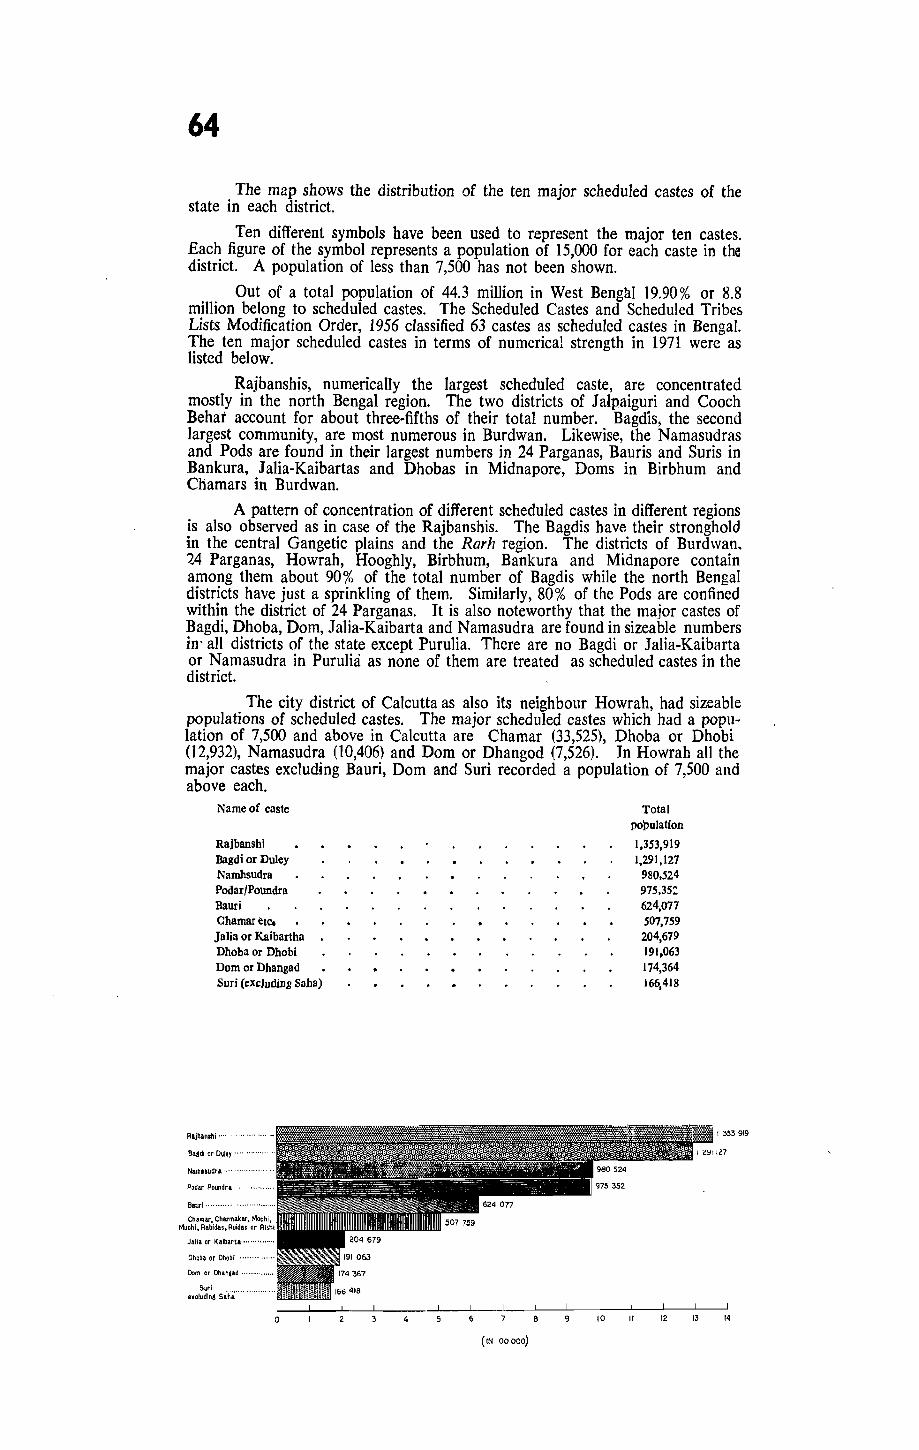
64
The map shows the distribution of the ten major scheduled castes of the state in each district.
Ten different symbols have been used to represent the major ten castes. Each figure of the symbol represents a population of 15,000 for each caste in the district. A population of less than 7,500 has not been shown.
Out of a total population of 44.3 million in West Bengal 19.90% or 8.8 million belong to scheduled castes. The Scheduled Castes and Scheduled Tribes Lists Modification Order, 1956 classified 63 castes as scheduled castes in Bengal. The ten major scheduled castes in terms of numerical strength in 1971 were as listed below.
Rajbanshis, numerically the largest scheduled caste, are concentrated mostly in the north Bengal region. The two districts of J alpaiguri and Cooch Behar account for about three-fifths of their total number. Bagdis, the second largest community, are most numerous in Burdwan. Likewise, the Namasudras and Pods are found in their largest numbers in 24 Parganas, Bauris and Suris in Bankura, lalia-Kaibartas and Dhobas in Midnapore, Doms in Birbhum and Chamars in Burdwan.
A pattern of concentration of different scheduled castes in different regions is also observed as in case of the Rajbanshis. The Bagdis have their stronghold in the central Gangetic plains and the Rarh region. The districts of Burdwan. ~4 Parganas, Howrah, Hooghly, Birbhum, Bankura and Midnapore contain among them about 90% of the total number of Bagdis while the north Bengal districts have just a sprinkling of them. Similarly, 80% of the Pods are confined within the district of 24 Parganas. It is also noteworthy that the major castes of Bagdi, Dhoba, Dom, Jalia-Kaibarta and Namasudra are found in sizeable numbers in' all districts of the state except Purulia. There are no Bagdi or lalia-Kaibarta or Namasudra in Purulici as none of them are treated as scheduled castes in the district.
The city district of Calcutta as also its neighbour Howrah, had sizeable populations of scheduled castes. The major scheduled castes which had a population of 7,500 and above in Calcutta are Chamar (33,525), Dhoba or Dhobi (12,932), Namasudra (10,406) and Dom or Dhangod (7,526). In Howrah all the major castes excluding Bauri, Dom and Suri recorded a population of 7,500 and above each.
Name of caste
Rajbanshi Bagdi or Duley Namhsudra Podar IPoundra Bauri Chamaretc. Jalia or Kaibartha Dhoba or Dhobi Dom or Dhangad Suri (excJud.ins Saba)
Rajban.hi ....
Basdi or Dul.y
Namasudra'·· ............ " .. ,.
Podar Poundra .
6aurl··········· ......... .
Jali. or Kalbarta .......•......
Dhoba or Dhobi ............. .
Dom or Dh,njad ............... .
Suri Ixcludlng Soh;,: ....... .
o 3 4 5 6 7
(IN 00000)
a 9
Total population
1,353,919 1,291,127
980,524 975,35: 624,077 507,759 204,679 191,063 174,364 166,418
1353919
10 II 12 13 14

MAP NO 64
h SIKKIM
I " ,-'-.......................... / \.. '
'\ DARJEEllNG DISTRIBUTION OF NUMERICALLY
10 MAJOR SCHEDULED CASTES 1971
_. \.. f._· , ~. /' .,. ....... : ~ (> .•••••• ~ ••• ;
I r" I... IALPAIGURI •
• RAJBANSHI
o BAGDI OR DULEY
IA NAMASUDRA
B PODOR POUNDRA
l:. BAURI
.A. CHAMAR. CHARMAKAR, MUCHI. RABIDAS. RUIDAS OR RISHI
6. JALIA OR KAIBART A
e DHOBA OR. DHOBI
• DOM OR DHANGAD
o SURI EXCLUDING SAHA
EACH SYMBOL REPRESENTS 15000 PERSONS
,
CALCUTTA
Z i ~ •••• ~~~~~~o . ~ rl. ..., ) !" .•.•• '" '-,. . .., "\. -v.., .~
,,,,_ '" • , . \ 0\ V 'JVO. C
/ ," ,,'. c ,J" .~ , .,.
r I .,_. )
! i {'t '1
" ,.-', , '\ , .
,..
o
c . , • \
•
•
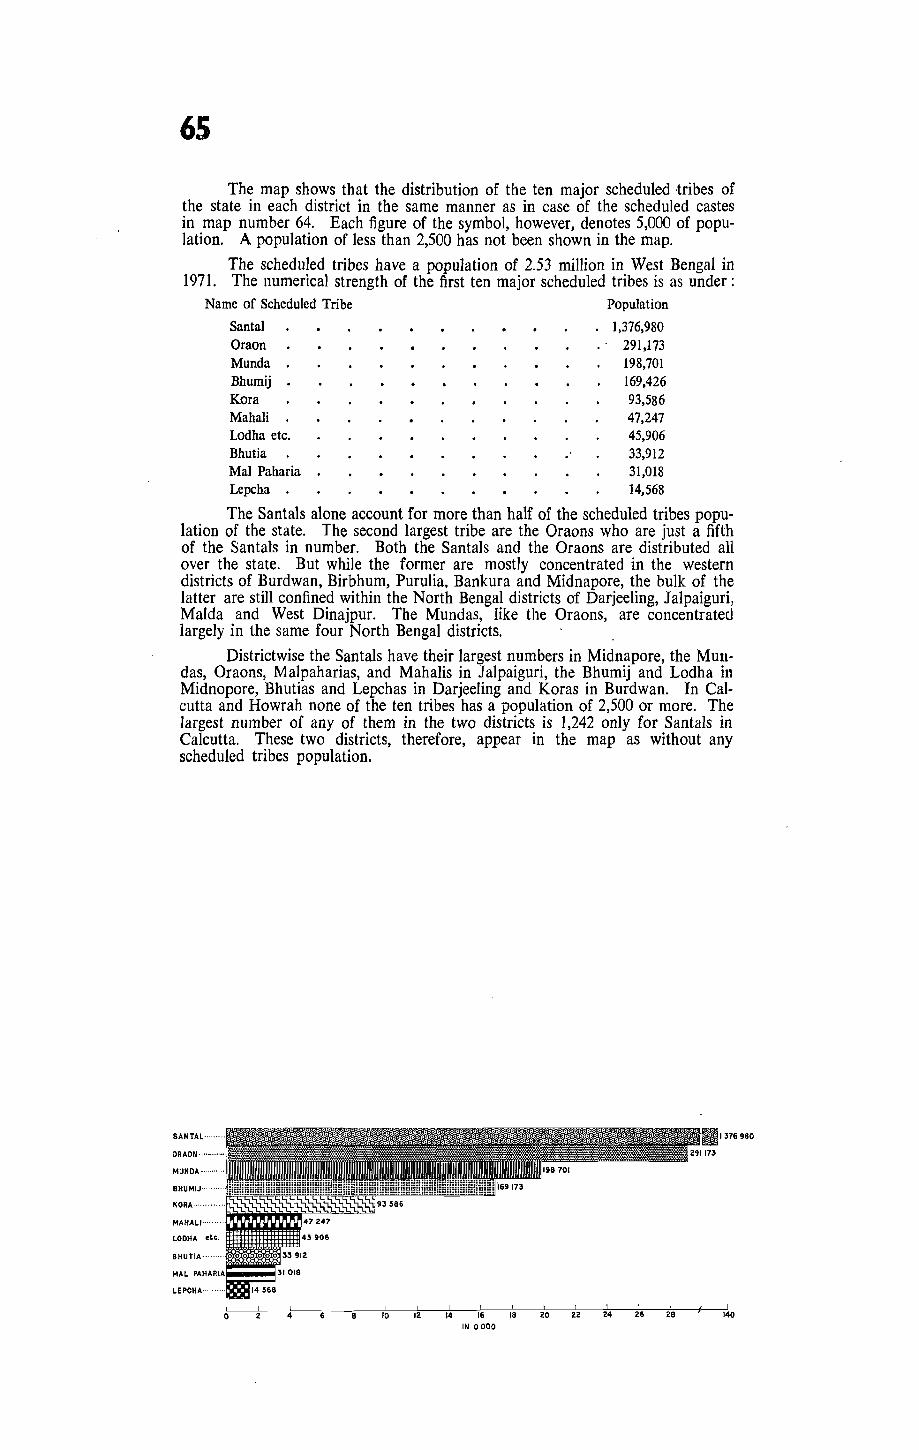
6S
The map shows that the distribution of the ten major scheduled tribes of the state in each district in the same manner as in case of the scheduled castes in map number 64. Each figure of the symbol, however, denotes 5,000 of population. A population of less than 2,500 has not been shown in the map.
The scheduled tribes have a population of 2.53 million in West Bengal in 1971. The numerical strength of the first ten major scheduled tribes is as under:
Name of Scheduled Tribe Population
Santal . 1,376,980 Oraon 291,173 Munda • 198,701 Bhumij 169,426 Kora 93,586 Mahali . 47,247 Lodha etc. 45,906 Bhutia 33,912 Mal Paharia • 31,018 Lepcha . 14,568
The Santals alone account for more than half of the scheduled tribes population of the state. The second largest tribe are the Oraons who are just a fifth of the Santals in number. Both the Santals and the Oraons are distributed all over the state. But while the former are mostly concentrated in the western districts of Burdwan, Birbhum, Purulia. Bankura and Midnapore, the bulk of the latter are still confined within the North Bengal districts of Darjeeling, Jalpaiguri, MaIda and West Dinajpur. The Mundas, like the Oraons, are concentrated largely in the same four North Bengal districts.
Districtwise the Santals have their largest numbers in Midnapore, the Mundas, Oraons, Malpaharias, and Mahalis in Jalpaiguri, the Bhumij and Lodha in Midnopore, Bhutias and Lepchas in Darjeeling and Koras in Burdwan. In Calcutta and Howrah none of the ten tribes has a popUlation of 2,500 or more. The largest number of any of them in the two districts is 1,242 only for Santals in Calcutta. These two districts, therefore, appear in the map as without any scheduled tribes population.
SANTAL·,,····
ORAON·"'··',,·, "
MUNDA '
BHUMIJ",,'"''''
KORA,,"" .
M ... H ... LI .......... !I!. LODHA .~t.
BHUTIA" .. ····.. 33912
31018
LEPCHA······· ..
0~-+--+4----.k--8 10 12 14 16 18 20 22 24 26 28
IN 0000
1376980
140
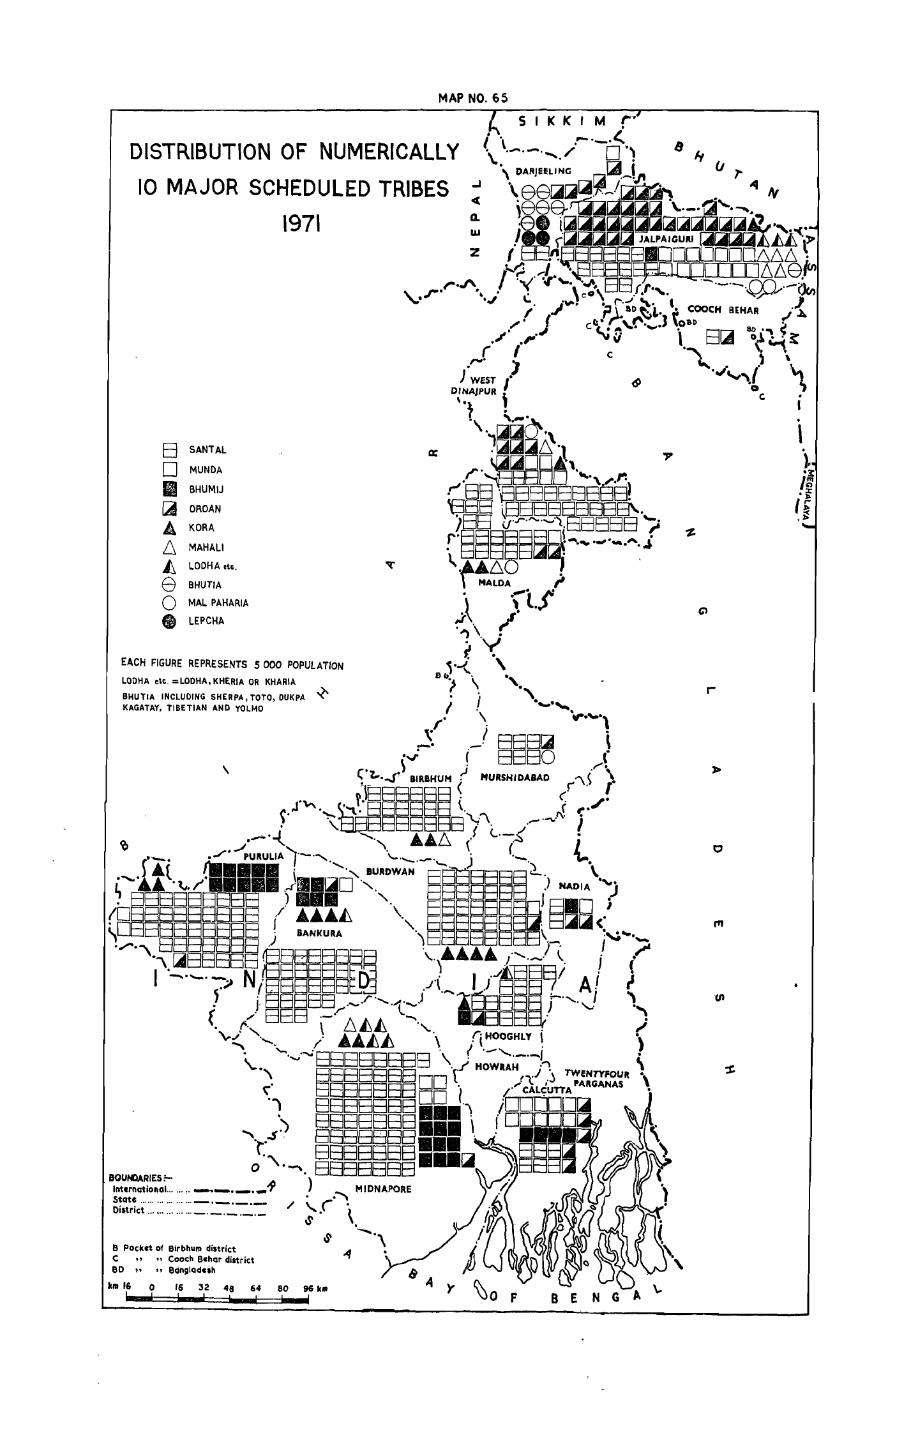
MAP NO. 65
DISTRIBUTION OF NUMERICALLY
10 MAJOR SCHEDULED TRIBES
1971
8 SANTAL
o II 1:4 A D ~ e o •
MUNDA
BHUMIJ
OMAN
KORA
MAHALI
LODHA ctG.
BHUTIA
MAL PAHAFlIA
LEPCHA
EACH FIGURE REPRESENTS S 000 POPULATION
LODHA dc. =LODHA. KHERJA OR KHARIA
BHUTIA INCLUDING SHERPA, TOTO, DUKPA -<' KAGATAY, TIBETIAN AND YOlMO
\
B Pocket 01 Bir bhum district C .. "Cooch Bchor district B 0 " "BdnglQduh
kID 16 0 16 32 48 64 80 96 km
SII(I(IM r '\ .-._.l.. .-.-....... / " . . \ DAR}EELJNG
...I '\ • Q><~~~~g~!~ a. UJ
z
8 E N
. \
o

66
A little less than fourfifth (78.11 %) of the population of West Bengal are Hindus by religion. The Muslims constitute 20.46% of the population. The followers of the other religions are negligible in number in the state as a whole. Christianity, Buddhism and Saridharma are the only other religions with more than a hundred thousand followers each. At the district level, however, Buddhism is quite important in Darjeeling claiming the following of 11.68 % of the population. Christians, likewise, constitute a sizeable proportion (3.18 %) of the population in J alpaiguri. The highest percentage of the Hindus in a district is observed in Purulia (92.89) which is followed closely by Bankura (90.85). r~e lowest percentage of Hindus is in Murshidabad (43.46) which happens to be the only district with a Muslim majority, 56.34 % of the population being the followers of Islam. Islam happens to be the second largest religion in all other disVicts except Darjeeling where the Buddhists occupy the second position and the Muslims are only 3.01 % of the population.
The percentage share of "other religions" is the highest in Bankura (4.10 %) followed by Purulia (2.04 % ).
The map shows the distribution of the religions in the districts of the state.
A square with 100 equal divisions has been drawn proportionately to the total population of each district, one small square representing 1 % of the total population. Eight different colours have been used in the map to represent six major religions, other religions and religion not stated. Again, this scale has been enlarged in case of one grid containing more than one religion.
HINDUS
MUSLIMS
CHRISTIANS
JAfNS
BUDDHISTS
SIKHS
...............•......... ( ... 111111111111111111111111111251 752
r;-;'iI32 203 ~
1 ........................ 1121504 ........................ r::::;:]35 084 ~
9064338
I I I I I I I I I I... I I I • I I o 40 80 120 160 200 240 280 320 360' 9040 9080 10120" 34600 34640
(IN 000)

MAP NO. 66
MAJOR RELIGIONS 1971 a.. w
DIVERSITY OF RELIGIONS
D HINDUS
MUSLIMS
D CHRISTIANS
JAINS
BUDDHISTS
SIKHS
OTHER RELIGIONS
RELIGIONS NOT STATED
~ , . . . ~ ~ .
~.-{ \ B v.·\ " }', .
c·
\ I'''' (. ,)
~." ',,'\ "'\.
i
I PURULIA , ,~"
"
I ' _,,,-.
_,,~. _'
\..." ~.
, ""'._.
'1
'" .$:) BOlN)ARIES ;- 'f.: "\
Intcmational ........ - _._._ • Stat •.................. _._._._ Diltrict ............... _._._._._
B Pockat of eirbllull district C " "Cooch Bellar district BD " "Ban9laduh
km 16 0 16 32 48 64 80 I
R.,. No. 7181HE'79-530'81
Sased upon Survey 01 India map wi,1I 'he permiuion of the Surveyor General of India.
Th. ,erritorial wnero of India .",end into ehe Ilea to a distanC1i of c .. "lve nautical miltit ,...aur.d from the .ppropriac .. bu. line.
• '2940
I
f
, . \..
'.,WfST DINAJPUIl ,;
~-.~,-.-,-.J
j ;,
3,148.746
NUMBER OF PERSONS 5000000
3.000000
2000.000
1000000
BENGAL PRINTID AT THllOI (H.L.O.) PIU .. r: .. G GROUP Of Suit'tlY '" I ........
© Government of I.dia copyriCht, 1979.
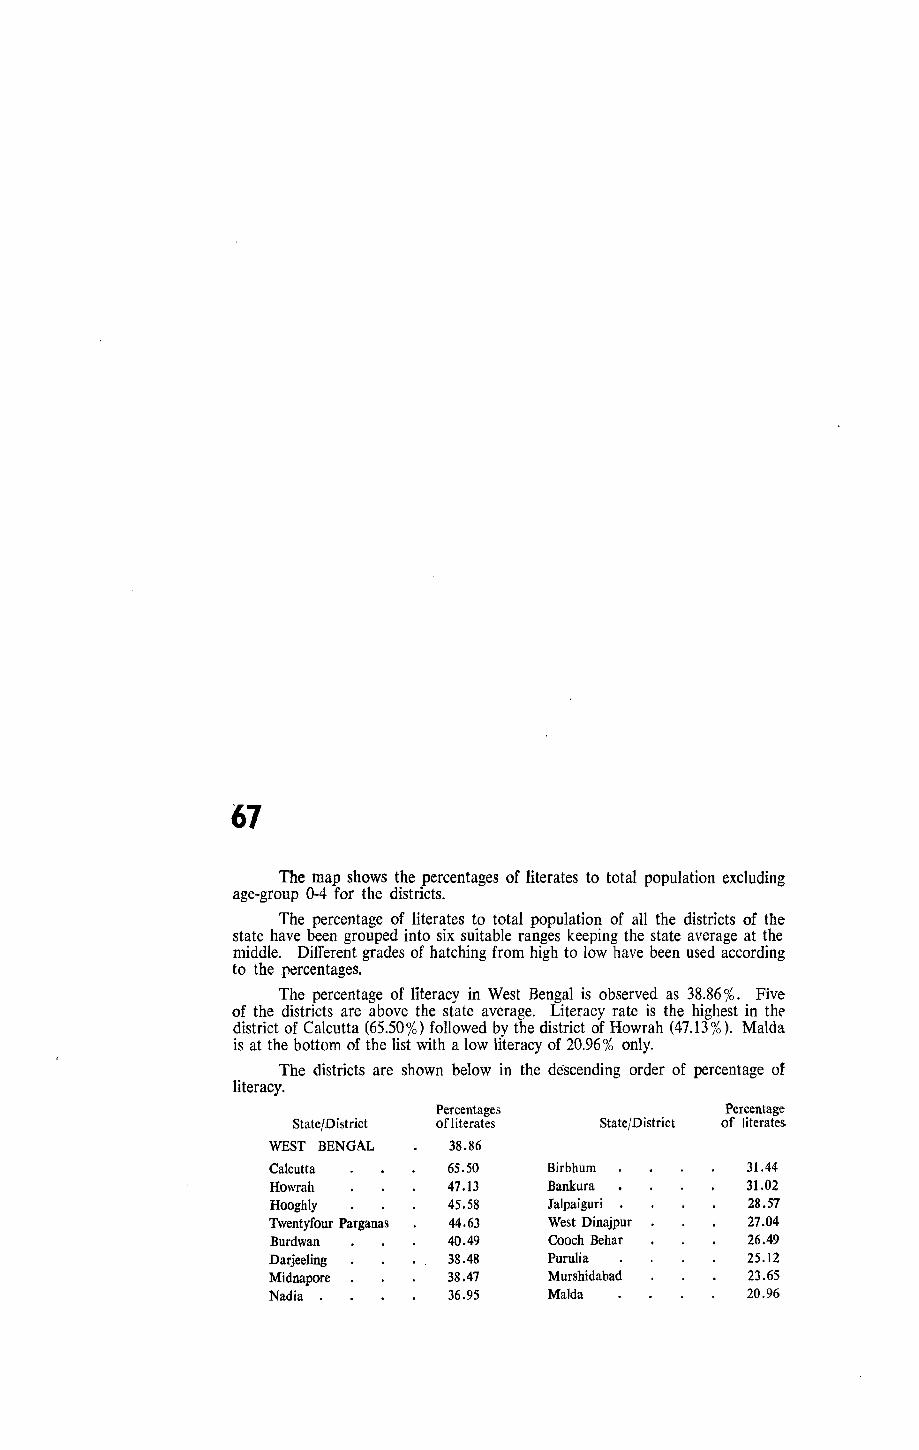
67
The map shows the percentages of literates to total population excluding age-group 0-4 for the districts.
The percentage of literates to total population of all the districts of the state have been grouped into six suitable ranges keeping the state average at the middle. Different grades of hatching from high to low have been used according to the .percentages.
The percentage of literacy in West Bengal is observed as 38.86 %. Five of the districts are above the state average. Literacy rate is the highest in thedistrict of Calcutta (65.50%) followed by the district of Howrah (47.13%). MaIda is at the bottom of the list with a low literacy of 20.96 % only.
The districts are shown below in the descending order of percentage of literacy.
Percentages Percentage State/District of literates State/District of literates
WEST BENGAL 38.86
Calcutta 65.50 Birbhum 31.44
Howrah 47.13 Bankura 31.02
Hooghly 45.58 Jalpaiguri . 28.57
Twentyfour Parganas 44.63 West Dinajpur 27.04
Burdwan 40.49 Cooch Behar 26.49
Darjeeling 38.48 Purulia 25.12
Midnapore 38.47 Murshidabad 23.65
Nadia 36.95 MaIda 20.96

LITE RACY 1971
PERCENTAGE OF TOTAL LITERATES IBJ '0'0' I ABOV,
III ""'" -"'00 ~ S.A.3S·86 ~ 35.01 -40.00
1& '''''' _,sao
~ "0' -roOO
[IT[]] "'00 I "'OW
(-. . _.> t --,
BOUNDARIES ...
,
PURULIA
o International ... " ... _ ....... _._ State .................. _._._._ 1> District ............... _._._._._
B Pocket of Birbhum district C " Cooch Bchar district 80 " "Sangladuh km16-o--r6~----'3~2""'-""'48=----'6"4-""8-=-O- 96 kill -<I
MAP NO 67
..J
. (t r.
) rl' ·1 -z. ~
"
'Il"
BENGAL The territorial wottn of Ift410 ultnd '.to the loCO to 0 'I~tcn't of t_rvif nautlc:OI aPes etCls.,.:d 'fro. \Il" ap,ro,rt(lt, base nne.

68
The map shows the percentage change in literacy during 1961-71 in each district of the state.
The percentages of literates to total population of each district for two census years 1961 and 1971 have been calculated. The difference between the percentages has been treated as gain if it is a positive value. There is no loss in percentage-change of literacy in any district. The percentage gains in literacy have been grouped into six suitable divisions keeping the state average at the middle as shown in the index. The districts have been hatched using high to low shades according to the percentage gain.
The state average of percentage-gain in literacy has been found as 5.51 % . There are 9 districts in which the percentage·gain is above the state average. The highest gain is observed in the district of 24·Parganas (6.47 %) followed by West Dinajpur (6.37 % ). Calcutta has recorded the lowest percentage gain (0.52 %). The percentage gain in Cooch Behar is 1.10 % only which indicates a very slow progress of literacy as compared to the other districts.
The percentage-gain in literacy during 1961-71 in the districts is shown below arranged on the descending order.
State/District Percentage gain in literacy
WEST BENGAL 4.51
Twenty Four Parganas • 6.47 West Dinajpur 6.37 Midnapore . 6.21 Burdwan 5.68 Jalpai!Uri 5.36 Birbhum 4.84 Darjeeling 4.72 Hooghly 4.66 Purlllia 4.58 Nadia. 4.41 Malda • • 4.32 Murshidabad. 4.25 Howrah 4.20 Bankura 3.86 Coach Behar 1.10 Calcutta 0.52

CHANGE IN LITERACY 1961-71
PERCENTAGE GAIN IN LITERACY
\
6,01 & ABOVE
5'01 - 6'00
4'51 - 5'00
S. A. 4,51
4'0. - 4'50
3'01 - 4'00
3·01 & BELOW
'B~KU~A
'110N_~'
BOUNDARIES: 0 International... ..... _._._._ -9 ~
State .................. _._._._ / District ..... , ." ..... . B Pocket of Birbhum district .s c " "Cooch eehar district .s 60 " "Bangladesh .., km 16 0 16 32 48 64 80 96 km
Q'
.9
MAP NQ 68
.~, S I I( K.~ M
69
Literac j among males is 49.57 % as against the total literacy rate of 38.86 % in the state. In six of the district literacy percentage among males exceeds the average total literacy. Districtwise Calcutta records the highest percentage of literacy (68.67) followed by Howrah (57.61), Hooghly (56.34), 24-Parganas (55.74) and Midnapore (53.02). In Burdwan the rate is just short of 50%. All these districts are highly urbanised attracting literate in-migrants and also offering better facilities for education. As in case of total literacy the lowest percentage of literates among males is found in the district of MaIda (29.95 % ). The district of Murshidabad, too, is not far above MaIda and has a low male literacy !of 31.94 % only. The statement below shows the literacy rates among males in the districts.
State/District
WEST BENGAL
Calcutta .
Percentage of literates among males.
49.57
68.67
State/District
Bankura
Percentage of literates
among males.
44.14 Howrah • 57.61 Birbhum 41.84 Hooply • 56.34 Purulia. 39.78 TWentyfour Par,!anas . 55.74 West Dinajpur 37.59 MidDapvre 53.02 JaJpaiguri • 37.18 Bvrdwan . 49.8& Coach Behar 37.03 Darjeelin, . 48.24 Murshidabad. 31.94 Natia 45.29 MaIda 29.95
The map shows the percentage of literates in the total male population excluding agengroup 0-4 by district.
The percentage of male literates of all the districts have been grouped into six suitable ranges keeping the state average (49.57 %)' at the middle. Various grades of hatching from high to low have been used according to these perccntalcs.
AREA
o IZOU PERCENTAGE 60°77 75"71 12°16 93°" 100°00 - - - - . ,.
MALE LITERATES
1°23 (000000 NI) 9°42 10°03

MALE LITERACY 1971
PERCENTAGE OF MALE LITERATES
III -~~ L;]
60'01 & ABOVE
50'01 _ 60'00'
S.A. 49'57 45'01 - 50'00
40'01- 45'00
3S'01 _ 40'00
E0l 'Ld 3S'00 & BELOW
(: '!:-_. )- -(
......... l
~-_--------"\" -------------
UNOARIE!:>:-
o
Inte'rnQtional .,. ~ .. -.-.-
,
State. . ... -._._.- / 'District ............. _._._._._
B pocket of Sir bhum district C " ., Cooch Bchar district
60 " .. Bangladesh
~
km 16 0 16 32 48 64 80 96 km "/ 8
MAP NO·69
z
•
"'r. =-=-~!.~-:~) r::: :
- - - - - _o ___ -_-_-_-_-_,. \ ... }::
t:: : : \,~:: ::~::'I:.~/:5~ ~N_"'!!'~A~~
, •. , ••...•. , t - - - - - - - -. ............ ,l-. ......... ," .. " -oS :hAALO"':::~ Z· .... ,
"I( ,: : ;
f ........... , .......... ......... o.
"
~ ,j: .... : .. ." .\ ... . '): .,,:; r. :::.'
I':.··.i ::::~ 1',/' ..... . e v,' I ..... . !~
A
:::::::::~ :.;"'j: :,.
\.';.j
0 F B
r
>
E N G
o
fI'
..
A
c
w CJ '0 « ... z w U It 40 w IL
20
0
\.

70
The map shows the percentage of literates in total female population excluding age-group 0-4 by district in the same manner as male literacy in map no. 69.
Poor rates of female literacy depress the general literacy rates i~ ~est Bengal as in many other states. The state average of female literacy has been a low figure of 26.56 % i.e. only one in four women in the state is literate. There are seven districts in which female literacy is above the state average. Calcutta has for obvious reasons, the highest rate of literacy among females for any district (60.34 %). It is significant that the rate is not far below the rate of male literacy. The next highest female literacy is in Howrah (34.04 %) which is way behind Calcutta's. Purulia which is one of the most backward of all the districts of the state in many respects 'has the lowest literacy among females (9.70%). MaIda, which has the lowest position as regards general literacy as also literacy among males has a slightly better showing in female literacy (11.25 %).
The districts are shown below according to female literacy percentages in the descending order.
Percentage State/District ofliterates
among females
WEST BENGAL . 26.56
Calcutta 60.34
Howrah 34.04
Hooghly 33.39
Twentyfour Parganas . 31.81
Burdwan 29.59
Nadia • 28.04
Darjeeling • 27.24
Midnapore . 22.88
AREA
o 14°23
FEMALE LITERATES
State/Districts
Birbhum
Jalpaiguri
Bankura
West Dinajpur
Murshidabad
Cooch Behar
Maida
Purulia
PERCENTAGE
PERCENTAGE 52°11 69°13
Percentage ofliterates
among females
20.64-
18.37
17.16
15.31
14.86
14.64-
11.25
9.70
100°00
° 5
83°49 91°56 100°00

FEMALE LITERACY 1971
PERCENTAGE OF FEMALE LITERATES
• • • ~ ---
L2J]···· ..... .... . ., ... .... .
\
35'01 & ABOVE
30'01 - 35'00
25'01 - 30'00
20'01 - 25'00
15'01 - 20'00
15'00 & BELOW
BOUNDARIES:- 0 International ... . , .. _._. __ ._ State " ........ , ...... _._._._ District ..... ,,"" "._._._._._ I
B Pock~t of Birbhum district oS C " "Coach Behar district BD " "Bangladesh
km 16 0 16 32 48 64 80 96 km !
MAP NO 70
..J
.: Q.
ILl
z
"...1\. '\.. . ...r. ,
BEN
III
~ 60 ... Z 1&1 V Ill: 40 101 A.
20
o
\..
z 0( m a: ~
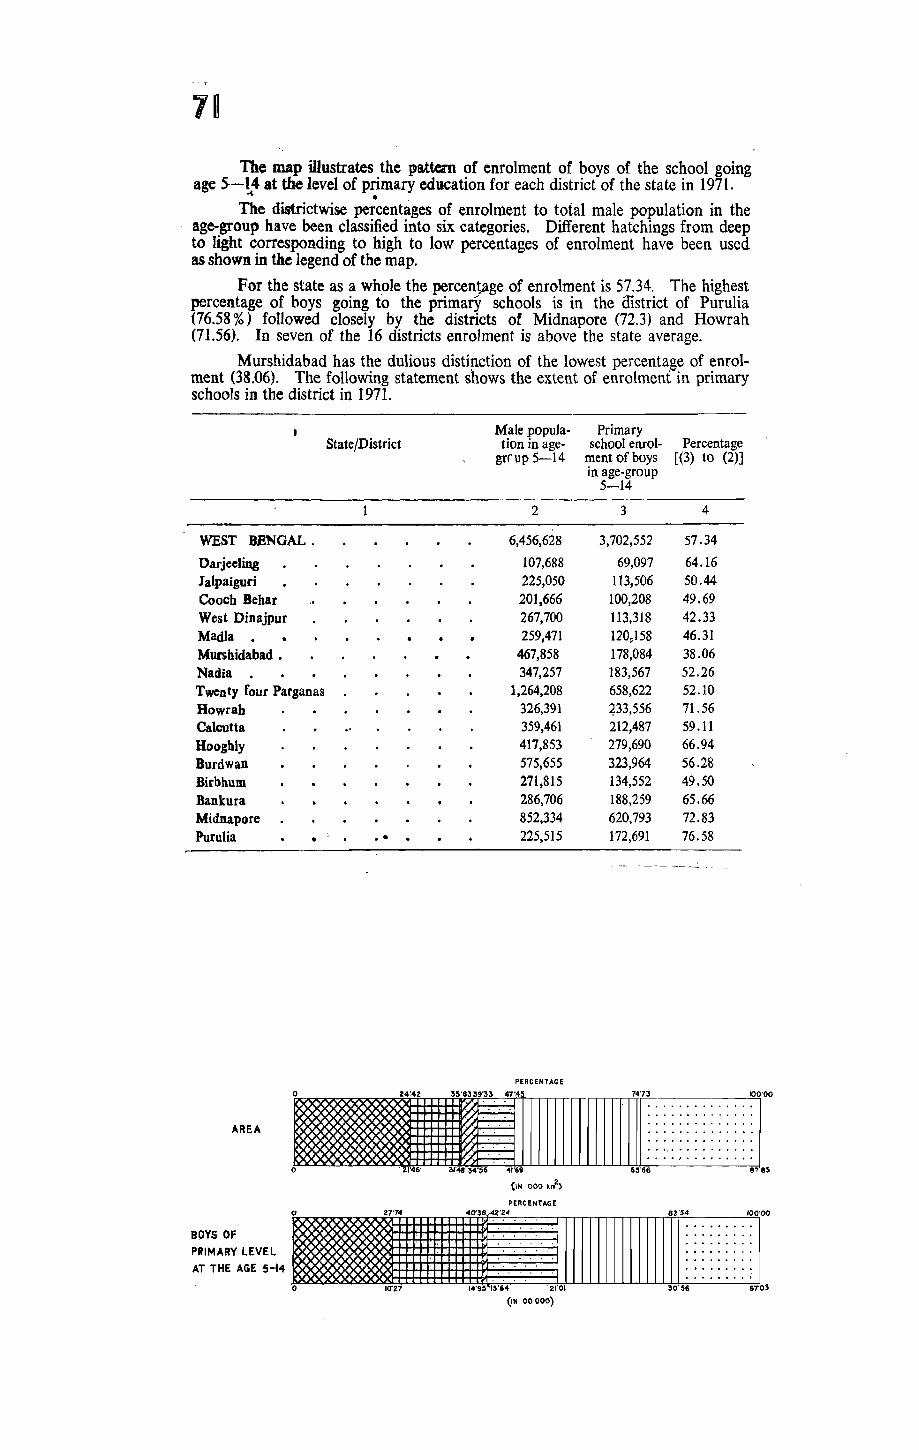
The map illustrates the pattern of enrolment of boys of the school going age 5--14 at the level of primary education for each district of the state in 1971.
~ . The districtwise percentages of enrolment to total male population in the
age-group have been classified into six categories. Different hatchings from deep to light corresponding to high to low percentages of enrolment have been used as shown in the legend of the map.
For the state as a whole the percentage of enrolment is 57.34. The highest percentage of boys going to the primary schools is in the district of Purulia (76.58 %) followed closely by the districts of Midnapore (72.3) and Howrah (71.56). In seven of the 16 districts enrolment is above the state average.
Murshidabad has the dulious distinction of the lowest percentage of enrolment (38.06). The following statement shows the extent of enrolment in primary schools in the district in 1971.
WEST BENGAL.
Darjeeling Ja1paiguri Cooch Behar West Dinajpur MadIa. • Murshidabad • Nadia • T wen ty four Parganas Howrah Calcutta Hooghly Burdwan Birbhum Bankura Midn.apore Purulia •
AREA
State/District
1
• •
.. .
Male popula-tion in age-
grrup 5-14
2
6,456,628
107,688 225,050 201,666 267,700 259,471
467,858 347,257
1,264,208 326,391 359,461 417,853 575,655 271,815 286,706 852,334 225,515
PERCENTAGE
(IN 000 krh PERCENTAGE
Primary school enrol- Percentage
ment of boys [(3) to (2)] in age-group
5-14
3 4
3,702,552 57.34
69,097 64.16 113,506 50.44 100,208 49.69 113,318 42.33 120~158 46.31 178,084 38.06 183,567 52.26 658,622 52.10 ~33,556 71.56 212,487 59.11 279,690 66.94 323,964 56.28 134,552 49.50 188,259 65.66 620,793 72.83 172,691 76.58
. -- - - -_ -- - -
:~~~~A~~V:~14 .11111111111l".· •• ···111111111111111f:: !:.: .T " 0 10'27 14·95 15"4 21'01 30' 56 67·03
(IN 00000)

MAP NO 71
~ SIt( t( 1 M r'
PRIMARY SCHOOL ENROLMENT OF BOYS 1971
~)7-' W!~Z 8 ~ ~~"L ••• ~~~~~ ~ ~ ITfi·-·"
PROPORTION OF BOY STUDENTS
TO TOTAL MALES OF AGE 5 -14 v-~~}I~~ .' flTIr~~;~JJnl
/." .. ,Vl. C :"o,':! .~. 10& :. : : : : .......... :..;:- .. J /"::: l' CCf.lI- \:"'~~')ft·· :~O.OC:H·BEH~R;:"..J\ ~
•... 70.01 • A80'I<
.-1: : :;-.''/ "V (} • .... a .... ::;: :~ •.. ~ > (. . . I : . . . , .. aD! ; ~
Jr.:: : : 'J c ,~ ~ : : ; : :.) \
•. ·65'01 -. 70'00
~ V : :-{ <t> "' .... ~{ \
.: : : : ''-' e { ~: ... , .. , . ., ...... '\ .: : : : : : : . '., ..." \' •••• _. • • •• T
.J" .•••••.••• \ .,... .................. :"". r:. : : : : ~. ~E~! ~I~~J.P~.R: ': ~'~'?l t:::: :t:: ::.:: :::::::;:: \. •... -60.01 -65'00
) ~;...., -'-. ...:/' ........... .._ •• , •• 'W ••••• '1' . ,." r. ................. :::::: .... ;
~ ............. I •• f .;.--. .... • .".~ :,..: :ll¥ ~ • • • • M ... LOA • • • • ., • • WI , •• , •••••• t •• f :I
m ,,' 50'01 - 55'00
',: : : : : : : : : : : :i' r::: :'l"lf
,J .. ~ : : : :.1' ··1X.::( ~::'t
~.~ ... \ B~I' .••••
r~ ... 50'00 & BELOW
E3
km 16 0 _wi
'1' • \ •• " r' . ~ .....• ····i······~ I .. t .... , . ~-:"
r': : : : :,: : : ......... .,...~. c· . ' , . . • . •• • • \ .:.; : . : : '): : : .......... : : ;, :-~ .. ! ·f'-·· . MURs'H'IDAaAD' •.. ~
(' ':': : • i • • j . . . . . . ; . . . . . . : : : : ;' C:.~. ,.] ... : : : :) : : : : : : : ...... • . , .~
\ ... N....) ·· .. •·· .. "1\ ~.~:=~" .. .s:1~!:: : :~~u;:: ~: :: :: : : ::::: :ij'1t,r . . . . ,r,¥: . ..,. . .-.: _: ., ...... ~ .~t.( ...... , .. .'\i t·
_. J. t· •• --. ., •••.••••••. , ••• ·/·...., ..... 1 I • ' . ...... .-1 Ni' ..... '0'--'::::::::'" ,: '\'''''''=;S;'I' •
..... v""'''' . . -.: . ...:.,...... ~,' ... : .. : I ~(j A'I "'A>CY'" '~.. .• ~'-:'-. ""?<"':xY-.. -.' -. "'joo.... A'\--.
~ . ';\: ... ' . .. . . •. . . " ........ ~. 1111\ ~~.' : ~ :: ',' "~Il~~A~' : . ~. :.' ..•• . .. fW
.. : .... _ . . • , . . . I NADIA V
. ~',. ; .:: ~:: :- :: :::-: :-: Q.< I~~ • ...:.....,'"' '" 'f ." • •• ~ • ... , .. ;. I r
1,6 32 48 . 6~ eo 96 km .....
' ", . 7,' I • :( ./.' ; II-.~ ..... 1 " '.!J. •
BEN
;; .') .\ i\ ..
A '-
o
m
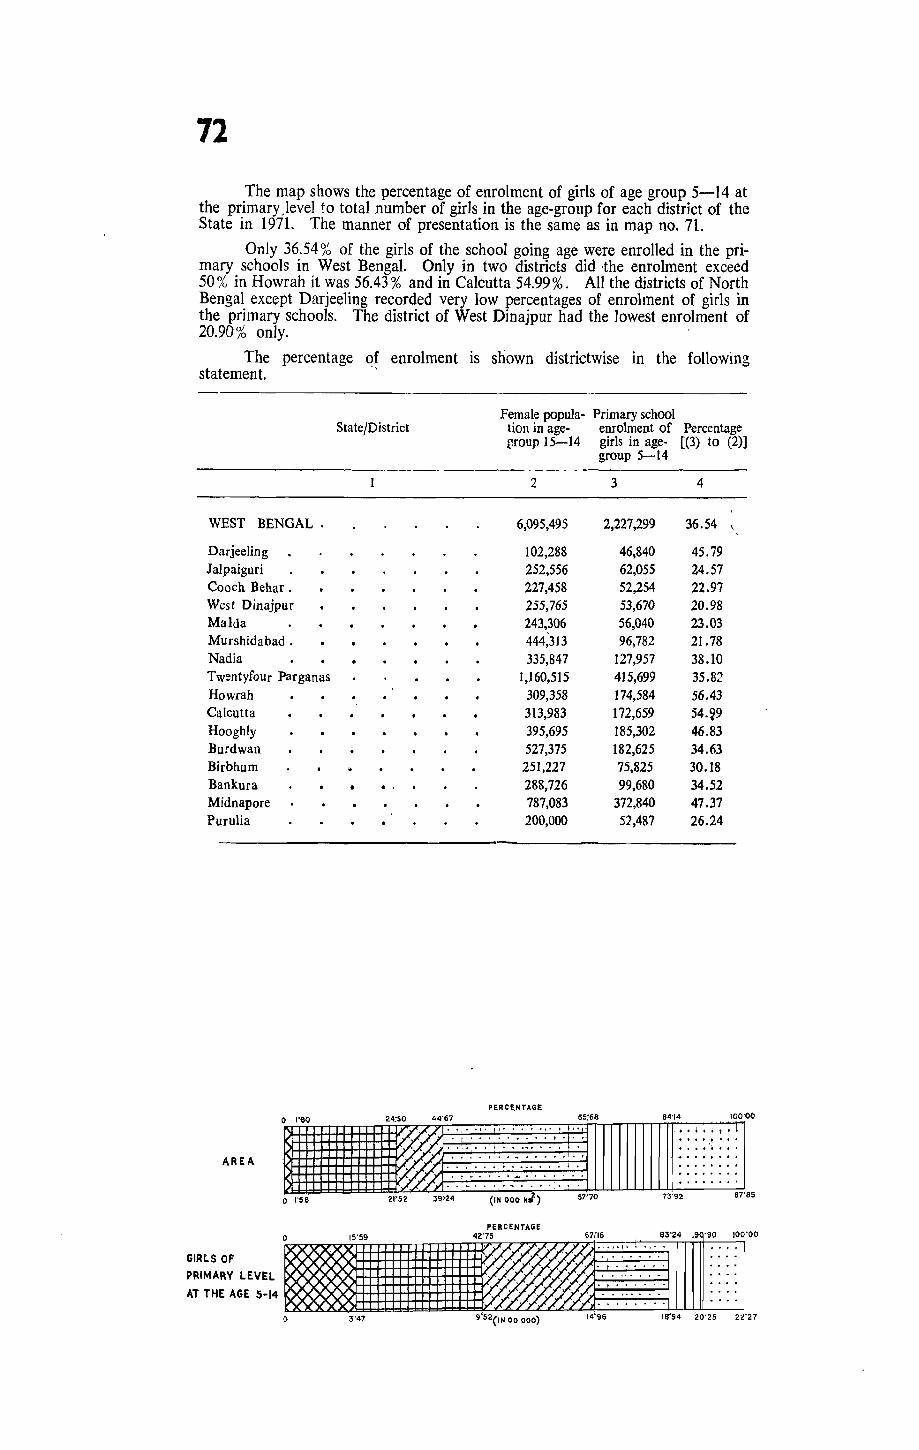
72
The map shows the percentage of enrolment of girls of age group 5-14 at the primary.leve1 to total number of girls in the age-group for each district of the State in 1971. The manner of presentation is the same as in map no. 71.
Only 36.54 % of the girls of the school going age were enrolled in the primary schools in West Bengal. Only in two districts did -the enrolment exceed 50% in Howrah it was 56.43% and in Calcutta 54.99%. All the districts of North Bengal except Darjeeling recorded very low percentages of enrolment of girls in the primary schoo1s. The district of West Dinajpur had the lowest enrolment of 20.90% only. .
The percentage of enrolment is shown districtwise in the following "
statement.
WEST BENGAL.
Darjeeling Jalpaiguri Cooch Behar. West Dinajpur MaIda Murshidabad . Nadia Twentyfour Parganas Howrah Calcutta Hooghly Burdwan Birbhum Bankura Midnapore Purulia
o I'eo
AREA.
o I'se
Female popula- Primary school tion in age- enrolment of Percentage group 15-14 girls in age- [(3) to (2)]
State/District
group 5-14 .---~~-
1 2 3 4
6,095,495 2,227,299 36.54 <.
102,288 46,840 45.79 252,556 62,055 24.57 227,458 52,254 22.97 255,765 53,670 20.98 243,306 56,040 23.03 444,313 96,782 21.78 335,847 127,957 38.10
1,160,515 415,699 35.82 309,358 174,584 56.43 313,983 172,659 54.~9
395,695 185,302 46.83 527,375 182,625 34.63 251,227 75,825 30.18 . . 288,726 99,680 34.52 787,083 372,840 47.37 200,000 52,487 26.24
PERCE.NTAGE 24:50 44'67 65'68 84'14 100'00
~ 0 0,' .,. I' 0 •• 0,1" "I
~. , •••• ., .... t ~ ...
• • f i ••• t ........ r • • • • • • • • .. • .. .. • + ...
r/// ...... , ........ 1.
I'//hl--' :_'.'.'.' :~~:.'.''''''''-21'52 ,J9'24 (IN 000 kri) 57'70 73'92 87'85
PERCENTAGE
o "." "." " .. " "." '~." '00'00
:~~:::G~E~:~.IIIIIIIIIIIIII~»' <1111:((('1 o 3'47 9'52(IN 00 000) 14'96 18'"54 20'25 22'27
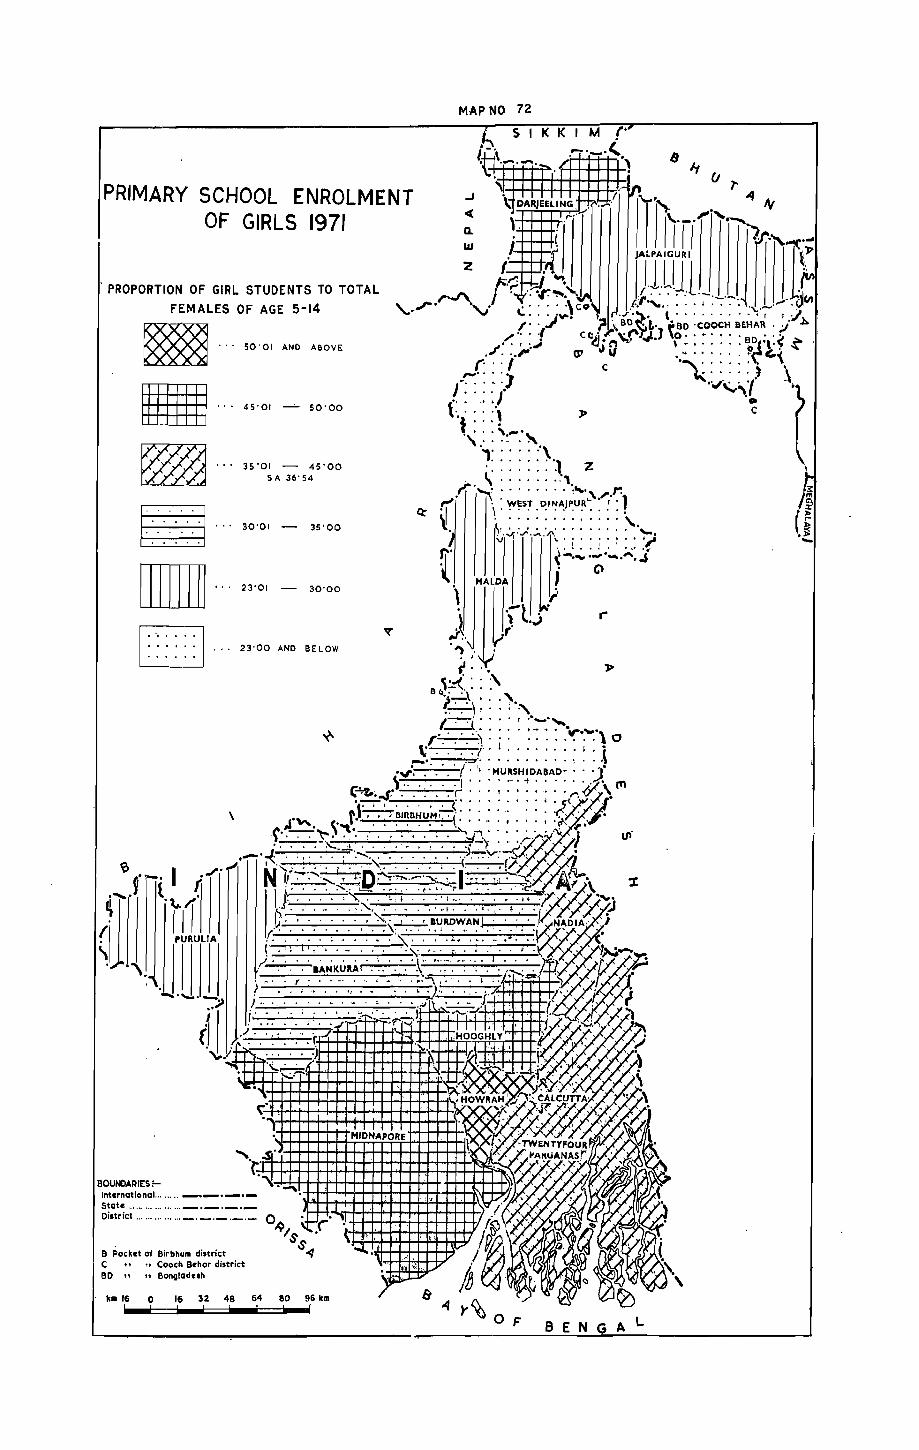
M·AP NO 72
S I K KIM f· _._.(
++-t+t--P L' ')
PRIMARY SCHOOL ENROLMENT OF GIRLS 1971
, PROPORTION OF GIRL STUDENTS TO TOTAL
FEMALES OF AGE 5-14
~ ... 50"0' ... "0'"
•... "0' 50'00
~ ~
3S '01 - 45'00 SA 36' 54
30'01 - 35'00
[IJ]]]] .. "'0' - 30'00
I : : : : : : [ ... "'00 'N' enow
NI,·~··'·;"'i~·D· f';'~'~'~1 j;' i'l >-.. ~ . . - • . . ~., L_ .... ,. . i!' L.·~ .... .C'. 1 I . . . . ,"i:: ... ~ t I . . .' I~. . • . r • I·, .7v
1"··,···· .. · .' :>~ .. ~'~~~~~A~":'.~·'. 'k / ::':::: ::~:: ::\~;::;'~~:;::::::> .~. . ..• IANKUftAI ... . . \ .•.. .•.• , .. ,.{_
. -n.....:. ~ . .:....1'~.-=:. ~. -~. ;;:..;. ~ .. -:,"';".-. --:. to~\ ~ . -. . ._ ;.. ... "',::IIfo-
'_.-...:,. -,~ ? .. ,., .... ,.. .'., ~ ... ',' j"{ 'I'
(ii" /- ::: -: -: < :: < ~ : ~~.~ <;.;·i~ ~1J~! ;:1 ' . I
.1. '.' . .. . J. .HOOGHL y.... -H, r(,,' . . • . . ~ '~..J I '.. , .
\:...v' 1"T'1. ... , . :) . ~I . r ~'EE'~~, , ~5~k~
... ~:~~Hi:;,l",",~~CA ~~ I , '!~VdJ7
-H-++-H-t-rHID~APORE ~~ ~~EN ""p.$" .. . ~h~l"7~,
'", ~/Y BOUNDARIES ~ "' • -"' ,1/ International ........ -_._.- .r • l\ ~/J. ).
~::::,,; :: :: ==-..:.-== o~/s;:.r'~~'...i'. . · v~./~1,~~. "b'~' B Pocket of Birbhum district , - ~.,.,r.¥.r'f>,H-t7" C .. .. Cooch Bchor district • • ,. ,<.
SO " "SongladClh ) ~ I!J km 16 0 16 32 48 64 eo 96 km