census bureau data for manufacturing
TRANSCRIPT
Census Bureau Datafor Manufacturing
U.S. Department of CommerceEconomics and Statistics Administration
BUREAU OF THE CENSUS
Census Bureau Datafor Manufacturing
U.S. Department of CommerceRonald H. Brown, Secretary
David J. Barram, Deputy Secretary
Economics and Statistics AdministrationEverett M. Ehrlich, Under Secretary
for Economic Affairs
BUREAU OF THE CENSUSMartha Farnsworth Riche, Director
Issued August 1995
Contents
Getting Started 1. . . . . . . . . . . . . . . . . . . . . . . . . . . . . . . . . . . . . . . . . . . . . . . . . . . . . . . . . . . . . . . . . . . . . . . . . . . . . . . . . . . . .
What Is the Census of Manufactures? 3. . . . . . . . . . . . . . . . . . . . . . . . . . . . . . . . . . . . . . . . . . . . . . . . . . . . . . . . . . . . . . .
What Is the Annual Survey of Manufactures? 6. . . . . . . . . . . . . . . . . . . . . . . . . . . . . . . . . . . . . . . . . . . . . . . . . . . . . . . .
What Are the Current Industrial Reports? 6. . . . . . . . . . . . . . . . . . . . . . . . . . . . . . . . . . . . . . . . . . . . . . . . . . . . . . . . . . . .
Other Manufacturing Data 8. . . . . . . . . . . . . . . . . . . . . . . . . . . . . . . . . . . . . . . . . . . . . . . . . . . . . . . . . . . . . . . . . . . . . . . . . . .
There’s More! 8. . . . . . . . . . . . . . . . . . . . . . . . . . . . . . . . . . . . . . . . . . . . . . . . . . . . . . . . . . . . . . . . . . . . . . . . . . . . . . . . . . . . . .
Using Your Computer 11. . . . . . . . . . . . . . . . . . . . . . . . . . . . . . . . . . . . . . . . . . . . . . . . . . . . . . . . . . . . . . . . . . . . . . . . . . . . . .
Where Do I Start? 12. . . . . . . . . . . . . . . . . . . . . . . . . . . . . . . . . . . . . . . . . . . . . . . . . . . . . . . . . . . . . . . . . . . . . . . . . . . . . . . . .
Ways and Means of Using Manufacturing Data 13. . . . . . . . . . . . . . . . . . . . . . . . . . . . . . . . . . . . . . . . . . . . . . . . . . . . . .
Summing it Up 18. . . . . . . . . . . . . . . . . . . . . . . . . . . . . . . . . . . . . . . . . . . . . . . . . . . . . . . . . . . . . . . . . . . . . . . . . . . . . . . . . . . . .
Need Help? Ask Us! 18. . . . . . . . . . . . . . . . . . . . . . . . . . . . . . . . . . . . . . . . . . . . . . . . . . . . . . . . . . . . . . . . . . . . . . . . . . . . . . .
Census Regional Offices 19. . . . . . . . . . . . . . . . . . . . . . . . . . . . . . . . . . . . . . . . . . . . . . . . . . . . . . . . . . . . . . . . . . . . . . . . . . .
State Data Centers 20. . . . . . . . . . . . . . . . . . . . . . . . . . . . . . . . . . . . . . . . . . . . . . . . . . . . . . . . . . . . . . . . . . . . . . . . . . . . . . . .
Business and Industry Data Centers 23. . . . . . . . . . . . . . . . . . . . . . . . . . . . . . . . . . . . . . . . . . . . . . . . . . . . . . . . . . . . . . . .
1
Manufacturing MeasuresCensus Bureau Data for Manufacturing
Getting StartedThis booklet is designed to make users ofmanufacturing and related data aware of theresources available from the Census Bureau andhow to use them. Whether you’re interested inanalyzing your sales performance, locating sitesfor plants and warehouses, or measuring yourmarket potential, you can find answers to manyof your questions with data from the printedreports and CD-ROM’s we describe in thisbooklet. We also furnish information to assistyou in locating additional resources.
The economic census is the primary source ofdetailed facts about the Nation’s economy. It is
collected every 5 years for years ending in “2”and “7.” The 1992 Economic Census measuredactivity during calendar year 1992 and covered98 percent of the U.S. economy. There are eightprimary components of the economic census:
Retail TradeWholesale TradeService IndustriesFinancial, Insurance, and Real Estate IndustriesTransportation, Communications, and UtilitiesManufacturesMineral IndustriesConstruction Industries
A variety of data are collected and tabulated,though the subjects covered vary by industry.Several key statistics are tabulated for allindustries:
Number of establishmentsNumber of employeesPayrollMeasures of output; value of shipments
and value added
This booklet focuses on the census of manufac-tures, the annual survey of manufactures, andthe Current Industrial Reports. Brief attention isalso given to several other economic programsalong with sources of foreign trade and demo-graphic data.
2
How Can I Get the Data?��)3� ��.�� +,*�/�.-� �, � ( ).$*) �� $)� .#$-�**&' .�� � �*,� (*, � $)!*,(�.$*)� ��*/.� .# (�$)�'/�$)"� #*1� .*� *,� ,�� �*).��.�
�/-.*( ,� � ,0$� -�/, �/� *!� .# � � )-/-��-#$)".*)�� ��� ���4������4� �4���� � ������ � ��4� �4�����2�� � ��4� �4���
�*)�.� !*," .� .*� �# �&� */,� �). ,) .� -$. � !*,� .# '�. -.� �/-$) --� �)�� $)�/-.,3� $)!*,(�.$*)�#..+���111�� )-/-�"*0�
� )-/-� ��.�� �, � �'-*� �0�$'��' � '*��''3� !,*(�� )/(� ,� *!� *.# ,� -*/,� -�
�*-.� (�%*,� +/�'$�� �)�� �*'' " � '$�,�,$ -� )-/-� , "$*)�'� *!!$� -� �- � +�" � ���.�. � ��.�� � ). ,-� �- � +�" � ���/-$) --� �)�� $)�/-.,3� ��.�� � ). ,-��- � +�" � ��
How Are Data Collected?
Questions on manufacturing were first asked inthe 1810 Decennial Census. Since 1967, wehave conducted a manufactures census every 5 years, collecting statistics on such subjects as:
Number of establishmentsEmploymentPayrollHours workedValue of shipments New capital expendituresMachinery BuildingsValue added by manufacturesCost of materials Inventories
In addition, data on manufacturing are collectedmore frequently in surveys like the annual surveyof manufactures (ASM) and commodity surveysused to prepare Current Industrial Reports(CIR’s). While the data are more timely, the levelof detail is not as great as that in the census.
The ASM provides information for the yearsbetween the censuses. This survey has beentaken since 1949. Since it collects data from asample of manufacturers, rather than all manu-facturers as the census does, data are generallyprovided only for the United States and States.
The CIR series provides monthly, quarterly, andannual data on production, shipments, and/orinventories of selected products or on specialsubjects. More information about reports in theseries is found beginning on page 6.
How Are the Data Organized?Statistics from the census and surveys are col-lected and published primarily in terms of theestablishments in an area. (An establishment is a single physical location at which a manufactur-ing activity takes place.) In general, manufactur-ing industries are classified in the standardindustrial classification (SIC) coding system bythe principal type of products produced. The SICsystem has 20 major groups for manufacturing:
20 Food and kindred products21 Tobacco products22 Textile mill products23 Apparel and other finished products
made from fabrics and similar materials24 Lumber and wood products,
except furniture25 Furniture and fixtures26 Paper and allied products27 Printing, publishing, and allied industries28 Chemicals and allied products29 Petroleum refining and related industries30 Rubber and misc. plastics products31 Leather and leather products32 Stone, clay, glass, and concrete products33 Primary metal industries34 Fabricated metal products, except
machinery and transportation equipment35 Industrial and commercial machinery
and computer equipment36 Electronic and other electrical equipment
and components, except computerequipment
37 Transportation equipment38 Measuring, analyzing, and controlling
instruments; photographic, medical, and optical goods; watches and clocks
39 Miscellaneous manufacturing industries
3
Some of the Bureau’s surveys distinguish betweenthe manufacture of durable goods (SIC’s 24, 25,and 32-39) and nondurable goods (SIC’s 20-23and 26-31). The major SIC groups are subdividedinto three-digit industry groups, which in turn aresubdivided into four-digit industries. Manufac-tured products are classified into 1,500 productclasses (five-digit codes) and 11,000 productcodes (seven digit) in a manner consistent withthe four-digit SIC for the industry from which theproducts originate. For example:
Major group 38 Measuring, analyzing, and controlling instruments, etc.
Industry group 386 Photographic equipment andsupplies
Industry 3861 Photographic equipment andsupplies
Product class 38611 Still picture equipment
Product 38611 11 Hand-type cameras
What Geographic Areas Are Covered?
The most detailed data from the census and thevarious surveys of manufacturing are availableonly at the national level. Only the census andASM provide significant data for States. Morelimited data for metropolitan areas (MA’s),counties, places, and ZIP Codes are availableonly from the census.
How Are Manufactures Data Used?
To suggest the wide variety of ways that data canbe used, here are a few examples by type ofuser. (Several detailed illustrations of data useare presented beginning on page 13.)
Individual manufacturersForecast salesAnalyze sales performanceDetermine market shareLocate plants and warehousesStudy fuel consumption within their industriesEvaluate changes in industriesLearn about industries that use their products
State and local governments; Chambers of CommerceStudy economic structure in their areas over timeCompare their areas with othersDevelop plans to encourage economic growth
Federal GovernmentCalculate the gross domestic productProduce the monthly index of industrial
productionMeasure productivity and price changesMonitor the effect of trade on domestic
industries
What Is the Census ofManufacturers?
The census of manufactures is one componentof the economic census. For the 1992 census,questionnaires were sent in early 1993 to about250,000 establishments. Each received 1 of 291 industry-tailored questionnaires. Data for anadditional 150,000 smaller, single-establishmentfirms with payroll were obtained from Federaladministrative records.
The 1992 Census of Manufactures covers allestablishments with one or more paid employeesprimarily engaged in manufacturing. Manufactur-ing production is usually carried on for the whole-sale market, for transfers to other plants of thesame company, or to the order of industrial usersrather than for direct sale to the householdconsumer. However, in a few instances, somemanufacturers sell chiefly at retail to householdconsumers through the mail.
Some activities of a service nature (enameling,engraving, etc.) are included in manufacturingwhen they are performed primarily for trade.They are considered nonmanufacturing activitieswhen performed primarily to the order of thehousehold consumer.
Reports From the Census of ManufacturesData from the 1992 Census of Manufactureswere released beginning in 1994 and willcontinue into 1996. Data are available in printedreports and on CD-ROM. Figure 1 summarizesthe data items published in the final reports. TheIndustry Series provides mainly national data for459 different industries. (Detailed final IndustriesSeries reports supersede preliminary reportsissued in 1994.) The Geographic Area Series
4
provides industry data for each State and itsmetropolitan areas, counties and places, and for the District of Columbia. The Subject Seriesconsists of three detailed reports at the nationallevel. Analytical Reports include data from thecensus of manufactures and related sources onexports and establishments that export. Seefigure 2.
The Location of Manufacturing Plants, availableonly on CD-ROM, provides the number of manu-facturing establishments by employment size inevery industry by two-, three-, and four-digit SIC,State, county, place with 2,500 inhabitants ormore, and ZIP Code areas.
For more information about reports and CD-ROM’s,their prices, and ordering instructions, contactCustomer Services (page 2) and obtain theeconomic census guides noted in the box below.
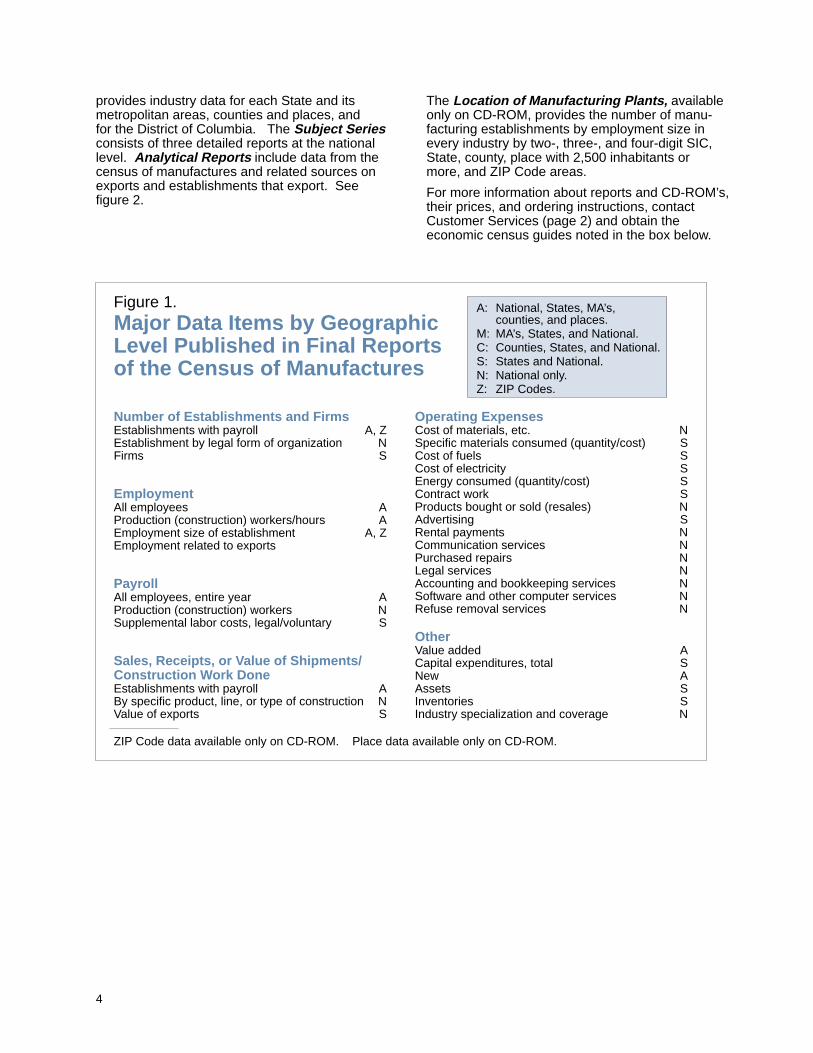
Figure 1.Major Data Items by Geographic Level Published in Final Reports of the Census of Manufactures
Number of Establishments and FirmsEstablishments with payroll A, ZEstablishment by legal form of organization NFirms S
EmploymentAll employees AProduction (construction) workers/hours AEmployment size of establishment A, ZEmployment related to exports
PayrollAll employees, entire year AProduction (construction) workers NSupplemental labor costs, legal/voluntary S
Sales, Receipts, or V alue of Shipments/Construction W ork DoneEstablishments with payroll ABy specific product, line, or type of construction NValue of exports S
Operating ExpensesCost of materials, etc. NSpecific materials consumed (quantity/cost) SCost of fuels SCost of electricity SEnergy consumed (quantity/cost) SContract work SProducts bought or sold (resales) NAdvertising SRental payments NCommunication services NPurchased repairs NLegal services NAccounting and bookkeeping services NSoftware and other computer services NRefuse removal services N
OtherValue added ACapital expenditures, total SNew AAssets SInventories SIndustry specialization and coverage N
ZIP Code data available only on CD-ROM. Place data available only on CD-ROM.
A: National, States, MA’s, counties, and places.
M: MA’s, States, and National.C: Counties, States, and National.S: States and National.N: National only.Z: ZIP Codes.
5
Figure 2.1992 Census of Manufactures ReportsIndustry Series (MC92-I-20A to 39D) (Available in 1995 in print and on CD-ROM)
This series supersedes the Preliminary IndustrySeries. Each report provides data for the Nation,with limited data for States, for 1 of 83 groups ofrelated industries. Data include number of estab-lishments, number of firms, payroll, value of ship-ments, cost of materials, new capital expenditures,inventories, hours worked, and value added bymanufacture.
For each industry, data on employment, payroll,value of shipments, capital expenditures, and value added by manufacture are also shown by employment-size class of establishment and degree of primary product specialization.
Some of the most widely used statistics arethose on shipments of specific products and con-sumption of various materials. Product data in-clude shipments by all producers, not just thoseclassified in the primary industry for all 5-digit product classes and for the 6,200 7-digit productcodes not shown in Current Industrial Reports.Each individual Industry Series report covers oneor more three-digit industry groups.
Geographic Area Series (MC92-A-1 to 51) (Available summer-fall 1995 in print and on CD-ROM)
A report for each State and the District of Columbiaprovides data by industry on the number of estab-lishments, payroll, employment, value of ship-ments, expenditures for new capital equipment,hours worked, and value added by manufacture,with comparative statistics for 1987.
Similar totals are shown by industry for MA’s,counties, and incorporated places but without thecomparative statistics for 1987.
Analytical Report Series (AR92-1 and 2) (Call Customer Services for availability. In print andon CD-ROM.)
These reports include information from the censusof manufactures and related sources.
Exports From Manufacturing Establishments(AR92-1). Provides data on the value of direct andindirect export shipments and estimates of the em-ployment required to manufacture these products,reported by two- and three-digit SIC codes for theNation and for States.
For years other than census years, this report ispublished based on data from the Annual Surveyof Manufactures.
Selected Characteristics of Manufacturing Establishments That Export (AR92-2). Providesthe number of establishments that export by “ex-port intensity” (percent of goods produced that are exported) by two- or three-digit SIC for Statesand separately by employment-size class.
Subject Series (MC92-S-1 to 3) (Released fall ’95 through early ’96 in print and on CD-ROM))
General Summary (MC92-S-1). Consolidates intoone volume many of the key statistics previouslypublished in the industry and geographic area series. Most data are at the national level, with limited data for States and MSA’s.
Concentration Ratios in Manufacturing(MC92-S-2). Provides measures of the share ofindividual activity accounted for by largest compa-nies. Concentration measures are shown for eachfour-digit industry, with time-series data.
Manufacturers’ Shipments to Federal Govern -ment (MC92-S-3). Provides estimates from a special survey on the value of goods shipped tothe Department of Defense, the Department of Energy, the National Aeronautics and Space Administration, and all other Federal agencies, for 69 4-digit industries that tend to have large Federal contracts.

6
Economic Census Guides of InterestIndustry Library (POF 811). Order form providing report and CD-ROM informationfor construction industries, mineral indus-tries, and manufactures. Free from Customer Services.
Business Library (POF 809). Order formproviding report and CD-ROM informationfor retail trade; wholesale trade; service industries; transportation, communications,and utilities; and finance, insurance, and realestate industries. Free from Customer Ser-vices.
Introduction to the 1992 Economic Census. Free from Customer Services.
Related Census Programs:Enterprise Statistics Series
This program counts companies rather thanestablishments as in the rest of the economiccensus. Establishments under common controlare grouped to show economic characteristics of the controlling firms at the national level. Dataalso are included on auxiliary establishmentsproviding services to other parts of the samecompany. The enterprise statistics report isissued every 5 years in conjunction with theeconomic census reports:
Company Summary details employment andsales size, legal form of organization, andcompany/establishment cross-tabulations. You can use the employment- and sales-sizeinformation to define data on “small business.”The number and primary industry of owned oroperated establishments, number of employees,annual payroll, and sales/receipts are shown byenterprise industrial classification (EIC). Addi-tional detail is included on firms with 500 or more employees.
What Is the Annua l Survey of Manufactures?The annual survey of manufactures collectsstatistics for the years between the census from a sample of the 400,000 establishmentscovered in the census. During census years, the establishments in the ASM sample receive a form that asks for extra detail on subjects such
as type of new expenditures, selected purchasedservices, and foreign content of material con-sumed. ASM-like data for census years arepublished in census reports only; there are no separate ASM reports for census years, such as 1992.
Reports From the Annual Survey of ManufacturesStatistics for Industry Groups and Industriesprovides national data on employment, worker-hours, payroll, supplemental benefits, valueadded by manufacture, new and used capitalexpenditures for plant and equipment, cost ofmaterials, cost of fuels and electric energy,beginning- and end-of-year inventories, andvalue of shipments, with comparable figures for the previous year.
Value of Product Shipments contains esti-mates of the value of product shipments forapproximately 1,500 product classes ofmanufactured products at the five-digit level. It also shows shipments of selected productclasses primary to more than one industry.
Geographic Area Statistics provides State data on employment, payroll, plant-hours, value added by manufacture, value of industryshipments, new capital expenditures, andend-of-year inventories. Data are classified bytwo-digit major groups and three-digit industrygroups for each State, with comparable data forthe previous year.
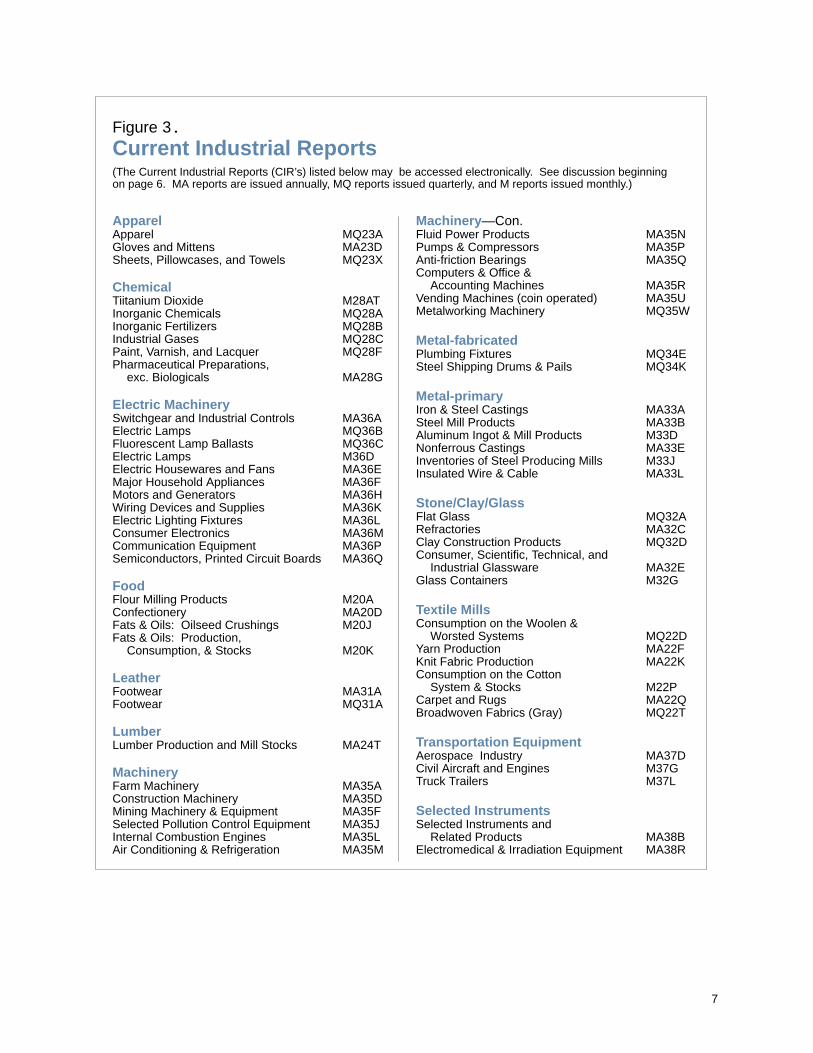
What Are the Current Industrial Reports?Current Industrial Reports data come from nearly70 separate surveys of producers of particularproduct groups that cover about 4,400 of the11,000 seven-digit SIC product categories. The various CIR surveys are conducted monthly,quarterly, or annually. The CIR’s deal mainly withthe quantity and value of shipments of particularproducts and occasionally with data on produc-tion and inventories; unfilled orders, receipts, andconsumption; and comparative data on domestic production, exports, and imports of theproducts they cover. See figure 3 for a list of CIR’s.
There are several ways to obtain CIR’s electroni-cally: CIR’s can be accessed through theCensus-BEA Electronic Bulletin Board (toaccess, 301-457-2310) and through Internet
7
Figure 3.
Current Industrial Reports(The Current Industrial Reports (CIR’s) listed below may be accessed electronically. See discussion beginning on page 6. MA reports are issued annually, MQ reports issued quarterly, and M reports issued monthly.)
ApparelApparel MQ23AGloves and Mittens MA23DSheets, Pillowcases, and Towels MQ23X
ChemicalTiitanium Dioxide M28ATInorganic Chemicals MQ28AInorganic Fertilizers MQ28BIndustrial Gases MQ28CPaint, Varnish, and Lacquer MQ28FPharmaceutical Preparations,
exc. Biologicals MA28G
Electric MachinerySwitchgear and Industrial Controls MA36AElectric Lamps MQ36BFluorescent Lamp Ballasts MQ36CElectric Lamps M36DElectric Housewares and Fans MA36EMajor Household Appliances MA36FMotors and Generators MA36HWiring Devices and Supplies MA36KElectric Lighting Fixtures MA36LConsumer Electronics MA36MCommunication Equipment MA36PSemiconductors, Printed Circuit Boards MA36Q
FoodFlour Milling Products M20AConfectionery MA20DFats & Oils: Oilseed Crushings M20JFats & Oils: Production,
Consumption, & Stocks M20K
LeatherFootwear MA31AFootwear MQ31A
LumberLumber Production and Mill Stocks MA24T
MachineryFarm Machinery MA35AConstruction Machinery MA35DMining Machinery & Equipment MA35FSelected Pollution Control Equipment MA35JInternal Combustion Engines MA35LAir Conditioning & Refrigeration MA35M
Machinery —Con.Fluid Power Products MA35NPumps & Compressors MA35PAnti-friction Bearings MA35QComputers & Office &
Accounting Machines MA35RVending Machines (coin operated) MA35UMetalworking Machinery MQ35W
Metal-fabricatedPlumbing Fixtures MQ34ESteel Shipping Drums & Pails MQ34K
Metal-primaryIron & Steel Castings MA33ASteel Mill Products MA33BAluminum Ingot & Mill Products M33DNonferrous Castings MA33EInventories of Steel Producing Mills M33JInsulated Wire & Cable MA33L
Stone/Clay/GlassFlat Glass MQ32ARefractories MA32CClay Construction Products MQ32DConsumer, Scientific, Technical, and
Industrial Glassware MA32EGlass Containers M32G
Textile MillsConsumption on the Woolen &
Worsted Systems MQ22DYarn Production MA22FKnit Fabric Production MA22KConsumption on the Cotton
System & Stocks M22PCarpet and Rugs MA22QBroadwoven Fabrics (Gray) MQ22T
Transportation EquipmentAerospace Industry MA37DCivil Aircraft and Engines M37GTruck Trailers M37L
Selected InstrumentsSelected Instruments and
Related Products MA38BElectromedical & Irradiation Equipment MA38R
�
8
(gopher.census.gov or www.census.gov/). Formore information about electronic access viaInternet, call 301-457-1242. Highlights areavailable on CENDATA, the Bureau’s onlineservice (for information, 301-457-1242), and byfax through FastFax (charge: $2.50 per minutewhile ordering; call 1-900-555-2FAX). Althoughmost CIR’s are no longer printed separately, youcan make special arrangements to obtain papercopies by calling 301-457-4651. In addition, CIRdata are printed in an annual compendium calledManufacturing Profiles.
Several CIR’s are considered “general purpose”reports, not restricted to one particular industrygroup; they are still printed. Three of them arenoted here. For more information, contactCustomer Services.
Manufacturers’ Shipments, Inventories, andOrders (M3-1) contains monthly data on thevalue of manufacturers’ shipments, new andunfilled orders and inventories, and inventoriesfor major industry groups at the U.S. level.
Pollution Abatement Costs and Expenditures(MA-200) contains annual data on total operatingcosts, capital expenditures, and cost recoveredby manufacture for air, water, and solid-wastepollution abatement in the United States duringthe year. Data for establishments with 20 ormore employees are shown by 4-digit SIC for the United States and by 2-digit SIC for States.Issued about 14 months after the end of thereference year.
Manufacturing T echnology: Prevalence andPlans for Use: 1993 (SMT (93)-3) provides data on establishments planning to use or notplanning to use any of 17 advanced techno-logies by employment size, age of plant, andmanufacturing process. It covers establish-ments in SIC Major Groups 34-38.
Other Manufacturing DataTwo other programs also provide manufacturingdata:
Plant and Equipment Expenditures Surveyprovides quarterly and annual statistics onnonagricultural firms’ actual and plannedexpenditures at the national level, by industry, fornew structures and equipment. Data are issuedvia press releases only.
County Business Patterns (CBP) reports, issuedannually by State, provide estimates of the num-ber of employees in each year’s mid-March pay
period, together with the number and employ-ment size of establishments and payroll by two-,three-, and four-digit SIC levels for the UnitedStates, States, and counties.
There’s More!Users of manufacturing and related data mayalso benefit from a variety of other censuses and surveys. You may need to know the demo-graphics of the consumer marketplace or the roleof retailers and wholesalers as distributors. Whatabout importing and exporting? Brief outlines ofthese programs are provided below.
Demographic DataThe census of population and housing, takenevery 10 years, is a valuable resource for busi-ness people, economists, sociologists, govern-ment officials, researchers, and anyone whosimply wants information about their community,State, or Nation. The most recent census, takenin 1990, collected information about nearly 250million people and 102 million housing units.
The 1990 Census of Population and Housingprovides details on American living that can beused in a variety of ways. Demographic informa-tion ranges from basic data on age, race, sex,marital status, and household size to more spe-cialized social characteristics such as educa-tion, ancestry, migration, disability, fertility, andveteran status.
Economic characteristics include income, occu-pation, place-of-work, journey to work, and othertopics. Housing characteristics include ownersand renters, plumbing and kitchen facilities,heating fuel, year structure built, utilities costs,vehicles available, and other topics. (See figure4 for a list of reports of interest to manufacturers.More 1990 census data are offered on computertape and CD-ROM’s.)
Geographic Coverage. Data from the 1990 census are available in a variety of forms, depending on the geographic area of interest. The decennial census provides a wider range of geographic coverage than any other source—from the Nation down to a block, as shown infigure 5.
The Census Bureau has prepared several typesof maps for use with census data, includingcounty block maps, census tract/block number-ing area (BNA) maps, county subdivision out-line maps, and urbanized area boundary maps.Contact Customer Services (see page 2) forinformation about them and on how to order.
9
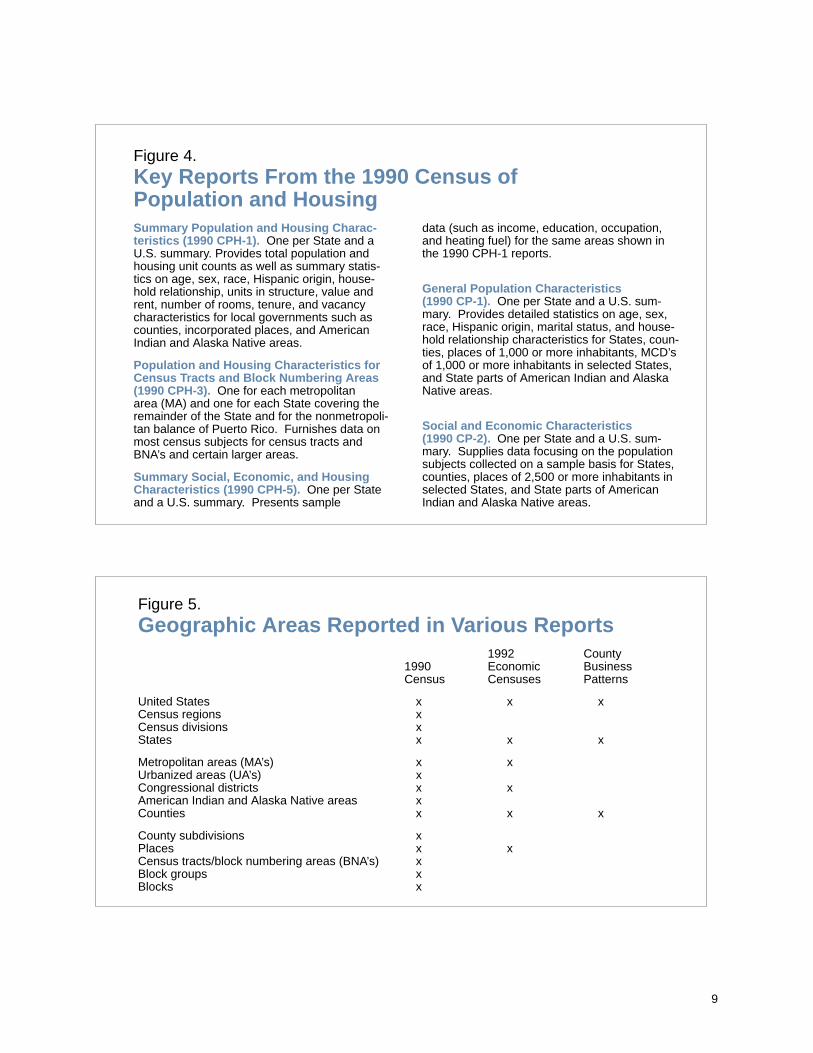
Figure 4.Key Reports From the 1990 Census of Population and HousingSummary Population and Housing Charac -teristics (1990 CPH-1). One per State and aU.S. summary. Provides total population andhousing unit counts as well as summary statis-tics on age, sex, race, Hispanic origin, house-hold relationship, units in structure, value andrent, number of rooms, tenure, and vacancycharacteristics for local governments such ascounties, incorporated places, and AmericanIndian and Alaska Native areas.
Population and Housing Characteristics forCensus T racts and Block Numbering Areas(1990 CPH-3). One for each metropolitan area (MA) and one for each State covering theremainder of the State and for the nonmetropoli-tan balance of Puerto Rico. Furnishes data onmost census subjects for census tracts andBNA’s and certain larger areas.
Summary Social, Economic, and HousingCharacteristics (1990 CPH-5). One per Stateand a U.S. summary. Presents sample
data (such as income, education, occupation,and heating fuel) for the same areas shown inthe 1990 CPH-1 reports.
General Population Characteristics (1990 CP-1). One per State and a U.S. sum-mary. Provides detailed statistics on age, sex,race, Hispanic origin, marital status, and house-hold relationship characteristics for States, coun-ties, places of 1,000 or more inhabitants, MCD’sof 1,000 or more inhabitants in selected States,and State parts of American Indian and AlaskaNative areas.
Social and Economic Characteristics (1990 CP-2). One per State and a U.S. sum-mary. Supplies data focusing on the populationsubjects collected on a sample basis for States,counties, places of 2,500 or more inhabitants inselected States, and State parts of AmericanIndian and Alaska Native areas.
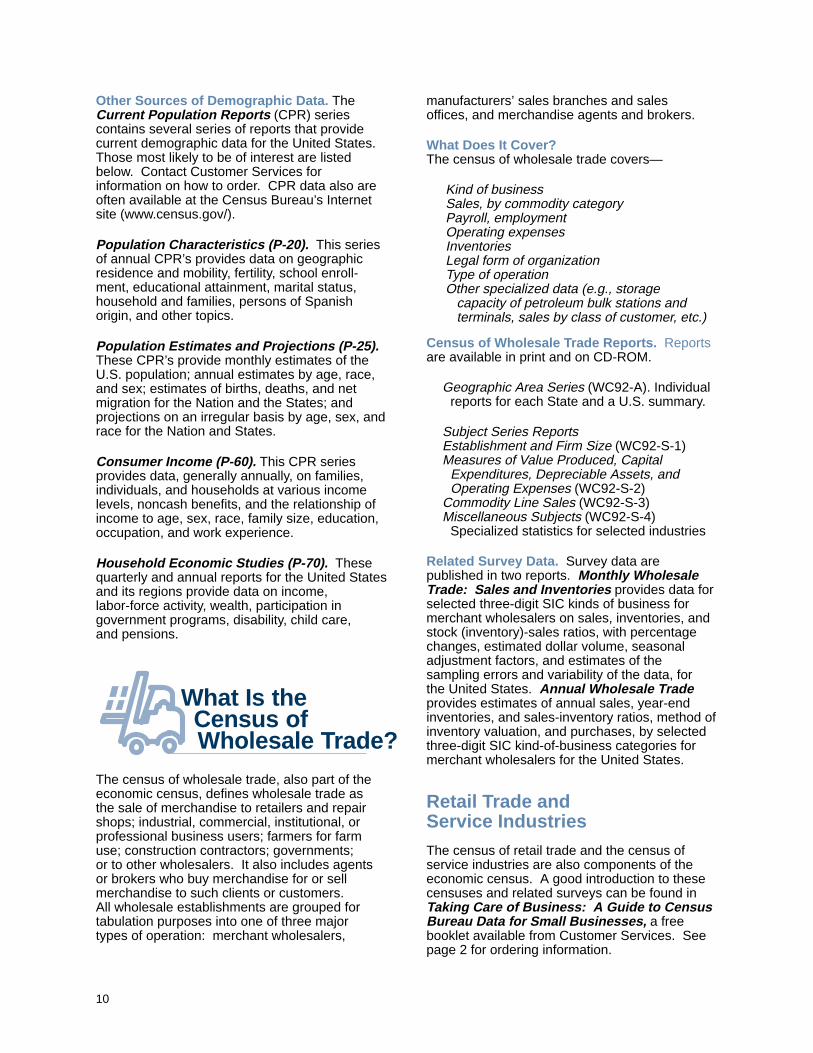
Figure 5.Geographic Areas Reported in V arious Reports
1992 County1990 Economic BusinessCensus Censuses Patterns
United States x x xCensus regions xCensus divisions xStates x x x
Metropolitan areas (MA’s) x xUrbanized areas (UA’s) xCongressional districts x xAmerican Indian and Alaska Native areas xCounties x x x
County subdivisions xPlaces x xCensus tracts/block numbering areas (BNA’s) xBlock groups xBlocks x
10
Other Sources of Demographic Data. TheCurrent Population Reports (CPR) seriescontains several series of reports that providecurrent demographic data for the United States.Those most likely to be of interest are listedbelow. Contact Customer Services forinformation on how to order. CPR data also areoften available at the Census Bureau’s Internetsite (www.census.gov/).
Population Characteristics (P-20). This seriesof annual CPR’s provides data on geographicresidence and mobility, fertility, school enroll-ment, educational attainment, marital status,household and families, persons of Spanishorigin, and other topics.
Population Estimates and Projections (P-25). These CPR’s provide monthly estimates of theU.S. population; annual estimates by age, race,and sex; estimates of births, deaths, and netmigration for the Nation and the States; andprojections on an irregular basis by age, sex, andrace for the Nation and States.
Consumer Income (P-60). This CPR seriesprovides data, generally annually, on families,individuals, and households at various incomelevels, noncash benefits, and the relationship ofincome to age, sex, race, family size, education,occupation, and work experience.
Household Economic Studies (P-70). Thesequarterly and annual reports for the United Statesand its regions provide data on income,labor-force activity, wealth, participation ingovernment programs, disability, child care, and pensions.
What Is the Census ofWholesale Trade?
The census of wholesale trade, also part of theeconomic census, defines wholesale trade as the sale of merchandise to retailers and repairshops; industrial, commercial, institutional, orprofessional business users; farmers for farmuse; construction contractors; governments; or to other wholesalers. It also includes agentsor brokers who buy merchandise for or sell merchandise to such clients or customers. All wholesale establishments are grouped fortabulation purposes into one of three major types of operation: merchant wholesalers,
manufacturers’ sales branches and sales offices, and merchandise agents and brokers.
What Does It Cover? The census of wholesale trade covers—
Kind of businessSales, by commodity categoryPayroll, employment Operating expensesInventoriesLegal form of organizationType of operationOther specialized data (e.g., storage capacity of petroleum bulk stations and terminals, sales by class of customer, etc.)
Census of Wholesale T rade Reports. Reportsare available in print and on CD-ROM.
Geographic Area Series (WC92-A). Individual reports for each State and a U.S. summary.
Subject Series Reports Establishment and Firm Size (WC92-S-1)Measures of Value Produced, Capital
Expenditures, Depreciable Assets, and Operating Expenses (WC92-S-2)
Commodity Line Sales (WC92-S-3)Miscellaneous Subjects (WC92-S-4)
Specialized statistics for selected industries
Related Survey Data. Survey data arepublished in two reports. Monthly WholesaleTrade: Sales and Inventories provides data forselected three-digit SIC kinds of business formerchant wholesalers on sales, inventories, andstock (inventory)-sales ratios, with percentagechanges, estimated dollar volume, seasonaladjustment factors, and estimates of thesampling errors and variability of the data, for the United States. Annual Wholesale T radeprovides estimates of annual sales, year-endinventories, and sales-inventory ratios, method ofinventory valuation, and purchases, by selectedthree-digit SIC kind-of-business categories formerchant wholesalers for the United States.
Retail Trade and Service IndustriesThe census of retail trade and the census ofservice industries are also components of theeconomic census. A good introduction to thesecensuses and related surveys can be found inTaking Care of Business: A Guide to CensusBureau Data for Small Businesses, a freebooklet available from Customer Services. Seepage 2 for ordering information.
11
Foreign Trade
Data on foreign trade help industries in apprais-ing the general trade situation and outlook, inshare-of-the-market and market penetration stu-dies, in product and market development, and inmeasuring the impact of competition. Whetherforeign trade is a daily concern in your businessdealings or an area of occasional interest, youwill find the variety of statistics on imports andexports valuable.
Export statistics record the physical movement ofmerchandise from the United States to foreigncountries, whether a commercial transaction isinvolved or not. Information on U.S. exports toall countries, except Canada, is compiled fromcopies of Shipper’s Export Declarations (SED’s)and SED data from qualified exporters, forwarders,or carriers. The statistics include commoditiesfor foreign aid, military sales, and agriculturalassistance; intracompany shipments; foreignpurchases; U.S. vessels sold abroad; andexports of electricity. Dollar values reportedusually refer to the f.a.s. (free-alongside-ship)values at the U.S. port of export. Data by com-modity classification cover net quantity, desti-nation (country and world area), U.S. customsdistrict of export, method of transportation, andmonth of export.
Import statistics reflect the physical movement ofboth government and other merchandise intoU.S. customs territory whether or not a commer-cial transaction is involved. Information on U.S.imports of merchandise is compiled primarilyfrom automated data submitted through the U.S.Customs’ Automated Commercial System. Databy commodity classification cover net quantity,dutiable status and rate, country and area oforigin, customs district of entry, method of transportation, and month of import. Value isreported by c.i.f. (cost, insurance, and freight)and dutiable (customs) value.
Foreign trade data are available in brief printedreports, on CD-ROM, on computer tape, and in computer-generated printouts. The ForeignTrade Division at the Census Bureau also produces “custom tabulations” on a cost-reimbursable basis. Some examples of reportsand CD-ROM’s are given below. For more information, contact Foreign Trade Division(301-457-3041).
U.S. Merchandise T rade (FT 900). A monthlyreport containing information on domestic andforeign exports and general imports of merchan-dise by selected country and selected commod-
ity groupings with merchandise trade balance by month and cumulative January to date.
U.S. Exports of Merchandise on CD-ROM. Provides U.S. exports of domestic and foreignmerchandise by 10,000 Harmonized Schedule BCommodity Codes. It contains quantity, value,and shipping weight by country of destination,customs district or exportation, and method oftransportation. Data are provided for currentmonth and year-to-date.
U.S. Imports of Merchandise on CD-ROM. Provides net quantity, value data (all methods oftransportation combined), value and shippingweight data for vessel and air shipments in termsof 18,000 commodities by country of origin, bycustoms district of entry, by customs district ofunlading, and by rate provision. Data areprovided for current month and year-to-date.
Using YourComputer
Most data are available on CD-ROM. Data fromthe 1992 Economic Census are released in aseries of cumulative discs, rather than separatediscs for individual censuses. Data files are indBase III+ format compatible with PC, Macintosh,and UNIX systems. “GO92” software, includedon the disc, lets you display data in more thanone way and extract selected data. EXTRACTand Profiles software provide even more ways tolook at the data. All you need is a computer witha CD-ROM reader. For ordering information, askCustomer Services to send you the 1992Economic Census order forms.
A free booklet, Census, CD-ROM, and Y ou!gives an overview of the data available on CD-ROMand equipment and software requirements. Census CD-ROM Products gives more detailedinformation about census and survey data avail-able on CD-ROM, and it’s free from CustomerServices. See ordering information on page 2.

12
Monthly Product Announcement. Provides up-to-date information on products released by the Census Bureau. Free subscription from Customer Services.
Census and You. The Census Bureau’s monthly newsletter. $21 per year. Call the Government Printing Office (202-512-1800) to subscribe if using VISA or MasterCard. Use code “DUN” to order.
Taking Care of Business—A Guide to Census Bureau Data for Small Businesses. Free from Customer Services.
Telephone Contact List for Data Users. A list of contacts at the Census Bureau, by area of specialty, with phone numbers. Free from Customer Services.
Census CD-ROM Products. Lists the data from the Census Bureau available on CD-ROM, with descriptions and prices. Free from Customer Services.
Have You Met the Census Bureau on the ‘Net Yet? A free introduction to data available from the Census Bureau on Internet.
Where Do I Start?Before you begin using census data, take sometime to think about what it is you need to know.To help you get started, consider the following:
Make a list of the data questions you would like answered.
Divide the list into two parts—manufacturing or other economic data and demographic data.
Determine the size of the geographic area you areare interested in—State, county, etc. Rememberthat you can find demographic information for much smaller areas than manufacturing data.
Use the resources available from your State datacenter, business and industry data center, and Customer Services at the Census Bureau to help you determine which reports will best suit your needs (see pages 19-23).
Use your library. Larger libraries and those associated with colleges and universities often carry census data.
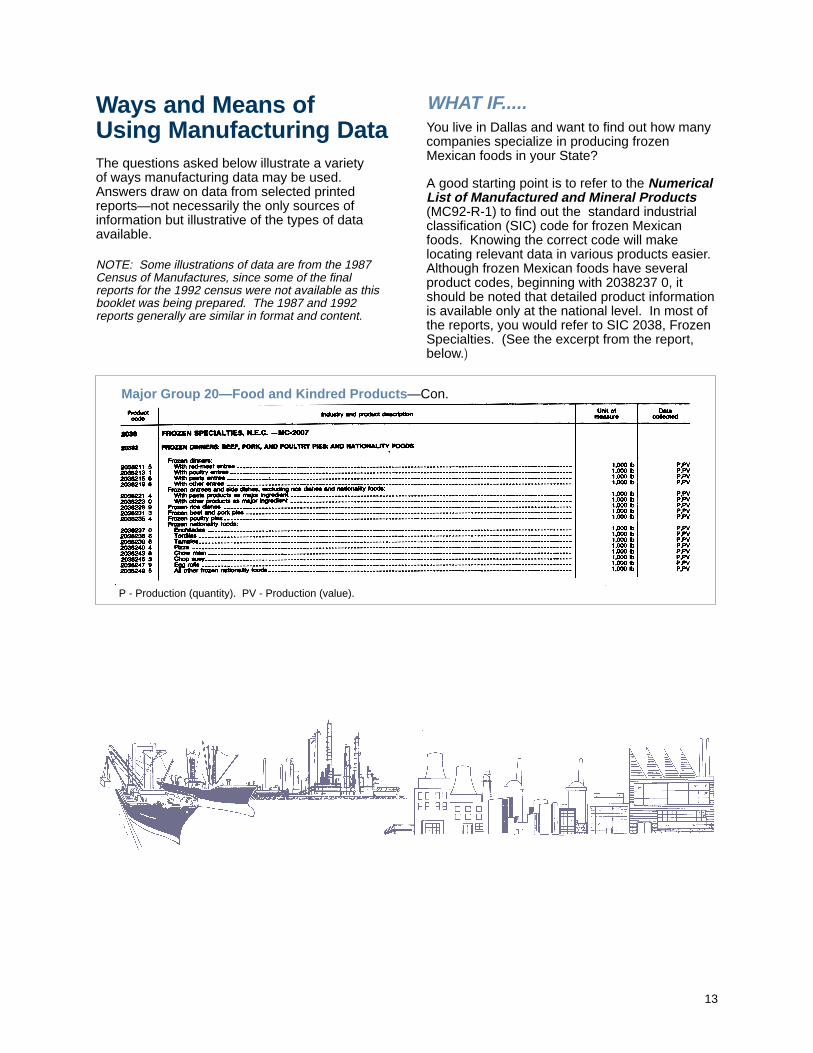
Major Group 20—Food and Kindred Products —Con.
P - Production (quantity). PV - Production (value).
13
Ways and Means of Using Manufacturing DataThe questions asked below illustrate a variety of ways manufacturing data may be used.Answers draw on data from selected printedreports—not necessarily the only sources ofinformation but illustrative of the types of dataavailable.
NOTE: Some illustrations of data are from the 1987Census of Manufactures, since some of the finalreports for the 1992 census were not available as thisbooklet was being prepared. The 1987 and 1992reports generally are similar in format and content.
WHAT IF.....You live in Dallas and want to find out how manycompanies specialize in producing frozenMexican foods in your State?
A good starting point is to refer to the NumericalList of Manufactured and Mineral Products(MC92-R-1) to find out the standard industrialclassification (SIC) code for frozen Mexicanfoods. Knowing the correct code will makelocating relevant data in various products easier.Although frozen Mexican foods have severalproduct codes, beginning with 2038237 0, itshould be noted that detailed product informationis available only at the national level. In most ofthe reports, you would refer to SIC 2038, FrozenSpecialties. (See the excerpt from the report,below.�
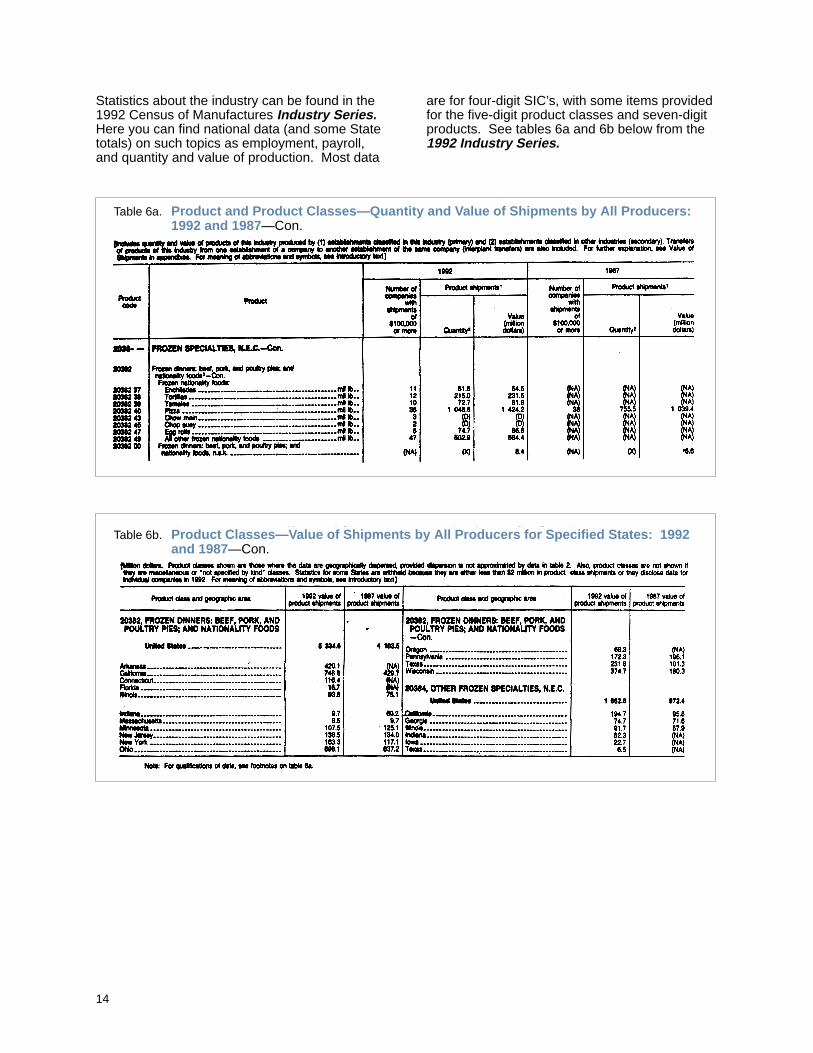
Table 6a. Product and Product Classes—Quantity and V alue of Shipments by All Producers:1992 and 1987—Con.
Table 6b. Product Classes—V alue of Shipments by All Producers for Specified States: 1992 and 1987—Con.
14
Statistics about the industry can be found in the1992 Census of Manufactures Industry Series.Here you can find national data (and some Statetotals) on such topics as employment, payroll,and quantity and value of production. Most data
are for four-digit SIC’s, with some items providedfor the five-digit product classes and seven-digitproducts. See tables 6a and 6b below from the1992 Industry Series.

15
To find out about the industry in the State, look atthe Census of Manufactures Geographic AreaSeries report for Texas. Table 5 tells you that in
1987, Texas had 17 establishments in SIC 2038,11 of which had 20 employees or more.
Table 5. Statistics by Selected Industry Group and Industry for the State: 1987 and 1982
D-Withheld to avoid disclosing data for individual companies; data are included in higher level totals.EE-1,000 to 2,499 employees.
Notice that table 2 below, from the AnnualSurvey of Manufactures (ASM), GeographicArea Statistics, has more recent data for theState but only for three-digit SIC codes. (State
data from the 1993 and 1994 ASM are expectedto be published in early 1996). Depending onyour industry, this level may be detailed enoughfor your needs.
Table 2. Statistics for the United States and States by Industry Group: 1991 and 1990 —Con.
Another source of industry data that providesmore industry detail than the Geographic AreaSeries is the Location of ManufacturingPlants on CD-ROM. This file shows a line ofdata for every four-digit industry in every area
regardless of size, and data are available forStates, counties, places, and ZIP Codes. This is a valuable resource for companies that marketproducts or services to manufacturers, or aretrying to locate prospective customers.
16
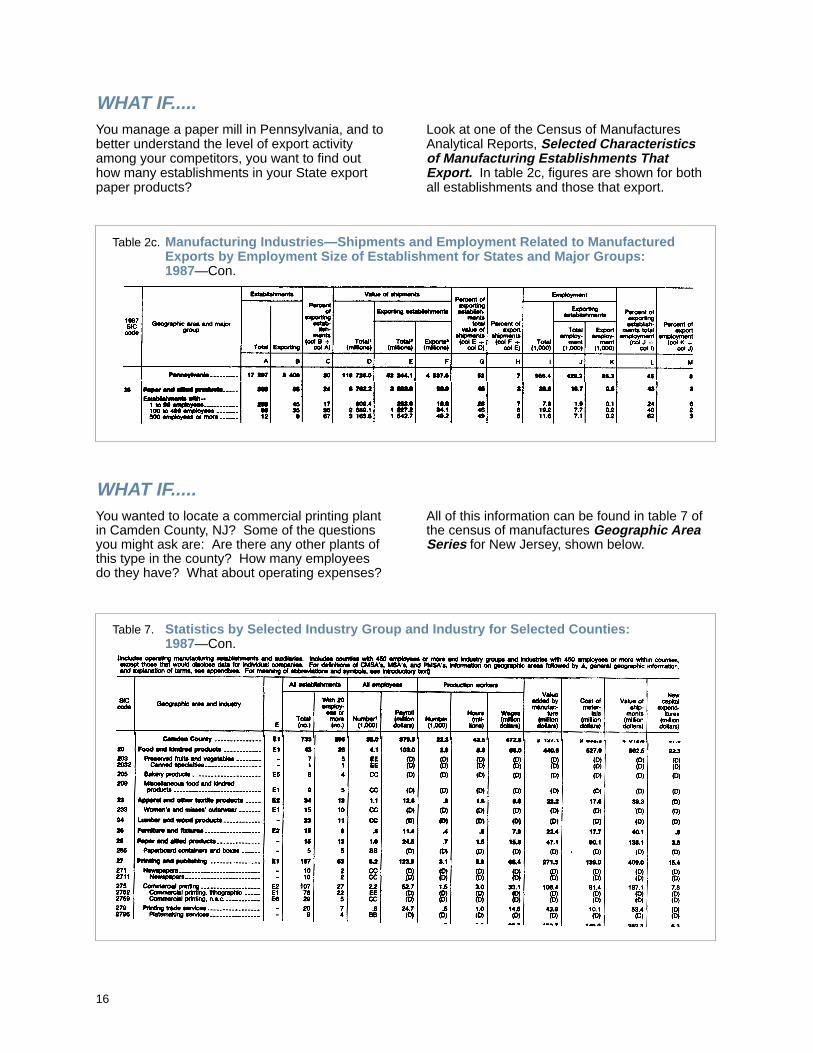
WHAT IF.....You manage a paper mill in Pennsylvania, and tobetter understand the level of export activityamong your competitors, you want to find outhow many establishments in your State exportpaper products?
Look at one of the Census of ManufacturesAnalytical Reports, Selected Characteristics of Manufacturing Establishments ThatExport. In table 2c, figures are shown for bothall establishments and those that export.
Table 2c. Manufacturing Industries—Shipments and Employment Related to ManufacturedExports by Employment Size of Establishment for States and Major Groups: 1987—Con.
WHAT IF.....You wanted to locate a commercial printing plantin Camden County, NJ? Some of the questionsyou might ask are: Are there any other plants ofthis type in the county? How many employeesdo they have? What about operating expenses?
All of this information can be found in table 7 ofthe census of manufactures Geographic AreaSeries for New Jersey, shown below.
Table 7. Statistics by Selected Industry Group and Industry for Selected Counties: 1987—Con.
17
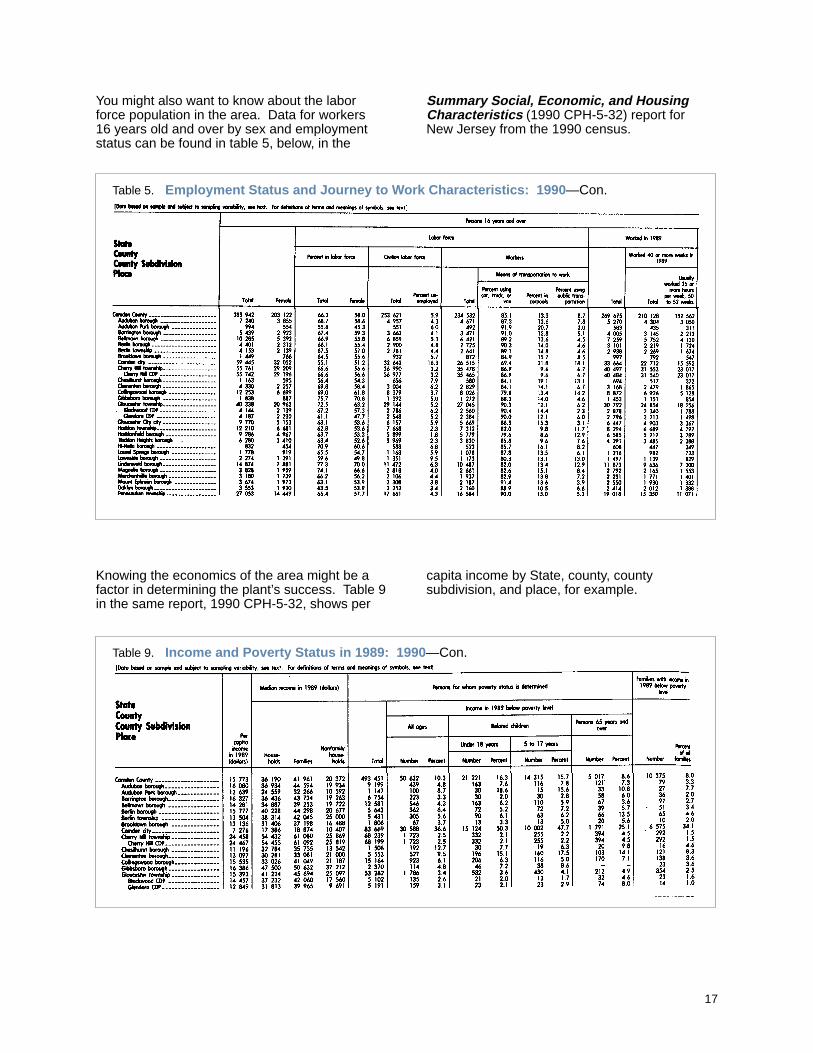
You might also want to know about the laborforce population in the area. Data for workers 16 years old and over by sex and employmentstatus can be found in table 5, below, in the
Summary Social, Economic, and HousingCharacteristics (1990 CPH-5-32) report for New Jersey from the 1990 census.
Table 5. Employment Status and Journey to W ork Characteristics: 1990 —Con.
Knowing the economics of the area might be afactor in determining the plant’s success. Table 9in the same report, 1990 CPH-5-32, shows per
capita income by State, county, countysubdivision, and place, for example.�
Table 9. Income and Poverty Status in 1989: 1990 —Con.
18
Summin g It UpThe questions asked illustrate a variety of wayscensus data can be used. We hope that thesequestions will encourage you to look at CensusBureau data to find answers to your ownquestions.
Our Customer Services staff (301-457-4100) canhelp you identify the report or product you needand provide ordering information. They can alsoput you in touch with specialists at the CensusBureau who are directly involved with the data.
Finally, don’t forget to use the services of theCensus Bureau’s regional offices, State datacenters, and business and industry data centerslisted on the following pages. Help is just aphone call away!
ManufacturingGeneral Inquiries 301-457-4769Concentration Ratios 457-4769Exports From Manufacturing
Establishments 457-4761Fuels & Electric Energy Consumed,
& Production Index 457-4680
IndustriesElectrical and Transportation Equipment, Instruments, and Misc. 457-4817Food, Textiles, and Apparel 457-4651Metals and Industrial Machinery 457-4755Wood, Furniture, Paper, Printing, Chemicals, Petroleum Products, Rubber and Plastics 457-4810
Monthly Shipments, Inventories, and Orders 457-4832
Technology, Innovation, Research and Development, Capacity, Utilization, and Pollution Abatement 457-4701
Other Useful ContactsForeign Trade 457-3041Wholesale Trade 457-2694Retail Trade 457-2687Population 457-2422County Business Patterns 457-2580Enterprise Statistics 457-7234
19
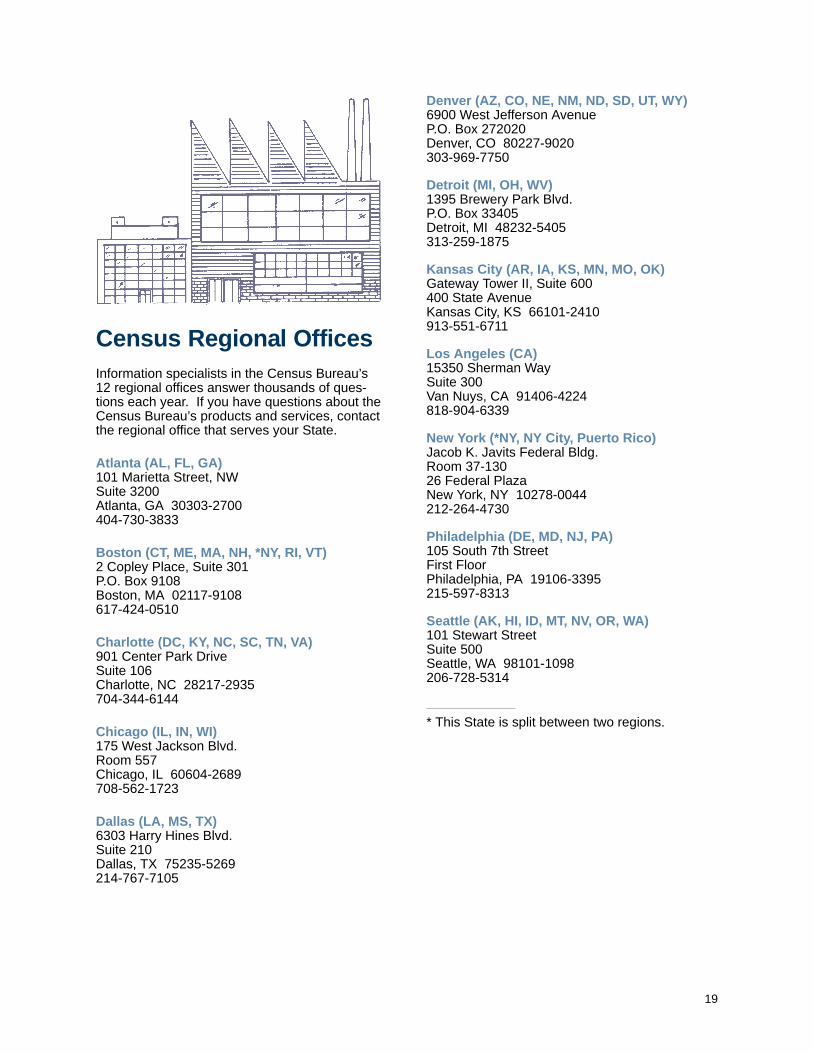
Census Regiona l OfficesInformation specialists in the Census Bureau’s 12 regional offices answer thousands of ques-tions each year. If you have questions about theCensus Bureau’s products and services, contactthe regional office that serves your State.
Atlanta (AL, FL, GA)101 Marietta Street, NWSuite 3200Atlanta, GA 30303-2700404-730-3833
Boston (CT , ME, MA, NH, *NY, RI, VT)2 Copley Place, Suite 301P.O. Box 9108Boston, MA 02117-9108617-424-0510
Charlotte (DC, KY , NC, SC, TN, VA)901 Center Park DriveSuite 106Charlotte, NC 28217-2935704-344-6144
Chicago (IL, IN, WI)175 West Jackson Blvd.Room 557Chicago, IL 60604-2689708-562-1723
Dallas (LA, MS, TX)6303 Harry Hines Blvd.Suite 210Dallas, TX 75235-5269214-767-7105
Denver (AZ, CO, NE, NM, ND, SD, UT, WY)6900 West Jefferson AvenueP.O. Box 272020Denver, CO 80227-9020303-969-7750
Detroit (MI, OH, WV)1395 Brewery Park Blvd.P.O. Box 33405Detroit, MI 48232-5405313-259-1875
Kansas City (AR, IA, KS, MN, MO, OK)Gateway Tower II, Suite 600400 State AvenueKansas City, KS 66101-2410913-551-6711
Los Angeles (CA)15350 Sherman WaySuite 300Van Nuys, CA 91406-4224818-904-6339
New York (*NY, NY City, Puerto Rico)Jacob K. Javits Federal Bldg.Room 37-13026 Federal PlazaNew York, NY 10278-0044212-264-4730
Philadelphia (DE, MD, NJ, P A)105 South 7th StreetFirst FloorPhiladelphia, PA 19106-3395215-597-8313
Seattle (AK, HI, ID, MT , NV, OR, WA)101 Stewart StreetSuite 500Seattle, WA 98101-1098206-728-5314
* This State is split between two regions.
20
State Data Centers (SDC’s)There are over 1,400 SDC’s located in everyState (except Alaska), the District of Columbia,Puerto Rico, Guam, and the U.S. Virgin Islands.While not affiliated with the Census Bureau,these organizations receive Census Bureau datafor their States and make that data available tothe public.
Most SDC’s involve a major State executive orplanning agency, a university, or the State library.The organization of the SDC’s varies from Stateto State, but most SDC’s provide special servicesnot offered by the Census Bureau, such as:
Downloading extracts from computer tape files onto diskettes
Producing State profiles using Census Bureau data
Online data from other sourcesMarketing researchGuides to local data sourcesMaps displaying dataReference libraries
For information about the services of your SDCand its affiliates, contact the lead agency in yourState, listed below.
AlabamaCenter for Business and Economic ResearchUniversity of AlabamaBox 870221Tuscaloosa, AL 35487-0221205-348-6191
ArizonaArizona Department of SecurityDES 045Z1789 West Jefferson St.Phoenix, AZ 85007602-542-5984
ArkansasUniversity of Arkansas - Little Rock2801 South UniversityLittle Rock, AR 72204501-569-8530
CaliforniaState Census Data CenterDepartment of Finance915 L StreetSacramento, CA 95814916-322-4651
ColoradoColorado Department of Local Affairs1313 Sherman Street, Room 521Denver, CO 80203303-866-2156
ConnecticutConnecticut Office of Policy and Management80 Washington StreetHartford, CT 06106-4459203-566-8285
DelawareDelaware Development Office99 Kings HighwayP.O. Box 1401Dover, DE 19903302-739-4271
District of ColumbiaMayor’s Office of PlanningRoom 570 Presidential Bldg.415 12th St. NWWashington, DC 20004202-727-6533
FloridaExecutive Office of the GovernorREA/OPBThe Capital, Room 1604Tallahassee, FL 32399-0001904-487-2814
GeorgiaGeorgia Office of Planning and Budget254 Washington St. SW, Room 640Atlanta, GA 30334404-656-0911
GuamGuam Department of Commerce590 South Marine Dr., Suite 601Tamuning, Guam 96911671-646-5841
HawaiiHawaii State Data Center220 S. King St., Suite 400Honolulu, HI 96813808-586-2493
IdahoIdaho Department of Commerce700 W. State St.Boise, ID 83720208-334-2470
IllinoisIllinois Bureau of the BudgetWilliam Stratton Bldg., Room 605Springfield, IL 62706217-782-1381
IowaState Library of IowaEast 12th and GrandDes Moines, IA 50319515-282-4350

21
KansasState LibraryRoom 343-NState Capitol Bldg.Topeka, KS 66612913-296-3296
KentuckyCenter for Urban & Economic ResearchCollege of Business & Public AdministrationUniversity of LouisvilleLouisville, KY 40292502-852-7990
LouisianaOffice of Planning and BudgetDivision of Administration1051 N. 3rd St.Baton Rouge, LA 70804504-342-7410
MaineMaine Department of Labor20 Union St.Augusta, ME 04330207-287-2271
MarylandMaryland Department of State Planning301 W. Preston St.Baltimore, MD 21201410-225-4450
MassachusettsMassachusetts Institute for Social and Economic Research128 Thompson HallUniversity of MassachusettsAmherst, MA 01003413-545-3460
MichiganDepartment of Management and BudgetDemographic Research and StatisticsP.O. Box 30026Lansing, MI 48909517-373-7910
MinnesotaState Demographer’s OfficeMinnesota Planning300 Centennial Office Bldg.658 Cedar StreetSt. Paul, MN 55155612-296-2557
MississippiCenter for Population StudiesUniversity of MississippiBondurant Bldg., Room 3WUniversity, MS 38677601-232-7288
MissouriMissouri State Library600 W. Main StreetP.O. Box 387Jefferson City, MO 65102314-751-1823MontanaMontana Department of Commerce1424 9th Ave.P.O. Box 200501Helena, MT 59620-0501406-444-2896NebraskaCenter for Public Affairs ResearchNebraska State Data CenterPeter Kiewit Conference Center, Room 232University of Nebraska at OmahaOmaha, NE 68182402-595-2311NevadaNevada State LibraryCapitol Complex100 Stewart St.Carson City, NV 89710702-687-8327New HampshireOffice of State Planning2 1/2 Beacon St.Concord, NH 03301603-271-2155New JerseyNew Jersey Department of LaborCN 388Trenton, NJ 08625-6833609-984-6833New MexicoEconomic Development Department1100 St. Francis DriveSanta Fe, NM 87503505-827-0182New YorkNew York Department of Economic Development1 Commerce Plaza, Room 90599 Washington AvenueAlbany, NY 12245518-474-1141North CarolinaNorth Carolina Office of State Planning116 West Jones StreetRaleigh, NC 27603-8003919-733-3270North DakotaDepartment of Agricultural EconomicsNorth Dakota State UniversityMorrill Hall, Room 217P.O. Box 5636Fargo, ND 58105701-231-8621

22
OhioOhio Department of DevelopmentP.O. Box 100177 High Street, 27th FloorColumbus, OH 43266-0101614-466-2115
OklahomaOklahoma Department of Commerce6601 Broadway ExtensionP.O. Box 26980Oklahoma City, OK 73126-0980405-841-5199
OregonCenter for Population Research and CensusSchool of Urban and Public AffairsPortland State UniversityP.O. Box 751Portland, OR 97207-0751800-547-8887
PennsylvaniaInstitute of State and Regional AffairsPennsylvania State Data CenterPenn State—Harrisburg777 West Harrisburg PikeMiddletown, PA 17057-4898717-948-6336
Puerto RicoPuerto Rico Planning BoardP.O. Box 41119San Juan, PR 00940-9985809-728-4430
Rhode IslandOffice of Municipal AffairsOne Capitol HillProvidence, RI 02908-5873401-277-6493
South CarolinaSouth Carolina Budget and Control BoardRembert Dennis Bldg., Room 425Columbia, SC 29201803-734-3780
South DakotaBusiness Research BureauUniversity of South Dakota414 E. ClarkVermillion, SD 57069605-677-5287
TennesseeState Planning Office500 Charlotte Ave., Suite 307Nashville, TN 37243-0001615-741-1676TexasTexas Department of CommerceP.O. Box 12728Capitol StationAustin, TX 78711512-320-9667UtahOffice of Planning and BudgetState Capitol, Room 116Salt Lake City, UT 84114801-538-1550VermontVermont Department of Libraries109 State StreetMontpelier, VT 05609-0601802-828-3261Virgin IslandsUniversity of the Virgin IslandsEastern Caribbean CenterNo. 2 John Brewer’s BayCharlotte Amalie,St. Thomas, VI 00802809-693-1027VirginiaVirginia Employment Commission700 East Main StreetRichmond, VA 23219804-786-8308WashingtonOffice of Financial Management450 Insurance Bldg.Box 43113Olympia, WA 98504-3113206-586-2504West VirginiaWest Virginia Development OfficeResearch and Strategic Planning DivisionCapitol ComplexBldg. 6, Room 552Charleston, WV 25305304-558-4010WisconsinDemographic Services Center101 E. Wilson St., 6th FloorP.O. Box 7868Madison, WI 53707-7868608-266-1927WyomingDepartment of Administration and InformationEconomic Analysis DivisionEmerson Building 327ECheyenne, WY 82002-0060307-777-7504

23
Business an d Industry Data Centers (BIDC’s)
An outgrowth of the State data center program,BIDC’s can provide an enormous amount ofstatistical information for the small businessowner, or potential owner. These organizationscan answer many questions new or existingbusinesses have about products, services, orlocation. Using economic data from the CensusBureau and other sources, BIDC’s can providestatistical information to help reduce the risks.Currently, 23 States have joined the programsince it began in 1987.
Arizona(same as State Data Center)
Connecticut(same as State Data Center)
Delaware(same as State Data Center)
FloridaFlorida Department of Commerce107 West Gaines Street315 Collins BuildingTallahassee, FL 32399-2000904-487-2971
IndianaIndiana Business Research Center801 W. Michigan, B.S. 4015Indianapolis, IN 46202-5151317-274-2205
Kentucky(same as State Data Center)
Maryland(same as State Data Center)
Massachusetts(same as State Data Center)
MinnesotaMinnesota State Demographer’s OfficeMinnesota Planning300 Centennial Office Building658 Cedar StreetSt. Paul, MN 55155612-297-3255
MississippiDivision of Research and Information SystemsDepartment of Economic and Community
Development1200 Walter Silas Bldg.Jackson, MS 39205601-359-2674
MissouriMissouri Small Business Development Centers300 University PlaceColumbia, MO 65211314-882-0344
Montana(same as State Data Center)
New Jersey(same as State Data Center)
New MexicoBureau of Business and Economic ResearchUniversity of New Mexico1920 Lomas NEAlbuquerque, NM 87131505-277-2216
New York(same as State Data Center)
North Carolina(same as State Data Center)
Ohio(same as State Data Center)
Oklahoma(same as State Data Center)
Pennsylvania(same as State Data Center)
Utah(same as State Data Center)
Washington(same as State Data Center)
West VirginiaCenter for Economic ResearchWest Virginia University323 Business and Economics Bldg.Morgantown, WV 26506-6025304-293-7832
WisconsinApplied Population LaboratoryDepartment of Rural SociologyUniversity of Wisconsin1450 Linden Drive, Room 316Madison, WI 53706608-265-3044