census data products: highlighting data for the american indian population
DESCRIPTION
Census Data Products: Highlighting Data for the American Indian Population. Kelly Karres US Census Bureau NC Indian Unity Conference March 1, 2013. States with Largest American Indian and Alaska Native Populations. American Indian Population in NC: 2000 to 2010. 2010 Census Race Question. - PowerPoint PPT PresentationTRANSCRIPT

Census Data Products:
Highlighting Data for the American Indian Population
Kelly KarresUS Census Bureau
NC Indian Unity ConferenceMarch 1, 2013

2
Califo
rnia
Oklaho
maAri
zona
Texa
sNe
w York
New M
exico
Washin
gton
North
Carol
inaFlo
rida
Michiga
n
0
100,000
200,000
300,000
400,000
500,000
600,000
700,000
800,000723,225
482,760
353,386315,264
221,058219,512198,998184,082
162,562139,095
362,801321,687
296,529
170,972
106,906
193,222
103,869122,110
71,458 62,007
American Indian or Alaska Native alone or in combinationAmerican Indian or Alaska Native alone
States with Largest American Indian and Alaska Native Populations

Source: 2000 and 2010 Census 3
American Indian Population in NC:2000 to 2010
2000
2010
0 50,000 100,000 150,000 200,000
131,736
184,082
99,551
122,110
American Indian or Alaska Native aloneAmerican Indian or Alaska Native alone or in combination

4
2010 Census Race Question
5
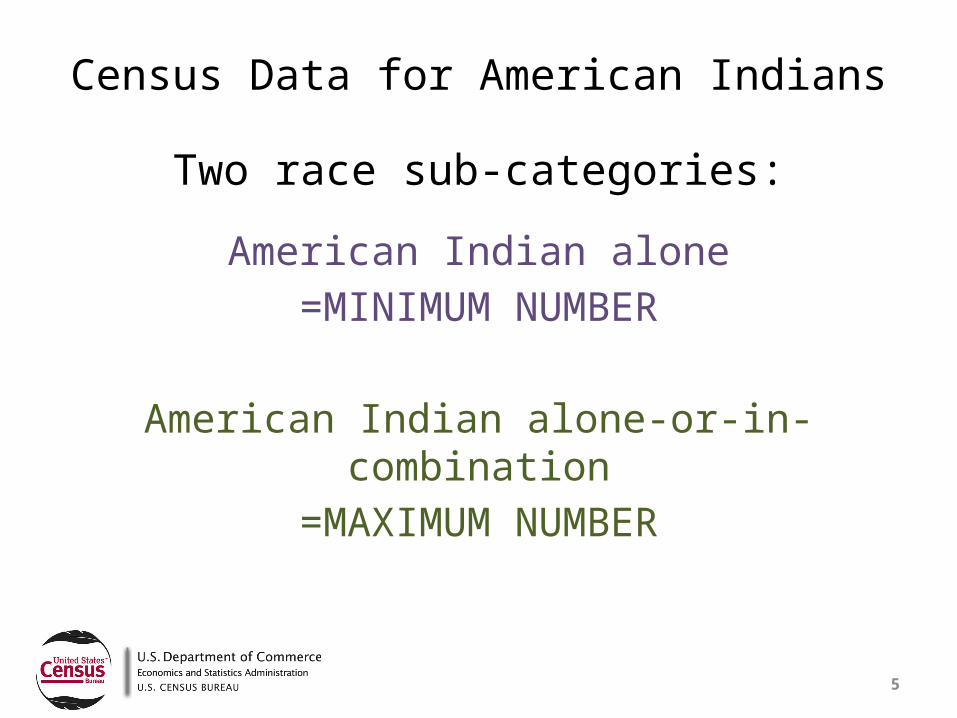
Census Data for American Indians
Two race sub-categories:American Indian alone=MINIMUM NUMBER
American Indian alone-or-in-combination=MAXIMUM NUMBER

Source: 2010 Census 6
Alone Alone or in Combination
In Combination0
10
20
30
40
50
60
70
80
90
100
22.7
39.7
92.5
18.426.7
39.2NCUS
Population Growth by AI Category: 2000 to 2010

Source: 2010 Census 7Alone Alone or in Combination In Combination
0
10
20
30
40
50
60
70
80
90
100
22.7
39.7
92.5
Population Growth in NC by AI Category: 2000 to 2010

8
Census Data for American Indians
Two types of data:Geographic-based
Tribal affiliation-based

Source: 2010 Census 9
2010 American Indian Alone Populationby County in NC

Source: 2010 Census 10
Breakdown by Category: Meherrin Tribe
0100200300400
See Tribe by Population Groups
handout

Source: 2010 Census, Alone or in Combination
11
1670
7516
3250
58306
408 2991896
CoharieEastern Band of CherokeesHaliwa-SaponiLumbeeMeherrin Indian TribeSapponyWaccamaw Siouan
Population Breakdown by NC TribeTotal= 73,345

12*Lumbee Removed
Source: 2010 Census, Alone or in Combination
1670
7516
3250
408
299
1896
CoharieEastern Band of CherokeesHaliwa-SaponiMeherrin Indian TribeSapponyWaccamaw Siouan
Population Breakdown by NC Tribe*Total= 30,078

13
Selected Characteristics of the American Indian Population in
North Carolina

14
Selected Characteristics Statewide
Source: 2011 American Community Survey, Alone or in Combination
Under 5
65 and over
Less than HS
Bachelor's degree
Veteran
Armed forces
With disability
No health insurance0.00%
5.00%
10.00%
15.00%
20.00%
25.00%
7.30%8.70%
24.20%
10.30%8.80%
1.20%
19.60%
22.90%
6.50%
13.20%
15.30%
17.80%
10.20%
1.10%
13.30%
16.30%
American IndianStatewide
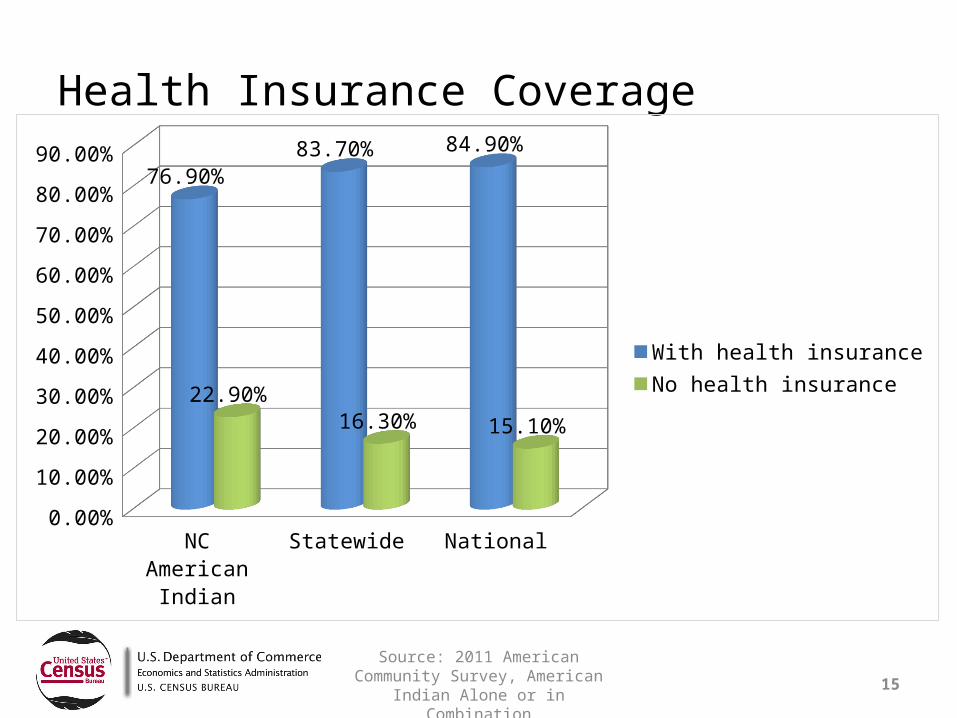
Source: 2011 American Community Survey, American Indian Alone or in Combination
15
Health Insurance Coverage
NC American Indian
Statewide National0.00%
10.00%20.00%30.00%40.00%50.00%60.00%70.00%80.00%90.00%
76.90%83.70% 84.90%
22.90%16.30% 15.10%
With health insuranceNo health insurance

16
Percent Unemployed
NC American Indian
Statewide
National
0.00% 2.00% 4.00% 6.00% 8.00%
7.90%
7.30%
6.50%
Source: 2011 American Community Survey, Alone or in Combination

17
NC American Indian
Statewide
National
0 10,00020,00030,00040,00050,00060,000
31,982
43,916
50,502
Median HH Income
Median Income
Source: 2011 American Community Survey, Alone or in Combination

18
Receiving Food Stamps/SNAP Benefits
NC Amer-ican In-
dian
Statewide National0.00%
5.00%
10.00%
15.00%
20.00%
25.00%
30.00%
35.00%
30.00%
14.70%13.00%
Food Stamps/SNAP benefits
Source: 2011 American Community Survey, Alone or in Combination

Source: American Community Survey 2007-2011
19
Poverty Rates by Race

Source: 2007-2011 American Community Survey
20
Percent of American Indian and Alaska Native Population in Poverty

Source: 2006-2010 American Community Survey AIAN Tables, Alone or in Combination
21
Coharie
Cherokee
Haliwa-Saponi
Lumbee
Meherrin
Waccamaw-Siouan
0 5 10 15 20 25 30 35 40
7.1
35.9
24.1
27.2
22.7
21.6
Poverty Rates for NC Tribes

22
Resources
