central arizona project · the central arizona project ... week of havasu little harq. : ... 106.0...
TRANSCRIPT

Central Arizona Project ANNUAL WATER QUALITY REPORT
2001
Central Arizona Project 23636 N 7th Street
Phoenix Arizona 85024 (623) 869-2333
wwwcap-a~com
Arizonas Single Largest Resource for Renewable Water Supplies
TABLE OF CONTENTS
INTRODUCTION2
Water Quality Standards Historical Water Quality Information Real-Time Water Quality Program
CAP CANAL WATER QUALITY DATA 5
Water Quality Program Results of Grab Sample Program
LAKE PLEASANT WATER QUALITY DATA 18
Lake Pleasant Depth Profiles Results of Lake Pleasant Water Quality Sampling
GENERAL DiSCUSSiON 36
SUMMARy 40
i I~=~~~-~~~~~=====-J
I I
CENTRAL ARIZONA PROJECT I ANNUAL WATER QUALITY REPORT I
I 2001
I Prepared by the Water Control Department
I March 2002
I I Contributing Efforts by
I I I I I I I - lie
I P A
Environmental Compliance
I~~~------~~~-=~~--=-~~~~
I I I I I I I I I I I
INTRODUCTION
The Central Arizona Project (CAP) delivers Colorado River water from Lake Havasu on Arizonas westem border to central and southem Arizona The total CAP system is 336 miles long and consists of open canals siphon pipelines tunnels pumping plants check structures and turnouts The CAP is Arizonas largest supplier of renewable water
The CAP is a multi-purpose project and will deliver an average of 15 million acre-feet of water each year to cities industries Indian communities and agricultural customers as it crosses the arid desert Colorado River water offsets groundwater mining which benefits the state in water conservation long-term storage for future use supplementing surface water supplies and complying with the Arizona Groundwater Management Act The CAP also provides flood control power management recreation and fish and wildlife benefits Other water-short areas of Arizona or other states such as Califomia Nevada and New Mexico can benefit from the CAP through water exchanges
The CAP canal system is connected to the Salt River Project (SRP) canal system This allows transfers and delivery of Colorado River water to SRP for customer use and direct recharge SRP manages and operates a storage reservoir and canal system which supplies water to a 240000 acre service area within the metropolitan area of Phoenix Arizona
Water Quality Standards
The CAP does not provide potable water directly to the public CAP is a raw water supplier and delivers Colorado River water to municipal water treatment plants These plants perform primary secondary and tertiary treatment of the water to remove suspended particles and bacteria The treated water is pumped through the municipal distribution system for domestic use
The CAP has developed a water quality-monitoring program which consists of three areas
1) Ongoing monitoring of primary pollutants and general water chemistry 2) Ongoing corrosion and materials studies 3) Customers parameters of interest
Water quality monitoring provides data and information to CAP staff and customers about pattems and trends in the canal and Lake Pleasant water quality The data can also be used to identify potential pollution sources
- 2shy
I~~~~--~~~~~--~
Water comes from two basic sources (1) Colorado River and (2) Lake Pleasant As previously mentioned the Colorado River is the main source of CAP water but Agua Fria River inflows from rainfallrunoff on the Lake Pleasant watershed mixes with Colorado River water that is stored in the reservoir
The CAP canal system has cross-drainage overchute structures which are designed to minimize the amount of offsite runoff from entering the canal However there is urban offsite runoff that results from bridges crossing the CAP aqueduct
Historical Water Quality Information
Prior to 1996 the USSR and CAWCD had cooperated with the United States Geological Survey (USGS) for a water quality sampling program The USGS collected monthly and quarterly grab samples at three sites on the CAP canal system
(1) Planet Ranch Road bridge (MP 8) (2) 7th Street bridge (MP 162) (3) County Road bridge just upstream of the Santa Rosa Turnout (MP 162)
The water quality program tested and analyzed over 50 parameters Historical CAP water quality data is available in the annual USGS Water Resources Data for Arizona reports The period of record for the historical data is October 1985 through September 1995 The cooperative agreement with the USGS sampling program expired on September 30 1995
Copies of the USGS annual reports can be obtained by contacting the USGS Tucson Office at (520) 670-6671
The CAP began publishing an annual water quality report in 1996 Copies of the annual reports since 1996 can be obtained by contacting the CAP Water Control Department at (623) 869-2573
Real-Time Water Quality Program
The real-time water quality program consists of a Hach turbidity meter and a Hydrolab multi-probe sensor installed at each of three sites
(1) Havasu Pump Plant (2) Hassayampa Pump Plant (3) Waddell PumpGenerator Plant
-3shy
I I I I I I I I I I I I I I I I I I
~~~~~~~~~~~~I
I I I I I I I I I I I
The real-time data is collected and stored in the CAPs control system database and daily summary reports are generated The following are the real-time parameters
Hach Turbidity (0-1000 NTU)
Hydrolab Temperature pH Dissolved Oxygen Conductivity Total Dissolved Solids Turbidity
The real-time water quality data is available to the general public by calling an automated voicedata program on the CAP control system The number is (623) 869-2182 The real time water quality data is also available at the CAP website CAP is in the process of adding the sampling program results to the website You can visit CAPs website at wwwcap-azcom
- 4shy
I~~~~--~~~~~~~
I~--------------------~
I I I Central Arizona Proj ect Canal I Water Quality Data
I I I I I I II I I I I I - 5 shy
I~--------------------~
I I I I I I I I I I I I
CAP CANAL WATER QUALITY
Water Quality Program
The water quality program consists of scheduled grab samples which are analyzed by a commercial laboratory and real-time water quality data from sensors installed at various locations along the canal system The water quality program consists of scheduled unscheduled and real-time water quality sampling
Grab Sample Program
In January 1999 the CAP contracted with Montgomery Watson Laboratory a State of Arizona licensed and certified laboratory to perform the water quality grab sample tests This program includes the following constituents and sampling sites
gt Water Quality Constituents
General Parameters Temperature (field measured) pH (field measured) Dissolved Oxygen (~O) (field measured) Conductivity (field amp lab measured) Alkalinity Calcium Chloride Copper Iron Magnesium Manganese Specific Conductance Sulfate Total Dissolved Solids (TDS) Turbidity
Taste and Odor MIS I Geosmin (as needed basis only)
Pathogens Giardia I Cryptosporidium
Priority Pollutants Heavy Metals (AsCdCrPbHgSeAg)
- 6shy
I~~~----------~~--~
Volatile Organic Compounds (VOCs) Volatile Organic Aromatics (VOAs) Organophosphorus Pesticides Carbamate Pesticides Chlorinated Herbicides
The general parameters priority pollutants and pathogens were sampled according to the attached grab sample schedule
gt Water Quality Sampling Sites
CAP Canal at Milepost
Havasu Pump Plant o Little Harquahala Pump Plant 58 99th Avenue 149 McKellips Road 194 Brady Pump Plant 254 San Xavier Pump Plant 319
The water quality data is presented in the following tables The data represents average values for each month per site including the yearly mean maximum and minimum In addition several graphs are attached which provide a graphical representation of site and time comparisons Also included is a map that identifies the grab sample locations
- 7 shy
-------------------
Central Arizona Project Canal Sampling Program Sampling Site Locations
vDEN-RHODES AQUEDUCT
FANNINMcFARLAND AQUEDUCT
L -
-rPump PIant---middotshy
UAEO PHIAL UII CO 11
LEGEND PIllA
COUIITY ( AP Aqutgtdllct
Pumplug PllUlts TUCSON
AQUEDUCT
bull WQ Localton
~ Pumping Plant Wlltltgt Watfr Samples an CoUKttgtd
2001 Grab Sample Schedule Lake
Week of Havasu Little Harq Plesant 99th Ave Mckellips Brady San Xavier
I Jan 3 GH GH GH GH GH GHi
Jan 22 GII Feb 6 GPPgc GPPgc GPP G G GPPgc
Feb 12 G 1 Feb 20 G G Mar 12 G GH GH GH GH GH
Mar 19 GH Apr 3 GH GH GH GH GH GH
Apr 30 H H H H H H
May 7 GH Mar 14 G May 23 GPPH GH GPP GPPH GH GH GPPH Jun 5 GH GH GH GH GH uH Jun 11 G GH GH GH Jun 18 G GH GH GH I
Jun 25 GH GH GH Jul3 GH GH GH GH
JulIO GPPH GH GPPH GPPH GH GH GPPH Jul 16 G GH H GH GH Jul23 GH GH GH =Jul30 G GH GH GH Aug 8 GgcH GH GH GgcH GH GH GgcH
Aug 13 G GH GH GH Aug21 GH GH GH Aug 27 G GH G GH GH Sep 5 GH GH GH GH GH GH
Sep 10 GH = GPPH GH i
Sep 18 GH GH H GH GH Sep26 G GH GH GH Oct 2 G PP gc H GH GPP G PP gc H GH GH G PP gc H
Oct 10 G GH GH GH Oct 17 G GH GH GH Oct 23 G GH GH GH Oct 30 G Nov 6 G GH GH GH GH GH
Nov 13 G Nov 19 G Nov 26 G GH GH GH Dec 5 GgcH G GgcH GH GH GgcH
Dec 10 G GH OH OH Dec 17 G GH GH OH Dec 26 G GH
- 9shy
G= General Chemistry alkalinity calcium chloride copper iron magnesium manganese sulfate specific conductance total dissolved solids (TDS) turbidity
H= HydroLab readings of temperature dissolved oxygen conductivity and pH will be taken each month at Lake Pleasant
gc= GiardialCryptosporidium
PP= Priority pollutants metals (silver arsenic cadmium chromium mercury lead selenium) volatile organic compounds (VOCs) semi-volatile organic compounds (semi-VOCs) aldicarbs herbicides
NOTE GiardialCryptosporidium and priority pollutant samples analysis will be undertaken with a two-week tum-around time based on the time the laboratory receives the samples
- 10shy
I Lake Havasu PP 2001 Parker Arizona
(General Chemistry Sampling Results)
Analyte Units Jan Feb Mar April May June July Aug Sept Oct Nov Dec Mean Max Min1
Temperature OF 530 560 580 645 750 790 840 820 770 770 630 550 686 840 530
pH 83 NA 86 84 83 NA 80 80 81 81 NA 84 82 86 80
Dissolved 02 mgL 117 NA NA NA NA NA NA NA NA NA NA NA 7 17 117 iDissolved 02 1090 NA NA NA NA NA NA NA NA NA NA 1060 1075 1090
060 I Field conductivity uSem 7250 NA 11850 9400 9320 NA 9500 9400 9440 9350 NA 9350 9429 11850 7250
Alkalinity mgL 1305 1303 1300 1400 1330 1313 1303 1260 1266 1304 1320 1310 1309 1400 1260 Calcium mgL 720 730 700 720 753 703 703 700 683 694 713 716 711 753 683 i
I Chloride mgL 686 692 690 730 699 750 735 740 696 712 740 720 716 750 686
I Copper mgL ND ND ND 001 011 ND ND 0022 ND ND 0012 NO lt0010 01 lt0010 I i
Iron (total) mgL 025 019 NO 036 023 ND 023 ND ND 013 013 014 lt010 lt010 lt010
Magnesium mgL 245 257 245 250 270 257 260 273 276 260 265 263 260 276 245 ij Manganese mgL ND ND ND 0016 NO ND ND ND ND ND ND NO lt0015 0016 lt0015
Specific Conductance uSem 8300 8200 8590 8910 8195 8306 8425 8378 8610 8746 9083 8420 8514 9083 8195
Sulfate mgL 2250 2283 2550 2300 2265 2353 2325 2300 2200 2280 2350 2275 2311 2550 2200
Total Dissolved Solids mgL 5800 5900 6000 5900 6100 5866 5975 5925 5900 6020 6200 6075 5972 I 6200 5800
Turbidity NTU 46 36 26 29 32 14 19 16 36 31 33 24 29 46 14
Little Harquabala PP 2001 --
(General Chemistry Sampling Results)
Analyte Units Jan Feb Mar April May June July Aug Sept Oct Nov Dec Mean Max Min
Temperature OF 519 NA 620 670 780 770 820 830 780 720 630 550 699 830 519
pH NA NA NA NA NA NA NA NA 81 82 82 83 82 83 81
Dissolved 02 mgL 110 NA NA NA NA 86 87 82 77 75 60 48 78 110 48
Dissolved 02 1000 NA NA NA NA 1050 1000 1000 940 940 620 450 875 1050 450 i
iField conductivity uSem 7220 NA 11340 8900 9370 9240 9100 980 9100 8000 8080 8090 8875 11340 7220 I Alkalinity mgL 1270 NA 1280 1370 1320 1298 1258 1253 1233 1270 1320 1306 1289 1370 1233
i Calcium mgL 720 770 690 710 670 700 695 674 1 675 686 680 733 700 770
Chloride mgL 717 NA 690 730 710 733 726 720 705 725 730 740 721 740 690~ I Copper mgL ND ND ND ND ND ND NO NO ND ND ND ND lt0010 lt0010 lt0010
Iron (total) mgL 029 020 ND ND i ND NO NO ND NO NO ND i 0012 lt00 lt010 lt01 0 1 Magnesium mgL 250 270 250 250 250 258 264 265 273 268 260 270 261 273 250
Manganese mgL ND ND ND ND ND ND ND ND NO NO ND ND lt0015 lt0015 lt0015 I Specific Conductance uSem 8350 NA 8650 8510 8360 8223 8238 8388 8518 8610 8050 8780 8425 8780 8050
Sulfate mgL 2340 NA 2300 2300 2290 2320 2310 2300 2275 2300 2300 2350 2308 2350 2275
Total Dissolved Solids mgL 5900 NA 6000 5900 6000 5900 5940 5975 5850 5900 6000 5900 5933 6000 5850
Turbidity NTU 39 NA 14 13 07 13 11 06 05 06 17 21 14 39 05 -NA - Data Not AvaIlable ND - Analyte Not Detectable
99th Avenue 2001 Glendale Arizona (General Chemistry Sampling Results) I
IAnalyte Units Jan Feb Mar April May June July Aug Sept Oct Nov Dec Mean Max Min
i Temperature OF 519 540 560 652 780 650 630 630 690 690 640 540 627 780 519
pH NA NA NA NA NA NA NA NA 77 80 83 82 80 83 77
Dissolved 02 mgL 124 114 08 00 78 70 54 31 53 53 61 48 74 124 31
Dissolved 02 1200 NA 020 1068 910 720 580 320 595 600 620 450 735 1200 320
Field conductivity uSem 7210 NA 9750 9200 9300 9200 9150 9200 8050 8000 8050 8100 8655 9750 7210
Alkalinity mgL 1280 1300 1310 1290 1260 1303 1318 1330 1298 1303 1255 1315 1297 1330 1255
i Calcium mgL 710 760 730 700 790 713 718 715 698 695 715 723 722 790 695
i Chloride mgL 699 676 690 710 670 750 740 733 716 723 725 733 714 750 670 i Copper mgL NO NO NO NO NO NO NO NO NO NO NO NO lt0010 lt0010 lt0010
Iron (total) mgL 013 020 013 NO 013 015 NO NO NO 0014 023 011 lt010 lt010 lt010
Magnesium mgL 250 260 250 250 270 263 270 273 275 275 275 270 265 275 250
Manganese mgL NO NO NO NO NO 0017 0021 0043 0120 014 NO NO lt0015 0140 lt0015
Specific Conductance uSem 8350 8700 8810 8630 8330 8365 8432 8513 8663 8735 8370 8830 8561 8830 8330
Sulfate mgL 2290 2280 2300 2300 2160 2360 2358 2325 2266 2300 2300 2300 2295 2360 2160
Total Dissolved Solids mgL 5800 5800 5800 6000 6400 6033 6060 5900 5875 6100 6000 6115 5990 6400 5800
Turbidity NTU 27 24 22 10 L7 14 08 15 17 16 18 20 17 27 08
McKellips Road 2001 Mesa Arizona I (General Chemistry Results)
Analyte Units Jan Feb Mar April May June July Aug Sept Oct Nov Dec Mean Max Min
ii Temperature OF 524 540 569 670 790 760 670 680 720 700 624 550 650 790 524
pH NA NA NA NA NA NA NA NA 75 81 81 84 80 84 75
Dissolved 02 mglL 93 104 108 IDA 104 IDA 79 78 75 73 67 52 87 108 52
Dissolved 02 1260 NA 1040 1140 NA 1130 830 720 900 810 650 480 896 1260 480
Field conductivity uSem 7260 N 9600 10000 9250 9170 9100 9200 8150 8100 8230 8100 8742 10000 7260
Alkalinity mgL 1280 1290 1290 1290 126 1295 1294 1300 1313 1280 1305 1273 1289 1313 I 1260I Calcium mgL 690 760 730 680 NA 708 712 703 693 690 710 696 706 760 I 680 Chloride mgL 712 732 680 720 72 755 732 728 718 733 760 726 726 760 i 680
Copper mgL NO NO NO NO NA NO NO NO NO 0014 NO ND lt0010 0014 I lt0010
Iron (total) mgL ND NO NO NO NA NO NO NO NO NO NO NO lt010 lt010 i i lt010
Magnesium mgL 240 270 250 250 NA 263 270 270 273 275 280 270 265 280 I 240
Manganese mglL NO NO NO NO NA 0030 0018 0037 0076 0050 0056 0041 00 01 00I I I
Specific Conductance uSem 8450 8700 8620 8540 817 8323 8532 8578 8585 8680 8625 8650 8538 8700 I 8170
Sulfate mgL 2310 2400 2200 2300 230 2370 2332 2300 2300 2325 2350 2333 2318 2400 2200
Total Dissolved Solids mgL 5600 5800 5800 6000 610 5900 6000 6133 6050 6050 6150 6033 5968 6150 5600
Turbidity NTU 24 13 13 12 045 11 09 14 17 11 17 10 13 24 05
NA - Data Not AvaIlable ND - Analyte Not Detectable
- -Brady PP 2001I
I (General Chemistry Sampling Results) Analyte Units Jan Feb Mar April May June July Aug Sept Oct Nov Dec Mean Max Min
Temperature OF 510 NA 611 722 847 781 715 699 733 727 69 I 569 691 847 510
pH NA NA NA NA NA NA NA NA NA 82 80 81 8 I 82 80 IDissolved 02 mglL 101 NA 120 NA NA 92 72 82 106 74 59 57 85 120 57
Dissolved 02 902 NA 1220 NA NA 956 829 918 986 858 662 546 875 1220 546 Field conductivity uSem 7080 NA 9600 9800 9830 9150 9150 9250 9350 8200 8300 8300 8910 9830 7080
Alkalinity mglL 1240 1210 1230 1280 1240 1280 1330 1420 1410 1300 1330 1240 1293 1420 1210 Calcium mglL 710 700 720 710 660 690 690 720 780 700 710 670 705 780 660 Chloride mglL 741 735 690 690 690 730 750 730 690 730 790 720 724 790 690i
Copper mglL NO NO NO NO NO NO NO NO NO NO NO NO lt0010 lt0010 lt0010
I ron (tota I) mglL NO NO NO 0014 NO NO NO NO NO NO NO NO lt010 0014 lt010 i
Magnesium mglL 260 260 260 250 250 260 260 270 310 270 280 280 268 310 250 Manganese mglL NO NO NO 0018 NO NO NO 0025 0Q38 0032 0025 NO lt0015 lt0015 lt0015
Specific Conductance uSem 8400 8550 8480 8710 8280 8270 8480 8510 8730 8950 8810 8600 8564 8950 8270
i Sulfate mglL 2400 2400 2200 2200 2230 2310 2350 2300 2200 2300 2400 2400 2308 2400 2200
Total Dissolved Solids mglL 5700 5700 5700 6000 5900 6000 6100 5900 5900 6400 5900 6100 5942 6400 5700 Turbidity NTU 14 13 12 42 06 08 11 13 10 15 17 12 14 42 06
San Xavier PP 2001 Tucson Arizona (General Chemistry Sampling Results)
Analyte Units Jan Feb Mar April May June July Aug Sept Oct Nov Dec Mean Max Min
Temperature OF 491 NA NA 738 826 770 821 862 825 706 678 539 726 862 491
pH NA NA NA NA NA NA NA NA NA 82 82 83 82 83 82
Dissolved 02 mglL 103 NA 104 NA NA 88 75 85 80 74 61 68 82 104 61 i
Dissolved 02 947 NA 1040 NA NA 867 924 1120 1020 840 690 630 898 1120 630 Field conductivity uSem 7000 NA 9400 10000 9600 9200 9200 8780 9360 8150 8200 8250 8831 10000 7000
Alkalinity mglL 1180 1120 1180 1140 1120 1070 1160 1110 1270 1280 190 1080 1158 1280 1070
Calcium mgIL 650 670 690 630 620 640 680 610 730 700 660 620 658 730 610 Chloride mglL 724 2020 700 740 737 790 750 690 690 740 760 770 843 2020 690
middot Copper mglL NO NO NO NO NO NO NO NO NO NO NO NO lt0010 lt0010 lt0010
middot i
Iron (total) mgIL NO NO NO NO NO NO NO NO NO NO NO NO lt010 lt010 lt010
Magnesium mglL 250 260 260 250 270 280 280 260 310 290 280 290 273 310 250 middot
Manganese mglL NO NO NO NO NO NO NO NO NO NO NO NO lt0015 lt0015 lt0015
i Specific Conductance uSem 8300 8400 8530 8620 8750 8520 8030 8210 8760 8850 8910 8700 8548 8910 8030 i Sulfate mglL 2350 4950 2300 2400 2390 2490 2370 2200 2200 2300 2400 2500 2571 4950 i 2200 I Total Dissolved Solids mgL 5600 5600 5800 6000 6000 5900 6100 5500 6000 6100 6100 6000 5892 6100 i 5500
Turbidity NTU 16 11 10 07 05 04 07 09 07 10 07 09 08 16 04 NA - Data Not Available NO = Analyte Not Detectable
Priority Pollutant Sampling Results February 2001
Analyte units Havasu PP 99w Ave San Xavier PP
Di(2-Ethylexl)phthlate ppb 07 Arsenic ppb 26 24 25
i Barium ppb 0096 01 0092 I Potassium ppm 41 41 4
Sodium ppm 80 78 78 Silica ppm 29 97 71
Strontium ppm 1 1 I I
i Lead ppb 056 I Chromium ppb 21 I Nitrate as N03 ppm 568
Nitrate as N ppm 129 Giardia L Non Detect Non Detect 01
Cryptosporidium L Non Detect Non Detect Non Detect
Priority Pollutant Sampling Results May 2001
IAnalyte units Havasu PP 99lR Ave San Xavier PP
Barium ppb 0098 0096 Potassium ppm 42 41 43 Sodium ppm 84 80 83 Silica ppm 10 99 88
Orthophosphate-P ppm 001
I Ce~ kizqna Project 2001 bi~ed6xgeii(po)
(averagernaltHY vatues)
I I 100 J--7~~~==~------------
I -- Cgt E 60 -1-- - --- - - ----- ----------___- - ------- __- ----------
0 o middot
40+---------------------~--~r_-~----~----~middotI ~
I 2Q + ___ ___100l--Yo_CoI----c0-ra-do_____ ---_ _ ------85l=cYoltLa=ke=-Pl=ea=Si=nt---------------_1-00l=Yo-=CoI==ora=-=dO River Water 1SCoIorado River River Water
90 -f~~~~~ ~ ---~---~ i
I ~= = - ~~= - = -~~==----i
JahFeb middotmiddot Met Apil bull~ Jile JlIy ~ Sept Qt middotmiddotribv Dec
-
1middot~~middotmiddot ____ McKali~ I middot I - -
I II
~f1lalkilor13 erOJed2()Qf middot Ca~ ~r Terqeratur~rF)
middot middot-T ~i
II (~ nlOllHy vaues) J ~
i
1000 _ ~__ l _ jjiL LL~~~~~~ ~ ii~ _ l ____
ooO+------------------- shy
bullbull _____bullbull ~l_ _bullbull _~ bull _ -- - ~
I ( ----------------1
OOmiddot) t-----------F~------------+---_j ~ -
I shy
i ~
IIgt mo+-middot -------~L-~~~C__-___7~~-----l
I ~ ~O +---------9lt-----------7---------------~___-_j E t shy
~o~------------------------~----------------~--------_jmiddot
I River Water 15Colorado River ) ~lt ~3)O f--=---=C-T=- ----=c-----= i _ 1 = j j
JaiRitF Mr APiI riii8y middot~~ ~ sElli middot ot ~~ ~ ~ -
I~~~~~~==~~====~
I I
I Cental Ar izpna Project 2001 CarialWater TOS (mglL) (average monthly values)
I 7000 r
I 6500 +---- - - ----- ---------- ---- - ----- ---shy
I S C ~ 5500 +--------------~-----------------
I en o I shy
100 Colorado 86 Lake Pleasant 100 Colorado 5000+ ------~R-ivcer-W7acte 1=6cC~o=locrac oR7ivcr-=------=---- d er-------Rc-iv=-e=-r7W7-ater------
I 4500 t------- ------------- - - - - -------shy
I 1 1 t shyo
J~h bull Fep Mar Apri( May Juni July Aug Sept Oct ~
L ~
I [~99th Ave ~Havas~ PP j shy
---- -
I i
Cental AriZ~naPnfec20of _ i _ I Ca~al~~ter T~~bidity (rit~f (aera9~monthlyvaliJes) gt
I 100 Colorado 85 Lake Pleasant 100 Colorado
River Water 15 Colorado River River Water
I lts- 30 + ------------r---T------------------+-----+----~------I middotmiddotSmiddotmiddotmiddot middot i
~ i s +__=--_---------_____---_ --c-_ ___ _ ------i-------i---- ---i
I -0
bullbull ~ 20 +-------~_------~~--~--~-------~----__~
I 10 +---- - ----- -------------7---- - --- - -------- ---- 1-shy
05 t-------------------------------~--------------------~---------~
I Eto +-~~-_-~r_-___-- _ - _-1 - -- __ --- ~---=r------r---r--~------_---i
jari Fab middotmiddot- April July bull
1~99th ~~ ~Hava~ ~ 1 I
I~--~~~~~------~~
I I I II Lake Pleasant Reservoir I Water Quality Data
I I I I I I I I I I I
- 18 shy
I I~~~~~--~--------~
LAKE PLEASANT RESERVOIR
The CAP aqueduct system utilizes Lake Pleasant as a seasonal pump-storage reservoir During a typical year Colorado River water is pumped into the lake from mid-October to mid-June when water demands and electricity costs are lower From mid-June to midshyOctober when water demands and electricity costs are higher water is released from the lake for customer deliveries
The Agua Fria River flows into Lake Pleasant and the inflows vary each year During dry years on the watershed the reservoir storage is mostly Colorado River water and during wet years with substantial runoff the reservoir has a blend of Colorado River and Agua Fria River water
The CAP conducted the following water quality sampling on Lake Pleasant in 2001
(1) Agua Fria River Sampling - February 20 July 11 and August 8 2001
In 2001 the Agua Fria River contributed approximately 25200 acre-feet of Lake Pleasant water This represented about 33 of the total lake volume at the end of the filling period in May 2001
I
The water quality samples may represent the water chemistry found in the Agua Fria River during a rainfall event However one sample does not provide enough data to fully assess and validate the typical water quality conditions of the Agua Fria River Refer to the attached table for the Agua Fria River water quality data
I Overall the water quality does not differ significantly from the Colorado River water which is diverted through the CAP canal and pumped into Lake Pleasant The water quality impact of the Agua Fria River was minimal for the year 2001 delivery season
I (2) Lake Pleasant Sampling - February 5 May 21 July 11 August 8 August 28 and October 2 2001
I I The water quality values were similar to the Colorado River The lake with mostly
Colorado River water was clear with turbidity levels averaging 20 NTU and TDS levels of 610 to 640 mgll
I Lake Pleasant depth profiles indicated that stratification occurred in the summer months The upper layer (epilimnion) was oxygen rich with a higher temperature as well as having a slightly higher pH conductivity and TDS The lower layer (hypolimnion) was lower in dissolved oxygen with lower temperatures and slightly
I I - 19 shy
I
lower pH and conductivity (which is a measure of TDS) Refer to the attached graphs of Lake Pleasant depth profiles for the above dates
The oxygen deficit conditions at the lower depths may cause sediment nutrient release through the process of reduction If the sedimentwater intetiace is exposed to prolonged periods of anoxia reducing conditions allow the formation of nutrients previously unavailable for taste and odor causing organisms This reduction may lead to sapropel formation a compound that is high in hydrogen sulfide and methane and has a shiny black color due to the presence of ferrous sulfide This compound is responsible for the occasional rotten-egg odor associated with water releases from the hypolimnion layer through the lower portal on the intake towers
Nutrients such as nitrogen and phosphorous become unbound from their ionic association with metals such as iron manganese and aluminum This process may free up nutrients which contribute to algae blooms in the canal system The precipitates iron and manganese cause discolored water and treatment problems
Typically the degree of stratification gradually forms during the summer and lasts until the latter part of fall Usually by November or December the lake has turned over This phenomenon is caused by the decrease in sutiace water temperatures which increase the sutiace water density and result in displacement or mixing of sutiace water with deeper water This mixing restores the lake to a more uniform water chemistry profile
Refer to the attached tables for the Lake Pleasant water quality values dated February 5 May 21 July 11 August 8 August 28 and October 22001
(3) Lake Pleasant Depth Profiles
The largest changes in lake water chemistry are related to seasonal changes and depth Depth profile samples were conducted on July 11 July 24 August 8 and September 18 2001 The water quality parameters included temperature pH specific conductivity and dissolved oxygen
All the water quality parameters evaluated on the above dates were at the following four locations
(1) Towers at New Waddell Dam (2) 250 yards north of New Waddell Dam (3) 1000 yards north of New Waddell Dam (4) 1 mile north of New Waddell Dam
- 20shy
l~ bull
CAP staff used a portable Hydrolab multi-probe water quality sensor to conduct depth profile sampling Refer to the following graphs which present the Lake Pleasant Depth profile results
The intake towers at the New Waddell Dam have sets of intake portals at two different levels which are 100 feet apart in elevation Adjustable operations and optimum use of the upper and lower portals offers the CAP opportunities to maximize the quality of water released from the lake for customer deliveries
I
In past years water releases were made through the upper gates as long as possible It was believed that this zone had the best water quality By the end of the summer the lake elevation was lower than the upper gates so all releases were switched over to the lower gates At that time the lower quality water from the bottom zone of the lake was introduced into the canal system resulting in treatment concems for the cities
I In 1998 a new operational scheme was used to manage the water quality from the releases at Lake Pleasant This new scheme consisted of using only the lower portals for releases during the entire summer The use of the lower gates during the initial releases
t in June allowed medium-oxygenated bottom water to be released early in the release period while prolonging the retention of the high-oxygenated epilimnion water This minimized the volume of anoxic water which would have been delivered from the lake during the latter part of the summer release period
I The 1998 procedure improved late summer water quality conditions The same release
I procedures have been used every summer since 1998 including 2001 Cities reported that they received significantly fewer taste and odor complaints from their customers
~ Lake Pleasant sampling results are presented in the following section Included are the 2001 tower operations project schematic for seasonal flows depth prollles at Lake Pleasant and the water quality sampling results
I i
I I I I - 21 shy
I ~~~~~__~~-==-=--=--=-=-==-=--===-
--------Lake Pleasant Operations 2001
October 2000 - May 2001 Operations in fill mode
May 1 - November 5 Operations in release mode Water released from lower gates all summer
May 1- November 5 Pass-through pumping (Colorado River water blended with Lake Pleasant water)
November 5 Lake Pleasant reaches lowest level of year (163877 ft above MSL) Terminated Lake Pleasant releases for season
November 52001 Operations return to fill mode
~~~----------~---------~ ~-------~--~~~
I I
I I I I - 22 shy
I~~~~--~~~~~~-~
-_ _ ------ -- -
ARIZONA
t N
LEGEND
bull PUMPING PLANT
CANAL100 COLORADO RIVER _ot- INVERTED SIPHONIOJA f1UA SIPHCraquoI
--+-+-- TUNNEL
--+---+-- PIPELINE
gILA IlMJI SIIIOf
WINTER MID OCTOBER - MAY
CENTRAL ARIZONA PROJECT GENERAL LOCATION MAP
~---~----------~---
J(
t 85 Lake Pleasant LECEND
15 ColoraJo River --t--- PIJIJPIHG PWIT
CAilAL
-- lIMRTED SIPflON
---t--~- IUlltlEl
----+- PIPELlUE
SUMMER JUNE - MID OCTOBER
CENTRAL ARIZONA PROJECT GENERAL LOCATION MAP
-- -- -shy
LAKE PLEASANT 7112001
DO (mgl)
o 05 1 15 2 25 3 35 4 45 5 55 6 65 7 75 8 85 9 95 10
1700 - ---1f---I---+------I--+ bull towers
--- 250yds
1000yds
~1mile
--Water Level
c 1620 o
~ gt ~ 1 600 ~-4~~~--~~~~~ -~I~-+~-r~~~r-~---+--~--+---~-+~~--4-~~~
GIyen
j 1580
1540
1520 Lower Gate
~ 1500
--
LAKE PLEASANT 7242001
o 05 15 2 25 3 35 445555665 7 75 8 8599510
1700 i --Towers
- 250yds 1680 +--~~-_r-~~r_~-_+-4_-+_~~_+-~-4_-~~-_+-~-+_--~~ -tr-1000yds
-- 1mile 1660 -+----1-- --+-----f-----+--I----+--r-_+__ --+- AFria
-Water Level
Upper Gate
1540
1520 Lower Gate -1500
LAKE PLEASANT 882001
0 05 15 2 25 3 35 4 45 5 55 6 65 7 75 8 85 9 95 10
1700 -- 882001
1680 2S0yds
-tl- SOOyds
1660 ~~t=~~~~~~~~~~~~~~~~~b~~~~=fPo-----+----~1 -+-1mile
-AguaFria
1640 -Water
Upper Gate c 0
f~ gt shyQI 1600W QI
l ~
1560
1540
Lower Gate 1520
1500
LAKE PLEASANT 9182001
1DO (mgJl) l
o 05 1 15 2 25 3 35 4 45 5 55 6 65 7 75 8 85 9 95 10
1700 -r---~~---T---r--1---T-~---T---r--~--T---r-~---T---r--~--T---r-~---i1~--~----~1 owers
~250YDS 1680 r-~---+---r--~--+-~r--+---+--~--+---r-~r--+---+--~--+---r-~---+---I
~1000YDS
1Mile 1660 r---r-~---+---r--~--+-~~-+---+--4---+---r-~---+---+--~--+---r-~--~1
+--______-+-__-__-+__~___________-_~ -Water---~-+---+---I Level
1640 +---~--1---+---r--~---~~---+--~--~--~--~~--~~~r=~--_t---r--~--~~--------__Q
Upper Gate
1560
1540
Lower Gate 1520
1500
_ bull ____ _ IIIIJ _ i __ _ _ ~ _
LAKE PLEASANT 7112001
Temperature (F)
90 85 80 75 70 65 60 55 50 1700 +--------shy
1680 ~------~~~----~------~------~--------~------~--------~------~
1660 +--------+----~~--r_------~------~--
1640 -t----l------~=r~~~==~~_-II--_T-------
1540
1520
--- Towers
-+-250yds
1000yds
-+- 1Mile
--Water Level
Upper Gate
Lower Gate -1500 l
LAKE PLEASANT 72401
Temperature (F)
90 85 80 75 70 65 60 55 50 1700 +--------+--------+--------r----~--~------~-------~~------~------~ r-----------~ -+-Towers
- 250yds 1680 T--------+--------+-------~--------~------_r------~~------~------~ 1000yds
~lMile
1660 +-------~~----_r--------r_------_r------~~------~------_4------~ ---AFria
-Water Level
Upper Gate
1560 +-ii~
1540
1520 Lower Gate
1500
- - ~ 111ft - ~ --- shy
LAKE PLEASANT 8801
Temperatura (F)
90 85 80 75 70 65 60 55 50 1700 +-------~--------~------_+--------~------~--------~------~--------~p------------~
-- towers
-+-250yds1680 +-------~--------~------_+--------~------~--------~------~---------
- 1000yds
1mile
~aguafria
1640 +-------~~~----~---middot---_+--------~------~-------middot-~------~~------~ - Water Level
1540
1520
1500
- _ - _ - middotmiddot ~ 1118 -
LAKE PLEASANT 9182001
Temperature (F)
90
1700 85 80 75 70 65 60 55 50
~Towers
1680
1660
250YDS
~1000YDS
___ 1Mile
1640 -Water
Level
1 1620
2 ~
1600 w QI
til J 1580
Upper Gate
1560
1540
1520 Lower Gate
1500
LAKE PLEASANT 9182001
4 5 6 7 8 9 10 11 12 13 14 1700 +-----~-------r_----_r----~------~----_+------+_----_+------~----~----------_
-+-Towers
1680 +-----_4------4-~--_4------4_----~------~~----~----~------~----~1 --- 250YDS
1000YDS
1660 +------t-------t------t------4-------i-------+-------if-------+-------t-------i1 ~ 1Mile
1------+------+-----------+-~~-+------+----~~-----+-----------~ -Water Level 164deg t---~j------II~---t--~-t_1~~----~~----r_----t_----i_----jL----------J
1620 i~ Upper Gate
1560 ~~~
1540
bullLower Gate 1520
1500
Lake Pleasant 2001 Water Quality Sampling Results
Analyte units FebS May 21 July J I Aug8 Aug28 Oct 2 Alkalinity ppm 131 126 122 119 121 127 Calcium ppm 72 72 70 67 68 68 I
Chloride ppm 627 74 78 80 80 75 I
I Copper ppm ND ND ND ND NO NO I
Iron (Total) ppm ND 11 ND NO ND NO i Magnesium ppm 27 28 28 29 30 30
I
I Manganese ppm ND 0025 ND ND NO 00]6 ~
I I
i Specific Conductance uScm 895 814 864 863 896 916 Sulfate ppm 211 231 246 250 250 240 I
Total Dissolved Solids Turbidity
ppm ntu
610 37 70
630 05
620 0
640 08
620 12 I
i Arsenic ppb 10 34 42 Barium ppb 013 01 0075 0083
i Chromium ppb 14 Lead (Total) ppb 061
Mercury ppm 022 Potassium ppm 45 45 49 46 Sodium ppm 81 83 87 92 Silica ppm 97 12 10 12
Strontium ppm 12 09 092 Orthophosphate-P ppm 001
MTBE ppm 52 Oiethylphthalate ppb 14 3
Agua Fria River 2001 Water Quality Sampling Results
Analyte units Feb 20 Julll Aug8 i
Alkalinity ppm 164 148 277 Calcium ppm 40 71 83 Chloride ppm 164 75 41 Copper ppm NO NO NO
Iron (Total) ppm 098 042 11 -Magnesium ppm 17 30 35 I Manganese ppm 0045 019 16 I
Specific Conductance uScm 412 865 792 I Sulfate ppm 339 231 110 I
Total Dissolved Solids ppm 260 630 530 I
Turbidity ntu 1 1 13 14 i Arsenic ppb 10 13 I Barium ppb 0036 0095 I
IChromium ppb 25 13 Ferrous Iron ppm 04 I
i Lead (Total) ppb 095 064 II Potassium ppm 17 52 Sodium ppm 28 87 - I Silica ppm 24 13
Strontium ppm 03 10 I
Orthophosphate-P ppm 0034 0015 Total phosphorous-P ppm 0065 002
Diethylphthalate ppb 11
GiardiaCryptosporidium CytsIOOL SliB CHD
GENERAL DISCUSSION
Turbidity gt- The suspended solids are very low with turbidity levels averaging 1-5 NTU with an occasional spike exceeding 100 NTU The water in the canal and Lake Pleasant is very clear and the lake bottom can be seen at depths of 25-30 feet In general when canal flows are lower or steady the turbidity is low When flow increases occur the higher velocities cause an increase in turbidity levels These increases in turbidity are generally very short in duration Algae blooms in the canal also have an impact on tUrbidity Blooms are generally very localized and do not contribute significantly to the overall turbidity levels of CAP water
TDS)gt Total dissolved solids represent the concentration of dissolved minerals in the water The TDS levels in CAP water are high when compared to most groundwater sources For the year the average TDS was 600 mgL and maintained consistent values throughout the canal system
pH ~ The average pH ranged from 82 in the Havasu area to 86 in the Tucson area The increase in pH can be attributed to the progressive increase in dissolved alkaline minerals The increase is a result of lower deliveries in the southern end of the aqueduct
Temperature ~ Average water temperatures for the year ranged from 63 to 69 degrees Fahrenheit with minimal differences between the Havasu Phoenix and Tucson areas of the canal system However monthly and seasonal temperatures varied considerably along the canal system Maximum temperatures reached 87 degrees Fahrenheit and minimum temperatures were about SO degrees Fahrenheit Note From June to mid-October when Lake Pleasant water is released for customer deliveries downstream of the Waddell Turnout the canal water temperatures range from 58 to 69 degrees Fahrenheit This water is 15 to 25 degrees cooler than normal canal water temperatures
DO The average dissolved oxygen levels were fairly uniform throughout the canal system Most of the sampling locations were approximately 8S mgL for 2001
Metals ~ The concentrations of dissolved heavy metals are very low to below laboratory detection limits throughout the CAP canal system
Pathogens ~ A significant amount of public drinking water in the urban areas of central and southern Arizona is treated CAP water One of the biggest concerns is the presence of pathogens in treated water including Giardia and Cryptosporidium In February and October all designated sampling sites on the CAP system produced non-detectable results for Giardia and Cryptosporidium
- 36shy
Secondary US EPA ArizonaMaximum
Maximum Health-basedContaminant Contaminant Guidancelevel
Range of Average level (MCl) (Aesthetics- level Analyte Units Detections Value (Health-based) based) (HBGl)
85 5
note 2 13 10 02 Iron note
266 note
231
600
note 2 note note 2 note note note
- 37shy
Note 1 Values presented are based upon laboratory method detection limits better defined as the lowest level that the laboratory can definitively identify that the analyte exists in the sample All method detection limits are below any existing EPA maximum contaminant level (MeL)
Note 2 Average value was not calculated due to test species not being detected consistently throughout the year See attached summary tables of priority pollutant results for locations and measured amounts
Note 3 The value reported for this constituent is for a one-time sampling event The detection of this contaminant did not reoccur in the same calendar year See attached summary tables ofpriority pollutant results for locations and measured amounts
WATER QUALITY IMPACT FROM BILL WILLIAMS RIVER
As previously mentioned the CAP aqueduct system begins at Lake Havasu The intake area for the Havasu Pumping Plant is located in a bay-like feature which is at the mouth of the Bill Williams River as it flows into Lake Havasu The Bill Williams River together with its headwaters at Alamo Lake forms the majority of the drainage area of west central Arizona During periods of heavy rainfall and runoff the flows in the Bill Williams River dominate this area of Lake Havasu and the water quality tends to be low in TDS but very turbid with high concentrations of organic matter and suspended sediments along with strong odors
The water quality deteriorates and causes treatment problems for the municipalities To avoid pumping this water into the CAP system and delivering it to customers the Havasu pumps are shut down until the water quality improves and clears up
In 1993 and 1995 the Havasu pumping had to be curtailed for a week or more due to the releases from Alamo Lake The reservoir watershed was dry in 2001 with minimal runoff therefore no water quality episodes occurred on the Bill Williams River
TASTE AND ODOR RESEARCH PROGRAM
Municipal water treatment plants which treat water supplies from the CAP and SRP systems have experienced seasonal taste and odor episodes The water has been described as having a musty-moldy-earthy taste or odor which is suspected of being associated with biological activity in reservoirs and canal systems Water treatment plants can treat this water with activated carbon to reduce or eliminate the offensive tastes and odors however treatments have significant cost
Compounds produced by Cyanobacteria (blue-green algae) are the suspected causes of the taste and odor problems Two compounds of concern are Geosmin and 2shymethylisoborneol (MIB) which can produce odors at levels as low as 1 part per trillion (ppt) The taste and odor constituents are an aesthetic problem and do not present a
- 38shy
health concern at these extremely low levels MIB detected in samples from several treatment plants appear to be due to planktonic Oscillatoria and both planktonic and periphytic Lyngbya Geosmin detected in samples appear to come from periphytic Anabeana and Lyngbya
An on going cooperative research and implementation program among ASU SRP CAP and the City of Phoenix has been monitoring the levels of MIB and Geosmin in the CAP and SRP canal systems The project is titled
Reducing Taste and Odor and Other Algae-Related Problems for Surface Water Supplies in Arid Environmentsmiddot
The project publishes and weekly newsletter which contains sampling results and recommendations for treatment of MIB and Geosmin A summary of the project and a copy of the newsletters distributed including the most current newsletter can be found at
httpceaspubeasasuedupwestltasteandodorhtm
GROUNDWATER RECHARGE PROJECTS - WATER QUALITY
The following direct recharge projects were in operation in 2001
1 Avra Valley Recharge Project 2 Pima Mine Road Recharge Project 3 Lower Santa Cruz Recharge Project 4 Agua Fria Recharge Project
A portion of the permitting process for these projects requires quarterly water quality monitoring The sampling results are compiled into an annual report The annual report is a matter of public record Copies of the reports or portions of the reports are available by contacting
Tom Harbour CAWCD Water Planning 623-869-2107 tharbourcap-azcom
- 39shy
Summary
This report has presented and discussed a variety of parameters in the CAP water quality monitoring program CAP employees are sensitive to customer needs and as changes occur along with increased interest in other constituents the water quality monitoring and sampling program will be revised accordingly and the data will be published in future annual water quality reports
For further information questions or comments please contact
Patrick Dent (623) 869-2581 Brian Henning (623) 869-2567 Tom Curry (623) 869-2353 Tim Kacerek (623) 869-2563
- 40shy

I I I I I I I I I I I
INTRODUCTION
The Central Arizona Project (CAP) delivers Colorado River water from Lake Havasu on Arizonas westem border to central and southem Arizona The total CAP system is 336 miles long and consists of open canals siphon pipelines tunnels pumping plants check structures and turnouts The CAP is Arizonas largest supplier of renewable water
The CAP is a multi-purpose project and will deliver an average of 15 million acre-feet of water each year to cities industries Indian communities and agricultural customers as it crosses the arid desert Colorado River water offsets groundwater mining which benefits the state in water conservation long-term storage for future use supplementing surface water supplies and complying with the Arizona Groundwater Management Act The CAP also provides flood control power management recreation and fish and wildlife benefits Other water-short areas of Arizona or other states such as Califomia Nevada and New Mexico can benefit from the CAP through water exchanges
The CAP canal system is connected to the Salt River Project (SRP) canal system This allows transfers and delivery of Colorado River water to SRP for customer use and direct recharge SRP manages and operates a storage reservoir and canal system which supplies water to a 240000 acre service area within the metropolitan area of Phoenix Arizona
Water Quality Standards
The CAP does not provide potable water directly to the public CAP is a raw water supplier and delivers Colorado River water to municipal water treatment plants These plants perform primary secondary and tertiary treatment of the water to remove suspended particles and bacteria The treated water is pumped through the municipal distribution system for domestic use
The CAP has developed a water quality-monitoring program which consists of three areas
1) Ongoing monitoring of primary pollutants and general water chemistry 2) Ongoing corrosion and materials studies 3) Customers parameters of interest
Water quality monitoring provides data and information to CAP staff and customers about pattems and trends in the canal and Lake Pleasant water quality The data can also be used to identify potential pollution sources
- 2shy
I~~~~--~~~~~--~
Water comes from two basic sources (1) Colorado River and (2) Lake Pleasant As previously mentioned the Colorado River is the main source of CAP water but Agua Fria River inflows from rainfallrunoff on the Lake Pleasant watershed mixes with Colorado River water that is stored in the reservoir
The CAP canal system has cross-drainage overchute structures which are designed to minimize the amount of offsite runoff from entering the canal However there is urban offsite runoff that results from bridges crossing the CAP aqueduct
Historical Water Quality Information
Prior to 1996 the USSR and CAWCD had cooperated with the United States Geological Survey (USGS) for a water quality sampling program The USGS collected monthly and quarterly grab samples at three sites on the CAP canal system
(1) Planet Ranch Road bridge (MP 8) (2) 7th Street bridge (MP 162) (3) County Road bridge just upstream of the Santa Rosa Turnout (MP 162)
The water quality program tested and analyzed over 50 parameters Historical CAP water quality data is available in the annual USGS Water Resources Data for Arizona reports The period of record for the historical data is October 1985 through September 1995 The cooperative agreement with the USGS sampling program expired on September 30 1995
Copies of the USGS annual reports can be obtained by contacting the USGS Tucson Office at (520) 670-6671
The CAP began publishing an annual water quality report in 1996 Copies of the annual reports since 1996 can be obtained by contacting the CAP Water Control Department at (623) 869-2573
Real-Time Water Quality Program
The real-time water quality program consists of a Hach turbidity meter and a Hydrolab multi-probe sensor installed at each of three sites
(1) Havasu Pump Plant (2) Hassayampa Pump Plant (3) Waddell PumpGenerator Plant
-3shy
I I I I I I I I I I I I I I I I I I
~~~~~~~~~~~~I
I I I I I I I I I I I
The real-time data is collected and stored in the CAPs control system database and daily summary reports are generated The following are the real-time parameters
Hach Turbidity (0-1000 NTU)
Hydrolab Temperature pH Dissolved Oxygen Conductivity Total Dissolved Solids Turbidity
The real-time water quality data is available to the general public by calling an automated voicedata program on the CAP control system The number is (623) 869-2182 The real time water quality data is also available at the CAP website CAP is in the process of adding the sampling program results to the website You can visit CAPs website at wwwcap-azcom
- 4shy
I~~~~--~~~~~~~
I~--------------------~
I I I Central Arizona Proj ect Canal I Water Quality Data
I I I I I I II I I I I I - 5 shy
I~--------------------~
I I I I I I I I I I I I
CAP CANAL WATER QUALITY
Water Quality Program
The water quality program consists of scheduled grab samples which are analyzed by a commercial laboratory and real-time water quality data from sensors installed at various locations along the canal system The water quality program consists of scheduled unscheduled and real-time water quality sampling
Grab Sample Program
In January 1999 the CAP contracted with Montgomery Watson Laboratory a State of Arizona licensed and certified laboratory to perform the water quality grab sample tests This program includes the following constituents and sampling sites
gt Water Quality Constituents
General Parameters Temperature (field measured) pH (field measured) Dissolved Oxygen (~O) (field measured) Conductivity (field amp lab measured) Alkalinity Calcium Chloride Copper Iron Magnesium Manganese Specific Conductance Sulfate Total Dissolved Solids (TDS) Turbidity
Taste and Odor MIS I Geosmin (as needed basis only)
Pathogens Giardia I Cryptosporidium
Priority Pollutants Heavy Metals (AsCdCrPbHgSeAg)
- 6shy
I~~~----------~~--~
Volatile Organic Compounds (VOCs) Volatile Organic Aromatics (VOAs) Organophosphorus Pesticides Carbamate Pesticides Chlorinated Herbicides
The general parameters priority pollutants and pathogens were sampled according to the attached grab sample schedule
gt Water Quality Sampling Sites
CAP Canal at Milepost
Havasu Pump Plant o Little Harquahala Pump Plant 58 99th Avenue 149 McKellips Road 194 Brady Pump Plant 254 San Xavier Pump Plant 319
The water quality data is presented in the following tables The data represents average values for each month per site including the yearly mean maximum and minimum In addition several graphs are attached which provide a graphical representation of site and time comparisons Also included is a map that identifies the grab sample locations
- 7 shy
-------------------
Central Arizona Project Canal Sampling Program Sampling Site Locations
vDEN-RHODES AQUEDUCT
FANNINMcFARLAND AQUEDUCT
L -
-rPump PIant---middotshy
UAEO PHIAL UII CO 11
LEGEND PIllA
COUIITY ( AP Aqutgtdllct
Pumplug PllUlts TUCSON
AQUEDUCT
bull WQ Localton
~ Pumping Plant Wlltltgt Watfr Samples an CoUKttgtd
2001 Grab Sample Schedule Lake
Week of Havasu Little Harq Plesant 99th Ave Mckellips Brady San Xavier
I Jan 3 GH GH GH GH GH GHi
Jan 22 GII Feb 6 GPPgc GPPgc GPP G G GPPgc
Feb 12 G 1 Feb 20 G G Mar 12 G GH GH GH GH GH
Mar 19 GH Apr 3 GH GH GH GH GH GH
Apr 30 H H H H H H
May 7 GH Mar 14 G May 23 GPPH GH GPP GPPH GH GH GPPH Jun 5 GH GH GH GH GH uH Jun 11 G GH GH GH Jun 18 G GH GH GH I
Jun 25 GH GH GH Jul3 GH GH GH GH
JulIO GPPH GH GPPH GPPH GH GH GPPH Jul 16 G GH H GH GH Jul23 GH GH GH =Jul30 G GH GH GH Aug 8 GgcH GH GH GgcH GH GH GgcH
Aug 13 G GH GH GH Aug21 GH GH GH Aug 27 G GH G GH GH Sep 5 GH GH GH GH GH GH
Sep 10 GH = GPPH GH i
Sep 18 GH GH H GH GH Sep26 G GH GH GH Oct 2 G PP gc H GH GPP G PP gc H GH GH G PP gc H
Oct 10 G GH GH GH Oct 17 G GH GH GH Oct 23 G GH GH GH Oct 30 G Nov 6 G GH GH GH GH GH
Nov 13 G Nov 19 G Nov 26 G GH GH GH Dec 5 GgcH G GgcH GH GH GgcH
Dec 10 G GH OH OH Dec 17 G GH GH OH Dec 26 G GH
- 9shy
G= General Chemistry alkalinity calcium chloride copper iron magnesium manganese sulfate specific conductance total dissolved solids (TDS) turbidity
H= HydroLab readings of temperature dissolved oxygen conductivity and pH will be taken each month at Lake Pleasant
gc= GiardialCryptosporidium
PP= Priority pollutants metals (silver arsenic cadmium chromium mercury lead selenium) volatile organic compounds (VOCs) semi-volatile organic compounds (semi-VOCs) aldicarbs herbicides
NOTE GiardialCryptosporidium and priority pollutant samples analysis will be undertaken with a two-week tum-around time based on the time the laboratory receives the samples
- 10shy
I Lake Havasu PP 2001 Parker Arizona
(General Chemistry Sampling Results)
Analyte Units Jan Feb Mar April May June July Aug Sept Oct Nov Dec Mean Max Min1
Temperature OF 530 560 580 645 750 790 840 820 770 770 630 550 686 840 530
pH 83 NA 86 84 83 NA 80 80 81 81 NA 84 82 86 80
Dissolved 02 mgL 117 NA NA NA NA NA NA NA NA NA NA NA 7 17 117 iDissolved 02 1090 NA NA NA NA NA NA NA NA NA NA 1060 1075 1090
060 I Field conductivity uSem 7250 NA 11850 9400 9320 NA 9500 9400 9440 9350 NA 9350 9429 11850 7250
Alkalinity mgL 1305 1303 1300 1400 1330 1313 1303 1260 1266 1304 1320 1310 1309 1400 1260 Calcium mgL 720 730 700 720 753 703 703 700 683 694 713 716 711 753 683 i
I Chloride mgL 686 692 690 730 699 750 735 740 696 712 740 720 716 750 686
I Copper mgL ND ND ND 001 011 ND ND 0022 ND ND 0012 NO lt0010 01 lt0010 I i
Iron (total) mgL 025 019 NO 036 023 ND 023 ND ND 013 013 014 lt010 lt010 lt010
Magnesium mgL 245 257 245 250 270 257 260 273 276 260 265 263 260 276 245 ij Manganese mgL ND ND ND 0016 NO ND ND ND ND ND ND NO lt0015 0016 lt0015
Specific Conductance uSem 8300 8200 8590 8910 8195 8306 8425 8378 8610 8746 9083 8420 8514 9083 8195
Sulfate mgL 2250 2283 2550 2300 2265 2353 2325 2300 2200 2280 2350 2275 2311 2550 2200
Total Dissolved Solids mgL 5800 5900 6000 5900 6100 5866 5975 5925 5900 6020 6200 6075 5972 I 6200 5800
Turbidity NTU 46 36 26 29 32 14 19 16 36 31 33 24 29 46 14
Little Harquabala PP 2001 --
(General Chemistry Sampling Results)
Analyte Units Jan Feb Mar April May June July Aug Sept Oct Nov Dec Mean Max Min
Temperature OF 519 NA 620 670 780 770 820 830 780 720 630 550 699 830 519
pH NA NA NA NA NA NA NA NA 81 82 82 83 82 83 81
Dissolved 02 mgL 110 NA NA NA NA 86 87 82 77 75 60 48 78 110 48
Dissolved 02 1000 NA NA NA NA 1050 1000 1000 940 940 620 450 875 1050 450 i
iField conductivity uSem 7220 NA 11340 8900 9370 9240 9100 980 9100 8000 8080 8090 8875 11340 7220 I Alkalinity mgL 1270 NA 1280 1370 1320 1298 1258 1253 1233 1270 1320 1306 1289 1370 1233
i Calcium mgL 720 770 690 710 670 700 695 674 1 675 686 680 733 700 770
Chloride mgL 717 NA 690 730 710 733 726 720 705 725 730 740 721 740 690~ I Copper mgL ND ND ND ND ND ND NO NO ND ND ND ND lt0010 lt0010 lt0010
Iron (total) mgL 029 020 ND ND i ND NO NO ND NO NO ND i 0012 lt00 lt010 lt01 0 1 Magnesium mgL 250 270 250 250 250 258 264 265 273 268 260 270 261 273 250
Manganese mgL ND ND ND ND ND ND ND ND NO NO ND ND lt0015 lt0015 lt0015 I Specific Conductance uSem 8350 NA 8650 8510 8360 8223 8238 8388 8518 8610 8050 8780 8425 8780 8050
Sulfate mgL 2340 NA 2300 2300 2290 2320 2310 2300 2275 2300 2300 2350 2308 2350 2275
Total Dissolved Solids mgL 5900 NA 6000 5900 6000 5900 5940 5975 5850 5900 6000 5900 5933 6000 5850
Turbidity NTU 39 NA 14 13 07 13 11 06 05 06 17 21 14 39 05 -NA - Data Not AvaIlable ND - Analyte Not Detectable
99th Avenue 2001 Glendale Arizona (General Chemistry Sampling Results) I
IAnalyte Units Jan Feb Mar April May June July Aug Sept Oct Nov Dec Mean Max Min
i Temperature OF 519 540 560 652 780 650 630 630 690 690 640 540 627 780 519
pH NA NA NA NA NA NA NA NA 77 80 83 82 80 83 77
Dissolved 02 mgL 124 114 08 00 78 70 54 31 53 53 61 48 74 124 31
Dissolved 02 1200 NA 020 1068 910 720 580 320 595 600 620 450 735 1200 320
Field conductivity uSem 7210 NA 9750 9200 9300 9200 9150 9200 8050 8000 8050 8100 8655 9750 7210
Alkalinity mgL 1280 1300 1310 1290 1260 1303 1318 1330 1298 1303 1255 1315 1297 1330 1255
i Calcium mgL 710 760 730 700 790 713 718 715 698 695 715 723 722 790 695
i Chloride mgL 699 676 690 710 670 750 740 733 716 723 725 733 714 750 670 i Copper mgL NO NO NO NO NO NO NO NO NO NO NO NO lt0010 lt0010 lt0010
Iron (total) mgL 013 020 013 NO 013 015 NO NO NO 0014 023 011 lt010 lt010 lt010
Magnesium mgL 250 260 250 250 270 263 270 273 275 275 275 270 265 275 250
Manganese mgL NO NO NO NO NO 0017 0021 0043 0120 014 NO NO lt0015 0140 lt0015
Specific Conductance uSem 8350 8700 8810 8630 8330 8365 8432 8513 8663 8735 8370 8830 8561 8830 8330
Sulfate mgL 2290 2280 2300 2300 2160 2360 2358 2325 2266 2300 2300 2300 2295 2360 2160
Total Dissolved Solids mgL 5800 5800 5800 6000 6400 6033 6060 5900 5875 6100 6000 6115 5990 6400 5800
Turbidity NTU 27 24 22 10 L7 14 08 15 17 16 18 20 17 27 08
McKellips Road 2001 Mesa Arizona I (General Chemistry Results)
Analyte Units Jan Feb Mar April May June July Aug Sept Oct Nov Dec Mean Max Min
ii Temperature OF 524 540 569 670 790 760 670 680 720 700 624 550 650 790 524
pH NA NA NA NA NA NA NA NA 75 81 81 84 80 84 75
Dissolved 02 mglL 93 104 108 IDA 104 IDA 79 78 75 73 67 52 87 108 52
Dissolved 02 1260 NA 1040 1140 NA 1130 830 720 900 810 650 480 896 1260 480
Field conductivity uSem 7260 N 9600 10000 9250 9170 9100 9200 8150 8100 8230 8100 8742 10000 7260
Alkalinity mgL 1280 1290 1290 1290 126 1295 1294 1300 1313 1280 1305 1273 1289 1313 I 1260I Calcium mgL 690 760 730 680 NA 708 712 703 693 690 710 696 706 760 I 680 Chloride mgL 712 732 680 720 72 755 732 728 718 733 760 726 726 760 i 680
Copper mgL NO NO NO NO NA NO NO NO NO 0014 NO ND lt0010 0014 I lt0010
Iron (total) mgL ND NO NO NO NA NO NO NO NO NO NO NO lt010 lt010 i i lt010
Magnesium mgL 240 270 250 250 NA 263 270 270 273 275 280 270 265 280 I 240
Manganese mglL NO NO NO NO NA 0030 0018 0037 0076 0050 0056 0041 00 01 00I I I
Specific Conductance uSem 8450 8700 8620 8540 817 8323 8532 8578 8585 8680 8625 8650 8538 8700 I 8170
Sulfate mgL 2310 2400 2200 2300 230 2370 2332 2300 2300 2325 2350 2333 2318 2400 2200
Total Dissolved Solids mgL 5600 5800 5800 6000 610 5900 6000 6133 6050 6050 6150 6033 5968 6150 5600
Turbidity NTU 24 13 13 12 045 11 09 14 17 11 17 10 13 24 05
NA - Data Not AvaIlable ND - Analyte Not Detectable
- -Brady PP 2001I
I (General Chemistry Sampling Results) Analyte Units Jan Feb Mar April May June July Aug Sept Oct Nov Dec Mean Max Min
Temperature OF 510 NA 611 722 847 781 715 699 733 727 69 I 569 691 847 510
pH NA NA NA NA NA NA NA NA NA 82 80 81 8 I 82 80 IDissolved 02 mglL 101 NA 120 NA NA 92 72 82 106 74 59 57 85 120 57
Dissolved 02 902 NA 1220 NA NA 956 829 918 986 858 662 546 875 1220 546 Field conductivity uSem 7080 NA 9600 9800 9830 9150 9150 9250 9350 8200 8300 8300 8910 9830 7080
Alkalinity mglL 1240 1210 1230 1280 1240 1280 1330 1420 1410 1300 1330 1240 1293 1420 1210 Calcium mglL 710 700 720 710 660 690 690 720 780 700 710 670 705 780 660 Chloride mglL 741 735 690 690 690 730 750 730 690 730 790 720 724 790 690i
Copper mglL NO NO NO NO NO NO NO NO NO NO NO NO lt0010 lt0010 lt0010
I ron (tota I) mglL NO NO NO 0014 NO NO NO NO NO NO NO NO lt010 0014 lt010 i
Magnesium mglL 260 260 260 250 250 260 260 270 310 270 280 280 268 310 250 Manganese mglL NO NO NO 0018 NO NO NO 0025 0Q38 0032 0025 NO lt0015 lt0015 lt0015
Specific Conductance uSem 8400 8550 8480 8710 8280 8270 8480 8510 8730 8950 8810 8600 8564 8950 8270
i Sulfate mglL 2400 2400 2200 2200 2230 2310 2350 2300 2200 2300 2400 2400 2308 2400 2200
Total Dissolved Solids mglL 5700 5700 5700 6000 5900 6000 6100 5900 5900 6400 5900 6100 5942 6400 5700 Turbidity NTU 14 13 12 42 06 08 11 13 10 15 17 12 14 42 06
San Xavier PP 2001 Tucson Arizona (General Chemistry Sampling Results)
Analyte Units Jan Feb Mar April May June July Aug Sept Oct Nov Dec Mean Max Min
Temperature OF 491 NA NA 738 826 770 821 862 825 706 678 539 726 862 491
pH NA NA NA NA NA NA NA NA NA 82 82 83 82 83 82
Dissolved 02 mglL 103 NA 104 NA NA 88 75 85 80 74 61 68 82 104 61 i
Dissolved 02 947 NA 1040 NA NA 867 924 1120 1020 840 690 630 898 1120 630 Field conductivity uSem 7000 NA 9400 10000 9600 9200 9200 8780 9360 8150 8200 8250 8831 10000 7000
Alkalinity mglL 1180 1120 1180 1140 1120 1070 1160 1110 1270 1280 190 1080 1158 1280 1070
Calcium mgIL 650 670 690 630 620 640 680 610 730 700 660 620 658 730 610 Chloride mglL 724 2020 700 740 737 790 750 690 690 740 760 770 843 2020 690
middot Copper mglL NO NO NO NO NO NO NO NO NO NO NO NO lt0010 lt0010 lt0010
middot i
Iron (total) mgIL NO NO NO NO NO NO NO NO NO NO NO NO lt010 lt010 lt010
Magnesium mglL 250 260 260 250 270 280 280 260 310 290 280 290 273 310 250 middot
Manganese mglL NO NO NO NO NO NO NO NO NO NO NO NO lt0015 lt0015 lt0015
i Specific Conductance uSem 8300 8400 8530 8620 8750 8520 8030 8210 8760 8850 8910 8700 8548 8910 8030 i Sulfate mglL 2350 4950 2300 2400 2390 2490 2370 2200 2200 2300 2400 2500 2571 4950 i 2200 I Total Dissolved Solids mgL 5600 5600 5800 6000 6000 5900 6100 5500 6000 6100 6100 6000 5892 6100 i 5500
Turbidity NTU 16 11 10 07 05 04 07 09 07 10 07 09 08 16 04 NA - Data Not Available NO = Analyte Not Detectable
Priority Pollutant Sampling Results February 2001
Analyte units Havasu PP 99w Ave San Xavier PP
Di(2-Ethylexl)phthlate ppb 07 Arsenic ppb 26 24 25
i Barium ppb 0096 01 0092 I Potassium ppm 41 41 4
Sodium ppm 80 78 78 Silica ppm 29 97 71
Strontium ppm 1 1 I I
i Lead ppb 056 I Chromium ppb 21 I Nitrate as N03 ppm 568
Nitrate as N ppm 129 Giardia L Non Detect Non Detect 01
Cryptosporidium L Non Detect Non Detect Non Detect
Priority Pollutant Sampling Results May 2001
IAnalyte units Havasu PP 99lR Ave San Xavier PP
Barium ppb 0098 0096 Potassium ppm 42 41 43 Sodium ppm 84 80 83 Silica ppm 10 99 88
Orthophosphate-P ppm 001
I Ce~ kizqna Project 2001 bi~ed6xgeii(po)
(averagernaltHY vatues)
I I 100 J--7~~~==~------------
I -- Cgt E 60 -1-- - --- - - ----- ----------___- - ------- __- ----------
0 o middot
40+---------------------~--~r_-~----~----~middotI ~
I 2Q + ___ ___100l--Yo_CoI----c0-ra-do_____ ---_ _ ------85l=cYoltLa=ke=-Pl=ea=Si=nt---------------_1-00l=Yo-=CoI==ora=-=dO River Water 1SCoIorado River River Water
90 -f~~~~~ ~ ---~---~ i
I ~= = - ~~= - = -~~==----i
JahFeb middotmiddot Met Apil bull~ Jile JlIy ~ Sept Qt middotmiddotribv Dec
-
1middot~~middotmiddot ____ McKali~ I middot I - -
I II
~f1lalkilor13 erOJed2()Qf middot Ca~ ~r Terqeratur~rF)
middot middot-T ~i
II (~ nlOllHy vaues) J ~
i
1000 _ ~__ l _ jjiL LL~~~~~~ ~ ii~ _ l ____
ooO+------------------- shy
bullbull _____bullbull ~l_ _bullbull _~ bull _ -- - ~
I ( ----------------1
OOmiddot) t-----------F~------------+---_j ~ -
I shy
i ~
IIgt mo+-middot -------~L-~~~C__-___7~~-----l
I ~ ~O +---------9lt-----------7---------------~___-_j E t shy
~o~------------------------~----------------~--------_jmiddot
I River Water 15Colorado River ) ~lt ~3)O f--=---=C-T=- ----=c-----= i _ 1 = j j
JaiRitF Mr APiI riii8y middot~~ ~ sElli middot ot ~~ ~ ~ -
I~~~~~~==~~====~
I I
I Cental Ar izpna Project 2001 CarialWater TOS (mglL) (average monthly values)
I 7000 r
I 6500 +---- - - ----- ---------- ---- - ----- ---shy
I S C ~ 5500 +--------------~-----------------
I en o I shy
100 Colorado 86 Lake Pleasant 100 Colorado 5000+ ------~R-ivcer-W7acte 1=6cC~o=locrac oR7ivcr-=------=---- d er-------Rc-iv=-e=-r7W7-ater------
I 4500 t------- ------------- - - - - -------shy
I 1 1 t shyo
J~h bull Fep Mar Apri( May Juni July Aug Sept Oct ~
L ~
I [~99th Ave ~Havas~ PP j shy
---- -
I i
Cental AriZ~naPnfec20of _ i _ I Ca~al~~ter T~~bidity (rit~f (aera9~monthlyvaliJes) gt
I 100 Colorado 85 Lake Pleasant 100 Colorado
River Water 15 Colorado River River Water
I lts- 30 + ------------r---T------------------+-----+----~------I middotmiddotSmiddotmiddotmiddot middot i
~ i s +__=--_---------_____---_ --c-_ ___ _ ------i-------i---- ---i
I -0
bullbull ~ 20 +-------~_------~~--~--~-------~----__~
I 10 +---- - ----- -------------7---- - --- - -------- ---- 1-shy
05 t-------------------------------~--------------------~---------~
I Eto +-~~-_-~r_-___-- _ - _-1 - -- __ --- ~---=r------r---r--~------_---i
jari Fab middotmiddot- April July bull
1~99th ~~ ~Hava~ ~ 1 I
I~--~~~~~------~~
I I I II Lake Pleasant Reservoir I Water Quality Data
I I I I I I I I I I I
- 18 shy
I I~~~~~--~--------~
LAKE PLEASANT RESERVOIR
The CAP aqueduct system utilizes Lake Pleasant as a seasonal pump-storage reservoir During a typical year Colorado River water is pumped into the lake from mid-October to mid-June when water demands and electricity costs are lower From mid-June to midshyOctober when water demands and electricity costs are higher water is released from the lake for customer deliveries
The Agua Fria River flows into Lake Pleasant and the inflows vary each year During dry years on the watershed the reservoir storage is mostly Colorado River water and during wet years with substantial runoff the reservoir has a blend of Colorado River and Agua Fria River water
The CAP conducted the following water quality sampling on Lake Pleasant in 2001
(1) Agua Fria River Sampling - February 20 July 11 and August 8 2001
In 2001 the Agua Fria River contributed approximately 25200 acre-feet of Lake Pleasant water This represented about 33 of the total lake volume at the end of the filling period in May 2001
I
The water quality samples may represent the water chemistry found in the Agua Fria River during a rainfall event However one sample does not provide enough data to fully assess and validate the typical water quality conditions of the Agua Fria River Refer to the attached table for the Agua Fria River water quality data
I Overall the water quality does not differ significantly from the Colorado River water which is diverted through the CAP canal and pumped into Lake Pleasant The water quality impact of the Agua Fria River was minimal for the year 2001 delivery season
I (2) Lake Pleasant Sampling - February 5 May 21 July 11 August 8 August 28 and October 2 2001
I I The water quality values were similar to the Colorado River The lake with mostly
Colorado River water was clear with turbidity levels averaging 20 NTU and TDS levels of 610 to 640 mgll
I Lake Pleasant depth profiles indicated that stratification occurred in the summer months The upper layer (epilimnion) was oxygen rich with a higher temperature as well as having a slightly higher pH conductivity and TDS The lower layer (hypolimnion) was lower in dissolved oxygen with lower temperatures and slightly
I I - 19 shy
I
lower pH and conductivity (which is a measure of TDS) Refer to the attached graphs of Lake Pleasant depth profiles for the above dates
The oxygen deficit conditions at the lower depths may cause sediment nutrient release through the process of reduction If the sedimentwater intetiace is exposed to prolonged periods of anoxia reducing conditions allow the formation of nutrients previously unavailable for taste and odor causing organisms This reduction may lead to sapropel formation a compound that is high in hydrogen sulfide and methane and has a shiny black color due to the presence of ferrous sulfide This compound is responsible for the occasional rotten-egg odor associated with water releases from the hypolimnion layer through the lower portal on the intake towers
Nutrients such as nitrogen and phosphorous become unbound from their ionic association with metals such as iron manganese and aluminum This process may free up nutrients which contribute to algae blooms in the canal system The precipitates iron and manganese cause discolored water and treatment problems
Typically the degree of stratification gradually forms during the summer and lasts until the latter part of fall Usually by November or December the lake has turned over This phenomenon is caused by the decrease in sutiace water temperatures which increase the sutiace water density and result in displacement or mixing of sutiace water with deeper water This mixing restores the lake to a more uniform water chemistry profile
Refer to the attached tables for the Lake Pleasant water quality values dated February 5 May 21 July 11 August 8 August 28 and October 22001
(3) Lake Pleasant Depth Profiles
The largest changes in lake water chemistry are related to seasonal changes and depth Depth profile samples were conducted on July 11 July 24 August 8 and September 18 2001 The water quality parameters included temperature pH specific conductivity and dissolved oxygen
All the water quality parameters evaluated on the above dates were at the following four locations
(1) Towers at New Waddell Dam (2) 250 yards north of New Waddell Dam (3) 1000 yards north of New Waddell Dam (4) 1 mile north of New Waddell Dam
- 20shy
l~ bull
CAP staff used a portable Hydrolab multi-probe water quality sensor to conduct depth profile sampling Refer to the following graphs which present the Lake Pleasant Depth profile results
The intake towers at the New Waddell Dam have sets of intake portals at two different levels which are 100 feet apart in elevation Adjustable operations and optimum use of the upper and lower portals offers the CAP opportunities to maximize the quality of water released from the lake for customer deliveries
I
In past years water releases were made through the upper gates as long as possible It was believed that this zone had the best water quality By the end of the summer the lake elevation was lower than the upper gates so all releases were switched over to the lower gates At that time the lower quality water from the bottom zone of the lake was introduced into the canal system resulting in treatment concems for the cities
I In 1998 a new operational scheme was used to manage the water quality from the releases at Lake Pleasant This new scheme consisted of using only the lower portals for releases during the entire summer The use of the lower gates during the initial releases
t in June allowed medium-oxygenated bottom water to be released early in the release period while prolonging the retention of the high-oxygenated epilimnion water This minimized the volume of anoxic water which would have been delivered from the lake during the latter part of the summer release period
I The 1998 procedure improved late summer water quality conditions The same release
I procedures have been used every summer since 1998 including 2001 Cities reported that they received significantly fewer taste and odor complaints from their customers
~ Lake Pleasant sampling results are presented in the following section Included are the 2001 tower operations project schematic for seasonal flows depth prollles at Lake Pleasant and the water quality sampling results
I i
I I I I - 21 shy
I ~~~~~__~~-==-=--=--=-=-==-=--===-
--------Lake Pleasant Operations 2001
October 2000 - May 2001 Operations in fill mode
May 1 - November 5 Operations in release mode Water released from lower gates all summer
May 1- November 5 Pass-through pumping (Colorado River water blended with Lake Pleasant water)
November 5 Lake Pleasant reaches lowest level of year (163877 ft above MSL) Terminated Lake Pleasant releases for season
November 52001 Operations return to fill mode
~~~----------~---------~ ~-------~--~~~
I I
I I I I - 22 shy
I~~~~--~~~~~~-~
-_ _ ------ -- -
ARIZONA
t N
LEGEND
bull PUMPING PLANT
CANAL100 COLORADO RIVER _ot- INVERTED SIPHONIOJA f1UA SIPHCraquoI
--+-+-- TUNNEL
--+---+-- PIPELINE
gILA IlMJI SIIIOf
WINTER MID OCTOBER - MAY
CENTRAL ARIZONA PROJECT GENERAL LOCATION MAP
~---~----------~---
J(
t 85 Lake Pleasant LECEND
15 ColoraJo River --t--- PIJIJPIHG PWIT
CAilAL
-- lIMRTED SIPflON
---t--~- IUlltlEl
----+- PIPELlUE
SUMMER JUNE - MID OCTOBER
CENTRAL ARIZONA PROJECT GENERAL LOCATION MAP
-- -- -shy
LAKE PLEASANT 7112001
DO (mgl)
o 05 1 15 2 25 3 35 4 45 5 55 6 65 7 75 8 85 9 95 10
1700 - ---1f---I---+------I--+ bull towers
--- 250yds
1000yds
~1mile
--Water Level
c 1620 o
~ gt ~ 1 600 ~-4~~~--~~~~~ -~I~-+~-r~~~r-~---+--~--+---~-+~~--4-~~~
GIyen
j 1580
1540
1520 Lower Gate
~ 1500
--
LAKE PLEASANT 7242001
o 05 15 2 25 3 35 445555665 7 75 8 8599510
1700 i --Towers
- 250yds 1680 +--~~-_r-~~r_~-_+-4_-+_~~_+-~-4_-~~-_+-~-+_--~~ -tr-1000yds
-- 1mile 1660 -+----1-- --+-----f-----+--I----+--r-_+__ --+- AFria
-Water Level
Upper Gate
1540
1520 Lower Gate -1500
LAKE PLEASANT 882001
0 05 15 2 25 3 35 4 45 5 55 6 65 7 75 8 85 9 95 10
1700 -- 882001
1680 2S0yds
-tl- SOOyds
1660 ~~t=~~~~~~~~~~~~~~~~~b~~~~=fPo-----+----~1 -+-1mile
-AguaFria
1640 -Water
Upper Gate c 0
f~ gt shyQI 1600W QI
l ~
1560
1540
Lower Gate 1520
1500
LAKE PLEASANT 9182001
1DO (mgJl) l
o 05 1 15 2 25 3 35 4 45 5 55 6 65 7 75 8 85 9 95 10
1700 -r---~~---T---r--1---T-~---T---r--~--T---r-~---T---r--~--T---r-~---i1~--~----~1 owers
~250YDS 1680 r-~---+---r--~--+-~r--+---+--~--+---r-~r--+---+--~--+---r-~---+---I
~1000YDS
1Mile 1660 r---r-~---+---r--~--+-~~-+---+--4---+---r-~---+---+--~--+---r-~--~1
+--______-+-__-__-+__~___________-_~ -Water---~-+---+---I Level
1640 +---~--1---+---r--~---~~---+--~--~--~--~~--~~~r=~--_t---r--~--~~--------__Q
Upper Gate
1560
1540
Lower Gate 1520
1500
_ bull ____ _ IIIIJ _ i __ _ _ ~ _
LAKE PLEASANT 7112001
Temperature (F)
90 85 80 75 70 65 60 55 50 1700 +--------shy
1680 ~------~~~----~------~------~--------~------~--------~------~
1660 +--------+----~~--r_------~------~--
1640 -t----l------~=r~~~==~~_-II--_T-------
1540
1520
--- Towers
-+-250yds
1000yds
-+- 1Mile
--Water Level
Upper Gate
Lower Gate -1500 l
LAKE PLEASANT 72401
Temperature (F)
90 85 80 75 70 65 60 55 50 1700 +--------+--------+--------r----~--~------~-------~~------~------~ r-----------~ -+-Towers
- 250yds 1680 T--------+--------+-------~--------~------_r------~~------~------~ 1000yds
~lMile
1660 +-------~~----_r--------r_------_r------~~------~------_4------~ ---AFria
-Water Level
Upper Gate
1560 +-ii~
1540
1520 Lower Gate
1500
- - ~ 111ft - ~ --- shy
LAKE PLEASANT 8801
Temperatura (F)
90 85 80 75 70 65 60 55 50 1700 +-------~--------~------_+--------~------~--------~------~--------~p------------~
-- towers
-+-250yds1680 +-------~--------~------_+--------~------~--------~------~---------
- 1000yds
1mile
~aguafria
1640 +-------~~~----~---middot---_+--------~------~-------middot-~------~~------~ - Water Level
1540
1520
1500
- _ - _ - middotmiddot ~ 1118 -
LAKE PLEASANT 9182001
Temperature (F)
90
1700 85 80 75 70 65 60 55 50
~Towers
1680
1660
250YDS
~1000YDS
___ 1Mile
1640 -Water
Level
1 1620
2 ~
1600 w QI
til J 1580
Upper Gate
1560
1540
1520 Lower Gate
1500
LAKE PLEASANT 9182001
4 5 6 7 8 9 10 11 12 13 14 1700 +-----~-------r_----_r----~------~----_+------+_----_+------~----~----------_
-+-Towers
1680 +-----_4------4-~--_4------4_----~------~~----~----~------~----~1 --- 250YDS
1000YDS
1660 +------t-------t------t------4-------i-------+-------if-------+-------t-------i1 ~ 1Mile
1------+------+-----------+-~~-+------+----~~-----+-----------~ -Water Level 164deg t---~j------II~---t--~-t_1~~----~~----r_----t_----i_----jL----------J
1620 i~ Upper Gate
1560 ~~~
1540
bullLower Gate 1520
1500
Lake Pleasant 2001 Water Quality Sampling Results
Analyte units FebS May 21 July J I Aug8 Aug28 Oct 2 Alkalinity ppm 131 126 122 119 121 127 Calcium ppm 72 72 70 67 68 68 I
Chloride ppm 627 74 78 80 80 75 I
I Copper ppm ND ND ND ND NO NO I
Iron (Total) ppm ND 11 ND NO ND NO i Magnesium ppm 27 28 28 29 30 30
I
I Manganese ppm ND 0025 ND ND NO 00]6 ~
I I
i Specific Conductance uScm 895 814 864 863 896 916 Sulfate ppm 211 231 246 250 250 240 I
Total Dissolved Solids Turbidity
ppm ntu
610 37 70
630 05
620 0
640 08
620 12 I
i Arsenic ppb 10 34 42 Barium ppb 013 01 0075 0083
i Chromium ppb 14 Lead (Total) ppb 061
Mercury ppm 022 Potassium ppm 45 45 49 46 Sodium ppm 81 83 87 92 Silica ppm 97 12 10 12
Strontium ppm 12 09 092 Orthophosphate-P ppm 001
MTBE ppm 52 Oiethylphthalate ppb 14 3
Agua Fria River 2001 Water Quality Sampling Results
Analyte units Feb 20 Julll Aug8 i
Alkalinity ppm 164 148 277 Calcium ppm 40 71 83 Chloride ppm 164 75 41 Copper ppm NO NO NO
Iron (Total) ppm 098 042 11 -Magnesium ppm 17 30 35 I Manganese ppm 0045 019 16 I
Specific Conductance uScm 412 865 792 I Sulfate ppm 339 231 110 I
Total Dissolved Solids ppm 260 630 530 I
Turbidity ntu 1 1 13 14 i Arsenic ppb 10 13 I Barium ppb 0036 0095 I
IChromium ppb 25 13 Ferrous Iron ppm 04 I
i Lead (Total) ppb 095 064 II Potassium ppm 17 52 Sodium ppm 28 87 - I Silica ppm 24 13
Strontium ppm 03 10 I
Orthophosphate-P ppm 0034 0015 Total phosphorous-P ppm 0065 002
Diethylphthalate ppb 11
GiardiaCryptosporidium CytsIOOL SliB CHD
GENERAL DISCUSSION
Turbidity gt- The suspended solids are very low with turbidity levels averaging 1-5 NTU with an occasional spike exceeding 100 NTU The water in the canal and Lake Pleasant is very clear and the lake bottom can be seen at depths of 25-30 feet In general when canal flows are lower or steady the turbidity is low When flow increases occur the higher velocities cause an increase in turbidity levels These increases in turbidity are generally very short in duration Algae blooms in the canal also have an impact on tUrbidity Blooms are generally very localized and do not contribute significantly to the overall turbidity levels of CAP water
TDS)gt Total dissolved solids represent the concentration of dissolved minerals in the water The TDS levels in CAP water are high when compared to most groundwater sources For the year the average TDS was 600 mgL and maintained consistent values throughout the canal system
pH ~ The average pH ranged from 82 in the Havasu area to 86 in the Tucson area The increase in pH can be attributed to the progressive increase in dissolved alkaline minerals The increase is a result of lower deliveries in the southern end of the aqueduct
Temperature ~ Average water temperatures for the year ranged from 63 to 69 degrees Fahrenheit with minimal differences between the Havasu Phoenix and Tucson areas of the canal system However monthly and seasonal temperatures varied considerably along the canal system Maximum temperatures reached 87 degrees Fahrenheit and minimum temperatures were about SO degrees Fahrenheit Note From June to mid-October when Lake Pleasant water is released for customer deliveries downstream of the Waddell Turnout the canal water temperatures range from 58 to 69 degrees Fahrenheit This water is 15 to 25 degrees cooler than normal canal water temperatures
DO The average dissolved oxygen levels were fairly uniform throughout the canal system Most of the sampling locations were approximately 8S mgL for 2001
Metals ~ The concentrations of dissolved heavy metals are very low to below laboratory detection limits throughout the CAP canal system
Pathogens ~ A significant amount of public drinking water in the urban areas of central and southern Arizona is treated CAP water One of the biggest concerns is the presence of pathogens in treated water including Giardia and Cryptosporidium In February and October all designated sampling sites on the CAP system produced non-detectable results for Giardia and Cryptosporidium
- 36shy
Secondary US EPA ArizonaMaximum
Maximum Health-basedContaminant Contaminant Guidancelevel
Range of Average level (MCl) (Aesthetics- level Analyte Units Detections Value (Health-based) based) (HBGl)
85 5
note 2 13 10 02 Iron note
266 note
231
600
note 2 note note 2 note note note
- 37shy
Note 1 Values presented are based upon laboratory method detection limits better defined as the lowest level that the laboratory can definitively identify that the analyte exists in the sample All method detection limits are below any existing EPA maximum contaminant level (MeL)
Note 2 Average value was not calculated due to test species not being detected consistently throughout the year See attached summary tables of priority pollutant results for locations and measured amounts
Note 3 The value reported for this constituent is for a one-time sampling event The detection of this contaminant did not reoccur in the same calendar year See attached summary tables ofpriority pollutant results for locations and measured amounts
WATER QUALITY IMPACT FROM BILL WILLIAMS RIVER
As previously mentioned the CAP aqueduct system begins at Lake Havasu The intake area for the Havasu Pumping Plant is located in a bay-like feature which is at the mouth of the Bill Williams River as it flows into Lake Havasu The Bill Williams River together with its headwaters at Alamo Lake forms the majority of the drainage area of west central Arizona During periods of heavy rainfall and runoff the flows in the Bill Williams River dominate this area of Lake Havasu and the water quality tends to be low in TDS but very turbid with high concentrations of organic matter and suspended sediments along with strong odors
The water quality deteriorates and causes treatment problems for the municipalities To avoid pumping this water into the CAP system and delivering it to customers the Havasu pumps are shut down until the water quality improves and clears up
In 1993 and 1995 the Havasu pumping had to be curtailed for a week or more due to the releases from Alamo Lake The reservoir watershed was dry in 2001 with minimal runoff therefore no water quality episodes occurred on the Bill Williams River
TASTE AND ODOR RESEARCH PROGRAM
Municipal water treatment plants which treat water supplies from the CAP and SRP systems have experienced seasonal taste and odor episodes The water has been described as having a musty-moldy-earthy taste or odor which is suspected of being associated with biological activity in reservoirs and canal systems Water treatment plants can treat this water with activated carbon to reduce or eliminate the offensive tastes and odors however treatments have significant cost
Compounds produced by Cyanobacteria (blue-green algae) are the suspected causes of the taste and odor problems Two compounds of concern are Geosmin and 2shymethylisoborneol (MIB) which can produce odors at levels as low as 1 part per trillion (ppt) The taste and odor constituents are an aesthetic problem and do not present a
- 38shy
health concern at these extremely low levels MIB detected in samples from several treatment plants appear to be due to planktonic Oscillatoria and both planktonic and periphytic Lyngbya Geosmin detected in samples appear to come from periphytic Anabeana and Lyngbya
An on going cooperative research and implementation program among ASU SRP CAP and the City of Phoenix has been monitoring the levels of MIB and Geosmin in the CAP and SRP canal systems The project is titled
Reducing Taste and Odor and Other Algae-Related Problems for Surface Water Supplies in Arid Environmentsmiddot
The project publishes and weekly newsletter which contains sampling results and recommendations for treatment of MIB and Geosmin A summary of the project and a copy of the newsletters distributed including the most current newsletter can be found at
httpceaspubeasasuedupwestltasteandodorhtm
GROUNDWATER RECHARGE PROJECTS - WATER QUALITY
The following direct recharge projects were in operation in 2001
1 Avra Valley Recharge Project 2 Pima Mine Road Recharge Project 3 Lower Santa Cruz Recharge Project 4 Agua Fria Recharge Project
A portion of the permitting process for these projects requires quarterly water quality monitoring The sampling results are compiled into an annual report The annual report is a matter of public record Copies of the reports or portions of the reports are available by contacting
Tom Harbour CAWCD Water Planning 623-869-2107 tharbourcap-azcom
- 39shy
Summary
This report has presented and discussed a variety of parameters in the CAP water quality monitoring program CAP employees are sensitive to customer needs and as changes occur along with increased interest in other constituents the water quality monitoring and sampling program will be revised accordingly and the data will be published in future annual water quality reports
For further information questions or comments please contact
Patrick Dent (623) 869-2581 Brian Henning (623) 869-2567 Tom Curry (623) 869-2353 Tim Kacerek (623) 869-2563
- 40shy

I I I I I I I I I I I
The real-time data is collected and stored in the CAPs control system database and daily summary reports are generated The following are the real-time parameters
Hach Turbidity (0-1000 NTU)
Hydrolab Temperature pH Dissolved Oxygen Conductivity Total Dissolved Solids Turbidity
The real-time water quality data is available to the general public by calling an automated voicedata program on the CAP control system The number is (623) 869-2182 The real time water quality data is also available at the CAP website CAP is in the process of adding the sampling program results to the website You can visit CAPs website at wwwcap-azcom
- 4shy
I~~~~--~~~~~~~
I~--------------------~
I I I Central Arizona Proj ect Canal I Water Quality Data
I I I I I I II I I I I I - 5 shy
I~--------------------~
I I I I I I I I I I I I
CAP CANAL WATER QUALITY
Water Quality Program
The water quality program consists of scheduled grab samples which are analyzed by a commercial laboratory and real-time water quality data from sensors installed at various locations along the canal system The water quality program consists of scheduled unscheduled and real-time water quality sampling
Grab Sample Program
In January 1999 the CAP contracted with Montgomery Watson Laboratory a State of Arizona licensed and certified laboratory to perform the water quality grab sample tests This program includes the following constituents and sampling sites
gt Water Quality Constituents
General Parameters Temperature (field measured) pH (field measured) Dissolved Oxygen (~O) (field measured) Conductivity (field amp lab measured) Alkalinity Calcium Chloride Copper Iron Magnesium Manganese Specific Conductance Sulfate Total Dissolved Solids (TDS) Turbidity
Taste and Odor MIS I Geosmin (as needed basis only)
Pathogens Giardia I Cryptosporidium
Priority Pollutants Heavy Metals (AsCdCrPbHgSeAg)
- 6shy
I~~~----------~~--~
Volatile Organic Compounds (VOCs) Volatile Organic Aromatics (VOAs) Organophosphorus Pesticides Carbamate Pesticides Chlorinated Herbicides
The general parameters priority pollutants and pathogens were sampled according to the attached grab sample schedule
gt Water Quality Sampling Sites
CAP Canal at Milepost
Havasu Pump Plant o Little Harquahala Pump Plant 58 99th Avenue 149 McKellips Road 194 Brady Pump Plant 254 San Xavier Pump Plant 319
The water quality data is presented in the following tables The data represents average values for each month per site including the yearly mean maximum and minimum In addition several graphs are attached which provide a graphical representation of site and time comparisons Also included is a map that identifies the grab sample locations
- 7 shy
-------------------
Central Arizona Project Canal Sampling Program Sampling Site Locations
vDEN-RHODES AQUEDUCT
FANNINMcFARLAND AQUEDUCT
L -
-rPump PIant---middotshy
UAEO PHIAL UII CO 11
LEGEND PIllA
COUIITY ( AP Aqutgtdllct
Pumplug PllUlts TUCSON
AQUEDUCT
bull WQ Localton
~ Pumping Plant Wlltltgt Watfr Samples an CoUKttgtd
2001 Grab Sample Schedule Lake
Week of Havasu Little Harq Plesant 99th Ave Mckellips Brady San Xavier
I Jan 3 GH GH GH GH GH GHi
Jan 22 GII Feb 6 GPPgc GPPgc GPP G G GPPgc
Feb 12 G 1 Feb 20 G G Mar 12 G GH GH GH GH GH
Mar 19 GH Apr 3 GH GH GH GH GH GH
Apr 30 H H H H H H
May 7 GH Mar 14 G May 23 GPPH GH GPP GPPH GH GH GPPH Jun 5 GH GH GH GH GH uH Jun 11 G GH GH GH Jun 18 G GH GH GH I
Jun 25 GH GH GH Jul3 GH GH GH GH
JulIO GPPH GH GPPH GPPH GH GH GPPH Jul 16 G GH H GH GH Jul23 GH GH GH =Jul30 G GH GH GH Aug 8 GgcH GH GH GgcH GH GH GgcH
Aug 13 G GH GH GH Aug21 GH GH GH Aug 27 G GH G GH GH Sep 5 GH GH GH GH GH GH
Sep 10 GH = GPPH GH i
Sep 18 GH GH H GH GH Sep26 G GH GH GH Oct 2 G PP gc H GH GPP G PP gc H GH GH G PP gc H
Oct 10 G GH GH GH Oct 17 G GH GH GH Oct 23 G GH GH GH Oct 30 G Nov 6 G GH GH GH GH GH
Nov 13 G Nov 19 G Nov 26 G GH GH GH Dec 5 GgcH G GgcH GH GH GgcH
Dec 10 G GH OH OH Dec 17 G GH GH OH Dec 26 G GH
- 9shy
G= General Chemistry alkalinity calcium chloride copper iron magnesium manganese sulfate specific conductance total dissolved solids (TDS) turbidity
H= HydroLab readings of temperature dissolved oxygen conductivity and pH will be taken each month at Lake Pleasant
gc= GiardialCryptosporidium
PP= Priority pollutants metals (silver arsenic cadmium chromium mercury lead selenium) volatile organic compounds (VOCs) semi-volatile organic compounds (semi-VOCs) aldicarbs herbicides
NOTE GiardialCryptosporidium and priority pollutant samples analysis will be undertaken with a two-week tum-around time based on the time the laboratory receives the samples
- 10shy
I Lake Havasu PP 2001 Parker Arizona
(General Chemistry Sampling Results)
Analyte Units Jan Feb Mar April May June July Aug Sept Oct Nov Dec Mean Max Min1
Temperature OF 530 560 580 645 750 790 840 820 770 770 630 550 686 840 530
pH 83 NA 86 84 83 NA 80 80 81 81 NA 84 82 86 80
Dissolved 02 mgL 117 NA NA NA NA NA NA NA NA NA NA NA 7 17 117 iDissolved 02 1090 NA NA NA NA NA NA NA NA NA NA 1060 1075 1090
060 I Field conductivity uSem 7250 NA 11850 9400 9320 NA 9500 9400 9440 9350 NA 9350 9429 11850 7250
Alkalinity mgL 1305 1303 1300 1400 1330 1313 1303 1260 1266 1304 1320 1310 1309 1400 1260 Calcium mgL 720 730 700 720 753 703 703 700 683 694 713 716 711 753 683 i
I Chloride mgL 686 692 690 730 699 750 735 740 696 712 740 720 716 750 686
I Copper mgL ND ND ND 001 011 ND ND 0022 ND ND 0012 NO lt0010 01 lt0010 I i
Iron (total) mgL 025 019 NO 036 023 ND 023 ND ND 013 013 014 lt010 lt010 lt010
Magnesium mgL 245 257 245 250 270 257 260 273 276 260 265 263 260 276 245 ij Manganese mgL ND ND ND 0016 NO ND ND ND ND ND ND NO lt0015 0016 lt0015
Specific Conductance uSem 8300 8200 8590 8910 8195 8306 8425 8378 8610 8746 9083 8420 8514 9083 8195
Sulfate mgL 2250 2283 2550 2300 2265 2353 2325 2300 2200 2280 2350 2275 2311 2550 2200
Total Dissolved Solids mgL 5800 5900 6000 5900 6100 5866 5975 5925 5900 6020 6200 6075 5972 I 6200 5800
Turbidity NTU 46 36 26 29 32 14 19 16 36 31 33 24 29 46 14
Little Harquabala PP 2001 --
(General Chemistry Sampling Results)
Analyte Units Jan Feb Mar April May June July Aug Sept Oct Nov Dec Mean Max Min
Temperature OF 519 NA 620 670 780 770 820 830 780 720 630 550 699 830 519
pH NA NA NA NA NA NA NA NA 81 82 82 83 82 83 81
Dissolved 02 mgL 110 NA NA NA NA 86 87 82 77 75 60 48 78 110 48
Dissolved 02 1000 NA NA NA NA 1050 1000 1000 940 940 620 450 875 1050 450 i
iField conductivity uSem 7220 NA 11340 8900 9370 9240 9100 980 9100 8000 8080 8090 8875 11340 7220 I Alkalinity mgL 1270 NA 1280 1370 1320 1298 1258 1253 1233 1270 1320 1306 1289 1370 1233
i Calcium mgL 720 770 690 710 670 700 695 674 1 675 686 680 733 700 770
Chloride mgL 717 NA 690 730 710 733 726 720 705 725 730 740 721 740 690~ I Copper mgL ND ND ND ND ND ND NO NO ND ND ND ND lt0010 lt0010 lt0010
Iron (total) mgL 029 020 ND ND i ND NO NO ND NO NO ND i 0012 lt00 lt010 lt01 0 1 Magnesium mgL 250 270 250 250 250 258 264 265 273 268 260 270 261 273 250
Manganese mgL ND ND ND ND ND ND ND ND NO NO ND ND lt0015 lt0015 lt0015 I Specific Conductance uSem 8350 NA 8650 8510 8360 8223 8238 8388 8518 8610 8050 8780 8425 8780 8050
Sulfate mgL 2340 NA 2300 2300 2290 2320 2310 2300 2275 2300 2300 2350 2308 2350 2275
Total Dissolved Solids mgL 5900 NA 6000 5900 6000 5900 5940 5975 5850 5900 6000 5900 5933 6000 5850
Turbidity NTU 39 NA 14 13 07 13 11 06 05 06 17 21 14 39 05 -NA - Data Not AvaIlable ND - Analyte Not Detectable
99th Avenue 2001 Glendale Arizona (General Chemistry Sampling Results) I
IAnalyte Units Jan Feb Mar April May June July Aug Sept Oct Nov Dec Mean Max Min
i Temperature OF 519 540 560 652 780 650 630 630 690 690 640 540 627 780 519
pH NA NA NA NA NA NA NA NA 77 80 83 82 80 83 77
Dissolved 02 mgL 124 114 08 00 78 70 54 31 53 53 61 48 74 124 31
Dissolved 02 1200 NA 020 1068 910 720 580 320 595 600 620 450 735 1200 320
Field conductivity uSem 7210 NA 9750 9200 9300 9200 9150 9200 8050 8000 8050 8100 8655 9750 7210
Alkalinity mgL 1280 1300 1310 1290 1260 1303 1318 1330 1298 1303 1255 1315 1297 1330 1255
i Calcium mgL 710 760 730 700 790 713 718 715 698 695 715 723 722 790 695
i Chloride mgL 699 676 690 710 670 750 740 733 716 723 725 733 714 750 670 i Copper mgL NO NO NO NO NO NO NO NO NO NO NO NO lt0010 lt0010 lt0010
Iron (total) mgL 013 020 013 NO 013 015 NO NO NO 0014 023 011 lt010 lt010 lt010
Magnesium mgL 250 260 250 250 270 263 270 273 275 275 275 270 265 275 250
Manganese mgL NO NO NO NO NO 0017 0021 0043 0120 014 NO NO lt0015 0140 lt0015
Specific Conductance uSem 8350 8700 8810 8630 8330 8365 8432 8513 8663 8735 8370 8830 8561 8830 8330
Sulfate mgL 2290 2280 2300 2300 2160 2360 2358 2325 2266 2300 2300 2300 2295 2360 2160
Total Dissolved Solids mgL 5800 5800 5800 6000 6400 6033 6060 5900 5875 6100 6000 6115 5990 6400 5800
Turbidity NTU 27 24 22 10 L7 14 08 15 17 16 18 20 17 27 08
McKellips Road 2001 Mesa Arizona I (General Chemistry Results)
Analyte Units Jan Feb Mar April May June July Aug Sept Oct Nov Dec Mean Max Min
ii Temperature OF 524 540 569 670 790 760 670 680 720 700 624 550 650 790 524
pH NA NA NA NA NA NA NA NA 75 81 81 84 80 84 75
Dissolved 02 mglL 93 104 108 IDA 104 IDA 79 78 75 73 67 52 87 108 52
Dissolved 02 1260 NA 1040 1140 NA 1130 830 720 900 810 650 480 896 1260 480
Field conductivity uSem 7260 N 9600 10000 9250 9170 9100 9200 8150 8100 8230 8100 8742 10000 7260
Alkalinity mgL 1280 1290 1290 1290 126 1295 1294 1300 1313 1280 1305 1273 1289 1313 I 1260I Calcium mgL 690 760 730 680 NA 708 712 703 693 690 710 696 706 760 I 680 Chloride mgL 712 732 680 720 72 755 732 728 718 733 760 726 726 760 i 680
Copper mgL NO NO NO NO NA NO NO NO NO 0014 NO ND lt0010 0014 I lt0010
Iron (total) mgL ND NO NO NO NA NO NO NO NO NO NO NO lt010 lt010 i i lt010
Magnesium mgL 240 270 250 250 NA 263 270 270 273 275 280 270 265 280 I 240
Manganese mglL NO NO NO NO NA 0030 0018 0037 0076 0050 0056 0041 00 01 00I I I
Specific Conductance uSem 8450 8700 8620 8540 817 8323 8532 8578 8585 8680 8625 8650 8538 8700 I 8170
Sulfate mgL 2310 2400 2200 2300 230 2370 2332 2300 2300 2325 2350 2333 2318 2400 2200
Total Dissolved Solids mgL 5600 5800 5800 6000 610 5900 6000 6133 6050 6050 6150 6033 5968 6150 5600
Turbidity NTU 24 13 13 12 045 11 09 14 17 11 17 10 13 24 05
NA - Data Not AvaIlable ND - Analyte Not Detectable
- -Brady PP 2001I
I (General Chemistry Sampling Results) Analyte Units Jan Feb Mar April May June July Aug Sept Oct Nov Dec Mean Max Min
Temperature OF 510 NA 611 722 847 781 715 699 733 727 69 I 569 691 847 510
pH NA NA NA NA NA NA NA NA NA 82 80 81 8 I 82 80 IDissolved 02 mglL 101 NA 120 NA NA 92 72 82 106 74 59 57 85 120 57
Dissolved 02 902 NA 1220 NA NA 956 829 918 986 858 662 546 875 1220 546 Field conductivity uSem 7080 NA 9600 9800 9830 9150 9150 9250 9350 8200 8300 8300 8910 9830 7080
Alkalinity mglL 1240 1210 1230 1280 1240 1280 1330 1420 1410 1300 1330 1240 1293 1420 1210 Calcium mglL 710 700 720 710 660 690 690 720 780 700 710 670 705 780 660 Chloride mglL 741 735 690 690 690 730 750 730 690 730 790 720 724 790 690i
Copper mglL NO NO NO NO NO NO NO NO NO NO NO NO lt0010 lt0010 lt0010
I ron (tota I) mglL NO NO NO 0014 NO NO NO NO NO NO NO NO lt010 0014 lt010 i
Magnesium mglL 260 260 260 250 250 260 260 270 310 270 280 280 268 310 250 Manganese mglL NO NO NO 0018 NO NO NO 0025 0Q38 0032 0025 NO lt0015 lt0015 lt0015
Specific Conductance uSem 8400 8550 8480 8710 8280 8270 8480 8510 8730 8950 8810 8600 8564 8950 8270
i Sulfate mglL 2400 2400 2200 2200 2230 2310 2350 2300 2200 2300 2400 2400 2308 2400 2200
Total Dissolved Solids mglL 5700 5700 5700 6000 5900 6000 6100 5900 5900 6400 5900 6100 5942 6400 5700 Turbidity NTU 14 13 12 42 06 08 11 13 10 15 17 12 14 42 06
San Xavier PP 2001 Tucson Arizona (General Chemistry Sampling Results)
Analyte Units Jan Feb Mar April May June July Aug Sept Oct Nov Dec Mean Max Min
Temperature OF 491 NA NA 738 826 770 821 862 825 706 678 539 726 862 491
pH NA NA NA NA NA NA NA NA NA 82 82 83 82 83 82
Dissolved 02 mglL 103 NA 104 NA NA 88 75 85 80 74 61 68 82 104 61 i
Dissolved 02 947 NA 1040 NA NA 867 924 1120 1020 840 690 630 898 1120 630 Field conductivity uSem 7000 NA 9400 10000 9600 9200 9200 8780 9360 8150 8200 8250 8831 10000 7000
Alkalinity mglL 1180 1120 1180 1140 1120 1070 1160 1110 1270 1280 190 1080 1158 1280 1070
Calcium mgIL 650 670 690 630 620 640 680 610 730 700 660 620 658 730 610 Chloride mglL 724 2020 700 740 737 790 750 690 690 740 760 770 843 2020 690
middot Copper mglL NO NO NO NO NO NO NO NO NO NO NO NO lt0010 lt0010 lt0010
middot i
Iron (total) mgIL NO NO NO NO NO NO NO NO NO NO NO NO lt010 lt010 lt010
Magnesium mglL 250 260 260 250 270 280 280 260 310 290 280 290 273 310 250 middot
Manganese mglL NO NO NO NO NO NO NO NO NO NO NO NO lt0015 lt0015 lt0015
i Specific Conductance uSem 8300 8400 8530 8620 8750 8520 8030 8210 8760 8850 8910 8700 8548 8910 8030 i Sulfate mglL 2350 4950 2300 2400 2390 2490 2370 2200 2200 2300 2400 2500 2571 4950 i 2200 I Total Dissolved Solids mgL 5600 5600 5800 6000 6000 5900 6100 5500 6000 6100 6100 6000 5892 6100 i 5500
Turbidity NTU 16 11 10 07 05 04 07 09 07 10 07 09 08 16 04 NA - Data Not Available NO = Analyte Not Detectable
Priority Pollutant Sampling Results February 2001
Analyte units Havasu PP 99w Ave San Xavier PP
Di(2-Ethylexl)phthlate ppb 07 Arsenic ppb 26 24 25
i Barium ppb 0096 01 0092 I Potassium ppm 41 41 4
Sodium ppm 80 78 78 Silica ppm 29 97 71
Strontium ppm 1 1 I I
i Lead ppb 056 I Chromium ppb 21 I Nitrate as N03 ppm 568
Nitrate as N ppm 129 Giardia L Non Detect Non Detect 01
Cryptosporidium L Non Detect Non Detect Non Detect
Priority Pollutant Sampling Results May 2001
IAnalyte units Havasu PP 99lR Ave San Xavier PP
Barium ppb 0098 0096 Potassium ppm 42 41 43 Sodium ppm 84 80 83 Silica ppm 10 99 88
Orthophosphate-P ppm 001
I Ce~ kizqna Project 2001 bi~ed6xgeii(po)
(averagernaltHY vatues)
I I 100 J--7~~~==~------------
I -- Cgt E 60 -1-- - --- - - ----- ----------___- - ------- __- ----------
0 o middot
40+---------------------~--~r_-~----~----~middotI ~
I 2Q + ___ ___100l--Yo_CoI----c0-ra-do_____ ---_ _ ------85l=cYoltLa=ke=-Pl=ea=Si=nt---------------_1-00l=Yo-=CoI==ora=-=dO River Water 1SCoIorado River River Water
90 -f~~~~~ ~ ---~---~ i
I ~= = - ~~= - = -~~==----i
JahFeb middotmiddot Met Apil bull~ Jile JlIy ~ Sept Qt middotmiddotribv Dec
-
1middot~~middotmiddot ____ McKali~ I middot I - -
I II
~f1lalkilor13 erOJed2()Qf middot Ca~ ~r Terqeratur~rF)
middot middot-T ~i
II (~ nlOllHy vaues) J ~
i
1000 _ ~__ l _ jjiL LL~~~~~~ ~ ii~ _ l ____
ooO+------------------- shy
bullbull _____bullbull ~l_ _bullbull _~ bull _ -- - ~
I ( ----------------1
OOmiddot) t-----------F~------------+---_j ~ -
I shy
i ~
IIgt mo+-middot -------~L-~~~C__-___7~~-----l
I ~ ~O +---------9lt-----------7---------------~___-_j E t shy
~o~------------------------~----------------~--------_jmiddot
I River Water 15Colorado River ) ~lt ~3)O f--=---=C-T=- ----=c-----= i _ 1 = j j
JaiRitF Mr APiI riii8y middot~~ ~ sElli middot ot ~~ ~ ~ -
I~~~~~~==~~====~
I I
I Cental Ar izpna Project 2001 CarialWater TOS (mglL) (average monthly values)
I 7000 r
I 6500 +---- - - ----- ---------- ---- - ----- ---shy
I S C ~ 5500 +--------------~-----------------
I en o I shy
100 Colorado 86 Lake Pleasant 100 Colorado 5000+ ------~R-ivcer-W7acte 1=6cC~o=locrac oR7ivcr-=------=---- d er-------Rc-iv=-e=-r7W7-ater------
I 4500 t------- ------------- - - - - -------shy
I 1 1 t shyo
J~h bull Fep Mar Apri( May Juni July Aug Sept Oct ~
L ~
I [~99th Ave ~Havas~ PP j shy
---- -
I i
Cental AriZ~naPnfec20of _ i _ I Ca~al~~ter T~~bidity (rit~f (aera9~monthlyvaliJes) gt
I 100 Colorado 85 Lake Pleasant 100 Colorado
River Water 15 Colorado River River Water
I lts- 30 + ------------r---T------------------+-----+----~------I middotmiddotSmiddotmiddotmiddot middot i
~ i s +__=--_---------_____---_ --c-_ ___ _ ------i-------i---- ---i
I -0
bullbull ~ 20 +-------~_------~~--~--~-------~----__~
I 10 +---- - ----- -------------7---- - --- - -------- ---- 1-shy
05 t-------------------------------~--------------------~---------~
I Eto +-~~-_-~r_-___-- _ - _-1 - -- __ --- ~---=r------r---r--~------_---i
jari Fab middotmiddot- April July bull
1~99th ~~ ~Hava~ ~ 1 I
I~--~~~~~------~~
I I I II Lake Pleasant Reservoir I Water Quality Data
I I I I I I I I I I I
- 18 shy
I I~~~~~--~--------~
LAKE PLEASANT RESERVOIR
The CAP aqueduct system utilizes Lake Pleasant as a seasonal pump-storage reservoir During a typical year Colorado River water is pumped into the lake from mid-October to mid-June when water demands and electricity costs are lower From mid-June to midshyOctober when water demands and electricity costs are higher water is released from the lake for customer deliveries
The Agua Fria River flows into Lake Pleasant and the inflows vary each year During dry years on the watershed the reservoir storage is mostly Colorado River water and during wet years with substantial runoff the reservoir has a blend of Colorado River and Agua Fria River water
The CAP conducted the following water quality sampling on Lake Pleasant in 2001
(1) Agua Fria River Sampling - February 20 July 11 and August 8 2001
In 2001 the Agua Fria River contributed approximately 25200 acre-feet of Lake Pleasant water This represented about 33 of the total lake volume at the end of the filling period in May 2001
I
The water quality samples may represent the water chemistry found in the Agua Fria River during a rainfall event However one sample does not provide enough data to fully assess and validate the typical water quality conditions of the Agua Fria River Refer to the attached table for the Agua Fria River water quality data
I Overall the water quality does not differ significantly from the Colorado River water which is diverted through the CAP canal and pumped into Lake Pleasant The water quality impact of the Agua Fria River was minimal for the year 2001 delivery season
I (2) Lake Pleasant Sampling - February 5 May 21 July 11 August 8 August 28 and October 2 2001
I I The water quality values were similar to the Colorado River The lake with mostly
Colorado River water was clear with turbidity levels averaging 20 NTU and TDS levels of 610 to 640 mgll
I Lake Pleasant depth profiles indicated that stratification occurred in the summer months The upper layer (epilimnion) was oxygen rich with a higher temperature as well as having a slightly higher pH conductivity and TDS The lower layer (hypolimnion) was lower in dissolved oxygen with lower temperatures and slightly
I I - 19 shy
I
lower pH and conductivity (which is a measure of TDS) Refer to the attached graphs of Lake Pleasant depth profiles for the above dates
The oxygen deficit conditions at the lower depths may cause sediment nutrient release through the process of reduction If the sedimentwater intetiace is exposed to prolonged periods of anoxia reducing conditions allow the formation of nutrients previously unavailable for taste and odor causing organisms This reduction may lead to sapropel formation a compound that is high in hydrogen sulfide and methane and has a shiny black color due to the presence of ferrous sulfide This compound is responsible for the occasional rotten-egg odor associated with water releases from the hypolimnion layer through the lower portal on the intake towers
Nutrients such as nitrogen and phosphorous become unbound from their ionic association with metals such as iron manganese and aluminum This process may free up nutrients which contribute to algae blooms in the canal system The precipitates iron and manganese cause discolored water and treatment problems
Typically the degree of stratification gradually forms during the summer and lasts until the latter part of fall Usually by November or December the lake has turned over This phenomenon is caused by the decrease in sutiace water temperatures which increase the sutiace water density and result in displacement or mixing of sutiace water with deeper water This mixing restores the lake to a more uniform water chemistry profile
Refer to the attached tables for the Lake Pleasant water quality values dated February 5 May 21 July 11 August 8 August 28 and October 22001
(3) Lake Pleasant Depth Profiles
The largest changes in lake water chemistry are related to seasonal changes and depth Depth profile samples were conducted on July 11 July 24 August 8 and September 18 2001 The water quality parameters included temperature pH specific conductivity and dissolved oxygen
All the water quality parameters evaluated on the above dates were at the following four locations
(1) Towers at New Waddell Dam (2) 250 yards north of New Waddell Dam (3) 1000 yards north of New Waddell Dam (4) 1 mile north of New Waddell Dam
- 20shy
l~ bull
CAP staff used a portable Hydrolab multi-probe water quality sensor to conduct depth profile sampling Refer to the following graphs which present the Lake Pleasant Depth profile results
The intake towers at the New Waddell Dam have sets of intake portals at two different levels which are 100 feet apart in elevation Adjustable operations and optimum use of the upper and lower portals offers the CAP opportunities to maximize the quality of water released from the lake for customer deliveries
I
In past years water releases were made through the upper gates as long as possible It was believed that this zone had the best water quality By the end of the summer the lake elevation was lower than the upper gates so all releases were switched over to the lower gates At that time the lower quality water from the bottom zone of the lake was introduced into the canal system resulting in treatment concems for the cities
I In 1998 a new operational scheme was used to manage the water quality from the releases at Lake Pleasant This new scheme consisted of using only the lower portals for releases during the entire summer The use of the lower gates during the initial releases
t in June allowed medium-oxygenated bottom water to be released early in the release period while prolonging the retention of the high-oxygenated epilimnion water This minimized the volume of anoxic water which would have been delivered from the lake during the latter part of the summer release period
I The 1998 procedure improved late summer water quality conditions The same release
I procedures have been used every summer since 1998 including 2001 Cities reported that they received significantly fewer taste and odor complaints from their customers
~ Lake Pleasant sampling results are presented in the following section Included are the 2001 tower operations project schematic for seasonal flows depth prollles at Lake Pleasant and the water quality sampling results
I i
I I I I - 21 shy
I ~~~~~__~~-==-=--=--=-=-==-=--===-
--------Lake Pleasant Operations 2001
October 2000 - May 2001 Operations in fill mode
May 1 - November 5 Operations in release mode Water released from lower gates all summer
May 1- November 5 Pass-through pumping (Colorado River water blended with Lake Pleasant water)
November 5 Lake Pleasant reaches lowest level of year (163877 ft above MSL) Terminated Lake Pleasant releases for season
November 52001 Operations return to fill mode
~~~----------~---------~ ~-------~--~~~
I I
I I I I - 22 shy
I~~~~--~~~~~~-~
-_ _ ------ -- -
ARIZONA
t N
LEGEND
bull PUMPING PLANT
CANAL100 COLORADO RIVER _ot- INVERTED SIPHONIOJA f1UA SIPHCraquoI
--+-+-- TUNNEL
--+---+-- PIPELINE
gILA IlMJI SIIIOf
WINTER MID OCTOBER - MAY
CENTRAL ARIZONA PROJECT GENERAL LOCATION MAP
~---~----------~---
J(
t 85 Lake Pleasant LECEND
15 ColoraJo River --t--- PIJIJPIHG PWIT
CAilAL
-- lIMRTED SIPflON
---t--~- IUlltlEl
----+- PIPELlUE
SUMMER JUNE - MID OCTOBER
CENTRAL ARIZONA PROJECT GENERAL LOCATION MAP
-- -- -shy
LAKE PLEASANT 7112001
DO (mgl)
o 05 1 15 2 25 3 35 4 45 5 55 6 65 7 75 8 85 9 95 10
1700 - ---1f---I---+------I--+ bull towers
--- 250yds
1000yds
~1mile
--Water Level
c 1620 o
~ gt ~ 1 600 ~-4~~~--~~~~~ -~I~-+~-r~~~r-~---+--~--+---~-+~~--4-~~~
GIyen
j 1580
1540
1520 Lower Gate
~ 1500
--
LAKE PLEASANT 7242001
o 05 15 2 25 3 35 445555665 7 75 8 8599510
1700 i --Towers
- 250yds 1680 +--~~-_r-~~r_~-_+-4_-+_~~_+-~-4_-~~-_+-~-+_--~~ -tr-1000yds
-- 1mile 1660 -+----1-- --+-----f-----+--I----+--r-_+__ --+- AFria
-Water Level
Upper Gate
1540
1520 Lower Gate -1500
LAKE PLEASANT 882001
0 05 15 2 25 3 35 4 45 5 55 6 65 7 75 8 85 9 95 10
1700 -- 882001
1680 2S0yds
-tl- SOOyds
1660 ~~t=~~~~~~~~~~~~~~~~~b~~~~=fPo-----+----~1 -+-1mile
-AguaFria
1640 -Water
Upper Gate c 0
f~ gt shyQI 1600W QI
l ~
1560
1540
Lower Gate 1520
1500
LAKE PLEASANT 9182001
1DO (mgJl) l
o 05 1 15 2 25 3 35 4 45 5 55 6 65 7 75 8 85 9 95 10
1700 -r---~~---T---r--1---T-~---T---r--~--T---r-~---T---r--~--T---r-~---i1~--~----~1 owers
~250YDS 1680 r-~---+---r--~--+-~r--+---+--~--+---r-~r--+---+--~--+---r-~---+---I
~1000YDS
1Mile 1660 r---r-~---+---r--~--+-~~-+---+--4---+---r-~---+---+--~--+---r-~--~1
+--______-+-__-__-+__~___________-_~ -Water---~-+---+---I Level
1640 +---~--1---+---r--~---~~---+--~--~--~--~~--~~~r=~--_t---r--~--~~--------__Q
Upper Gate
1560
1540
Lower Gate 1520
1500
_ bull ____ _ IIIIJ _ i __ _ _ ~ _
LAKE PLEASANT 7112001
Temperature (F)
90 85 80 75 70 65 60 55 50 1700 +--------shy
1680 ~------~~~----~------~------~--------~------~--------~------~
1660 +--------+----~~--r_------~------~--
1640 -t----l------~=r~~~==~~_-II--_T-------
1540
1520
--- Towers
-+-250yds
1000yds
-+- 1Mile
--Water Level
Upper Gate
Lower Gate -1500 l
LAKE PLEASANT 72401
Temperature (F)
90 85 80 75 70 65 60 55 50 1700 +--------+--------+--------r----~--~------~-------~~------~------~ r-----------~ -+-Towers
- 250yds 1680 T--------+--------+-------~--------~------_r------~~------~------~ 1000yds
~lMile
1660 +-------~~----_r--------r_------_r------~~------~------_4------~ ---AFria
-Water Level
Upper Gate
1560 +-ii~
1540
1520 Lower Gate
1500
- - ~ 111ft - ~ --- shy
LAKE PLEASANT 8801
Temperatura (F)
90 85 80 75 70 65 60 55 50 1700 +-------~--------~------_+--------~------~--------~------~--------~p------------~
-- towers
-+-250yds1680 +-------~--------~------_+--------~------~--------~------~---------
- 1000yds
1mile
~aguafria
1640 +-------~~~----~---middot---_+--------~------~-------middot-~------~~------~ - Water Level
1540
1520
1500
- _ - _ - middotmiddot ~ 1118 -
LAKE PLEASANT 9182001
Temperature (F)
90
1700 85 80 75 70 65 60 55 50
~Towers
1680
1660
250YDS
~1000YDS
___ 1Mile
1640 -Water
Level
1 1620
2 ~
1600 w QI
til J 1580
Upper Gate
1560
1540
1520 Lower Gate
1500
LAKE PLEASANT 9182001
4 5 6 7 8 9 10 11 12 13 14 1700 +-----~-------r_----_r----~------~----_+------+_----_+------~----~----------_
-+-Towers
1680 +-----_4------4-~--_4------4_----~------~~----~----~------~----~1 --- 250YDS
1000YDS
1660 +------t-------t------t------4-------i-------+-------if-------+-------t-------i1 ~ 1Mile
1------+------+-----------+-~~-+------+----~~-----+-----------~ -Water Level 164deg t---~j------II~---t--~-t_1~~----~~----r_----t_----i_----jL----------J
1620 i~ Upper Gate
1560 ~~~
1540
bullLower Gate 1520
1500
Lake Pleasant 2001 Water Quality Sampling Results
Analyte units FebS May 21 July J I Aug8 Aug28 Oct 2 Alkalinity ppm 131 126 122 119 121 127 Calcium ppm 72 72 70 67 68 68 I
Chloride ppm 627 74 78 80 80 75 I
I Copper ppm ND ND ND ND NO NO I
Iron (Total) ppm ND 11 ND NO ND NO i Magnesium ppm 27 28 28 29 30 30
I
I Manganese ppm ND 0025 ND ND NO 00]6 ~
I I
i Specific Conductance uScm 895 814 864 863 896 916 Sulfate ppm 211 231 246 250 250 240 I
Total Dissolved Solids Turbidity
ppm ntu
610 37 70
630 05
620 0
640 08
620 12 I
i Arsenic ppb 10 34 42 Barium ppb 013 01 0075 0083
i Chromium ppb 14 Lead (Total) ppb 061
Mercury ppm 022 Potassium ppm 45 45 49 46 Sodium ppm 81 83 87 92 Silica ppm 97 12 10 12
Strontium ppm 12 09 092 Orthophosphate-P ppm 001
MTBE ppm 52 Oiethylphthalate ppb 14 3
Agua Fria River 2001 Water Quality Sampling Results
Analyte units Feb 20 Julll Aug8 i
Alkalinity ppm 164 148 277 Calcium ppm 40 71 83 Chloride ppm 164 75 41 Copper ppm NO NO NO
Iron (Total) ppm 098 042 11 -Magnesium ppm 17 30 35 I Manganese ppm 0045 019 16 I
Specific Conductance uScm 412 865 792 I Sulfate ppm 339 231 110 I
Total Dissolved Solids ppm 260 630 530 I
Turbidity ntu 1 1 13 14 i Arsenic ppb 10 13 I Barium ppb 0036 0095 I
IChromium ppb 25 13 Ferrous Iron ppm 04 I
i Lead (Total) ppb 095 064 II Potassium ppm 17 52 Sodium ppm 28 87 - I Silica ppm 24 13
Strontium ppm 03 10 I
Orthophosphate-P ppm 0034 0015 Total phosphorous-P ppm 0065 002
Diethylphthalate ppb 11
GiardiaCryptosporidium CytsIOOL SliB CHD
GENERAL DISCUSSION
Turbidity gt- The suspended solids are very low with turbidity levels averaging 1-5 NTU with an occasional spike exceeding 100 NTU The water in the canal and Lake Pleasant is very clear and the lake bottom can be seen at depths of 25-30 feet In general when canal flows are lower or steady the turbidity is low When flow increases occur the higher velocities cause an increase in turbidity levels These increases in turbidity are generally very short in duration Algae blooms in the canal also have an impact on tUrbidity Blooms are generally very localized and do not contribute significantly to the overall turbidity levels of CAP water
TDS)gt Total dissolved solids represent the concentration of dissolved minerals in the water The TDS levels in CAP water are high when compared to most groundwater sources For the year the average TDS was 600 mgL and maintained consistent values throughout the canal system
pH ~ The average pH ranged from 82 in the Havasu area to 86 in the Tucson area The increase in pH can be attributed to the progressive increase in dissolved alkaline minerals The increase is a result of lower deliveries in the southern end of the aqueduct
Temperature ~ Average water temperatures for the year ranged from 63 to 69 degrees Fahrenheit with minimal differences between the Havasu Phoenix and Tucson areas of the canal system However monthly and seasonal temperatures varied considerably along the canal system Maximum temperatures reached 87 degrees Fahrenheit and minimum temperatures were about SO degrees Fahrenheit Note From June to mid-October when Lake Pleasant water is released for customer deliveries downstream of the Waddell Turnout the canal water temperatures range from 58 to 69 degrees Fahrenheit This water is 15 to 25 degrees cooler than normal canal water temperatures
DO The average dissolved oxygen levels were fairly uniform throughout the canal system Most of the sampling locations were approximately 8S mgL for 2001
Metals ~ The concentrations of dissolved heavy metals are very low to below laboratory detection limits throughout the CAP canal system
Pathogens ~ A significant amount of public drinking water in the urban areas of central and southern Arizona is treated CAP water One of the biggest concerns is the presence of pathogens in treated water including Giardia and Cryptosporidium In February and October all designated sampling sites on the CAP system produced non-detectable results for Giardia and Cryptosporidium
- 36shy
Secondary US EPA ArizonaMaximum
Maximum Health-basedContaminant Contaminant Guidancelevel
Range of Average level (MCl) (Aesthetics- level Analyte Units Detections Value (Health-based) based) (HBGl)
85 5
note 2 13 10 02 Iron note
266 note
231
600
note 2 note note 2 note note note
- 37shy
Note 1 Values presented are based upon laboratory method detection limits better defined as the lowest level that the laboratory can definitively identify that the analyte exists in the sample All method detection limits are below any existing EPA maximum contaminant level (MeL)
Note 2 Average value was not calculated due to test species not being detected consistently throughout the year See attached summary tables of priority pollutant results for locations and measured amounts
Note 3 The value reported for this constituent is for a one-time sampling event The detection of this contaminant did not reoccur in the same calendar year See attached summary tables ofpriority pollutant results for locations and measured amounts
WATER QUALITY IMPACT FROM BILL WILLIAMS RIVER
As previously mentioned the CAP aqueduct system begins at Lake Havasu The intake area for the Havasu Pumping Plant is located in a bay-like feature which is at the mouth of the Bill Williams River as it flows into Lake Havasu The Bill Williams River together with its headwaters at Alamo Lake forms the majority of the drainage area of west central Arizona During periods of heavy rainfall and runoff the flows in the Bill Williams River dominate this area of Lake Havasu and the water quality tends to be low in TDS but very turbid with high concentrations of organic matter and suspended sediments along with strong odors
The water quality deteriorates and causes treatment problems for the municipalities To avoid pumping this water into the CAP system and delivering it to customers the Havasu pumps are shut down until the water quality improves and clears up
In 1993 and 1995 the Havasu pumping had to be curtailed for a week or more due to the releases from Alamo Lake The reservoir watershed was dry in 2001 with minimal runoff therefore no water quality episodes occurred on the Bill Williams River
TASTE AND ODOR RESEARCH PROGRAM
Municipal water treatment plants which treat water supplies from the CAP and SRP systems have experienced seasonal taste and odor episodes The water has been described as having a musty-moldy-earthy taste or odor which is suspected of being associated with biological activity in reservoirs and canal systems Water treatment plants can treat this water with activated carbon to reduce or eliminate the offensive tastes and odors however treatments have significant cost
Compounds produced by Cyanobacteria (blue-green algae) are the suspected causes of the taste and odor problems Two compounds of concern are Geosmin and 2shymethylisoborneol (MIB) which can produce odors at levels as low as 1 part per trillion (ppt) The taste and odor constituents are an aesthetic problem and do not present a
- 38shy
health concern at these extremely low levels MIB detected in samples from several treatment plants appear to be due to planktonic Oscillatoria and both planktonic and periphytic Lyngbya Geosmin detected in samples appear to come from periphytic Anabeana and Lyngbya
An on going cooperative research and implementation program among ASU SRP CAP and the City of Phoenix has been monitoring the levels of MIB and Geosmin in the CAP and SRP canal systems The project is titled
Reducing Taste and Odor and Other Algae-Related Problems for Surface Water Supplies in Arid Environmentsmiddot
The project publishes and weekly newsletter which contains sampling results and recommendations for treatment of MIB and Geosmin A summary of the project and a copy of the newsletters distributed including the most current newsletter can be found at
httpceaspubeasasuedupwestltasteandodorhtm
GROUNDWATER RECHARGE PROJECTS - WATER QUALITY
The following direct recharge projects were in operation in 2001
1 Avra Valley Recharge Project 2 Pima Mine Road Recharge Project 3 Lower Santa Cruz Recharge Project 4 Agua Fria Recharge Project
A portion of the permitting process for these projects requires quarterly water quality monitoring The sampling results are compiled into an annual report The annual report is a matter of public record Copies of the reports or portions of the reports are available by contacting
Tom Harbour CAWCD Water Planning 623-869-2107 tharbourcap-azcom
- 39shy
Summary
This report has presented and discussed a variety of parameters in the CAP water quality monitoring program CAP employees are sensitive to customer needs and as changes occur along with increased interest in other constituents the water quality monitoring and sampling program will be revised accordingly and the data will be published in future annual water quality reports
For further information questions or comments please contact
Patrick Dent (623) 869-2581 Brian Henning (623) 869-2567 Tom Curry (623) 869-2353 Tim Kacerek (623) 869-2563
- 40shy

I~--------------------~
I I I Central Arizona Proj ect Canal I Water Quality Data
I I I I I I II I I I I I - 5 shy
I~--------------------~
I I I I I I I I I I I I
CAP CANAL WATER QUALITY
Water Quality Program
The water quality program consists of scheduled grab samples which are analyzed by a commercial laboratory and real-time water quality data from sensors installed at various locations along the canal system The water quality program consists of scheduled unscheduled and real-time water quality sampling
Grab Sample Program
In January 1999 the CAP contracted with Montgomery Watson Laboratory a State of Arizona licensed and certified laboratory to perform the water quality grab sample tests This program includes the following constituents and sampling sites
gt Water Quality Constituents
General Parameters Temperature (field measured) pH (field measured) Dissolved Oxygen (~O) (field measured) Conductivity (field amp lab measured) Alkalinity Calcium Chloride Copper Iron Magnesium Manganese Specific Conductance Sulfate Total Dissolved Solids (TDS) Turbidity
Taste and Odor MIS I Geosmin (as needed basis only)
Pathogens Giardia I Cryptosporidium
Priority Pollutants Heavy Metals (AsCdCrPbHgSeAg)
- 6shy
I~~~----------~~--~
Volatile Organic Compounds (VOCs) Volatile Organic Aromatics (VOAs) Organophosphorus Pesticides Carbamate Pesticides Chlorinated Herbicides
The general parameters priority pollutants and pathogens were sampled according to the attached grab sample schedule
gt Water Quality Sampling Sites
CAP Canal at Milepost
Havasu Pump Plant o Little Harquahala Pump Plant 58 99th Avenue 149 McKellips Road 194 Brady Pump Plant 254 San Xavier Pump Plant 319
The water quality data is presented in the following tables The data represents average values for each month per site including the yearly mean maximum and minimum In addition several graphs are attached which provide a graphical representation of site and time comparisons Also included is a map that identifies the grab sample locations
- 7 shy
-------------------
Central Arizona Project Canal Sampling Program Sampling Site Locations
vDEN-RHODES AQUEDUCT
FANNINMcFARLAND AQUEDUCT
L -
-rPump PIant---middotshy
UAEO PHIAL UII CO 11
LEGEND PIllA
COUIITY ( AP Aqutgtdllct
Pumplug PllUlts TUCSON
AQUEDUCT
bull WQ Localton
~ Pumping Plant Wlltltgt Watfr Samples an CoUKttgtd
2001 Grab Sample Schedule Lake
Week of Havasu Little Harq Plesant 99th Ave Mckellips Brady San Xavier
I Jan 3 GH GH GH GH GH GHi
Jan 22 GII Feb 6 GPPgc GPPgc GPP G G GPPgc
Feb 12 G 1 Feb 20 G G Mar 12 G GH GH GH GH GH
Mar 19 GH Apr 3 GH GH GH GH GH GH
Apr 30 H H H H H H
May 7 GH Mar 14 G May 23 GPPH GH GPP GPPH GH GH GPPH Jun 5 GH GH GH GH GH uH Jun 11 G GH GH GH Jun 18 G GH GH GH I
Jun 25 GH GH GH Jul3 GH GH GH GH
JulIO GPPH GH GPPH GPPH GH GH GPPH Jul 16 G GH H GH GH Jul23 GH GH GH =Jul30 G GH GH GH Aug 8 GgcH GH GH GgcH GH GH GgcH
Aug 13 G GH GH GH Aug21 GH GH GH Aug 27 G GH G GH GH Sep 5 GH GH GH GH GH GH
Sep 10 GH = GPPH GH i
Sep 18 GH GH H GH GH Sep26 G GH GH GH Oct 2 G PP gc H GH GPP G PP gc H GH GH G PP gc H
Oct 10 G GH GH GH Oct 17 G GH GH GH Oct 23 G GH GH GH Oct 30 G Nov 6 G GH GH GH GH GH
Nov 13 G Nov 19 G Nov 26 G GH GH GH Dec 5 GgcH G GgcH GH GH GgcH
Dec 10 G GH OH OH Dec 17 G GH GH OH Dec 26 G GH
- 9shy
G= General Chemistry alkalinity calcium chloride copper iron magnesium manganese sulfate specific conductance total dissolved solids (TDS) turbidity
H= HydroLab readings of temperature dissolved oxygen conductivity and pH will be taken each month at Lake Pleasant
gc= GiardialCryptosporidium
PP= Priority pollutants metals (silver arsenic cadmium chromium mercury lead selenium) volatile organic compounds (VOCs) semi-volatile organic compounds (semi-VOCs) aldicarbs herbicides
NOTE GiardialCryptosporidium and priority pollutant samples analysis will be undertaken with a two-week tum-around time based on the time the laboratory receives the samples
- 10shy
I Lake Havasu PP 2001 Parker Arizona
(General Chemistry Sampling Results)
Analyte Units Jan Feb Mar April May June July Aug Sept Oct Nov Dec Mean Max Min1
Temperature OF 530 560 580 645 750 790 840 820 770 770 630 550 686 840 530
pH 83 NA 86 84 83 NA 80 80 81 81 NA 84 82 86 80
Dissolved 02 mgL 117 NA NA NA NA NA NA NA NA NA NA NA 7 17 117 iDissolved 02 1090 NA NA NA NA NA NA NA NA NA NA 1060 1075 1090
060 I Field conductivity uSem 7250 NA 11850 9400 9320 NA 9500 9400 9440 9350 NA 9350 9429 11850 7250
Alkalinity mgL 1305 1303 1300 1400 1330 1313 1303 1260 1266 1304 1320 1310 1309 1400 1260 Calcium mgL 720 730 700 720 753 703 703 700 683 694 713 716 711 753 683 i
I Chloride mgL 686 692 690 730 699 750 735 740 696 712 740 720 716 750 686
I Copper mgL ND ND ND 001 011 ND ND 0022 ND ND 0012 NO lt0010 01 lt0010 I i
Iron (total) mgL 025 019 NO 036 023 ND 023 ND ND 013 013 014 lt010 lt010 lt010
Magnesium mgL 245 257 245 250 270 257 260 273 276 260 265 263 260 276 245 ij Manganese mgL ND ND ND 0016 NO ND ND ND ND ND ND NO lt0015 0016 lt0015
Specific Conductance uSem 8300 8200 8590 8910 8195 8306 8425 8378 8610 8746 9083 8420 8514 9083 8195
Sulfate mgL 2250 2283 2550 2300 2265 2353 2325 2300 2200 2280 2350 2275 2311 2550 2200
Total Dissolved Solids mgL 5800 5900 6000 5900 6100 5866 5975 5925 5900 6020 6200 6075 5972 I 6200 5800
Turbidity NTU 46 36 26 29 32 14 19 16 36 31 33 24 29 46 14
Little Harquabala PP 2001 --
(General Chemistry Sampling Results)
Analyte Units Jan Feb Mar April May June July Aug Sept Oct Nov Dec Mean Max Min
Temperature OF 519 NA 620 670 780 770 820 830 780 720 630 550 699 830 519
pH NA NA NA NA NA NA NA NA 81 82 82 83 82 83 81
Dissolved 02 mgL 110 NA NA NA NA 86 87 82 77 75 60 48 78 110 48
Dissolved 02 1000 NA NA NA NA 1050 1000 1000 940 940 620 450 875 1050 450 i
iField conductivity uSem 7220 NA 11340 8900 9370 9240 9100 980 9100 8000 8080 8090 8875 11340 7220 I Alkalinity mgL 1270 NA 1280 1370 1320 1298 1258 1253 1233 1270 1320 1306 1289 1370 1233
i Calcium mgL 720 770 690 710 670 700 695 674 1 675 686 680 733 700 770
Chloride mgL 717 NA 690 730 710 733 726 720 705 725 730 740 721 740 690~ I Copper mgL ND ND ND ND ND ND NO NO ND ND ND ND lt0010 lt0010 lt0010
Iron (total) mgL 029 020 ND ND i ND NO NO ND NO NO ND i 0012 lt00 lt010 lt01 0 1 Magnesium mgL 250 270 250 250 250 258 264 265 273 268 260 270 261 273 250
Manganese mgL ND ND ND ND ND ND ND ND NO NO ND ND lt0015 lt0015 lt0015 I Specific Conductance uSem 8350 NA 8650 8510 8360 8223 8238 8388 8518 8610 8050 8780 8425 8780 8050
Sulfate mgL 2340 NA 2300 2300 2290 2320 2310 2300 2275 2300 2300 2350 2308 2350 2275
Total Dissolved Solids mgL 5900 NA 6000 5900 6000 5900 5940 5975 5850 5900 6000 5900 5933 6000 5850
Turbidity NTU 39 NA 14 13 07 13 11 06 05 06 17 21 14 39 05 -NA - Data Not AvaIlable ND - Analyte Not Detectable
99th Avenue 2001 Glendale Arizona (General Chemistry Sampling Results) I
IAnalyte Units Jan Feb Mar April May June July Aug Sept Oct Nov Dec Mean Max Min
i Temperature OF 519 540 560 652 780 650 630 630 690 690 640 540 627 780 519
pH NA NA NA NA NA NA NA NA 77 80 83 82 80 83 77
Dissolved 02 mgL 124 114 08 00 78 70 54 31 53 53 61 48 74 124 31
Dissolved 02 1200 NA 020 1068 910 720 580 320 595 600 620 450 735 1200 320
Field conductivity uSem 7210 NA 9750 9200 9300 9200 9150 9200 8050 8000 8050 8100 8655 9750 7210
Alkalinity mgL 1280 1300 1310 1290 1260 1303 1318 1330 1298 1303 1255 1315 1297 1330 1255
i Calcium mgL 710 760 730 700 790 713 718 715 698 695 715 723 722 790 695
i Chloride mgL 699 676 690 710 670 750 740 733 716 723 725 733 714 750 670 i Copper mgL NO NO NO NO NO NO NO NO NO NO NO NO lt0010 lt0010 lt0010
Iron (total) mgL 013 020 013 NO 013 015 NO NO NO 0014 023 011 lt010 lt010 lt010
Magnesium mgL 250 260 250 250 270 263 270 273 275 275 275 270 265 275 250
Manganese mgL NO NO NO NO NO 0017 0021 0043 0120 014 NO NO lt0015 0140 lt0015
Specific Conductance uSem 8350 8700 8810 8630 8330 8365 8432 8513 8663 8735 8370 8830 8561 8830 8330
Sulfate mgL 2290 2280 2300 2300 2160 2360 2358 2325 2266 2300 2300 2300 2295 2360 2160
Total Dissolved Solids mgL 5800 5800 5800 6000 6400 6033 6060 5900 5875 6100 6000 6115 5990 6400 5800
Turbidity NTU 27 24 22 10 L7 14 08 15 17 16 18 20 17 27 08
McKellips Road 2001 Mesa Arizona I (General Chemistry Results)
Analyte Units Jan Feb Mar April May June July Aug Sept Oct Nov Dec Mean Max Min
ii Temperature OF 524 540 569 670 790 760 670 680 720 700 624 550 650 790 524
pH NA NA NA NA NA NA NA NA 75 81 81 84 80 84 75
Dissolved 02 mglL 93 104 108 IDA 104 IDA 79 78 75 73 67 52 87 108 52
Dissolved 02 1260 NA 1040 1140 NA 1130 830 720 900 810 650 480 896 1260 480
Field conductivity uSem 7260 N 9600 10000 9250 9170 9100 9200 8150 8100 8230 8100 8742 10000 7260
Alkalinity mgL 1280 1290 1290 1290 126 1295 1294 1300 1313 1280 1305 1273 1289 1313 I 1260I Calcium mgL 690 760 730 680 NA 708 712 703 693 690 710 696 706 760 I 680 Chloride mgL 712 732 680 720 72 755 732 728 718 733 760 726 726 760 i 680
Copper mgL NO NO NO NO NA NO NO NO NO 0014 NO ND lt0010 0014 I lt0010
Iron (total) mgL ND NO NO NO NA NO NO NO NO NO NO NO lt010 lt010 i i lt010
Magnesium mgL 240 270 250 250 NA 263 270 270 273 275 280 270 265 280 I 240
Manganese mglL NO NO NO NO NA 0030 0018 0037 0076 0050 0056 0041 00 01 00I I I
Specific Conductance uSem 8450 8700 8620 8540 817 8323 8532 8578 8585 8680 8625 8650 8538 8700 I 8170
Sulfate mgL 2310 2400 2200 2300 230 2370 2332 2300 2300 2325 2350 2333 2318 2400 2200
Total Dissolved Solids mgL 5600 5800 5800 6000 610 5900 6000 6133 6050 6050 6150 6033 5968 6150 5600
Turbidity NTU 24 13 13 12 045 11 09 14 17 11 17 10 13 24 05
NA - Data Not AvaIlable ND - Analyte Not Detectable
- -Brady PP 2001I
I (General Chemistry Sampling Results) Analyte Units Jan Feb Mar April May June July Aug Sept Oct Nov Dec Mean Max Min
Temperature OF 510 NA 611 722 847 781 715 699 733 727 69 I 569 691 847 510
pH NA NA NA NA NA NA NA NA NA 82 80 81 8 I 82 80 IDissolved 02 mglL 101 NA 120 NA NA 92 72 82 106 74 59 57 85 120 57
Dissolved 02 902 NA 1220 NA NA 956 829 918 986 858 662 546 875 1220 546 Field conductivity uSem 7080 NA 9600 9800 9830 9150 9150 9250 9350 8200 8300 8300 8910 9830 7080
Alkalinity mglL 1240 1210 1230 1280 1240 1280 1330 1420 1410 1300 1330 1240 1293 1420 1210 Calcium mglL 710 700 720 710 660 690 690 720 780 700 710 670 705 780 660 Chloride mglL 741 735 690 690 690 730 750 730 690 730 790 720 724 790 690i
Copper mglL NO NO NO NO NO NO NO NO NO NO NO NO lt0010 lt0010 lt0010
I ron (tota I) mglL NO NO NO 0014 NO NO NO NO NO NO NO NO lt010 0014 lt010 i
Magnesium mglL 260 260 260 250 250 260 260 270 310 270 280 280 268 310 250 Manganese mglL NO NO NO 0018 NO NO NO 0025 0Q38 0032 0025 NO lt0015 lt0015 lt0015
Specific Conductance uSem 8400 8550 8480 8710 8280 8270 8480 8510 8730 8950 8810 8600 8564 8950 8270
i Sulfate mglL 2400 2400 2200 2200 2230 2310 2350 2300 2200 2300 2400 2400 2308 2400 2200
Total Dissolved Solids mglL 5700 5700 5700 6000 5900 6000 6100 5900 5900 6400 5900 6100 5942 6400 5700 Turbidity NTU 14 13 12 42 06 08 11 13 10 15 17 12 14 42 06
San Xavier PP 2001 Tucson Arizona (General Chemistry Sampling Results)
Analyte Units Jan Feb Mar April May June July Aug Sept Oct Nov Dec Mean Max Min
Temperature OF 491 NA NA 738 826 770 821 862 825 706 678 539 726 862 491
pH NA NA NA NA NA NA NA NA NA 82 82 83 82 83 82
Dissolved 02 mglL 103 NA 104 NA NA 88 75 85 80 74 61 68 82 104 61 i
Dissolved 02 947 NA 1040 NA NA 867 924 1120 1020 840 690 630 898 1120 630 Field conductivity uSem 7000 NA 9400 10000 9600 9200 9200 8780 9360 8150 8200 8250 8831 10000 7000
Alkalinity mglL 1180 1120 1180 1140 1120 1070 1160 1110 1270 1280 190 1080 1158 1280 1070
Calcium mgIL 650 670 690 630 620 640 680 610 730 700 660 620 658 730 610 Chloride mglL 724 2020 700 740 737 790 750 690 690 740 760 770 843 2020 690
middot Copper mglL NO NO NO NO NO NO NO NO NO NO NO NO lt0010 lt0010 lt0010
middot i
Iron (total) mgIL NO NO NO NO NO NO NO NO NO NO NO NO lt010 lt010 lt010
Magnesium mglL 250 260 260 250 270 280 280 260 310 290 280 290 273 310 250 middot
Manganese mglL NO NO NO NO NO NO NO NO NO NO NO NO lt0015 lt0015 lt0015
i Specific Conductance uSem 8300 8400 8530 8620 8750 8520 8030 8210 8760 8850 8910 8700 8548 8910 8030 i Sulfate mglL 2350 4950 2300 2400 2390 2490 2370 2200 2200 2300 2400 2500 2571 4950 i 2200 I Total Dissolved Solids mgL 5600 5600 5800 6000 6000 5900 6100 5500 6000 6100 6100 6000 5892 6100 i 5500
Turbidity NTU 16 11 10 07 05 04 07 09 07 10 07 09 08 16 04 NA - Data Not Available NO = Analyte Not Detectable
Priority Pollutant Sampling Results February 2001
Analyte units Havasu PP 99w Ave San Xavier PP
Di(2-Ethylexl)phthlate ppb 07 Arsenic ppb 26 24 25
i Barium ppb 0096 01 0092 I Potassium ppm 41 41 4
Sodium ppm 80 78 78 Silica ppm 29 97 71
Strontium ppm 1 1 I I
i Lead ppb 056 I Chromium ppb 21 I Nitrate as N03 ppm 568
Nitrate as N ppm 129 Giardia L Non Detect Non Detect 01
Cryptosporidium L Non Detect Non Detect Non Detect
Priority Pollutant Sampling Results May 2001
IAnalyte units Havasu PP 99lR Ave San Xavier PP
Barium ppb 0098 0096 Potassium ppm 42 41 43 Sodium ppm 84 80 83 Silica ppm 10 99 88
Orthophosphate-P ppm 001
I Ce~ kizqna Project 2001 bi~ed6xgeii(po)
(averagernaltHY vatues)
I I 100 J--7~~~==~------------
I -- Cgt E 60 -1-- - --- - - ----- ----------___- - ------- __- ----------
0 o middot
40+---------------------~--~r_-~----~----~middotI ~
I 2Q + ___ ___100l--Yo_CoI----c0-ra-do_____ ---_ _ ------85l=cYoltLa=ke=-Pl=ea=Si=nt---------------_1-00l=Yo-=CoI==ora=-=dO River Water 1SCoIorado River River Water
90 -f~~~~~ ~ ---~---~ i
I ~= = - ~~= - = -~~==----i
JahFeb middotmiddot Met Apil bull~ Jile JlIy ~ Sept Qt middotmiddotribv Dec
-
1middot~~middotmiddot ____ McKali~ I middot I - -
I II
~f1lalkilor13 erOJed2()Qf middot Ca~ ~r Terqeratur~rF)
middot middot-T ~i
II (~ nlOllHy vaues) J ~
i
1000 _ ~__ l _ jjiL LL~~~~~~ ~ ii~ _ l ____
ooO+------------------- shy
bullbull _____bullbull ~l_ _bullbull _~ bull _ -- - ~
I ( ----------------1
OOmiddot) t-----------F~------------+---_j ~ -
I shy
i ~
IIgt mo+-middot -------~L-~~~C__-___7~~-----l
I ~ ~O +---------9lt-----------7---------------~___-_j E t shy
~o~------------------------~----------------~--------_jmiddot
I River Water 15Colorado River ) ~lt ~3)O f--=---=C-T=- ----=c-----= i _ 1 = j j
JaiRitF Mr APiI riii8y middot~~ ~ sElli middot ot ~~ ~ ~ -
I~~~~~~==~~====~
I I
I Cental Ar izpna Project 2001 CarialWater TOS (mglL) (average monthly values)
I 7000 r
I 6500 +---- - - ----- ---------- ---- - ----- ---shy
I S C ~ 5500 +--------------~-----------------
I en o I shy
100 Colorado 86 Lake Pleasant 100 Colorado 5000+ ------~R-ivcer-W7acte 1=6cC~o=locrac oR7ivcr-=------=---- d er-------Rc-iv=-e=-r7W7-ater------
I 4500 t------- ------------- - - - - -------shy
I 1 1 t shyo
J~h bull Fep Mar Apri( May Juni July Aug Sept Oct ~
L ~
I [~99th Ave ~Havas~ PP j shy
---- -
I i
Cental AriZ~naPnfec20of _ i _ I Ca~al~~ter T~~bidity (rit~f (aera9~monthlyvaliJes) gt
I 100 Colorado 85 Lake Pleasant 100 Colorado
River Water 15 Colorado River River Water
I lts- 30 + ------------r---T------------------+-----+----~------I middotmiddotSmiddotmiddotmiddot middot i
~ i s +__=--_---------_____---_ --c-_ ___ _ ------i-------i---- ---i
I -0
bullbull ~ 20 +-------~_------~~--~--~-------~----__~
I 10 +---- - ----- -------------7---- - --- - -------- ---- 1-shy
05 t-------------------------------~--------------------~---------~
I Eto +-~~-_-~r_-___-- _ - _-1 - -- __ --- ~---=r------r---r--~------_---i
jari Fab middotmiddot- April July bull
1~99th ~~ ~Hava~ ~ 1 I
I~--~~~~~------~~
I I I II Lake Pleasant Reservoir I Water Quality Data
I I I I I I I I I I I
- 18 shy
I I~~~~~--~--------~
LAKE PLEASANT RESERVOIR
The CAP aqueduct system utilizes Lake Pleasant as a seasonal pump-storage reservoir During a typical year Colorado River water is pumped into the lake from mid-October to mid-June when water demands and electricity costs are lower From mid-June to midshyOctober when water demands and electricity costs are higher water is released from the lake for customer deliveries
The Agua Fria River flows into Lake Pleasant and the inflows vary each year During dry years on the watershed the reservoir storage is mostly Colorado River water and during wet years with substantial runoff the reservoir has a blend of Colorado River and Agua Fria River water
The CAP conducted the following water quality sampling on Lake Pleasant in 2001
(1) Agua Fria River Sampling - February 20 July 11 and August 8 2001
In 2001 the Agua Fria River contributed approximately 25200 acre-feet of Lake Pleasant water This represented about 33 of the total lake volume at the end of the filling period in May 2001
I
The water quality samples may represent the water chemistry found in the Agua Fria River during a rainfall event However one sample does not provide enough data to fully assess and validate the typical water quality conditions of the Agua Fria River Refer to the attached table for the Agua Fria River water quality data
I Overall the water quality does not differ significantly from the Colorado River water which is diverted through the CAP canal and pumped into Lake Pleasant The water quality impact of the Agua Fria River was minimal for the year 2001 delivery season
I (2) Lake Pleasant Sampling - February 5 May 21 July 11 August 8 August 28 and October 2 2001
I I The water quality values were similar to the Colorado River The lake with mostly
Colorado River water was clear with turbidity levels averaging 20 NTU and TDS levels of 610 to 640 mgll
I Lake Pleasant depth profiles indicated that stratification occurred in the summer months The upper layer (epilimnion) was oxygen rich with a higher temperature as well as having a slightly higher pH conductivity and TDS The lower layer (hypolimnion) was lower in dissolved oxygen with lower temperatures and slightly
I I - 19 shy
I
lower pH and conductivity (which is a measure of TDS) Refer to the attached graphs of Lake Pleasant depth profiles for the above dates
The oxygen deficit conditions at the lower depths may cause sediment nutrient release through the process of reduction If the sedimentwater intetiace is exposed to prolonged periods of anoxia reducing conditions allow the formation of nutrients previously unavailable for taste and odor causing organisms This reduction may lead to sapropel formation a compound that is high in hydrogen sulfide and methane and has a shiny black color due to the presence of ferrous sulfide This compound is responsible for the occasional rotten-egg odor associated with water releases from the hypolimnion layer through the lower portal on the intake towers
Nutrients such as nitrogen and phosphorous become unbound from their ionic association with metals such as iron manganese and aluminum This process may free up nutrients which contribute to algae blooms in the canal system The precipitates iron and manganese cause discolored water and treatment problems
Typically the degree of stratification gradually forms during the summer and lasts until the latter part of fall Usually by November or December the lake has turned over This phenomenon is caused by the decrease in sutiace water temperatures which increase the sutiace water density and result in displacement or mixing of sutiace water with deeper water This mixing restores the lake to a more uniform water chemistry profile
Refer to the attached tables for the Lake Pleasant water quality values dated February 5 May 21 July 11 August 8 August 28 and October 22001
(3) Lake Pleasant Depth Profiles
The largest changes in lake water chemistry are related to seasonal changes and depth Depth profile samples were conducted on July 11 July 24 August 8 and September 18 2001 The water quality parameters included temperature pH specific conductivity and dissolved oxygen
All the water quality parameters evaluated on the above dates were at the following four locations
(1) Towers at New Waddell Dam (2) 250 yards north of New Waddell Dam (3) 1000 yards north of New Waddell Dam (4) 1 mile north of New Waddell Dam
- 20shy
l~ bull
CAP staff used a portable Hydrolab multi-probe water quality sensor to conduct depth profile sampling Refer to the following graphs which present the Lake Pleasant Depth profile results
The intake towers at the New Waddell Dam have sets of intake portals at two different levels which are 100 feet apart in elevation Adjustable operations and optimum use of the upper and lower portals offers the CAP opportunities to maximize the quality of water released from the lake for customer deliveries
I
In past years water releases were made through the upper gates as long as possible It was believed that this zone had the best water quality By the end of the summer the lake elevation was lower than the upper gates so all releases were switched over to the lower gates At that time the lower quality water from the bottom zone of the lake was introduced into the canal system resulting in treatment concems for the cities
I In 1998 a new operational scheme was used to manage the water quality from the releases at Lake Pleasant This new scheme consisted of using only the lower portals for releases during the entire summer The use of the lower gates during the initial releases
t in June allowed medium-oxygenated bottom water to be released early in the release period while prolonging the retention of the high-oxygenated epilimnion water This minimized the volume of anoxic water which would have been delivered from the lake during the latter part of the summer release period
I The 1998 procedure improved late summer water quality conditions The same release
I procedures have been used every summer since 1998 including 2001 Cities reported that they received significantly fewer taste and odor complaints from their customers
~ Lake Pleasant sampling results are presented in the following section Included are the 2001 tower operations project schematic for seasonal flows depth prollles at Lake Pleasant and the water quality sampling results
I i
I I I I - 21 shy
I ~~~~~__~~-==-=--=--=-=-==-=--===-
--------Lake Pleasant Operations 2001
October 2000 - May 2001 Operations in fill mode
May 1 - November 5 Operations in release mode Water released from lower gates all summer
May 1- November 5 Pass-through pumping (Colorado River water blended with Lake Pleasant water)
November 5 Lake Pleasant reaches lowest level of year (163877 ft above MSL) Terminated Lake Pleasant releases for season
November 52001 Operations return to fill mode
~~~----------~---------~ ~-------~--~~~
I I
I I I I - 22 shy
I~~~~--~~~~~~-~
-_ _ ------ -- -
ARIZONA
t N
LEGEND
bull PUMPING PLANT
CANAL100 COLORADO RIVER _ot- INVERTED SIPHONIOJA f1UA SIPHCraquoI
--+-+-- TUNNEL
--+---+-- PIPELINE
gILA IlMJI SIIIOf
WINTER MID OCTOBER - MAY
CENTRAL ARIZONA PROJECT GENERAL LOCATION MAP
~---~----------~---
J(
t 85 Lake Pleasant LECEND
15 ColoraJo River --t--- PIJIJPIHG PWIT
CAilAL
-- lIMRTED SIPflON
---t--~- IUlltlEl
----+- PIPELlUE
SUMMER JUNE - MID OCTOBER
CENTRAL ARIZONA PROJECT GENERAL LOCATION MAP
-- -- -shy
LAKE PLEASANT 7112001
DO (mgl)
o 05 1 15 2 25 3 35 4 45 5 55 6 65 7 75 8 85 9 95 10
1700 - ---1f---I---+------I--+ bull towers
--- 250yds
1000yds
~1mile
--Water Level
c 1620 o
~ gt ~ 1 600 ~-4~~~--~~~~~ -~I~-+~-r~~~r-~---+--~--+---~-+~~--4-~~~
GIyen
j 1580
1540
1520 Lower Gate
~ 1500
--
LAKE PLEASANT 7242001
o 05 15 2 25 3 35 445555665 7 75 8 8599510
1700 i --Towers
- 250yds 1680 +--~~-_r-~~r_~-_+-4_-+_~~_+-~-4_-~~-_+-~-+_--~~ -tr-1000yds
-- 1mile 1660 -+----1-- --+-----f-----+--I----+--r-_+__ --+- AFria
-Water Level
Upper Gate
1540
1520 Lower Gate -1500
LAKE PLEASANT 882001
0 05 15 2 25 3 35 4 45 5 55 6 65 7 75 8 85 9 95 10
1700 -- 882001
1680 2S0yds
-tl- SOOyds
1660 ~~t=~~~~~~~~~~~~~~~~~b~~~~=fPo-----+----~1 -+-1mile
-AguaFria
1640 -Water
Upper Gate c 0
f~ gt shyQI 1600W QI
l ~
1560
1540
Lower Gate 1520
1500
LAKE PLEASANT 9182001
1DO (mgJl) l
o 05 1 15 2 25 3 35 4 45 5 55 6 65 7 75 8 85 9 95 10
1700 -r---~~---T---r--1---T-~---T---r--~--T---r-~---T---r--~--T---r-~---i1~--~----~1 owers
~250YDS 1680 r-~---+---r--~--+-~r--+---+--~--+---r-~r--+---+--~--+---r-~---+---I
~1000YDS
1Mile 1660 r---r-~---+---r--~--+-~~-+---+--4---+---r-~---+---+--~--+---r-~--~1
+--______-+-__-__-+__~___________-_~ -Water---~-+---+---I Level
1640 +---~--1---+---r--~---~~---+--~--~--~--~~--~~~r=~--_t---r--~--~~--------__Q
Upper Gate
1560
1540
Lower Gate 1520
1500
_ bull ____ _ IIIIJ _ i __ _ _ ~ _
LAKE PLEASANT 7112001
Temperature (F)
90 85 80 75 70 65 60 55 50 1700 +--------shy
1680 ~------~~~----~------~------~--------~------~--------~------~
1660 +--------+----~~--r_------~------~--
1640 -t----l------~=r~~~==~~_-II--_T-------
1540
1520
--- Towers
-+-250yds
1000yds
-+- 1Mile
--Water Level
Upper Gate
Lower Gate -1500 l
LAKE PLEASANT 72401
Temperature (F)
90 85 80 75 70 65 60 55 50 1700 +--------+--------+--------r----~--~------~-------~~------~------~ r-----------~ -+-Towers
- 250yds 1680 T--------+--------+-------~--------~------_r------~~------~------~ 1000yds
~lMile
1660 +-------~~----_r--------r_------_r------~~------~------_4------~ ---AFria
-Water Level
Upper Gate
1560 +-ii~
1540
1520 Lower Gate
1500
- - ~ 111ft - ~ --- shy
LAKE PLEASANT 8801
Temperatura (F)
90 85 80 75 70 65 60 55 50 1700 +-------~--------~------_+--------~------~--------~------~--------~p------------~
-- towers
-+-250yds1680 +-------~--------~------_+--------~------~--------~------~---------
- 1000yds
1mile
~aguafria
1640 +-------~~~----~---middot---_+--------~------~-------middot-~------~~------~ - Water Level
1540
1520
1500
- _ - _ - middotmiddot ~ 1118 -
LAKE PLEASANT 9182001
Temperature (F)
90
1700 85 80 75 70 65 60 55 50
~Towers
1680
1660
250YDS
~1000YDS
___ 1Mile
1640 -Water
Level
1 1620
2 ~
1600 w QI
til J 1580
Upper Gate
1560
1540
1520 Lower Gate
1500
LAKE PLEASANT 9182001
4 5 6 7 8 9 10 11 12 13 14 1700 +-----~-------r_----_r----~------~----_+------+_----_+------~----~----------_
-+-Towers
1680 +-----_4------4-~--_4------4_----~------~~----~----~------~----~1 --- 250YDS
1000YDS
1660 +------t-------t------t------4-------i-------+-------if-------+-------t-------i1 ~ 1Mile
1------+------+-----------+-~~-+------+----~~-----+-----------~ -Water Level 164deg t---~j------II~---t--~-t_1~~----~~----r_----t_----i_----jL----------J
1620 i~ Upper Gate
1560 ~~~
1540
bullLower Gate 1520
1500
Lake Pleasant 2001 Water Quality Sampling Results
Analyte units FebS May 21 July J I Aug8 Aug28 Oct 2 Alkalinity ppm 131 126 122 119 121 127 Calcium ppm 72 72 70 67 68 68 I
Chloride ppm 627 74 78 80 80 75 I
I Copper ppm ND ND ND ND NO NO I
Iron (Total) ppm ND 11 ND NO ND NO i Magnesium ppm 27 28 28 29 30 30
I
I Manganese ppm ND 0025 ND ND NO 00]6 ~
I I
i Specific Conductance uScm 895 814 864 863 896 916 Sulfate ppm 211 231 246 250 250 240 I
Total Dissolved Solids Turbidity
ppm ntu
610 37 70
630 05
620 0
640 08
620 12 I
i Arsenic ppb 10 34 42 Barium ppb 013 01 0075 0083
i Chromium ppb 14 Lead (Total) ppb 061
Mercury ppm 022 Potassium ppm 45 45 49 46 Sodium ppm 81 83 87 92 Silica ppm 97 12 10 12
Strontium ppm 12 09 092 Orthophosphate-P ppm 001
MTBE ppm 52 Oiethylphthalate ppb 14 3
Agua Fria River 2001 Water Quality Sampling Results
Analyte units Feb 20 Julll Aug8 i
Alkalinity ppm 164 148 277 Calcium ppm 40 71 83 Chloride ppm 164 75 41 Copper ppm NO NO NO
Iron (Total) ppm 098 042 11 -Magnesium ppm 17 30 35 I Manganese ppm 0045 019 16 I
Specific Conductance uScm 412 865 792 I Sulfate ppm 339 231 110 I
Total Dissolved Solids ppm 260 630 530 I
Turbidity ntu 1 1 13 14 i Arsenic ppb 10 13 I Barium ppb 0036 0095 I
IChromium ppb 25 13 Ferrous Iron ppm 04 I
i Lead (Total) ppb 095 064 II Potassium ppm 17 52 Sodium ppm 28 87 - I Silica ppm 24 13
Strontium ppm 03 10 I
Orthophosphate-P ppm 0034 0015 Total phosphorous-P ppm 0065 002
Diethylphthalate ppb 11
GiardiaCryptosporidium CytsIOOL SliB CHD
GENERAL DISCUSSION
Turbidity gt- The suspended solids are very low with turbidity levels averaging 1-5 NTU with an occasional spike exceeding 100 NTU The water in the canal and Lake Pleasant is very clear and the lake bottom can be seen at depths of 25-30 feet In general when canal flows are lower or steady the turbidity is low When flow increases occur the higher velocities cause an increase in turbidity levels These increases in turbidity are generally very short in duration Algae blooms in the canal also have an impact on tUrbidity Blooms are generally very localized and do not contribute significantly to the overall turbidity levels of CAP water
TDS)gt Total dissolved solids represent the concentration of dissolved minerals in the water The TDS levels in CAP water are high when compared to most groundwater sources For the year the average TDS was 600 mgL and maintained consistent values throughout the canal system
pH ~ The average pH ranged from 82 in the Havasu area to 86 in the Tucson area The increase in pH can be attributed to the progressive increase in dissolved alkaline minerals The increase is a result of lower deliveries in the southern end of the aqueduct
Temperature ~ Average water temperatures for the year ranged from 63 to 69 degrees Fahrenheit with minimal differences between the Havasu Phoenix and Tucson areas of the canal system However monthly and seasonal temperatures varied considerably along the canal system Maximum temperatures reached 87 degrees Fahrenheit and minimum temperatures were about SO degrees Fahrenheit Note From June to mid-October when Lake Pleasant water is released for customer deliveries downstream of the Waddell Turnout the canal water temperatures range from 58 to 69 degrees Fahrenheit This water is 15 to 25 degrees cooler than normal canal water temperatures
DO The average dissolved oxygen levels were fairly uniform throughout the canal system Most of the sampling locations were approximately 8S mgL for 2001
Metals ~ The concentrations of dissolved heavy metals are very low to below laboratory detection limits throughout the CAP canal system
Pathogens ~ A significant amount of public drinking water in the urban areas of central and southern Arizona is treated CAP water One of the biggest concerns is the presence of pathogens in treated water including Giardia and Cryptosporidium In February and October all designated sampling sites on the CAP system produced non-detectable results for Giardia and Cryptosporidium
- 36shy
Secondary US EPA ArizonaMaximum
Maximum Health-basedContaminant Contaminant Guidancelevel
Range of Average level (MCl) (Aesthetics- level Analyte Units Detections Value (Health-based) based) (HBGl)
85 5
note 2 13 10 02 Iron note
266 note
231
600
note 2 note note 2 note note note
- 37shy
Note 1 Values presented are based upon laboratory method detection limits better defined as the lowest level that the laboratory can definitively identify that the analyte exists in the sample All method detection limits are below any existing EPA maximum contaminant level (MeL)
Note 2 Average value was not calculated due to test species not being detected consistently throughout the year See attached summary tables of priority pollutant results for locations and measured amounts
Note 3 The value reported for this constituent is for a one-time sampling event The detection of this contaminant did not reoccur in the same calendar year See attached summary tables ofpriority pollutant results for locations and measured amounts
WATER QUALITY IMPACT FROM BILL WILLIAMS RIVER
As previously mentioned the CAP aqueduct system begins at Lake Havasu The intake area for the Havasu Pumping Plant is located in a bay-like feature which is at the mouth of the Bill Williams River as it flows into Lake Havasu The Bill Williams River together with its headwaters at Alamo Lake forms the majority of the drainage area of west central Arizona During periods of heavy rainfall and runoff the flows in the Bill Williams River dominate this area of Lake Havasu and the water quality tends to be low in TDS but very turbid with high concentrations of organic matter and suspended sediments along with strong odors
The water quality deteriorates and causes treatment problems for the municipalities To avoid pumping this water into the CAP system and delivering it to customers the Havasu pumps are shut down until the water quality improves and clears up
In 1993 and 1995 the Havasu pumping had to be curtailed for a week or more due to the releases from Alamo Lake The reservoir watershed was dry in 2001 with minimal runoff therefore no water quality episodes occurred on the Bill Williams River
TASTE AND ODOR RESEARCH PROGRAM
Municipal water treatment plants which treat water supplies from the CAP and SRP systems have experienced seasonal taste and odor episodes The water has been described as having a musty-moldy-earthy taste or odor which is suspected of being associated with biological activity in reservoirs and canal systems Water treatment plants can treat this water with activated carbon to reduce or eliminate the offensive tastes and odors however treatments have significant cost
Compounds produced by Cyanobacteria (blue-green algae) are the suspected causes of the taste and odor problems Two compounds of concern are Geosmin and 2shymethylisoborneol (MIB) which can produce odors at levels as low as 1 part per trillion (ppt) The taste and odor constituents are an aesthetic problem and do not present a
- 38shy
health concern at these extremely low levels MIB detected in samples from several treatment plants appear to be due to planktonic Oscillatoria and both planktonic and periphytic Lyngbya Geosmin detected in samples appear to come from periphytic Anabeana and Lyngbya
An on going cooperative research and implementation program among ASU SRP CAP and the City of Phoenix has been monitoring the levels of MIB and Geosmin in the CAP and SRP canal systems The project is titled
Reducing Taste and Odor and Other Algae-Related Problems for Surface Water Supplies in Arid Environmentsmiddot
The project publishes and weekly newsletter which contains sampling results and recommendations for treatment of MIB and Geosmin A summary of the project and a copy of the newsletters distributed including the most current newsletter can be found at
httpceaspubeasasuedupwestltasteandodorhtm
GROUNDWATER RECHARGE PROJECTS - WATER QUALITY
The following direct recharge projects were in operation in 2001
1 Avra Valley Recharge Project 2 Pima Mine Road Recharge Project 3 Lower Santa Cruz Recharge Project 4 Agua Fria Recharge Project
A portion of the permitting process for these projects requires quarterly water quality monitoring The sampling results are compiled into an annual report The annual report is a matter of public record Copies of the reports or portions of the reports are available by contacting
Tom Harbour CAWCD Water Planning 623-869-2107 tharbourcap-azcom
- 39shy
Summary
This report has presented and discussed a variety of parameters in the CAP water quality monitoring program CAP employees are sensitive to customer needs and as changes occur along with increased interest in other constituents the water quality monitoring and sampling program will be revised accordingly and the data will be published in future annual water quality reports
For further information questions or comments please contact
Patrick Dent (623) 869-2581 Brian Henning (623) 869-2567 Tom Curry (623) 869-2353 Tim Kacerek (623) 869-2563
- 40shy
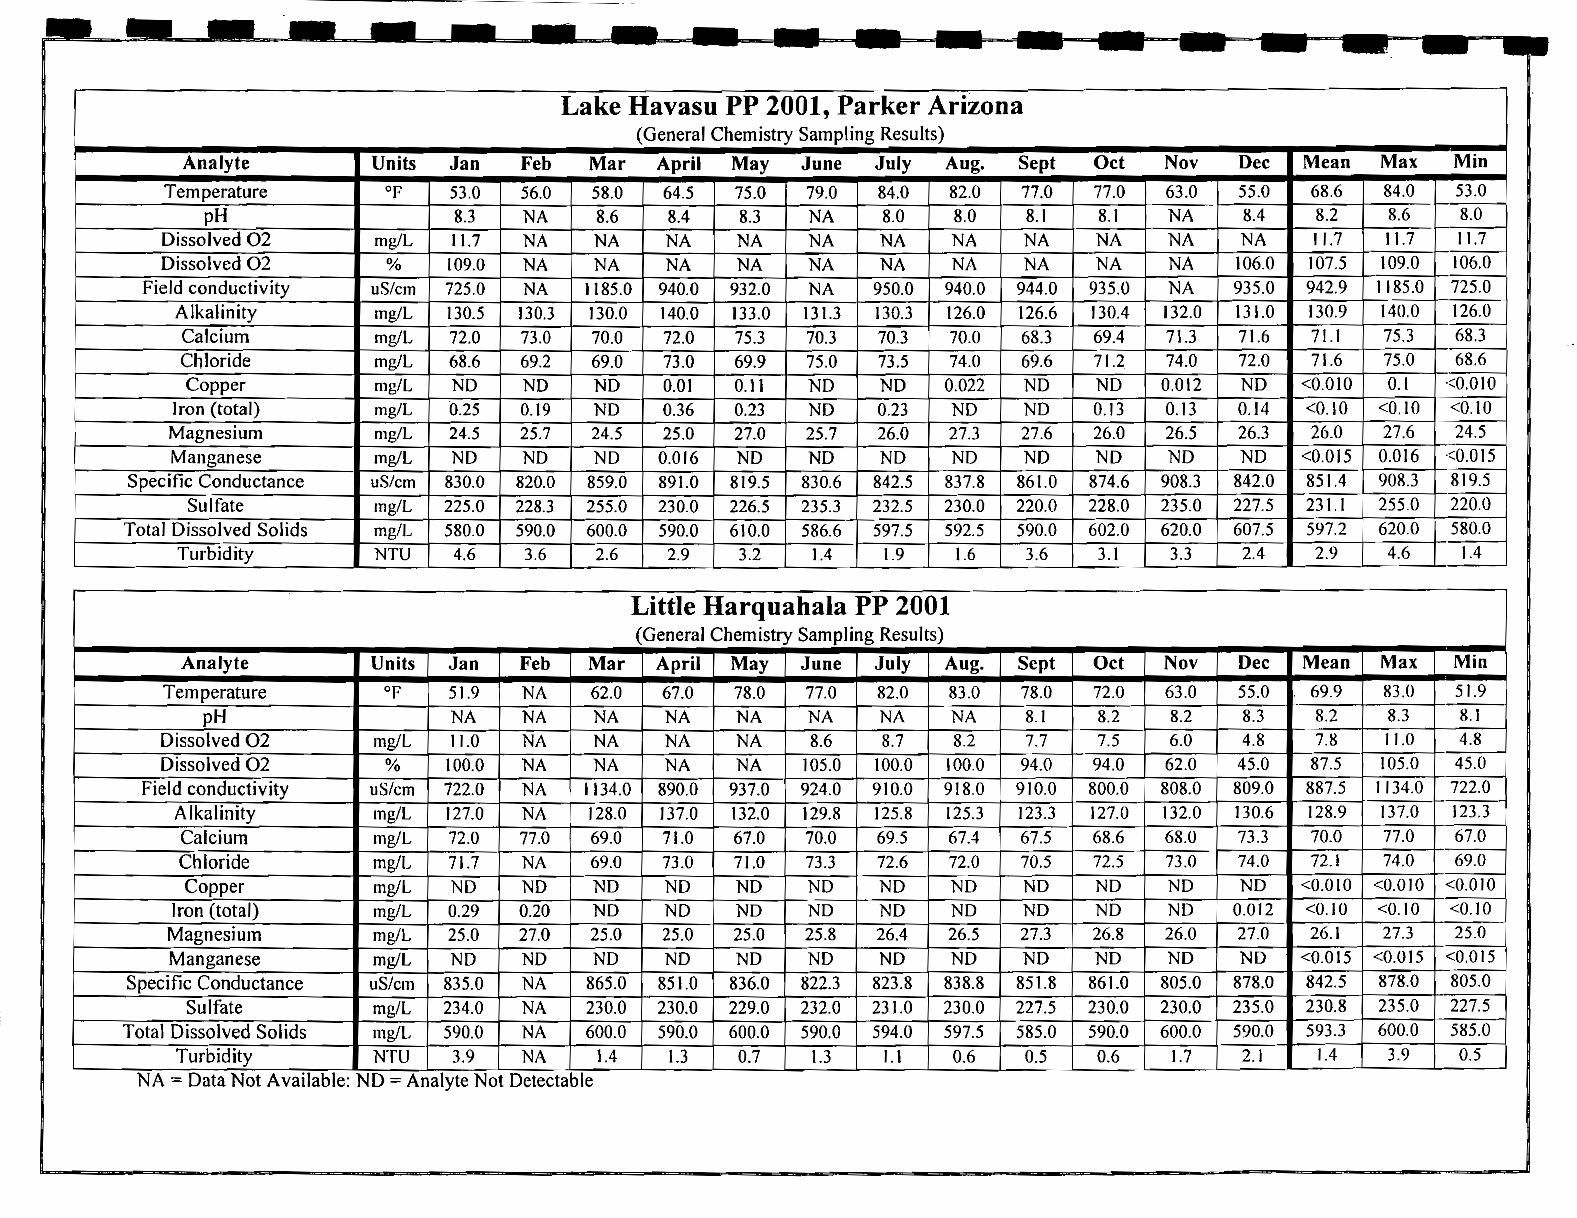
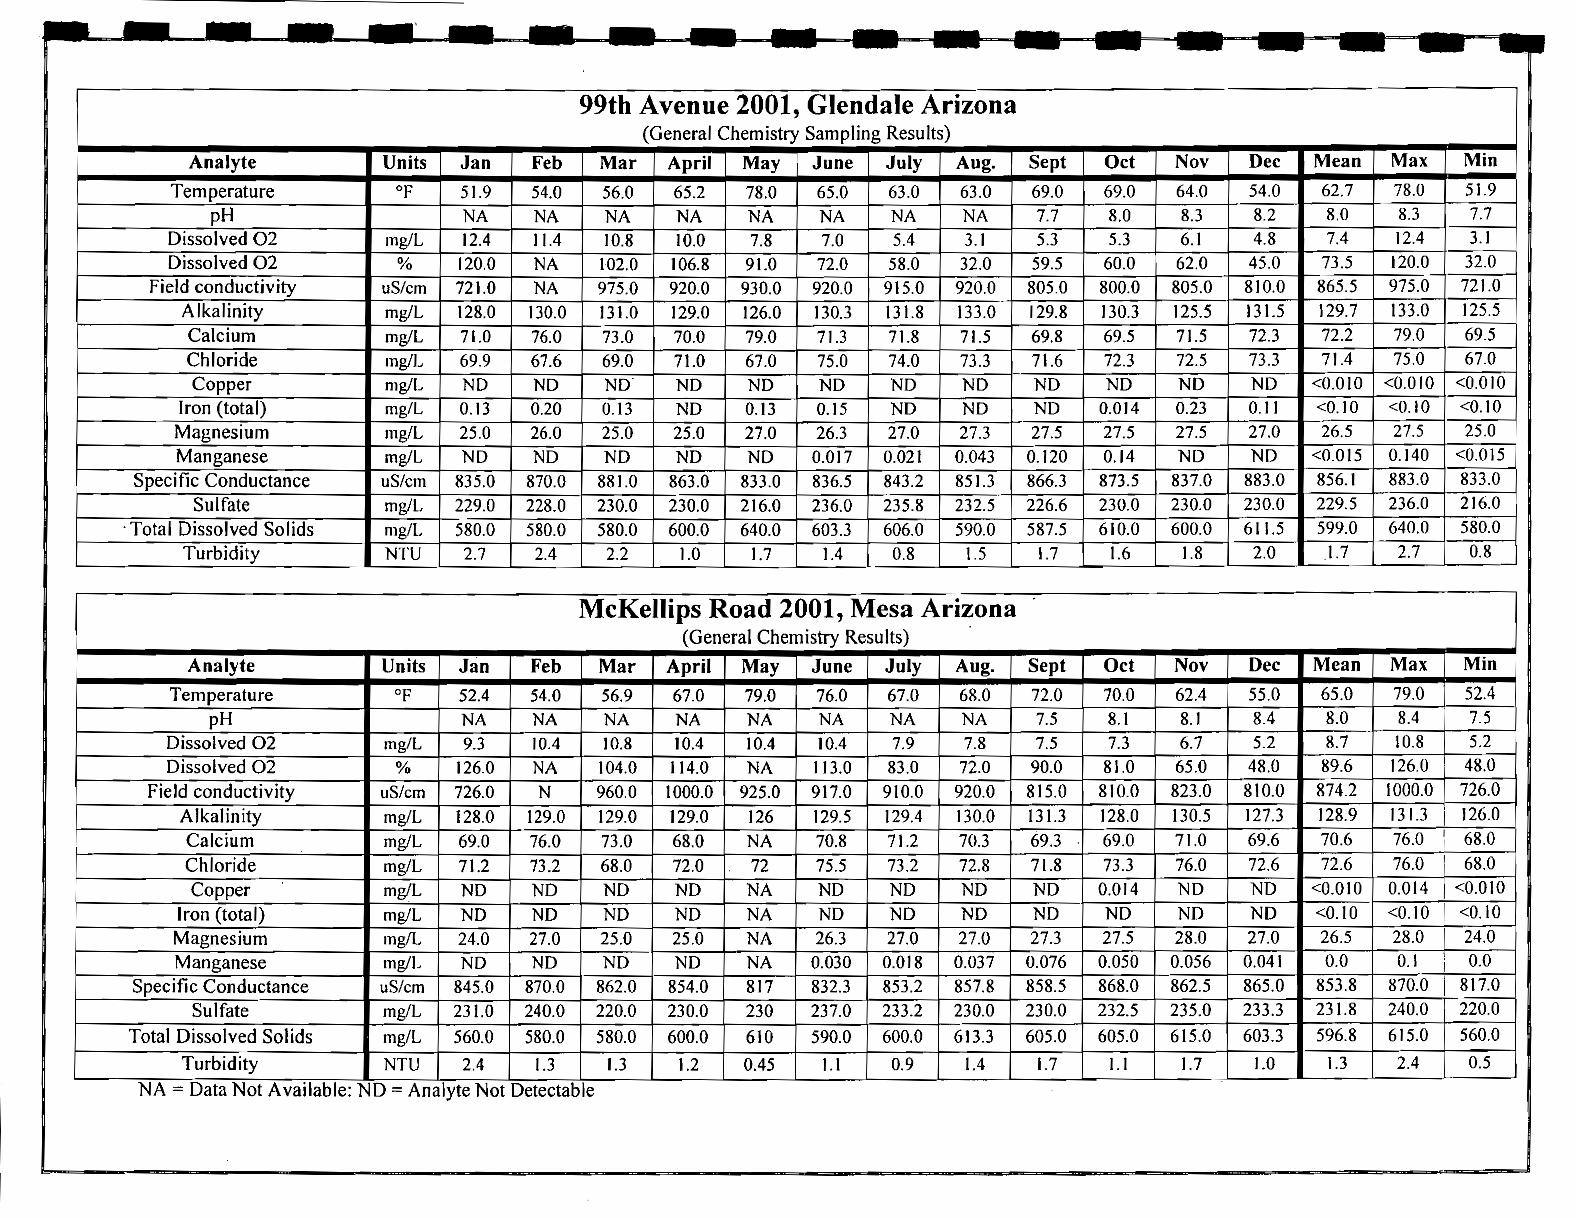
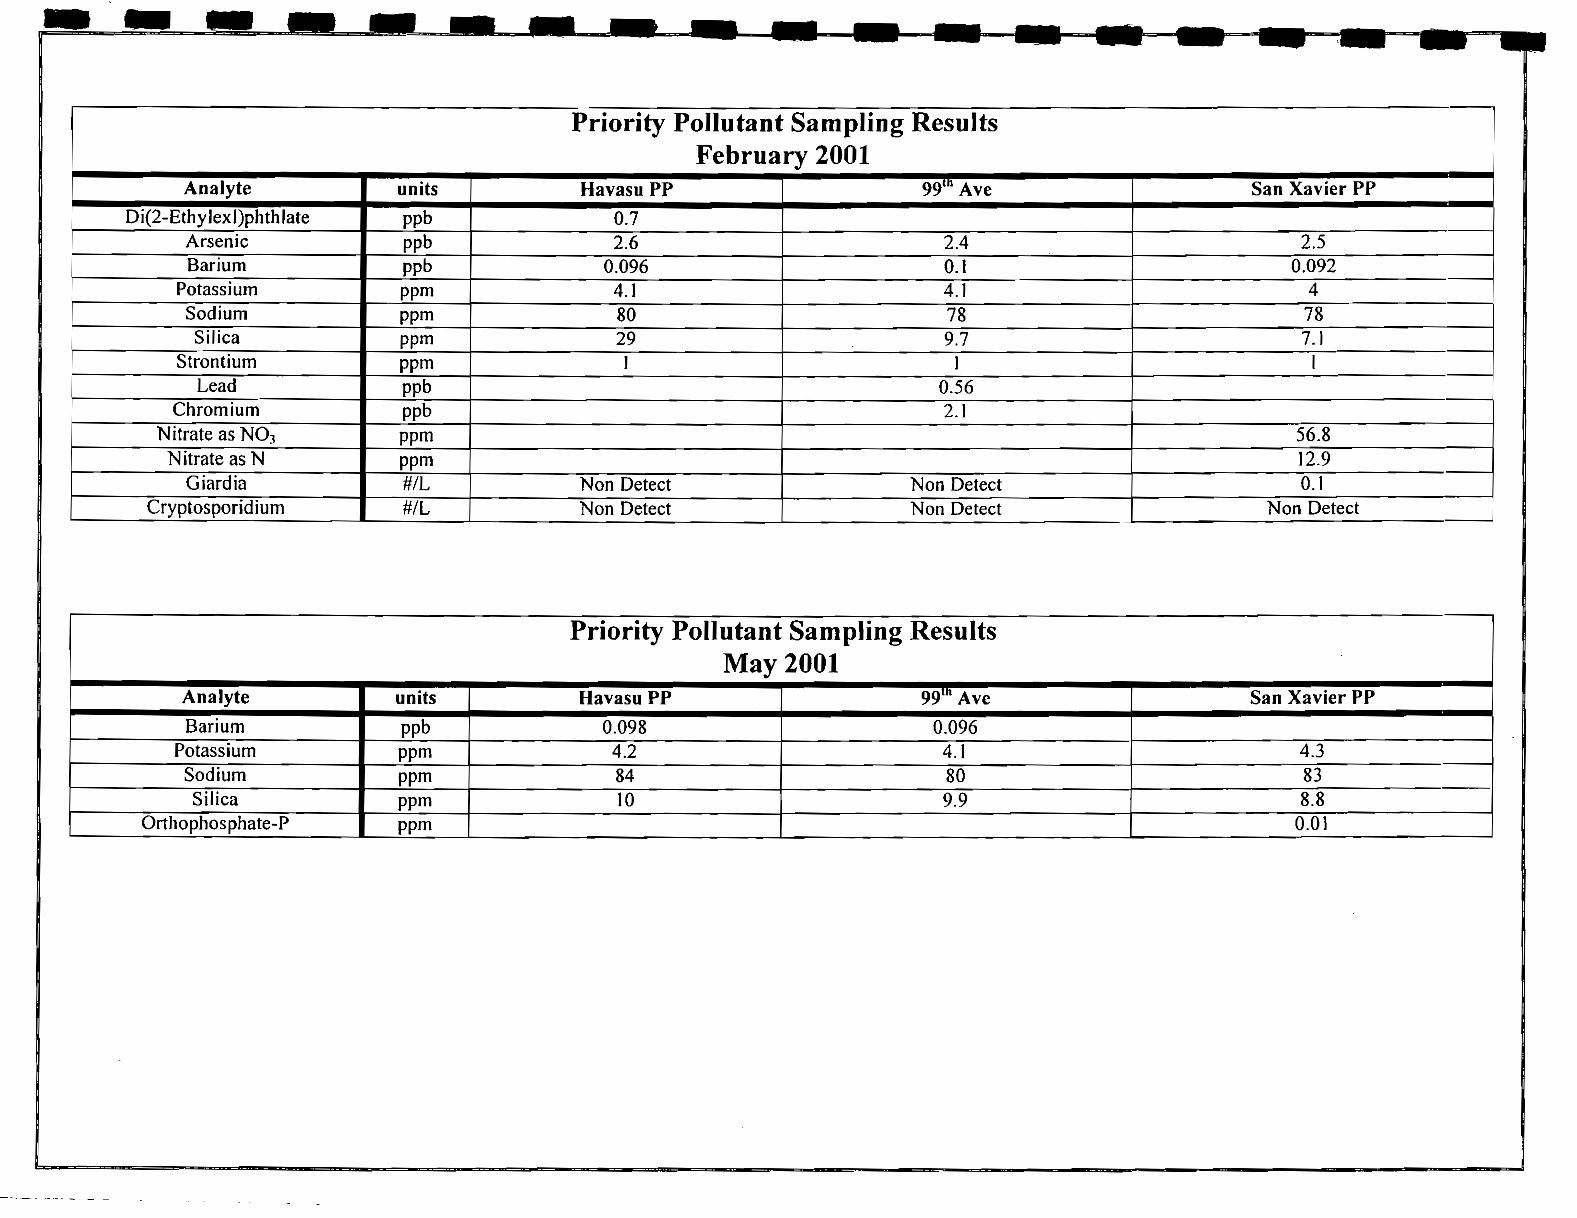
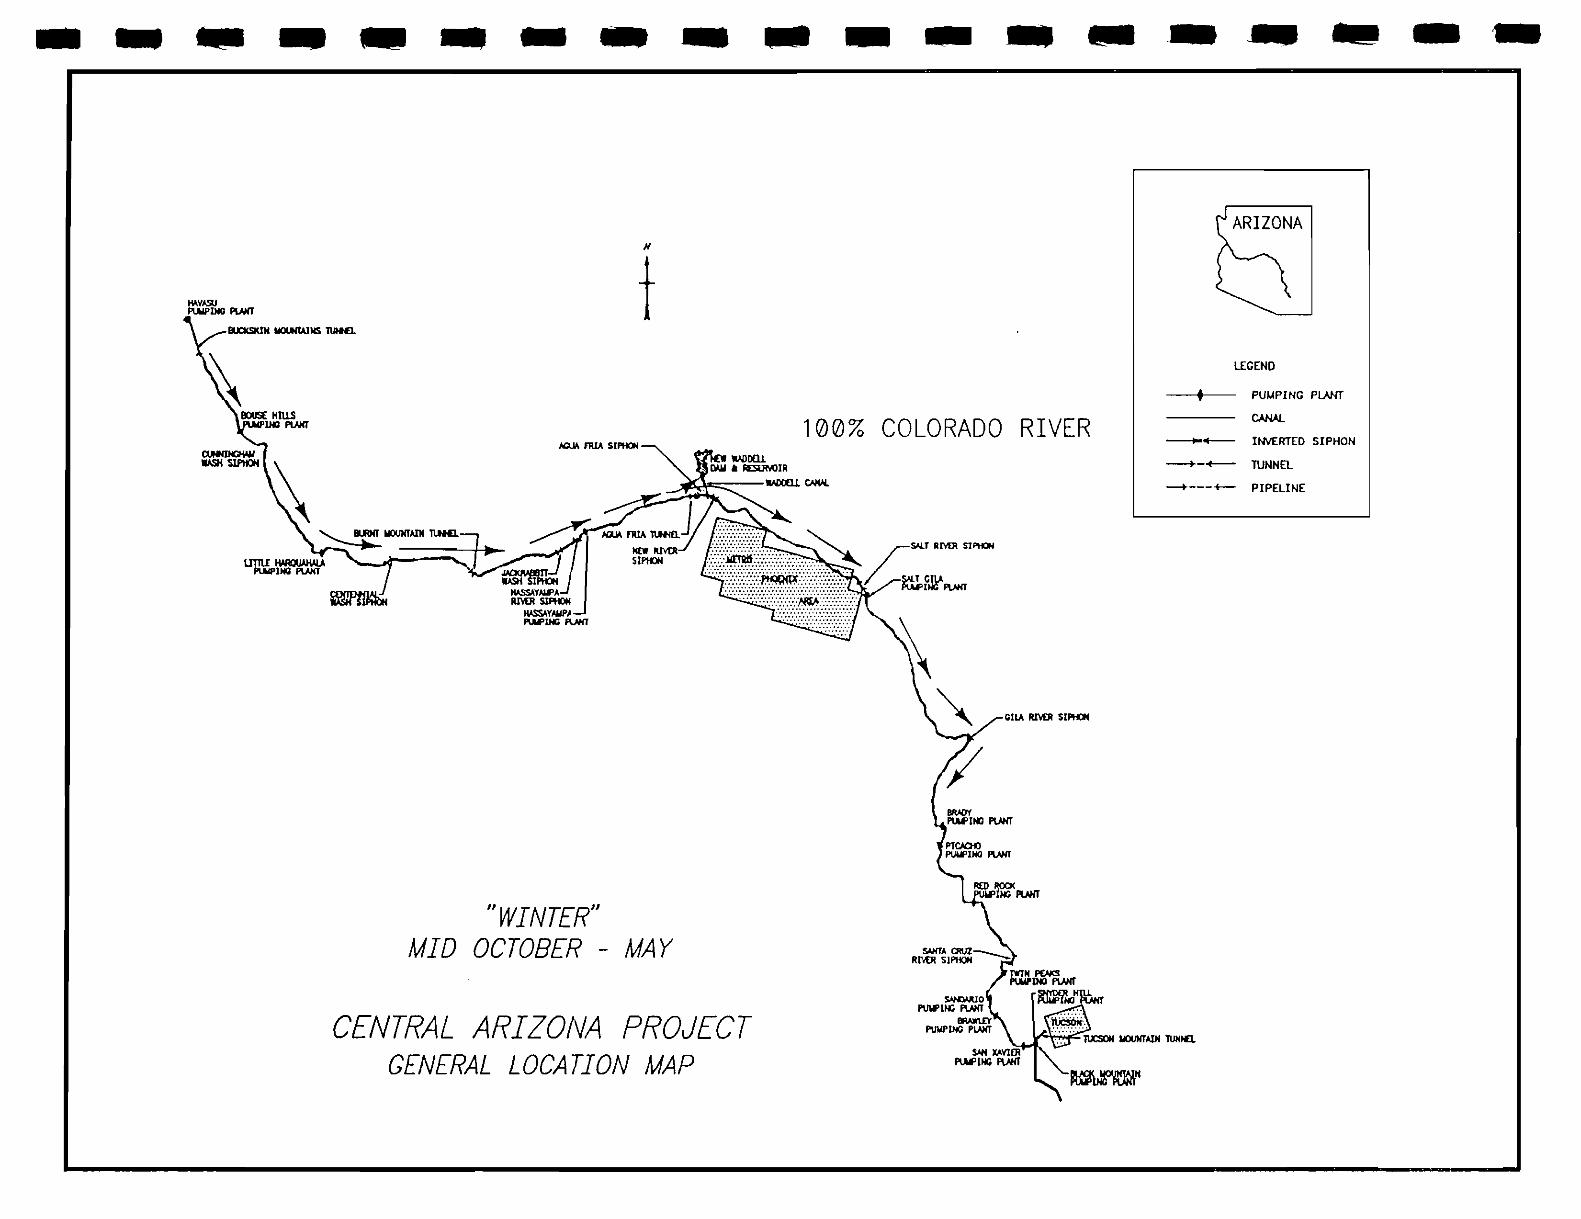

LAKE PLEASANT 9182001
1DO (mgJl) l
o 05 1 15 2 25 3 35 4 45 5 55 6 65 7 75 8 85 9 95 10
1700 -r---~~---T---r--1---T-~---T---r--~--T---r-~---T---r--~--T---r-~---i1~--~----~1 owers
~250YDS 1680 r-~---+---r--~--+-~r--+---+--~--+---r-~r--+---+--~--+---r-~---+---I
~1000YDS
1Mile 1660 r---r-~---+---r--~--+-~~-+---+--4---+---r-~---+---+--~--+---r-~--~1
+--______-+-__-__-+__~___________-_~ -Water---~-+---+---I Level
1640 +---~--1---+---r--~---~~---+--~--~--~--~~--~~~r=~--_t---r--~--~~--------__Q
Upper Gate
1560
1540
Lower Gate 1520
1500
_ bull ____ _ IIIIJ _ i __ _ _ ~ _
LAKE PLEASANT 7112001
Temperature (F)
90 85 80 75 70 65 60 55 50 1700 +--------shy
1680 ~------~~~----~------~------~--------~------~--------~------~
1660 +--------+----~~--r_------~------~--
1640 -t----l------~=r~~~==~~_-II--_T-------
1540
1520
--- Towers
-+-250yds
1000yds
-+- 1Mile
--Water Level
Upper Gate
Lower Gate -1500 l
LAKE PLEASANT 72401
Temperature (F)
90 85 80 75 70 65 60 55 50 1700 +--------+--------+--------r----~--~------~-------~~------~------~ r-----------~ -+-Towers
- 250yds 1680 T--------+--------+-------~--------~------_r------~~------~------~ 1000yds
~lMile
1660 +-------~~----_r--------r_------_r------~~------~------_4------~ ---AFria
-Water Level
Upper Gate
1560 +-ii~
1540
1520 Lower Gate
1500
- - ~ 111ft - ~ --- shy
LAKE PLEASANT 8801
Temperatura (F)
90 85 80 75 70 65 60 55 50 1700 +-------~--------~------_+--------~------~--------~------~--------~p------------~
-- towers
-+-250yds1680 +-------~--------~------_+--------~------~--------~------~---------
- 1000yds
1mile
~aguafria
1640 +-------~~~----~---middot---_+--------~------~-------middot-~------~~------~ - Water Level
1540
1520
1500
- _ - _ - middotmiddot ~ 1118 -
LAKE PLEASANT 9182001
Temperature (F)
90
1700 85 80 75 70 65 60 55 50
~Towers
1680
1660
250YDS
~1000YDS
___ 1Mile
1640 -Water
Level
1 1620
2 ~
1600 w QI
til J 1580
Upper Gate
1560
1540
1520 Lower Gate
1500
LAKE PLEASANT 9182001
4 5 6 7 8 9 10 11 12 13 14 1700 +-----~-------r_----_r----~------~----_+------+_----_+------~----~----------_
-+-Towers
1680 +-----_4------4-~--_4------4_----~------~~----~----~------~----~1 --- 250YDS
1000YDS
1660 +------t-------t------t------4-------i-------+-------if-------+-------t-------i1 ~ 1Mile
1------+------+-----------+-~~-+------+----~~-----+-----------~ -Water Level 164deg t---~j------II~---t--~-t_1~~----~~----r_----t_----i_----jL----------J
1620 i~ Upper Gate
1560 ~~~
1540
bullLower Gate 1520
1500
Lake Pleasant 2001 Water Quality Sampling Results
Analyte units FebS May 21 July J I Aug8 Aug28 Oct 2 Alkalinity ppm 131 126 122 119 121 127 Calcium ppm 72 72 70 67 68 68 I
Chloride ppm 627 74 78 80 80 75 I
I Copper ppm ND ND ND ND NO NO I
Iron (Total) ppm ND 11 ND NO ND NO i Magnesium ppm 27 28 28 29 30 30
I
I Manganese ppm ND 0025 ND ND NO 00]6 ~
I I
i Specific Conductance uScm 895 814 864 863 896 916 Sulfate ppm 211 231 246 250 250 240 I
Total Dissolved Solids Turbidity
ppm ntu
610 37 70
630 05
620 0
640 08
620 12 I
i Arsenic ppb 10 34 42 Barium ppb 013 01 0075 0083
i Chromium ppb 14 Lead (Total) ppb 061
Mercury ppm 022 Potassium ppm 45 45 49 46 Sodium ppm 81 83 87 92 Silica ppm 97 12 10 12
Strontium ppm 12 09 092 Orthophosphate-P ppm 001
MTBE ppm 52 Oiethylphthalate ppb 14 3
Agua Fria River 2001 Water Quality Sampling Results
Analyte units Feb 20 Julll Aug8 i
Alkalinity ppm 164 148 277 Calcium ppm 40 71 83 Chloride ppm 164 75 41 Copper ppm NO NO NO
Iron (Total) ppm 098 042 11 -Magnesium ppm 17 30 35 I Manganese ppm 0045 019 16 I
Specific Conductance uScm 412 865 792 I Sulfate ppm 339 231 110 I
Total Dissolved Solids ppm 260 630 530 I
Turbidity ntu 1 1 13 14 i Arsenic ppb 10 13 I Barium ppb 0036 0095 I
IChromium ppb 25 13 Ferrous Iron ppm 04 I
i Lead (Total) ppb 095 064 II Potassium ppm 17 52 Sodium ppm 28 87 - I Silica ppm 24 13
Strontium ppm 03 10 I
Orthophosphate-P ppm 0034 0015 Total phosphorous-P ppm 0065 002
Diethylphthalate ppb 11
GiardiaCryptosporidium CytsIOOL SliB CHD
GENERAL DISCUSSION
Turbidity gt- The suspended solids are very low with turbidity levels averaging 1-5 NTU with an occasional spike exceeding 100 NTU The water in the canal and Lake Pleasant is very clear and the lake bottom can be seen at depths of 25-30 feet In general when canal flows are lower or steady the turbidity is low When flow increases occur the higher velocities cause an increase in turbidity levels These increases in turbidity are generally very short in duration Algae blooms in the canal also have an impact on tUrbidity Blooms are generally very localized and do not contribute significantly to the overall turbidity levels of CAP water
TDS)gt Total dissolved solids represent the concentration of dissolved minerals in the water The TDS levels in CAP water are high when compared to most groundwater sources For the year the average TDS was 600 mgL and maintained consistent values throughout the canal system
pH ~ The average pH ranged from 82 in the Havasu area to 86 in the Tucson area The increase in pH can be attributed to the progressive increase in dissolved alkaline minerals The increase is a result of lower deliveries in the southern end of the aqueduct
Temperature ~ Average water temperatures for the year ranged from 63 to 69 degrees Fahrenheit with minimal differences between the Havasu Phoenix and Tucson areas of the canal system However monthly and seasonal temperatures varied considerably along the canal system Maximum temperatures reached 87 degrees Fahrenheit and minimum temperatures were about SO degrees Fahrenheit Note From June to mid-October when Lake Pleasant water is released for customer deliveries downstream of the Waddell Turnout the canal water temperatures range from 58 to 69 degrees Fahrenheit This water is 15 to 25 degrees cooler than normal canal water temperatures
DO The average dissolved oxygen levels were fairly uniform throughout the canal system Most of the sampling locations were approximately 8S mgL for 2001
Metals ~ The concentrations of dissolved heavy metals are very low to below laboratory detection limits throughout the CAP canal system
Pathogens ~ A significant amount of public drinking water in the urban areas of central and southern Arizona is treated CAP water One of the biggest concerns is the presence of pathogens in treated water including Giardia and Cryptosporidium In February and October all designated sampling sites on the CAP system produced non-detectable results for Giardia and Cryptosporidium
- 36shy
Secondary US EPA ArizonaMaximum
Maximum Health-basedContaminant Contaminant Guidancelevel
Range of Average level (MCl) (Aesthetics- level Analyte Units Detections Value (Health-based) based) (HBGl)
85 5
note 2 13 10 02 Iron note
266 note
231
600
note 2 note note 2 note note note
- 37shy
Note 1 Values presented are based upon laboratory method detection limits better defined as the lowest level that the laboratory can definitively identify that the analyte exists in the sample All method detection limits are below any existing EPA maximum contaminant level (MeL)
Note 2 Average value was not calculated due to test species not being detected consistently throughout the year See attached summary tables of priority pollutant results for locations and measured amounts
Note 3 The value reported for this constituent is for a one-time sampling event The detection of this contaminant did not reoccur in the same calendar year See attached summary tables ofpriority pollutant results for locations and measured amounts
WATER QUALITY IMPACT FROM BILL WILLIAMS RIVER
As previously mentioned the CAP aqueduct system begins at Lake Havasu The intake area for the Havasu Pumping Plant is located in a bay-like feature which is at the mouth of the Bill Williams River as it flows into Lake Havasu The Bill Williams River together with its headwaters at Alamo Lake forms the majority of the drainage area of west central Arizona During periods of heavy rainfall and runoff the flows in the Bill Williams River dominate this area of Lake Havasu and the water quality tends to be low in TDS but very turbid with high concentrations of organic matter and suspended sediments along with strong odors
The water quality deteriorates and causes treatment problems for the municipalities To avoid pumping this water into the CAP system and delivering it to customers the Havasu pumps are shut down until the water quality improves and clears up
In 1993 and 1995 the Havasu pumping had to be curtailed for a week or more due to the releases from Alamo Lake The reservoir watershed was dry in 2001 with minimal runoff therefore no water quality episodes occurred on the Bill Williams River
TASTE AND ODOR RESEARCH PROGRAM
Municipal water treatment plants which treat water supplies from the CAP and SRP systems have experienced seasonal taste and odor episodes The water has been described as having a musty-moldy-earthy taste or odor which is suspected of being associated with biological activity in reservoirs and canal systems Water treatment plants can treat this water with activated carbon to reduce or eliminate the offensive tastes and odors however treatments have significant cost
Compounds produced by Cyanobacteria (blue-green algae) are the suspected causes of the taste and odor problems Two compounds of concern are Geosmin and 2shymethylisoborneol (MIB) which can produce odors at levels as low as 1 part per trillion (ppt) The taste and odor constituents are an aesthetic problem and do not present a
- 38shy
health concern at these extremely low levels MIB detected in samples from several treatment plants appear to be due to planktonic Oscillatoria and both planktonic and periphytic Lyngbya Geosmin detected in samples appear to come from periphytic Anabeana and Lyngbya
An on going cooperative research and implementation program among ASU SRP CAP and the City of Phoenix has been monitoring the levels of MIB and Geosmin in the CAP and SRP canal systems The project is titled
Reducing Taste and Odor and Other Algae-Related Problems for Surface Water Supplies in Arid Environmentsmiddot
The project publishes and weekly newsletter which contains sampling results and recommendations for treatment of MIB and Geosmin A summary of the project and a copy of the newsletters distributed including the most current newsletter can be found at
httpceaspubeasasuedupwestltasteandodorhtm
GROUNDWATER RECHARGE PROJECTS - WATER QUALITY
The following direct recharge projects were in operation in 2001
1 Avra Valley Recharge Project 2 Pima Mine Road Recharge Project 3 Lower Santa Cruz Recharge Project 4 Agua Fria Recharge Project
A portion of the permitting process for these projects requires quarterly water quality monitoring The sampling results are compiled into an annual report The annual report is a matter of public record Copies of the reports or portions of the reports are available by contacting
Tom Harbour CAWCD Water Planning 623-869-2107 tharbourcap-azcom
- 39shy
Summary
This report has presented and discussed a variety of parameters in the CAP water quality monitoring program CAP employees are sensitive to customer needs and as changes occur along with increased interest in other constituents the water quality monitoring and sampling program will be revised accordingly and the data will be published in future annual water quality reports
For further information questions or comments please contact
Patrick Dent (623) 869-2581 Brian Henning (623) 869-2567 Tom Curry (623) 869-2353 Tim Kacerek (623) 869-2563
- 40shy
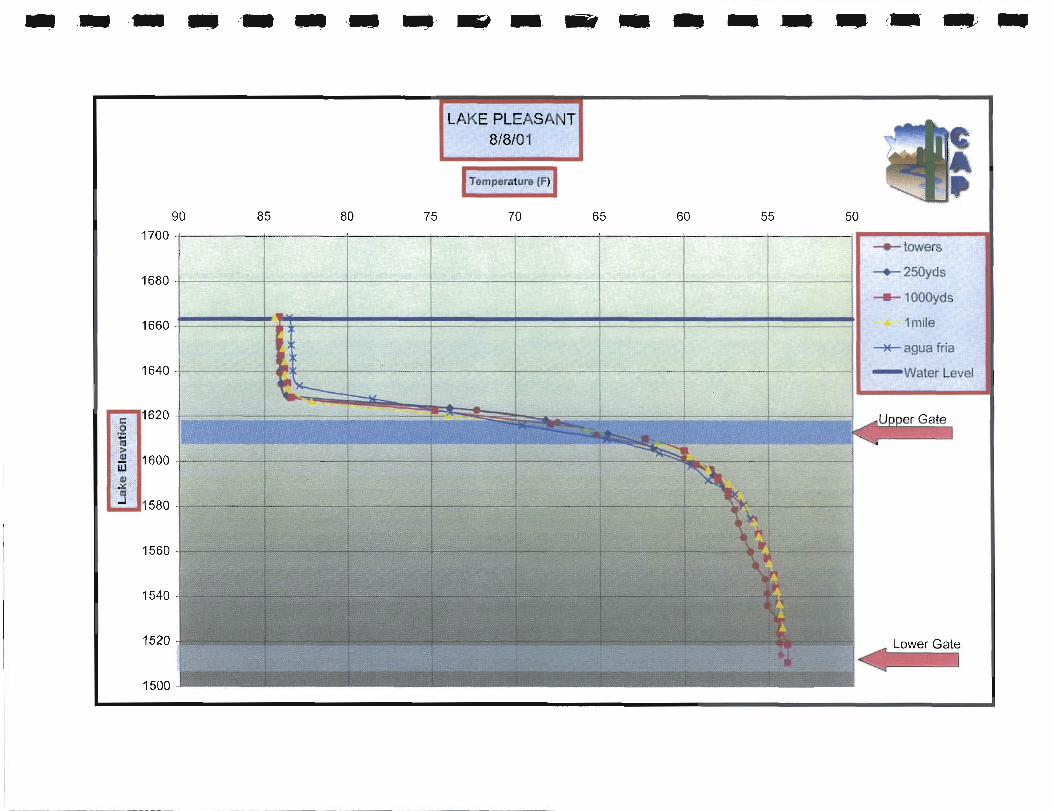
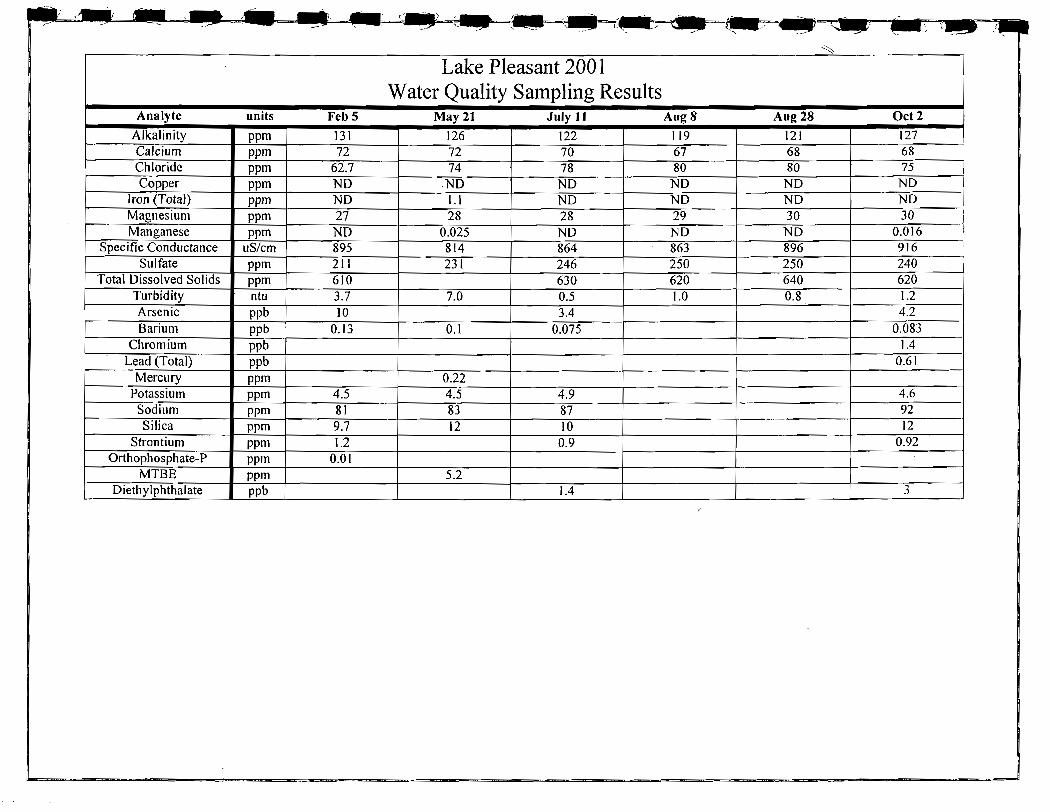
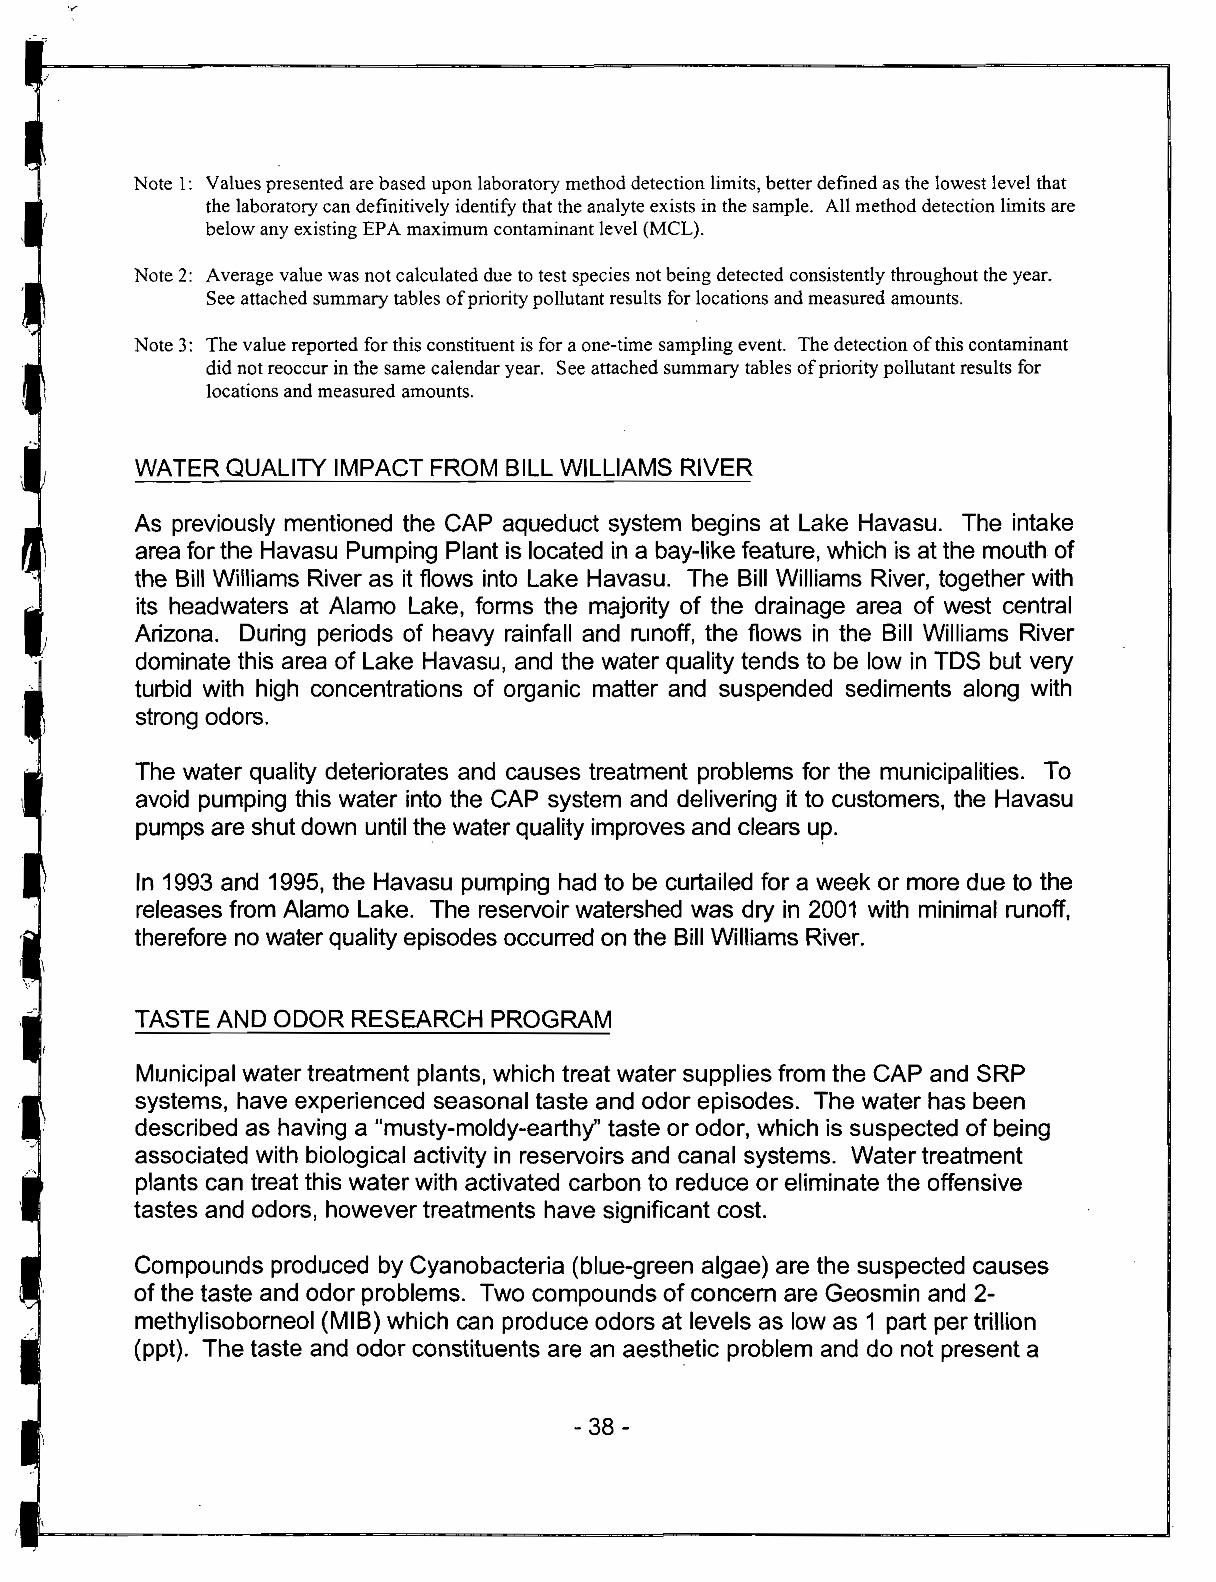