central california coastal circulation study: program ... · pdf filecentral california...
TRANSCRIPT
CENTRAL CALIFORNIA COASTAL CIRCULATION STUDY: PROGRAM OVERVIEW AND REPRESENTATIVE RESULTS
A. Bratkovich', R.L Bernstein2, D.B. Cheltonhnd P.M. Kosro3
NOAA Great Lakes Environmental Research Laboratory 2205 Commonwealth Bhrd., Ann Arbor, MI 48105 Seaspace, 3655 Nobel Drive, San Diego, CA 92122
College of Oceanography, Oregon State University, Corvallis, OR 97331
INTRODUCTION AND BACKGROUND
An extensive physical oceanographic data set was collected from the region off the coast of Central California in order to study the dominant features of the subtidal current variability between Point Conception and San Francisco Bay. This study began in 1983 and was motivated by the fact that relatively few direct measurements of slope and shelf currents were available from this portion of the California coast at that time. The current structure, dynamics and energetics of this region remained relatively ill-defined promoting assessments of environmental impacts which are correspondingly vague.
This synopsis presents some results derived from the analysis of the Central California Coastal Circulation Study (C4S) measurement set pertinent to the following topics: 1) description of the major features of the observed current field and their relationship to the local wind field, 2) description of seasonal transitions or trends observed in the flow field and relationship to other physical fields, 3) characterization of subtidal wave-like features in the flow field and probable forcing mechanisms. Results shown are taken from Bernstein et al. 1985; Bernstein et al. 1986; Bratkovich 1989; Bratkovich et al. 1985; Bratkovich et al. 1988; Bratkovich et al. 1991 ; Breaker and Bratkovich 1991; Chelton 1984; Chetton 1987; Chelton et al. 1988; Chelton et al. 1987; Chelton and Kosro 1987% 1987b, 1987c, 1987d.
Historical observations from this region, supporting data and theoretical work, as of the initiation date for this project (e.g., Allen 1980; Bemstein et al. 1977; Brink 1983; Hickey 1979; Hickey and Pola 1983; Huyer 1983; Huyer et al. 1979; List and Koh 1976; Lynn et al. 1982; McClain and Thomas 1983; Munk et al. 1970; Nelson 1977; Nelson and Husby 1983; Reid et al. 1958; Reid and Schwartzlose 1962; Schwartzlose 1963; Smith 1968; Sverdrup et al. 1942; Traganza et al. 1980; Wickham 1975; Winant and Bratkovich 1981 ; Winant 1980; Wyllie 1966; Yoshida 1980) indicated that a coastal undercurrent flows poleward a large percentage of the time, and that a seasonally varying poleward countercurrent, the Davidson Current, opposed the mean equatorward surface flow further offshore which is the primary component of the California Current System. This representation of the coastal current variabili off Central California was largely reconstructed from nonsynoptic, sporadic data which in many cases is based upon inferential relationships between water mass properties and currents. The C4S observational study, which was rich in longer-term direct measurements of current variability, was designed to quantify some of the dominant flow characteristics of this apparently complex oceanographic region.
The field measurement interval was February 1984 through July 1985. The field observations were conducted by Raytheon Service Company (RSC) as part of the Mineral Management Services (MMS), U.S. Department of the Interior, funded Central California Coastal Circulation Study (C4S). Hydrographic surveys, surface driier measurements, and moored current,

Southem Cliffom18 Bight Phyric.1 Oceanography Workrhop
temperature, salinity, and bottom pressure measurements were executed by RSC while supporting data (e.g., sea surface elevation ,, and surface winds) were gathered from standard sources. SeaSpace provided remotely sensed sea surface temperature imagery for the region. Cheton et al. (1987) gives an overview of the field program. 38
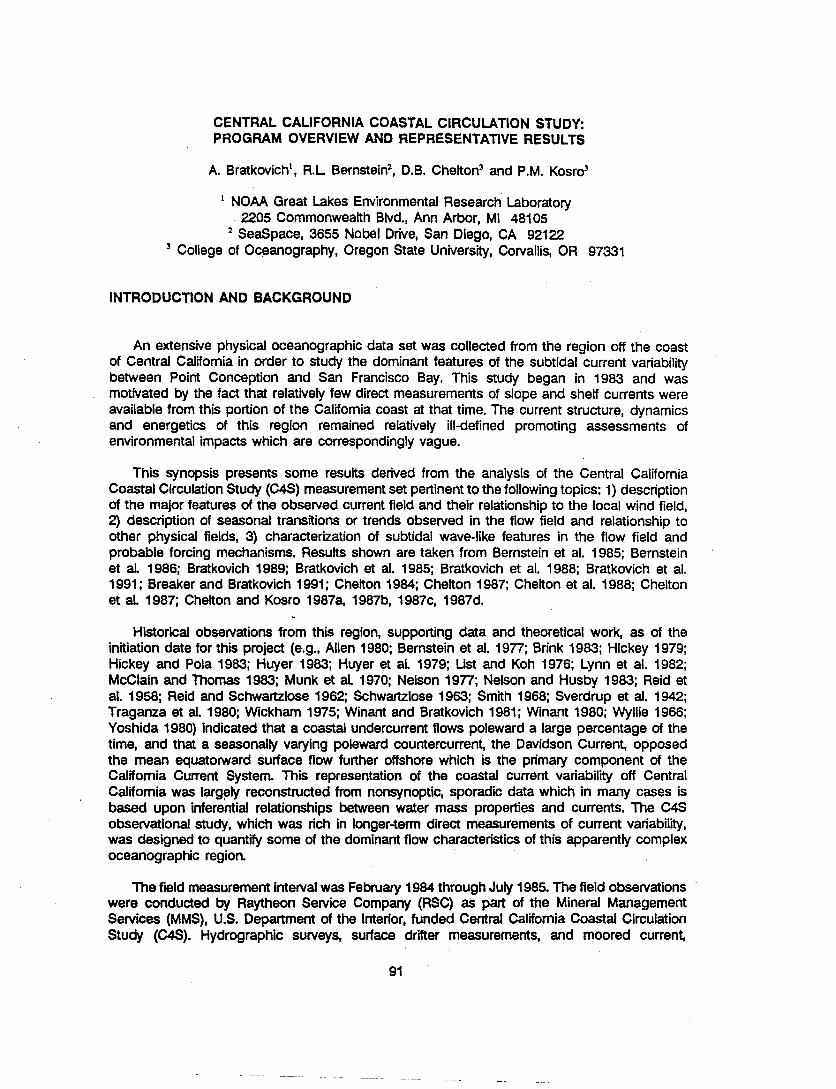
Five mooring transects were occupied during t h i eighteen month period composed primarily of outer shelf (100 m total water depth) and upper slope (500 m total water 35
depth) moorings with an alongshelf shelf spacing of 75 to 125 km. Figures 1 and 2 are detailed planview and perspective illustrations of the moored current meter array. Nominal instrument depths were 70, 220 and 470 m. 34
Four hydrographic surveys were conducted as 123 122 121 120
part of the observation set and SST imagery was gathered on a nearly continuous basis Figure I. Locator map for the C4S study area. throughout the entire observation period. Four Outer shelf mOOrlng8 are located In a nominal drifter sets were also deployed and tracked water depth of 100 m. Upper slope moorlngs are as of the integrated measurement shed In a nominal water depth of 500 m with an
program. extra mooring site added in 250 m water depth off Point Sal. Cross-shelf site separations are typically 5-15 km. Alongshelf separations for
parameters of geophysical and mwlng transem are 75.125 km (Chetton et al. dynarnical significance for this area are the 10gl). local inertial frequency, f (0.00078 radls), the average buoyancy frequency, N (-0.003 radls), and the local bottom slope, s, which varies between 0.01 and 0.001 depending on location. The buoyancy frequency also varies with position in the water column and with season (by roughly a factor of three).
REPRESENTATIVE ANALYSES AND RESULTS
Thii presentation focuses primarily upon subtidal (time scales significantly longer than 1 day) flow variability, structure, and associated forcing and property transport. Here we differentiate between synoptic or 'event' time scales (2 - 10 days), subsynoptic time scales (1 0 - 50 days), seasonal time scales (50 - 150 days) and annual time scales (150 - 500 days). No comparable spatial scale stratification is employed since the eccentric, anisotropic nature of coastal current features disallows such classification.
Current Structure and Subtidal Temporal VarlaMllty
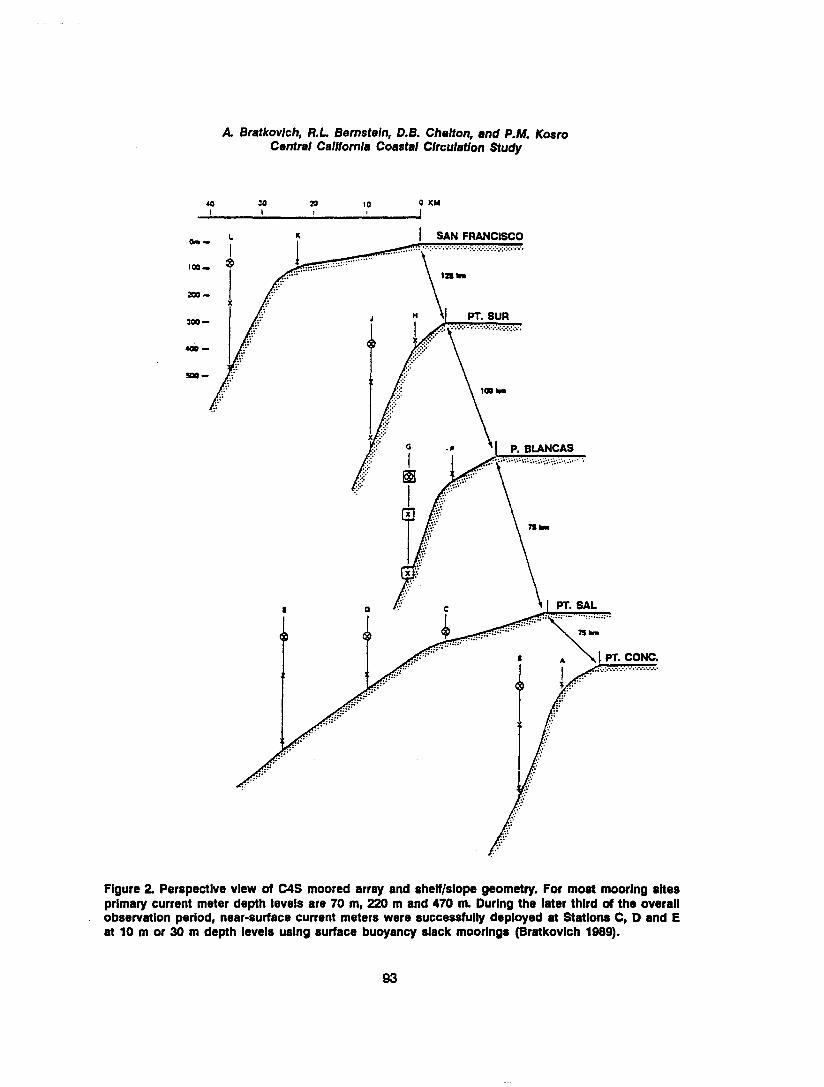
The flow on the upper slope and outer shelf between Pdnt Conception and Monterey Bay appears to be predominantly polward throughout the fieM measurement period. The mean current speeds (wer -3 month intervals) at the 70 m depth level are O(15 cm/s) with standard deviations for subtidal time scales of comparable amplitude (Figure 3). Current means and
A Bratkovich, R.L Bernsteln, D.B. Chelfon, and P.M. Kosro Central California Coastal Clrculation Study
Figure 2 Perspective view of C4S moored array and shelflslope geometry. For most moorlng sites primary current meter depth levels are 70 m, 220 m and 470 m During the later third of the overall
. observation period, nearsurface current meters were successfully deployed at Stations C, D and E at 10 m or 30 m depth levels using surface buoyancy slack moorlngs (Bratkovich 1989).
Southern California Bight Physical Oceanography Workshop
-40LJ-F1M- 'A' S . ~ ' N I D ' ? F I M I A 1 M I J ' J "
1984 1985 flgure 3. Tlme u d e s of surhu winds, water temperature and rlong.hel currents for selected locations and depth levels In C4S array. The portthe crorr-rhelf (alongshelf) utls Is directed towards 55 T (325 T) (Chelton et a1 194n).

A Bmtkovlch, R.L Bemeteln, D.B. Chelton, and P.M. Kottro CmmI C.IMomia C0art.I Clrculdon Study
standard deviations at the 220 and 470 m measurement levels are significantly smaller than 70 m depth level values (means and standard deviations of 10 cm/s or less) at most mooring locations and during most deployment intervals. The deeper instrument locations at the Point Sur and, to a lesser degree, the Piedras Blancas mooring transects are an exception to this tendency. Figure 3 also shows energetic mean (time averaged wer a month or more) and variable flow components at 220 and 470 m depths at these locations, most notably during late spring and early summer of both 1984 and 1985.
The time series data displayed in Figure 3 demonstrate the tendency (at least in the upper 300 m of the water column) for currents to flow poleward a large percentage of the time (80% or more) between Piedras Blancas (Station FIG) and Point Sur (Station J). The most energetic flows approach 50 cm/s in amplitude and persist at 25 cm/s or greater for periods of 10 to 30 days. For the 70 m depth instrument located in 500 m water depth off Piedras Blancas, the subtidal component of flow reverses infrequently (about 20 times per annual cycle). Episodes of zero crossings tend to be spaced by intervals of 20 to 40 days, a dominant time scale in the variability of the subtidal alongshelf flow.
Less frequent measurements of near-surface currents show that fluctuations tend to be comparably energetic (to 70 m depth level currents), but less directionally consistent than currents at depth levels of 70 m and greater. All of the 10 and 30 m depth level instruments were deployed on the Point Sal line during spring and summer of 1985. During this time interval, surface currents tended to be directed shoreward with alongshelf component means (taken wer the deployment interval) which were less than 5 cm/s and directed equatorward. Compared to the rest of the moored array (depths greater than 30 m), these locations were occupied less than 30% of the time and resulting statistically based results are thus less conclusive or representative.
Standard deviation values for the subtidal current components indicate that a typical advection range perturbation for a 1 day interval would be 8 to 13 km (an average advection rate of 10 to 15 cm/s for a duration of 1 day). Assuming the horizontal current fluctuations are normally distributed, the advection range perturbation would be double (triple) this value less than 5% (1%) of the time. These perturbations would be biased by a mean value of daily advection range of 5 to 20 km.
Some of the unique circulation features in the C4S region are shown in Figure 4 including a region of persistent offshore flow in the vicinity of Point Sur and an apparent onshore flow at Point Sal (70 m depth level) which is unusually persistent and energetic (-1 0 cm/s) considering its proximity to the coastline. This latter feature may be a manlestation of a near- surface pressure gradient field which has a significant equatorward component. A purely geostrophic balance would require onshore flow in the vicinity of the pressure front. For an unsteady quasigeostrophic flow field, an equatorward pressure gradient component would tend to accelerate fluid poleward as opposing forcing contributions (such as surface wind stress) subside. This tendency towards poleward acceleration during periods of slackened equatorward surface winds is one of the dominant characteristics d the flow between Point Sal (Stations C, D and E) and Piedras Blancas (Stations F and G). Chelon et al. (1988) have established that the wind and current fluctuations which occur in the Point Sal region profoundly influence the current variability, and associated water mass characteristics such as near-surface temperature, at locations further poleward in the study area They show that about 50% of the variability in

Southern Californk Bight Physical Oceanogrephy Wothhop
currents off Point Sal is correlated with local wind forcing and that currents observed at mooring transects further upcoast tend to be better correlated wlh winds at Point Sal than for more local wind observations. A tentative hypothesis based on this result is that the Point Sal - Point Arguello region provides dynamical control for currents over the upper slope and outer shelf for most of coastal Central California
Hydrographic data shown in Figures 5 and 6 indicate the apparent persistence and spatial continuity of the alongshelf geostrophic velocity component field. A nearly synoptic picture (Figure 5) of the alongshelf geostrophic velocity field at five diierent sections shows that the undercurrent is nearly continuous in space and apparently NOT &stinct from a shelf-trapped surface countercurrent. Figures 6a and 6b also shows the current structure in plainviw and at one transect for all four of the surveys. The undercurrent is a persistent feature with maximum poleward speeds of 20 to 30 cm/s. Direct observations of currents at depth at the same shelf transect confirm that these maximal values are accurate in an absolute sense not just relative to a geostrophic 'reference level.'
Relationship to Surface Wind Forcing
I I MEANVUOCrrY@70mDEPM
MEAN TEMP. (c) e m m MPTH
Figure 4. Pianview of mean currents at 70 m depth horfton showing representative persistent features in regional flow field. Ail values shown are averaged over approximately 100 day period encompassing spring and early summer of 1984 (Bratkovich 1969).
The relationship between surface winds and 70 m depth level currents is examined for a selected time window and locations in Table 1. The correlation between subtidal wind and current fluctuations attains a maximum value of -0.73 at a time lag of +0.25 days for Station K alongshelf currents and alongshelf wind stress component measured at Buoy 46012 (Half Moon Bay). A positive time lag implies wind stress component fluctuations which lead current component fluctuations. There are also relatively high correlations (0.61) between Stations A and C and the alongshelf wind stress component estimated using buoy winds measured off Point Sal (Buoy 46011) at time lags of 0.5 and 0.0 days respectively. These correlation levels imply that 37 - 54% of the low frequency alongshelf current variance at 70 m depth on the shelf can be directly associated with local wind forcing. For these particular calculations, the 95% nonzero significance level corresponds to an 'artificial agree- of -4 to 10% of the alongshelf current variance with alongshelf surface wind stress.
For slope moorings at the 70 m depth level and local surface wind stress there are lower maximum significant correlation values (0.32 - 0.43), and the lag of maximum correlation tends to be longer (0.25 - 1.25 days, wind stress leading currents). Roughly characterized, the

Figure 5. Alongshelf geostrophic flow field for six transects along central California. Positive values are poleward (Chelton and Kosro 1987a).

Southem Califomla Blght Physlcal Oceanography Workshop
currents above the slope at the 70 m depth level appear to be much less responsive to 37.
local wind forcing than are the shelf currents at the same depth level. This finding is consistent with results based on local wind 36.
and current measurements from the Coastal Ocean Dynamics Experiment (CODE) (e.g., Winant et al. 1987) conducted on the 35' continental shelf and slope north of San Francisco Bay.
For the Piedras Blancas case, the alongshelf component of flow at 70 m opposes the alongshelf component of wind about 90% of the time and local maxima in poleward flow coincide with local minima in w equatorward winds about 75% of the time. Periods of slack equatorward winds are accompanied by poleward current 35
accelerations at depth of magnitude -0.0002 crn/s2. This acceleration value when balanced with an equivalent pressure gradient force 34
would be equivalent to a spatially averaged sea surface tilt of order 2 cmf100 km. A Figure 6a. Dynamic height contours (01500 m) for geostrophically balanced average onshore C4s rWofi Wdrogra~hic data employed are from flow of 5 cm/s would indicate that the local the cruise @Pbod- dated In the uPPe* right-hand value of the cross-shelf component of Corner Of each frame 1987). pressure gradient force (or equivalent sea surface tilt) in the region near Point Sal might exceed this spatially averaged value by a factor of two or more.
Seasonal Variability of Surface Winds and Subtidal Circulation
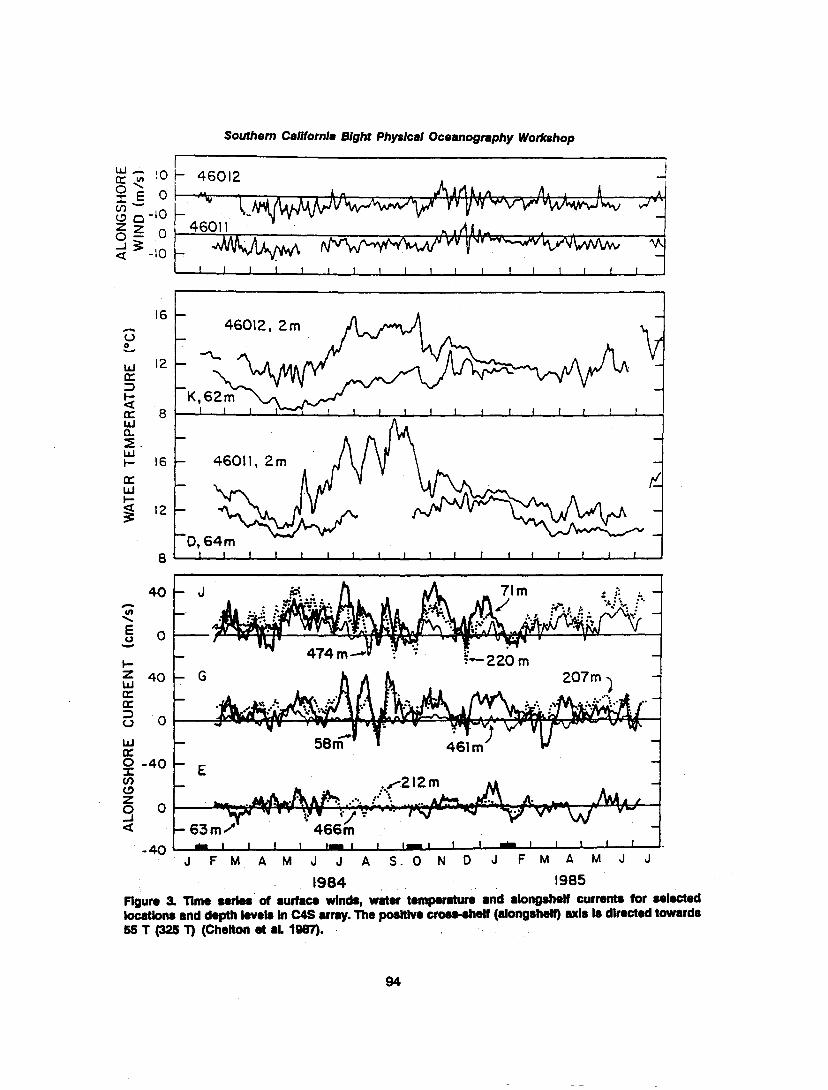
The seasonal cycles in oceanographic E 0 fields for this region are generally weak x compared to the synoptic and subsynoptic scale variability. One notable exception is the annual cycle in near surface watertemperature which responds on larger spatial scales to .seasonal variations in solar insolation and air
1 0 0 8 0 6 0 4 0 2 0 0 8060 40 20 0 temperature. The annual cycle in water DISTANCE OFFSHORE (km) temperature lags that of solar insolation by FIOun 6R veltlcrl af grartrophicaily several months due to the thermal inertia of ihrndpoimwqudowadvelocr(component the coastal water mass and the effects of tor a t r a m running porpendlcuiar to the coast vigorous upwelling favorable winds. List and to r station about 85 km offshore Point Pledras Koh (1976) analyzed long time series of water Bkn- Contour interval 5 cm/r and shaded temperatures at various locations along nQloM cormpond to @W*owa* flow. sum9 coastal California They found that the annual ym *- In the lower Ian corner
water temperature cycle was much smaller for of u c h frame (Chelton et rl. 1987).

A Bmtkovlch, RL Bemotein, D.B. Chelton, and P.M. Kosm Centmi California Coastal Circulation Study
Table 1. Maxlmum correlatlonr and corresponding tlme lags between 70 m alongshore currents at C4S moorlngs and alongshore wlnd stress. Alongshore Is detined by the major prlnclpal axes determlned from the February through July 1984 time series. Also ghren in the table are the 95% slgniflcance Ievek of the correlation8 (computed u In Cheton 1983), the percent varlance explained by the correlatlonr, and the lags of rnwlmum conelatlon. Po8thre lags lndlcate that currents lag wlnd streu Dashes Indicate that the conelatlon was not statldlcalfy slgniflcant at the 95% confidence level at any lag (From Chelton et al. 1988).
I Mooring Major Uind Max. 95% signif. X Var. Lag of Max.
Site Axis ('1) Buoy Correl . Level Explained Correl. (days)
Shelf Moorings
K 326.8 4601 2 0.73 0.34 53.3 0.25
F 304.1 4601 1 0.61 0.25 37.2 0.50
C 320.3 4601 1 0.61 0.26 37.2 0.00
A 302.0 4601 1 0.21
S 1 ope Moorings
L 352.1 46012 0.40 0.34 16.0 1.25
J 316.1 16028 0.32 0.31 10.2 1-00
G 328.0 4601 1 0.36 0.31 13.0 0.75
D 334.7 4601 1 0.43 0.21 18.5 , 0.25
B 284.9 4601 1 0.23
Central California stations (-3" C peak-to-trough) than for stations to the north or south (-8" C peak-to-trough). Nelson (1977') and Nelson and Husby (1983) indicate significant long-term average annual cycles in surface wind stress and surface heat flux for the Central California coast.
The C4S observation set was consistent with the above as illustrated in Figure 7. Near surface meteorological observations showed a strong annual cycle in surface water temperature (-5" C peak-to-trough). Over-water winds (as reported from coastal NDBC data buoys) were persistently upwelling favorable peaking in May at -9 m/s. Winds remain upwelling favorable at this location throughout the year, but weaken substantially in winter months. The 70 m depth horizon temperature measurements (see also Figure 8) showed a weak annual cycle (-2.5" C peak-to-trough). At this same depth horizon, the currents were consistently poleward peaking (-25 cm/s) in the last half of the year and diminishing to less than 10 cm/s in spring. Synoptic and subsynoptic variability appear to play a much more dominant role on the outer shelf and upper slope in this region.
Subtidal Wavelike Features
For the subtidal (less than 1 cpd) frequency range resolvable with this moored data set (an acceptable level of statistical stability can probably be achieved down to -0.03 cpd), sea surface and current variabiii should be due in part to the passage of long, wind-forced, frictionally modified, coastal-trapped waves (e.g., as described by Chapman (1987) for the
Figure 7. Monthly averaged data (doh are averages, sticks show standard deviation) for surface water temperature and winds (top), temperature and current. at Station F (middle frames), and temperature currents at Station G (bottom frames) for the Pledras Blancas transect (see Figure 1) (Bratkovich 1989).
A Bntkovich, R.L &mrte/n, D.B. Chalton, md P.M Korro C.ntml C.lifomla Cor8t.l Clrcu/aUon Study
CODE region) and to the response to local variations in the wind stress, bottom stress and pressure force components. The local wind-forced response is one dominant type of variability expected in this region as exhibited by the correlation levels of Table 1. Examining the time-space lagged correlation of sea surface fluctuations, currents, and winds over the array region, helps quantify the percentage variance contributed to variable fields of interest by wavelike disturbances propagating through the study region. If a limited number of wave modes (one or two) dominate the variability, and these modes have stable phase propagation characteristics, the modes should be readily identifiable in timespace domain statistics (cross-correlation functions).
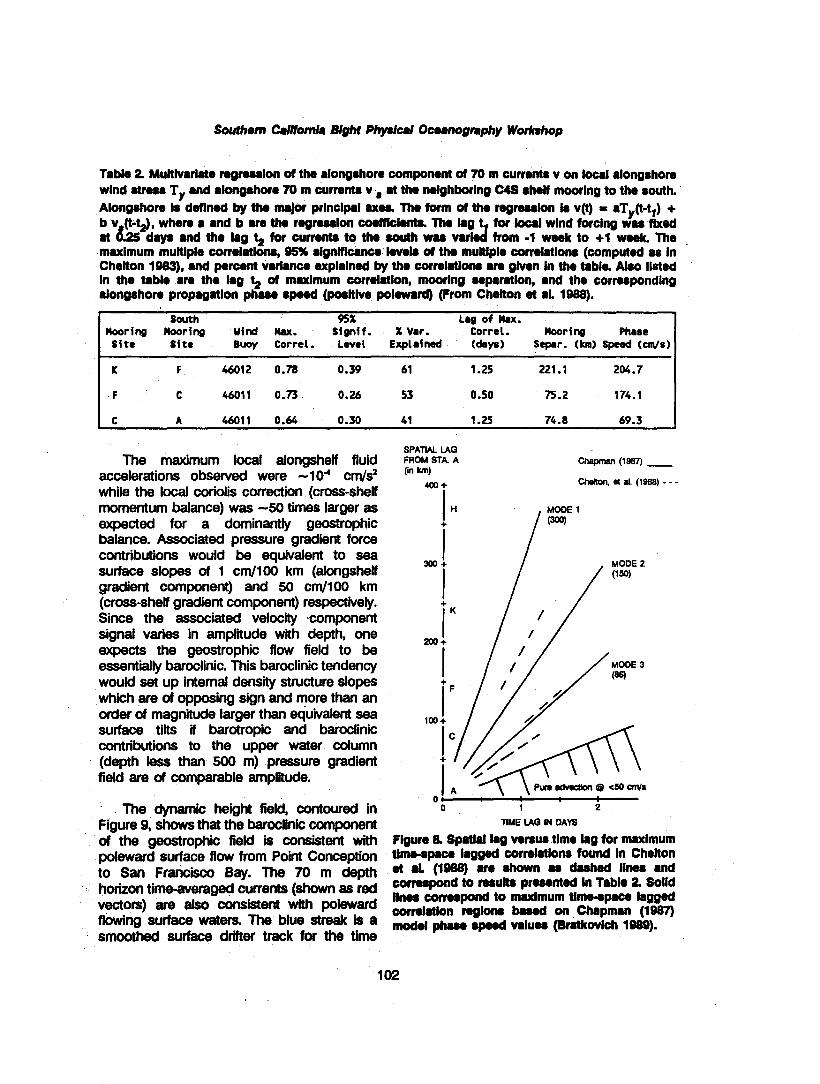
Table 2 shows results from a multivariate regression Zinaly~is derived from the first 6 months of the 70 m depth current and offshore wind data The alongshelf current fluctuations at a given outer shelf location were regressed on local alongshelf wind stress component at fixed lag (wind stress leads by 0.25 days) and alongshelf currents at 70 m depth for the next most equatorward outer shelf mooring location. These results give an indication of the relative importance of poleward propagating disturbances in the current field compared to local wind forcing effects. The highest correlation values observed range from 0.64 at Station C to 0.78 at Station F with 41% and 61% of the current variance explained respectively. The alongshetf propagation speed associated with the lag for maximum correlation was 69.3 and 204 cm/s respectively.
Comparing these results to those used to evaluate the effect of local wind forcing (see Table I), one can estimate, to first order, the relative contributions of local wind forcing and subtidal wavelike effects with respect to shelf currents. By adding terms due to wavelike effects, the percent variance explained at a given outer shelf location increases by roughly 5 to 15%. While this contribution is a significant part of the total variance explained, it appears that the response to local wind forcing is a more significant determinant of alongshelf current variabili than poleward propagating wavelike disturbances. Nevertheless, the phase speed values derived from this analysis are in a realistic range for continental shelf waves (e.g., Chapman 1987) as illustrated in Figure 8.
Energetic Events
The most energetic current amplitude and variabili episodes observed in the C4S region during the limited observation period occurred during late summer 1984 between Point Sal and Monterey Bay. Three energetic pulses of poleward flow in the 40-60 cmls amplitude range (-70 m depth horizon, Piedras Blancas and Point Sur) were spaced by -30 days. The stack plots in Figure 3 show the detailed variabili of physical fields during this timeframe. The middle pulse was preceded and followed by more equatorward (less poleward) directed currents. The peak-to-trough ampliude of these oscillations approached 70 cmfs and was easily identifiable at the 220 m depth level where their amplitude was attenuated by -30%. There was no d i m a b l e signal in the current field at 470 m associated with these pulses.
Southern C.Illomk BlgM PhyrIcaf Ocm8nognphy Workrhop
Tabk 2 Mutthrarlrte rogresslon of the alongshore Component of 70 m currents v on local alongshore wlnd strou Ty m d alongshore 70 m cumnts v ,8t tho neighboring C4S shelf mooring to the south. Alongshore k defined by tho major princlpmi 8x08. Tho form of tho rogrwrlon k v(t) = aTy(t-t,) + b v (t-9, where a and b are tha r o g r d o n wdfi~knt8. Tho for local wind forcing w u fked 8t &S days and the k g 4 for currents to ths 8outh wa8 from -1 week to +I week. The maximum multlpk cornllions, 05K signnlcmu level8 ot tho muttipk comlatlons (computed u in Chetton 1983). and percent varknco awpialned by the conektionr am ghren In the tabla Ako Ilsted In the t8ble are the k g 12 of maxlmum correlrUon, moMlng separ8tlon. and the corresponding alongshore propaglion phuo speed (posltlve polward) (From Chetton at 81 1988).
P
South 95% Lag of Max. Mooring Mooring Uind Max. Signif. % Var. Correl . Moor i ng Phase Site Site Buoy Correl. L w e l Explained (days) Separ. (ka) Sped (cm/s)
K F 46012 0.78 0.39 61 1.25 221.1 204.7
The maximum local alongshelf fluid accelerations observed were -104 cm/sz while the local corioiis correction (cross-shelf momentum balance) was -50 times larger as expected for a dominantly geostrophic balance. Associated pressure gradient force contributions would be equivalent to sea surface slopes of 1 crn/100 km (alongshelf gradient component) and 50 cm/100 km (cross-shelf gradient component) respectively. Since the associated velocity .component signal varies in amplitude with depth, one expects the geostrophic flow field to be essentially baroclinic. This baroclinic tendency would set up internal density structure slopes which are of opposing sign and more than an order of magnitude larger than equivalent sea surface tilts if barotropic and baroclinic contributions to the upper water column (depth less than 500 m) pressure gradient field are of comparable amplitude.
The dynamic height field, contoured in Figure 9, shows that the baroclinic component of the geostrophic field is consistent with poleward surface flow from Point Conception to San Francisco Bay. The 70 m depth horizon time-averaged currents (shown as red vectors) are also consistent with poleward flowing surface wat- The Mue streak is a smoothed surface drifter track for the time
SPATIAL LAG FROM STA. A Cm km)
400+ I
chaprmur (l98/) - Cheltci-~, et al. (1988) - - -
MODE 2 (1.50)
TIME LAG IN DAYS
Figure a SpaWal k g venur tima k g for maximum tlme-spaco lagged correlations found in Chetton a .I. (lese) are shown u dashed llnes and correspond to m u b pro8ented In Table 2 Solid lines wrre8pond to mo<imum tim-spmco lagged conektion roglonr b88d on Chap- (1987) modd phaw spood valuw (Brlkwlch 1989).

R Bratkovlch, R.L Bernsteln, D.8. Chatton, and P.M. Kosro Cantml CallMomla Coast81 CSrculatlon Sfudy
Figure Q. SST tmagev for 24 July 1984. Overlay contours are surface dynamlc hefgM relative to 500 m level (In dyn-cm) derlved from CalCOFl sunrey data spannlng 15-28 July. Light blue streak Is a smoothed surface drlfter track for perlod 32-20 Juv. Red vectors are W a y time average af 70 rn depth level currents from C43 array for perlod 22-28 July. Data comporke was produced by 8. L Rernsteln and c~workers at SeaSpace (Bratkmlch et ab 1993).
period 12-20 July which is consistent in orientation with the flow a€ 70 rn off Piedras Blancas and, for this specific case, the associated surface drifter and measured current speeds are af comparable amplitude (-40 cmJs).
The sea surface temperature (SST) signature of this poleward flow event is very evidl Figure 9, which shows a plume of wanner water (darker shades) extending poleward fro111 Irre western Santa Barbara Channel towards San Francisco Bay. For the later half of July, SST measured at the dour NDBC buoys between the Channel Islands and San Francisco Bay show elevating surface temperatures which peak in the last half of Ju!y and then subside (2 to 4" C) by early August This signal structure is partly due to the subsidence of upwelling favorable win& along this portion d coast during the first half of July followed by the reestablishment of upwelling favorable wind conditions in last July and on into August. R is clear from the data presented in Figure 9, that to some degree, the alongshe# poleward advection of heal : also
Southern Clllfomla Bight Phpicai Oceanogmphy Workshop
plays an important role in influencing SST conditions, especially in the southern half of the region.
Analysis Associated with an Actual 011 Spill Event
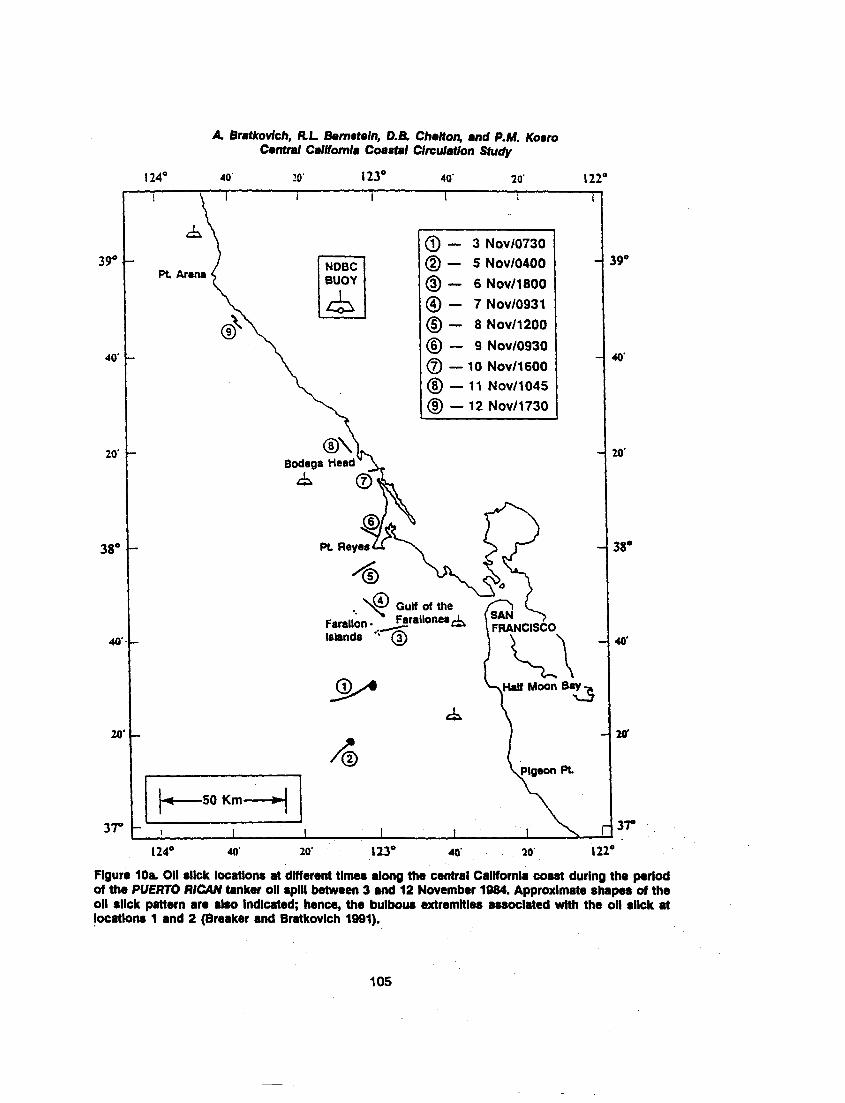
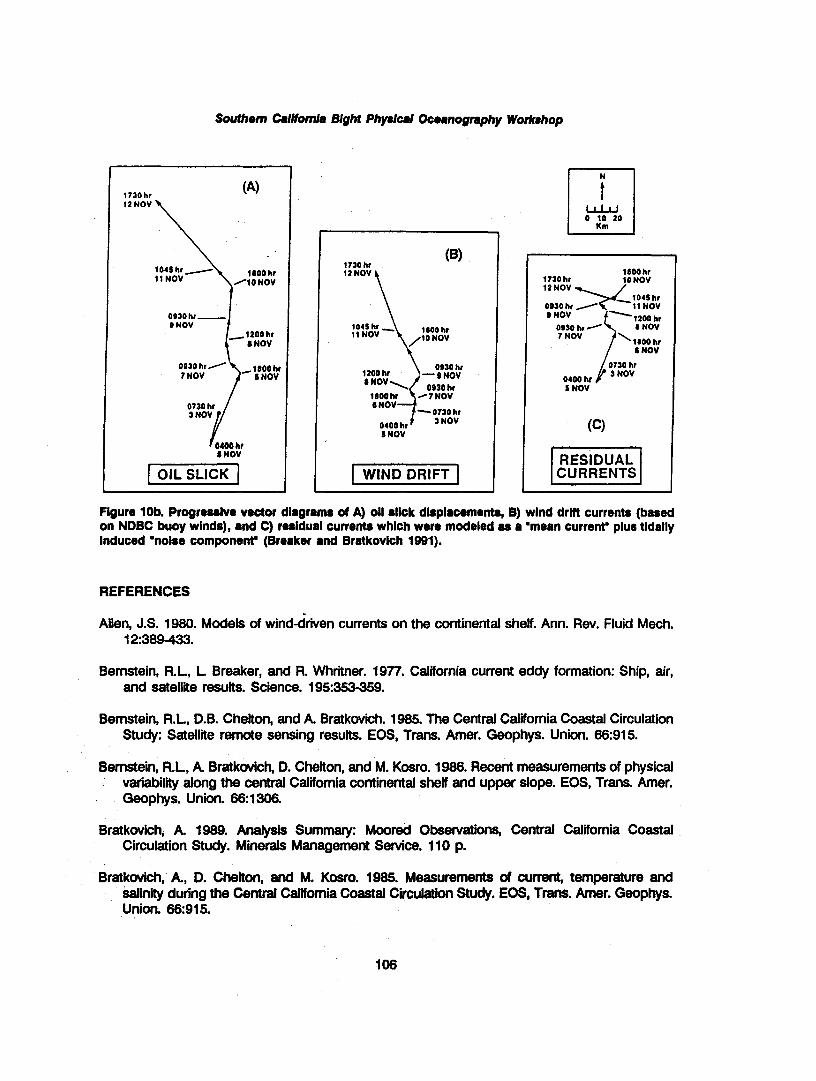
Breaker and Bratkwich (1991) have reported resuks associated with an oil spill ihich occurred near the northern edge of the C4S study region close to the midpoint of the observation period. The oil slick path is shown by the time sequence of locations and times in Figures 10a and lob. A simple estimator for oil slick location was constructed using three components: advection by 'mean' currents, drift due to surface wind forcing, and displacement perturbations due to tidal currents (which can be significant near the mouth of San Francisco Bay). Using historical values (determined a prion] of mean current (6 cm/s to the NW), wind drift coefficient (3.5% of surface wind speed), and tidal current ellipses for the region, -70% of the mean square oil slick displacement could be accounted for using this model. About 90% of the mean square displacement could be accounted for using a 'best fir value for wind d i i coefficient (-4.4% of surface wind speed). A reversal in oil slick direction early in its evolution could be attributed to the onset of a large scale reversal in shelf currents. This conclusion was reachedusing indirect evidence associated with advection of large scale temperature gradients and regionally averaged rates of change in the surface temperature field.
The accurate hindcasting or prediction of oil spill trajectories appears to be technically feasible, but practically out of reach. We still do not have the necessary coastal observation networks and the near-real-time communication and modeling components required to provide logistical guidance for environmental emergencies like the case reported and analyzed above.
ACKNOWLEDGMENTS
The work was funded by the Minerals Management Service, U.S. Department of the Interior under contract to Raytheon Service Company (RSC) as part of the analysis component of the Central California Coastal Circulation Study. We would like to acknowledge the key roles D. Cook, R. Tait (RSC) and S. Larson (MMS) played in the management of the overall project. D. Lindner, G. Parker, N. Plutchak, M. Speranza and W. Van Ana coordinated and executed the field observation program for Raytheon Service Company. M. Falla and G. Davis (RSC) processed and organized the extensive time series data base. T. Kan, J. Faulkner, and I. Wang organized the time series data base and were instrumental in the overall data analysis activity for this component of C4S. The support of the Center for Earth Sciences, University of Southern California, and of the NOAA Great Lakes Environmental Research Laboratory is gratefully acknowledged by A.B.
A Brrrtkovlch, R.L Bemsteln, D.B. CheCton, and P.M. Korro Central Calffornla Coastal Cimuletion Study
1 2 4 O 40 20 123" 40' 20' l 2r0
- 39O
40' - - 40'
20' - - 20'
38O -
40' -
20. - - 20'
1 2 4 O 40' 20' In0 40' 20 1 21°
Figure 10a. 01 slick locations at different times along the central California coast during the period of the PUERTO /?/CAN tanker oil spill between 3 and 12 November 1984. Approximate shape8 of the oil slick pattern are also Indicated; hence, the bulbow extremities rurcloclated with the oil slick at locations 1 and 2 (Breaker and Bratkovich 1991).
Southem CaIlfomIa BIgM PhyrIcd Oceanography Worbhop
1730 hr 12 NOV
(A)
\ 1045 hr / 11 NOV
1600 hr H O N O V
0710 hr
0400 hr S NOV
1730 hr (B)
l2NOV
1200 hr 0930 hr - fi NOV
093Ohr yi"o"V'407 -07JOhr
0400 hr 5 NOV
1600 hr 1730 hr lONOV 12NOV
0930 hr / 9 NOV
0930 hr / 7 NOV
0400 ht 5 NOV
(C)
Figure lob. Progressive vector diagrams of A) oil slkk displawments, B) wind drift currents (based on NDBC buoy winds), and C) residual currents which were modeled as a 'mean current' plus tidally induced 'noise component' (Breaker and Bratkovich 1991).
REFERENCES
Allen, J.S. 1980. Models of winddriven currents on the continental shelf. Ann. Rev. Fluid Mech. 12:389-433.
Bemstein, R.L, L Breaker, and R. Whritner. 1977. California current eddy formation: Ship, air, and satellite results. Science. 195:353-359.
Bemstein, R.L, D.B. Chelton, and A Bratkwich. 1985. The Central California Coastal Circulation Study: Satellite remote sensing results. EOS, Trans. Amer. Geophys. Union. 66:915.
Bernstein, R.L, A Bratkovich, D. Chelton, and M. Kosro. 1986. Recent measurements of physical variability along the central California continental shelf and upper slope. EOS, Trans. Arner. Geophys. Union. 663306.
Bratkovich, A 1989. Analysis Summary: Moored Observations, Central California Coastal Circulation Study. Minerals Management Service. 1 10 p.
Bratkovich, A, D. Chelton, and M. Kosro. 1985. Measurements of current, temperature and salinity during the Central California Coastal Circulation Study. EOS, Trans. Amer. Geophys. Union. 66:915.
A. Bntkovich, R-L Bemstein, 0.6. Chelton, and P.M. Kosro Centrcll Callfomla Coastal Clrculaffon Study
Bratkwich, A., T. Kan, and J. Faulkner. 1988. Central California Coastal Circulation Study: Moored observations January 1984 through July 1985. Minerals Management Service. 31 p.
Bratkovich, A,, R.L Bernstein, D.B. Chelton, and P.M. Kosro. 1991. The Central California Coastal Circulation Study: Flow characteristics and forcing. Draft manuscript for submission to the J. Geophys. Res. 67 p.
Breaker, LC., and A. Bratkovich. 1991. Oceanic processes contributing to the displacement of oil spilled off San Francisco by the M N Puerto Rican. Submitted to Oil and Chemical Pollution. 46 p.
Brink, KH. 1983. The near-surface dynamics of coastal upwelling. Prog. Oceanogr. 12223-257.
Chapman, D.C. 1987. Application of wind-forced, long, coastal-trapped wave theory along the California coast. J. Geophys. Res. 92: 1798-1 81 6.
Cheton, D.B. 1984. Seasonal variability of alongshore geostrophic velocity off Central California J. Geophys. Res. 89:3473-3486.
Chelton, D.B. 1987. Central California Coastal Circulation Study Drifter Observations February, July, October 1984 and January 1985, Oregon State University. Report 130. 24 p.
Chelton, D.B., R.L Bernstein, A. Bratkwich, and M. Kosro. 1987. The Central California Coastal Circulation Study. EOS, Trans. Amer. Geophys. Union. 68:l-13.
Chelton, D.B., and P.M. Kosro. 1987a Central California Coastal Circulation Study CTD Observations, Cruise 8401, February 1984, Oregon State University. Report 126. 34 p.
Cheton, D.B., and P.M. Kosro. 1987b. Central California Coastal Circulation Study CTD Observations, Cruise 8403, July 1984, Oregon State University. Report 127. 36 p.
Chelton, D.B., and P.M. Kosro. 1987c. Central California Coastal Circulation Study CTD Observations, Cruise 8404, October 1984, Oregon State University. Report 128. 39 p.
Chelton, D.B., and P.M. Kosro. 19874. Central California Coastal Circulation Study CTD Observations, Cruise 8501, January 1985, Oregon State University. Report 129. 28 p.
Chelton, D.B., A. Bratkovich, R.L Bernstein, and M. Kosro. 1988. Poleward flow off Central California during the spring and summer of 1981 and 1984. J. Geophys. Res. 931 0604- 1 0620.
Hickey, B.M. 1979. The California Current System - hypothesis and facts. Progr. Oceanogr. 8~191-279.
Hickey, B.M., and N.E. Pola 1983. The alongshore pressure gradient on the west coast of North America J. Geophys. Res. 88:7623-7633.
Southom Califomla Bight Physical Ocwnogmphy Worlnhop
Huyer, A. 1983. Coastal upwelling in the California Current System. Prog. Oceanogr. 12:259-284.
Huyer, A., E.J.C. Sobey, and R.L Smith. 1979. The spring transitions in currents over the Oregon continental sheff. J. Geophys. Res. 84:6995-7011.
List, E.J., and R.C.Y. Koh. 1976. Variation in coastal temperatures on the southern and central California coast. J. Geophys. Res. 81 :1 971 -1 979.
Lynn, R.J., K.A. Bliss, and LE. Eber. 1982. Vertical and horizontal distributions of seasonal mean temperature, salinity, sigma-t, stability, ctynamic height, oxygen, and oxygen saturation in the California Current, 1958-1 978. CalCOFl Atlas 30, Univ. of California, San Diego. 51 3 p.
McClain, D.R., and D.H. Thomas. 1983. Year-to-year fluctuations of the California countercurrent and effects on marine organisms. CalCOFl Rep. 24: 1651 81.
Munk, W.H., F. Snodgrass, and M. Wimbush. 1970. Tides offshore: Transition from California coastal to deep sea waters. Geophys. Fluid Dyn. 1 :161-235.
Nelson, C.S. 1977. Wind stress and wind stress curl over the California Current. NOAA Tech. Rep. NMFSSSRF-714. 87 p.
Nelson, C.S., and D.M. Husby. 1983. Climatology of surface heat fluxes over the California Current region. Tech. Rep. NMFS SSRF-763, NOAA, National Marine Fisheries Service, Washington D.C. 155 p.
Reid, J.L, Jr., G.I. Roden, and J.G. Wyllie. 1958. Studies of the California Current System. CalCOFl Reports. 5:28-57.
Reid, J.L, Jr., and R.A. Schwartzlose. 1962. Direct measurements of the Davidson Current off Central California J. ~ e o p h ~ s . Res. 67:2491-2497.
Schwartzlose, R.A 1963. Nearshore currents of the western United States and Baja California as measured by drift bottles. CalCOFl Reports. 9:1522.
Smith, R.L 1968. Upwelling. Oceanogr. Mar. Biol. Ann. Rev. 6:1146.
Sverdrup, H.U., M.W. Johnson, and R.H. Fleming. 1942 The Oceans. Prentice-Hall, Englewood C l i i , N. J. 1060 p.
Traganza, E.D., D.A. Nestor, and AK McDonald. 1980. Satelliie observations of a nutrient rich upwelling off the coast of California J. Geophys. Res. 85:41014106.
Wickham, J.B. 1975. Observations of the California Cwntercurrent. J. Mar. Res. 333325340.
Winant, C.D., and AW. Bratkovich. 1981. Temperature and currents on the southern California shelf: A description of the variability. J. Phys. Oceanogr. 11:71-86.
Winant, C.D. 1980. Coastal circulation and wind-induced currents. Ann. Rev. Fluid Mech. 12:271-301.
A. Bmtkovlch, RL Bemrteln, D.B. Chelton, and P.M. Korro Cmntrcll Califomla Coastal Clrculatfon Study
Winant, C.D., R.C. Beardsley, and R.E. Davis. 1987. Moored wind, temperature and current observations made during Coastal Ocean Dynamics Experiments 1 and 2 wer the Northern California continental shetf and upper slope. J. Geophys. Res. 92:1569-1603.
Wyllie, J.G. 1966. Geostrophic flow of the California Current at the surface and at 200 m. CalCOFl Atlas 4, Univ. of California, San Diego.
Yoshida, K. 1980. The coastal undercurrent - a role of longshore scales in coastal upwelling dynamics. Prog. Oceanogr. 9:83-131.
OCS Study t
MMS 91-0035
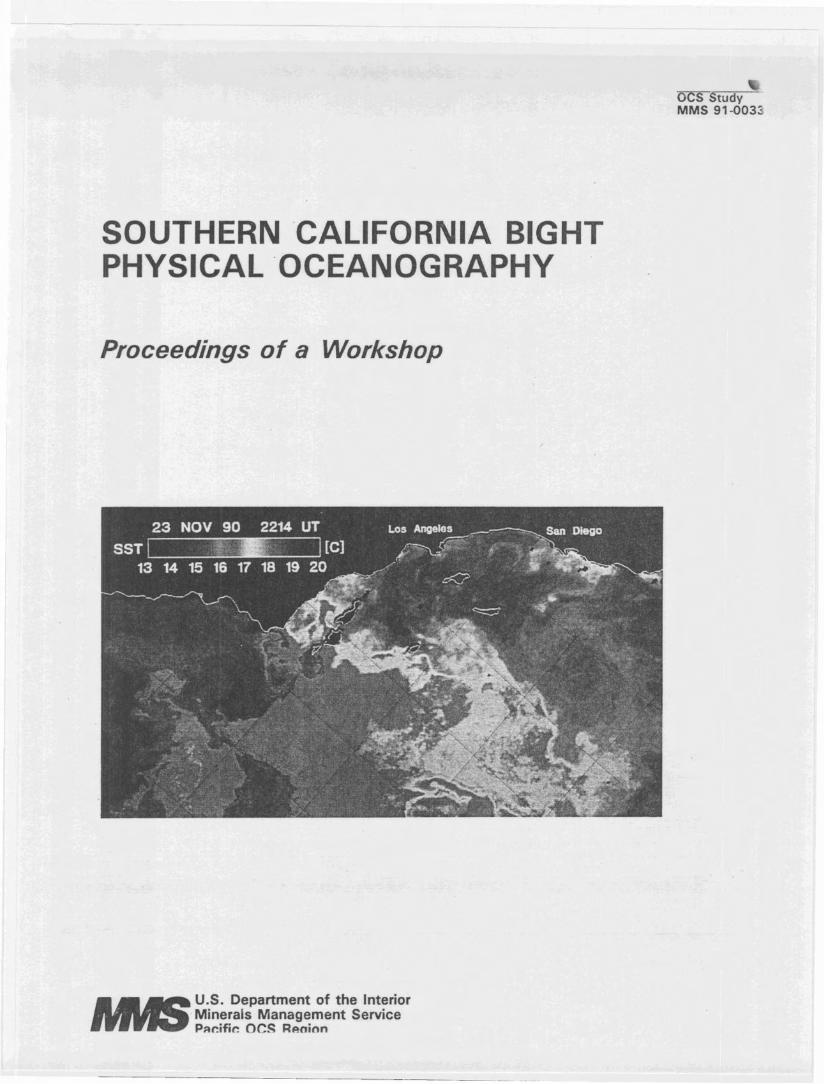
SOUTHERN CALIFORNIA BIGHT PHYSICAL OCEANOGRAPHY
Proceedings of a Workshop
U.S. Department of the Interior Minerals Management Service Padfie nCs R~ninn
- .. - - - . - - - - -
As the Nation's principal conservation agency, the Department of the Interior has responsibility for most of our nation- ally owned public lands and natural resources. This includes fostering the wisest use of our land and water re- sources, protecting our fish and wildlife, preserving the environmental and cul- tural values of our national parks and historical places, and providing for the enjoyment of life through outdoor recrea- tion. The Department assesses our en- ergy and mineral resources and works to assure that their development is in the best interest of all our people. The De- partment also has a major responsibility for American Indian reservation com- munities and for people who live in Island Territories under U.S. Administration.