central wetlands unit subsidence
TRANSCRIPT

8/10/2019 Central Wetlands Unit Subsidence
http://slidepdf.com/reader/full/central-wetlands-unit-subsidence 1/34
Wetlands Loss in the Central Wetlands Unit
Coastal Louisiana
by Chris McLindon

8/10/2019 Central Wetlands Unit Subsidence
http://slidepdf.com/reader/full/central-wetlands-unit-subsidence 2/34
Central Wetlands Unit
This is the USGS Land Area Change Map. It shows the “hot spots” of change (or land loss) as colored patches that are
coded by the time period in which the wetlands were lost. The Central Wetland Unit (CWU) is unique in that it
encompasses a portion of the major metropolitan area of the city of New Orleans. The Unit includes a hot spot of land
area change that has received a lot of public attention, and has been discussed in the popular media more than any
other single area on the coast. An evaluation of the geology of the area reveals that there is a highly probable
explanation for the land area change that has occurred at this location, and that explanation is not consistent with any
other explanations that have been offer in the popular media. The land area change in CWU is considered here to be
an excellent example of the relatively isolated effects of near surface sediment compaction.
Couvillion, B.R.,et.al, 2011, Land
area change in coastal Louisiana from
1932 to 2010: U.S. Geological Survey
Scientific Investigations Map 3164,
scale 1:265,000, 12 p. pamphlet.

8/10/2019 Central Wetlands Unit Subsidence
http://slidepdf.com/reader/full/central-wetlands-unit-subsidence 3/34
Schleifstein, M, 11/15/2011 New signs explain importance of
restoring cypress in Bayou Bienvenue Wetlands Triangle next to
the Lower 9th Ward, NOLA.com, The Times-Picayune
The Bayou Bienvenue Wetland Triangle refers to the triangular-shaped body of open water that is immediately adjacent
to the Lower 9th Ward of New Orleans. This plaque was placed at the end of the 9th ward, shown in red, and
overlooking the open water. The text of the plaque captures the essence of the popular conception of coastal change –
that saltwater intrusion caused by the digging of canals killed the cypress trees that once lived there and eroded the
land. It also frames the goal of the restoration movement – that the wetlands that supported the cypress swamps can
be restored to the way they were in the past. The overwhelming revelation of examining all of the hot spots of land loss
in detail is the land area change is primarily the result of natural subsidence. The same is true here, and there is no
way to reverse the natural processes.

8/10/2019 Central Wetlands Unit Subsidence
http://slidepdf.com/reader/full/central-wetlands-unit-subsidence 4/34
This U.N.O. research team assessed the causes of land
area change as shown by color code. It is the
construction of the Intercoastal Waterway and the MRGO
that account for the bulk of the direct removal in this area.
However, counter to popular conception, the team
attributed no erosion of wetlands surface to a directconnection with either of these waterways. As is the case
across the coastal plain the largest cause of change here
is due to submergence of the wetlands below the surface.
It is the change in slope of the marsh surface caused by
subsidence that allows salt water to flow into area.
Throughout the history of the delta cycle this type of
change in hydrology has resulted in a change in biology.
The death of the cypress trees is also totally natural.
Fearnely, S. et.al., 2001, Mapping the Geomorphology and Processes of
Coastal Land Loss in the Pontchartrain Basin: 1932 to 1990 and 1990 to
2001, Journal of Coastal Research, No. 10054, p. 48-58
27%
9%
64%

8/10/2019 Central Wetlands Unit Subsidence
http://slidepdf.com/reader/full/central-wetlands-unit-subsidence 5/34
The mechanisms of subsidence in CWU are directly tied to its geologic history, and therefore to the sedimentary
substrate below the surface. These sediments record a fairly complex history that includes:
1. The formation of a set of barrier islands that was an extension of the present day chain of barrier
islands off the coast of Mississippi
2. The submergence of those islands and subsequent burial by deltas of the Mississippi River
3. The formation of point bar and natural levee deposits of later channels of the river that built out over
the subsiding delta, and
4. The formation of swamp and marsh deposits in the low lying areas off of the natural levees that
accumulated thick layers of organic peat deposits.
The following sequence of slides will attempt to represent a reconstruction of the recent geologic history of the
area, and to delineate the major components of the sedimentary substrate resulting from that history. The
patterns of subsidence that are being experienced at the surface today can then be examined in context with
these critical components.
The first three slides illustrate the development of the first seven of the sixteen deltas of the late Holocene Epoch
that were defined by David Frazier in 1967. These slides are used here to show the burial of the Pine Island
barrier island chain, and the later channels of the Mississippi River that crossed the area between about 3,500
and 4,500 years ago. The next slides in the sequence will incorporate the detailed mapping of elements of the
shallow sedimentary layers by Rogers, et.al., 2008. These include maps of the top of the barrier island deposits
and the thickness of the organic peat layer. The detailed work of Rogers is then incorporated with the patterns of
subsidence that have been mapped across the area by Dixon, et.al., 2006.
The conclusion of this examination will be that the submergence of the Bayou Bienvenue Wetland Triangle is
due primarily to the subsidence of the area resulting from a deep rooted tectonic subsidence combined with near
surface sediment compaction. Dokka, et.al., 2011 showed that the primary mechanism of subsidence across the
New Orleans Land Bridge in the northeastern corner of the CWU has been the activity of faults at the surface,
and the extraction of water from shallow sedimentary layers.
8/10/2019 Central Wetlands Unit Subsidence
http://slidepdf.com/reader/full/central-wetlands-unit-subsidence 6/34
5,500 years before present
6 2 1 05
Thousand Years Before Present
4 3
1
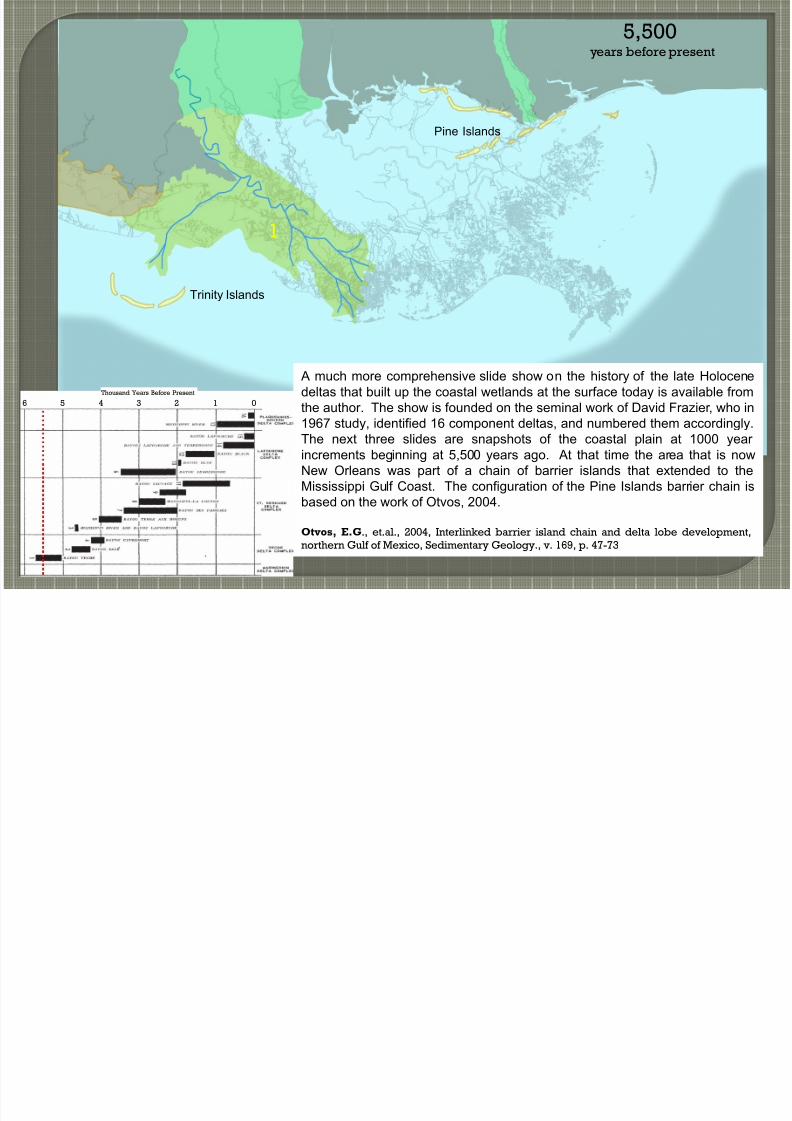
A much more comprehensive slide show on the history of the late Holocene
deltas that built up the coastal wetlands at the surface today is available from
the author. The show is founded on the seminal work of David Frazier, who in1967 study, identified 16 component deltas, and numbered them accordingly.
The next three slides are snapshots of the coastal plain at 1000 year
increments beginning at 5,500 years ago. At that time the area that is now
New Orleans was part of a chain of barrier islands that extended to the
Mississippi Gulf Coast. The configuration of the Pine Islands barrier chain is
based on the work of Otvos, 2004.
Otvos, E.G., et.al., 2004, Interlinked barrier island chain and delta lobe development,
northern Gulf of Mexico, Sedimentary Geology., v. 169, p. 47-73
Trinity Islands
Pine Islands

8/10/2019 Central Wetlands Unit Subsidence
http://slidepdf.com/reader/full/central-wetlands-unit-subsidence 7/34
4,500 years before present
2
3
Frazier’s Delta #3 was the first incursion of the Mississippi River to the
eastern part of the coastal plain in the late Holocene about 4,500 years ago.
It appears to have cut a fairly straight path across the shallow waters thatcovered the area at the time. The area of the French Quarter and the West
Bank would have probably been cypress swamps. This course of the river
was used over and over again throughout the Holocene, as it is used by the
most recent course of the river. It appears the repeated use of the same
course over time and the natural levees that were built up each time the
river took that course have given the French Quarter to Uptown areas the
stability that they exhibit. These natural levee areas are both high in
elevation and slow in subsidence.
6 2 1 05
Thousand Years Before Present
4 3

8/10/2019 Central Wetlands Unit Subsidence
http://slidepdf.com/reader/full/central-wetlands-unit-subsidence 8/34
3,500 years before present
6 2 1 05
Thousand Years Before Present
4 3
6
4
5
7
Within the 1,000 year period between 4,500 and 3,500 years ago fourdelta systems were active across the coastal plain. The river switched
back and forth depositing sediment to build up the coastal wetlands. The
outer fringes of deltas 4 and 6 have now subsided below the surface. In
this natural system a “no net loss” of wetlands cover was maintained
because every acre of wetlands that subsided below the surface in one
area was matched by an acre of newly created wetlands at the site of the
active delta. The channel of the river that fed delta 5 ran along the front of
the barrier island chain, and it forms the “backbone” of the Metairie and
Gentilly ridges that are highpoints of elevation in the metro area.

8/10/2019 Central Wetlands Unit Subsidence
http://slidepdf.com/reader/full/central-wetlands-unit-subsidence 9/34
3,500 years before present
6 2 1 05
Thousand Years Before Present
4 3
6
4
5
7
The inset photograph is profile of the subsurface from a pit dug off BullardRoad in New Orleans East. It clearly captures the superposition of
Mississippi delta deposits on the white sands of the barrier island. Most of
the marsh at the surface today around New Orleans was deposited by
delta 5, and this is a cross section of those deposits. Subsequent river
channels continued to provide sediment by overbank flooding until the
construction of levees beginning in the 19th century. The thickness of the
delta deposits (labeled “B”) shows that subsidence was active in the area
even 4,000 years ago. The islands sunk below the surface and the delta
built across them.

8/10/2019 Central Wetlands Unit Subsidence
http://slidepdf.com/reader/full/central-wetlands-unit-subsidence 10/34
2,500 years before present
6 2 1 05
Thousand Years Before Present
4 3
6
7
9
8
Bayou Jasmine Archeological Siteca. 800 BC
By 2,500 years ago the marshes created by deltas 6 and 7 were
subsiding below the surface and deltas 8 and 9 had built a vastexpanse of wetlands across what are now Breton and Chandeleur
Sounds. Archeological sites in the area strongly suggest that this
complex ecological system of cypress swamps and fresh and saline
marshes was inhabited by native people. This vast ecosystem
succumbed to subsidence over the next few hundred years. The
cypress swamps were drowned and died off and the marshes went
through a natural progression from freshwater to brackish to saline, andfinally to open water bays as the subsided below the surface.
Outer Islands
8/10/2019 Central Wetlands Unit Subsidence
http://slidepdf.com/reader/full/central-wetlands-unit-subsidence 11/34
2,500 years before present
6 2 1 05
Thousand Years Before Present
4 3
6
79
8
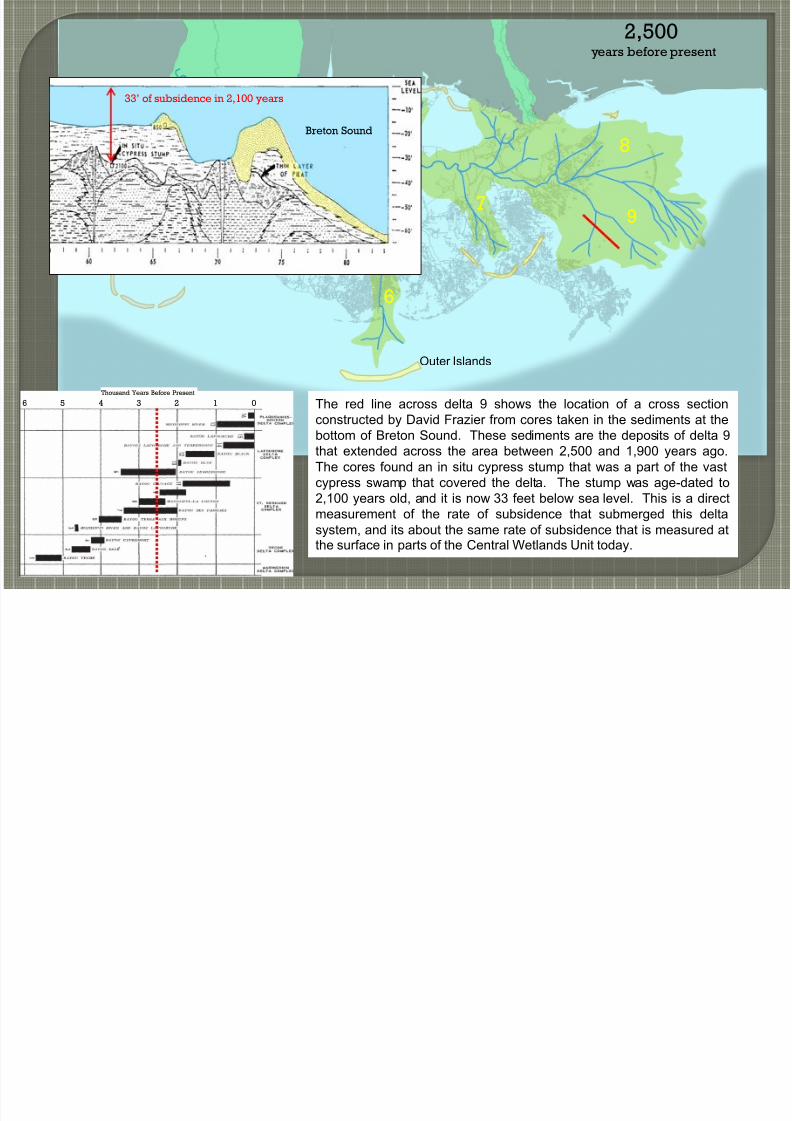
The red line across delta 9 shows the location of a cross section
constructed by David Frazier from cores taken in the sediments at thebottom of Breton Sound. These sediments are the deposits of delta 9
that extended across the area between 2,500 and 1,900 years ago.
The cores found an in situ cypress stump that was a part of the vast
cypress swamp that covered the delta. The stump was age-dated to
2,100 years old, and it is now 33 feet below sea level. This is a direct
measurement of the rate of subsidence that submerged this delta
system, and its about the same rate of subsidence that is measured atthe surface in parts of the Central Wetlands Unit today.
Outer Islands
Breton Sound
33’ of subsidence in 2,100 years
8/10/2019 Central Wetlands Unit Subsidence
http://slidepdf.com/reader/full/central-wetlands-unit-subsidence 12/34
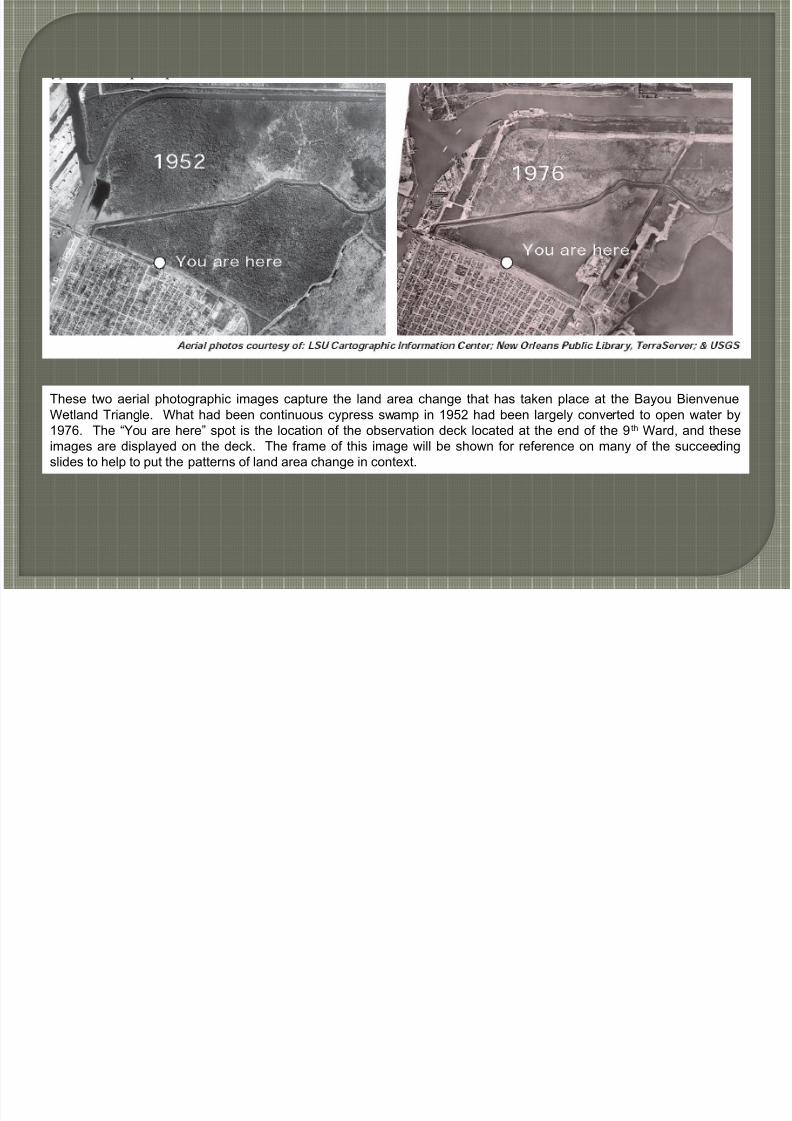
These two aerial photographic images capture the land area change that has taken place at the Bayou Bienvenue
Wetland Triangle. What had been continuous cypress swamp in 1952 had been largely converted to open water by1976. The “You are here” spot is the location of the observation deck located at the end of the 9th Ward, and these
images are displayed on the deck. The frame of this image will be shown for reference on many of the succeeding
slides to help to put the patterns of land area change in context.

8/10/2019 Central Wetlands Unit Subsidence
http://slidepdf.com/reader/full/central-wetlands-unit-subsidence 13/34
This slide attempts to put the 1952 aerial photograph from the Bayou Bienvenue Triangle in historical context. The
inset image on the left is a portion of the 1878 Hardee Map of New Orleans taken from Rogers, 2008. It shows the
limits of urban development that extended out to the Metairie and Gentilly Ridges, that are underlain and supported by
the distributary channel deposits, and a depiction of the cypress swamps that extended out to Lake Pontchartrain from
there. It is not hard to envision that the entire area from the banks of the river to the lake and marshes had once been
cypress swamp. The area of Bayou Bienvenue was the last undeveloped portion of the swamp that had not been
drained for development. It is very likely that the process of draining and desiccating the swamp and marsh deposits
for development contributed to the subsidence of the area.
Roger.J.D., 2008, Development of the New Orleans Flood Protection System prior to Hurricane Katrina. Journal of Geotechnical and
Geoenvironmental Engineering, v. 134, p. 602-617

8/10/2019 Central Wetlands Unit Subsidence
http://slidepdf.com/reader/full/central-wetlands-unit-subsidence 14/34
The frame of the Bayou Bienvenue Wetlands photographs is shown here superimposed in red on a map of the principal
geological elements of the area taken from Rogers, et.al. 2008. The Pine Island chain of barrier islands is shown in
orange stippled pattern, the abandoned distributary channels of the Mississippi River from the historical deltas that
buried the island are shown in yellow hashed pattern, and the point bar deposits of the modern river channel are shown
in yellow stipple. It is central to an understanding of near surface subsidence that the distributary channel and point bar
deposits of the river are much more stable and resistant to subsidence due to compaction than the highly organic
deposits of the swamps and marshes that were situated between them. The Bayou Bienvenue Triangle is centered in a
roughly triangular shaped area that is bounded on its north side by the relatively stable distributary channel deposits
and on its south side by the equally stable point bar deposits of the modern channel.
Roger, J.D., et.al., 2008, Geologic Conditions Underlying the 2005 17
th
Street Canal Levee Failure In New Orleans, Journal of Geotechnicaland Geoenvironmental Engineering, v. 134, p. 583-601
ROGERS, et.al., 2008

8/10/2019 Central Wetlands Unit Subsidence
http://slidepdf.com/reader/full/central-wetlands-unit-subsidence 15/34
16
0
0
Both of these maps are also taken from Rogers, et.al., 2008. On the left is a contour map of the thickness of peat
deposits that accumulated from organic material of the marsh and swamps. The contour values were enlarged for
visibility here, but both of these maps will be presented again at a larger scale. The thickest accumulation of peat is the
16 feet that directly underlies Bayou Bienvenue. The map on the right is the depth to the top of the barrier island
deposits. Depth contours range in value from 10’ to 30’ below the surface. The distributary channel deposits that lie just
along the southern boundary of the island deposits are also shown. The axis of the barrier islands clearly guided the
orientation of the distributary channels. It is the distributary channels that underlie the Metairie and Gentilly Ridges.
These maps will be placed in their proper geographic context in subsequent slides, but it is obvious even at thisperspective that there is a relationship between the two. The thickest deposits of peat form a triangular shape that is
bounded on its north by the abandoned distributary channels and on its south by the current river channel. The
accumulation of sand in a barrier island or a point bar of a river is an aggradational processes in which sand deposits can
literally stack one on top of another and build up above a base level. Conversely, the accumulation of peat occurs at and
just below the surface, so that continued accumulation requires the creation of accommodation space by subsidence. In
this way the thickness of accumulated peat records historical subsidence. The triangular pattern of subsidence implied
by the peat thickness lies midway between axes of the stable areas on either side of it that resisted subsidence. The
following set of slides will put these maps in more direct context to each other and to the overall patterns of subsidence in
the area.
ROGERS, et.al., 2008ROGERS, et.al., 2008

8/10/2019 Central Wetlands Unit Subsidence
http://slidepdf.com/reader/full/central-wetlands-unit-subsidence 16/34
The radar illumination of the land surface is used to measure elevation with satellites. By continuous monitoring of this
data, the rate of subsidence of the land surface can be measured. This map published by Dixon, et.al., 2006 shows the
values of subsidence for the New Orleans area in mm/year. The maximum values over 20 mm/year were all measured
on the remaining land surfaces surrounding the Bayou Bienvenue Wetland Triangle. 20 mm is about ¾ of an inch per
year or about 8 inches per decade. The following sequence of slides will examine the subsurface geology of the area
to reveal the mechanisms of subsidence.
Dixon, T.H., et.al., 2006, Subsidence and flooding in New Orleans, Nature, v. 441, p. 587-588
DIXON, 2006
8/10/2019 Central Wetlands Unit Subsidence
http://slidepdf.com/reader/full/central-wetlands-unit-subsidence 17/34
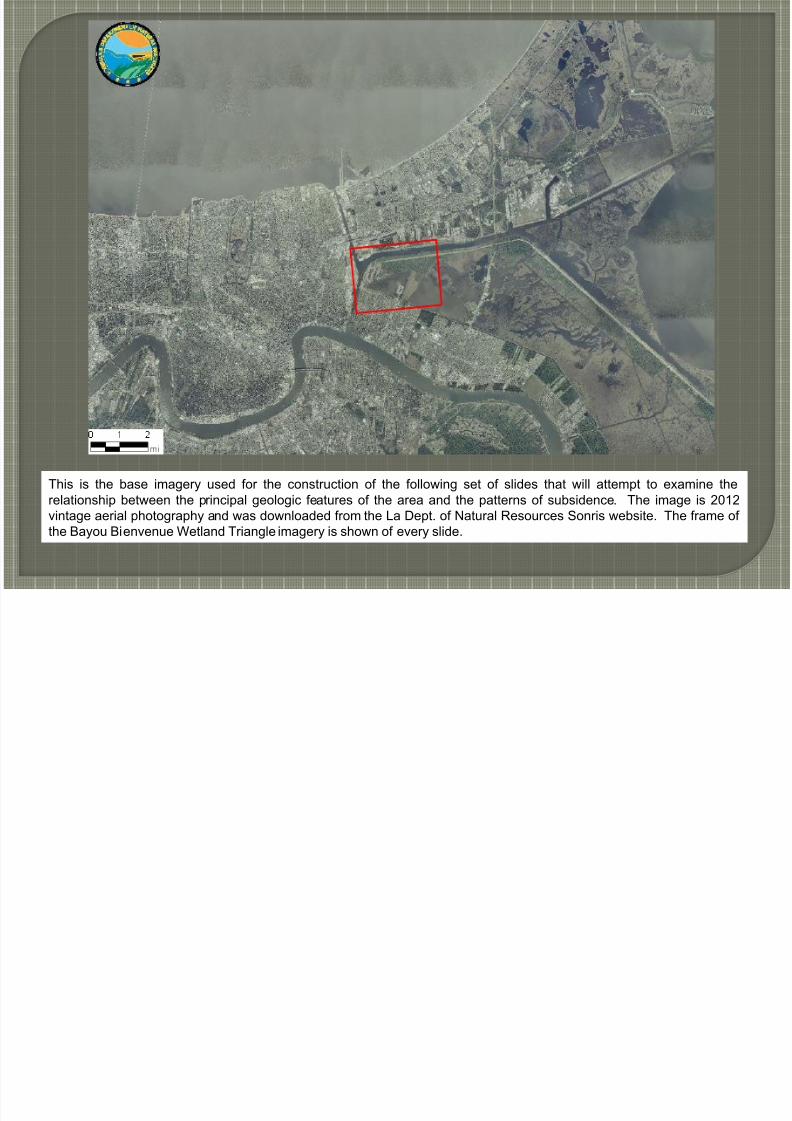
This is the base imagery used for the construction of the following set of slides that will attempt to examine the
relationship between the principal geologic features of the area and the patterns of subsidence. The image is 2012
vintage aerial photography and was downloaded from the La Dept. of Natural Resources Sonris website. The frame of
the Bayou Bienvenue Wetland Triangle imagery is shown of every slide.

8/10/2019 Central Wetlands Unit Subsidence
http://slidepdf.com/reader/full/central-wetlands-unit-subsidence 18/34
Rogers, et.al., 2008 map of the elevation to the top of the barrier island deposits is placed in its proper orientation
relative to the base image. It is clear that the orientation of distributary channels that underlie the Metairie and Gentilly
Ridges was controlled by the configuration of the barrier islands. Apparently the historical river channels ran along the
south side of the islands, and the two may have coexisted for some time before the islands slipped below the surface
and were covered with delta/river overbank deposits.

8/10/2019 Central Wetlands Unit Subsidence
http://slidepdf.com/reader/full/central-wetlands-unit-subsidence 19/34
-10-30
-10
The contours of the depth to the top of the barrier island deposits are preserved here for comparison with the other
features. These slides are configured to be able to switch back and forth between them to easily compare each of the
component parts along with the final composite slide of the sequence.

8/10/2019 Central Wetlands Unit Subsidence
http://slidepdf.com/reader/full/central-wetlands-unit-subsidence 20/34
This slide is intended to help envision the extent of the cypress swamps across the area prior to urbanization. The
historical course of the river that is preserved by the deposits of the distributary channel is shown as a dashed green
line. These deposits of the abandoned distributary channel of the river underlie the Metairie and Gentilly Ridges. The
yellow line indicates the approximate location of the cross section shown on the next slide.
8/10/2019 Central Wetlands Unit Subsidence
http://slidepdf.com/reader/full/central-wetlands-unit-subsidence 21/34
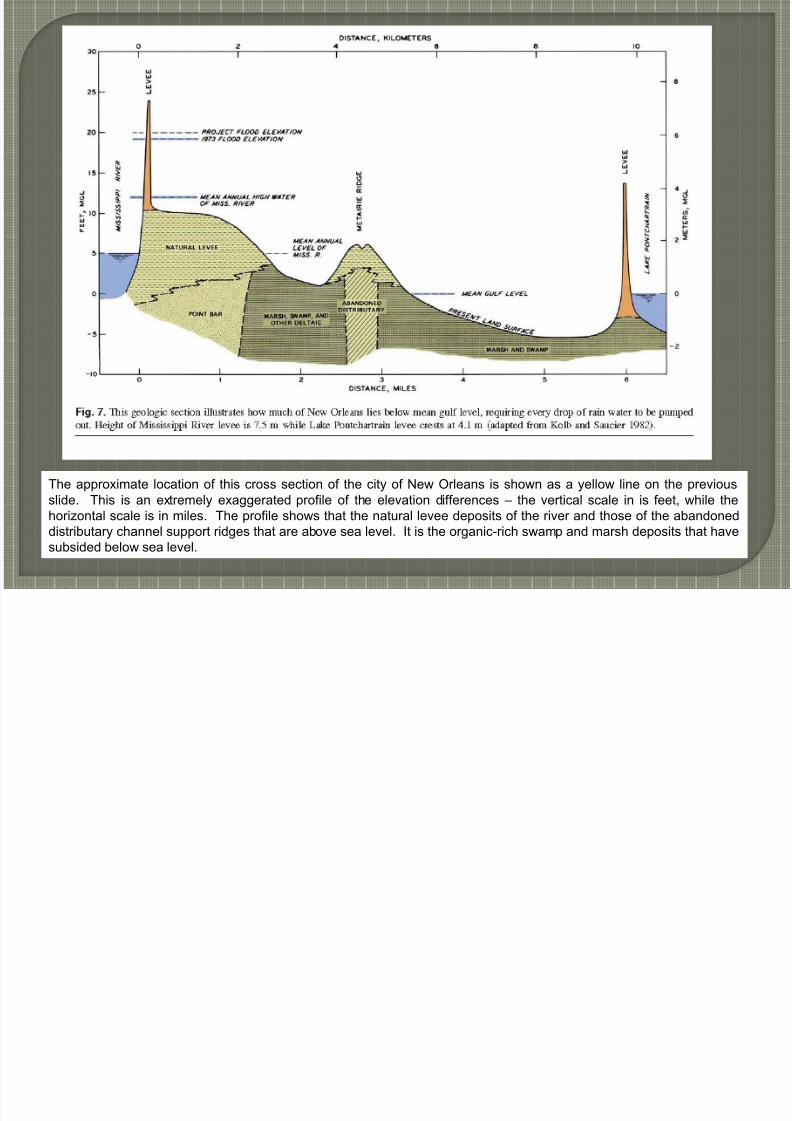
The approximate location of this cross section of the city of New Orleans is shown as a yellow line on the previous
slide. This is an extremely exaggerated profile of the elevation differences – the vertical scale in is feet, while the
horizontal scale is in miles. The profile shows that the natural levee deposits of the river and those of the abandoned
distributary channel support ridges that are above sea level. It is the organic-rich swamp and marsh deposits that have
subsided below sea level.

8/10/2019 Central Wetlands Unit Subsidence
http://slidepdf.com/reader/full/central-wetlands-unit-subsidence 22/34
This is the thickness contour map of the shallow peat deposits beneath the area of investigation. The peat layer
reaches a maximum thickness of 16 feet just beneath Bayou Bienvenue. As previously discussed, the accumulation of
peat is dependent on the creation of accommodation space by subsidence. Just as with the larger scale evaluation of
the thickness of the Holocene section as a whole, in this case thickness may be taken as a proxy for subsidence, and it
would be correct to say the area around Bayou Bienvenue has subsided by at least 16 feet over the past few thousand
years.
ROGERS, et.al. 2008

8/10/2019 Central Wetlands Unit Subsidence
http://slidepdf.com/reader/full/central-wetlands-unit-subsidence 23/34
16
12
16
0
8
By switching back and forth between the slides in this sequence, it will become obvious that the minimum thickness of
peat accumulation is coincident with the course of abandoned distributary channels the underlies the Metairie and
Gentilly Ridges. Peat accumulations thicken again on the northside of the barrier island deposits, and at the northeast
corner of the mapping area. As will be discussed, Dokka, 2011 concluded that this area in New Orleans East may have
experienced some subsidence due to the activity of faulting. This faulting may have also had a contributory effect on
the subsidence at Bayou Bienvenue.

8/10/2019 Central Wetlands Unit Subsidence
http://slidepdf.com/reader/full/central-wetlands-unit-subsidence 24/34
Dokka, 2011 mapped the surface traces of faults shown as magenta dashed lines here. Comparison of this slide with
the previous slide shows a good correspondence of the thickening of the peat deposits with the pattern of faulting, and
suggests that the activity of the faults was likely a component in causing the subsidence that allowed for the
accumulation of the peat.Dokka, R.K., 2011, The role of deep processes in late 20 th century subsidence of New Orleans and coastal areas of southern Louisiana and
Mississippi, Journal of Geophysical Research, v. 16, B06403, 25 p.

8/10/2019 Central Wetlands Unit Subsidence
http://slidepdf.com/reader/full/central-wetlands-unit-subsidence 25/34
Fort Proctor stands as a measurable documentation of the effects of subsidence. The fort was constructed at ProctorLanding in 1865, but never used. Historical documents show the fort was positioned 150’ from the shoreline, and
based on comparison with other forts around the Gulf, it was almost certainly at least five above sea level at the time of
construction. The fort is now in Lake Borne, and the foundation is about four feet below sea level. The implied rate of
subsidence is very similar to the values measured in 2006 by Dixon. The green outline is the marsh creation project
being undertaken by Ecosystem Investment Partners. This project will be subject to nearly the same rates of
subsidence that have been experienced across the area resulting in the burial of the barrier islands, the submergence
of the cypress swamps in Breton Sound, and the sinking of Fort Proctor, and the mud flats created by the project will
very likely be submerged below sea level in less than 20 years.
Dixon Area of Maximum
Subsidence ~ 0.8 in/yr
Ecosystem Investment Partners
Marsh Creation Project Outline
Fort Proctor

8/10/2019 Central Wetlands Unit Subsidence
http://slidepdf.com/reader/full/central-wetlands-unit-subsidence 26/34
This is the subsidence map of Dixon, 2006 with the patterns showing areas of relatively high rates of subsidence color-
filled in orange and red. These color-filled areas are used on the next slide to draw conclusions about the relationship
between the principal geologic features of the subsurface in this area, and the rates of subsidence that are being
experienced at the surface.
DIXON 2006

8/10/2019 Central Wetlands Unit Subsidence
http://slidepdf.com/reader/full/central-wetlands-unit-subsidence 27/34
16
12
16
0
8
-10-30
-10
This slide combines the depth contours of the top of the barrier island deposits, the thickness contours of the peat
deposits, the color-filled areas of relatively high subsidence and the trace of the surface faulting published by Dokka,
2011. There is an obvious strong correlation between subsidence and the thickness of the peat, as well as a
correlation between areas of low subsidence and the axis of the barrier island deposits and the distributary channels.
The distributary channels and the recent point bar deposits of the river have provided relative stability and the areas
between have subsided.
8/10/2019 Central Wetlands Unit Subsidence
http://slidepdf.com/reader/full/central-wetlands-unit-subsidence 28/34
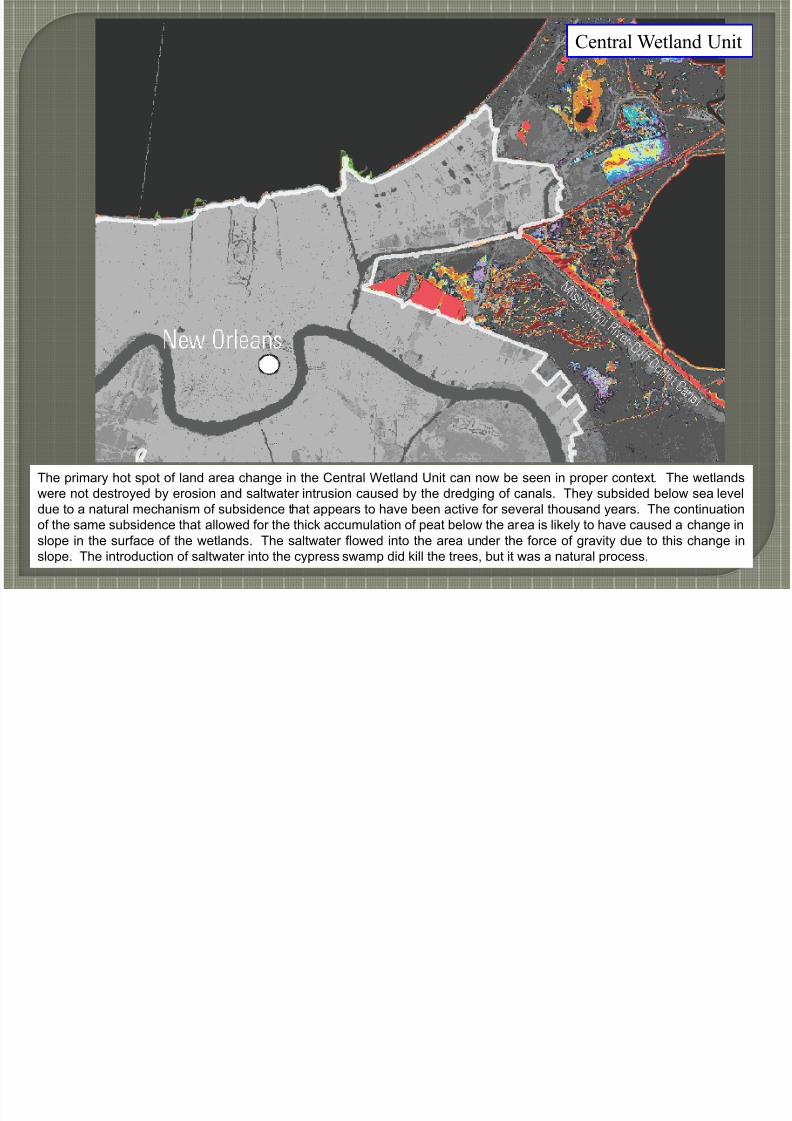
Central Wetland Unit
The primary hot spot of land area change in the Central Wetland Unit can now be seen in proper context. The wetlands
were not destroyed by erosion and saltwater intrusion caused by the dredging of canals. They subsided below sea level
due to a natural mechanism of subsidence that appears to have been active for several thousand years. The continuation
of the same subsidence that allowed for the thick accumulation of peat below the area is likely to have caused a change in
slope in the surface of the wetlands. The saltwater flowed into the area under the force of gravity due to this change in
slope. The introduction of saltwater into the cypress swamp did kill the trees, but it was a natural process.

8/10/2019 Central Wetlands Unit Subsidence
http://slidepdf.com/reader/full/central-wetlands-unit-subsidence 29/34
This three-dimensional block diagram helps to illustrate the geologic framework of the area around New Orleans. The
location of the Bayou Bienvenue Wetland Triangle is approximated by the red rectangle, and shows that it is situated
between the relatively stable ridges supported by the abandoned distributary channel running along the southern
boundary of the buried barrier island deposits and the point bar deposits of the modern channel of the river. This is an
area of natural subsidence and the accumulation of organic peats from the marsh and swamp has been going on for
thousands of years in this natural slough.
Kolb, C.R. & Saucier, R.T., 1982, Engineering Geology of New Orleans, Geological Society of American Reviews in Engineering Geology, v.5,pl 75-93
KOLB & SAUCIER, 1982

8/10/2019 Central Wetlands Unit Subsidence
http://slidepdf.com/reader/full/central-wetlands-unit-subsidence 30/34
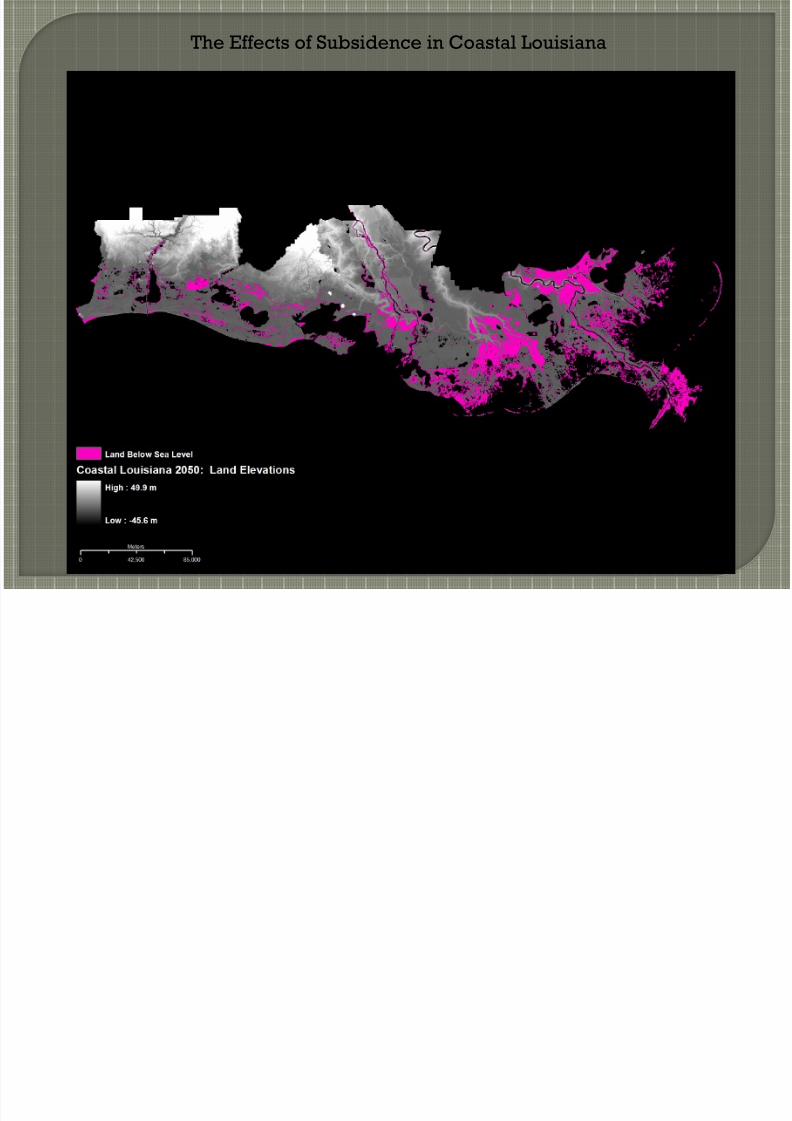
The following sequence of three slides shows the effects of subsidence in coastal Louisiana over the course of te
rest of this century. These images were a part of numerous presentations by Dr. Roy Dokka, and LSU geology
professor prior to his untimely death in 2011. The images were created by the LSU Center for Geoinformatics.
They show the areas of coastal Louisiana that were below sea level in 2010 and projections for 2050 and 2100.
The striking increase in the area of south Louisiana that will be below sea level over the course of this century is
due entirely to the effects of subsidence. This subsidence is being driven by the same mechanisms that have
been in effect across this area for millions of years. There are deposits of the ancient Mississippi River delta that
are now three miles below the surface of coastal Louisiana. These deposits were subsided by the same
mechanisms that have submerged the historical delta deposits of the past 6,000 years.
The mechanisms of subsidence affecting coastal Louisiana are as fundamental as the movement of the crustal
plates and as simple as the compaction of surface sediments. Taken together these mechanisms produce an
unrelenting effect at the surface that cannot be reversed or even meaningfully offset by the actions of humans.
The Effects of Subsidence in Coastal Louisiana

8/10/2019 Central Wetlands Unit Subsidence
http://slidepdf.com/reader/full/central-wetlands-unit-subsidence 31/34
The Effects of Subsidence in Coastal Louisiana
8/10/2019 Central Wetlands Unit Subsidence
http://slidepdf.com/reader/full/central-wetlands-unit-subsidence 32/34

8/10/2019 Central Wetlands Unit Subsidence
http://slidepdf.com/reader/full/central-wetlands-unit-subsidence 33/34
The Effects of Subsidence in Coastal Louisiana

8/10/2019 Central Wetlands Unit Subsidence
http://slidepdf.com/reader/full/central-wetlands-unit-subsidence 34/34
Land area change in coastal Louisiana has been among the most widely discussed topics in public discourse
over the past few decades. The overwhelming majority of that discourse has taken place without the benefit of a
component of valid science. The most commonly held beliefs about the coast are:
1. “land loss” in the wetlands is primarily due to erosion
2. that erosion was initially caused by and is being accelerated by canals that were dug in the marsh
3. because land loss is the result human activity, humans will be capable of reversing it.
All of these contentions are completely erroneous. There is no valid scientific documentation that any of these
popular contentions are even remotely supportable. The disconnect between popular conception and scientific
fact is a measure of the degree to which human culture has become disconnected from the natural world. The
idea that human beings could intervene in the natural processes of the coast and reverse their effects is, as MarkTwain said, like “trying to bully the comets in their courses”. The land area change being experienced on the
coast plain of south Louisiana is primarily the result of the natural mechanisms of subsidence. Those
mechanisms are being driven by forces as fundamental as the movement of the continental plates. They
represent a set overwhelming geophysical forces that humans are completely powerless to affect.
The best thing that modern human culture can do to try to achieve coastal restoration is to move toward a goal of
working within the processes of nature instead of trying to alter or control them. The restoration of the wetlands
can only come about by restoring the entire natural system as closely as possible to the way it would have been
if humans had never interfered. The mechanisms of subsidence are going to continue. The abandoned deltadeposits will all eventually sink below the surface. Only by allowing the natural formation of a delta system
where nature would choose to build it is land area change on the coast ever going to be brought to a point of
equilibrium.
Commentary