ceo and board characteristics as determinants of …ftp.iza.org/dp6256.pdfiza discussion paper no....
TRANSCRIPT

DI
SC
US
SI
ON
P
AP
ER
S
ER
IE
S
Forschungsinstitut zur Zukunft der ArbeitInstitute for the Study of Labor
CEO and Board Characteristics as Determinants of Private Benefits of Control:Evidence from the Russian Stock Exchange
IZA DP No. 6256
December 2011
Irina BerezinetsYulia IlinaAlexander Muravyev

CEO and Board Characteristics as Determinants of Private Benefits of Control: Evidence from the Russian Stock Exchange
Irina Berezinets St. Petersburg State University
Yulia Ilina
St. Petersburg State University
Alexander Muravyev IZA and St. Petersburg State University
Discussion Paper No. 6256 December 2011
IZA
P.O. Box 7240 53072 Bonn
Germany
Phone: +49-228-3894-0 Fax: +49-228-3894-180
E-mail: [email protected]
Any opinions expressed here are those of the author(s) and not those of IZA. Research published in this series may include views on policy, but the institute itself takes no institutional policy positions. The Institute for the Study of Labor (IZA) in Bonn is a local and virtual international research center and a place of communication between science, politics and business. IZA is an independent nonprofit organization supported by Deutsche Post Foundation. The center is associated with the University of Bonn and offers a stimulating research environment through its international network, workshops and conferences, data service, project support, research visits and doctoral program. IZA engages in (i) original and internationally competitive research in all fields of labor economics, (ii) development of policy concepts, and (iii) dissemination of research results and concepts to the interested public. IZA Discussion Papers often represent preliminary work and are circulated to encourage discussion. Citation of such a paper should account for its provisional character. A revised version may be available directly from the author.

IZA Discussion Paper No. 6256 December 2011
ABSTRACT
CEO and Board Characteristics as Determinants of Private Benefits of Control: Evidence from the Russian Stock Exchange* This paper investigates whether and how various characteristics of CEOs and corporate boards are related to the severity of corporate governance problems within firms. The latter is proxied by private benefits of control, which we measure for dual class stock firms using the voting premium approach. Our empirical analysis is based on data from Russia and takes advantage of the extreme corporate governance problems in the country, considerable variation in corporate governance practices across firms and over time, and presence of a large and exogenously created (during the process of privatization) group of dual class stock companies. The data are assembled from the RTS, SKRIN and SPARK databases and include over 200 firms observed in 1997-2009, with over 1000 observations in total. Our econometric analysis suggests a quadratic relationship between private benefits of control and CEO ownership with a minimum at about 4% CEO ownership, a positive association between CEO tenure and private benefits, and a quadratic in CEO age with a dip in private benefits at about 52 years of age. There is also a quadratic relationship between private benefits of control and board size, implying the optimality of medium-sized (about 9-10 directors) boards. We find no gender effects on private benefits of control. JEL Classification: G34 Keywords: CEO, corporate board, private benefits of control, dual-class stock firms, Russia Corresponding author: Alexander Muravyev IZA P.O. Box 7240 53072 Bonn Germany E-mail: [email protected]
* We gratefully acknowledge financial support from the Economics Education and Research Consortium (EERC), grant No. 09-528. Our special thanks are due to EERC experts Victor Ginsburgh and Michael Alexeev. The paper has also benefited from comments and suggestions at the XII International Academic Conference on Economic and Social Development (Moscow, April 2011), VIII Workshop on Empirical Research in Financial Accounting (Seville, March 2011), seminar at the Department of Finance, Aalto University (Helsinki, May 2011), SSEM Conference “Crisis and Recovery in Emerging Markets” (Izmir, June 2011), and 24th Australasian Finance & Banking Conference (Sydney, 14-16 December 2011).

1. Introduction
In the last decades, the corporate finance literature has seen a growing interest in the link
between corporate governance and performance, on the one hand, and various characteristics
of CEOs and corporate boards, including directors’ gender, age, tenure, and ownership stakes
in the firm, on the other hand. Many studies have examined whether and how these
characteristics may affect the severity of the corporate governance conflict between suppliers
and users of capital, a key issue in the functioning of the modern corporation (Shleifer and
Vishny 1997). For example, a recent paper by Yim (2010) shows an important role of a
CEO’s age in shaping corporate policies. Adams and Ferreira (2009) focus on the hitherto
rarely investigated issue of gender composition of boards. Hermalin and Weisbach (2003)
provide a comprehensive review of the role of corporate boards, including board size and the
presence of independent directors. Corporate governance effects of managerial ownership also
remain high on the research agenda (e.g., Benson and Davidson 2009) despite the long history
of this research, which dates back to the seminal contributions by Berle and Means (1932) and
Jensen and Meckling (1976).
All these issues are of considerable interest not only from the research perspective, but
also highly relevant from the practitioner’s viewpoint as well as from the policy angle. Better
understanding of how various corporate governance arrangements work may, for example,
help to shape corporate law (as well as regulations adopted by stock exchanges) which
typically contain provisions concerning the size and composition of corporate boards,
establishment of various committees, as well as those regarding accounting and disclosure
standards. Indeed, recent years have seen a number of important developments in corporate
law on all continents, such as the adoption of Russia’s law on joint-stock companies (Black
and Kraakman 1996), the 2002 Sarbanes-Oxley Act in the US (Romano 2005), and corporate
governance reforms in India (Khanna 2009).
Importantly, most empirical studies that try to evaluate corporate governance effects of
various governance mechanisms and arrangements rely heavily on traditional performance
measures, most notably Tobin’s Q and various financial ratios based on accounting data (e.g.,
Bhagat and Black 2002; Karamanou and Verfas 2005; Adjaoud et al. 2007; Chhaochharia and
Grinstein 2007). A key assumption here is that, whenever a corporate governance conflict
arises, it will eventually be reflected in corporate performance. For example, managerial
opportunism (regardless of whether it comes from “shirking” or “stealing” behavior) will
damage the long-term performance of firms, and will be reflected in their lower
capitalizations once investors learn about the problem.
2
A fundamental issue, however, is that these traditional performance measures are
subject to various external influences such as exogenous firm-specific and industry-specific
shocks and can suffer from measurement problems (stemming, for example, from variations
in accounting rules and practices) that can hardly be properly controlled for in empirical
analysis. This may explain, at least in part, why researchers often come to different and
inconsistent conclusions concerning, for example, the effect of independent directors, audit
and compensation committees, and other board characteristics on company performance (e.g.,
Bhagat and Black 2002; Beiner et al. 2004; Van, Postma and Sterken 2008). A clearer picture
of how various corporate governance mechanisms and arrangements work requires a better
measure, which would be less subject to such noisy influences.
Importantly, the recent corporate finance and governance literature offers a candidate
measure of this type called “private benefits of control” (see Dyck and Zingales 2004).
Theoretically, private benefits of control capture pecuniary and non-pecuniary benefits that a
party in control over the firm can extract without sharing them with other shareholders. They
may involve high managerial wages, transfer pricing, payments in kind or simply
psychological benefits from being in control over the firm. If private benefits of control could
be estimated empirically, they would provide a better idea (as compared with traditional
measures of corporate performance) of the severity of corporate governance problems within
firms. This indicator would also be useful in identifying firm-level correlates and
determinants of corporate governance problems. This is exactly what our study attempts to
achieve.
In particular, our paper looks at the old question of which characteristics of CEOs and
corporate boards are associated with better corporate governance, but from a rather unusual
angle. Instead of relating key characteristics of CEOs and corporate boards to traditional
measures of company performance, we link them to a measure of private benefits of control.
The latter is estimated using the voting premium approach, which is based on comparing
prices of voting and non-voting stocks in dual class stock companies. This is the key
innovation and contribution of our paper to the corporate finance and governance literature.
Our empirical analysis focuses on Russia, which is not an accident. First, Russia has
long been regarded as country with extreme corporate governance problems. As noted by
Shleifer and Vishny (1997), in the mid-1990s, managers and/or controlling shareholders of
Russian companies had immense opportunities for diverting both profits and assets to
themselves. Goetzmann et al. (2003) even labeled Russia “a Wild West of corporate control”.
At the same time, Russia has been known for considerable variation in corporate governance
3

practices across firms and dynamic changes in firms’ governance structure (e.g., Black 2001).
In other words, the country can be regarded as a unique laboratory for studying corporate
governance problems. Second, our paper takes advantage of the considerable number of dual-
class stock firms (those issuing voting and non-voting shares) traded in the Russian stock
market. This gives us a large enough sample of firms for which we can easily compute a
measure of private benefits of control. Third, we exploit the fact that most Russian dual class
stock companies were created not because of the desire of their founders to retain control over
productive assets while obtaining external financing, but because of the specific design of the
Russian privatization. Thus, the sample selection issue does not apply or at least is of much
smaller concern in our study as compared with studies of mature stock markets. To sum up, in
the Russian case the researcher can obtain a proxy for private benefits of control for a large
and non-selected sample of firms. Our paper takes advantage of these three prominent
features of the country’s corporate sector.
This study is based on a novel hand-collected dataset of Russian dual stock companies
that combines the 1997-2009 share trade data from the Russian Trading System (RTS) stock
exchange with additional information from companies’ charters and quarterly reports to the
Federal Financial Market Service (FFMS). Overall, we have at our disposal an unbalanced
panel of more than 200 firms observed over 13 years, with more than 1000 observations in
total. The newly collected data also allow us to make a number of important observations
about the evolution of corporate governance in Russia, an important emerging market, over
the last years. This is another key contribution of our paper.
Our econometric analysis suggests that private benefits of control decline with CEO
ownership in the range of 0 to 4 percent and increase thereafter. CEO tenure appears to be
positively related to the size of private benefits. We also find a dip in private benefits of
control at CEO age of about 52 years. There is evidence that very small and very large
supervisory boards are less effective (are associated with larger private benefits of control)
than medium-sized boards with about 9-10 directors. Private benefits of control appear to be a
decreasing function of the average age of the board’s members. Finally, we find no gender
effects, in particular, the gender composition of supervisory boards seems not to matter.
The rest of the paper is organized as follows. Section 2 focuses on key conceptual and
measurement issues related to private benefits of control. Section 3 presents the institutional
background for dual class shares in Russia. Section 4 provides a review of the literature and
formulates a number of hypotheses to be tested. The methodology of our empirical analysis is
4

described in Section 5. Section 6 describes the data and sample used in the paper. The
estimation results are presented in Section 7 and discussed in Section 8. Section 9 concludes.
2. Private benefits of control: conceptual and measurement issues
Starting with Jensen and Meckling (1976) and Grossman and Hart (1980), the idea of private
benefits of control has been one of the centerpieces of the modern theoretical and empirical
corporate finance literature. Private benefits arise when corporate resources are used to the
sole or main advantage of the party that controls the firm. They may take a variety of forms,
from rather innocuous psychological benefits to high managerial wages and outright theft of
corporate resources. Whether pecuniary or non-pecuniary, private benefits of control are
usually extracted to the detriment of (minority) shareholders and other investors in the firm.
Corporate governance, as seen from the agency perspective, is largely about how to ensure
effective restraints on extraction of such private benefits by managers and/or controlling
shareholders (Shleifer and Vishny 1997; Dyck and Zingales 2004).
If properly quantified, private benefits of control would provide a good idea of the
severity of corporate governance problems within firms. Analyses of determinants of these
private benefits would then help to find effective corporate governance mechanisms and
arrangements. The problem, however, is that private benefits of control are intrinsically
unobservable. As Nicodano and Sembenelli (2004, p. 227) put it, private benefits from control
“consist in unobservable consumption and investment opportunities deriving from
discretionary power to allocate company resources”. Indeed, if private benefits could be easily
and reliably evaluated they would immediately loose their “privacy” and minority
shareholders could bring in a lawsuit against the corporation or the controlling owner. The
difficulty of measuring private benefits of control is the principal reason why they have not
been extensively used in the literature in lieu of traditional indicators of company
performance, such as ROE or Tobin’s Q (which are only indirect proxies for corporate
governance problems in firms).
The finance literature has nevertheless developed two approaches to approximate
private benefits of control. The first, called the voting premium approach, is based on
comparing prices of voting and non-voting shares in companies that have issued two different
classes of stock (Lease, McConnell and Mikkelson 1983; Zingales 1995). The second, called
the control premium approach, is based on comparing the price of shares in transactions
involving control block change and the price of shares in the stock market after the
announcement of such control block sales (Barclay and Holderness 1989).
5

The first method associates private benefits with the voting premium, which is
conventionally defined as the difference between the price of voting shares and the price of
non-voting shares divided by the price of non-voting shares. The theoretical linkage between
the voting premium and private benefit of control is best illustrated in the model developed by
Zingales (1995), which is briefly described in Appendix 1. In contrast to non-voting shares,
voting shares confer control rights (and potentially give access to private benefits) and are
therefore valued higher. In the stock market, voting shares have higher prices as even a small
fraction of them may be pivotal in a control contest while non-voting shares are irrelevant in
battles for control. The voting premium therefore reflects the price a potential bidder would be
willing to pay to atomistic holders of voting stock in order to establish control over the
company. Thus, the higher the private benefits of control, the higher the voting premium. In
the empirical corporate literature, the voting premium approach to measuring private benefits
of control has been used in Nenova (2003), Doidge (2004) and Desai, Dyck and Zingales
(2007), among others.
The second method considers the difference between the price of shares in
transactions involving control block change and the price in the stock market after the
announcement of the control block sale (Barclay and Holderness 1989). This control premium
approach implies that, as long as the exchange price reflects the value of corporate benefits
that accrue to all shareholders in proportion to their fractional ownership, any difference
between the block price and the exchange price reflects benefits that accrue to the blockholder
alone – the private benefits from control. This approach has been applied, among others, by
Franks and Mayer (2001), Dyck and Zingales (2004), and Albuquerque and Schroth (2010).
Both methods have some deficiencies (see, e.g., Benos and Weisbach 2004). A key
issue is sample selection, which is typical of both cases. Indeed, block trades are not everyday
events and are unlikely to occur in a random fashion. There may be strong links between the
performance of a company in the past (as well as its expected performance in the future) and
the probability that a large block of its shares changes hands. Barclay and Holderness (1989)
also note that large blocks tend to be traded intact when private benefits are substantial but
tend to be broken up when private benefits are small. Thus, the average private benefits
estimated from block trades are likely to be overstated. Similarly, while the voting premium is
continuously observed over time (at least in publicly traded firms), there are relatively few
companies issuing dual class shares in the first place and these companies are typically not
representative of the whole population of firms. In fact, companies often introduce dual-class
share structures because their founders or controlling shareholders want to raise funds without
6

jeopardizing control over productive assets (e.g., Partch 1987; Smith and Amoako-Adu 1995;
Becht et al. 2002). Thus, the decision to issue non-voting stock is likely to be related to the
size of the benefits of control. When private benefits of control are small, there is little reason
for issuing non-voting stock.
3. Institutional background
The development of the Russian corporate sector offers an excellent opportunity to study
private benefits of control, especially using the voting premium approach. As explained below,
the country has a considerable number of dual-class stock firms most of which were created
“exogenously”, that is, due to the specific design of the Russian privatization program. Thus,
the sample selection issue is of much smaller concern in Russia as compared with most other
stock markets.
Dual class shares were authorized in Russia in 1992, when a major presidential decree
on privatization was enacted.1 This document established three basic options for privatizing
large and medium-sized state-owned enterprises, which were to be transformed into joint-
stock companies. It also provided a standard corporate charter, which all privatized companies
had to adopt. According to the decree, enterprises that followed the so-called “option 1” of
privatization were re-established as companies with up to 25 percent of their charter capital
represented by preferred (non-voting) shares and the rest represented by common (voting)
shares. The other two options (“option 2” and “option 3”) did not envisage the issue of non-
voting stocks. The equity of companies that followed these options was formed by common
shares only.
Why did some companies choose “option 1” and others choose the other two options
during the process of privatization? The existing literature tends to suggest (Boycko et al.
1995; Blasi et al. 1997; Chubais 1999) that insiders (managers and workers, the key players at
the first stage of the privatization process) preferred privatizing their firms in 1992-1994 using
“option 2” and “option 3”, which would give them full control over the firms, and resorted to
“option 1”, which would split the firms’ equity between voting and non-voting stock and give
them non-voting shares for free, only when they did not have enough funds to purchase the
firms’ assets (see Hare and Muravyev 2003).
There have been a number of studies that treated the method of privatization as an
exogenous factor with regard to the performance of firms and even used it as instrument for
1 See Presidential Decree No. 721 dated 1 July 1992 “On organizational measures on transformation of state
enterprises and voluntary associations of state enterprises into joint-stock companies”.
7

the firms’ post-privatization ownership structure (Earle and Estrin 1997). Perhaps, a more
nuanced and careful view is that “option 1” (resulting in the issue of non-voting shares) was
typical of relatively large and capital-intensive enterprises that could not be bought out by
their managers and employees under the other options due to wealth constraints. This is one
of the conclusions in a recent work by Sprenger (2011) which analyses the determinants of the
post-privatization ownership structures and also the choice of the privatization method.
Overall, the existing literature does not suggest any mechanism by which the use of “option
1” (= the issue of dual class stock) in the process of privatization is related to the magnitude
of private benefits of control. We therefore build on this literature to claim that the selection
issue is of no or little importance in our analysis.
The legal status of the two classes of shares, common and preferred, was initially
specified in the standard corporate charter. The rights attached to common (voting) stock were
quite similar to those existing in most other jurisdictions (they are basically restricted to the
right to vote at shareholder meetings and the right to receive dividends, which are indefinite).
The status of preferred shares was, in contrast, rather peculiar. While sharing a number of
features with common shares, they did not confer general voting rights but instead provided a
number of pecuniary privileges to their owners. In particular, companies with dual class stock
were required to allocate at least 10 percent of their net profit to dividends on preferred shares.
In addition, the dividend on preferred shares was bounded below by the dividend on common
stocks. Preferred shareholders were also granted superior rights in the event of company
liquidation. Importantly, the standard charter stipulated temporary enfranchisement of
preferred shares in the case the dividend on them was not paid or was not paid in full, and it
also endowed preferred shareholders with the right to vote on all decisions that involved their
“class rights”. Effectively, preferred shareholders were granted veto power on decisions that
concerned their class rights, as such decisions required a supermajority (two-thirds) approval
by these investors.
Since the start of Russia’s privatization, there have been some changes in both the
country’s corporate law and individual corporate charters concerning the legal status of
preferred shares (see Muravyev, 2009b for details). However, the basic principle that
preferred shares do not vote but are instead entitled to a superior dividend has largely
remained intact. Thus, the differentiation of voting rights across classes – a deviation from the
8

one-share-one-vote rule – has been retained. This is crucial for estimating private benefits of
control based on the prices of common and preferred shares.2
There have been more than 200 dual class stock companies traded in the Russian stock
market, with the earliest trades in the RTS3 dating back to September 1996. The magnitude of
the voting premium has fluctuated a great deal between 1996 and 2009, with the highest
values achieved right after the 1998 financial crisis (Muravyev 2009a). The high magnitudes
of the voting premium, often above 100 percent, suggest large private benefits and significant
risks of minority shareholder expropriation in Russian firms. Based on the large voting
premium in Russia, Goetzmann et al. (2003) even labeled the country “a Wild West of
corporate control”.
4. Key characteristics of directors, managers and the private benefits of control
A CEO is the key decision maker in the firm and has considerable discretion in determining
its policies. A key issue in corporate governance, at least from the agency perspective which
our study draws upon, is that this discretion can be used not for maximizing shareholder value,
but for extracting private benefits from control over the firm (Shleifer and Vishny 1997). The
scope of such opportunistic behavior depends on a variety of factors, such as how well the
CEO’s incentives are aligned with those of shareholders (for example, via ownership and
incentive contracts) and how effective the mechanisms of control are. These mechanisms are
usually thought to include the capital markets, the legal and regulatory system, the product
and factor markets, and the internal control system, the key element of which is the board of
directors (Jensen 1997).
Below we briefly review the theoretical and empirical literature on how characteristics
of CEOs and boards of directors may affect the magnitude of private benefits of control and 2 Ideally, the two types of stock should be identical and differ only with respect to their voting rights. This is
rarely observed in the real world, however. For example, Zingales (1995, p.1057) in his US study notes that
“only 21 companies have nonvoting common stock. In all other cases both classes are voting, but their voting
power differs. The majority of companies (57) attribute ten votes to the superior voting class and one to the
inferior voting class.” Also, in many companies “…inferior voting shares have the right to elect a minority of
directors.” As Zingales notes, “these differences in relative voting power create some problems in the cross-
sectional comparisons”. In other jurisdictions, non-voting stocks may be truly non-voting, but superior in terms
of cash flow rights. What really matters is the deviation from the one-share-one-vote rule, however introduced.
Israeli companies, for example, used to introduce such deviation by issuing shares which were entitled to one
vote each but had different par values and hence, provided different dividends (Levy 1983). 3 The RTS was the first electronic trading system in Russia, established in September 1995; it was transformed
into the RTS Stock Exchange in 1997.
9

firm performance in general. We show that for most factors mentioned, the available
evidence, whether theoretical or empirical, is controversial, which suggests the importance of
further research in the field.
4.1. Managerial ownership
There are competing hypotheses concerning the effect of CEO and director ownership on
company performance. According to the incentive alignment hypothesis developed by Jensen
and Meckling (1976), ownership provides managers with monetary incentives to maximize
profit and thus improves company performance. An alternative hypothesis says that
ownership by managers promotes their entrenchment, which is particularly costly when they
have low qualification, prefer to live an easy life, or extract private benefits of control in some
other forms (Morck et al. 1988; Stulz 1988). Higher managerial ownership also exposes
managers to higher risk relative to diversified shareholders and thus stimulates them to reject
value-enhancing, but risky projects (Guay 1999; Ross 2004). Given these competing
hypotheses, the overall impact of managerial ownership on private benefits of control and on
corporate performance at large is an empirical issue.
Indeed, pros and cons of managerial ownership have been scrutinized in numerous
empirical studies, but the available evidence is far from conclusive. For example, Core and
Larcker (2002) find a positive association between managerial ownership and firm
performance, McConnell and Servaes (1990) find a positive but decreasing relation, and
Cheung, Wei and John (2006) find no relationship. A recent study by Benson and Davidson
(2009) reports a significant inverted U-shaped relation similar to that found in the early
research on this issue. This result is interpreted as suggesting incentive alignment at low
levels and risk aversion at high levels of ownership by managers. A study by Masulis et al.
(2009) suggests that managers with greater excess control rights over cash flow rights are
more prone to pursue private benefits at shareholders’ expense, and explains why firm value
is decreasing in insider excess control rights.
Overall, we expect to find support for the incentive alignment hypothesis, which
implies a negative relationship between private benefits of control and CEO ownership. If, in
addition, there are substantial entrenchment and risk aversion effects, we should observe this
relationship either levelling off or changing the sign at higher levels of CEO ownership.
10

4.2. Age
The literature usually links the effect of a CEO’s age on corporate performance to her career
concerns (e.g., Holmstrom 1982; Gibbons and Murphy 1992) and decision horizon (e.g.,
Antia, Pantzalis and Park 2010). The career concerns literature offers two perspectives. One
perspective, which can be found in Holmstrom (1982) and Scharfstein and Stein (1990)
maintains that younger CEOs face higher risks when making decisions and may avoid radical
actions. The other perspective, advanced by Prendergast and Stole (1996) suggests more
conservatism on the part of older CEOs. The empirical evidence is mixed. Chevalier and
Ellison (1999) find, for example, that younger managers of mutual funds hold less
unsystematic risk and prefer more conventional portfolios. However, Li, Low and Makhija
(2011) show that younger CEOs lead a “busy life” trying to establish their reputations in the
market, while older CEOs seem to prefer an “easy life”. From the viewpoint of the career
concerns literature, however, one could expect more opportunism on the part of older
managers, who do not need to maintain reputation in the managerial labor market.
The fact that managers’ decision horizons are shorter than shareholders’ investment
horizons has been seen as an important source of corporate governance problems in firms
(Jensen and Smith 1985). It has been suggested that CEOs with short decision horizon would
pursue short-term objectives at the expense of long-run results that would be optimal for the
firm’s shareholders. The argument may be extended to the case of private benefits of control:
managers with short decision horizon are more likely to pursue own interests. However,
CEOs close to retirement may also reduce their private benefits in order to improve firm
performance, which may affect their retirement package (Kalyta 2009). Indeed, there is some
evidence that older CEOs are more likely to engage in earnings management (Davidson et al.
2007).
A recent paper by Cole and Mehran (2009) studies determinants of executive
compensation, including age, in privately held firms. This setup is interesting as in privately
held firms, CEOs have nearly full control over their compensation. Cole and Mehran find a
quadratic relationship between CEO age and pay, with maximum pay at 55 years of age. This
finding is interpreted as stemming from greater conservatism and risk-aversion and/or lower
consumption of older CEOs (the life-cycle consumption hypothesis), which makes them leave
earnings in the firm rather than consume them through salary. But these interpretations need
not necessarily hold for publicly traded firms where ownership is separated from control and
CEOs cannot “store” their wealth in the firms.
11
Overall, a CEO’s age appears to be an important determinant of her behavior,
including the propensity to extract private benefits, but the exact relationship is hard to predict
based on theory. The effect of CEO age is therefore another issue that should be addressed in
empirical studies.
4.3. Tenure
With respect to managers’ tenure, the dominant view in the literature is that CEOs staying
longer at the top position of the firm have better opportunities for the extraction of private
benefits of control. The principal mechanism behind this is the increase in the influence on the
selection of new directors and greater control of the board (Hermalin and Weisbah 1998).
Although the relevant empirical evidence is not very extensive, it tends to support the adverse
effect of longer tenures of CEOs on corporate performance. For example, Ryan and Wiggins
(2004) report that a CEO’s ability to influence the board of directors increases with his tenure,
which leads to substantial agency problems in board governance.4 In view of such evidence,
Whitehead (2011) even raises the question of whether it could be beneficial to restrict CEO
tenure in corporate law.
Overall, with respect to CEO tenure (when it is isolated from CEO age), the literature
is rather unambiguous and suggest that a CEO’s private benefits increase in her longevity in
the firm. We therefore expect to see a positive association between private benefits of control
and CEO tenure in our empirical analysis.
4.4. Gender
Groson and Gneezy (2009) identify three key characteristics of individuals that presumably
differ by gender and may have important economic implications: risk preferences, social
preferences, and reaction to competition. Their survey suggests that women are more risk
averse than men, that the social preferences of women are more situational specific than those
of men, and that women are neither more nor less socially oriented, but their social
preferences are more compliant. Also, compared to men, women are more averse to
competition. Some of the important results regarding gender differences have been obtained
in the area of finance. For example, in the analysis of stock investments by men and women
from 35,000 US households, Barber and Odean (2001) find that men trade 45 percent more
4 There is also extensive business literature suggesting that longer tenures may be associated with poorer
performance (Musteen et al. 2006; Walters et al. 2007), for example, because of slower knowledge acquisition
and resistance to change. Some of these factors can be seen as related to managers’ private benefits.
12

than women. As stocks are considered the most risky investments among marketable
securities, this result can be interpreted as suggesting less risk aversion on the part of men as
compared with women.
However, these differences need not necessarily apply to certain groups of the
population, most notably, entrepreneurs, managers and professionals. While there are fewer
women in senior positions in firms, they may have risk preferences similar to those of men
because of the selection process (Johnson and Powell 1994; Atkinson, Baird and Frye 2003).
A number of studies evidence that the gender diversity of supervisory boards has a
positive effect on corporate governance and performance. For example, Higgs (2003)
contends that gender diversity could enhance board effectiveness and recommends that firms
draw more actively from professional groups in which women are better represented.
Westphal and Milton (2000) and Carter, Simkins and Simpson (2003) arrive at similar
conclusions. A recent study by Adams and Ferreira (2009) shows that female directors have
better attendance records than male directors, and that male directors have fewer attendance
problems the more gender-diverse the supervisory board is. These results suggest that gender-
diverse boards allocate more effort to monitoring. Indeed, according to Adams and Ferreira
(2009) more diverse boards are more likely to hold CEOs accountable for poor stock
performance of the company, and CEO turnover is more sensitive to stock return performance
in firms with relatively more women on boards.
Drawing on the available theoretical and empirical literature we expect greater
representation of women at the top of companies to have a negative or zero effect on private
benefits of control.
4.5. Size of corporate boards
Theory also remains ambiguous about the optimal size of corporate boards. For example, a
major advantage of large boards is seen in the greater collective information that the board
possesses about factors affecting the value of firm (product markets, technology, regulation,
mergers and acquisitions etc.). Thus, larger boards may be better in performing the advisory
function (Dalton et al. 1999), one of the two key roles, in addition to the monitoring function,
of corporate boards (Chen 2007). The major disadvantages of large boards are the
coordination costs and free-rider problems (Jensen 1993). Harris and Raviv (2008) model the
trade-off between the benefits of greater expertise that additional outside directors bring and
the costs of an aggravated free-rider problem in order to identify the optimal number of
outside directors on the board.
13

The empirical evidence on the optimal size of boards is mixed. The influential study
by Yermack (1996) suggests that small boards of directors are more effective than large
boards. In particular, he finds an inverse relationship between board size and firm value
measured by Tobin’s Q. Similar results are reported in Conyon and Peck (1998) and
Eisenberg, Sundgren and Wells (1998). However, Beiner et al. (2004) and Lehn et al. (2009)
find no robust relation between firm performance and board size. Moreover, Andres and
Vallelado (2008) find a quadratic relationship suggesting the optimality of medium-sized
boards in their study of banks in OECD countries. A recent paper by Coles, Daniel and
Naveen (2008) shows that the relation between Tobin’s Q and board size is U-shaped,
suggesting that small and large boards are better than medium-sized ones. However, the
picture turns out to be more nuanced as the latter result stems from differences between
simple and complex firms. Specifically, company performance increases in board size for
complex firms and decreases for simple ones, with an important role played by the number of
outside directors in both cases.
We therefore do not advance any specific hypothesis concerning the optimal size of
corporate boards. Answering this question requires an empirical study.
4.6. Non-executive/independent directors
The presence of non-executive and/or independent directors is one of the key characteristics
of corporate boards. It has been widely assumed that more independent directors have less
conflict of interests while monitoring managers and therefore may be more effective in
performing this key role. However, it has also been noted (e.g., Lawrence and Stapledon 1999)
that independent directors may not be good monitors because of social or political ties with
the CEO (which could be the true even if the director meets all the usual criteria of
independence) or because they simply do not have enough time due to other commitments.
Different types of independent directors could perform differently, for example, CEOs of
public companies may bring more valuable advice and be more effective in monitoring than
directors who are appointed only for their public status and ties.
Again, empirical studies show mixed results concerning the role of non-executive
and/or independent directors. On the one hand, Weisbach (1988) finds that boards with higher
proportion of outside directors are more likely to replace a CEO in case of poor corporate
performance. A positive relationship between board independence and firm performance is
also reported in Rosenstein and Wyatt (1990) and Andres and Vallelado (2008). On the other
hand, Agrawal and Knoeber (1996) show that outside directors are associated with poorer
14

performance. Similar results are reported in Shivdasani and Yermack (1999) and Klein
(1998). Bhagat and Black (2002) do not find any relationship between the presence of
independent directors on the board and company performance. A recent study by Coles et al.
(2008) shows that the role of independent directors depends on the level of complexity in
firms. In particular, the share of inside directors has a positive effect on Tobin’s Q in
“complex” (R&D-intensive) firms, where the firm-specific knowledge of insiders is more
important, as compared with “simple” firms.
All in all, whether the proportion of independent/non-executive directors in corporate
boards has an effect on private benefits of control extracted by managers and/or controlling
shareholders (and ultimately on corporate performance) is an empirical issue.
5. Methodology
In this paper, we relate key variables characterizing CEOs and supervisory boards to the
voting premium, which is interpreted as a measure of private benefits of control. In the most
general form, the corresponding econometric model can be written as follows:
VPit = αi + Xitβ + Yitγ + Zitφ + δt + εit (1)
where subscripts i and t index firms and time, respectively, the dependent variable, VPit, is
conventionally defined as the difference between the price of common shares (PCSh) and the
price of preferred shares (PPSh) divided by the price of preferred shares5, αi is a time-invariant
firm-specific effect (which captures unobserved characteristics of firm i), vector Xit includes
essential characteristics of CEOs, such as age, gender, and tenure in the firm, vector Yit
contains characteristics of the firm’s supervisory board, including size, ownership stake, and
gender composition6, vector Zit includes additional conventional control variables, such as
5 An important advantage of the dependent variable chosen is that it helps eliminate from the analysis the effect
of many firm-specific and industry-specific shocks, which impact on traditional measures of corporate
performance, such as Tobin’s Q. To give an example, a substantial increase in oil prices is likely to positively
affect the values of both common and preferred shares of the oil sector companies. As the computation of the
voting premium uses the difference between the prices of the two classes of stock, much of the effect of
increased oil prices is differenced away. This is not the case with Tobin’s Q. An oil price rally would raise
Tobin’s Q of companies belonging to the oil extraction industry relative to firms from other sectors. Obviously,
such an increase has nothing to do with better corporate governance in the oil sector companies. 6 Russian companies have a two-tier structure of corporate boards, with management and supervisory boards
separated from each other. In what follows, we focus on supervisory boards only. In most Russian companies the
CEO has the power of the sole executive body and members of the management board are typically elected by
15

firm size, δt denote time effects common to all firms, and εit stands for a random disturbance.
In this specification, vectors of coefficients β and γ are of our primary interest.
Theoretical models suggest, however, that the voting premium, if taken at face value,
provides only an imperfect measure of the private benefits. Indeed, the model by Zingales
(1995) shows that the voting premium is affected, in addition to the private benefits of control,
by the likelihood of a control fight over the firm as well as by the proportion of voting shares
in the company’s equity (see Appendix 1). In fact, Doidge (2004) mentions this as a key
shortcoming of the voting premium as a measure of private benefits.
While some authors have considered, based on various assumptions, several
adjustments to the traditional definition of the voting premium in order to make it closer to the
true value of private benefits (see, e.g., Nenova 2003 and Doidge 2004), our approach is
different. We use the key variables identified in the theoretical work by Zingales as additional
controls in regressions. The idea here is to eliminate any potential spurious correlation
between the voting premium on the one hand and CEO and board characteristics on the other
hand if these latter factors are correlated, for whatever reason, with other determinants of the
voting premium, such as the likelihood of a control fight over the firm. This is also a more
traditional approach in the literature. Indeed, according to Albuquerque and Schrot (2010,
p.33) “[c]urrent approaches to estimating private benefits of control rely on empirical proxies,
such as the block premium or the voting premium, and on the use of control variables to
remove from these proxies aspects unrelated to private benefits of control”.
We therefore augment model (1) with additional control variables that include a proxy
for the probability of a control fight, the proportion of voting shares in the company’s equity,
and a measure of liquidity.7 Finally, given some variation in the characteristics of Russian
preferred shares across companies, we add several control variables specific to the Russian
case. These include dummy variables for the temporary enfranchisement of preferred shares
and compulsory allocation of 10 percent on net profit to dividends on preferred shares, among
other factors (see Muravyev 2009a for details). With these modifications, the baseline
regression model transforms into:
the supervisory board following the recommendation of the CEO. The CEO and supervisory board are therefore
the key players in the corporate governance game while the management board appears to be of secondary
importance (and also clearly endogenous with respect to the CEO and supervisory board). 7 Although stock liquidity is usually not a part of theoretical models of the voting premium, it is almost always
included in empirical analyses (e.g., Nenova 2003 and Neumann 2003). As shown in the contributions by Stoll
and Whaley (1983) and Amihud and Mendelson (1986), higher liquidity ceteris paribus contributes to higher
prices. Therefore, the voting premium may be affected by different liquidity of the two classes of stock.
16

VPit = αi + Xitβ + Yitγ + Zitφ +Witψ + δt + εit (2)
where vector Wit includes the mentioned additional controls (variables from standard analyses
of the voting premium as well as those specific to the Russian case) and the other notations
are the same as in (1).
Our regression model includes the time-invariant firm-specific effect αi which
captures unobserved characteristics of firm i. This is done in order to mitigate endogeneity
concerns, specifically those arising when some of the characteristics of CEOs and corporate
boards are correlated with omitted characteristics of firms (which, in turn, affect the voting
premium). However, we acknowledge that fixed-effects specifications like (1) and (2) do not
necessarily eliminate all potential problems related to regressor endogeneity. In particular, this
approach does not address the issues of measurement error and reversed causation. We
therefore admit that the estimated coefficients may not necessarily have a causal
interpretation.8
Another issue is that the fixed-effects estimator uses only the within variation in the
data and ignores the between variation. As a result, the coefficients on time-invariant
repressors cannot be estimated. Worse, the estimator provides very imprecise estimates when
the within variation in the data exists, but is very tiny (driven by a few firms only) and partly
reflects noise in the data. This point is important for the interpretation of our results.9
As regards standard errors, we perform estimations using the cluster robust estimator
of variance with clustering by firms. This takes care of potential violations of the iid
assumption regarding the standard errors εit (independently and identically distributed errors).
In particular, it ensures the calculation of correct standard errors when observations within
firm i are correlated in some unknown way, resulting in correlation in εit within i.
6. Data and sample
Our analysis is based on a novel hand-collected dataset of publicly traded Russian companies
that have issued dual class stocks. Specifically, the sample embraces all companies whose
8 Addressing this problem would require finding instruments for a whole bunch of variables related to CEOs and
boards, which is virtually impossible in an exploratory study like ours. 9 The random-effects estimator, which is the main alternative to the fixed-effects estimator, uses not only the
within variation, but also the between variation in the data. It makes, however, a rather restrictive assumption
that firm effects are uncorrelated with the other regressors, which is usually very difficult to justify. Looking
ahead, the Hausman specification test rejects the RE estimator in most of the specifications used in our study.
17
common and preferred shares were traded in the RTS Stock Exchange between 1997 and
2009.10 The choice of the RTS (and not MICEX or any other stock exchange) is motivated by
the wider coverage of the RTS, with more than 50 dual class stock companies listed and
traded there as early as the late 1990s.11
The RTS data on share trade, which are downloadable from the RTS web-site
(http://www.rts.ru), are supplemented with information on ownership, characteristics of shares
from companies’ quarterly reports to the Federal Financial Market Service (FFMS, previously
the Federal Commission on Securities Market). These data have been assembled from the
SKRIN and SPARK databases (www.skrin.ru, http://spark.interfax.ru) which collect and
process original reports submitted by Russian joint-stock companies to the FFMS and
statistical agencies.
These sources provide a large array of variables characterizing various aspects of
firms’ operations. In particular, there is information on the distribution of ownership among
large shareholders (the reporting threshold in Russia is 5 percent), ownership stakes of
affiliated persons (including CEO and other directors, regardless of the size of their stakes)12,
and composition of corporate boards (including name, age, tenure, and previous positions
during the five year period). In addition, they provide information about industry affiliation,
number of employees, and key financial variables of the firms. Using these various sources,
we have assembled a database that contains most important variables characterizing corporate
ownership patterns, size and composition of corporate supervisory boards, as well as
characteristics of managers, in accordance with the discussion in the methodology section.
Overall, the database is an unbalanced annual panel of more than 200 firms during 13 years
(1997-2009) with over 1000 observations in total. The definition of the key variables, which
we use in the empirical analysis, is provided in Table 1 below. Table 2 shows the descriptive
statistics for these variables. Further details concerning the calculation of the voting premium,
Shapley value, and liquidity variables are available in Appendix 2.
10 The distinction between “listed” and “traded” is important in the Russian context. In 2001, for example, there
were over 150 companies with dual class shares listed in the RTS. However, in any quarter of 2001, the number
of companies with reported transactions involving both types of stock was less than half of this number. 11 The choice of a particular exchange has major implications for the measurement of liquidity, an important
control variable in our analysis, especially when the latter is based on trade volumes data. The implications for
the measurement of stock prices are less important as cross-market differences in prices are being consistently
eliminated by arbitrageurs. 12 The disclosure standards adopted in Russia do not generally allow identification of complex ownership
structures, such as family ownership or pyramidal ownership. This is certainly a limitation of the data we use.
18

Table 1. Definitions of variables used in the empirical analysis. Variable Description Dependent variable VP Voting premium (calculated based on the average ask and bid prices over May-August
for each year).* Vector X variables CEO_ownersh Share of CEO in the firm’s equity, percent. CEO _tenure CEO tenure in the firm, full years. CEO _age Age of CEO, years. CEO _gender Dummy for CEO gender (1 stands for male and 0 for female). Vector Y variables BRD_no_direct Supervisory board size, number of people. BRD_a_ownersh Average share of the board members in the firm’s equity, percent. BRD_nonex_share Share of non-executive directors. BRD_male_share Share of men in the supervisory board. BRD_a_age Average age of the members of corporate boards, years. CHAIR_ownersh Ownership stake of the Chairman, percent. CHAIR_age Age of the Chairman, years. CHAIR_gender Dummy for the Chairman’s gender (1 stands for male and 0 for female). Vector Z variables SIZE Firm size – logarithm of the number of employees. POWER, FUELS, CHEMIC, MACNIN, TELECOM, WSALES, OTHER
Industry variables: power stands for power utilities, fuels stands for oil&gas firms, chemic denotes chemistry, machin is a dummy for machine building, telecm stands for transport and communications (mostly telecoms), wsales stands for sales (mostly electricity distribution companies), and other include all remaining industries.
Vector W variables SHAPLEY Shapley value; characterizes the extent to which a small atomistic shareholder can be
pivotal in a control fight over the firm.* SHARE_VOTING Share of common (voting) stocks in equity. DIV10 Dummy for the presence of the 10% dividend rule on preferred shares.(does the
corporate charter requires the firm to pay 10% of net profit as dividend on pref. shares? 0=No, 1=Yes).
ADR Dummy for the issue of ADR (has the firm issued any ADR? 0=No, 1=Yes). VOTE Dummy for enfranchisement of preferred shares in the current year, occurs when the
company did not pay dividends on pref. shares in the previous year (are the preferred shares of the firm voting in the current year? 0=No, 1=Yes).
VETO Dummy for the existence of the veto power for preferred shareholders.(equals 1, if the corporate charter includes the veto power, 0 – otherwise).
LIQUIDITY_comm The variable measures the liquidity of common stocks (calculated as average_bid/average_ask over May-August for each year. The closer this variable to 1, the more liquid the stock is. When it is close to 0, the stock is illiquid).*
LIQUIDITY_pref The variable measures the liquidity of preferred stocks (calculated as average_bid/average_ask over May-August for each year. The closer this variable to 1, the more liquid the stock is. When it’s close to 0, the stock is illiquid).*
Note: * See details in Appendix 2.
19

Table 2. Descriptive statistics. Variable Mean Std. Dev. Min Max
VP 1.13 0.94 -0.12 5.12 CEO_ownersh 0.40 1.05 0 13.68 CEO _tenure 3.60 3.29 0 25 CEO _age 51.21 8.17 30 70 CEO _gender 0.99 0.08 0 1 BRD_no_directors 8.09 2.13 5 18 BRD_av_ownersh 0.08 0.46 0 8.88 BRD_nonex_share 0.76 0.21 0 1 BRD_male_share 0.86 0.15 0.33 1 BRD_av_age 44.86 5.91 28 63.17 CHAIR_ownersh 0.09 0.65 0 8.38 CHAIR_age 47.86 11.45 24 74 CHAIR_gender 0.88 0.32 0 1 SIZE 8.53 1.30 4.06 11.71 POWER 0.31 0.46 0 1 FUELS 0.14 0.35 0 1 CHEMIC 0.02 0.16 0 1 MACNIN 0.04 0.21 0 1 TELECOM 0.37 0.48 0 1 WSALES 0.04 0.19 0 1 OTHER 0.08 0.27 0 1 SHAPLEY 0.04 0.12 0 0.84 SHARE_VOTING 0.79 0.06 0.75 0.99 DIV10 0.90 0.29 0 1 ADR 0.21 0.40 0 1 VOTE 0.13 0.34 0 1 VETO 0.70 0.46 0 1 LIQUIDITY_comm 0.65 0.27 0.01 0.99 LIQUIDITY_pref 0.55 0.30 0.01 0.99 Note: The number of observations for most variables is 1009. Only in a few cases it drops to just below 1000 (for example, BRD_av_ownersh has 974 non-missing values and CHAIR_ownersh has 989 values).
The data in Table 2 show that the average voting premium for the whole period of observation
is equal to 1.13 or 113 percent. This is large by international standards.13 The premium has
also varied over time, being considerably higher in the crisis periods as compared with other
years (see Table 3). Concerning the distribution of the voting premium, it is largely confined
to the interval between 0 and 5 (from zero to 500 percent). Only 1 percent of the observations
of the voting premium exceed the threshold of 500 percent, and only in 2 percent of cases we
see negative values.14 A closer look at the proportion of companies with dual class stock listed
13 For example, the voting premium is 46% in Israel (Levy 1983), 13% in the UK (Megginson 1990), 20% in
Switzerland (Horner 1988), and 23% in Germany (Hoffmann-Burchardi 1999). Among mature stock markets,
the largest premium, about 82%, is found in Italy (Zingales 1994). 14 Negative values of the voting premium (which are, strictly speaking, in conflict with finance theory) are
occasionally found in other stock markets, e.g., in Denmark and Norway. Odegaard (2007) attributes the long
existence of negative voting premia in Norway to regulatory restrictions on foreign ownership. Once those
restrictions were lifted the premium became positive. Neumann (2003) suggests that negative voting premium in
20
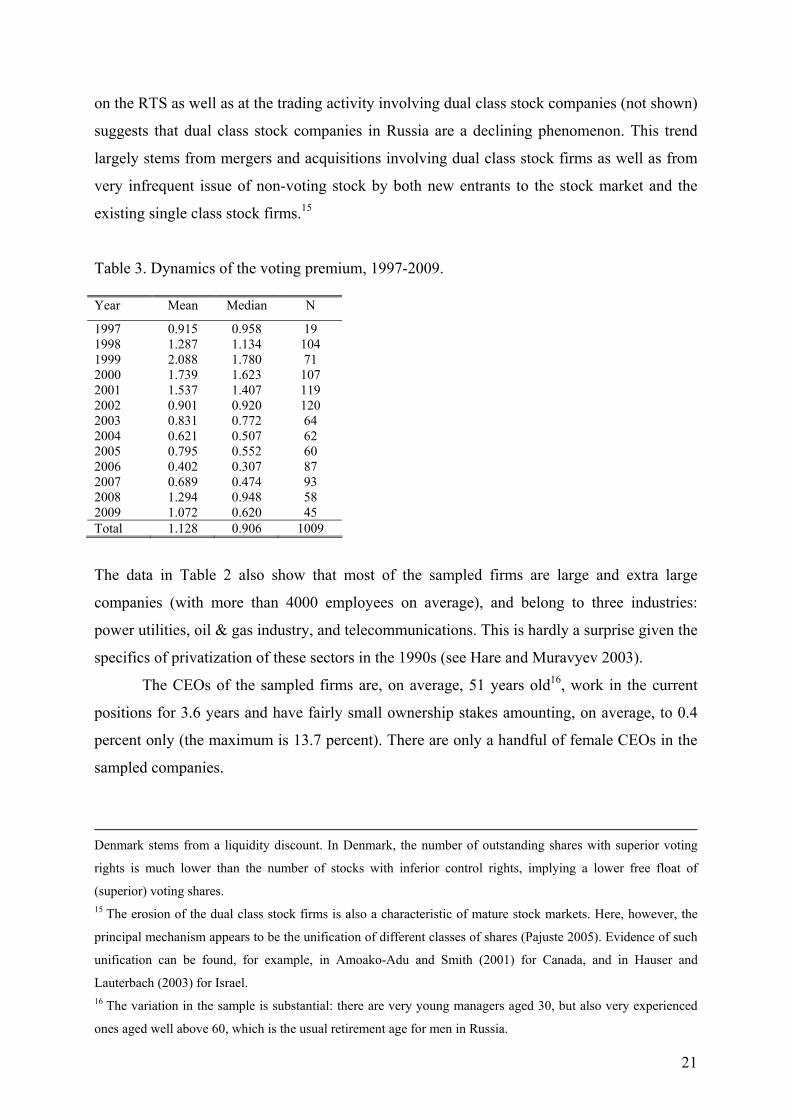
on the RTS as well as at the trading activity involving dual class stock companies (not shown)
suggests that dual class stock companies in Russia are a declining phenomenon. This trend
largely stems from mergers and acquisitions involving dual class stock firms as well as from
very infrequent issue of non-voting stock by both new entrants to the stock market and the
existing single class stock firms.15
Table 3. Dynamics of the voting premium, 1997-2009. Year Mean Median N
1997 0.915 0.958 19 1998 1.287 1.134 104 1999 2.088 1.780 71 2000 1.739 1.623 107 2001 1.537 1.407 119 2002 0.901 0.920 120 2003 0.831 0.772 64 2004 0.621 0.507 62 2005 0.795 0.552 60 2006 0.402 0.307 87 2007 0.689 0.474 93 2008 1.294 0.948 58 2009 1.072 0.620 45 Total 1.128 0.906 1009
The data in Table 2 also show that most of the sampled firms are large and extra large
companies (with more than 4000 employees on average), and belong to three industries:
power utilities, oil & gas industry, and telecommunications. This is hardly a surprise given the
specifics of privatization of these sectors in the 1990s (see Hare and Muravyev 2003).
The CEOs of the sampled firms are, on average, 51 years old16, work in the current
positions for 3.6 years and have fairly small ownership stakes amounting, on average, to 0.4
percent only (the maximum is 13.7 percent). There are only a handful of female CEOs in the
sampled companies.
Denmark stems from a liquidity discount. In Denmark, the number of outstanding shares with superior voting
rights is much lower than the number of stocks with inferior control rights, implying a lower free float of
(superior) voting shares. 15 The erosion of the dual class stock firms is also a characteristic of mature stock markets. Here, however, the
principal mechanism appears to be the unification of different classes of shares (Pajuste 2005). Evidence of such
unification can be found, for example, in Amoako-Adu and Smith (2001) for Canada, and in Hauser and
Lauterbach (2003) for Israel. 16 The variation in the sample is substantial: there are very young managers aged 30, but also very experienced
ones aged well above 60, which is the usual retirement age for men in Russia.
21

The supervisory boards have, on average, eight directors. The directors hold no or
very small fractions of equity in the firms, less than 0.1 percent on average. Most of the
directors sitting on the supervisory boards are non-executive. As compared with CEOs, they
are considerably younger (45 years on average, with many members aged between 26 and 30)
and nearly 15 percent of them are women. The Chairmen of supervisory boards are somewhat
older (48 years) and hold larger stakes in their firms (0.16 percent). Nearly 12 percent of them
are females. The gender statistics therefore show greater presence of women at lower levels of
the corporate hierarchy – almost none among the CEOs, a significant number among the
Chairmen, and even larger fraction among the supervisory board members.
The overwhelming majority of the sampled companies have controlling shareholders,
which results in low Shapley values in the whole sample (by definition, the Shapley value is
equal to zero if a firm has a controlling owner).17 The shareholder capital of the sampled firms
consists, on average, of 21 percent preferred shares and 79 percent common shares (variable
SHARE_VOTING). Common shares appear to be somewhat more liquid than preferred
shares as variables LIQUIDITY_comm and LIQUIDITY_pref suggest.
In order to get an idea about the evolution of corporate governance in Russia we now
turn to the comparison of the key variables between 1999 and 2009. Both years chosen are
post-crisis years, which ensures that we compare firms in two similar environments. The
substantial time span between the two periods allows us to capture important dynamic aspects.
The descriptive statistics for the 1999 and 2009 sub-samples are presented in Table 4. In
addition, Table 4 shows the differences in means and p-values from a double-sided t-test for
the equality of means between the two sub-samples.
Table 5 supplements these statistics with more details about the evolution of key
characteristics of CEOs and corporate boards on the year-by-year basis. Panel A reports the
means and Panel B – the medians of the variables selected. Medians are important in view of
the large number of observations with zero values in some variables, such as ownership by
CEOs and board members. By looking at the medians, one can identify, for example, the time
when the majority of companies became headed by CEOs without any ownership.
We first make a clarifying point about some differences in the industry affiliation
between the 1999 and 2009 sub-samples (implying, more generally, a considerable
unbalancedness of the panel) which are apparent from Table 4. To a large extent, these
differences reflect the reorganization of the two largest industries in our sample, namely,
telecoms and power utilities, which was initiated by government. In the late 1990s, virtually 17 These descriptive statistics are very much in line with those from other studies of corporate governance in Russia, e.g., Kuznetsov and Muravyev (2001), Muravyev (2003), Iwasaki (2008), and Pöyry and Maury (2010).
22

all regions of Russia (89 at the time) had an own telecom and power utility company, which
was a heritage of the privatization program (see Hare and Muravyev 2003). In 2001-2002,
most regional telecoms were reorganized into several larger companies. Vertically integrated
regional power utilities were instead split into power generation, power distribution, and
wholesale companies in 2004-2005, with some horizontal mergers following thereafter.
Changes in firm size reflect these mergers and spin-offs, and to some extent, the general
downsizing of Russian firms. Overall, we believe that changes in the sample due to these
government-initiated sectoral reforms had little to do with private benefits of control and are
therefore not important (ignorable) in our analysis. More generally, as the causes of missing
observations do not appear to be endogenous to the model, the unbalancedness of the panel is
not an issue in our analysis.
Table 4. Comparison of the 1999 and 2009 sub-samples. Variable Mean St.D. Min Max Mean St.D. Min Max Diff p-value
VP 2.09 1.49 -0.01 5.12 1.07 1.01 -0.12 3.92 -1.02 0.000 CEO_ownersh 0.48 0.76 0 4.66 0.03 0.09 0 0.55 -0.45 0.000 CEO_tenure 4.38 3.35 0 25 2.82 3.52 0 15 -1.56 0.018 CEO_age 54.52 8.29 33 70 48.51 9.47 33 69 -6.01 0.000 CEO_gender 1 0 1 1 1 0 1 1 0 n/a BRD_no_directors 8.20 2.48 6 18 9 1.89 6 14 0.80 0.066 BRD_av_ownersh 0.06 0.10 0 0.65 0.09 0.49 0 3.27 0.03 0.575 BRD_nonex_share 0.65 0.18 0.13 1 0.87 0.17 0.17 1 0.22 0.000 BRD_male_share 0.88 0.12 0.50 1 0.81 0.15 0.40 1 -0.07 0.011 BRD_av_age 48.02 4.06 38.81 57.67 42.64 7.23 28.78 63.17 -5.39 0.000 CHAIR_ownersh 0.01 0.05 0 0.30 0.18 0.49 0 1.85 0.16 0.006 CHAIR_age 49.44 11.08 27 73 44.84 10.29 26 66 -4.59 0.027 CHAIR_gender 0.90 0.30 0 1 0.87 0.34 0 1 -0.03 0.567 SIZE 9.11 0.90 6.96 11.70 8.23 1.48 5.53 11.46 -0.88 0.000 POWER 0.17 0.38 0 1 0.29 0.46 0 1 0.12 0.128 FUELS 0.17 0.38 0 1 0.16 0.37 0 1 -0.01 0.850 CHEMIC 0.03 0.17 0 1 0.07 0.25 0 1 0.04 0.324 MACNIN 0.07 0.26 0 1 0.02 0.15 0 1 -0.05 0.257 TELECOM 0.49 0.50 0 1 0.22 0.42 0 1 -0.27 0.003 WSALES 0 0 0 0 0.11 0.32 0 1 0.11 0.004 OTHER 0.07 0.26 0 1 0.13 0.34 0 1 0.06 0.264 SHAPLEY 0.06 0.17 0 0.74 0.06 0.15 0 0.82 0.00 0.986 SHARE_VOTING 0.77 0.04 0.75 0.95 0.81 0.07 0.75 0.99 0.04 0.000 DIV10 0.96 0.20 0 1 0.87 0.34 0 1 -0.09 0.075 ADR 0.20 0.40 0 1 0.29 0.46 0 1 0.09 0.259 VOTE 0.11 0.32 0 1 0.18 0.39 0 1 0.07 0.326 VETO 0.28 0.45 0 1 1 0 1 1 0.72 0.000 LIQUIDITY_comm 0.46 0.29 0.01 0.99 0.54 0.34 0.02 0.98 0.08 0.193 LIQUIDITY_pref 0.29 0.26 0.01 0.98 0.45 0.32 0.01 0.95 0.16 0.004
The data in Table 4 show that CEO share declined between 1999 and 2009, with the
test for the equality of means indicating statistically significant difference at the 1 percent
level. CEO tenure declined too, from 4.4 years to mere 2.8 years; the difference is statistically
23
24
significant at the 5 percent level.18 There was a substantial drop in CEO age, from 54.5 to 48.5
years, significant at the 1 percent level. Interestingly, there was not any woman occupying the
position of CEO in the sampled companies in either year.
The data also suggest a slight increase in the size of corporate boards, a substantial
increase in the share of non-executive directors, and a large drop in the average age of
directors, including Chairmen. Somewhat counter-intuitively, the data show an increase in the
ownership stakes of Chairmen, although the average stake of directors did not change.
As to other variables, there was an increase in the share of common stock in the firms’
equity as well as an increase in the liquidity of preferred stocks (both significant at the 1
percent level). The change in variable VETO merely reflects the 2001 change in corporate law,
which gave preferred shareholders the power to veto unfavorable changes in corporate
charters (see Muravyev, 2009b).
The additional data in Table 5 indeed confirm the downward trends in CEO ownership,
CEO tenure, and CEO age. They also confirm that female CEOs are indeed exceptions in the
sample, with a few women occupying the top positions in 2006-2008 only. The data suggest
no clear dynamics for the size of corporate boards in Russia, albeit the data in Table 4 showed
some increase. However, the shift towards higher proportion of non-executive directors that
we saw in Table 4 appears to be a part of the general trend. There is also a clear tendency
towards younger boards (including Chairmen) in more recent years. No particular tendency is
seen in the Chairman’s ownership stake, in contrast to the comparison of the data from 1999
and 2009 in Table 4. The latter result was apparently driven by the fluctuations in the sample
composition. Overall, the detailed statistics in Table 5 are very much in line with the
comparison of the two sub-samples in Table 4 and confirm a number of strong trends in the
evolution of corporate governance in Russian companies over 1997-2009.
18 The reorganization of power utilities in the mid-2000s is the primary reason for a considerable drop in CEO
tenure in 2006-2007 which is reported in Table 5.

Table 5. Dynamics of CEO and board characteristics. Panel A. Means of variables.
Variable/ Year 1997 1998 1999 2000 2001 2002 2003 2004 2005 2006 2007 2008 2009 Total
CEO_ownersh 0.62 0.62 0.48 0.59 0.71 0.65 0.16 0.14 0.2 0.14 0.1 0.16 0.03 0.4CEO_tenure 4.37
3.54 4.38 4.28 4.33 4.63 3.81 3.84 3.27 2.54 1.77 2.59 2.82 3.6CEO_age 53.8 53.7 54.5 54.1 52.5 52.2 49.8 50.4 49.8 48.3 47.5 48.4 48.5 51.2CEO_gender 1 1 1 1 1 1 1 1 1 0.99 0.98 0.95 1 0.99BRD_no_directors 8.92 7.49 8.2 7.51 7.5 7.33 8.58 8.37 8.77 8.4 8.6
8.93
9 8.09
BRD_av_ownersh 0.05 0.17 0.06 0.14 0.17 0.15 0.02 0.02 0.02 0.01 0 0 0.09 0.08BRD_nonex_share 0.74 0.62 0.65 0.63 0.7 0.75 0.78 0.8 0.85 0.88 0.88 0.85 0.87 0.76BRD_male_share 0.92 0.87 0.88
0.87 0.84 0.82 0.91
0.91 0.87 0.83 0.85 0.86
0.81 0.86
BRD_av_age 50.4 49.1 48 47.9 45.8 45.1 44 43.5 44.1 41.3 41.1 42 42.6 44.9CHAIR_ownersh 0.11 0.12 0.01 0.04 0.1 0.07 0.15 0.17 0.15 0.11 0.02 0.03 0.18 0.09CHAIR_age 53.5 52.5 49.4 51.8 48.2 48.2 48.6 47.6 48.1 43.9 43.4 42.8 44.8 47.9CHAIR_gender 0.92 0.91 0.9 0.79 0.8 0.82 0.98 0.97 0.97 0.92 0.91 0.95 0.87 0.88 Panel B. Medians of variables.
Variable/ Year 1997 1998 1999 2000 2001 2002 2003 2004 2005 2006 2007 2008 2009 Total
CEO_ownersh 0.43 0.21 0.17 0.2 0.16 0.11 0.01 0 0 0 0 0 0 0.01CEO_tenure 3
4 5 5 5 4.5 2 3 2 1 1 2 2 3CEO_age 53 53.5 54 53 52 53 51 51 51 48 49 49 47 52CEO_gender 1 1 1 1 1 1 1 1 1 1 1 1 1 1BRD_no_directors 8 6 8 6 6 6 8 8 9 8 9 9 9 8BRD_av_ownersh 0.03 0.05 0.01 0.04 0.02 0 0 0 0 0 0 0 0 0BRD_nonex_share 0.71 0.67 0.67 0.67 0.75 0.83 0.86 0.86 0.89 0.88 0.9 0.88 0.9 0.83BRD_male_share 0.96 0.88 0.88 0.88 0.83 0.87 0.96 0.9 0.88 0.86 0.88 0.88 0.86 0.88BRD_av_age 51.3 48.9 47.6 48.5 45.7 44.8 43.8 43 43.4 40.4 40.8 41.7 42.7 45.3CHAIR_ownersh 0 0 0 0 0 0 0 0 0 0 0 0 0 0CHAIR_age 56 51 49 53 46 46 46 47 48 44 43 41 42 47CHAIR_gender 1 1 1 1 1 1 1 1 1 1 1 1 1 1

7. Empirical results
Our approach to testing the main research hypotheses is the following. We start with the most
parsimonious baseline specification that contains only one key variable characterizing the
firm’s CEO, namely, her ownership stake. Then we consider the quadratic specification in
CEO ownership. Next, we sequentially add other key variables of interest, starting with
additional characteristics of the CEO and finishing with characteristics of the corporate board
and Chairman. Again, we start with the linear specification and then test for the quadratic
relationship. All estimates reported in the paper are obtained using the fixed-effects estimator.
Table 6 shows the fist set of results for CEO characteristics.19 Column 1 reports results
for the effect of CEO ownership on the private benefits of control using a linear specification.
The coefficient of interest turns to be statistically insignificant. Column 2 shows the results
for a non-linear specification, where the effect of CEO ownership is assumed to be quadratic.
The coefficients of interest remain insignificant when taken separately, but are jointly
significant at the 10 percent level (p-value 0.0543, not reported in the table). We next
augment the model with CEO tenure in years (Column 3). The newly included variable enters
the model with a positive, albeit marginally statistically insignificant coefficient. The
magnitude of the coefficients on CEO ownership (as well as on its quadratic term) changes
somewhat, suggesting correlation between CEO ownership and tenure. Column 4 reports the
results for a quadratic specification in CEO tenure. The coefficient on CEO tenure remains
positive and becomes statistically significant at the 5 percent level, while the coefficient on
the quadratic term is negative, but insignificant. We interpret this result as evidence that CEO
tenure has a positive, albeit diminishing effect on the private benefits of control. The
estimated coefficients on CEO ownership variables now suggest a minimum of private
benefits at CEO ownership of about 3.7 percent. This turning point is between the 95th and
99th percentiles of the distribution of CEO ownership in the sample, therefore the right branch
of the parabola is somewhat difficult to interpret (we discuss this issue later, after examining
additional specifications). Columns 5 and 6 report the results for linear and quadratic
specifications in CEO age. The results suggest non-linearity in the effect of CEO age on the
private benefits of control – the minimum is achieved when CEOs are about 51 years of age,
which is close to the average in the sample. Note that due to the very small number of female
CEOs in our sample (and, apparently, in Russia in general) we cannot say anything about the
effect of CEO gender on private benefits of control.
19 The table reports only those coefficients which are of primary interest in our study. A table with full results is
available in Appendix 3.

Table 6. Estimation results for key characteristics of CEOs. 1 2 3 4 5 6
CEO ownersh 0.0103 -0.1170 -0.1886 -0.2143* -0.2010 -0.2251* (0.0380) (0.1170) (0.1253) (0.1246) (0.1269) (0.1263)CEO ownersh2 0.0174 0.0258* 0.0287** 0.0278* 0.0300** (0.0134) (0.0145) (0.0145) (0.0147) (0.0146)CEO _tenure 0.0179 0.0441** 0.0553*** 0.0505** (0.0117) (0.0209) (0.0204) (0.0198)CEO tenure2 -0.0022 -0.0023* -0.0027** (0.0013) (0.0014) (0.0013)CEO _age -0.0062 -0.1321** (0.0053) (0.0520)CEO age2 0.0013** (0.0005)r2 .37 .37 .37 .37 .37 .38p 2.57e-39 5.54e-40 6.54e-41 1.62e-41 7.64e-40 1.08e-42N 1007 1007 1007 1007 1004 1004Note: The table shows only the key variables of interest. For full results, see Appendix 3. The dependent variable is the voting premium, VP. The results are obtained using the fixed-effects estimator. Cluster-robust standard errors are reported in parentheses. Asterisks ***, **, * denote significance at the 1 percent, 5 percent, and 10 percent levels, respectively.
As to the control variables, most of them enter the regressions with the right sign and
many are statistically significant (see Appendix 3). The coefficient on the Shapley value
(variable SHAPLEY), for example, is positive (which is consistent with theory), albeit
marginally statistically insignificant. This may be due to the fact that most variation in the
Shapley value is across firms and not over time, as ownership of firms does not change much
on the year-by-year basis. However, as the fixed effect estimator ignores all the between
variation in the data, estimation loses precision. The coefficients on the liquidity variables
LIQUIDITY_comm and LIQUIDITY_pref have the right signs and are highly statistically
significant. In particular, the results suggest a decrease in the voting premium due to higher
liquidity of preferred stocks, and an increase in the premium due to higher liquidity of
common shares. We also observe large and statistically significant time effects, mirroring the
dynamics of the voting premium in the raw data (see Table 3). 20
The next set of results is shown in Table 7. We sequentially add variables
characterizing the size of supervisory boards, average ownership stakes of directors, as well as
presence of non-executive directors in firms. As before, we explore both linear and quadratic
specifications. Column 1 shows the results for a linear specification in board size. The 20 We use the FE estimator as specification tests usually do not support the pooled OLS and RE estimators. In
Appendix 4 we show the results of the RE estimation mirroring the FE results just discussed. The Breusch and
Pagan test (unambiguously) suggests the presence of unobserved firm-level effects; the Hausman test rejects the
consistency of the RE estimator in three out of six cases while in the other three cases it does not reject on the
margin. Given that the Hausman test has low power (often does not reject when it should), we focus on the FE
results.
27

coefficient on the newly added variable is statistically insignificant. In Column 2 we test a
quadratic specification in board size. The two variables of interest are statistically significant,
suggesting a parabolic relationship with a dip in private benefits of control at board size of
about nine directors. This is slightly above the average in the sample and given the large range
of variable BRD_no_directors we can interpret the result as suggesting the optimality of
medium-sized boards (as opposed to both very large and very small ones). The specifications
in Columns 3 and 4 test the importance of the average shareholding of board members.
Neither the linear specification (Column 3) nor the quadratic one (Column 4) suggests any
effect, however. The coefficients on the other variables of interests are barely affected. In
Columns 5 and 6 we test the importance of non-executive directors in corporate supervisory
boards. The results show no statistically significant relationship between private benefits of
control and the share of non-executive directors, regardless of the specification used. This
exercise does not lead to any important changes in the other coefficients of interest. In
particular, we still observe (see Column 6) a dip in private benefits of control when CEO
ownership reaches about 3.9 percent, a positive, albeit diminishing relationship between CEO
tenure and private benefits of control (the estimates suggest a parabola with the peak of
private benefits at 8.6 years of CEO tenure, which is between the 90th and 95th percentiles of
the distribution), and very well-defined parabolas in CEO age and board size. In particular,
the minimum of private benefits obtains at CEO age of about 53 years and board of directors
consisting of 9.6 people.
28

Table 7. Estimation results for key characteristics of CEOs and boards. 1 2 3 4 5 6
CEO ownersh -0.2241* -0.2395* -0.2537** -0.2379** -0.2018* -0.2015* (0.1256) (0.1226) (0.1222) (0.1179) (0.1219) (0.1212)CEO ownersh2 0.0295** 0.0301** 0.0316** 0.0300** 0.0263* 0.0263* (0.0145) (0.0143) (0.0142) (0.0138) (0.0140) (0.0139)CEO _tenure 0.0489** 0.0449** 0.0459** 0.0461** 0.0459** 0.0459** (0.0198) (0.0203) (0.0202) (0.0202) (0.0204) (0.0201)CEO tenure2 -0.0029** -0.0026* -0.0026* -0.0027* -0.0027* -0.0027* (0.0014) (0.0014) (0.0014) (0.0014) (0.0015) (0.0015)CEO _age -0.1418*** -0.1384** -0.1406** -0.1393** -0.1363** -0.1363** (0.0541) (0.0543) (0.0544) (0.0545) (0.0551) (0.0553)CEO age2 0.0014** 0.0013** 0.0014** 0.0013** 0.0013** 0.0013** (0.0005) (0.0005) (0.0005) (0.0005) (0.0005) (0.0005)RD_no_directors 0.0242 -0.2523** -0.2931** -0.2901** -0.3019** -0.3016*** (0.0312) (0.1194) (0.1204) (0.1208) (0.1163) (0.1152)RD no directors2 0.0135** 0.0152** 0.0151** 0.0158*** 0.0158*** (0.0060) (0.0060) (0.0061) (0.0057) (0.0057)BRD_av_ownersh 0.0058 -0.1261 -0.1331 -0.1335 (0.0616) (0.2678) (0.2688) (0.2694)BRD av ownersh2 0.0141 0.0147 0.0147 (0.0236) (0.0237) (0.0237)BRD_nonex_share 0.1238 0.1466 (0.2255) (0.8298)BRD nonex share2 -0.0184 (0.6017)r2 .38 .39 .39 .39 .39 .39p 5.74e-41 2.97e-42 7.14e-42 1.57e-42 5.52e-42 3.97e-42N 980 980 969 969 951 951Note: The table shows only the key variables of interest. The dependent variable is the voting premium, VP. The results are obtained using the fixed-effects estimator. Cluster-robust standard errors are reported in parentheses. Asterisks ***, **, * denote significance at the 1 percent, 5 percent, and 10 percent levels, respectively.
Table 8 shows the results for additional specifications in which we look at the effect of
the gender and age composition of corporate boards, as well as at several characteristics of
Chairmen. Columns 1 and 2 display the results for the proportion of male directors on
corporate boards. Neither the linear specification nor the quadratic one delivers statistically
significant relationships. Columns 3 and 4 present the results for the effect of the average age
of board members on the private benefits of control. The linear specification shown in
Column 3 suggests a negative effect of age on private benefits: the older the directors, the
smaller the private benefits. The quadratic specification shown in Column 4 shows
insignificant coefficients on the two variables of interest. However, they are jointly significant
at the 5 percent level (p-value 0.0378, not shown in the table). This is one of the two cases
throughout our analysis when a linear specification is preferred to a quadratic one. The
regressions in Columns 5 and 6, in which we explore the effect of the Chairman’s
characteristics (ownership stake, age, and gender), are therefore linear in the average age of
board members. The results in Column 5 suggest a positive effect of the ownership stake held
by the Chairman on the private benefits. The results reported in Column 6 do not support the
29

quadratic specification in the Chairman’s ownership stake, however. The effect of ownership
by the Chairman is considerably smaller (in absolute value) than the effect of CEO ownership,
but a striking feature is the positive sign of the coefficient on CHAIR_ownersh variable,
suggesting that private benefits increase in the Chairman’s ownership stake.
Table 8. Additional estimation results for key characteristics of CEOs and boards. 1 2 3 4 5 6
CEO ownersh -0.1994 -0.2007 -0.2118* -0.2217* -0.2472** -0.2524** (0.1217) (0.1242) (0.1262) (0.1293) (0.1196) (0.1195)CEO ownersh2 0.0260* 0.0261* 0.0282** 0.0293** 0.0326** 0.0336** (0.0140) (0.0142) (0.0142) (0.0145) (0.0134) (0.0134)CEO _tenure 0.0459** 0.0459** 0.0484** 0.0484** 0.0511*** 0.0500*** (0.0205) (0.0206) (0.0190) (0.0190) (0.0192) (0.0191)CEO tenure2 -0.0027* -0.0027* -0.0027* -0.0026* -0.0027* -0.0027* (0.0015) (0.0015) (0.0014) (0.0014) (0.0014) (0.0014)CEO_age -0.1363** -0.1361** -0.1222** -0.1222** -0.1153** -0.1144** (0.0556) (0.0560) (0.0542) (0.0542) (0.0549) (0.0532)CEO age2 0.0013** 0.0013** 0.0012** 0.0012** 0.0011** 0.0011** (0.0005) (0.0006) (0.0005) (0.0005) (0.0005) (0.0005)RD_no_directors -0.3038*** -0.3032*** -0.3050** -0.3002** -0.3071** -0.3015** (0.1158) (0.1163) (0.1196) (0.1183) (0.1216) (0.1193)RD no directors2 0.0159*** 0.0158*** 0.0157*** 0.0154*** 0.0157*** 0.0154*** (0.0057) (0.0057) (0.0058) (0.0058) (0.0059) (0.0058)BRD_av_ownersh -0.1345 -0.1307 -0.0551 -0.0766 -0.2549 -0.2699 (0.2702) (0.2711) (0.2767) (0.2971) (0.2004) (0.2006)BRD av ownersh2 0.0148 0.0145 0.0091 0.0113 0.0271 0.0284 (0.0238) (0.0238) (0.0243) (0.0261) (0.0179) (0.0179)BRD_nonex_share 0.1423 0.1393 0.4272 0.3846 0.3863 0.4092 (0.8372) (0.8415) (0.8191) (0.8172) (0.8309) (0.8375)BRD nonex share2 -0.0172 -0.0148 -0.2584 -0.2326 -0.2288 -0.2506 (0.6048) (0.6070) (0.5950) (0.5907) (0.6040) (0.6109)BRD_male_share 0.0185 -0.2096 -0.2351 -0.2705 -0.0395 0.0231 (0.3290) (1.7204) (1.6819) (1.6829) (1.6372) (1.6223)BRD male share2 0.1477 0.2238 0.2365 0.1436 0.1040 (1.1059) (1.0808) (1.0837) (1.0581) (1.0475)BRD_av_age -0.0181** 0.0579 -0.0181** -0.0183** (0.0077) (0.0695) (0.0077) (0.0078)BRD av age2 -0.0009 (0.0008) CHAIR_gender -0.1508 -0.1404 (0.1562) (0.1582)CHAIR_ownersh 0.1105*** -0.0303 (0.0371) (0.1338)CHAIR_age 0.0001 0.0016 (0.0035) (0.0273)CHAIR ownersh2 0.0184 (0.0154)CHAIR age2 -0.0000 (0.0003)r2 .39 .39 .39 .39 .39 .39p 9.28e-43 2.05e-42 4.70e-43 7.59e-43 5.43e-49 4.93e-49N 950 950 947 947 947 947Note: The table shows only the key variables of interest. The dependent variable is the voting premium, VP. The results are obtained using the fixed-effects estimator. Cluster-robust standard errors are reported in parentheses. Asterisks ***, **, * denote significance at the 1 percent, 5 percent, and 10 percent levels, respectively.
30

The coefficients on the other variables of interests do not change much in Table 8 as
compared with Tables 6 and 7. In particular, we still observe statistically significant
relationships between the voting premium (our measure of private benefits) on the one hand
and CEO ownership, tenure, and age as well as board size, on the other hand.
We next use the regression in Column 5 of Table 8 (our preferred model) to present
the estimated non-linear relationships in a graphical form. In particular, for each percentile
(from the 1st to 99th) of the distributions of variables CEO_ownersh, CEO_tenure, CEO_age,
and BRD_no_directors we calculate the estimated effects and the 10 and 5 percent confidence
intervals. The results are shown in Charts 1 to 4.
Chart 1 suggests a U-shaped relationship between CEO ownership and the voting
premium. However, the turning point occurs quite far on the right of the distribution of CEO
ownership (at 3.8 percent, the sample average is way below, 0.4 percent only), and the right
branch of the parabola is only marginally significant (the 5 percent confidence interval
contains zero already at the turning point). Overall, our results can be interpreted as
suggesting that the incentive effect prevailing at low levels of CEO ownership gets
countervailed by other effects (e.g., entrenchment), but the small number of observations with
substantial CEO ownership does not allow us to get a more precise picture.
Chart 2 depicts the relationship between CEO tenure and the voting premium. This is
a downward facing parabola, with a very wide confidence interval in the right tail of the
distribution of CEO tenure. The turning point, which is at 9.5 years, is far above the average
tenure in the sample, which is 3.6 years only. As there is no theory suggesting why CEOs
with long tenures may extract less private benefits of control, we interpret this result as
positive but diminishing relationship between CEO tenure and private benefits.
Chart 3 shows the relationship between CEO age and the voting premium. This is a
well-defined upward facing parabola with the turning point at about 52.4 years of age. This
number is pretty close to the sample average, which is 51.2. The effect is statistically
significant on the whole support of CEO age.
Finally, Chart 4 shows the relationship between board size and the voting premium.
This is an upward facing parabola with the turning point at about 9.7 (the sample average is
8.1). The effect is negative and statistically significant, except for the extreme right of the
distribution of board size, where the confidence interval contains zero. Overall, the chart
provides substantial evidence for the optimality of the medium-sized boards.
31

Chart 1. The estimated relationship between the voting premium and CEO ownership share
with confidence intervals.
-1-.5
0vo
ting
prem
ium
0 1 2 3 4 5CEO share
lower 5% upper 5% lower 10% upper 10% estimated effect
Chart 2. The estimated relationship between the voting premium and CEO tenure with
confidence intervals.
-.20
.2.4
.6vo
ting
prem
ium
0 5 10 15CEO tenure
lower 5% upper 5% lower 10% upper 10% estimated effect
32

Chart 3. The estimated relationship between the voting premium and CEO age with
confidence intervals. -6
-4-2
0vo
ting
prem
ium
30 40 50 60 70CEO age
lower 5% upper 5% lower 10% upper 10% estimated effect
Chart 4. The estimated relationship between the voting premium and board size with
confidence intervals.
-3-2
-10
votin
g pr
emiu
m
5 10 15board size
lower 5% upper 5% lower 10% upper 10% estimated effect
33
8. Results discussion
How can we interpret the results of our empirical analysis? Are they consistent with the
existing literature, fully or partly? Below we offer a brief discussion of these issues.
One of the key findings from our analysis is a non-linear relationship between CEO
ownership and private benefits of control. We observe a decline in the voting premium when
CEO ownership increases in the range of zero to four percent. However, further increases in
CEO ownership are associated with increases in the voting premium. This finding is
consistent with the incentive alignment argument at low levels of CEO ownership and the
entrenchment and/or risk aversion effects at higher levels of CEO ownership. It is similar, for
example, to the findings of the influential study by Morck, Schleifer and Vishny (1988)
suggesting that the entrenchment effect is dominant between five percent and 25 percent, and
the alignment effect is dominant in the ranges of zero to five percent and also above 25
percent managerial ownership. It is also similar to the recent findings by Benson and
Davidson (2009) who report a significant inverted U-shaped relationship between CEO
ownership and company value. Note that we cannot prove or dismiss the prevalence of the
incentive alignment argument at high values of CEO ownership due to the lack of variation in
our data. The largest ownership stake held by CEOs is below 14 percent in our sample.
Nevertheless, our analysis provides important additional evidence for non-linearities
associated with CEO ownership.
Perhaps, one of the most interesting (and also somewhat puzzling) results is the U-
shaped relationship between CEO age and private benefits of control, with a dip in private
benefits occurring when CEOs are about 52 years old. The interpretation of the right branch
of this parabola is rather intuitive, as it is consistent, for example, with the idea that older
CEOs have shorter decision horizons and are less concerned about their careers, which makes
the extraction of private benefits of control a more attractive strategy. Indeed, Davidson et al.
(2007) show that older CEOs are more likely to engage in earnings management. The left
branch of the parabola (large private benefits for young and very young CEOs) is more
difficult to justify based on the existing theories, such as those focusing on career concerns or
life-cycle consumption patterns. The issue apparently deserves a special and detailed
investigation.
Our analysis suggests a positive relationship between CEO tenure and the voting
premium, albeit with some curvature at the top of the distribution of CEO tenure. This
positive but diminishing relationship is consistent with the hypothesis that CEOs with longer
tenures have greater influence on the selection of new directors and greater control of the
board in general. Greater control over the board makes CEOs less constrained in their
34

decisions, including extraction of private benefits. Overall, this result is in line with the
findings from several other studies, such as Daily and Dalton (1994) and Finkelstein and
D’Aveni (1994) who show a central role of CEO power (which accumulates with tenure) in
corporate governance.
We find a nonlinear relationship between the voting premium and the size of corporate
boards. An increase in the board size in the range from 5 to 9 directors reduces the voting
premium. However, for large boards with 10 to 17 directors, adding an extra director seems to
increase the voting premium. This result is partially consistent with a number of previous
studies suggesting that large boards are ineffective in monitoring managers (Eisenberg,
Sundgren and Wells 1998); it is also consistent with the literature suggesting potential flaws
of small boards, such as greater involvement of CEOs in selecting directors (e.g., Shivdasani
and Yermack 1999) or the lack of capacity (Jensen 1993). Overall, the quadratic relationship
that we report in our study is similar to the findings in some studies, such as Andres and
Vallelado (2008) for the banking sector. More substantially, our results are in line with the
notion of the optimal board size, expressed in Jensen (1993) and Lipton and Lorsch (1992).
The fact that we use a proxy of private benefits of control rather than a conventional measure
of corporate performance reinforces these previous findings in a non-trivial way. Of course,
there is a caveat that our results are not necessarily interpretable in the causal sense because of
the lack of exogenous variation in the data. Indeed, the endogeneity of board size has been an
important issue in the corporate governance literature, although different studies report
different results (Hermalin and Weisbach 2003; Beiner et al. 2004; Harris and Raviv 2008).
Among other characteristics of corporate boards, we find a non-trivial association
between the average age of directors and private benefits of control. The latter seem to
decrease with the average age of board members. This result can be related to greater
experience or higher independence of more senior members of corporate boards. We admit,
however, that this issue may deserve additional and more detailed analysis.
The results also show a positive association between the ownership stake of the
Chairman and the voting premium, which is rather counterintuitive. Indeed, other things being
equal, larger ownership stakes can be thought to increase the motivation of directors to
monitor managers and thus should be associated with smaller private benefits (or, at least, one
can expect no positive effect, similarly to what we observe for the average ownership stake of
directors). We interpret this result as having to do with a particular feature of corporate
governance in Russia, namely, that a departing CEO (regardless of whether this is due to age
or poor performance) is often offered the position of the firm’s Chairman. This was
particularly common in the 1990s and early 2000s, with the generation of CEOs who acquired
35

significant ownership stakes in their firms during the process of privatization. Evidence of
such transitions from the position of CEO to the position of Chairman can be found, for
example, in Rachinski (2005), who calls them “honor retirements”.
Finally, our econometric results suggest no gender effects. The reason may be in the
selection process accompanying women’s promotion to the top of the corporate hierarchy:
while women are, for example, more risk averse and less overconfident than men in the
population in general, women in the corporate headquarters are not necessarily so. Indeed,
several studies, such as Johnson and Powell (1994) and Atkinson, Baird and Frye (2003)
provide evidence that such gender differences are considerably smaller among managers than
in the general population.
9. Conclusion
Starting with Berle and Means (1932), the corporate governance literature has dealt with the
question of which governance mechanisms and arrangements can best mitigate the corporate
governance conflict between suppliers and users of capital, a key issue in the functioning of
the modern corporation (Shleifer and Vishny 1997). Recently, there has been growing interest
in the role of various characteristics of CEOs and corporate boards, including directors’
gender, age, tenure, and ownership stakes in the firm. In this paper we study how these
characteristics are related to private benefits of control, which are a direct indicator of
corporate governance problems in firms. This is the key strength of our paper relative to the
existing literature, which typically examines the effect of corporate governance mechanisms
and arrangements on firm performance.
Our analysis suggests that increases in CEO ownership, at least until the threshold of 4
percent, mitigate corporate governance conflicts between the suppliers and users of capital.
Further increases in CEO ownership seem to be associated with higher private benefits, due to
the managers’ entrenchment or risk aversion. We also find that CEO longevity at the top
position in the firm is associated with larger private benefits. One of the most interesting and
somewhat puzzling findings, which may require additional research, is the non-linear
relationship between private benefits and CEO age, with the minimum at 52 years of age. We
also find evidence suggesting the optimality of medium-sized boards as opposed to very small
one and very large one. This finding adds to the long-standing debate about the effect of board
size on corporate performance. Finally, our analysis does not suggest any effect of the gender
composition of supervisory boards on private benefits of control.
Our paper is among the first to focus on the link between key characteristics of CEOs
and boards on the one hand and private benefits of control on the other hand and is therefore
36

of exploratory nature. As such, it has a number of limitations, which should be addressed in
further studies. One limitation is that our results do not necessarily imply causal relationships.
In particular, the results may be influenced by omitted variables and reversed causation.
Although fixed effects specifications, which our study is based upon, take care of some of
these issues, they do not solve the problem in its entirety. Identification of causal effects
would require natural experiments and/or strong and valid instruments for a group of variables
characterizing CEOs and boards, which are not available to us. Another limitation is related to
the external validity of our study, stemming from its focus on a single country. Although
Russia is an important emerging market and has recently been regarded as a promising testing
ground for economic theories, one cannot automatically generalize from its experiences to
other economies. Further research focusing on other stock markets is clearly needed.
37

References
Adams, R. and Ferreira, D. (2009) Women in the boardroom and their impact on governance and performance. Journal of Financial Economics 94: 291-309.
Adjaoud, F., Zeghal, D. and Andaleeb, S. (2007) The effects of boards quality on performance: a study of Canadian Firms. Corporate Governance: An International Review 15 (4): 623-635.
Agrawal, A. and Knoeber, C. (1996) Firm performance and mechanisms to control agency problems between managers and shareholders. Journal of Financial and Quantitative Analysis 31 (3): 377–398.
Albuquerque, R. and Schroth, E. (2010) Quantifying private benefits of control from a structural model of block trades. Journal of Financial Economics 96 (1): 33-55.
Amihud, Y. and Mendelson, H. (1986) Asset pricing and the bid–ask spread. Journal of Financial Economics 17 (2): 223–249.
Amihud, Y. and Mendelson, H. (1991) Liquidity, asset prices, and financial policy. Financial Analysts Journal 47 (6): 56–66.
Amoako-Adu, B. and Smith, B. (2001) Dual class firms: capitalization, ownership structure and recapitalization back into single class. Journal of Banking and Finance 25: 1083-111.
Andres, P. and Vallelado, E. (2008) Corporate governance in banking: the role of the board of directors. Journal of Banking and Finance 32 (12): 2570-2580.
Antia, M., Pantzalis, C. and Park, J. (2010) CEO decision horizon and firm performance. An empirical investigation. Journal of Corporate Finance 16: 288–301.
Atkinson, S., Baird, S. and Frye M. (2003) Do female mutual fund managers manage differently? Journal of Financial Research 26 (1): 1–18.
Barber, Brad M. and Terrance Odean (2001) Boys Will Be Boys: Gender, Overconfidence, And Common Stock Investment, Quarterly Journal of Economics, 116(1): 261-292.
Barclay, M. and Holderness, C. (1989) Private benefits from control of public corporations. Journal of Financial Economics 25 (2): 371-395.
Bartholdy, J., Olson, D. and Peare, P. (2007) Conducting event studies on a small stock exchange. European Journal of Finance, 13 (3): 227-252.
Becht, M., Bolton, P. and Roell, A. (2002) Corporate governance and control. NBER Working Paper No. 9371.
Beiner, Stefan, Wolfgang Drobetz, Frank Schmid and Heinz Zimmermann (2004) Is Board Size an Independent Corporate Governance Mechanism? Kyklos 57(3): 327-356.
Benos, E. and Weisbach, M. (2004) Private benefits and cross-listings in the United States. Emerging Markets Review 5 (2): 217-240.
Benson, B. and Davidson, W. III (2009) Reexamining the managerial ownership effect on firm value. Journal of Corporate Finance 15: 573-586.
Berle, A. and Means, G. (1932) The Modern Corporation and Private Property. New York: Macmillan.
Bhagat, S. and Black, B. (2002) The non-correlation between board independence and long-term board performance. Journal of Corporation Law 27 (2): 231–273.
Black, B. (2001) Does corporate governance matter? A crude test using Russian data. University of Pennsylvania Law Review 149 (6): 2131–2150.
38

Black, B. and Kraakman, R. (1996) A Self Enforcing Model of Corporate Law. Harvard Law Review 109: 1911-1982.
Black, B., Love, I. and Rachinsky, A. (2006) Corporate governance indices and firms’ market values: time series evidence from Russia. Emerging Markets Review 7(4):361-379.
Blasi, J., Kroumova, M. and Kruse, D. (1997) Kremlin Capitalism: The Privatization of the Russian Economy. Ithaca, NY and London: Cornell University Press.
Boycko, M., Shleifer, A. and Vishny, R. (1995) Privatizing Russia. Cambridge: M.I.T. Press.
Brown, J. David, John Earle and Almos Telegdy (2005) The Productivity Effects of Privatization: Longitudinal Estimates from Hungary, Romania, Russia, and Ukraine, CERT Discussion Papers 0508, Heriot Watt University.
Carter, David A., Betty J. Simkins, and W. Gary Simpson (2003) Corporate Governance, Board Diversity, and Firm Value. Financial Review 38(1): 33-53.
Chen, D. (2007) The monitoring and advisory functions of corporate boards: theory and evidence. Unpublished manuscript, Duke University.
Cheung, W., Wei, A. and John, K. (2006) Insider ownership and corporate performance: evidence from the adjustment cost approach. Journal of Corporate Finance 12: 906–925.
Chevalier, J. and Ellison, G. (1999) Are some mutual fund managers better than others? Cross-sectional patterns in behavior and performance. Journal of Finance 54 (3): 875-899.
Chhaochharia, V. and Grinstein, Y. (2007) Corporate governance and firm value: the impact of the 2002 Governance Rules. Journal of Finance 52 (4): 1789-1825.
Chubais, A. (1999) (ed.) Privatization: the Russian style (Privatizatsiya po-rossiyski). Vagrius, Moscow.
Chung, S. and Peihwang, W. (2005) The relationship between bid–ask spreads and holding periods: the case of Chinese A and B shares. Global Finance Journal 15 (3):239- 249.
Cole, R. and Mehran, H. (2009) Gender and the availability of credit to privately held firms: evidence from the surveys of small business finances. Staff Reports 383, Federal Reserve Bank of New York.
Coles, Jeffrey L., Daniel, Naveen D., and Naveen, Lalitha (2008) Boards: Does one size fit all, Journal of Financial Economics, 87(2): 329-356.
Conyon, M. and Peck, S. (1998) Board size and corporate performance: evidence from European countries. European Journal of Finance 4: 291–304.
Core, J. and Larcker, D. (2002) Performance consequences of mandatory increases in executive stock ownership. Journal of Financial Economics 64: 317–340.
Daily, C. and Dalton, D. (1994) Bankruptcy and corporate governance: the impact of board composition and structure. Academy of Management Journal 37: 1603-1617.
Dalton, D., Daily, C., Johnson, J. and Ellstrand, A. (1999) Number of directors and financial performance: a meta-analysis. Academy of Management Journal 42: 674–686.
Davidson, W., Xie, B., Xu, W. and Ning, Y. (2007) The influence of executive age, career horizon and incentives on pre-turnover earnings management. Journal of Management and Governance 11 (1): 45-60.
Desai, M., Dyck, A. and Zingales, L. (2007) Theft and taxes. Journal of Financial Economics 84 (3): 591-623.
Dharmapala, D. and Khanna, V. (2008) Corporate governance, enforcement, and firm value: evidence from India. SSRN working paper. 39

Doidge, C. (2004) U.S. cross-listings and the private benefits of control: evidence from dual-class firms. Journal of Financial Economics 72 (3): 519-553.
Dyck, A. and Zingales, L. (2004) Private benefits of control: an international comparison. Journal of Finance 59 (2): 537-600.
Earle, J. and Estrin, S. (1997) After voucher privatization: the structure of corporate ownership in Russian manufacturing industry. CEPR Discussion Paper No. 1736.
Eisenberg, T., Sundgren, S. and Wells, M. (1998) Larger board size and decreasing firm value in small firms. Journal of Financial Economics 48: 35–54.
Finkelstein, S. and D’Aveni, R. (1994) CEO duality as a double-edged sword: how boards of directors balance entrenchment avoidance and unity of command. Academy of Management Journal 37: 1079-1108.
Franks, J. and Mayer, C. (2001) Ownership and control of German corporations. Review of Financial Studies 14 (4): 943-77.
Gibbons, R. and Murphy, K. (1992) Optimal incentive contracts in the presence of career concerns: theory and evidence. Journal of Political Economy 100: 468-505.
Goetzmann, W., Spiegel, M. and Ukhov, A. (2003) Modelling and measuring Russian corporate governance: the case of Russian preferred common shares. NBER Working Paper No. 9469.
Goriaev, A. and Zabotkin, A. (2006) Risks of investing in the Russian stock market: lessons of the first decade. Emerging Markets Review 7 (4): 380-397.
Gourevitch, P. and Shinn, J. (2005) Political power and corporate control: the new global politics of corporate governance. Princeton University Press, Princeton, NJ.
Groson, D. and Gneezy, U. (2009) Gender differences in preferences. Journal of Economic Literature 47 (2): 448-474.
Grossman, S. and Hart, O. (1988) One share-one vote and the market for corporate control. Journal of Financial Economics 20 (1): 175-202.
Guay, W. (1999). The sensitivity of CEO wealth to equity risk: an analysis of the magnitude and determinants. Journal of Financial Economics 53: 43–71.
Guillaume, D., Dacorogna, M., Dave, R., Muller, U., Olsen, R. and Pictet, O. (1997) From the bird’s eye to the microscope: a survey of new stylized facts of the intra-daily foreign exchange markets. Finance and Stochastics 1: 95-129.
Hare, P. and Muravyev, A. (2003) Privatization in Russia, in: D. Parker, D. Saal (eds.) “International Handbook on Privatization”, Edward Elgar Publishing, Cheltenham, UK.
Harris, M. and Raviv, A. (2008) A theory of board control and size. Review of Financial Studies 21: 1797-1832.
Hauser, S. and Lauterbach, B. (2003) The value of voting rights to majority shareholders: evidence from dual class stock unifications. Review of Financial Studies 7: 125-148.
Hermalin, B. and Weisbach, M. (1998) Endogenously chosen boards of directors and their monitoring of the CEO. American Economic Review 88: 96–118.
Hermalin, B. and Weisbach, M. (2003) Boards of directors as an endogenously determined institution: a survey of the economic literature. Economic Policy Review 9 (1): 7-26.
Higgs, D. (2003) Review of the role and effectiveness of nonexecutive directors / www.dti.gov.uk/cld/non_execs_review.
40

Hilt, E. (2008) Wall Street’s First Corporate Governance Crisis: The Conspiracy Trials of 1826. Paper presented at the University of California Davis conference “Crises and Prosperity in Comparative Economic History”, May 23-25, 2008.
Hoffmann-Burchardi, U. (1999) Corporate governance rules and the value of control: a study of German dual-class shares. FMG Discussion paper No. 315 (London School of Economics).
Holmstrom, Bengt (1982) Managerial Incentive Problems: A Dynamic Perspective. In: Essays in Economics and Management in Honor of Lars Wahlbeck. Helsinki: Swedish School of Economics.
Horner, Melchior R. (1988) The value of the corporate voting right: Evidence from Switzerland, Journal of Banking and Finance, 12(1):69-83.
Iwasaki, I. (2008) The Determinants of Board Composition in a Transforming Economy: Evidence from Russia, Journal of Corporate Finance, 14(5): 532-549.
Jensen, M. (1993) The modern industrial revolution, exit, and the failure of internal control systems. Journal of Finance 48 (3) 831-880.
Jensen, M. (1997) Eclipse of the public corporation. Harvard Business Review (Sept.-October 1989, revised).
Jensen, M. and Meckling, W. (1976) Theory of the firm: managerial behavior, agency costs and ownership structure. Journal of Financial Economics 3: 305-360.
Jensen, M. and Smith, C. (1985) Stockholder, manager, and creditor interests: applications of agency theory. In: Altman, E.I., Subrahmanyam, M.G. (Eds.), Recent advances in corporate finance. Irwin, Homewood, IL.
Johnson, J. and Powell, P. (1994) Decision making, risk and gender: Are managers different? British Journal of Management 5: 123-138.
Kalyta, P. (2009) Accounting discretion, horizon problem and CEO retirement benefits. Accounting Review 84 (5): 1553–1573.
Karamanou, I. and Verfas, N. (2005) The association between corporate boards, audit committees and management earnings forecasts: an empirical analysis. Journal of Accounting Research 43 (3): 453–486.
Khanna, V. (2009) Law enforcement and stock market development: evidence from India. Working paper, Center on Democracy, Development, and The Rule of Law, Stanford University.
Klein, A. (1998) Firm performance and board committee structure. Journal of Law & Economics 41(1): 275-303.
Koutmos, G. and Tucker, M. (1996) Temporal relationships and dynamic interactions between spot and futures stock markets. Journal of Futures Market 16 (1): 55-69.
Kuznetsov, P. and Muravyev, A. (2001) Ownership Concentration and Firm Performance in Russia: The Case of Blue Chips of the Stock Market, Acta Oeconomica, 51(4): 469-488.
Lawrence, J. and Stapledon, G. (1999) Do independent directors add value? Research Report, Melbourne: Centre for Corporate Law and Securities Regulation, University of Melbourne.
Le, T. and Buck, T. (2011) State ownership and listed firm performance: a universally negative governance relationship? Journal of Management and Governance 15: 227-248.
Lease, R., McConnell, J. and Mikkelson, W. (1983) The market value of control in publicly traded corporations. Journal of Financial Economics 11: 439-472.
41

Leech, D. (1988) The Relationship between shareholding concentration and shareholder voting power in British companies: a study of the application of power indices for simple games. Management Science 34 (4): 509-527.
Leech, D. (2003) Computing power indices for large voting games. Management Science 49 (6): 831-838.
Lehn, K., Patro, S. and Zhao, M. (2009) Determinants of the size and composition of US corporate boards: 1935-2000. Financial Management, Winter: 747-780.
Levy, Haim (1983) Economic Evaluation of Voting Power of Common Stock, Journal of Finance, 38(1): 79-93.
Li, Xiaoyang, Low, Angie and Makhija, Anil K. (2011) Career Concerns and the Busy Life of the Young CEO, Working Paper Series 2011-4, Ohio State University, Charles A. Dice Center for Research in Financial Economics.
Lin, Ji-Chai and John S. Howe (1990) Insider Trading in the OTC Market. Journal of Finance, 45(4): 1273-84.
Lipton, M. and Lorsch, J. (1992) A modest proposal for improved corporate governance. Business Lawyer 48: 59-77.
Masulis, R., Wang, C. and Xie, F. (2009) Agency problems in dual-stock companies. Journal of Finance 54 (4): 1697-1727.
McConnell, J. and Servaes, H. (1990) Additional evidence on equity ownership and corporate value. Journal of Financial Economics 27: 595–612.
Megginson, William L. (1990) Restricted Voting Stock, Acquisition Premiums, and the Market Value of Corporate Control, The Financial Review, 25(2): 175-98.
Milnor, J. and Shapley, L. (1978) Values of large games II: oceanic games. Mathematics of Operations Research 3 (4): 290-307.
Morck, R., Schleifer, A. and Vishny, R. (1988) Management ownership and market valuation: an empirical analysis. Journal of Financial Economics 20: 293-315.
Muravyev, A. (2003) Turnover of Senior Managers in Russian Privatised Firms, Comparative Economic Studies, 45(2): 148-172.
Muravyev, A. (2009 a) Dual class stock in Russia: explaining a pricing anomaly. Emerging Markets Finance and Trade 45(2): 39-61.
Muravyev, A. (2009 b) Investor protection and share prices: evidence from statutory rules governing variations of shareholders’ class rights in Russia. DIW Berlin Discussion Paper No. 865, German Institute for Economic Research.
Musteen, M., Barker III, V. and Baeten, V. (2006) CEO attributes associated with attitude toward change: the direct and moderating effects of CEO tenure. Journal of Business Research 59: 604-612.
Nenova, T. (2003) The value of corporate voting rights and control: a cross-country analysis. Journal of Financial Economics 68: 325–351.
Neumann, R. (2003) Price differentials between dual-class stocks: voting premium or liquidity discount. European Financial Management 9 (3): 315–332.
Nicodano, G. and Sembenelli, A. (2004) Private benefits, block transaction premiums and ownership structure. International Review of Financial Analysis 13 (2): 227-244.
Odegaard, B. (2007) Price differences between equity classes. Corporate control, foreign ownership or liquidity? Journal of Banking and Finance 31: 3621-3645.
42

Pajuste, A. (2005) Determinants and consequences of the unification of dual-class shares. European Central Bank. Working paper series. # 465, March 2005, 59 p.
Partch, M. (1987) The creation of a class of limited voting common stock and shareholder wealth. Journal of Financial Economics 18: 313-39.
Pöyry, S. and B. Maury (2010) Influential ownership and capital structure, Managerial and Decision Economics, 31(5): 311-324.
Prendergast, Canice and Stole, Lars (1996) Impetuous Youngsters and Jaded Old-Timers: Acquiring a Reputation for Learning, Journal of Political Economy, 104(6): 1105-34.
Rachinsky, Andrei (2005) Self Enforced Mechanisms of Corporate Governance: Evidence from Managerial Turnover in Russia, Working Papers w0051, CEFIR, Moscow.
Romano, R. (2005) The Sarbanes-Oxley act and the making of quack corporate governance. The Yale Law Journal 114(7): 1521-1611.
Rosenstein, Stuart and Jeffrey G. Wyatt (1990) Outside directors, board independence, and shareholder wealth. Journal of Financial Economics 26, 175-191.
Ross, Stephen A. (2004) Compensation, Incentives, and the Duality of Risk Aversion and Riskiness, Journal of Finance, 59(1): 207-225.
Ryan, Jr., H. E., Wiggins III, R. A. (2004) Who is in whose pocket? Director compensation, board independence, and barriers to effective monitoring. Journal of Financial Economics 73: 497-524.
Saito, R. and Silveira, A. (2010) The Relevance of tag along rights and identity of controlling shareholders for the price spreads between dual-class shares: the Brazilian case. Brazilian Administration Review 7 (1): 1-21.
Scharfstein, David S. and Jeremy C. Stein (1990) Herd Behavior and Investment. American Economic Review, 80: 465-479.
Shivdasani, Anil and David Yermack (1999) CEO Involvement in the Selection of New Board Members: An Empirical Analysis, Journal of Finance, 54(5): 1829-1853.
Shleifer, A. and Vishny, R. (1997) A survey of corporate governance. Journal of Finance 52: 737–783.
Smith, B. and Amoako-Adu, D. (1995) Relative prices of dual-class shares. Journal of Financial and Quantitative Analysis 30 (2): 223-239.
Sprenger, C. (2011) The choice of ownership structure: evidence from Russian mass privatization. Journal of Comparative Economics, 39(2): 260-277.
Sprenger, C. (2010) State Ownership in the Russian Economy. Part 1. Its Magnitude And Sectoral Distribution, Journal of the New Economic Association, 6: 120-140 (in Russian).
Stoll, H. and Whaley, R. (1983) Transaction costs and the small firm effect. Journal of Financial Economics 12 (1): 57-79.
Stulz, R. (1988) Managerial control of voting rights: financing policies and the market for corporate Control. Journal of Financial Economics 20: 25-54.
Van, E., Postma, T. and Sterken, E. (2008) Board characteristics and corporate performance in the Netherlands. Eastern Economic Journal 29 (1): 41-58.
Walters, Bruce A., Kroll, Mark J. and Wright, Peter (2007) CEO tenure, boards of directors, and acquisition performance, Journal of Business Research, 60(4): 331-338.
Weisbach, M. (1988) Outside directors and CEO turnover. Journal of Financial Economics 20: 421–460. 43

Westphal, James D. and Laurie P. Milton (2000) How Experience and Network Ties Affect the Influence of Demographic Minorities on Corporate Boards. Administrative Science Quarterly 45(2): 366-398.
Whitehead, Charles K. (2011) Why Not a CEO Term Limit? Boston University Law Review, forthcoming.
Yermack, D. (1996) Higher market valuation of companies with small board of directors. Journal of Financial Economics 40 (2): 185-211.
Yim, S. (2010) The acquisitiveness of the youth: CEO age and acquisition behavior. Working paper, Harvard University.
Zingales, L. (1994) The value of the voting right: a study of the Milan stock exchange experience. Review of Financial Studies 7 (1): 125-148.
Zingales, L. (1995) What determines the value of corporate votes? Quarterly Journal of Economics 110(4): 1047-1073.
44

Appendix 1. The voting premium approach to measuring private benefits of control. The literature knows several theoretical models linking the voting premium to private benefits
of control, the most influential of which was developed by Zingales (1994, 1995). The model
assumes that atomistic small investors who hold voting shares may, under certain
circumstances, become pivotal in a fight for control over the firm and thus can reap a part of
the private benefits normally available to the party controlling the firm. In contrast to voting
stocks, non-voting shares are irrelevant in future control fights and their owners, therefore,
have no access to private benefits. The voting premium thus reflects the price a potential
bidder would be willing to pay to atomistic holders of voting stock in order to establish
control over the company and thus may be interpreted as a measure of private benefits of
control.
The model considers the “classical” case of two classes of stocks which are identical
in all respects, but differ in the voting rights attached to them (one class is voting, and the
other class is not). Using a number of assumptions, Zingales shows that, in the event of a
control contest, the voting premium can be represented as the ratio between the value of the
private benefits of control and the value of cash flow rights (the present value of corporate
benefits distributed pro rata to shareholders) divided by the fraction of voting shares in the
company’s equity. In mathematical terms, the following expression for the voting premium
arises:
VPCC = (B/y) (1/ π), (A1)
where VPCC denotes the voting premium in the event of a control contest, B measures the size
of the private benefits of control, y indicates the value of cash flow rights, and π represents the
proportion of voting shares outstanding. The intuition behind π is that when the fraction of
voting shares becomes larger, so does the number of shares among which the benefits of
control are to be distributed.
This model applies only in the event of a control contest. Zingales (1995) then argues
that the voting premium observed in daily trading should reflect the expectation of different
prices of the two classes of stock in case of such an event. Therefore, it should be equal to the
voting premium during a control contest times the probability (Φ) that such an event will take
place:
VP = Φ VPCC = Φ (B/y) (1/π). (A2)
Thus, according to the model, there are three major determinants of the magnitude of the
voting premium: the relative size of the private benefits of control (B/y), the probability of a
control contest, and the fraction of the voting stock in the company’s equity. The probability
45

Φ of a contested tender offer directly depends on the ownership structure of companies: it is
essentially zero if a company has a majority shareholder, positive but small if there is one
large owner and all other shareholders are small, and large when there are multiple large
shareholders with similar stakes while the remaining shares are distributed among small
owners.
Empirical estimation of model (A2) usually adds a number of control variables. Of
these, the most important are the variables measuring liquidity of both classes of stock. It is
also common to include variables measuring differences in some observable rights attached to
different equity classes (such as different dividends, mandatory bid rule, liquidity
differentials, etc. (Saito and Silveira 2010).
46

Appendix 2. Some measurement issues.
In this appendix we briefly discuss important measurement issues related to three variables
used in our empirical analysis: the voting premium, probability of a control fight, and stock
liquidity.
Voting premium. The voting premium is conventionally defined as the difference
between the price of common shares and the price of preferred shares divided by the price of
preferred shares. The calculation thus requires the knowledge of stock prices in the relevant
period. This is a major issue in the Russian context as most stocks are quite illiquid and traded
only infrequently. As noted by Goriaev and Zabotkin (2006), out of 350 stocks listed in the
RTS, which is the largest stock exchange of Russia in terms of coverage, only a couple dozen
were more or less regularly traded in the early 2000s. For many companies, no transactions
were observed during consecutive days, weeks or even months. This brings major
methodological challenges to the analysis of stock market prices and returns. The situation is
even more complicated in our study as calculation of the voting premium requires
simultaneously observed prices of both common and preferred stocks of the same companies.
Typical remedies to the problem of thin trading include using averages of transaction
prices over extended periods and/or imputation of prices based on bid and ask quotations. The
former approach can be found, for example, in Chung and Wie (2005) and Black et al. (2006),
who rely on quarterly average share prices in their studies of the contemporary Chinese and
Russian stock markets. In the case of India’s stock market, Dharmapala and Khanna (2008)
even employ the 365-day average. Similarly, Hilt (2008) uses quarterly averages in his
analysis of the 19th century US stock market, which at that time was also characterized by
infrequent trading and low liquidity. The latter approach is used in Lin and Howe (1990),
Koutmos and Tucker (1996), and Guillaume et al. (1997), among others. Also, the CRSP data
files, which are most often used in event studies of the US stock market, report the average of
the bid and ask prices if a stock does not trade on a given day (Bartholdy, Olson and Peare
2007).
Using Russian data, Muravyev (2009b) experiments with various options and finds
that the results are quite similar regardless of whether one calculates the VP using actual
prices or imputed prices. Based on this result, in order to calculate the voting premium, we
use the average of the stock prices imputed from ask and bid quotations over May-August
each year. Specifically, we first calculate imputed prices of stocks for each trading day and
then average them over the four-month period.
Probability of control contests. In the model by Zingales (1994, 1995), the probability
of a control fight over a firm is among the key factors determining the size of the voting
47

premium. In our study it plays a role of an important control variable that purges the voting
premium of the components unrelated to the private benefits of control. We proxy the
probability of a control fight by the Shapley value, which is the most popular approach in the
literature.21
There are several approaches for computing the Shapely value (see e.g., Milnor and
Shapley 1978; Leech 1988; Leech 2003), which often rely on the approximate methods. In
particular, approximations are needed in the case of large but finite number of players (e.g.,
company shareholders). Approximate solutions are also inevitable because of the reporting
thresholds, when ownership stakes below a certain threshold are not reported at all (the
threshold is 5 percent in the Russian case). Clearly, such data provide rather rough
approximations, but this is the best option available.
As concerns the exact algorithm used for the computation of the Shapley value, we
rely on the online software for voting power analysis provided by Dennis Leech and Robert
Leech from the University of Warwick, http://www.warwick.ac.uk/~ecaae, as available in
February 2010.
Liquidity variables. Since the studies by Stoll and Whaley (1983) and Amihud and
Mendelson (1986), the role of liquidity for valuation of securities is widely acknowledged:
higher liquidity ceteris paribus contributes to higher prices. The logic is simple: the less
liquid security should have higher trading costs which should be reflected in a lower price of
that instrument. Moreover, the effect of trading costs is not of second-order and may be
considerable since these costs have to be incurred every time the asset is traded.
Measuring liquidity of a stock is somewhat controversial: there is no single measure
that captures all essential aspects of liquidity (Amihud and Mendelson 1991). It is even more
complicated to judge relative liquidity of dual class shares. For example, these classes
typically constitute unequal proportions of company equity and are issued in different
21 Alternative approaches to measuring the probability of a takeover can be found, for example, in Zingales
(1994) and Smith and Amoako-Adu (1995). Zingales (1994) suggests two proxies: a dummy equal to unity if
one shareholder owns a majority of stock and zero otherwise and a dummy equal to unity if there are at least two
large shareholders but neither has a majority of votes. Smith and Amoako-Adu (1995) use a vector of variables
comprising ownership (the fraction of votes held by insiders), size (measured as the logarithm of the market
value of equity), and abnormal stock return as a combined proxy for the probability of a takeover. The intuition
behind the size factor is that larger companies are less likely to be the targets in control contests since cost of
obtaining control over them is higher. Abnormal stock returns are used in order to measure company
performance: it is argued that poorly performing companies are more likely to be acquired because takeovers are
a means of replacing inefficient management.
48

numbers. Other things being equal, the larger the fraction of a particular class in company
equity, the higher its liquidity compared to the other class. However, for corporate control
reasons voting shares may be held more concentrated than non-voting stock. Hence, a large
share of voting stock may be not traded in the market. As a result, when the fraction of non-
voting stock is relatively small, the number and the volume of transactions may be larger for
common stock while the ratio of the number of shares traded in the stock exchange to the total
number of shares may be larger for preferred stock.
The traditional measure is the ratio of the volume of transactions (in monetary terms)
to the average absolute percentage change in price. Instead of the volume of trade proxies,
liquidity may be measured by the number of transactions, the spread between ask and bid
prices, the number of days between the end of the month and the day of the previous recorded
stock exchange transaction, etc.
Our approach to measuring liquidity is based on the ask-bid spread. We believe that
this approach mitigates the issues related to the unequal number of common and preferred
stocks issued, as well as to the class differences in the free float in the stock market. The
liquidity of stocks in our paper is calculated as average_bid/average_ask over May-August for
each year. The closer this variable to 1, the more liquid the stock is. When it is close to 0, the
stock is very illiquid.
49

Appendix 3. Estimation results for characteristics of CEOs, in full. 1 2 3 4 5 6
CEO_ownersh 0.0103 -0.1170 -0.1886 -0.2143* -0.2010 -0.2251* (0.0380) (0.1170) (0.1253) (0.1246) (0.1269) (0.1263) CEO_ownersh2 0.0174 0.0258* 0.0287** 0.0278* 0.0300** (0.0134) (0.0145) (0.0145) (0.0147) (0.0146) CEO _tenure 0.0179 0.0441** 0.0553*** 0.0505** (0.0117) (0.0209) (0.0204) (0.0198) CEO _tenure2 -0.0022 -0.0023* -0.0027** (0.0013) (0.0014) (0.0013) CEO _age -0.0062 -0.1321** (0.0053) (0.0520) CEO _age2 0.0013** (0.0005) SHAPLEY 0.5296 0.5668 0.4823 0.5185 0.5335 0.5833 (0.3710) (0.3754) (0.3752) (0.3711) (0.3761) (0.3741) 1/SHARE_VOTING 0.4383 0.2850 0.3524 0.1813 0.1675 0.1697 (1.6843) (1.6902) (1.7158) (1.7314) (1.7108) (1.6659) DIV10 0.3531** 0.3545** 0.3299** 0.3145* 0.3910** 0.3810* (0.1567) (0.1588) (0.1612) (0.1646) (0.1972) (0.2059) ADR -0.0444 -0.0461 -0.0289 -0.0585 -0.0243 -0.0736 (0.1248) (0.1259) (0.1308) (0.1316) (0.1340) (0.1312) VOTE 0.2261** 0.2187** 0.2231** 0.2211** 0.2213** 0.2062** (0.1044) (0.1043) (0.1044) (0.1035) (0.1046) (0.1014) VETO 0.0463 0.0358 0.0405 0.0498 0.0516 0.0609 (0.1487) (0.1493) (0.1478) (0.1479) (0.1478) (0.1465) LIQUIDITY_comm 1.3058*** 1.3124*** 1.3097*** 1.3166*** 1.3217*** 1.3480*** (0.2894) (0.2898) (0.2879) (0.2872) (0.2901) (0.2870) LIQUIDITY_pref -1.3622*** -1.3601*** -1.3534*** -1.3708*** -1.4082*** -1.3914*** (0.2710) (0.2711) (0.2704) (0.2687) (0.2682) (0.2638) SIZE -0.1292** -0.1339** -0.1361** -0.1291** -0.1317** -0.1238** (0.0531) (0.0537) (0.0542) (0.0542) (0.0541) (0.0542) Industry dummies Subsumed in firm fixed effects YEAR_1997 -0.7255*** -0.7223*** -0.7210*** -0.7024*** -0.5867*** -0.6183*** (0.1422) (0.1408) (0.1464) (0.1470) (0.1432) (0.1386) YEAR_1998 -0.3571*** -0.3528*** -0.3369*** -0.3311*** -0.3235*** -0.3381*** (0.1220) (0.1212) (0.1213) (0.1222) (0.1224) (0.1224) YEAR_1999 0.2932* 0.2987* 0.2951* 0.2969* 0.2984* 0.2783* (0.1666) (0.1664) (0.1656) (0.1653) (0.1647) (0.1648) YEAR_2001 -0.1427 -0.1459 -0.1488 -0.1403 -0.1426 -0.1402 (0.1051) (0.1057) (0.1057) (0.1068) (0.1071) (0.1070) YEAR_2002 -0.7527*** -0.7534*** -0.7691*** -0.7655*** -0.7708*** -0.7723*** (0.1544) (0.1549) (0.1535) (0.1543) (0.1549) (0.1537) YEAR_2003 -0.7882*** -0.7910*** -0.8102*** -0.7971*** -0.8044*** -0.7967*** (0.1567) (0.1571) (0.1572) (0.1583) (0.1595) (0.1584) YEAR_2004 -0.9876*** -0.9947*** -1.0162*** -1.0008*** -1.0026*** -0.9930*** (0.1563) (0.1568) (0.1551) (0.1569) (0.1576) (0.1592) YEAR_2005 -0.9024*** -0.9191*** -0.9335*** -0.9127*** -0.9171*** -0.9196*** (0.1928) (0.1939) (0.1939) (0.1961) (0.1957) (0.1957) YEAR_2006 -1.3705*** -1.3896*** -1.3930*** -1.3621*** -1.3664*** -1.3648*** (0.1549) (0.1575) (0.1572) (0.1613) (0.1624) (0.1622) YEAR_2007 -1.1421*** -1.1699*** -1.1610*** -1.1290*** -1.1271*** -1.1506*** (0.1847) (0.1893) (0.1894) (0.1931) (0.1945) (0.1910) YEAR_2008 -0.6462*** -0.6751*** -0.6773*** -0.6530*** -0.6576*** -0.6696*** (0.2239) (0.2289) (0.2299) (0.2321) (0.2317) (0.2287) YEAR_2009 -0.8296*** -0.8531*** -0.8540*** -0.8309*** -0.8385*** -0.8427*** (0.2131) (0.2165) (0.2148) (0.2174) (0.2150) (0.2138) INTERCEPT 1.7825 2.0548 1.9609 2.0863 2.3437 5.3567** (2.2298) (2.2479) (2.2749) (2.2868) (2.2490) (2.3968) R2 .37 .37 .37 .37 .37 .38 p 2.57e-39 5.54e-40 6.54e-41 1.62e-41 7.64e-40 1.08e-42 N 1007 1007 1007 1007 1004 1004 Note: The dependent variable is the voting premium, VP. The results are obtained using the fixed-effects estimator. Cluster-robust standard errors are reported in parentheses. Asterisks ***, **, * denote significance at the 1 percent, 5 percent, and 10 percent levels, respectively.
50

Appendix 4. Estimation results for characteristics of CEOs; RE and specification tests. 1 2 3 4 5 6
CEO_ownersh -0.0224 -0.0456 -0.0633 -0.0698 -0.0720 -0.0731 (0.0163) (0.0415) (0.0441) (0.0455) (0.0462) (0.0454) CEO_ownersh2 0.0026 0.0039 0.0044 0.0046 0.0052 (0.0032) (0.0034) (0.0035) (0.0036) (0.0036) CEO _tenure 0.0125 0.0249 0.0245 0.0242 (0.0090) (0.0163) (0.0169) (0.0168) CEO _tenure2 -0.0010 -0.0010 -0.0013 (0.0010) (0.0010) (0.0010) CEO _age 0.0009 -0.1155*** (0.0044) (0.0409) CEO _age2 0.0012*** (0.0004) SHAPLEY 0.5563* 0.5610* 0.4911 0.4990 0.4896 0.5042 (0.3252) (0.3248) (0.3301) (0.3271) (0.3266) (0.3192) 1/SHARE_VOTING 0.2380 0.2411 0.2623 0.2724 0.2860 0.3260 (0.4650) (0.4652) (0.4667) (0.4669) (0.4656) (0.4582) DIV10 -0.1860* -0.1851* -0.1909* -0.1921* -0.1789 -0.1630 (0.1110) (0.1114) (0.1106) (0.1105) (0.1141) (0.1103) ADR 0.0776 0.0764 0.0737 0.0692 0.0757 0.0536 (0.0941) (0.0945) (0.0956) (0.0950) (0.0944) (0.0931) VOTE 0.1525 0.1517 0.1568 0.1578 0.1566 0.1595* (0.0984) (0.0984) (0.0983) (0.0984) (0.0981) (0.0956) VETO -0.0435 -0.0466 -0.0396 -0.0372 -0.0366 -0.0173 (0.1442) (0.1444) (0.1441) (0.1439) (0.1449) (0.1419) LIQUIDITY_comm 1.4003*** 1.4031*** 1.3978*** 1.4022*** 1.4073*** 1.4092*** (0.2549) (0.2556) (0.2552) (0.2551) (0.2558) (0.2542) LIQUIDITY_pref -1.4196*** -1.4208*** -1.4198*** -1.4262*** -1.4389*** -1.4134*** (0.2425) (0.2432) (0.2427) (0.2422) (0.2428) (0.2367) SIZE -0.0260 -0.0270 -0.0292 -0.0281 -0.0290 -0.0223 (0.0397) (0.0396) (0.0398) (0.0398) (0.0399) (0.0407) POWER -0.1889 -0.1887 -0.1975 -0.1976 -0.1959 -0.1597 (0.1412) (0.1417) (0.1422) (0.1425) (0.1418) (0.1398) FUELS -0.1892 -0.1917 -0.1923 -0.1890 -0.1797 -0.1128 (0.1520) (0.1522) (0.1532) (0.1532) (0.1544) (0.1515) CHEMIC -0.0676 -0.0674 -0.0736 -0.0702 -0.0662 0.0189 (0.1674) (0.1682) (0.1684) (0.1697) (0.1701) (0.1633) MACHIN 0.0257 0.0265 0.0579 0.0595 0.0616 0.0868 (0.2513) (0.2505) (0.2552) (0.2551) (0.2548) (0.2398) TELECM -0.1926 -0.1847 -0.2020 -0.2007 -0.2068 -0.1502 (0.1623) (0.1642) (0.1661) (0.1663) (0.1657) (0.1637) WSALES 0.2642 0.2629 0.2576 0.2559 0.2578 0.2983 (0.2274) (0.2277) (0.2278) (0.2283) (0.2288) (0.2374) Year dummies Included, but not shown Breusch-Pagan test 10.42 10.26 11.11 11.32 11.14 11.50 0.0012 0.0014 0.0009 0.0008 0.0008 0.0007 Hausman test 30.24 30.83 31.69 34.86 44.31 37.74 0.1127 0.1271 0.1349 0.0907 0.0140 0.0641 r2 0.36 0.36 0.36 0.36 0.36 0.36 p 4.9e-103 1.7e-105 7.7e-105 2.8e-104 2.8e-104 2.3e-110 N 1007 1007 1007 1007 1004 1004 Note: The dependent variable is the voting premium, VP. The results are obtained using the random-effects estimator. Cluster-robust standard errors are reported in parentheses. Asterisks ***, **, * denote significance at the 1 percent, 5 percent, and 10 percent levels, respectively. Two specification tests are reported: the Breusch-Pagan test for the presence of random effects and the Hausman test for the consistency of the random-effects estimator.
51