certain psychological variables predicting …
TRANSCRIPT
CERTAIN PSYCHOLOGICAL VARIABLES PREDICTING
MATHEMATICAL CREATIVITY AMONG
SECONDARY SCHOOL STUDENTS
Thesis
Submitted for the Degree of
DOCTOR OF PHILOSOPHY IN EDUCATION
By
MIDHUNDAS A M
Supervised by
Dr. K. VIJAYAKUMARI
Associate Professor
FAROOK TRAINING COLLEGE RESEARCH CENTRE IN EDUCATION
UNIVERSITY OF CALICUT
2020

DECLARATION
I, Midhundas A. M., do hereby declare that this thesis entitled as
“CERTAIN PSYCHOLOGICAL VARIABLES PREDICTING
MATHEMATICAL CREATIVITY AMONG SECONDARY SCHOOL
STUDENTS” is a genuine record of the research work done by me under the
supervision of Dr. K. Vijayakumari, Associate Professor, Farook Training College;
and that no part of the thesis has been presented earlier for the award of any Degree,
Diploma or Associateship in any other University.
Farook Training College, Midhundas A.M
23-12-2020
Dr. K. VIJAYAKUMARI Associate Professor Farook Training College, Calicut
CERTIFICATE
This is to certify that the thesis entitled “CERTAIN PSYCHOLOGICAL
VARIABLES PREDICTING MATHEMATICAL CREATIVITY AMONG
SECONDARY SCHOOL STUDENTS” is an authentic record of research work
carried out by MIDHUNDAS A.M., for the degree of Doctor of Philosophy in
Education, University of Calicut, under my supervision and guidance and that no
part there of has been presented before for any other Degree, Diploma, or Associate
ship in any other University.
Contents in the hardcopy and softcopy are the same.
Dr. K. Vijayakumari Farook Training College (Research Supervisor)
23-12-2020

Acknowledgements
This thesis has been brought together in its final form with the support and
inspiration from various people and institutions. As the curtain to the work of my
Ph.D draws down, it is a pleasurable job to express my thanks to all those who
contributed in many ways to the success of this study and made it an unforgettable
experience.
More than my desire to acquire a Ph.D., there were two people who wanted
it more for me. They are with me, no more. I lost them. I acknowledge and dedicate
this research work to my dear father Late Mr. K.R Mohandas and my dear sister
Late Mrs. Sajmadas K.K for helping me dream big and achieve bigger things.
At this moment of fulfilment, first of all I would like to express my heartfelt
gratitude and admiration to my supervising teacher Dr. K. Vijayakumari, Associate
Professor, Farook Training College, for her intellectual supervision with immense
knowledge and persistent motivation throughout the tenure of my study. Her sharp
questions from each and every angle of the concerned area, critical analysis, and
unfathomable dedication towards research made me even more enthusiastic towards
research. Without her firm backing and mentorship, this effort would not have been
completed to my satisfaction. Teacher always inspired me to think in a different
perspective. It has been amazing opportunity to do my doctoral research under her
masterly guidance and expertise. My joy knows no bounds in expressing my cordial
gratitude to Viji teacher.
I would like to express my gratitude to Dr. T. Mohamed saleem, Principal,
Farook Training College and Dr. C. A. Jawahar, former Principal, Farook
Training College, for providing all necessary facilities and encouragement to
conduct the study.
I express my gratitude to Dr. V. Sumangala, Former HoD & Professor in
Education, University of Calicut for giving permission to use the tool ‘Test of
Mathematical Creativity, Test of Problem Solving Ability in Mathematics and
Mathematics Anxiety Scale’ prepared by her for the present study and for valuable
suggestions in the conduct of the study.

I would like to express sincere thanks to Dr. K. Manikandan, Professor and
Head, Department of Psychology, University of Calicut for permitting to use the
tool ‘Locus of Control Scale’ of Dept. of Psychology, University of Calicut for the
the present study.
I would like to express my gratefulness to all teachers who taught me so far.
I feel honoured to share my heartfelt thanks to all the members of teaching staff of
Farook Training College. I thankfully reminisce Mrs. Sabira M, Librarian of
Farook Training College and I extend my sincere gratitude to all the non teaching
staff of Farook Training College for their support and encouragement during the
study.
I am greateful to the heads of the institutions, teachers and students who had
supported me in data collection. I am honoured to be accompanied by a group of
aspiring young research colleagues. The support provided by each and everyone,
especially Muneer.V and Saritha A.S is praiseworthy.
The inspiration and enthusiasm created in me by my family has been a
guiding light throughout. Mere acknowledgement cannot redeem the commitment I
owe to my dear mother Mrs. Ajitha M K and my better half Nimisha V K, my dear
son Medwin N Das for all the support and encouragement they have given to pursue
my interests.
I profoundly thanks Bina Photostat, Calicut University for DTP, printing and
binding the thesis. Last, but not the least I acknowledge my friends, relatives and all
those who have directly and indirectly aided in completion of this work.
Farook Training College MIDHUNDAS A M

CONTENT
LIST OF TABLES
LIST OF FIGURES
LIST OF APPENDICES
CHAPTER TITLE PAGE No.
I. INTRODUCTION 1 – 17
II. REVIEW OF RELATED LITERATURE 18 – 82
III. METHODOLOGY 83 – 129
IV. ANALYSIS 130 – 162
V. SUMMARY, CONCLUSION AND SUGGESTION 163 – 178
REFERENCES 179 – 213
APPENDICES 214 – 247

LIST OF TABLES
Table No. Title Page
No.
1 Sampling Frame of the Study 88
2 Basal Sample selected for the Study 89
3 Details of item analysis of Mathematical Creativity Test 94
4 Item - total correlation of Mathematical Creativity Test 95
5 Correlation coefficient for scores on dimensions with Mathematical Creativity Score 95
6 Scoring procedure for Originality 96
7 Cronbach Alpha coefficients for Fluency, Flexibility and Originality 97
8 Discriminating power of items of Optimism Inventory 100
9 Factors effecting Academic Stress of students 103
10 Seven dimension and number of items under each dimensions 106
11 Data and results of item analysis of Scale on Academic Stress 108
12 Number of items based on types of problems 111
13 Data and results of item analysis of Mathematics Anxiety Scale (N1=N2=100) 118
14 Item – excluded Alpha coefficient for the Mathematics Anxiety Scale 120
15 Extent of Mathematical Creativity among Secondary School Students 132
16 Deciles for the total group and sub groups based on Gender, Locale, and Type of management 134
17 Skewness and Kurtosis of the distribution of Mathematical Creativity 138
18 Pearson’s Product Moment Coefficient of Correlation and Shared Variance (r2 ×100) for Mathematical Creativity and the select Psychological Variables 139

Table No. Title Page
No.
19 Correlation matrix of the select variables with Mathematical Creativity (N=700) 148
20 Statistics for ensuring Absence of Autocorrelation 149
21 Variation Inflation Factor of the predictor variables 150
22 Value of R, R 2 and Adjusted R 2 for Model 1 152
23 Details of Regression Coefficients 152
24 Values of R, R2 and Adjusted R2 of Model 2 153
25 Details of Regression Coefficients b, Beta and Structure Coefficient for Model 2 153
26 ANOVA details for the model with Problem Solving Ability in Mathematics 156
27 ANOVA details for the model without Problem Solving Ability in Mathematics 156
28 Details of ANOVA for the Model excluding Mathematics Anxiety 157
29 Details of ANOVA for the Model excluding Locus of Control 159
30 Standardized Regression Coefficients, Structure Coefficients and Proportionate Reduction of Error of the predictor variables in predicting Mathematical Creativity 159

LIST OF FIGURES
Figure
No. Title Page
No.
1 Guilford’s Model of Structure of Intellect 21
2 Diagrammatic representation of the variables involved in the study 87
3 Breakup of the Final Sample 124
4 Histogram and Frequency Curve of the distribution of Mathematical Creativity scores of secondary school students measured through Mathematical Creativity Test. (N=700) 137
5 Scatter plot of ZResidual against ZPredicted (Mathematical Creativity). 149
6 Normal Q-Q Plot on the scores of Mathematical Creativity 151

LIST OF APPENDICES
Appendix No. Title
1 Details of the Participants of the Study
2A Mathematical Creativity Test (Malayalam)
2B Mathematical Creativity Test (English)
3A Optimism Inventory (Draft, Malayalam)
3B Optimism Inventory (Final, Malayalam)
3C Optimism Inventory (Final, English)
4A Scale on Academic Stress (Final, Malayalam)
4B Scale on Academic Stress (Final, English)
5 Test of Problem Solving Ability in Mathematics (Malayalam)
6 Matehmatics Anxiety Scale (Malayalam)
7 Locus of Control Scale (Malayalam)

Chapter 1
INTRODUCTION
❖ Need and Significance of the Study
❖ Statement of the Problem
❖ Definition of Key Terms
❖ Objectives of the Study
❖ Hypotheses of the Study
❖ Methodology of the Study
❖ Scope and Limitations
❖ Organization of the Report

Education is a tool for preparing the younger generation who are the pillars
of the future of the country and the world itself. The sustainable development of a
country in every aspect- social, economic, technological, depends upon the quality
of education it imparts from elementary to higher education. Quality education
ensures making the individuals more creative and productive. Through the
enactment of Right to Education Act (RTE, 2009), India has made a giant leap
towards quality education. RTE assures every child the fundamental right to quality
education. It helps them to acquire basic literacy and numeracy, enjoy learning
without fear and feel valued and included, irrespective of where they come from
(UNICEF, 2000). Kothari Commission (1964) and National Education Policy (2020)
also stressed the importance of Access to quality education for every child. For
ensuring quality education, teachers have to play a significant role in the process of
learning. They are expected to be dedicated and committed to develop motivation,
skill, values, and lateral thinking among students and optimum utilization of
resources (Nagoba & Mantri, 2015). They have to ensure overall performance of a
child to make him/her self sufficient and feel as a responsible member of the society.
Mathematics is the numerical and calculation part of man’s life and
knowledge. It plays a predominant role in the everyday life of an individual and has
become an indispensable factor for the progress of the present day world.

Introduction
2
Mathematics reveals hidden patterns that help one to understand the world around
and is a strategic key in the development of the whole mankind. The knowledge of
mathematics helps a person at his workplace, enhances his mental abilities and
provides a better understanding of how the world around him functions.
Identifying the significance of Mathematics in the life of an individual, and
in the development of the country, various commissions and committees have
reiterated the need of special attention in Mathematics education at school level
(Zakir Hussain committee, 1937; The Secondary Education Commission, 1952;
National Curriculum Framework, 2005). National Education Policy, 2020 has
highlighted the need of ensuring essential knowledge and skill in mathematics at
school level citing the status of fundamental literacy and numeracy among
elementary school students of India. Ramanujam (2012) analyzed the status of
Mathematics education in India and commented that the country has to traverse in
some way to face the challenge of providing quality mathematics education for all at
school level.
Mathematics as a subject of study, is considered as a key to success in school
education. At the same time, the majority feel it as one amongst the most difficult
subjects for learning (Ramanujam, 2012). Mathematics is treated by many as an
inflexible subject that contains many equations and meaningless manipulations of
numbers and symbols. A major reason for mathematics to be a herculean task for
students can be linked to teaching of mathematics. It includes lack of application,
innovation and technology, an obsession of giving over emphasis to the right answer
among teachers than the process of reaching at the right answer, and rote learning.

Introduction
3
More stereotyped and mechanical approach to teaching mathematics keeps the
subject away from the majority of students. Mathematics learning should be joyful,
meaningful and more process oriented so that learners will be engaged in the
learning process. Innovative ideas in teaching and learning make the learning
process more enjoyable and meaningful through active participation of the child in
learning of mathematics.
The aim of teaching Mathematics at school level can be listed as practical,
disciplinary, cultural, aesthetic and social. With respect to the disciplinary aims of
teaching mathematics, one can observe that, learning of Mathematics disciplines the
mind and develops reasoning power among children. A mathematics student will be
capable of using his power of reasoning in an independent way. The disciplinary
aims of mathematics learning also include development of constructive imagination
and inventive faculties among learners, and helping the learner to be original and
creative in thinking. Instead of following rote learning in mathematics a creative
learning approach in which students are encouraged to use their creative and critical
thinking to make new, meaningful ideas, to take risks, act independently with
flexibility are to be adopted which will make them successful problem solvers.
Mathematics, through the meothod of problem solving works as a platform for
developing creativity. The nature of problems, the ways of solving them and even
posing problems open doors to creativity.
The former Indian president and one of the great scientists of India Dr. APJ
Abdul Kalam in an interview with India Knowledge @Wharton during Wharton-
India Economic Forum in Philadelphia expressed the lines of a poem written by him

Introduction
4
as “Learning gives creativity, Creativity leads to thinking, Thinking provides
knowledge, Knowledge makes you great”. The importance of creative thinking is
evident in these lines. The association of components of knowledge can generate
enriched citizens. Essence of mathematics provides a suitable platform for
developing creativity. Creative thinking in mathematics can bring changes in the
general view of mathematics. Exercising mathematics helps an individual to develop
the ability to manipulate ideas mentally in various situations, to develop divergent
thinking and problem solving ability, leading to creativity.
Development of Mathematical Creativity is an important aspect of
mathematics education. Creative thinking involves imagination, basic use of the
scientific method, problem posing, problem solving, making interpretations and
using symbols. As Cropley (1992) points out, there is considerable confusion about
the nature of creativity and there are at least two major ways in which the term is
used. On the one hand, it refers to a special kind of thinking or mental functioning,
often called divergent thinking. On the other hand, creativity refers to the generation
of products that are perceived to be creative such as work of arts, music etc.
Need and Significance of the Study
Poincare (1948) believed that discovery in mathematics is a combination of
ideas and stated that “there are a lot of these combinations but a few of them are
useful. In the process of finding these useful combinations, a great number of
combinations are constructed and then meaningful combinations are distinguished
from meaningless ones”. Thus creating useful mathematical concepts through
combining previously known concepts or discovering unknown relations between
Introduction
5
mathematical facts can be considered as a creative act of doing mathematics
(Ervynck, 1991). Arriving at a rare solution through unfamiliar method to problem
than using a standard method can be taken as an evidence of Mathematical
Creativity. Chamberlin and Moon (2005) considered “divergent thinking as one of
prevalent descriptors of Mathematical Creativity”. Laycock (1970) described
“Mathematical Creativity as an ability to analyze a given problem from different
perspectives, see patterns, differences and similarities, generate multiple ideas and
choose a proper method to deal with unfamiliar mathematical situations”.
Fisher (2004) has suggested a revisit to mathematics education so that it
becomes new stairs to engage students with challenging problems and experiences
leading to creative problem solving. In order to make the learners prepared for a
future work force and cope up with a complex world with emerging trends, creative
thinking is essential. American Council of Teachers of Mathematics (2000)
emphasized the need of challenging problems that stimulate students to develop
diverse and sound ways of mathematical thinking and think creatively. Many studies
have reported that the educational practices following in many countries are not
appropriate for developing creative mathematical thinking (Chan, 2007; Mann,
2005). National Curriculum Framework of India (2005) suggested that creativity in
arts, literature and other domains of knowledge are closely linked together.
Education must provide means and opportunities to enhance a child's creative
expression. A major goal of an educational system is fostering creativity, a dynamic
property of the human mind among students.

Introduction
6
The cognitive process dimensions suggested by Revised Bloom’s taxonomy
(Anderson & Krathwohl, 2001) include ‘creating’ as the highest level of cognitive
process. They defined ‘creating’ as compile information together in a different way
by combining elements in a new pattern or proposing alternative solutions. In order
to reach this ultimate level of thinking, mathematics is to be learnt in a way that has
meaning and relevance, rather than memorizing formulae, theorems and shortcuts. A
classroom that encourages students to think freely, without the insistences that are
expected in a normal mathematics class room is reported to be contributing to the
development of creative thinking in Mathematics (Byron, Khazanchi & Nazarian,
2010; Perez-Tyteca, Castro, Segovia, Castro, Fernandez & Cano, 2009; Trujillo &
Hadfield, 1999; Ervynck, 1991). Creative thinking promotes student engagement
and makes learning more interesting and meaningful.
Mathematical Creativity is defined by many in different ways and there is no
uniqueness in the approach of researchers towards Mathematical Creativity.
Chamberlin and Moon (2005) define creativity in mathematics as “an unusual ability
to generate novel and useful solutions to simulated or real applied problems using
mathematical modelling”. According to the International Commission on
Mathematical Instruction (2004) Mathematical Creativity is “the capacity of a
person to produce logical and imaginative numerical which are essentially novel and
previously unknown to the producer”. Meissner (2000) has highlighted the need of
thorough knowledge in mathematics for the development of Mathematical
Creativity, as excellent knowledge in the content helps individuals to make
connections between different concepts and types of information. Ervynck (1991)

Introduction
7
identified the role of creativity in mathematics in advanced mathematical thinking as
helping to form reasonable inferences so that mathematical theories are formed and
new knowledge is generated. Rather similar to this, Sriraman (2004) cheractirised
professional mathematicians as having an exclusive domain of Mathematical
Creativity. By practicing mathematical accuracy and fluency, students are expected
to be more capable of expressing their creative thinking. According to Pehkonen
(1997) mathematics creative thinking is a combination of logical and divergent
thinking based on intuition with a conscious aim. Many researchers have supported
flexibility, fluency and novelty as the components of divergent thinking in
mathematical problem solving and problem posing (Siswono, 2004; Haylock, 1997;
Silver, 1997; Krutetskii, 1976). These components respectively assess different parts
and are independent of each other. If creative thinking is original and reflective, that
may produce a complex product. The levels of creative thinking are not easily
identified in the learning process of normal class rooms.
Research in the area of mathematics education is always a key concern for
those who are engaged in the process of improving the status of mathematics
education in the country. Banergy (2012) has made a review on the researches in
mathematics education and found that the majority of studies are conducted at
elementary level, especially on intervention strategies. At secondary level of
education, the need for studies on cognitive and affective gains of students is
highlighted in the report so that the curriculum can be structured more effectively.
Mathematical Creativity is a complex concept and is a blooming area of research in
India. Review of the studies in the area of Mathematical Creativity revealed that
some studies focused on the relationship of academic achievement and

Introduction
8
Mathematical Creativity (Bahar & Maker, 2011; Hungi & Changeiywo, 2009;
Karimi, 2000) where as researches by Tyagi (2015), Kavitha (2009) and Sriraman
(2005) focused on problem solving and Mathematical Creativity. Many studies are
found to be reported on the relationship of Mathematical Creativity with variables
like mathematics anxiety, intelligence, numerical aptitude, mathematical ability,
educational administration, intellectual involvement, social involvement, self
concept, optimism, and so on. (Jinu & Vijayakumari, 2018; Midhundas &
Vijayajumari, 2017; Kanhai & Singh, 2016; Midhundas & Vijayajumari, 2016;
Kattou, Kontoyianni, Pantazi, & Christou, 2013; Sreerekha, 2001; Tuli, 1980 &
Jensen, 1973). Efficiency of certain approaches, methods, techniques and materials
in facilitating divergent thinking and Mathematical creativity was the focus for many
studies which is found to be a trend among studies in 21st century (Jinu, 2018;
Vijayakumari & Kavithamol, 2014; Sharma, 2013; Idris & Mohd-Nor, 2010 &
Kwon, Park & Park, 2006).
Studies in the area of Mathematical Creativity are mainly focusing on
correlates and methods to foster Mathematical Creativity. Studies focusing on
prediction of Mathematical Creativity are rare and most of the studies in this regard
focus on environmental variables and achievement. Efficiency of psychological
variables to predict Mathematical Creativity is not well explored. It will be
beneficial for mathematics teachers, curriculum planners, school administrators and
parents if the variables contributing to Mathematical Creativity of secondary school
students are identified and their relative efficiency in predicting Mathematical
Creativity are calculated.

Introduction
9
Statement of the Problem
Mathematical creativity is an ability which is not uniquely defined and is
very difficult to be identified by an average classroom teacher. It is usually ignored
by the formal classroom practices but at the same time is an important aspect of
mathematics education. Personal, social and environmental factors may affect
Mathematical creativity. If the variables contributing to Mathematical Creativity and
their relative efficiency to predict the variable are identified, it will be easier to focus
on the creative ability of the child in mathematics. The present study attempts to find
out the efficiency of some select psychological variables to predict Mathematical
Creativity of secondary school students of Kerala. Thus the present study is entitled
as “CERTAIN PSYCHOLOGICAL VARIABLES PREDICTING MATHEMATICAL
CREATIVITY AMONG SECONDARY SCHOOL STUDENTS”.
Operational Definition of Key Terms
In order to get a clear picture on the statement of the problem, the key terms
involved are defined operationally and are given below.
Psychological variables
The variables that are related to cognitive and emotional aspects of an
individual are known as psychological variables. In the present study psychological
variables stands for a set of variables both cognitive and affective viz.,
Problem Solving Ability in Mathematics
Mathematics Anxiety
Academic Stress

Introduction
10
Locus of Control and
Optimism
Predicting
The SAGE dictionary of Social Science Research Methods (2006) explains
predicting as “stating about what will be observed before the actual event, a
foretelling of some future happening”. The Oxford English dictionary (2006) defines
predicting as “making a statement about the future”.
In the present study predicting means the ability of the select psychological
variables to predict variation in Mathematical Creativity among secondary school
students calculated using multiple regression analysis.
Mathematical Creativity
The ability to think divergently and to transfer information is essential to
creativity and creative ideas must be fluent, flexible, capable of elaborating and
redefining problems (Guilford, 1967). Romey (1970) defined Mathematical
Creativity as an ability to combine mathematical ideas, things, techniques and
approaches in a new way and analyze a given problem from various dimensions.
Mathematical Creativity means making new mathematical combinations from
existing mathematical concepts, objects and elements. In the present study
Mathematical Creativity is the total score obtained by an individual in a
Mathematical Creativity Test developed by Midhundas and Vijayakumari (2017),
the components considered being fluency, flexibility and originality.

Introduction
11
Secondary School Students
In the present study secondary school students are students studying in VIII,
IX and X classes following Kerala state syllabus.
Research Questions
The questions answered through this study are the following.
1. To what extent do the secondary school students of Kerala are
Mathematically Creative?
2. Whether the select psychological variables are correlated to Mathematical
Creativity?
3. To what extent the select psychological variables predict Mathematical
Creativity?
4. What is the contribution of each of the select psychological variables in
predicting Mathematical Creativity?
Objectives of the Study
The objectives of the study are the following.
1. To find out the extent of Mathematical Creativity among secondary school
students of Kerala.
2. To find out whether the select psychological variables are significantly
related to Mathematical Creativity of secondary school students.

Introduction
12
i). To find out whether Problem Solving Ability in Mathematics is
significantly related to Mathematical Creativity of secondary school
students.
ii). To find out whether Mathematics Anxiety is significantly related to
Mathematical Creativity of secondary school students.
iii). To find out whether Academic Stress is significantly related to
Mathematical Creativity of secondary school students.
iv). To find out whether Locus of Control is significantly related to
Mathematical Creativity of secondary school students.
v). To find out whether Optimism is significantly related to
Mathematical Creativity of secondary school students.
3. To develop a regression equation for predicting Mathematical Creativity
among secondary school students with the select psychological variables.
4. To find out the relative efficiency of the select psychological variables in
predicting Mathematical Creativity of secondary school students.
Hypotheses of the Study
The hypotheses of the study are the following.
1. There exists significant relationship between Problem Solving Ability in
Mathematics and Mathematical Creativity of secondary school students.

Introduction
13
2. There exists significant relationship between Mathematics Anxiety and
Mathematical Creativity of secondary school students.
3. There exists significant relationship between Academic Stress and
Mathematical Creativity of secondary school students.
4. There exists significant relationship between Locus of Control and
Mathematical Creativity of secondary school students.
5. There exists significant relationship between Optimism and Mathematical
Creativity of secondary school students.
6. The select psychological variables significantly predict Mathematical
Creativity among secondary school students.
Methodology of the Study
Design
The study is a correlation research with predictive design and focuses
on prediction of the criterion variable with the select psychological variables.
Variables
The criterion variable of the study is Mathematical Creativity and the
predictive variables are
Problem Solving Ability in Mathematics
Mathematics Anxiety
Academic Stress

Introduction
14
Locus of Control
Optimism
Participants
Population of the study is secondary school students of Kerala and the
participants of the study are 700 ninth standard students taken from various schools
of Kozhikode, Wayanad, Kasargod, Palakkad, and Kollam districts selected using
stratified sampling technique.
Instruments
The data was collected using the following instruments.
Mathematical Creativity Test (Vijayakumari & Midhundas, 2017)
Optimism Inventory (Vijayakumari & Midhundas, 2016)
Scale on Academic Stress (Vijayakumari, Sajmadas & Midhundas, 2015)
Test of Problem Solving Ability in Mathematics (Sumangala & Rinsa, 2008)
Mathematics Anxiety Scale (Sumangala & Malini, 1993)
Locus of Control Scale (Kunhikrishnan & Mathew, 1987)
Statistical Techniques used
The collected data was organized and analysed as per the research questions
and objectives of the study. The hypotheses were tested using statistical techniques.
The statistical techniques used for analyzing the data are given below.
● Descriptive statistics was used for knowing the extent of Mathematical
Creativity among secondary school students.

Introduction
15
● Pearson’s Product Moment Coefficient of Correlation ‘r’ was used to
estimate the extent and nature of relation between Mathematical Creativity
and the select Psychological variables.
● Multiple Regression Analysis was used to develop an equation to predict
Mathematical Creativity using the select Psychological variables.
Scope and Limitations of the Study
The present study attempted to find out the psychological variables that
predict Mathematical Creativity of secondary school students of Kerala.
Standardized tools were used with satisfactory validity and reliability to measure
each variable. Study was conducted on a sample of 700 secondary school students
from Kasargode, Wayanad, Kozhikode, Palakkad and Kollam districts of Kerala.
The sample was selected using stratified sampling technique. Adequate
representation of strata like gender, locality and type of management, was provided
to enable generalization of results to the entire population. The present study is
expected to be a support to understand the prevailing level of Mathematical
Creativity among secondary school students of Kerala. The study helps to find out
the most important variables among the select ones in predicting Mathematical
Creativity among secondary school students of Kerala. The findings of the study will
be useful for policy makers in planning programmes for developing Mathematical
Creativity. The results of the study are expected to be generalizable to students of
other states also.

Introduction
16
In order to make the study feasible, the sampling frame was confined to
secondary school students of 19 schools from five districts of Kerala. The basal
sample was 800 ninth standard students from the 19 randomly selected schools. Due
representation was given to various strata while selecting the sample to ensure the
sample as the best representative one. The study was limited to government and
aided school students and the unaided section was ignored. There are many variables
for predicting mathematical creativity; investigator selected only five psychological
variables for the study.
Despite the sincere efforts of the investigator to make the study as objective
as possible some limitations have been inherited in the study. As some of the
instruments are self reporting ones, the investigator recognizes the accuracy of
responses in these instruments need not be perfect but it is not under control of the
investigator. Though the basal sample size was 800, the final sample is 700 due to
lack of cooperation of participants.
Organization of the Report
The report is presented in five chapters.
Chapter 1:
This chapter contains a brief introduction to the problem, need and
significance of the study, statement of the problem, definition of key terms, research
questions, objectives and hypotheses, methodology, scope and limitations of the
study.

Introduction
17
Chapter 2:
This chapter presents the conceptual overview of the concerned variables and
review of the related studies.
Chapter 3:
This chapter describes the methodology of the study which consisted
Method, Design, Variables, Participants, Instruments, Data collection procedure and
Statistical techniques used for the study.
Chapter 4:
This chapter describes statistical analysis and interpretation, discussion of
results and tenability of hypotheses.
Chapter 5:
This chapter deals with the summary of the study, major findings and
implications of the study and suggestions for further research.

Chapter II
REVIEW OF RELATED LITERATURE
❖ Theoretical Overview
❖ Review of Related Studies

Review of related literature is an important characteristic of any investigation
and it plays a vital role in any field of investigation. Literature review covers
reviews of earlier research studies conducted in the field of current research area. It
helps the investigator to get greater awareness of studies undertaken in the field of
study and familiarizes him with the updates in the field or area in which he is trying
to conduct the research. Through review of literature, he attains an insight about
methodology used, tools developed etc., and which will guide to an improvement in
research design. Review helps an investigator to identify and to avoid duplication of
research in his field. Thus in depth analysis of the associated literature will help a
researcher to experience the significance of present study and to develop a novel
insight to the same.
The present study tries to find out the efficiency of certain psychological
variables in predicting Mathematical Creativity among secondary school students.
To have better awareness of the nature of study in this area, the researcher has gone
through the relevant related literature. This chapter describes the background studies
of the variables under study and tries to provide a better awareness of the concept of
creativity.

Review
19
These are presented under two sections viz.,
❖ Theoretical overview of Creativity and Mathematical creativity
❖ Review of related studies on Mathematical Creativity and the select
Psychological Variables.
Theoretical Overview of Creativity and Mathematical Creativity
Creativity is a universal and cognitive function to think divergently and
create something new. According to Levin (1978) creativity is a special form of
thinking. It is the ability to discover new solutions to the existing problems;
otherwise it can be producing new ideas, inventions or works of art. It helps
individuals to solve complicated problems in their day to day life. There are many
definitions for creativity with regard to process and product but there is no globally
accepted one.
The word ‘creativity’ originated from an Indo-European word ‘kere’ which
means ‘to create something’. Thus the epistemological meaning of the word
‘creativity’ is ‘to develop something new’. Thinkers develop varying viewpoints
about creativity and hence some of the definitions are listed below.
Galton (1870) defines creativity as a cognitive ability of human beings to
think divergently and produce a number of original and flexible responses to a set of
specified stimuli.

Review
20
According to Thurstone (1952) the novel ideas of an individual leads to
solutions. If he reaches to the solution in a sudden closure as an instinct, he is said to
be creative.
Ausubel (1963) defines creativity as a generalized constellation of
intellectual abilities, personality variables and problem solving traits.
Newell, Shaw and Simon (1962) define creativity as an unconventional
thinking which was initially vague and undefined. It leads to the formulation of a
clear solution which is highly motivated and persistent. This type of unconventional
thinking is termed as creativity. By them, the thinker and his culture have great
value. Since the task involved is of great intensity, the product has novelty.
Parnes (1992) defines creativity as the process of thinking and responding. It
is connected with our previous experience. It involves responding to stimuli such as
objects, symbols, ideas, people, situations, etc. In his opinion all the thinking process
should be result-oriented and it must end up with generating at least one unique
combination.
According to Sternberg (1988) creativity is a process which results into a
novel work, it is accepted as a tenable and useful trait. According to him, the novel
work is satisfying at some point of time to a group of people.
Theories on Creativity
The first scientific explanation of creativity was given by Guilford (1950).
He explained the construct creativity in general, in relation to the model of structure
of intellect (SOI model). Guilford explained the structure of intelligence by

Review
21
proposing a three dimensional model by using the statistical technique of factor
analysis. According to this model every intelligence activity can be described in
terms of three different basic parameters such as Operation, Contents and Products.
Guilford identified five operations, five content, and six products. The dimension of
the act of thinking is divided into five kinds of operations viz., evaluation,
convergent thinking, divergent thinking, memory and cognition.The contents refer to
ways of thinking more effectively about different kinds of information, such as
visual, auditory, symbolic, semantic and behavioral.The products refer to the kind of
information we process from content types. It contains – units, classes, relationship,
systems, transformation and implication.Thus the maximum number of factors in
terms of different possible combinations of these dimensions will be 5×5×6=150.
Each factor has a trigram symbol, one symbol each from operation, content and
product. This model may be diagrammatically represented as figure 1.
Figure 1. Guilford’s Model of Structure of Intellect
(Source: https://madhavuniversity.edu.in/guilford-structure-of-intellect-theory.html)

Review
22
Finke (1992) proposed the “Geneplore” theory, in which creativity takes
place in two phases: a generative phase, where an individual constructs mental
representations called pre-inventive structures and an exploratory phase, where those
structures are used to come up with creative ideas. It is said that when people use
their imagination to develop new ideas, these ideas are heavily structured in
predictable ways by the properties of existing categories and concepts.
Honing Theory developed by Gabora in 1997 proposed that creativity arises
due to the self organizing, self mending nature of a world view and that it is by way
of the creative process the individual hones an integrated worldview. Honing theory
places equal emphasis on the externally visible creative outcome and the internal
cognitive restructuring brought about by the creative process. It focuses on not just
restructuring as it pertains to the conception of the task, but to the world view as a
whole. When faced with a creatively demanding task, there is an interaction between
conception of the task and the world view. The conception of the task changes
through interaction with the world view, and the world view changes through
interaction with the task.This interaction is retreated until the task is complete, at
which point not only is the task conceived differently, but the world view also is
subtly or drastically transformed. Another distinguishing feature of honing theory is
that the creative process reflects the natural tendency of a world view to attempt to
resolve dissonance and seek internal consistency amongst its components, whether
they be ideas, attitudes, or bits of knowledge.
Ward (2003) proposed Incubation theory in which the term incubation is a
temporary break from creative problem solving that can result in insight. There has
Review
23
been some empirical ‘research’ looking at whether, as the concept of ‘incubation’
implies a period of interruption or rest from a problem may aid creative problem
solving. Ward lists various hypothesis that have been advanced to explain why
incubation may aid creative problem solving and notes how some empirical
evidence is consistent with the hypothesis that incubation aids creative problem
solving in that it enables ‘forgetting’ of misleading clues. Absence of incubation
may lead the problem solver to become fixed on inappropriate strategies of solving
the problem. This work disputes the earlier hypothesis that creative solutions to
problems arise mysteriously from the unconscious mind while the conscious mind is
occupied on other tasks.
Helie and Sun in 2010 proposed a unified framework for understanding
creativity in problem solving, namely the Explicit-Implicit Interaction (EII) theory
of creativity. This new theory constitutes an attempt at providing a more unified
explanation of relevant phenomena. The EII Theory relies mainly on five basic
principles namely,
i) The co-existence of and the difference between explicit and implicit
knowledge.
ii) The simultaneous involvements of implicit and explicit process in most
tasks.
iii) The redundant representation of explicit and implicit knowledge.
iv) The integration of the results of explicit and implicit processing
v) The iterative and possibly bidirectional processing.

Review
24
A computational implementation of the theory was developed and used to
simulate relevant human data. This work represents an initial step in the
development of process based theories of creativity encompassing incubation,
insight and various other related phenomena.
According to Hemisphere theory of Creativity, creative acts are said to be the
result of interaction between the two hemispheres of the individual’s brain. This
theory gives quite a predominant biological base to the upusage and functioning of
creativity. The researches into hemisphere functioning of Clark (1983) and Kitano
and Kirby (1986) have demonstrated that creative individuals are usually right
hemisphere dominant while logical, rational thinkers are left hemisphere dominant.
According to the level theory proposed by Taylor (1975), creativity may be
described as existing at five levels viz., Expressive, Productive, Inventive,
Innovative and Emergenative in an ascending hierarchy. A person is said to be
creative to the extent that he is able to reach these levels. Expressive Creativity
stands for spontaneous expression without reference to originality and quality of the
products. At Productive Creativity level, a person is able to produce something
innovative. Inventive Creativity level is marked by the presence of ingenuity with a
clear emphasis on novel use of old things. In the Innovative Creativity level, one is
able to develop new ideas or principles with the help of highly developed abstract
conceptualizing skills. Emergenative Creativity is the level of creation where most
abstract ideational principles or assumptions underlying a body of art or science are
used.

Review
25
Psychoanalytic theory of creativity by Frued (1958), says that sublimation of
repressed unconscious wishes, pregenital and libidinal urges determine creativity.
They totally do not accept it to be an unconscious function since unconscious
function is a stereotype. Hadamard (1945) gave importance to the unconscious. He
says when somebody speaks, the thoughts are conscious but language is
unconscious. Freud (1976) proposed that the basic idea of psycho dynamic approach
was that creativity arises from the tension between conscious reality and
unconscious drives. In order to express an individual’s unconscious wishes
concerning power, richness, fame, honor, or love, there exists a tension between
conscious reality and unconscious drives.
The theory by Arieti (1974) represents the contemporary views about the
nature and meaning of the terms creativity, the creative process and creative output.
The author compares creative people and psychotic as creatives aim to change
reality for broader and more useful social purpose and self actualization whereas
psychotics transform reality within the framework of his private world regardless of
any purpose. A creative person enjoys good mental health that energizes his
cognitive abilities to create something new. The theory considers the creative
process as a ‘magic synthesis’ of the two modalities, the primary process and the
secondary process which can be termed as the ‘tertiary process’.
The primary process originates in the primitive parts of the mind called the
‘id’ and the ‘ego’. The secondary process is the outcome of the developed mind and
involves logical and systematic thinking at the conscious level. In the words of
Arieti (1976), “In the creative process, both these primary and secondary processes

Review
26
work in quite strange and intricate combinations, synthesizing the rational with the
irrational and thus instead of rejecting the primitive, the creative mind integrates it
with the normal psychological process. It is from this magic synthesis that
something new, novel, the unexpected and the desirable emerges''.
Psychic creation model proposed by Barron (1965) stresses sub
consciousness and the model supports the popular views of creativity as a
mysterious process involving subconscious thoughts beyond the control of the
creator. In contrast to the prominent role that some models give to subconscious
processes, Perkin (1981) argues that subconscious mental processes are behind all
thinking and therefore, play no extraordinary role in creative thinking. Inability to
describe the thought processes does not mean inability to control them. Phases
described by this model are,
Conception - In a prepared mind
Gestation - Time, intricately co-ordinated
Parturition - Suffering to be born
Bringing up the baby - Further period of development
Seven-Step Model for Creative Thinking by Osborn (1953), proposed orientation,
preparation, analysis, ideation, incubation, synthesis and evaluation as the steps of
developing creativity. The Seven-steps can be described as
⮚ Orientation - Pointing up the problem
⮚ Preparation - Gathering pertinent data
⮚ Analysis - Breaking down the irrelevant material

Review
27
⮚ Isolation - Piling up alternatives by way of ideas
⮚ Incubation - Letting up, to invite illumination
⮚ Synthesis - Putting the pieces together
⮚ Evaluation - Judging the resulting ideas
One of the earliest models of the creative process is attributed to Wallas
(1926). According to him, the process of creativity is a combination of ideas that are
not generally associated together. He proposed that creative thinking proceeds
through the following four phases.
⮚ Preparation - Gathering Information
⮚ Incubation - Setting problem aside
⮚ Illumination - Seeing the solution
⮚ Verification - Refining the idea
Preparation: The problem is analyzed and the plan of action is formulated for its
solution. Relevant facts and materials are collected for reaching the solution. A
continuous effort is made to tackle the problem
Incubation: The solution does not come immediately. The problem is put aside
for the time and the mind is directed to some other channel. This stage of inaction is
called incubation. But the data collected are isolated below the conscious level of the
mind. The unconscious mind continues to search and a clue is provided for the
solution of the problem.

Review
28
Illumination: The clue leads to the third stage, namely the stage of illumination. At
this stage, the searcher experiences a sudden appearance of the solution to the
problem.
Verification: In this stage the new theme is checked out to determine whether the
solution emerging from the insight is the correct one. The individual rethinks,
revises and refines the solution.
Guilford in 1967 proposed a distinction between convergent and divergent
production and it is commonly renamed as convergent and divergent thinking.
Convergent thinking involves a single correct solution to a problem, whereas
divergent thinking involves creative generation of multiple answers to set problems.
Divergent thinking is sometimes used as a synonym for creativity in psychology and
literature. He noticed that creative people tend to exhibit this type of thinking more
than others. He thus associated divergent thinking with creativity appointing it
several characteristics as
I. Fluency - The ability to produce a number of ideas or problem solutions in
a limited period. The fluency factors are,
i. Word fluency: This refers to the ability to generate words having a
specific letter or combination of letters.
ii. Ideational fluency: This refers to the ability to construct ideas to meet
certain requirements. It makes something to write about.
iii. Expressional fluency: This means the ability to put ideas into words.

Review
29
iv. Associational fluency: It focuses on the completion of relationships
in distinction from ideational fluency.
II. Flexibility - The ability to simultaneously propose a variety of solutions to a
specific problem. The flexibility factors are,
i. Spontaneous flexibility: It is defined as the ability to produce a great
variety of ideas with freedom. What is measured is the variation is the
kind of responses.
ii. Adaptive flexibility: This means a change in the interpretation of the
task, approach or strategy to a solution. This shows best in the type of
problem that requires the most unusual type of solution.
III. Originality – Originality means the ability to produce unfamiliar or
uncommon responses, remote combinations or connections or clever
responses.
IV. Elaboration – Systematic organization of details of an idea in hand and carry
it out.
V. Redefinition - It means defining or perceiving in a way different from the
usual established or intended way, use and so on. Redefinition can be figural,
symbolic or semantic.
VI. Sensitivity to problems - It involves seeing defects, needs, deficiencies,
seeing the odd, the unusual and seeing what must be done.

Review
30
Torrance (1960) defined creativity as “a process of sensing problems,
deficiencies, gaps in knowledge, missing elements, disagreement and so on,
identifying the problems; seeking for solutions, making guesses or making
hypotheses and possibly modifying and retesting them; and finally communicating
the results”. He identified four components through which individual creativity can
be evaluated. They are Fluency, Flexibility, Originality and Elaboration.
Fluency means the ability to come up with many diverse ideas quickly. It is
the number of relevant and acceptable responses. Flexibility is the number of
different categories or variety of responses. It indicates how many ways an
individual responds to a particular stimulus. It is an indicative of the individual’s
ability to respond to a similar situation, to think in a different mode and trying the
unknown. Originality is the ability to produce unusual or uncommon responses,
remote combinations or connections among the participants of the study. It is
measured as their infrequency of occurrence or novelty of ideas generated among
the participants under study whereas Elaboration means the amount of detail
associated with an idea. It makes the production of detailed steps, with a variety of
implications and consequences. It is the ability to elaborate upon ideas and fill them
out with details.
Theories on Mathematical Creativity
Majority of existing definitions of Mathematical Creativity cited in literature
are vague and there is no globally accepted definition of Mathematical Creativity.
However definitions of some mathematicians like Poincare, Laycock, Ervynck and
Sriraman are worth noting and are noted below.

Review
31
French mathematician Poincare (1956) described the elemental aspect of
Mathematical Creativity as the ability to choose from the large number of possible
combinations of mathematical propositions, a minimal collection that leads to the
proof. According to him, creating something in mathematics is the association of a
lot of ideas, but a few of them are useful. Number of combinations are constructed
for finding these useful combinations, useless ones are neglected. In other words,
creating is the combination of forming, recognizing and choosing important from
them.
Laycock (1970) defined Mathematical Creativity as the ability to analyze a
given problem in various angles, viewing patterns, observing similarities and
generating a suitable method for dealing with unfamiliar mathematical problems.
According to Ervynck (1991) Mathematical Creativity is the ability to
generate mathematical objects. It involves the creation of a concept for managing
mathematical problems within a mathematical situation. He says that mathematical
creativity possesses certain characteristics such as relational, selective and briefly
presentable. In his opinion, if an individual creates a useful mathematical concept by
associating known concepts or discovering unknown relations between
mathematical concepts. This act of finding new mathematical ideas or combinations
is considered as an act of doing creative Mathematics.
According to Sriraman (2004), Mathematical Creativity is the process of
reaching in unusual and insightful solutions to a given problem, without considering
the level of complexity and the publication of original results in a prominent
mathematical research journal. He explained Mathematical Creativity in terms of

Review
32
originality and usefulness. He distinguished Mathematical Creativity between school
level and professional level which provides unusual and new insights in
mathematical situations and idea of new association at school level. According to his
view; it is not practical for the identification and development of Mathematical
Creativity in school students. However in the higher levels,
Mathematical Creativity can be defined as
1. The ability to produce original work that significantly extends the body of
knowledge.
2. The ability to open up venues of new questions for other mathematicians.
3. The process that results in novel unusual, insightful solutions to a given
problem or analogous problems.
4. The termination of new questions or possibilities that allow an old problem
to be regarded from a new angle.
According to Investment theory proposed by Stenberg and Lubart (1995)
creative individuals are like good investors. The creative people are those who invest
a good time for understanding others to the intrinsic worth of their creative ideas.
The high sales value of creativity means they let others pursue their idea. In short,
creative people are the trend setters in the society. Six distinct but interrelated
elements constituting creativity are intelligence, knowledge, thinking styles,
personality, motivation and environment. By theory, the personality traits supported
to nourish creativity are willingness to take sensible risks, overcome barriers,

Review
33
tolerate ambiguity, motivation, self efficiency, supporting environment and reward
(Sternberg, 1988). According to the investment theory of Mathematical Creativity,
Mathematical Creativity is not just a simple total of six elements but it requires a
certain threshold of knowledge. Creative endeavors can be encouraged with a high
level of motivation, if an individual is in a non supportive environment.
System theory of Mathematical Creativity by Csikszentmihalyi (2000),
views Mathematical Creativity as a process that involves the interaction between a
person, task and environment. Novelty or originality of creativity differs person to
person, task to task and environment to environment. This theory considers cultural
and social aspects of Mathematical Creativity rather than individualistic processes.
The field consists of individuals having any type of interaction or influence on the
domain. An observable interaction between the three components of a system viz.,
individual, domain and field are necessary components of system theory of
Mathematical creativity.
Review
34
Review of Related Studies
In the field of research, the researcher has to acquire up-to-date information
about what has been thought and done in the particular area from which the present
problem has been taken up. Hence a thorough survey of related studies was
conducted.
The survey of related studies implies locating, studying, and evaluating
reports of relevant researches of published articles, going through related portions of
Encyclopedias, and research abstracts, study of pertinent pages out of
comprehensive books on the subject and going through related manuscripts, if any.
The researcher has to build upon the accumulated and recorded knowledge of the
past. Survey of related studies provides the investigator with new ideas, theories,
explanations, hypotheses or methods of research valuable in formulating and
studying the problem. It enables him to know the means of getting to the frontier in
the field of his research. It helps to formulate hypotheses, which is the basis for the
entire research plan.
The present study has Mathematical Creativity as the criterion variable and
Problem Solving Ability in Mathematics, Mathematics Anxiety, Academic Stress,
Locus of Control and Optimism as the predictor variables. Studies related to these
variables are given under separate headings viz.,
Studies on Creativity
Studies on Mathematical Creativity
Studies on Problem Solving Ability in Mathematics

Review
35
Studies on Mathematics Anxiety
Studies on Academic Stress
Studies on Locus of Control
Studies on Optimism
Studies on Creativity
The researcher had reviewed studies on Creativity which is a much explored
one compared to Mathematical Creativity and it helped to find the details of studies
on creativity in other dimensions.
Shrividhya (2014) conducted a study on scientific creativity among
secondary school students. The study was conducted on a sample of 500 secondary
school students from Kannur District. Scientific creativity was measured using the
scientific creativity test by Pekmez, Aktamis and Taskin (2009). The study revealed
that the scientific creativity is found to be not satisfactory among secondary school
students.
Singh (2013) studied the intermediate influence of achievement motivation,
emotional intelligence and creativity on academic achievement on a sample of 745
student-teachers. The study found that achievement motivation and creativity have
no direct influence on academic achievement, but emotional intelligence has
significant influence on the variable academic achievement.
Rani and Dalal (2013) investigated the relationship between creativity and
achievement motivation of senior secondary students. The data was collected from a
sample of 640 students selected randomly from the various schools of Haryana

Review
36
State. The findings of the study revealed that the variables creativity and
achievement motivation has no significant relationship.
In a study “Comparison of Creative thinking abilities of high and low
achievers secondary school students” Anwar, Shamim-ur-Rasool and Haq (2012)
attempted to examine the creative thinking abilities of high and low achievers at
secondary school level. The result of the study showed that there was no difference
between high achievers and low achievers in terms of creative thinking abilities.
However, girls and the students belonging to urban areas found better in their
creative thinking.
Yadav and Wadhwa (2011) investigated the impact of creativity on academic
achievement. The participants were adolescents studying in English medium and
Hindi medium schools. The result shows that there is no impact of creativity on
academic achievement. The girls and boys of English medium school possess more
creativity and they are good achievers than the girls and boys of Hindi medium
schools.
Baran, Erdogan and Cakmak (2011) conducted a study on the relationship
between Creativity and Mathematical Ability of six year old students. In this study,
data for creative ability were collected using Torrance Tests of Creative Thinking.
Data for Mathematical Ability were gathered using a mathematical test, measuring
aspects of informal and formal Mathematics. It was found that there is no significant
relationship between Mathematical Ability and Creativity. Also there was no
significant relationship between Mathematical Ability and Creativity components
such as fluency, originality and elaboration.
Review
37
Alam (2009) examined the relationship between academic achievement with
creativity as well as achievement motivation. The analyses lead to the conclusion
that both creativity and achievement motivation have a significant role on the
academic achievement of students.
Reddy (2008) conducted a study on the influence of gender on creativity of
student teachers. The result of the study found that male and female student teachers
do not differ significantly with respect to their creativity.
Kim (2008) in an analysis of the available literature on creativity reported
that the underachievement of gifted students may be tied to the interest and
unrecognized creativity. He is of the opinion that many gifted students were
underachievers and up to 30 percent of high school dropouts would be highly gifted.
Jacob (2007) investigated the relationship between creativity and self
concept. The study revealed that there is a positive correlation between creativity
and self-concept. The researcher highlighted the significance of creativity and the
need for developing better and positive self-concept for developing creativity.
Sreekanth (2004) in an analytical study about the role of society in
development of creativity among children found that the influence of society in the
form of parents, teachers and school administrators should consider the learner-
centric, learner-friendly views while developing curriculum.
Slavica (2004) conducted the relation between creativity, academic
performance and academic preferences. The study find out a low positive correlation
between creativity and achievement in the sub sample of girls. Also it was found that

Review
38
initial step in the acquisition of knowledge will contribute to creative thinking of
students.
Mahapatra (2000) conducted a study on the effectiveness of enrichment
programmes in developing creative expressions at elementary stages. The result of
the study indicated that girls were found to be better in developing composition
writing when compared to boys. It also showed that the experimental treatment
using enrichment programs had a positive impact on the overall performance of the
children.
Kumari (2000) conducted a correlational study for finding the correlates of
Creativity and nurturing the creative potential. The sample of the study was
collected from pre-school children. The study revealed that intellectual
characteristics, language characteristics, social characteristics and home
environment have a significant effect on creativity and it’s fostering.
Adey (1999) examined the influence of Cognitive Acceleration through
Science Education (CASE) program on Scientific Creativity. The participants were
secondary school students and Scientific Creativity was measured by Scientific
Creativity Test. The study showed that the program promoted the overall
development of Scientific Creativity. However the effects on different aspects of
Scientific Creativity varied significantly.
Sunitha (1997) investigated creativity in relation to Achievement in
Malayalam. A sample of 500 secondary school pupils was selected for the study.
The data was collected using Generalized Achievement Test in Malayalam for

Review
39
secondary classes and a comprehensive Test of Creativity. The result of the study
indicated that creativity and its subcomponents have significant relation with
Malayalam Achievement.
Dahiya (1995) examined the effect of mastery learning strategy on the
creative abilities and achievement in Mathematics. The data was collected and
analyzed from the sample of seventy students of secondary schools from Delhi. The
conclusion of the study showed that the group of pupils taught mathematics through
mastery learning strategy has shown significantly higher gain in verbal creativity
and non verbal creativity than the group of pupils taught mathematics through
conventional methods.
Remadevy (1993) examined the relationship between attitude towards
science and creativity in the science of secondary school pupils. The data was
collected from a sample of 704 secondary school pupils from different schools
selected by stratified random sampling from three districts of Kerala. The findings of
the study revealed that there exists a positive significant relationship between
attitude towards science and creativity in science.
Prasad (1993) investigated the influence of gender difference on creativity.
The data collected from 40 boys and 40 girls of sixth standard students in two
Navodaya Vidyalaya of Orissa. To collect the data Torrance Test of Creative
Thinking was used. The finding of the study revealed that the girls differ
significantly in the measures of originality from the boys. In all the other creativity
components gender difference is not present.

Review
40
Jain (1992) conducted a correlational study on creativity in relation to
teaching aptitude, skills and personality variables of teachers. The findings of the
study indicate that there is a positive and highly significant correlation between
creativity and classroom creativity, teaching aptitude and teaching skills.
Sreekala (1991) investigated the effect of certain attitude variables and
intelligence on the creativity of secondary school pupils of Kerala. The study was
conducted on a sample of 750 secondary school pupils. The major findings of the
study are that the main effects of attitude towards mathematics, towards problem
solving, towards education and intelligence on creativity are significant.
Naja (1989) conducted a study on the relationship between the factors of
creativity and achievement in Mathematics. The participants of the study were nine
hundred and sixty ninth standard students selected using the stratified random
sampling technique. The results of the study showed that an increase in creative
thinking was attended by a corresponding increase in the achievement in
Mathematics and creativity has a determining influence on achievement in
Mathematics.
Chandini (1989) examined the efficiency of some social familial variables in
predicting creativity. The sample of the study was 780 secondary school pupils from
Ernamkulam and Thrissur districts of Kerala. The study found that the social
familial variables, home learning facility, family acceptance of education, family
cultural level and family environment selected for the study were low inefficient to
predict creativity and its components like verbal creativity, figural creativity and
symbolic creativity of secondary school pupils.

Review
41
Sukla and Sharma (1987) conducted a study to find out the level of creativity
components in middle school children. The Sample of the study consisted of 230
urban, rural and refuge children. The scientific creativity test was administered to
track the level of various creativity components such as fluency, flexibility and
originality. It was found that the rural pupil scored higher in fluency than the refuge
pupil. It was also revealed that the tribal pupil shows low score in creativity
components.
Joshi (1981) studied the creativity and personality traits of intellectually
gifted children. It was concluded that for urban population high achievers are highly
creative and no correlation was found between achievement and creativity in rural
population.
Badrinath and Sathyanarayana (1979) conducted a correlational study among
high school students to find the correlates of creativity. It was found that students of
first, second, third and fourth birth order do not differ significantly with respect to
their creative scores.
Srivastava (1977) conducted a study to find out the relationship between
creativity with birth order and the number of siblings. The data was collected from a
sample of 543 urban and 354 rural students of the standard ten. The study found that
birth order of the subjects has no impact on their creativity scores. However, the
number of siblings in the family was reported to be positively and significantly
correlated with creativity scores.

Review
42
Studies on Mathematical Creativity
In his study Analysis of Mathematical Creativity in mathematics learning is
open ended by Isnani, Waluya, Rochmad, Wardono (2020) analyzed the location,
causes, and types of student errors in doing Open-Ended Real Analysis test
questions through the use of the Newman Error Analysis (NEA) medium. The
sample of the study taken from students of Real Analysis courses in the Mathematics
Education Study Program at Pancasakti University, Tegal, Indonesia. The result of
the study showed that injecting the creative character of students from the beginning
of entering college, students are allowed to practice both formally and informally to
work on high-level questions for about five semesters, thereby creative ability in
mathematics are formed.
Lim, Ismail, Yudariah and Yusof (2019) in their exploratory research on
fostering Mathematical Creativity among engineering undergraduates, tried to find
out influence of creative problem solving towards Mathematical Creativity among
the engineering undergraduates. Case study method was used for a deep explanation
of three final year electrical engineering students. The research findings revealed
that engineering undergraduates were able to generate different creative methods
with the help of the SCAMPER- Substitute, Combine, Modify, Adapt, Put to other
uses, Eliminate and Rearrange.
Jinu and Vijayakumari (2018) conducted a correlational study on influence
of gender and intelligence on Mathematical Creativity. The study was conducted on
250 upper primary school students from Government schools of Kerala state among
which 142 were male and 108 were female students. The data was analyzed using

Review
43
Pearson’s correlation coefficient, two way ANOVA and t-test. The findings were
that there is a positive moderate relationship between Mathematical Creativity and
Intelligence and, no gender difference exists in the relationship between the two
variables.
With a sample of 24 eighth grade pupils from several schools, Jarmas and
Raedi (2017) studied Mathematical Creativity among excellent eighth grade pupils.
The findings showed that there are differences between the pupils regarding
flexibility, originality and fluency and all students possess high level achievement.
Walia and Walia (2017) developed a Mathematical Creativity test. The
sample of the study was 288 eighth grade students of Kurukshetra district of
Haryana. Split- half reliability was found to be .89 which is significant. Content
validity of the test was determined by the teachers from different schools and
concurrent validity Product moment correlation was used to determine Concurrent
validity. It was found 0.50 which is significant.
Tyagi (2017) conducted a study on Mathematical Creativity, Mathematical
Intelligence and the causal relationship between them. A sample of four hundred and
thirty nine students of age group eleven to fourteen were selected as participants of
the study using the technique of random clustering. Mathematical Creativity among
the students was measured using the test of Mathematical Creativity developed by
Singh (1985). There are five types of activities present in the test are patterns, new
relationship, nine-dot areas, subject and similarities. The results of the study
revealed that there is no significant unidirectional causal relationship between
Mathematical Creativity and mathematical intelligence, but there exists a symmetric

Review
44
relation between the two variables. It was also revealed that mathematical
intelligence is a cause of Mathematical Creativity and vice versa.
A correlational study by Akgul and Kahveci (2017) analysed student’s
mathematics self-efficacy, their metacognitive skills in mathematics and their
mathematics achievement in relation to their Mathematical Creativity. 445 gifted
and talented middle school students from 13 Science and Art Centers were selected
for the study. The study found that Mathematical Creativity is significantly related
with mathematical achievement, mathematical metacognition skills and self-efficacy
in mathematics.
Vijitha (2016) conducted a correlational study on the spatial ability and
Mathematical Creativity among higher secondary school students. The sample of the
study was 281 male and 338 female higher secondary school students. The findings
of the study revealed that there is significant positive correlation between spatial
ability and Mathematical Creativity of higher secondary school students.
Singer and Voica (2015) examined the Mathematical Creativity of fourth to
sixth grades high achievers in mathematics in relation to their problem posing
abilities in geometry. The study found that the students showed a kind of cognitive
flexibility which is mathematically specialized. Mathematical Creativity of the
students is presented itself during problem posing contexts through a process of
abstraction- generalization based on small, incremental changes of parameters so
that synthesis and simplification are achieved.

Review
45
Jaleel and Titus (2015) conducted a study to find relationship between
Mathematical Creativity and Achievement of students at secondary level. The data
was taken from 240 secondary school students of different schools from Ernakulam
and Thrissur districts of Kerala State. Pearson’s Product Moment Coefficient of
Correlation was used to explore the correlation. The result of the study showed that
there exists significant positive relationship between Mathematical Creativity and
Achievement of students at secondary level.
In a study on an Educational program of Mathematical Creativity, Petrovici
and Havarneanu (2015) attempted to find out the effectiveness of educational
programs on Mathematical Creativity. Participants for the study were non-voluntary
students of classes IV, V and VI of an urban school in Iasi, Romania. The findings
of the study indicated that the educational innovation programs help students to
develop extrinsic motivation in Mathematical Creativity activities.
Ibrahim and Irawan (2015) conducted a study on effectiveness of peer
tutoring to increase Mathematical Creative thinking ability of class ninth students.
The study found that the group of students who used peer tutoring approach
improved the creative thinking in mathematics.
Vijayakumari and Kavithamole (2014) examined effectiveness of Mind
Mapping technique in developing Mathematical Creativity. The study was
conducted on a sample of 100 students (with 50 students each in the experimental
and control groups) of higher secondary school students of Kerala. Mathematical
Creativity was measured using the test of Mathematical Creativity by Sumangala

Review
46
(1998). The result of the study showed that Mind Mapping is an important tool for
developing Mathematical Creativity.
Kattou, Kontoyianni, Pitta-Pantazi, Christou and Cleanthous (2014) in their
study on predicting mathematical creativity examined a number of cognitive factors
such as mathematical ability, Intelligence, working memory, speed and control of
processing that may predict creative ability in mathematics. The participants of the
study were 359 fourth, fifth and sixth grade elementary school students in Cyprus.
The findings of the study were that mathematical ability can predict Mathematical
Creativity and other factors were not found to predict mathematical creativity.
Aizikovitsh-Udi (2014) attempted to find out the extent of Mathematical
Creativity and aesthetics in Solving Problems among students attending the
mathematically talented youth program. The study was on 57 eighth grade students
attending the Mathematically Talented Youth Program. The findings showed that
whether these students are solving the problems with clarity but they failed to
develop high level of Mathematical Creativity and aesthetics in their solutions.
Sharma (2013) examined the effect of divergent mathematical exercises,
creativity and their interaction on Mathematical Creativity of the students. The study
was experimental in nature with pre-test post-test control group design. The sample
consists of 127 class IX students of age ranging from 14 to 17 belonging to six
different schools of Jalandhar district. Moghe test of creative thinking in
Mathematics was used for calculating Mathematical Creativity and Passi tests of
creativity for creativity. Data were collected and analyzed with the help of 2x2
Analysis of Covariance. The result of the study indicated that divergent

Review
47
mathematical exercises were effective in fostering Mathematical Creativity when
groups were matched on pre-test of Mathematical Creativity. Creativity was found
to be a significant correlate of Mathematical Creativity. It was also revealed that
when groups were matched with respect to the pre-test Mathematical Creativity was
independent of interaction between treatment and creativity.
Sebastian (2013) conducted a correlational study among 992 secondary
school students about the relationship between Mathematical Creativity and
achievement in Mathematics. Mathematical Creativity test and Achievement test in
Mathematics were the tools for data collection. The findings of the study revealed
that a significant positive relationship exist between the two variables Mathematical
Creativity and achievement in Mathematics.
Lew and Cho (2013) investigated the relationship between creativity,
motivation and creative home environment. The sample of the study consisted of
150 students taken from five kindergartens and were statistically analyzed. The
study revealed that there is significant positive relationship between the intrinsic
motivation and the creative personality. Also it was found that there is no significant
relationship between the intrinsic or extrinsic motivation and the creative thinking
ability, significant relationship was observed for creative thinking ability and
creative personality with the creative home environment.
Leikin and Lev (2013) studied the relationship between mathematical ability
and mathematical creativity in secondary school children. They also examined
relationships between mathematical creativity, general giftedness and excellence,
explored creativity of adolescents with superior mathematical abilities, and the

Review
48
power of different types of Multiple Solution Tasks (MSTs) for the identification of
between-group differences related to mathematical creativity. The sample consisted
of 184 students (16-18 years old) divided into four major experimental groups
according to varying combinations of the levels of excellence in school mathematics
(EM factor) and of general giftedness (G factor). Additionally 7 students (16-18
years old) with superior mathematical abilities (S-MG) took part in the study. The
data was collected by means of written tests and individual interviews. The result
indicated The G and EM factors are interrelated but different personality traits. The
G and EM factors have different main effects on performance on different
mathematical tasks. The G and EM factors interact on the flexibility criterion and
identical tasks reveal different effects of the G and EM factors.
Kattou, Kontoyianni, Pantazi, & Christou (2013) conducted a study on
connecting Mathematical Creativity to mathematical ability. Sample of 359
elementary school students from Cyprus were selected for the study. This
requirement was due to the fact that the instruments were presented and solved in
electronic form. The study showed that Mathematical Creativity and mathematical
ability is positively related.
Betty (2013) investigated Mathematical Creativity and Ability for
fundamental mathematical operations of primary school students with dyscalculia.
The Sample selected for the study was 2024 primary school students from 50
schools of Ernakulum District. The study found that dyscalculic and normal students
differ significantly with respect to Mathematical Creativity and ability for
fundamental operations.

Review
49
Githua and Njubi (2013) studied the effects of practicing Mathematical
Creativity enhancing learning/teaching strategy during instruction on secondary
school students’ mathematics achievement by gender in Kenya’s Nakuru
municipality. The population consisted 2 students aged 16 years in sampled
secondary schools of Nakuru Municipality. The Mathematics achievement Test was
used to test mathematics achievement. The result of the study showed that the
students who learned through mathematical creativity enhancing learning/teaching
strategy attain high scores in maths than those who learned by traditional method
and there is no gender difference in score of mathematics attained through
Mathematical Creativity enhancing learning/teaching strategy.
Sambo and Ibrahim (2012) investigated Mathematical Creativity to find
whether every child is born mathematically creative or not. The study revealed
training in creativity has been found to improve student’s creativity.
Bahar and Maker (2011) examined the relationship between Mathematical
Creativity and Mathematical achievement. In the study students’ score in
Mathematics was correlated with ‘Iowa Test of Basic Skills’ (ITBS) and the
‘Comprehensive Tests of Basic Skills’ (CTBS). ITBS included measures of problem
solving, data interpretation, Mathematics concepts, estimation and computation. The
CTBS was used as a measure of Mathematical achievement in Mathematical
concepts, estimation and computation. It was found that there exists a positive and
significant correlation between Mathematical Creativity and its components-
originality, fluency, flexibility, elaboration-with Mathematical achievement in both
ITBS and CTBS tests.

Review
50
Fetterly (2010) conducted an exploratory study of the use of a problem-
posing approach to pre-service elementary education teacher’s Mathematical
Creativity, beliefs, and Anxiety. The participants of the study were juniors entering
into the elementary education program at a research institution in the south-east
region of the United States and were assessed using the Creative Ability in
Mathematics, Mathematics Belief Questionnaire, the General Assessment Criteria,
and the Abbreviated Math Anxiety Scale. The findings of the study revealed that
intentional experience to Mathematical Creativity develops elementary pre-service
teacher’s Mathematical Creativity and also intentional experience to Mathematical
Creativity decreases elementary pre-service teacher’s Mathematics Anxiety. Also
mathematical beliefs are not a predictor of elementary pre-service teacher’s
Mathematical Creativity.
Yaftian, Nadjafikhah, Bakhshalizadeh (2010) conducted a study about
Mathematical Creativity and mathematics education which shows effective
characteristics of mathematical creativity and describes how creativity in
mathematical developments could be occurred. The study showed that the learners
do not think of mathematics as a neat, clear, and explicit subject at the beginning and
they may dare risk, mistake and make effort to be a creative person in mathematics
and, they are able to play their role in generating new mathematics and taking part in
active mathematics learning.
The relationship between Mathematical Creativity and Achievement in
Mathematics was examined by Talawar and Madhusudhanan (2010). The
participants were six hundred students from different English medium schools in

Review
51
Bangalore. The results indicated that there is a significant positive relationship
between Mathematical Creativity and achievement in Mathematics.
Nisha (2010) explored the influence of commercialized learning materials for
the development of creativity in Mathematics in secondary school students. The
sample of 607 secondary school students and 31 Mathematics teachers from 7
districts in Kerala state were selected for the study. The conclusion of the study
revealed that opportunities and platform for the development of Mathematical
Creativity was provided, the utilization of commercialized learning materials acted
as a barrier for the development of creativity in Mathematics in secondary school
students.
Leikin and Lev (2007) conducted a study in school children and introduced
multiple solution tasks as a tool for measuring Mathematical Creativity. Students are
of three different ability groups such as Gifted, Proficient (non-gifted), and regular
were instructed to solve problems in different ways. Non-gifted proficient students
show difference in the nonconventional task compared to their gifted peers but
presents similar results in doing the conventional task. Gifted and non-gifted
students differed meaningfully in all parameters from regular students.
Sak and Maker (2006) investigated the developmental variations in
children’s creative Mathematical thinking as a function of schooling, age and
knowledge. A mathematical test was administered to measure mathematical
knowledge and divergent production abilities such as originality, flexibility,
elaboration and fluency. It was found that knowledge has a significant contribution

Review
52
in describing variance in divergent production abilities such as originality, flexibility
and elaboration in fourth and fifth graders.
Purpose of cultivating divergent thinking in mathematics through an open-
ended approach by Kwon, Park and Park (2006) was to develop a program to help
cultivate divergent thinking in mathematics based on open-ended problems and to
analyze its effect by using a method of pre- and post-testing. The result of the study
indicated that the treatment group students performed better than the comparison
students overall on each component of divergent thinking skills, with the
components fluency, flexibility, and originality. The developed program can be a
useful resource for teachers to use in developing their students’ creative skills.
Hong and Aqui (2004) have suggested that content knowledge is a crucial
factor for Mathematical Creativity. He also opined that creative students in
mathematics are more cognitively resourceful than their peers who achieved high
grade in school mathematics.
Banerjee (2003) conducted a comparative study on self concept and
cognitive style of creative and non-creative students. The sample of the study
consists of 560 school students from seventh and eighth standard. Grade-wise
comparison showed that students of seventh standard are relatively higher than
eighth standard in cognitive style and self concept. Hence it revealed that cognitive
style and self-control are independent of grade. It was also revealed that there exists
a significant positive correlation in cognitive style and self concept with creativity.
Major findings were that the factors discriminating between high, moderate and low
Review
53
creative are fluency, both verbal and non-verbal elaboration and originality.
Cognitive style did not significantly discriminate between creativity groups.
Sreerekha (2001) examined the relationship between self concept,
intelligence, Mathematics Creativity and achievement in mathematics of secondary
school pupils by using the test on Mathematical Creativity, scale on self-concept and
Intelligence test using Raven’s colored progressive matrices. The findings of the
study pointed out that intelligence and Mathematical Creativity related positively
and significantly with mathematics achievement.
Resmi (1997) examined the interaction effect of Mathematics study
Approach and Mathematical Creativity on Achievement in Mathematics of
secondary school pupils in Kerala. The study consists of 600 ninth standard students
from three districts. Test of Mathematical Creativity, Mathematics study approach
and achievement test in Mathematics were used for collection of data. The study
revealed that there is no positive correlation between mathematics study approaches
with Achievement in Mathematics. However there exists a significant positive
correlation between Mathematical Creativity and Achievement in Mathematics.
Haylock (1997) conducted a study among secondary school students for
recognizing Mathematical Creativity. The study showed that students with same
degree of mathematical achievement have significant difference in Mathematical
Creativity and mathematical ability. The general conclusion of the study enlighted
that several factors differentiate Mathematical Creativity from mathematical ability.
Review
54
George (1994) investigated the Mathematical Creativity of secondary school
students in relation to their intelligence and mathematical achievement. A sample of
8000 secondary school students was selected for the study. The finding of the study
revealed that there exists a significant and positive correlation between Mathematics
creativity and Mathematics achievement.
Haylock (1987) studied the aspects of Mathematical Creativity among
children of age of eleven to twelve. It was reported that children may show a
fixation in Mathematics and the fixation may provide some self restriction that may
cause them to fail to solve problems. He suggested that mathematical attainment
limits the pupil’s creativity but does not determine it. Low attaining pupils who do
not have sufficient mathematical knowledge and skills demonstrate creative
thinking. In highest attaining group there is a significant number of pupils who show
very low level of these kinds of creative thinking in Mathematics.
Singh (1985) assessed Mathematical Creativity among the students by using
the test of Mathematical Creativity. There are five kinds of activity in the test such
as patterns, new relationship, nine-dot areas, subject and similarities. The results of
the study revealed that there is no significant unidirectional causal relationship
between Mathematical Creativity and mathematical intelligence. However there
exists an equilibrium relationship between the two variables. It was also revealed
that mathematical intelligence is a cause of Mathematical Creativity and vice versa.
Tuli (1980) conducted a correlational study among school students for
studying Mathematical Creativity in relation to aptitude and achievement in

Review
55
mathematics. It was found that Mathematical Creativity is significantly correlated to
aptitude and achievement in Mathematics.
Jensen (1973) investigated the relationships among Mathematical Creativity,
numerical aptitude and mathematical achievement. It was suggested that the
possibility of Mathematical Creativity as an additional evidence for student’s
Mathematics performance. The study found that moderately high correlation exist
among the constructs Mathematical Creativity, numerical aptitude and mathematical
achievement.
Studies on Problem Solving Ability in Mathematics
Sonia and Bindu (2017) conducted a correlational study on relationship
between problem solving ability in mathematics and numerical ability of secondary
level students. The result of the study revealed that there is a positive significant
relationship between problem solving ability in mathematics and numerical ability
of secondary school students.
Lizzie (2017) investigated the problem solving ability in mathematics in
relation to their academic achievement among higher secondary school students. The
study revealed that there exists a positive relationship between problem solving
ability in mathematics and achievement.
Jyothi and Renuka (2017) investigated problem solving ability in
mathematics of secondary students. The study aimed to find influence of the mother
occupation and age on the problem solving ability of students. Data was collected
from 300, ninth class students in Chittoor District using stratified random sampling
Review
56
technique. The study showed that mother occupation and age have a significant
influence on the problem solving ability in mathematics of IX class students.
Vidya and Malini (2016) checked the relationship between critical thinking
skills and problem solving ability among adolescents. The study revealed that there
exists a significant relationship between critical thinking skills and problem solving
skills.
Suresh (2016) conducted a study on Creativity and Problem Solving Ability
among Higher Secondary School Students. The sample of the study consists of 160
higher secondary school students studying in the government and private school
students of attur taluk in the academic year 2014-2015 using simple random
sampling technique. The findings of the study showed that there is no significant
relationship between creativity and problem solving ability among higher secondary
school students. And there is no significant difference found in the level of creativity
and problem solving ability between male and female higher secondary school
students.
Kanhai and Singh (2016) conducted an experimental study to find whether
there exists any causal relation between Mathematical Creativity and mathematical
problem solving performance. Sample of the study was 770 seventh grade students.
The study found that there exists a significant positive correlation between
Mathematical Creativity and attitudinal and environmental characteristics. The study
predicts the influence of attitudinal characteristic-self-concept in determining
Mathematical Creativity. Also the environmental factors-resource adequacy, creative
stimulation by teachers, etc. were found to be predictors of Mathematical Creativity
Review
57
in the study. Social and intellectual involvement among students and educational
administration of schools were found suppressive factors.
Dhadhich (2016) conducted a study on problem solving ability of 9th
standard students. The result revealed that there is significant difference between
problem solving ability of boys and girls of 9th standard students.
Ayllon, Gomez and Claver (2016) investigated Mathematical thinking and
creativity through mathematical problem posing and solving. Both concepts are
complex processes that shares elements, such as fluency, flexibility, novelty and
elaboration. The result of the study based on certain studies showed that problem
posing and solving related to the development of mathematical knowledge and
creativity.
A study on Problem solving ability in Mathematics of ninth standard
students in Dindigul district by Kannan, Sivapragasam and Senthilkumar (2016) on
80 ninth standard students’s revealed that level of Problem solving ability in
Mathematics of ninth standard students is average.
Tyagi (2015) checked the relationship between Mathematical creativity and
Mathematical problem solving ability Performance. Sample comprises 480 eighth
grade students. The result of the study showed that there exists a positive significant
relationship between Mathematical Problem Solving Performance and Mathematical
Creativity.
Asharani and Francis (2015) investigated the effect of Vedic mathematics on
speed and accuracy in problem solving ability in mathematics among secondary

Review
58
school students. The study revealed that Vedic mathematics method is
comparatively more effective than the activity oriented method in developing speed
and accuracy of problem solving ability in mathematics.
Gnanadevan and Selvaraj (2013) conducted a study to find out the science
attitude and problem solving ability of higher secondary school students in relation
to their achievement in science with respect to gender, type of school, residential
area and medium of school. The study revealed that the male and female students do
not differ significantly in their science attitude, but differ significantly in their
problem solving ability. The students studying in government school and private
school differ significantly in their science attitude, problem solving ability and
achievement in science. The study also found that the students residing at urban and
rural area differ significantly in their science attitude and achievement in science,
but do not differ significantly in their problem solving ability. Also the students
studying in Tamil medium and English medium differ significantly in their science
attitude and problem solving ability and do not differ significantly in their
achievement in science.
Anjali (2013) studied role of play schools with regard to the behavioral
profile, creativity, problem solving ability and social cognition of preschoolers. The
sample of 300 preschoolers (150 had attended play school and 150 had not attended
play school) participated in the study. The study revealed a positive indication of the
influence of play school on the behavioral profile, creativity, problem solving ability
and social cognition of preschoolers.

Review
59
Jose and Thomas (2011) studied the relationship between problem solving
ability and scholastic achievement of secondary school students. The sample
comprised of 320 secondary school students of Kottayam District. The study
revealed that there is no significant difference in the relationship between problem
solving ability and scholastic achievement of secondary school students with respect
to gender but there is a significant difference between these variables with respect to
locale and type of school.
Siswono (2010) conducted a study on leveling student’s creative thinking in
solving and posing mathematical problem. The data from thirteen eighth grades of
Junior Secondary School students collected by using task based interview method
and yielded the following results as five levels of creative thinking, namely level 0
to level 4 with different characteristics in each level and difference in each level
based on fluency, flexibility, and novelty in mathematical problem solving and
problem posing.
Karasel, Ayda and Tezer (2010) studied the relationship between
mathematics anxiety and mathematics problem solving skills among primary school
students and found out a low level of relationship between mathematics anxiety and
mathematics problem solving ability.
Fadlelmula (2010) made an attempt to demonstrate how mathematical
problem solving and self- regulated learning are two important and interrelated
concepts in mathematics education, and how they contribute to effective
mathematics learning. The study revealed that the use of self-regulatory strategies
is a crucial characteristic of, and an important predictor of effective problem solving
Review
60
experiences. Especially, the use of metacognitive self-regulatory strategies
significantly contributes to success in students’ problem solving processes.
Therefore, it is evident that self-regulated learning contributes to more effective
problem solving in mathematics learning. In addition, it is clear that an integral part
of developing students’ problem solving experiences gets through enhancing their
self-regulatory skills. For this reason, mathematics instruction should foster utilizing
self-regulatory strategies, and self-regulated learning should be an integral part of all
mathematics learning.
Kavitha (2009) examined the interaction effect of Mathematical Creativity,
Intelligence and Problem Solving Ability on achievement in mathematics of ninth
standard students of Bangalore District. The sample consists of 600 students of ninth
standard students studying in different types of English medium schools in
Bangalore. It was found that there is a significant positive relationship between
Mathematical Creativity and Problem Solving Ability.
Akinsola (2008) investigated the relationship of some psychological
variables in predicting problem solving ability of in-service mathematics teachers.
The sample consists of 92 females and 30 male out of 122 in-service mathematics
teachers enrolled in the B.Ed primary education programme in the Department of
Primary Education, University of Botswana. The findings of the study revealed that
mathematics anxiety, mathematics teaching efficacy belief, locus of control and
study habits all have significant relationship with problem solving ability but more
the mathematics anxiety of in-service teachers the weaker their problem solving
ability.

Review
61
Preethy (2008) conducted a study on relative efficiency of problem solving
ability, mathematical interest and awareness in the utility of mathematics in
predicting achievement in mathematics of secondary school pupils of Kerala. A
sample of 500 students of ninth standard drawn from 10 schools of Kozhikode and
Malappuram districts of Kerala participated in the study. The study revealed that
problem solving ability, mathematics interest and awareness in the utility of
mathematics have significant positive correlation with achievement in mathematics.
Soumya (2007) investigated the relationship between creative thinking and
problem solving ability of ninth standard students of Ernakulum district. Total of
300 students of ninth standard in Ernakulum district was administered for the study.
The study found that there exists a significant positive relationship between creative
thinking and problem solving ability.
Nifsa (2007) examined the interaction effect of creativity and formal
reasoning on problem solving ability in physics of secondary school students. The
sample consists of 550 secondary school students from ninth standard. The study
found that there is a direct relationship between creativity and problem solving
ability in physics.
Ashalatha (1990) investigated the relationship between problem solving
ability and creativity. By using specific creativity test, students were grouped into
high, average and low scores according to their level of creativity. The findings of
the study showed that high, average and low groups of creative pupils differ in their
problem solving ability.

Review
62
Jayasree (1988) examined the effect of select attitude variables on creativity
of secondary school students. The results of the study indicated that the effect of
attitude towards problem solving, attitude towards mathematics and attitude towards
education on creativity are significant.
Studies on Academic Stress
Manikandan and Neethu (2018) investigated student engagement in relation
to academic stress and self-efficacy under the participants as 280 adolescents
students from higher secondary schools situated at Calicut district of Kerala. The
result of the study revealed that student engagement is significantly associates to
academic stress and self-efficacy. Thus self efficacy increases, the student
engagement increases and decreases academic stress and also when academic stress
increases, decreases student engagement and self-efficacy.
In their study, a study of academic stress among higher secondary school
students Sagar and Singh (2017) examined the level of academic stress among
higher secondary school students. 180 students were selected for the sample
obtained from 10 higher secondary schools at Bareilly district by using academic
stress scale. The findings for the study suggested that male students have more
academic stress than female students, but there is no significant difference was
found among academic stress of arts, science and commerce stream students,
academic stress of government aided and self finance school students and rural &
urban area school students.

Review
63
Kumari, Ram and Barwal (2016) conducted a study of the relationship
between stress and mathematics achievement of high school students. The data for
the study consists of 200 students of 10th standard studying in rural and urban
government high schools belonging to the Mandi district of Himachal Pradesh. The
finding of the study revealed that boy students shows more amount of stress than
girls, girls had higher mathematics achievement than the boys, There exists no
significant relationship between stress and mathematics achievement of rural and
urban high school students and there exists a significant relationship between stress
and mathematics achievement of high school girls.
Nikitha, Jose and Valsaraj (2014) studied the correlation between academic
stress and self-esteem among higher secondary students in selected schools of Udupi
District. The data was collected and analyzed from 96 first year students of science
batch in private school. The study found that there exists a significant but low
negative correlation between academic stress and self- esteem among the students.
Menaga and Chandrasekaran (2014) investigated whether there exists any
significant difference in the academic stress among higher secondary school students
with respect gender, stream of study, type of school management, type of family and
family income. The study was conducted on 250 higher secondary school students in
Thiruvannamalai District. The study found that there is a significant difference in the
academic stress in relation to their gender, type of family and type of school
management, but there is no significant difference in the variable academic stress in
connection to family income and stream of study.

Review
64
Owolabi (2013) conducted an experimental study to investigate the impact of
emotional intelligence training on academic stress and self- efficacy among senior
secondary school students. The study was conducted on 140 participants and found
that emotional intelligence training had a positive impact on academic stress. The
study also identified that the efficacy of the programme had a greater impact on
female participants than the male participants.
Lal (2013) studied the relationship between academic stress and intelligence
among adolescents. The data was collected from 200 high school students. The tool
used for the study was the Students Academic stress scale by Dr. Abha Rani Bist
and Intelligence Test by Dr. R.K. Ojha. The study revealed that the intelligence
quality had slightly influenced on academic stress of senior secondary school
students.
Bartwal and Raj (2013) examined the relationship between academic stress
and emotional intelligence of school going adolescents. The study was conducted on
200 senior school students of Bathinda District and identified that there exists a
significant relationship between academic stress and emotional intelligence among
the school going adolescents.
Byron, Khazanchi and Nazarian (2010) conducted a study onthe relationship
between stressors and creativity: A meta-analysis examining competing theoretical
models. The findings of the experimental study revealed that the effect of stressors
on creative performance depends on how stress induced and the extent to which an
evaluative context is made salient can serve to either increase or decrease creative

Review
65
performance; in contrast contexts characterized by uncontrollability serve to only
decrease creative performance.
Hussain, Kumar and Hussain (2008) examined the level of academic stress
and overall adjustment among public and government high school students and also
find the relationship between these two variables. The data was collected from 100
students of class ninth from two different schools. The study revealed that the
magnitude of academic stress was significantly higher among the public school
students whereas government school students were significantly better in the level of
adjustment. The study also identified a negative correlation between academic stress
and level of adjustment among high school students.
Studies on Mathematics Anxiety
Hill, Mammarella, Devine, Caviola, Passolunghi and Szucs (2016)
investigated maths anxiety in primary and secondary school students: gender
differences, developmental changes and anxiety specificity. A sample of 1014
children both boys and girls attending both primary and secondary schools in Italy
were selected for the study. The study revealed that girls show higher maths anxiety
than boys at both educational levels. While there was a reliable negative correlation
between maths anxiety and secondary student’s arithmetic performance, no such
relationship was revealed in primary students.
Tok, Bahtiyar and Karalok (2015) studied the effects of teaching
Mathematics Creatively on academic achievement, attitudes towards mathematics,
and mathematics anxiety. The sample of the study consists of 42 sixth graders

Review
66
attending a state elementary school in Denizli city’s central county, Turkey. The
study revealed that teaching mathematics with creativity increases attitude towards
maths and achievement and decreases the anxiety towards mathematics.
Mutawah (2015) studied the influence of mathematics anxiety in middle and
high school student’s math achievement on 1352 students of Grade 8, 9 and 10 in 14
middle and high schools across Bahrain. The study revealed that anxiety increases as
the student’s progress through the grade levels and there is a gender differences in
mathematics anxiety among students. It also found that the level of the anxiety is
highest among those who perceived themselves as low achievers.
Srivastava, Imam and Sing (2015) investigated mathematics anxiety among
secondary school students in relation to gender and parental education. The data was
collected from 1000 secondary school students from Lucknow using the tool of
mathematical anxiety scale and personal background assessment questionnaire. The
study showed that female have more anxiety level than males in mathematics. The
children whose parents are not educated or less educated are more anxious than
those who have both or one parent having higher level of education.
Sharma (2014) investigated the effects of strategy and Mathematics Anxiety
on Mathematical Creativity of school students. The subjects of the study consists of
111 grade ninth students ranging from 14 – 17 years belonging to three different
schools using cluster random sampling technique. The study showed that the
students with low mathematical anxiety was found to be best for developing
mathematical creativity.

Review
67
Morsaniya, Busdraghi and Primi (2014) investigated the link between
mathematical anxiety and performance on the cognitive reflected test (CRT) the
experiment was conducted on the university students and secondary school students.
The study revealed that mathematics anxiety is a significant predictor of cognitive
reflection, even after controlling for the effects of general mathematical knowledge,
school mathematical achievement and test anxiety.
Barwal and Sharma (2013) examined academic achievement of high school
students in relation to their mathematics anxiety. The sample comprises of 200 high
school students belonging to Mandhi districts of Himachal Pradesh. The study
showed that there exists highly significant relationship between academic
achievement and mathematics anxiety of high school students.
Abbasi, Samadzadeh and Shahbazzadegan (2013) investigated mathematics
anxiety in high school students and its relationship with self-esteem and teacher’s
personality characteristics. The sample of the study consists of 480 school students
and 60 mathematics teachers were chosen in accordance with their characteristics.
The result revealed that there exists a negative significant relationship between the
student’s, mathematical anxiety and their self-esteem and also exist a significant
relationship between the students, mathematical anxiety and their teacher's
personality characteristics.
Zakaria, Zain, Ahmad and Erlina (2012) conducted a study on Mathematics
anxiety and achievement among secondary school students. The study involved 195
secondary school students from Selangor, Malaysia. The research examined the
differences in mathematics anxiety according to gender as well as the differences in

Review
68
mathematics achievement of students based on the level of mathematics anxiety.
The study concluded that there were significant differences in achievement based on
the level of mathematics anxiety. Thus, math anxiety is one factor that affects
student achievement.
Keow (2012) studied mathematics anxiety in secondary school students on
294 students in Singapore through interviews and surveys. Results revealed an
average anxiety level of 44% and a negative correlation with achievement.
Gangadharrao and Marathwada (2012) studied the scientific creativity of
students in secondary school level and compared the level of scientific creativity
between the students of private school and Navodhaya school. The study was
conducted on 207 students of ninth standard. The study showed that the scientific
creativity level of Navodhaya school students is better than private school students
due to students from these schools are chosen on merit basis.
Vitasari, Herawan, Wahab, Othman and Sinnadurai (2010) investigated
about the exploring mathematics anxiety among engineering students. The study
examined whether mathematics anxiety is one of the study anxiety sources among
UMP’S Engineering students. The result showed that there is difference in
mathematics anxiety among engineering students on the dimensions gender,
expectation and differences based on faculties.
Rana and Mahmood (2010) studied the relationship between test anxiety and
academic achievement. 414 science students from university in Lahore were
randomly selected for sample. The study showed that when test anxiety score

Review
69
decreases, student’s achievement score increases and the students with higher test
anxiety must be identified and treated in order to increase their academic
achievement.
Mohammed and Tarmizi (2010) made an attempt to compare mathematical
anxiety levels and its impacts on performance between Malaysia and Tanzania
secondary school mathematics learners. The study was performed using correlation
survey and analyzed data using t-test. The result revealed that there were higher
mean scores in test related anxiety in Malaysian students than Tanzanian students.
Kargar, Tarmizi and Bayat (2010) conducted a study on the relationship
between mathematical thinking, mathematics anxiety and mathematics attitudes
among university students. The sample of the study consists of 203 university
students from the faculty of science, engineering, food science, and human ecology
in one of the public university in Malaysia. The correlation analysis was used to find
out the relationship between mathematical thinking, mathematics attitude, and
mathematics anxiety and independent t-test was used to examine differences
between the two gender groups and two race groups on their mathematics anxiety,
attitudes toward mathematics and mathematical thinking. The study revealed that
significant high positive correlation exists between mathematical thinking and
mathematics attitude and there was negative moderate relationship between
mathematical thinking and mathematics anxiety.
Naderi, Abdulla, Aizan, Sharir and Kumar (2009) conducted a study to
examine whether creativity, age and gender are predictors of academic achievement
among undergraduate student. The data was collected from 153 undergraduate

Review
70
students in Malaysian Universities. Multiple regression analysis showed that the
interaction effect between creativity, age and gender as low predictors of academic
achievement.
Karimi and Venkatesan (2009) studied mathematics anxiety, mathematics
performance and academic hardiness in high school students on 284 tenth grade high
school students from Karnataka state. It was found that mathematics anxiety has
significant negative correlation with mathematics performance but no significant
correlation is found with academic hardiness. Significant gender difference in
mathematics anxiety was reported but no significant gender difference was found in
mathematics performance and academic hardiness.
Zakaria and Nordin (2008) investigated the effects of mathematics anxiety
on matriculation students on motivation and achievement by selecting a sample of
88 students who were at the end of their second semester of study using three
instruments namely mathematics anxiety scale, effectance motivation scale and the
mathematics achievement test. The result of the study revealed that a significant low
positive correlation between motivation and achievement and also a student with
high anxiety tends to be less motivated to work with mathematics.
Philip (2008) studied the relationship between intelligence, scientific
creativity, achievement motivation, home environment and achievement in science.
The data was collected and analysed from 1120 students of standard XII from four
Districts of Kerala. The study revealed that there is a significant relationship
between each of the independent variables and achievement in science for the total
sample and sub samples based on gender, place of residence and nature of the

Review
71
institution. The study also identified that achievement motivation has a negligible
relationship with scientific creativity and home environment and all other
independent variables have a significant positive relationship with each other.
Archana (2006) studied the interaction effect of academic anxiety,
achievement motivation and sex on performance in Biology. The study was
conducted on a sample of 500 students of standard ninth and the data were collected
using scale of academic anxiety and scale of achievement motivation. The result of
study revealed that academic anxiety is a debilitating factor of performance in
Biology (increasing level of academic anxiety causes decreasing performance in
biology) and achievement motivation is a facilitating factor of performance in
biology.
Mathematics anxiety and mathematics achievement was studied by Brian,
Sherman and David (2003). It was found that lack of mathematics achievement
causes mathematics anxiety. Changes in mathematics achievement causes related
variation in anxiety. Investigator also found that there is a negative correlation
between mathematics anxiety and mathematics achievement.
Cates and Rhymer (2003) investigated the relationship between mathematics
anxiety and mathematics performance in an instructional hierarchy perspective. The
sample selected from college students were assigned to one of two groups as high
anxiety or low anxiety based on the score on mathematics anxiety. The study
revealed that the higher mathematics anxiety group had significantly lower fluency
level across all mathematical operations tests.

Review
72
Studies on Locus of Control
Ciftci (2019) studied the effect of mathematics teacher candidates’ locus of
control on math anxiety using structural equation modeling. The subjects were 402
students from three different state universities in Turkey selected using a
combination of convenience and purposive sampling. The result of the study showed
that locus of control positively affected math anxiety and a significant positive
relationship was found between the external locus of control and the total and sub-
scale scores of math anxiety.
Kalamu, Hulukati, Badu and Panai (2018) investigated the effect of locus
control on mathematical problem solving ability of gorontalo city state middle
school students. The data for the study collected from Gorontalo City Middle School
students totaling 1729 people with multistage random sampling with 95 people. The
study revealed that there is a positive direct effect of locus of control on
mathematical problem solving abilities of students.
Hans, Deshpande, Pillai, Fernandes, Arora, Kariya and Uppoor (2017)
investigated the self-efficacy, locus of control and commitment in select private
management colleges in Oman. A sample of 50 teachers participated in the study.
The result of the study showed that locus of control and self-efficacy negatively
related with the commitment level of the faculty members working in these private
management colleges.
Bharathi (2017) checked the influence of self-concept, locus of control and
maths anxiety on the computation ability of mathematics students at secondary level.

Review
73
A sample of 15 secondary school students were selected for collecting the data
regarding the study. The study showed that most of the students who are studying at
secondary levels are found to be moderate level in self-concept, locus of control and
maths anxiety while dealing their academic streams and particularly in mathematics
students require more concentration for dealing with mathematical problems.
Angelova (2016) investigated the locus of control and its relationship with
some social-demographic factors. Sample of the study consists of 608 persons
ranged between 15 and 65 years old. The findings of the study revealed that out of
three social-demographic factors -education, family status, professional activity and
place of residence, three of them are shows a significant relationship with locus of
control and other without a significant relationship with locus of control.
Naik (2015) conducted a study on the locus of control among college
students of Gulbarga. The study was conducted on samples of B.A and B.Sc. with
the age range of 16 – 25 years, studying in Gulbarga city degree colleges by using
random sampling method. The findings of the study not showed any difference in
the locus of control among male and female college students, science and arts
college students, and urban and rural college students.
Lather, Jain and Shukla (2014) examined the student’s creativity in relation
to locus of control. The data was selected from a sample of 450 students of Mysore
University out of which 40 belonged to Electronics and communication, 44 were
from Civil Engineering, 40 from Environmental Sciences, 37 from Biotechnology,
40 from Geography, 16 from mathematics, 20 from Food and Nutrition and 7 from
Centre for Women Studies. The study revealed that students with high creativity are

Review
74
significantly high in Internal Locus of Control and the students who were low on
creativity are significantly higher on External Locus of Control. The study also
found that students at post graduate level show high external locus of control than
graduate level. Finally, understanding at the locus of control of various academic
disciplines, the decreasing order of External Locus of Control of various academic
disciplines is falling as Geography being on top followed by sciences and
engineering, mathematics, food and nutrition and Centre for Women studies has
lowest External Locus of Control.
Griffin (2014) conducted a study titled as Locus of Control and
psychological well-being: separating the measurement of internal and external
constructs. A sample of 577 students took part in a survey through an online data-
collection system. The study showed that external LOC predicted unique variance in
self-esteem, depression, and stress and Internal LOC was found to have no unique
association with psychological well-being.
Ghanbari, Talb, Karimzade and Saeed (2014) studied the effect of teaching
problem solving skills and locus of control on the academic achievement of
mathematics students. The sample of the study consists of 30 students from
Lordegan selected via multi stage cluster sampling. The result of the study revealed
that the teaching of problem solving skills and locus of control had significantly
related to the academic performance of the mathematics students- training of
problem solving skills can improve the academic achievement of mathematics
students and a higher internal locus of control provides higher level of self
confidence.

Review
75
Keshavarz and Baharudin (2013) studied the moderating role of father's
education on the association between perceived paternal parenting styles and locus
of control among Malaysian adolescents. The findings of the study are 1) there were
significant negative relationships between fathers' authoritative parenting style and
authoritarian parenting style with adolescents' internal locus of control and 2)
father's high level of education moderated the relationship between perceived
paternal authoritarian parenting and locus of control.
Joo, Lim and Kim (2013) examined locus of control, self efficacy and task
value as the predictors of learner satisfaction, achievement and persistence in an
online university located in South Korea. The study found that locus of control, self-
efficacy and task value were significant predictors of learner satisfaction, while self-
efficacy and task value predicted achievement.
Mihaela, Magdalena and Loredana (2012) conducted a study on relation
between locus of control and creative attitudes in the structure of didactic
competence. The samples included 96 students and teachers having didactic
experience between 5 and 35years with 63 women and 33 men and were selected
using the locus of control scale questionnaire method. The study found that teacher’s
personality structure, locus of control and creative attitudes are considered as
predictors of didactic competence. Persons with an internal locus of control have
high values of creative attitudes, which mean the superiority of the belief in the
internal control as compared to the external one in the structure of didactic
competence.

Review
76
Zaidi and Mohsin (2011) examined a study on Locus of Control in
Graduation Students. The sample of the study consists of 200 individuals both men
and women equally between the ages of 18 to 25 years old. The result of the study
revealed that there is a significant difference in locus of control among men and
women. The study reported that men scored high on internal locus of control as
compared to women.
Kutanis, Mesci and Ovdur (2011) investigated the effects of locus of control
on learning performance. The sample consists of 450 tourism and hotel management
studied in the academic year of 2009-2010. The result of the study revealed that the
learning performances of the students with internal locus of control are high, and
they are more proactive and effective during the learning process. On the other hand,
the ones with external locus of control are more passive and reactive during this
period.
Bhogayata (1998) conducted a study on the relationship among creativity,
self-concept and locus of control. The study revealed that the students with higher
self-concept are more fluent, original and creative than the students with a lower
concept.
Enger, Howerton and Cobbs (1994) investigated internal or external locus of
control, self-esteem, and parental verbal interaction of at-risk black male
adolescents. A sample of 42 male students in Grades 6, 7, and 8 from the United
States was administered for the study. A moderate positive relationship found
between self-esteem and parental verbal interaction was consistent with a previous
finding of no significant relationship for Black elementary children. A weak, yet

Review
77
significant, negative relationship was found between locus of control and parental
verbal interaction.
Studies on Optimism
Mathur and Sharma (2015) studied Academic Stress in relation with
Optimism and resilience on the sample of 300 senior school students drawn from
public, private and missionary schools. The findings of the study revealed that
Academic stress correlated negatively with optimism and resilience and both the
variables significantly predicted academic stress.
Mathai (2015) conducted a study on the mediating effect of coping styles on
the optimism athletic performance relationship among track and field athletes. 148
athletes randomly chosen from different schools and colleges in Kerala participating
in district, state and national levels under the age range of 16- 19 were the sample
administered for the study. The study showed that individuals are optimistic on the
use of positive copying strategies that give better performance.
Rezaei, Mousavi, Safari, Bahrami, Menshadi (2015) conducted a study of the
relationship between optimism, pessimism and coping strategies with mental health
among university students of Lorestan. The sample of the study was 367 students
from Lorestan University in the academic year 2014 by using stratified random
sampling technique. The result of the study showed that there is a significant
relationship between optimism and pessimism with mental health. People who
viewed as more optimistic about events were positively correlated with mental
health.

Review
78
The Relationship between Optimism-Pessimism and Personality Traits
among Students in the Hashemite University by Mahasneh, Al-Zoubi and Batayeneh
(2013) examined the relationship between optimism and personality characteristics.
The sample of the study was 534 students among undergraduate students enrolled in
the Hashemite University. The study showed that a positive significant relationship
exists between optimism and introversion and pessimism emotional equilibrium.
Moran, Bankole, Roxanne, Mitchel and Moore (2012) checked student
academic optimism: a confirmatory factor analysis. A sample consists of 35
elementary schools, nine middle schools, and five high schools with a total
population of over 34000 students in urban districts in the mid-Atlantic region The
findings of the study revealed that student academic optimism was unrelated to socio
economic status(SES) and that student academic optimism has a significant effect
on achievement over and above the effects of SES and student demographic
characteristics leads the authors to consider the possibility that SES may not be as
influential as once thought when other conditions of the school environment are
taken into consideration.
Sanchez, Brufau, Mendez, Corbalan and Liminana (2010) studied the
relationship between optimism, creativity and psychopathological symptoms in
University students. The study was conducted on 113 University students from
different degree programs. The study found that a strong negative correlation
between optimism and psychopathological symptoms exist, there is no significant
correlation between creativity and psychopathological symptoms.

Review
79
Gordon (2008) conducted a study on attributional style and athletic
performance. A sample of 18 female basketball players (ages: 18–24 years) from a
division II collegiate team completed the attributional style questionnaire and the life
orientation test measures during the third week of the season. Team performance can
be predicted based on the assessment of the attributional style optimism of team
members and coaches. The key to performance was perseverance in the face of
failure, a product of attributing bad events to one-off, non-pervasive external causes
as optimists do.
Schumacher (2006) conducted a study on assessing the relationship between
optimism and academic success. The sample of the study included 48 students from
a senior secondary high school, population 1384, in central British Columbia by
using a questionnaire. The findings of the study revealed that there is no significant
relation between grade and optimism scores and also suggested that further study is
needed to delineate all of the factors affecting the association between optimism and
academic achievement.
Rudski (2004) studied the illusion of control, superstitious belief, and
optimism among 275 participants. The study showed that no relationship between
optimism or pessimism and the illusion of control were observed.
Aspinwall and Taylor (1992) conducted a longitudinal study on impact of
individual differences and coping on college adjustment and performance. The study
revealed that optimism at the beginning of college predicted a
smoother, psychologically healthier transition to college life, as well as larger groups
of new friends.

Review
80
Conclusion
The researcher made an earnest effort to include almost all relevant studies in
the review. The investigator has made an attempt to review studies in the area of
Creativity, Mathematical Creativity especially the relationship of Mathematical
Creativity with other variables in India and abroad in an exhaustive way. The review
helped the researcher to arrive at a conclusion that many studies in Creativity and
Mathematical Creativity are done in India as well as outside India. But Indian
studies mainly focus on the relationship of Creativity with other variables like
academic achievement, intelligence, mathematical ability, self concept, achievement
motivation etc. (Topno, 2014; Sing, 2013; Rani & Dalal 2013; Jayaram, 2013;
Baran, Erdogan & Cakmak 2011; Yadhav & Wadhva, 2011; Alam, 2009; Reddy,
2009; & Jacob, 2007).
Many studies are found to be reported on the relationship of Mathematical
Creativity with other variables like intelligence, spatial ability, problem posing
ability, self concept, mathematical ability, numerical aptitude, educational
administration, intellectual involvement, social involvement, etc. (Isnani, Waluya,
Rochmad, Wardono, 2020; Lim, Ismail, Yudariah & Yusof, 2019; Jinu &
Vijayakumari, 2018; Tyagi, 2017; Kanhai, 2016; Vijitha, 2016; Singer & Voica,
2015; Leikin & Lev, 2013; Kattou, Kontoyianni, Pantazi, & Christou, 2013). A
number of studies in the area of Mathematical Creativity are on its relationship with
achievement in mathematics (Jaleel & Titus, 2015; Nicemol, 2013; Sebastian, 2013;
Bahar & Maker, 2011; Talawar & Madhusudhan, 2010; Sreerekha, 2001; Haylock,
1997; Resmi, 1997; Gorge, 1994; Tuli, 1980; Jensen, 1973).

Review
81
Some studies focused on certain strategies like concept mapping, educational
courseware, and commercialized learning materials and approaches, methods,
techniques and materials in facilitating divergent thinking and Mathematical
Creativity (Jinu, 2018; Daunis & Scullin, 2017; Varghese, 2016; Yeh & Lin, 2015;
Vijayakumari & Kavithamol, 2014; Smogorzewske, 2014; Sharma, 2013; Kuveri,
2013; Sharma, 2013; Albert & Kormos, 2011; Idris & Mohd-Nor, 2010; Kwon,
Leikin & Lev, 2007; Park & Park, 2006 & Haylock, 1997).
Some studies are found to be reported on the relationship of Mathematical
Creativity with Problem Solving Ability (Moore-Russo and Demler, 2018; Kanhai
& Sing, 2016; Suresh, 2016; Tyagi, 2015; Ayllon, Gomez & Claver, 2015; Kavitha,
2009; Nifsa, 2007; Ashalatha, 1990; Jayasree, 1988; Torrance, 1987). The review of
related literature indicates that a few studies are reported on the relationship between
Mathematical Creativity and the variables like Academic stress, Mathematical
anxiety, Locus of control and Optimism (Bharathi, 2017; Sharma, 2014; Lather, Jain
and Shukla, 2014; Byron, Khazanechi & Nazarian, 2010; Fetterly, 2010; Sanchez,
Brufau, Mendez, Corbalan & Liminana, 2010; Johny, 2008; Akinsola, 2008;
Bhogayata, 1998; Shaham, Singer & Scharffer, 1992; Spielberger & Rickman, 1990;
Haylock, 1987; Teichner, Arees & Reilly, 1963).
As a result of the investigative review, very few studies in Kerala are found
to be reported on Mathematical Creativity. The studies on Mathematical Creativity
do not give a consistent result on relationship with many psychological variables.
Main focus of these researches was to find the relationship between Mathematical
Creativity and mathematical achievement. If the combination of more than one

Review
82
psychological variables that affect Mathematical Creativity is established, it will be
useful for teachers, parents, school authorities and curriculum developers to nurture
Mathematical Creativity in students. So the researcher decided to conduct a study to
find out how the five psychological variables problem solving ability in
mathematics, academic stress, mathematics anxiety, locus of control and optimism
affect Mathematical Creativity and their relative efficiency to predict mathematical
creativity among secondary school students of Kerala.
Chapter 3
METHODOLOGY
❖ Design of the Study
❖ Variables of the Study
❖ Participants of the Study
❖ Instruments Used
❖ Data Collection Procedure, Scoring
and Consolidation of Data
❖ Statistical Techniques Used for
Analysis of Data

This chapter describes the method followed in the study. The present study
focuses on the ability of the select psychological variables to predict Mathematical
Creativity among secondary school students. The method adopted, variables under
study, participants, instruments, data collection procedure and the statistical
techniques used are described in detail under the following headings
Design of the Study
Variables of the Study
Participants of the Study
Instruments used
Data collection procedure, Scoring and Consolidation of data
Statistical Techniques used for analysis of data
Design of the Study
Research design is a wide master plan of the research to ensure collection of
requisite data with the problem at hand in order to answer the research questions as
clearly as possible.
The investigator adopted survey method to understand the extent of
Mathematical Creativity among secondary school students and to find out whether
the select variables are significant predictors of Mathematical Creativity. For this,

Methodology 84
correlational research with prediction design was used. In a correlational research,
the investigator describes the degree of association between the related variables. In
a prediction design outcome variable is anticipated by using certain variables as
predictors. Using the prediction design the investigator studied the relationship of
the select psychological variables with Mathematical Creativity and the efficiency of
these variables in predicting Mathematical Creativity.
Variables of the Study
The two types of variables in a prediction design are the outcome (criterion)
variable and the predictor variables. The present study attempts to predict
Mathematical Creativity using the select psychological variables. Hence
Mathematical Creativity is the outcome (criterion) variable and the predictor
variables are the select psychological variables viz., Problem Solving Ability in
Mathematics, Mathematics Anxiety, Academic Stress, Locus of Control and
Optimism.
Problem Solving Ability in Mathematics
A problem is a perplexing situation, the solution to which is not immediate.
Problem solving means the process of discovering the correct sequence of
alternatives leading to an ideal solution to a problem. Problem solving requires
higher order mental abilities like reasoning and creative thinking. It is a vertical
thinking, a sequential logic based process to arrive at the best solution for a problem
where as lateral thinking results in breakthroughs and innovations (Walsh, 2015).
These two types of thinking are related to each other. Problem solving needs

Methodology 85
creative thinking and creativity is fostered through solving novel problems that are
challenging to the learner. Researchers like Cropley (2005), Saragih and Habeahan
(2014) and Suresh (2016) have reported positive relationship between problem
solving ability and creativity. Hence in the present study, Problem solving ability in
mathematics was selected as a predictor variable for Mathematical Creativity.
Mathematics Anxiety
Mathematics Anxiety is a feeling of tension, apprehension, or fear that
interferes with math performance (Ashcraft & Kirk, 2001). It is a fear of
mathematics that can interrupt mathematical problem solving and mathematics
related activities in everyday life. Anxiety is generally considered as a negative
variable that hinder the free thinking and information processing. Loudon and
Deininger (2016) studied the physiological response to creative tasks and found that
divergent thinking and psycho physiological state are correlated and an initial
relaxed state is not a predictor of creativity. Daker, Cortes, Lyons and Green (2019)
reported a new type of anxiety, ‘creative anxiety’ that can predict creativity in areas
like art, science and mathematics. It will be remarkable if the role of mathematics
anxiety in predicting mathematical creativity is explored.
Academic Stress
Academic Stress is mental distress with respect to some anticipated
frustration associated with academic failure, anticipation of such failure, or even an
awareness of the possibility of such failure (Gupta & Khan, 1987). It is the concern
and stress that comes from schooling and education as physical, mental or emotional
Methodology 86
reaction in the academic life. A meta analysis of studies on relationship of stress and
creativity conducted by Byron, Nazarian and Khazanchi (2010) revealed that the
results are inconsistent and more studies are needed to explore the relationship. They
made a conclusion that an environment in which the individual has more control
increases the creative performance. Academic stress among students may affect their
creativity and hence it was included as a predictor variable.
Locus of Control
According to Rotter (1960), behavior of an individual is affected by how he
expects its consequences or results. If the consequence is positive, the behavior is
encouraged, otherwise discouraged. If a person believes that he can control what
happens to him, he is referred to as having an internal locus of control. A belief that
one is controlled by luck, fate or powerful others, is referred to as having external
locus of control. Lather, Jain and Shukla (2014) have reported that students having
internal locus of control have higher creativity and those with external locus of
control have low level of creativity. Locus of control is a variable which need more
exploration in the context of creative thinking and was included as a predictor
variable of Mathematical Creativity.
Optimism
Seligman (1990) defined optimists as those who tend to believe that defeat is
just a temporary setback, when confronted with hard knocks of the world and they
believe that the causes for the present failure is confined to this particular case. They
perceive the setback or the bad situation as a challenge and work hard to confront

Methodology 87
the same. Optimism moderates many psychological and physiological states like
positive emotions, mental and physical health. Cropley (2015) has reported a
positive correlation between optimism and creativity. The relationship need not be
direct, but may have a mediating role on creativity. So optimism was also included
in the select psychological variables as an affective variable.
Diagrammatic representation of the variables involved in the study is given as figure
2.
Figure 2. Diagrammatic representation of the variables involved in the study
Participants of the Study
The population of the study is secondary school students of Kerala. The
study was delimited to ninth standard students studying in Government and Aided
schools of Kerala with the assumption that ninth standard students will be a more
representative group of secondary school students. Schools from Northern, Central

Methodology 88
and Southern part of the Kerala state were included in order to get a cross section of
the Kerala state. Stratified sampling technique was used to select the participants of
the study. The participants were selected from 19 schools of five districts of Kerala
state. Four schools from Kasaragod, three schools from Wayanad, five from
Kozhikode, three from Palakkad and four schools from Kollam were selected
randomly. Care was taken to include schools from urban and rural areas as well as
government and aided schools. The sampling frame of the study is given as table 1.
Table 1
Sampling Frame of the Study
District No. of
Schools
No. of Schools from
Rural
No. of Schools from
Urban
No. of Govt:
Schools
No. of Aided
Schools
Kasaragod 4 3 1 2 2
Wayanad 3 2 1 2 1
Kozhikode 5 2 3 3 2
Palakkad 3 2 1 2 1
Kollam 4 2 2 2 2
The basal sample included 800 ninth standard students from 19 schools of
five districts of Kerala state. From each school a randomly assigned ninth class was
taken and the entire students of that class were included in the sample. Equal
representation of male and female students was given in the basal sample. The
distribution of the basal sample is given as table 2.

Methodology 89
Table 2
Basal Sample Selected for the Study
Gender Type of Management Locale
Male Female Government Aided Rural Urban
400 400 450 350 450 350
The list of schools selected is given as Appendix 1.
Instruments Used
Collection of relevant data is an important aspect of any research work.
Various techniques and instruments are to be used to collect feasible data. Selection
of suitable instrument for collecting data is of vital importance for a successful
research. A researcher is expected to select an appropriate one among the available
instruments. If no such instrument with quality is available he/she is expected to
construct a new one.
In the present study, the researcher has to measure the dependent variable
Mathematical Creativity and the independent variables Problem Solving Ability in
Mathematics, Mathematics Anxiety, Academic Stress, Locus of Control and
Optimism. Standardized tools were available to measure Problem Solving Ability in
Mathematics, Mathematics Anxiety and Locus of Control. Instruments to measure
Mathematical Creativity, Academic stress and Optimism were developed by the
researcher with his supervising teacher. The list of instruments used in the study is
given below,

Methodology 90
Mathematical Creativity Test (Vijayakumari & Midhundas, 2017)
Optimism Inventory (Vijayakumari & Midhundas, 2016)
Scale on Academic Stress (Vijayakumari, Sajmadas & Midhundas, 2015)
Test of Problem Solving Ability in Mathematics (Sumangala & Rinsa, 2008)
Mathematics Anxiety Scale (Sumangala & Malini, 1993)
Locus of Control Scale (Kunhikrishnan & Mathew, 1987)
Each instrument is discussed below in detail.
Mathematical Creativity Test (Vijayakumari & Midhun das, 2017)
A Mathematical Creativity Test was constructed and standardized by the
investigator with the help of supervising teacher to measure Mathematical Creativity
of secondary school students. The procedure of development of the test is explained
under the titles planning of the test, item writing, pilot testing, item analysis, scoring
procedure, reliability and validity.
Planning of the Test
As the first step, the investigator reviewed the literature available in the area
of Mathematical Creativity and identified appropriate definition and components of
the variable. Laycock (1970) described mathematical creativity as “an ability to
analyze a given problem from different perspective, see patterns, differences and
similarities, generate multiple ideas and choose a proper method to deal with
unfamiliar mathematical situations”. The investigator decided to select the
components of creativity as Fluency, Flexibility and Originality as per the theories
on Creativity by Guilford (1967) and Torrence (1969).

Methodology 91
Creativity is originality in thinking which needs a clear notion of the subject
matter. Hence the selection of content for the test needs much attention so that
students are very familiar with the concept. Hence basic branches of mathematics
are to be included in the test. Basic branches of Mathematics are arithmetic, algebra,
geometry and trigonometry. Among these, arithmetic and geometry are the major
areas dealt in primary and upper primary levels. Secondary school students are
expected to be more confident in basic arithmetic and geometry. Hence it was
decided to restrict the content of the test to arithmetic and geometry. Items to
measure Mathematical Creativity were so framed that responses can be scored for
three components fluency, flexibility and originality. Fluency means the number of
original ideas produced by an individual corresponding to a stimulus. Flexibility is
the ability to change the approach. Flexibility is taken as the different approaches
taken by the individual in response to the same stimulus. Originality means an
answer is rare, that is occurring occasionally in a given population.
Altogether 16 items with 8 items from arithmetic and 8 from geometry were
prepared by the investigator. The items were undergone scrutiny by experts and as
per their suggestions 6 items were removed, one from arithmetic and five from
geometry. Thus the draft test consists of ten items 7 from arithmetic and 3 from
geometry.
To test the feasibility of the test, and get an idea about the time needed to
respond to the item, the test was administered on a sample of 30 secondary school
students. Students were encouraged to ask doubts or clarification on the items and a
close observation was made on the style of responding. Modifications in the

Methodology 92
wording were made for those items for which students asked for clarification. The
total time limit for the test was fixed as 30 minutes and specific time limit for each
item was also given.
Example: Arithmetic: Write down maximum numbers using five ones.
(1 1 1 1 1)
Geometry: Using the following images make different meaningful figures.
Pilot testing
The draft test was administrated on a sample of 370 secondary school
students of ninth standard selected through stratified sampling technique, giving
equal weightage to gender of students, locality and type of management of the
school. The purpose of pilot testing is to collect data for item analysis. The
investigator approached the headmasters of the randomly selected schools and
sought permission for administering the tool in the class. The draft test was
administered to the allotted class and proper instruction was given before
responding. Sample item were worked out in the class to make them familiar with
the procedure. Time limit was strictly followed in all groups.
Item analysis
The response sheets were scored as per the scoring procedure of each
component. The fluency score was taken as the number of relevant responses for
each item. Flexibility score was the number of categories of responses for each item

Methodology 93
and originality score was taken based on the frequency of occurrence of that
response among the group. The total score on fluency, flexibility and originality for
each item was taken as the Mathematical Creativity score on the item for that
respondent. Based on the total Mathematical Creativity score, the entire sheets were
arranged in ascending order and the highest 27 percent (100) and the lowest 27
percent (100) were separated. The group with higher score was treated as upper
group and with lower score was taken as the lower group. Mean and standard
deviation of each item were calculated for both upper and lower groups. Then t-
value for each item was calculated using the formula
where M1 is the mean score on Mathematical Creativity obtained for an item for the
upper group, M2 is the mean score on Mathematical Creativity obtained for that item
for lower group. Here σ1 is the standard deviation of the distribution of
Mathematical Creativity scores for the item for upper group and σ2 is the standard
deviation of the distribution of Mathematical Creativity scores for the item for lower
group.
Test of significance of difference between means for two large independent
groups was used to calculate the discriminating power of the item. Items having
critical ratio greater than or equal to 2.58 (The tabled value for significance at .01

Methodology 94
level) were included in the final test. The details of item analysis of Mathematical
Creativity Test are given in table 3.
Table 3
Details of item analysis of Mathematical Creativity Test
Item No.
M1 M2 σ1 σ2 t – Value Remarks
1 10.39 3.83 4.29 2.01 13.82 Accepted
2 2.09 0.25 4.61 0.78 3.93 Accepted
3 5.84 1.97 2.99 2.03 10.67 Accepted
4 8.95 3.39 4.95 2.71 9.85 Accepted
5 10.88 3.47 4.88 3.18 12.69 Accepted
6 13.15 6.58 3.85 2.98 13.47 Accepted
7 11.72 3.70 6.78 2.68 10.98 Accepted
8 33.89 6.52 14.19 3.92 18.58 Accepted
9 14.55 5.72 4.49 3.70 15.15 Accepted
10 17.72 4.54 9.68 2.60 13.14 Accepted
All the items in the test have critical ratio greater than 2.58 and hence all the
ten items of the draft test can be selected for the final test.
The item total correlation was calculated by correlating the score on each
item of the Mathematical Creativity Test with the total score obtained for the test.
This was done to verify whether the score of each item significantly contribute to the
Mathematical Creativity Score. The correlation coefficients are presented in table 4.

Methodology 95
Table 4
Item - total correlation of Mathematical Creativity Test
Item No. 1 2 3 4 5 6 7 8 9 10
Correlation 0.63 0.33 0.56 0.60 0.60 0.66 0.69 0.83 0.68 0.61
The correlation coefficients indicate that significant correlation exist between
the scores of all the items and the total Mathematical Creativity Score at .01 level.
The correlation coefficient for the scores on the three dimensions and the
total Mathematical Creativity Score were also calculated. The details are given as
table 5.
Table 5
Correlation coefficient for scores on dimensions with Mathematical Creativity Score
Dimension Correlation coefficient with Mathematical Creativity Score
Fluency 0.96
Flexibility 0.84
Originality 0.72
The correlation coefficients obtained show that the dimensions are highly
correlated with total score of Mathematical Creativity. Considering all the three
criteria for selection of items in the test, all the ten items in the draft test were
selected for the final test.
Scoring procedure
The Mathematical Creativity Test has been scored for three factors of
creativity, viz., fluency, flexibility and originality. The responses to each item of the
test receives three types of scores and the sum of all the three scores for all the items

Methodology 96
of the test is considered as the total score of Mathematical Creativity. The scoring
pattern of Fluency, Flexibility and Originality are explained below.
Fluency
For each item the relevant responses are counted and each response is
assigned a score of one. The total score obtained for all the items in the test is the
total score of the individual on Fluency.
Flexibility
The responses are classified into categories and a score of one is assigned for
each category. No additional score is assigned for more than one response in a
category. The sum of the scores obtained for the items is taken as the Flexibility
score.
Originality
The score is given based on different degrees of uncommonness of the
response as shown in table 6.
Table 6
Scoring procedure for Originality
Sl. No. Groups according to uniqueness of response Score
1 Less than 5% 5
2 5% to 10% 4
3 10 to 15% 3
4 15 to 20% 2
5 20 to 25% 1
6 More than 25% 0

Methodology 97
The responses to each item is to be analyzed in the whole sample and based
on the uniqueness of each response, score is to be assigned. Total of these scores is
the originality score obtained for that item. Sum of the originality score of all the
items is the score on Originality. The total of the scores on Fluency, Flexibility and
Originality obtained by a respondent is his/her Mathematical Creativity score. As
per the nature of the test, the minimum score is zero and there is no maximum score.
The higher the score, the higher will be Mathematical Creativity.
Reliability
The reliability of the test was measured using Cronbach Alpha Coefficient
which is an index of internal consistency of the test. The value obtained is .782
indicating that the test is reliable (N= 370).
Cronbach Alpha coefficient was calculated for each component viz.,
Fluency, Flexibility and Originality. The details are given as table 7.
Table 7
Cronbach Alpha coefficients for Fluency, Flexibility and Originality
Components Item
1 Item
2 Item
3 Item
4 Item
5 Item
6 Item
7 Item
8 Item
9 Item 10
Fluency α = .778
.764 .762 .772 .776 .762 .766 .776 .765 .755 .775
Flexibility α = .692
.597 .661 .595 .617 .629 .627 .596 .669 .620 .667
Originality α = .743
.589 .637 .594 .606 .578 .604 .646 .730 .589 .622

Methodology 98
The reliability coefficients (Cronbach α) obtained for the components
Fluency, Flexibility and Originality are .778, .692 and .743 respectively. The values
of α when each item is dropped from the set of 10 items is less than the total value
obtained in the case of Fluency, Flexibility and Originality and hence all the ten
items sufficiently explain the components.
Validity
Content validity of the test was ensured by taking much care in framing
items for the test. Suggestion from experts in the field was incorporated while
preparing the test. Concurrent validity of Mathematical Creativity Test was
estimated by correlating the score of the test with marks obtained by 35 students in
the Test of Mathematical Creativity developed by Sumangala (1998). The
correlation coefficient obtained is .764 indicating that the test is valid to measure
Mathematical Creativity among secondary school students.
A copy of the final form of the Mathematical Creativity Test (Malayalam
and English version) is appended as Appendix 2.
Optimism Inventory (Vijayakumari & Midhundas, 2016)
The concept of Learned Optimism was introduced by Seligman (1992) and
according to him optimists as those who tend to believe that defeat is just a
temporary setback when confronted with hard knocks of the world and they believe
that the causes for the present failure is confined to this particular case. The
inventory prepared by Seligman (1992) contains 41 items and is based on western
culture.

Methodology 99
Construction of the Tool
The first step in the construction and standardization of any tool is planning
of the tool. For the present study, the investigator prepared Optimism Inventory to
study the Optimism in secondary school students of Kerala based on the inventory
by Seligman. The items are given as a statement to which there are two options,
namely optimistic and not optimistic. The inventory (draft form) contains 41 items
related to the life situations of students.
Example: A friend surprised you with a gift.
a) The friend got a high mark in the exam
b) The previous day, I also gave a gift.
Item analysis
The inventory was administered on a sample of 370 secondary school
students selected by stratified random sampling technique giving due representation
to gender of the students. The 370 response sheets obtained were scored and the total
score for each sheet was calculated. Then these were arranged in descending order
of the total score and the lowest and highest 27 percentage of the 370 sheets (100
sheets each) were separated. As the responses to the item are dichotomous,
discriminating power of the items were calculated using the formula
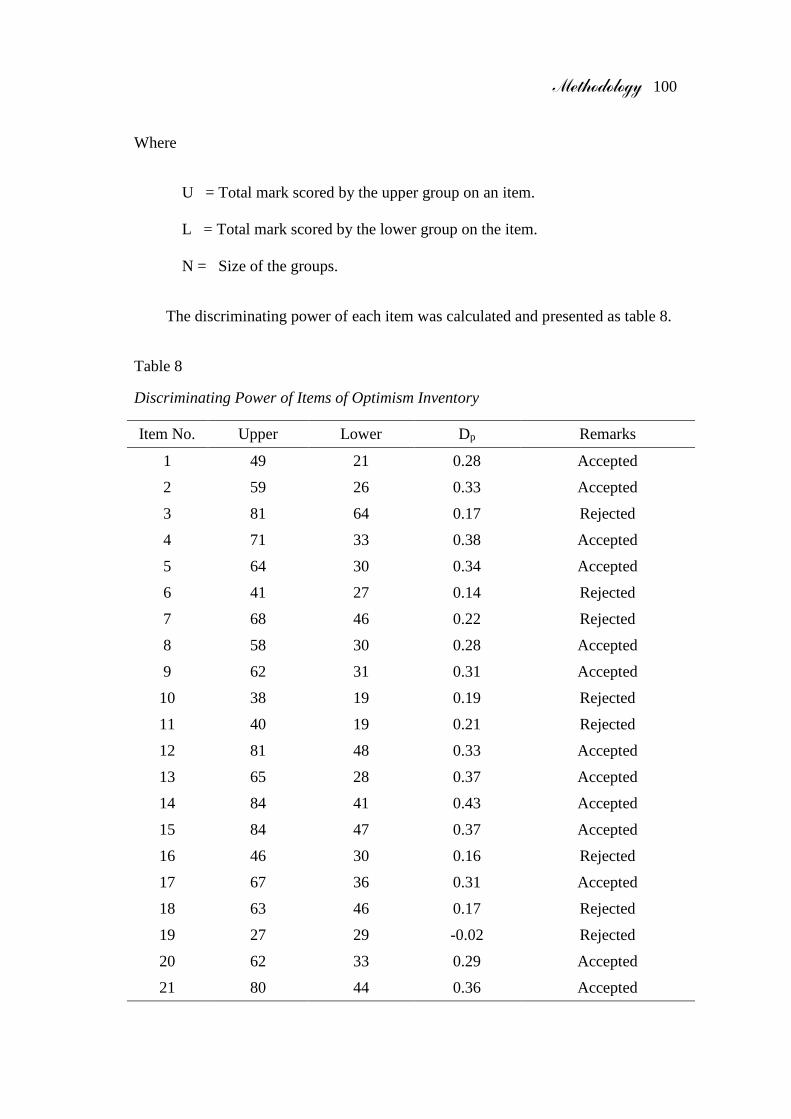
Methodology 100
Where
U = Total mark scored by the upper group on an item.
L = Total mark scored by the lower group on the item.
N = Size of the groups.
The discriminating power of each item was calculated and presented as table 8.
Table 8
Discriminating Power of Items of Optimism Inventory
Item No. Upper Lower Dp Remarks
1 49 21 0.28 Accepted
2 59 26 0.33 Accepted
3 81 64 0.17 Rejected
4 71 33 0.38 Accepted
5 64 30 0.34 Accepted
6 41 27 0.14 Rejected
7 68 46 0.22 Rejected
8 58 30 0.28 Accepted
9 62 31 0.31 Accepted
10 38 19 0.19 Rejected
11 40 19 0.21 Rejected
12 81 48 0.33 Accepted
13 65 28 0.37 Accepted
14 84 41 0.43 Accepted
15 84 47 0.37 Accepted
16 46 30 0.16 Rejected
17 67 36 0.31 Accepted
18 63 46 0.17 Rejected
19 27 29 -0.02 Rejected
20 62 33 0.29 Accepted
21 80 44 0.36 Accepted

Methodology 101
Item No. Upper Lower Dp Remarks
22 42 33 0.09 Rejected
23 63 39 0.24 Rejected
24 41 28 0.13 Rejected
25 30 17 0.13 Rejected
26 75 46 0.29 Accepted
27 68 44 0.24 Rejected
28 58 34 0.24 Rejected
29 66 32 0.34 Accepted
30 62 27 0.35 Accepted
31 43 23 0.2 Rejected
32 60 26 0.34 Accepted
33 69 37 0.32 Accepted
34 76 45 0.31 Accepted
35 71 40 0.31 Accepted
36 52 22 0.3 Accepted
37 62 30 0.32 Accepted
38 26 15 0.11 Rejected
39 73 32 0.41 Accepted
40 64 30 0.34 Accepted
41 57 30 0.27 Accepted
Items with discrimination power greater than or equal to .25 were selected
for the final tool. Based on this, 25 items were retained and 16 statements were
rejected.
Scoring procedure
There are two options namely A, B for every item and one option shows
optimistic and other shows not optimistic respectively. In this, one mark is given for
choosing optimism and zero for the other. The total mark obtained by a student is

Methodology 102
the optimism score.Option A in items 1, 8, 9, 13, 14, 17, 26, 29, 35, 37, 39 and
option B in items 2, 4, 5, 12, 15, 20, 21, 30, 32, 33, 34, 36, 40, 41 denote optimism.
Reliability
Internal consistency of the tool was calculated by using KR-20 formula. The
reliability coefficient obtained is .82, the value shows that the tool is highly reliable.
Validity
The Optimism Inventory has construct validity as the items were prepared on
the basis of concept of Learned Optimism by Seligman (1992).
A copy of the draft and final form of the Optimism Inventory (Malayalam
and English version) are appended as Appendix 3.
Scale on Academic Stress (Vijayakumari, Sajmadas & Midhundas, 2015)
The Scale on Academic stress was developed and standardized by the
investigator, Sajmadas and supervising teacher, to measure the stress experienced by
students during their academic period. Detailed description of the construction of the
tool is given below.
Planning
The first step in the construction and standardization of any tool is planning.
It was planned to prepare a scale to measure academic stress among secondary
school students. After reviewing literature, the factors suggested by Lin and Chen

Methodology 103
(2009) for academic stress were selected for the scale. The seven factors based on
which the scale was prepared are given in table 9.
Table 9
Factors Affecting Academic Stress of Students
Stress from teachers Teaching materials, teaching and exercise items.
Stress from results Stress from Parents, including conflicts between expectations and opinions and drops in grades.
Stress from tests Worry about how to prepare for a test and redo the compulsory courses.
Studying in group stress Exercise reports, grouping, etc.
Peer stress Academic competition, peer interferences, etc.
Time management stress Social activities and student association, time management and choices, etc.
Self-inflicted stress Self-expectation, interests of course selection, etc.
The detailed descriptions of the factors are as follows
Stress from Teachers
The cause for stress can be teacher related and such stress is rooted with
teachers, their method of teaching, the teaching materials, and the exercise items
assigned for students. Students become less interested and motivated to learn when
their teachers do not have enough energy and passion for inspirational teaching
(Klusmann, Kunter, Trautwein, Lüdtke, & Baumert, 2008; Skaalvik & Skaalvik,
2007). Way of teaching of particular teachers cannot be digested by certain pupils.
Some lessons are too difficult and strict teachers lead them to reduce interest in
associate subjects. This creates severe stress in pupils. Some teachers provide too

Methodology 104
much data which causes difficulty to assimilate knowledge in a proper way. Lack of
support from teachers is another cause of stress to students.
Stress from results
The stress from results is the feeling of anxiety when waiting for an exam
result such as fear of failure, and stress from parents, including conflicts between
expectations and opinions and drops in grades. A feel of failure in test papers is an
important reason for test stress in the pupils.
Stress from tests
Perceived stress has been shown to increase during exam periods
(Zunhammer, Eberle, Eichhammer & Busch, 2013). Test stress means getting a little
nervous in a test situation. A student with test anxiety has debilitating feelings of
worry and fear which impacts a negative performance. When the exam is getting
nearer, the pressure of teachers and guardians upon the students become very high
and hence they come under high stress. Lack of preparation, redoing of exams,
illness, lack of memory, not getting enough sleep, test preparation etc also cause
stress in pupils.
Studying in group stress
Learning in groups plays an important role in enhancing learning. Anxious
thoughts in some students influence learning and often face problems when working
with groups. Certain worries made obstacles to perform well and in completing
academic works.

Methodology 105
Peer stress
Peer pressure is the direct influence on students by their peers, or an
individual who gets encouraged to follow their peers. They may change their
attitudes, values, or behaviors and some behave strangely from their comfort zone.
Peer stress is very strong during adolescence, is the period of stress and strain, so
acceptance and sense of feelings are developed during this period. Generally
academic competitions and useless interference among the peers contribute to peer
stress.
Time management stress
An individual fails to cope up with balancing his commitments, such as
academic work and volunteering sports, hobbies, and social activities, can
sometimes make frustration. Time management is one of the most valuable skills
one learns in schools, and is an important component for being successful.
For making a successful life, time scheduling is one of the valuable skills.
Time management is an ability of decision making and helps each one how to
allocate time to reaching their goals. Some students show maladjustment with
scheduling the time between academic and social activities, with student association
etc., that causes stress in them.
Self-inflicted stress
Self – inflicted stress is the stress due to inability to set a mind on how to
manage the expectations, time, relationships, and interest. Stress is induced in the
mind of the pupil due to various reasons like lack of timely preparation, emotional
problems and some barriers. Family, illness, physical and mental disturbances etc
also make stress in students.

Methodology 106
Preparation of the Tool
While writing items for the scale based on the above dimensions, great care
was taken to make it clear and simple. Based on the seven dimensions 35 statements
were written and have undergone discussion with experts. According to the
suggestions from experts some items were discarded and some were modified. Thus
32 items were selected for the draft scale. These 32 statements are so framed that the
possible responses for each statement is Strongly Agree (SA), Agree (A), Undecided
(U), Disagree (D) or Strongly Disagree (SD). The dimension, number of items in
each dimension and sample items are given as table 10.
Table 10
Seven Dimensions and Number of Items under each Dimension
Sl. No.
Dimension No. of items
Sample items
1 Stress from Teachers
6 I feel that the exercises and reports of some teachers are too difficult.
2 Stress from Results
7 I feel that there is vast difference between my current results and upper primary school results.
3 Stress from tests
5 I do not get good enough sleep at night because I worry about school tests.
4 Group stress
3 I feel nervous when I conducting a speech or give a presentation.
5 Peer stress 2 I feel anxiety that my exam results are not as good as those of my classmates are.
6 Time management stress
3 I feel that it is very difficult for me to adjust between my academic and social activities.
7 Self-inflicted stress
6 I have no interest in some subjects.
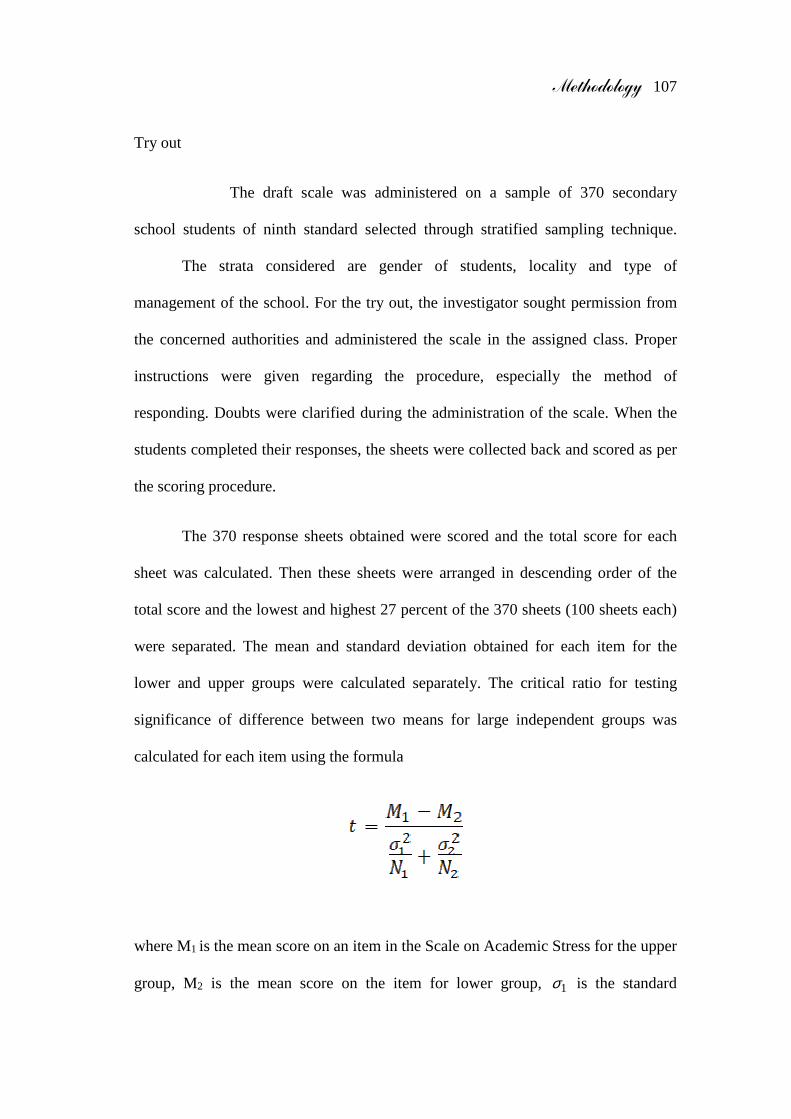
Methodology 107
Try out
The draft scale was administered on a sample of 370 secondary
school students of ninth standard selected through stratified sampling technique.
The strata considered are gender of students, locality and type of
management of the school. For the try out, the investigator sought permission from
the concerned authorities and administered the scale in the assigned class. Proper
instructions were given regarding the procedure, especially the method of
responding. Doubts were clarified during the administration of the scale. When the
students completed their responses, the sheets were collected back and scored as per
the scoring procedure.
The 370 response sheets obtained were scored and the total score for each
sheet was calculated. Then these sheets were arranged in descending order of the
total score and the lowest and highest 27 percent of the 370 sheets (100 sheets each)
were separated. The mean and standard deviation obtained for each item for the
lower and upper groups were calculated separately. The critical ratio for testing
significance of difference between two means for large independent groups was
calculated for each item using the formula
where M1 is the mean score on an item in the Scale on Academic Stress for the upper
group, M2 is the mean score on the item for lower group, 1σ is the standard

Methodology 108
deviation of the scores for that item for upper group and 2σ is the standard deviation
of the scores on the item for the lower group.
After calculating critical ratio, items having critical ratio greater than or
equal to 2.58 were included in the final scale. The details of items analysis of Scale
on Academic Stress is given in table 11.
Table 11
Data and Results of Item Analysis of Scale on Academic Stress
Item
No. M1
M2
t-value Remarks
1 4.26 1.03 2.39 1.24 11.56 Accepted
2 3.90 1.00 2.59 1.27 8.09 Accepted
3 3.73 1.91 2.79 1.23 6.11 Accepted
4 3.78 .83 2.73 1.44 6.27 Accepted
5 4.01 .88 2.76 1.33 7.81 Accepted
6 4.06 1.88 3.26 1.26 5.04 Accepted
7 4.29 .71 2.47 1.50 10.95 Accepted
8 3.86 1.02 2.04 1.29 11.02 Accepted
9 4.37 1.96 3.868 1.28 4.29 Accepted
10 3.90 1.10 2.50 1.32 8.12 Accepted
11 3.51 1.16 2.17 1.24 7.84 Accepted
12 3.85 1.06 3.10 1.28 4.49 Accepted
13 4.03 .99 2.32 1.14 11.25 Accepted
14 3.86 1.01 2.14 1.26 10.61 Accepted
15 3.62 1.16 2.19 1.13 8.80 Accepted
16 3.60 1.13 1.98 1.12 10.11 Accepted
17 4.21 .93 2.49 1.47 9.85 Accepted
18 4.29 .80 2.96 1.54 7.61 Accepted
19 3.36 1.03 2.05 1.13 8.56 Accepted

Methodology 109
Item
No. M1
M2
t-value Remarks
20 3.80 1.94 2.57 1.29 7.67 Accepted
21 3.92 .99 2.28 1.03 11.43 Accepted
22 3.85 .74 2.55 1.20 9.15 Accepted
23 3.35 1.15 1.85 .94 10.02 Accepted
24 3.97 .78 2.34 1.27 10.90 Accepted
25 4.00 1.96 2.16 1.18 12.03 Accepted
26 4.03 1.95 2.54 1.32 9.09 Accepted
27 4.07 .90 2.39 1.21 11.11 Accepted
28 3.14 1.27 1.75 1.03 8.46 Accepted
29 4.14 1.03 2.93 1.40 6.92 Accepted
30 3.32 1.29 1.82 1.11 8.78 Accepted
31 3.26 1.26 1.81 1.20 8.32 Accepted
32 4.10 .89 2.54 1.35 9.59 Accepted
The items with critical ratio, ‘t’ greater than 2.58, the tabled value of ‘ t’
required for significance at .01 level were selected for the final scale. Thus all the 32
items in the draft scale were selected for the final scale. A student needs
approximately 20 minutes to respond to these 32 items.
Scoring Procedure
The Scale on Academic Stress is a five point Likert type Scale with
responses- Strongly agrees (SA), Agree (A), Undecided (U), Disagree (D) and
Strongly Disagree (SD). A score of 5 was given for a response Strongly Agree, 4 for
Agree, 3 for Undecided, 2 for Disagree and 1 for Strongly Disagree. The minimum
score obtainable in the scale is 32 and maximum is 160.

Methodology 110
Reliability
The internal consistency of the scale was established by calculating
Cronbach alpha coefficient. The value obtained is .87 (N=370) and hence the scale
can be considered as a reliable one.
Validity
The validity of the present scale was ensured through face validity, content
validity and concurrent validity. Content validity of the scale was ensured by taking
much care in framing items for the scale. Suggestion from experts in the field was
incorporated while preparing the scale. The items in the present scale were phrased
in the least ambiguous way and the meaning of all the terms were clearly defined, so
that the subjects responded to the items without difficulty and misunderstanding.
Hence the scale possesses face validity. Concurrent validity of Scale on Academic
stress was estimated by correlating with the score obtained by 30 students in the
Academic stress Inventory developed by Department of Psychology, University of
Calicut. The correlation coefficient obtained is .789 indicating that the scale is valid
to measure Academic stress among secondary school students.
A copy of the final form of the Scale on Academic Stress (Malayalam and
English version) is appended as Appendix 4.
Test of Problem Solving Ability in Mathematics (Sumangala & Rinsa, 2008)
Test of Problem Solving Ability in Mathematics developed by Sumangala
and Rinsa (2008) was adopted for measuring Problem Solving Ability of students in
Mathematics. Six types of problems viz., Logical problems, Algorithmic Problems,

Methodology 111
Story Problems, Rule using Problems, Troubleshooting Problems, Situated case
Problems are included in the test and there are 25 multiple choice items in the test.
The total time limit for the test was fixed as 35 minutes. The number of items under
each type of problem is given as table 12.
Table 12
Number of Items based on Types of Problems
Sl. No. Types of problems No. of Items
1 Logical problems 9
2 Algorithmic problems 4
3 Story problems 2
4 Rule using problems 7
5 Troubleshooting problems 2
6 Situated case problems 1
Total 25
The types of problems included in the test are explained with sample item
from each.
Logical problems
Logical problems are problems that need mental acuity, clarity and logical
reasoning to reach at the solution.
Example: Raman walks in front of Krishnan, Rajan walks in front of Rama, Sethu
walks in front of Rajan and Sita walks in front of Rama. Who is at the last?
Methodology 112
Sita
Krishnan
Sethu
Rajan
Algorithmic Problems
For solving such problems, learners need to select and present the proper
sequence of operations.
Example: If 13=12, 13 + 23 =32 13+23+33+43=102 then 13+23+33+43+53+63 =?
212
152
62
21
Story Problems
Story problem is a mathematical exercise where significant background
information needed to solve an algorithm is presented as a text. Using this, learners
find out a mathematical equation for solving the problem; extract the values for the
narrative and solve for the unknown quantity.
Example: Bimal went for a walk after sunrise in the early morning. After a while he
met Stephen who was coming from the opposite direction. While talking to
Stephen, Stephen's shadow appeared on Bimal's right side. So which direction was
Bimal facing?

Methodology 113
East
West
South
North
Rule using Problems
Many problems have correct solutions with multiple solution paths or
multiple rules governing the process. They tend to have a clear purpose or goal that
is constrained but not restricted to a specific procedure or method. The purpose of
rule using problems is to find the most relevant information in the least amount of
time.
Example: If the difference between 6 times and 8 times of a number is 40 then the
number is?
240
320
40
20
Troubleshooting Problems
Troubleshooting Problem is one of the most common forms of everyday
problem solving. The primary purpose of troubleshooting is fault state diagnosis.
That is, some part of a system is not functioning properly, resulting in a set of
symptoms, which have to be diagnosed and match with the user’s knowledge of
various fault states. Troubleshooting skills requires a combination of domain and

Methodology 114
system knowledge, troubleshooting strategies such as search and replace, serial
elimination, and space splitting and experience. These skills are integrated and
organized by the trouble shooter’s experience.
Examples: Find three different numbers in which the sum of reciprocals of these
numbers is a natural number?
1,2,3
2,5,6
1,3,6
None of these.
Situated case Problems
Case problems are situations. Case problem requires the solver to articulate
the nature of the problem and the different perspectives that impact the problem
before suggesting solutions. They are contextual and justifying the decision is the
most important process in solving the problem.
Example: A soap measures 5cm × 4cm × 1.5cm. How will you find how many soaps
a card board box can contain, which measures 55cm × 48cm × 15cm.

Methodology 115
Scoring procedure
The test contains 25 multiple choice items and the responses are given as a,
b, c and d among which one is the correct answer and the other three are distractors.
A separate answer sheet is provided along with the test which contains the four
options for each item. A respondent has to mark his/her response by putting a ()
mark against a letter denoting the answer that he/she thinks as the correct one. For
each correct response a score of 1 is assigned whereas a zero score is given for an
incorrect response. The maximum score obtainable in the test is 25 and the
minimum is zero.
Reliability
The test developers have reported the reliability coefficient as .75 calculated
by test- retest method (N=40). Hence the scores of the test can be considered as
reliable.
Validity
Concurrent validity of Test of Problem Solving Ability in Mathematics was
established by correlating the score of the test with the marks obtained by the
students in another test of Problem Solving Ability in Mathematics developed by
Sumangala and Vijayakumari (2000) using Pearson’s Product Moment Coefficient
of Correlation. The correlation coefficient obtained is 0.59. A significant positive
correlation between the scores of the two tests indicates that the test is valid to
measure Problem Solving Ability in Mathematics.

Methodology 116
A copy of the Test of Problem solving ability in Mathematics is appended as
Appendix 5.
Mathematics Anxiety Scale (Sumangala & Malini, 1993)
The variable Mathematics Anxiety was measured using the Scale of
Mathematics Anxiety developed by Sumangala and Malini (1993) after re-
standardization with the consent of the original developers. This scale is in the form
of a five point Likert type Attitude scale and is intended to measure the extent of
fear or the feeling of apprehension in working with Mathematics on the assumption
that a feeling of apprehension would possibly spur a student into working hard and
hence improve his/her performance. If the apprehension is so intense that the normal
reasoning process is inhibited, then it is fear and hence debilitating anxiety. The
original scale consists of 29 statements in which 23 are for measuring debilitating
anxiety and 6 are for measuring facilitating anxiety. To each statement, students are
to respond in any of the five ways, viz., Strongly agree (SA), Agree (A), Undecided
(U), Disagree (D) and Strongly Disagree (SD).
Example:
Debilitating anxiety: In the classroom, I face difficulties while doing calculations
which I use daily.
Facilitating anxiety: Even if my answer is wrong, I will do calculations on the board
if I get a chance.
As the scale was prepared more than 20 years back, it was re-standardized by
the investigator. The Mathematics Anxiety Scale was administered on a sample of

Methodology 117
370 secondary school students selected by stratified random sampling technique
giving due representation to gender of the students, locale of the schools and type of
management of schools. The 370 response sheets obtained were scored and the total
score for each sheet was calculated. Then these sheets were arranged in descending
order of the total score and the lowest and highest 27 percentage of the 370 sheets
(100 sheets each) were separated. The mean and standard deviation obtained for
each item for the lower group and upper group were calculated separately.
Then t-value for each item was calculated using the formula
where M1 is the mean score on Mathematics Anxiety obtained for an item for the
upper group, M2 is the mean score on Mathematics Anxiety obtained for that item
for lower group, σ1 is the standard deviation of the Mathematics Anxiety scores for
that item for upper group and σ2 is the standard deviation of the Mathematics
Anxiety scores for that item for lower group. N1 and N2 stand for the size of upper
and lower group respectively. After calculating critical ratio, items having critical
ratio greater than or equal to 1.96 were selected for the final scale. The details of
item analysis of Mathematics Anxiety scale are given in table 13.

Methodology 118
Table 13
Data and Results of Item Analysis of Mathematics Anxiety Scale (N1=N2=100)
Item No
M1 σ1 M2 σ2 t-value Remarks
1 2.20 1.35 4.30 1.13 11.88 Accepted
2 2.60 1.33 4.38 0.70 11.79 Accepted
3 2.67 1.31 4.01 1.07 7.89 Accepted
4 2.83 1.36 3.97 0.90 6.96 Accepted
5 3.07 1.40 3.96 1.01 5.11 Accepted
6 2.35 1.22 3.91 0.98 9.91 Accepted
7 2.58 1.34 2.88 1.35 1.57 Rejected
8 1.75 1.14 3.08 1.45 7.17 Accepted
9 2.84 1.38 3.94 1.02 6.44 Accepted
10 2.48 1.12 2.87 1.21 2.35 Accepted
11 3.07 1.38 4.18 0.94 6.60 Accepted
12 2.07 1.13 3.79 1.10 10.84 Accepted
13 2.14 1.24 3.90 1.05 10.75 Accepted
14 2.92 1.24 3.61 1.17 4.03 Accepted
15 1.88 1.05 3.67 1.23 11.03 Accepted
16 2.12 1.28 4.29 1.14 12.56 Accepted
17 2.32 1.20 3.92 1.04 10.04 Accepted
18 1.83 0.94 3.53 1.30 10.55 Accepted
19 1.28 0.60 3.32 1.37 13.56 Accepted
20 1.87 1.16 3.47 1.34 8.98 Accepted
21 2.00 0.99 3.92 1.05 13.26 Accepted
22 2.20 1.19 2.45 1.29 1.42 Rejected
23 2.38 1.10 3.93 1.06 10.08 Accepted
24 2.64 1.32 2.84 1.23 1.10 Rejected
25 2.62 1.24 4.13 0.97 9.56 Accepted
26 2.43 1.09 4.06 0.91 11.40 Accepted
27 2.27 1.21 2.53 1.29 1.46 Rejected
28 2.63 1.31 2.81 1.32 0.96 Rejected
29 2.58 1.27 4.05 1.18 8.45 Accepted

Methodology 119
Items with critical ratio greater than 1.96, the value required for significance
at .05 level were selected for the final scale. Thus 24 items were selected for the
final scale and five items were rejected. Among 24 items, one item is for facilitating
anxiety and the 23 items are for debilitating anxiety. A student needs
approximately15 minutes to complete responses of the 24 items.
Scoring Procedure
The Mathematics Anxiety Scale is a five point Likert Scale with responses-
Strongly Agree (SA), Agree (A), Undecided (U), Disagree (D) and Strongly
Disagree (SD). For a debilitating Anxiety item, the scores assigned are 5, 4, 3, 2 and
1 and for facilitating Anxiety item, the scores assigned are 1, 2, 3, 4 and 5 for the
responses SA, A, U, D and SD respectively. The sum of scores for all the items is
the score on the Mathematics Anxiety Scale.
The revised version of Mathematics Anxiety scale contains 24 items and the
minimum score obtainable is 24 and the maximum score is 120.
Reliability
The test developers have claimed that the test- retest reliability coefficient as
.86 (N = 35) and the Cronbach’s Alpha coefficient as .80 (N = 100). Cronbach
Alpha coefficient was calculated for the revised version of Mathematics Anxiety
scale to test the internal consistency of the scale. The value obtained is .85 indicating
that the scale is a reliable one. The alpha coefficient when each item is dropped is
given as table 14.

Methodology 120
Table 14
Item – Excluded Alpha Coefficient for the Mathematics Anxiety Scale
Item No. Cronbach's α Item No. Cronbach's α
1
2
3
4
5
6
7
8
9
10
11
12
0.830
0.825
0.833
0.831
0.836
0.828
0.838
0.835
0.842
0.836
0.828
0.829
13
14
15
16
17
18
19
20
21
22
23
24
0.842
0.832
0.828
0.831
0.830
0.829
0.831
0.822
0.827
0.831
0.827
0.830
The values of Alpha coefficient when each item is dropped from the set of 24
items are less than the value obtained from the entire set of the 24 items and hence
the 24 items in the scale sufficiently explains the construct, Mathematics Anxiety.
Thus the items of the revised version of Mathematics Anxiety Scale are
internally consistent and hence the scale is reliable.
Validity
The statements of the original scale were phrased in the least ambiguous way
and hence wording of the statement will suggest that the scale is a good measure of
Mathematics Anxiety. So it can be said that the scale has face validity.
Construct validity of the scale was examined by the developers through
testing the following hypotheses.

Methodology 121
i. The measure of the scale will discriminate significantly between high and
low achievers in Mathematics.
ii . The measures of the scale will be negatively related to measures of the scale
of Self Concept in Mathematics by testing, using a sample of 30 students the
above two hypotheses were found confirmed. (t-value 38.207 and r = -.632).
Validity of the scale was estimated empirically by comparing the scores on
the scale with the scores of Kerala Examination Anxiety scale (Nair,1976)
and by correlating with Achievement scores in Mathematics. The correlation
coefficients obtained are .57 and -.64 (N = 40) respectively.
As no change in the structure of the scale was made, the revised version of
the scale is also valid to measure Mathematics Anxiety of secondary school students.
A copy of the final Mathematics Anxiety Scale is appended as Appendix 6.
Locus of Control Scale (Kunhikrishnan & Mathew, 1987, Re-standardized by
Manikandan & Sujisha, 2017)
The scale was developed by Kunhikrishnan and Mathew (1987) on the basis
of Rotter I-E Scale and Reid-Ware Three Factor Scale. The original scale contained
70 items with possible responses as right or wrong. The items are to be scored in
favour of external locus of control.
The original scale was re-standardized by Manikandan and Sujisha (2017).
The modified scale contains 46 items, the pattern of responding and scoring being
the same as the original version.
Methodology 122
Example: If you start a day well, all the other activities of the day will be good.
Scoring procedure
For an item indicating external Locus of Control, a score of ‘1’ is to be given
for the response ‘Right’ and for the response ‘Wrong’ zero. For the reverse items,
the scoring is in the reverse order. The total score obtainable in the scale is 46 and
minimum zero.
Reliability
Reliability of the original scale was estimated by split- half method (N=200)
and the reliability coefficient reported is .825.
Reliability of the modified form was estimated by Manikandan and Sujisha
(2017) using test- retest method and reliability coefficient obtained is .78. The
values show that the scale is a reliable one.
Validity
Criterion related validity was established by taking the external criterion as
the scores on Locus of Control Questionnaire (Kunhikrishnan, Chandran &
Kuruvilla, 1979). The correlation coefficient obtained is .72 which indicates that the
scale is valid to measure Locus of Control.
A copy of the Locus of Control Scale is appended as Appendix 7.

Methodology 123
Data Collection Procedure
After making a clear idea about the sample, the investigator prepared a
detailed plan of procedure for data collection. The investigator visited the schools
selected for data collection and sought permission from the heads of the institution
officially. After getting permission, the investigator contacted the teachers in charge
of the assigned classes and informed them about the nature of data collection. Six
instruments were to be administered among students in order to collect necessary
data and it took approximately 3 hours to complete the administration of the
instruments. The investigator informed the purpose and nature of data collection
procedure to students and ensured the confidentiality of data. After seeking their co-
operation the investigator administered the instruments one by one by giving proper
instruction and working out examples (especially for Mathematical Creativity Test).
While administering the Mathematical Creativity Test and Test of Problem Solving
ability in Mathematics, the time schedule was strictly followed. For other
instruments, when students completed their responses for one instrument, the sheets
were collected back and the next instrument was distributed. At most care was taken
to make the data collection procedure uniform to all the groups.
Scoring and Consolidation of Data
The response sheets were sorted and arranged the set for each participant.
The incomplete response sheets were discarded, and if one response sheet of a
participant is found to be incomplete, the entire set of response sheets of that
participant was rejected. This reduced the final sample size to 700, though data was
collected from 800 students.

Methodology 124
The breakup of the final sample was presented in figure 3.
Figure 3. Breakup of the final sample
Each response sheet was scored based on the scoring procedure and tabulated
in the Excel worksheet. The statistical analysis was carried out using statistical
package for social sciences (SPSS) and JAMOVI.
Statistical Techniques
The data collected was systematically tabulated, consolidated and
subjected to suitable statistical analysis. This part deals with a detailed description of
statistical techniques employed to test the tenability of the hypotheses formulated for
the present study. Statistical techniques used for the present study are explained
below.
Boys 104
Girls 88
Boys 87
Girls 100
Boys 79
Girls 96
Boys 62
Girls 84
Aided 187
Government 192
Aided 146
Government 175
Urban 379
Rural 321
Kerala 700

Methodology 125
Preliminary Analysis
Descriptive statistical measures such as mean, standard deviation and deciles
of the scores on dependent variable were calculated for the total sample and
subsamples based on gender of the students, locality and type of management of
school. 99 percent Confidence Interval for Mean of Mathematical Creativity was
calculated to estimate the population mean. Skewness and Kurtosis of the
distribution for the total sample were also calculated.
Pearson’s Product Moment Coefficient of Correlation
Pearson’s correlation coefficient is the test statistics that measures the
statistical relationship between two continuous variables. It gives information about
the magnitude of the correlation, as well as the direction of the relationship.
Pearson’s Product Moment Coefficient of Correlation ‘r’ was used to
estimate the extent of relation between Mathematical Creativity and the select
Psychological variables. Shared variance (r2 × 100) was calculated to know the
variance accounted for by one variable on other.
Multiple Regression Analysis
Multiple regression equation for Mathematical Creativity with problem
solving ability in mathematics, academic stress, mathematics anxiety, locus of
control and optimism was developed. The method of multiple regression analysis
deals with estimating a dependent variable from some combination of a number of
independent variables.

Methodology 126
Multiple regression analysis is used to explain the relationship between two
or more independent variables and one dependent variable. A dependent variable is
formed as a function of several independent variables with corresponding
coefficients, along with the constant term. A regression equation is developed to
predict the dependent variable from the select independent variables.
The multiple regression equation can be explained as
y = b1x1 + b2x2 + … + bnxn + c.
Here, b1,b2…..bn are the regression coefficients, which represent the value at which
the criterion variable changes when the predictor variable changes. The b values
explain the degree at which each predictor variable affects the criterion variable
when the effects of all other predictor variables are kept constant.
Multiple regression analysis was used for the present study to predict
individual and joint effect of the select psychological variables on Mathematical
Creativity. Forced entry method was used for this using JAMOVI
Regression analysis being a parametric test has to satisfy some assumptions,
major ones being the assumptions on Homoscedasticity, Autocorrelation,
Multicollinearity and Normality of the residuals.
While using multiple regression, first of all the predictor variables must be
measured in an interval or ratio scale (or dichotomous) and the criterion variable
must be quantitative/ in interval or ratio scale, continuous and unbounded. Also the
predictor variables are expected to have non zero variance.
Methodology 127
Homoscedasticity means equality of the variance of the residuals at each
level of the independent variables. The assumption of homoscedasticity can be
tested through Levene’s test or can be interpreted from the data through scatter plot
of standardized residuals against standardized predicted values.
Autocorrelation means when regression analysis is performed on data taken
over successive time intervals the residuals are often correlated. Assumption of
independent error or absence of autocorrelation can be tested by calculating Durbin-
Watson statistics. The value varies from zero to four, as a rule of thumb, it is
accepted that a value less than one or greater than three indicates presence of
autocorrelation. A value greater than one, near to two indicates lack of
autocorrelation.
Multicollinearity is the existence of linear relationships between two or more
independent variables. The presence of multicollinearity between variables causes
some difficulties with the regression analysis. So it should therefore be ensured that
the data do not show Multicollinearity. The assumption of multicollinearity can be
tested using Variance Inflation Factors (VIF). VIF’s less than 10 and tolerance
statistics greater than .2 indicate absence of linear relation between the predictor
variables.
The assumption of normality determined by underline residuals are normally
distributed and is tested by using Shapiro – Wilk test. It is assumed that the residuals
are random variables that are normally distributed with mean zero.

Methodology 128
The results of multiple regression analysis are interpreted through the
following values.
Regression Coefficients: The coefficients of the predictor variables in the regression
equation formed are known as regression coefficients or b-values. A positive b-
value indicates a positive relation between that predictor variable and the criterion
variable, whereas a negative b-value indicates a negative relationship between the
variables. It indicates the degree of the effect of the predictor variable on the
criterion variable, the effects of other variables being considered as constant. t-
values calculated for each b-values gives idea about whether the b-value is
significantly different from zero. Variables with a non-zero b-values are taken as
significant predictors of the criterion variable.
Standardized Regression Coefficients: The β values are the standardised b- values
which are independent of the units of measurement. The beta value explains the
number of standard deviations that the criterion variable will change as the result of
change in the predictor variable by one standard deviation.
Structure Coefficient: It is the coefficient obtained by dividing the bivariate
correlation coefficient between the predictor variable and the criterion variable by
the multiple correlation. A squared value of structural coefficient gives information
on how much variance of R2 effect, the predictor can explain or the explained
variance accounted for by the predictor variable (Ziglari, 2017).
R and R2: R is the correlation between the observed and the predicted values of the
dependent variable. R2 indicates how close the observed data are to the fitted

Methodology 129
regression line. It is the percentage of variation or the amount of variance in the data
explained by the model. F-value is calculated to know the significance of R2.
Adjusted R2 denotes the amount of variance in Y accounted for by the model
if it is derived from the population than the sample values. A negligible difference
between R2 and adjusted R2 shows the model is valid to predict the criterion
variable. That is adjusted R2 is calculated to cross- validate the regression model.
Proportional reduction in error (PRE): PRE is an index for the extent that knowing a
variable helps to predict the criterion variable. A value of zero indicates no reduction
in error where as a value of 1 indicates complete prediction. Usually a value greater
than .4 is taken for representing a strong reduction in error. It is calculated by
finding the difference between the residuals of the models with and without the
variable and dividing it with the residual in the model without that predictor
variable.
Conclusion
This chapter focuses on the method, participants, instruments used, data
collection procedure and the statistical techniques used for analyzing the data. A
detailed description of the instruments developed by the investigator is also
attempted in this chapter.

Chapter 4
ANALYSIS AND INTERPRETATION
❖ Extent of Mathematical Creativity
among Secondary School Students
❖ Relationship between
Mathematical Creativity and the
Select Psychological Variables
❖ Efficiency of the Select
Psychological Variables in
Predicting Mathematical Creativity

Analysis of data is a vital step in research as it helps the researcher to address
research questions or testing the hypotheses. As Marshall and Rossman (1990)
describe, analysis of data helps to arrange the collected data in order, makes it
structured and gives meaning by describing the nature of the data and coming up
with findings and their conclusion.
This chapter includes analysis of the data collected, followed by discussion
of the results. Analysis of the collected data was done according to the objectives
and hypotheses of the study and the details are given under the major headings viz.,
⮚ Extent of Mathematical Creativity among secondary school students.
⮚ Relationship between Mathematical Creativity and the select Psychological
Variables.
⮚ Efficiency of the select Psychological Variables in Predicting Mathematical
Creativity.
The major objectives based on which analysis was done are the following.
• To find out the extent of Mathematical Creativity among secondary school
students of Kerala.

Analysis and Interpretation 131
• To find out whether the select psychological variables are significantly
related to Mathematical Creativity of secondary school students.
• To develop a regression equation for predicting Mathematical Creativity with
the select psychological variables.
• To find out the relative efficiency of the select psychological variables in
predicting Mathematical Creativity.
Extent of Mathematical Creativity among Secondary School Students
The Mathematical Creativity Test used in the study for measuring
Mathematical Creativity among secondary school students of Kerala contains 10
items and the scoring pattern of the test suggests that the minimum score on the test
is zero, but there is no maximum score. In the data collected from 700 secondary
school students, the least value obtained is two and the maximum value is 201.
To know the extent of Mathematical Creativity among secondary school
students, the mean, standard deviation and 99 percent confidence interval for mean
were calculated for the total sample and the subsamples based on gender of the
students, type of management and locale of the school. The values are given in table
15.

Analysis and Interpretation 132
Table 15
Extent of Mathematical Creativity among Secondary School Students
Group N Mean SD 99 Percent Confidence Interval
Lower Limit Upper Limit
Total 700 79.1 35.5 75.63 82.56
Boys 332 80.9 35.3 75.91 85.89
Girls 368 77.5 35.6 72.72 82.28
Government 367 73.9 33.2 69.48 78.31
Aided 333 84.9 37.1 79.65 90.14
Urban 379 81.1 30.7 77.03 85.16
Rural 321 76.8 40.4 70.98 82.61
Result and Discussion
Table 15 shows that the mean score of Mathematical Creativity obtained for
the total sample (N=700) is 79.1 with standard deviation 35.5. The 99 percent
confidence interval for mean is (75.63, 82.56). This indicates that the probability
that the mean score of Mathematical Creativity of secondary school students of
Kerala will be in between 75.63 and 82.56 is .99, the probability that the value may
be outside this interval is being less than or equal to .01.
The mean score of Mathematical Creativity obtained for boys (N=332) is
80.9 with standard deviation 35.3. The 99 percent confidence interval for mean is
(75.91, 85.89). This indicates that the mean score of Mathematical Creativity of
secondary school boy students will be in between 75.91 and 85.89 with a confidence

Analysis and Interpretation 133
of 99 percent and the maximum number of cases that may lie outside this interval is
only 1 out of 100.
From table 15 it is found that the mean score of Mathematical Creativity
obtained for girls (N=368) is 77.5 with standard deviation 35.6. The 99 percent
confidence interval for mean is (72.72, 82.28). This indicates that the probability
that the mean score of Mathematical Creativity of secondary school girl students
will be in between 72.72 and 82.28 is .99. The probability that the value may lie
outside this interval is less than or equal to .01.
Table 15 shows that the mean score of Mathematical Creativity obtained for
the government secondary school students (N=376) is 73.9 with a standard deviation
33.2. The 99 percent confidence interval for mean is (69.48, 78.31). This indicates
that the mean score of Mathematical Creativity of government secondary school
students of Kerala will be in between 69.48 and 78.31, with a probability of .99, the
probability that the value may be outside this interval be less than or equal to .01.
The mean score of Mathematical Creativity obtained for the aided secondary
school students (N=333) is 84.9 with standard deviation 37.1(Table 15). The 99
percent confidence interval for mean is (79.65, 90.14). This indicates that the
probability of the mean score of Mathematical Creativity of aided secondary school
students of Kerala to be in between 79.65 and 90.14 is .99, the probability that the
value may lie outside this interval is being less than or equal to .01.
Table 15 shows that the mean score of Mathematical Creativity obtained for
the urban secondary school students (N=379) is 81.1 with standard deviation 30.7.

Analysis and Interpretation 134
The 99 percent confidence interval for mean is (77.03, 85.16). This indicates that it
is 99 percent confident that the mean Mathematical Creativity score of urban
secondary school students of Kerala will be in between 77.03 and 85.16.The
probability that the value may be outside this interval is less than or equal to.01.
From table 15 it can be seen that the mean score of Mathematical Creativity
obtained for the rural secondary school students (N=321) is 76.8 with a standard
deviation 40.4. The 99 percent confidence interval for mean is (70.98, 82.61). This
indicates that the probability that the mean score of Mathematical Creativity of rural
secondary school students of Kerala will be in between 70.98 and 82.61 is .99. The
probability that the value may lie outside this interval is less than or equal to .01.
To get a clear picture of the distribution of data, deciles were calculated for
the total group and subgroups based on Gender, Locale and Type of Management.
Details are given in table 16.
Table 16
Deciles for the Total group and Sub groups based on Gender, Locale, and Type of
Management
Deciles
Group P10 P20 P30 P40 P50 P60 P70 P80 P90
Total 38 48 57.7 66.6 76 84 94.3 107 126
Boys 38.1 47.2 58 69 80 88.6 100 109 131
Girls 38 48 57 65 75 82 91 103 124
Government 35 43 52 61 73 80.6 90 102 119
Aided 42.2 55 63 72.8 82 89 100 115 132
Urban 44 55 62 72 79 86 94 103 119
Rural 30 41 50 61 74 82 95 112 132

Analysis and Interpretation 135
Results and Discussion
Table 16 gives the values of the deciles calculated for the variable
Mathematical Creativity for the total group as P10 (D1) 38, P20 ( D2 ) 48, P30 ( D3 )
57.7, P40 ( D4 ) 66.6, P50 ( D5 ) 76, P60 ( D6 ) 84, P70 ( D7 ) 94.3, P80 ( D8 ) 107 and P90 (
D9 ) 126. The tenth percentile score of Mathematical Creativity for secondary school
students of Kerala is 38 which means that ten percent of secondary school students
in Kerala are having Mathematical Creativity scores measured through the
Mathematical Creativity Test is less than 38. The score of 48 as P20 means that 20
percent of secondary school students of Kerala have score on Mathematical
Creativity less than 48. The score of 57.7 as P30 indicates that 30 percent of
secondary school students in Kerala have a score on Mathematical Creativity less
than 57.7. The score of 66.6 as P40 means that 40 percent of secondary school
students of Kerala have score on Mathematical Creativity less than 66.6. The score
of 76 as P50 indicates that 50 percent of secondary school students of Kerala have
score on Mathematical Creativity less than 76. The score of 84 as P60 means that 60
percent of secondary school students of Kerala have score on Mathematical
Creativity less than 84. The score of 94.3 as P70 indicates that 70 percent of
secondary school students of Kerala have score on Mathematical Creativity less than
94.3. P80 is 107 indicating that 80 percent of the entire group of secondary school
students of Kerala have score on Mathematical Creativity less than 107. P90 as 126
indicates that ten percent of the population have score on Mathematical Creativity
greater than 126.

Analysis and Interpretation 136
In the case of boys, the tenth percentile score of Mathematical Creativity is
38.1, whereas it is 38 for the total group. But P20 for boys is slightly less than that of
the total group and all other calculated percentiles are greater than that of the total
group. Ten percent of the secondary school boy students have score greater than
131, whereas it is 126 in the case of the total group.
Table 16 gives the values of the deciles calculated for the variable
Mathematical Creativity for the secondary school girl students. All the deciles for
girls are less than that of the total group, except the first and second deciles (P10 and
P20) which are equal to that of the total group.
The nine deciles calculated for the variable Mathematical Creativity for the
government secondary school students as given in table 16 are 35, 43, 52, 61, 73,
80.6, 90, 102 and 119 which are less than that of the total group. But in the case of
aided school students, the values of the deciles calculated are 42.2, 55, 63, 72.8, 82,
89, 100, 115 and 132 respectively which are greater than the deciles for the total
group.
The values of the deciles calculated for the variable Mathematical Creativity
for the urban secondary school students as given in Table 16. All the deciles for
urban school students are greater than that of the total group, except the decile
values D7, D8 and D9 which are less than that of the total group. But in the case of
rural school students, all the decile values are less than that of the total group, except
D7, D8 and D9 which are greater than that of the total group.

Analysis and Interpretation 137
The histogram and the frequency curve of the data on Mathematical
Creativity of secondary school students were drawn and presented as figure 4.
Figure 4. Histogram and frequency curve of the distribution of Mathematical
Creativity scores of secondary school students measured through Mathematical
Creativity Test. (N=700)
The histogram shows that the students with high score in Mathematical
Creativity are comparatively less than that with low score.
The values of skewness and kurtosis for Mathematical Creativity were
calculated. The details are given as table 17.

Analysis and Interpretation 138
Table 17
Skewness and Kurtosis of the distribution of Mathematical Creativity
Statistic Values SE
Skewness 0.604 0.092
Kurtosis 0.406 0.185
The skewness of the distribution was found to be 0.604. The value shows
that the distribution is slightly positively skewed. That is the number of students
who got higher score is comparatively less than the students who got lower scores in
Mathematical Creativity. The kurtosis value was found to be 0.406. The value
suggests a slightly leptokurtic curve. But both the values are less than 1.5 indicating
that the distribution is not remarkably deviating from symmetry and the distribution
is mesokurtic. Hence the distribution of scores for Mathematical Creativity is not
deviating from normality.
The highest score obtained for Mathematical Creativity in the sample is 201
but the mean score is 79.1 which is far below the highest score obtained. On the
basis of the mean score of Mathematical Creativity obtained for the total sample
with standard deviation, the deciles for the total group, the confidence interval and
histogram representation, it was found that Mathematical Creativity is not at a
satisfactory level among secondary school students of Kerala. Below average level
of Mathematical Creativity among secondary school students of Israel and Indonesia
was reported in the studies of Aizikovitsh-Udi (2014) and Isnani, Waluya, Rochmad
and Wardono (2020) respectively.

Analysis and Interpretation 139
Relationship between Mathematical Creativity and the select Psychological
Variables
For the purpose of analyzing the relationship between the variable
Mathematical Creativity and the select psychological variables of secondary school
students, Pearson’s Product Moment Coefficient of Correlation was used. The
coefficient of correlation was calculated for each predictor variable with
Mathematical Creativity and its components viz., Fluency, Flexibility and
Originality. Shared variance was also calculated in each case and the details are
presented in table 18.
Table 18
Pearson’s Product Moment Coefficient of Correlation and Shared Variance (r2
×100) for Mathematical Creativity and the Select Psychological Variables
Variable
Problem solving ability in Mathematics
Academic Stress
Mathematics Anxiety
Locus of
Control Optimism
Mathematical Creativity
.502**
(25.2)
-.173**
(2.99)
-.261**
(6.81)
-.281**
(7.89) .047
Fluency .489** (23.91)
-.165** (2.72)
-.258** (6.65)
-.284** (8.06)
.025
Flexibility .398**
(15.84)
-.151**
(2.28)
-.185**
(3.42)
-.209**
(4.36) .068
Originality .367**
(13.46)
-.125**
(1.56)
-.200**
(4)
-.190**
(3.61) .063

Analysis and Interpretation 140
Result and Discussion
From table 18 it can be seen that Pearson's coefficient of correlation for
Mathematical Creativity and Problem Solving Ability in Mathematics is .502. As
this value is greater than tabled value .101 for significance at .01 level (N = 700), the
relationship between the two variables are significant. The positive sign indicates a
positive relationship between the variables. The magnitude of ‘r’ shows that there
exists a substantial relationship between Problem Solving Ability in Mathematics
and Mathematical Creativity. The shared variance obtained is 25.2 and it shows that
Problem Solving Ability in Mathematics accounts for 25.2 percent of the variance in
Mathematical Creativity.
The analysis of correlation coefficient obtained for Problem Solving Ability
in Mathematics and Mathematical Creativity showed that the two variables are
substantially, positively related and the relationship is significant. The same result
was reported by Tyagi (2015) and Kavitha (2009) among secondary school students
of India, Moore-Russo and Demler (2018) among instructors and staff associated
with a gifted mathematics program in the United States, Torrance (1987) and
Ayllon, Gomez and Ballesta-Claver (2016).
When Mathematical Creativity and Academic Stress are considered, the ‘r’
value obtained is -.173, which is greater than tabled value .101 (N= 700), for
significance at .01 level. Hence Mathematical Creativity and Academic Stress are
significantly related, but the relationship is negative and very low. That is,
Mathematical Creativity decreases at a low rate when the Academic Stress increases.
Analysis and Interpretation 141
Academic Stress is accounted for 2.99 percent of the variance in Mathematical
Creativity.
That is Academic Stress and Mathematical Creativity are significantly
related, the relationship is low and negative. The meta-analysis of 76 experimental
studies conducted by Byron, Khazanchi and Nazarian (2010) supports the finding of
a negative relationship between Creativity and Stress.
From table 18, the coefficient of correlation for the variables Mathematical
Creativity and Mathematics Anxiety (N=700) is -.261. This value is greater than the
tabled value of ‘r’ (N = 700, α = .01) showing that the relationship between the two
variables is significant at .01 level. The negative sign indicates a negative
relationship, explained as for an increase in one variable there is a corresponding
decrease in the other variable. The magnitude of ‘r’ shows that the relationship is
low. That is, Mathematical Creativity and Mathematics Anxiety are significantly
negatively related but the extent of relationship is low. When shared variance is
considered (6.812), it can be inferred that the percentage of variance in
Mathematical Creativity explained by variance in Mathematics Anxiety is about 6.8
percent.
The study revealed that Mathematics Anxiety and Mathematical Creativity
are significantly related, the relationship is low and negative. This finding of the
study is in line with the findings of studies by Sharma (2014), Midhundas and
Vijayakumari (2016) and Johny (2008) among secondary school students of India.
Haylock (1987) in a study on three middle school students aged between 11 - 22
years of Norwich, also reported the same result. Fetterly (2010) also found a

Analysis and Interpretation 142
significant relationship between Mathematical Creativity and Mathematics Anxiety
and reported that an interposed, intentional experience to Mathematical Creativity, at
least in some cases lowers Mathematics Anxiety among pre service elementary
education teachers.
The coefficient of correlation obtained for Mathematical Creativity and
Locus of Control is -.281. As this value is greater than tabled value .101 for the
significance at .01 level (N=700), the two variables are negatively related. The ‘r’
value has a magnitude that indicates a slight low relationship between the variables.
Locus of Control accounts for 7.89 percent of the variance in Mathematical
Creativity.
Analysis of correlation coefficient obtained for Locus of Control (External)
and Mathematical Creativity showed that the relationship between the two variables
is significant and the relationship is negative and low. This finding is agreeable with
the finding of the study by Lather, Jain and Shukla (2014) among students of
University of Mysore.
Pearson’s coefficient of correlation ‘r’ for Mathematical Creativity and
Optimism is .047. This value is less than the table value .078 (N= 700) which shows
that the relationship between Mathematical Creativity and Optimism is not
significant at .05 level.
That is, Optimism and Mathematical Creativity are not significantly related.
This finding is concomitant with the finding of Sanchez, Brufau, Mendez, Corbalan
and Liminana (2010) in the study among Murcia university students from Spain.

Analysis and Interpretation 143
Midhundas and Vijayakumari (2015) found a significant positive and low
relationship between Optimism and Mathematical Creativity among secondary
school students.
From table 18 it can be seen that Pearson's coefficient of correlation for
Fluency and Problem Solving Ability in Mathematics is .489. As this value is
greater than tabled value .101 for significance at .01 level (N = 700), the two
variables are significantly related. The positive sign indicates a positive relationship
between the variables. The magnitude of ‘r’ shows that there exists a substantial
relationship between Problem Solving Ability in Mathematics and Fluency. When
shared variance is considered (23.91), it can be inferred that the percentage of
variance in Fluency explained by variance in Problem Solving Ability in
Mathematics is about 24 percent.
When Fluency and Academic Stress are considered, the ‘r’ value obtained is
-.165, which is greater than tabled value .101 (N= 700), for significance at .01 level.
That is, Fluency and Academic Stress are significantly related, but the relationship is
negative and very low. That is, Fluency decreases when the Academic Stress
increases but the rate of change is very low. When shared variance is considered
(2.722), it can be inferred that the percentage of variance in Fluency explained by
variance in Academic Stress is about 2.7 percent.
From table 18, the coefficient of correlation for the variables Fluency and
Mathematics Anxiety for the total sample (N=700) is -.258. This value is greater
than the tabled value of ‘r’ (N = 700, α = .01) showing that the relationship between
the two variables is significant at .01 level. The negative sign indicates a negative

Analysis and Interpretation 144
relationship, explained as for an increase in one variable there is a corresponding
decrease in the other variable. The magnitude of ‘r’ shows that the relationship is
low. That is, Fluency and Mathematics Anxiety are significantly negatively related
but the extent of relationship is low.
The coefficient of correlation obtained for Fluency and Locus of Control is
-.284. As this value is greater than tabled value .101 for the significance at .01 level
(N=700), the two variables are negatively related. The ‘r’ value has a magnitude that
indicates a slight low relationship between the variables. Locus of Control is
accounted for 8 percent of the variance in Fluency.
Pearson’s coefficient of correlation ‘r’ for Fluency and Optimism is .025.
This value is less than the table value .078, (N= 700) which shows that there is no
significant relationship between Optimism and Fluency at .05 level.
From table 18 it can be seen that Pearson's coefficient of correlation for
Flexibility and Problem Solving Ability in Mathematics is .398. As this value is
greater than tabled value .101 for significance at .01 level (N = 700), the two
variables are significantly related. The positive sign indicates a positive relationship
between the variables. The magnitude of ‘r’ shows that there exists a low
relationship between Flexibility and Problem Solving Ability in Mathematics. When
shared variance is considered (15.84), it can be inferred that the percentage of
variance in Flexibility explained by variance in Problem Solving Ability in
Mathematics is about 15.8 percent.
Analysis and Interpretation 145
When Flexibility and Academic Stress are considered, the ‘r’ value obtained
is -.151, which is greater than tabled value .101 (N= 700), for significance at .01
level. That is, Flexibility and Academic Stress are significantly related, but the
relationship is negative and very low. That is, Flexibility decreases by a small
amount when the Academic Stress increases. Academic Stress accounts for 2
percent of the variance in Flexibility.
The coefficient of correlation for the variables Flexibility and Mathematics
Anxiety for the total sample (N=700) is -.185. This value is greater than the tabled
value of ‘r’ (N = 700, α = .01) showing that the relationship between the two
variables is significant at .01 level. The negative sign indicates a negative
relationship, explained as for an increase in one variable there is a corresponding
decrease in the other variable. The magnitude of ‘r’ shows that the relationship is
very low. That is, Flexibility and Mathematics Anxiety are significantly negatively
related but the extent of relationship is low.
The coefficient of correlation obtained for Flexibility and Locus of Control is
-.209. As this value is greater than tabled value .101 for the significance at .01 level
(N=700), the two variables are negatively related. The ‘r’ value has a magnitude that
indicates a low relationship between the variables. The obtained shared variance is
4.368, that is 4 percent variance in Flexibility is explained by variance in Locus of
Control.
Pearson’s coefficient of correlation ‘r’ for Flexibility and Optimism is .068.
This value is less than the table value .078, (N= 700) which shows that there is no
significant relationship between Optimism and Flexibility at .05 level.

Analysis and Interpretation 146
From table 18 it can be seen that Pearson's coefficient of correlation for
Originality and Problem Solving Ability in Mathematics is .367. As this value is
greater than tabled value .101 for significance at .01 level (N = 700), the two
variables are significantly related. The positive sign indicates a positive relationship
between the variables. The magnitude of ‘r’ shows that there exists a low
relationship between Originality and Problem Solving Ability in Mathematics.
Problem Solving Ability in Mathematics accounts for 13 percent of the variance in
Originality.
When Originality and Academic Stress are considered, the ‘r’ value obtained
is -.125, which is greater than tabled value .101 (N= 700), for significance at .01
level. That is, Originality and Academic Stress are significantly related, but the
relationship is negative and very low. That is, Originality decreases at a low rate
when the Academic Stress increases. When shared variance is considered (1.562), it
can be inferred that the percentage of variance in Originality explained by variance
in Academic Stress is only 1.5 percent.
From table 18, the coefficient of correlation for the variables Originality and
Mathematics Anxiety for the total sample (N=700) is -.200. This value is greater
than the tabled value of ‘r’ (N = 700, α = .01) showing that the relationship between
the two variables is significant at .01 level. The negative sign indicates a negative
relationship, explained as for an increase in one variable there is a corresponding
decrease in the other variable. The magnitude of ‘r’ shows that the relationship is
low. That is, Originality and Mathematics Anxiety are significantly negatively
related but the extent of relationship is low.

Analysis and Interpretation 147
The coefficient of correlation obtained for Originality and Locus of Control
is -.190. As this value is greater than tabled value .101 for the significance at .01
level (N=700), the two variables are negatively related. The ‘r’ value has a
magnitude that indicates a very low relationship between the variables. The obtained
shared variance is 3.61, that is 3.6 percent variance in Originality is explained by
variance in Locus of Control.
Pearson’s coefficient of correlation ‘r’ for Originality and Optimism is .063.
This value is less than the table value .078, (N= 700) which shows that there is no
significant relationship between Originality and Optimism at .05 level.
Efficiency of the select Psychological Variables in Predicting Mathematical
Creativity
Multiple regression analysis was done to develop a model to predict values
of Mathematical Creativity from the select psychological variables. Basic input of
regression analysis is the correlation matrix. The correlation coefficients for the
select variables except Optimism with Mathematical Creativity were calculated and
the matrix is presented as table 15. The variable Optimism was excluded from the
set of predictor variables as the variable was found to have no significant correlation
with Mathematical Creativity even at .05 level.
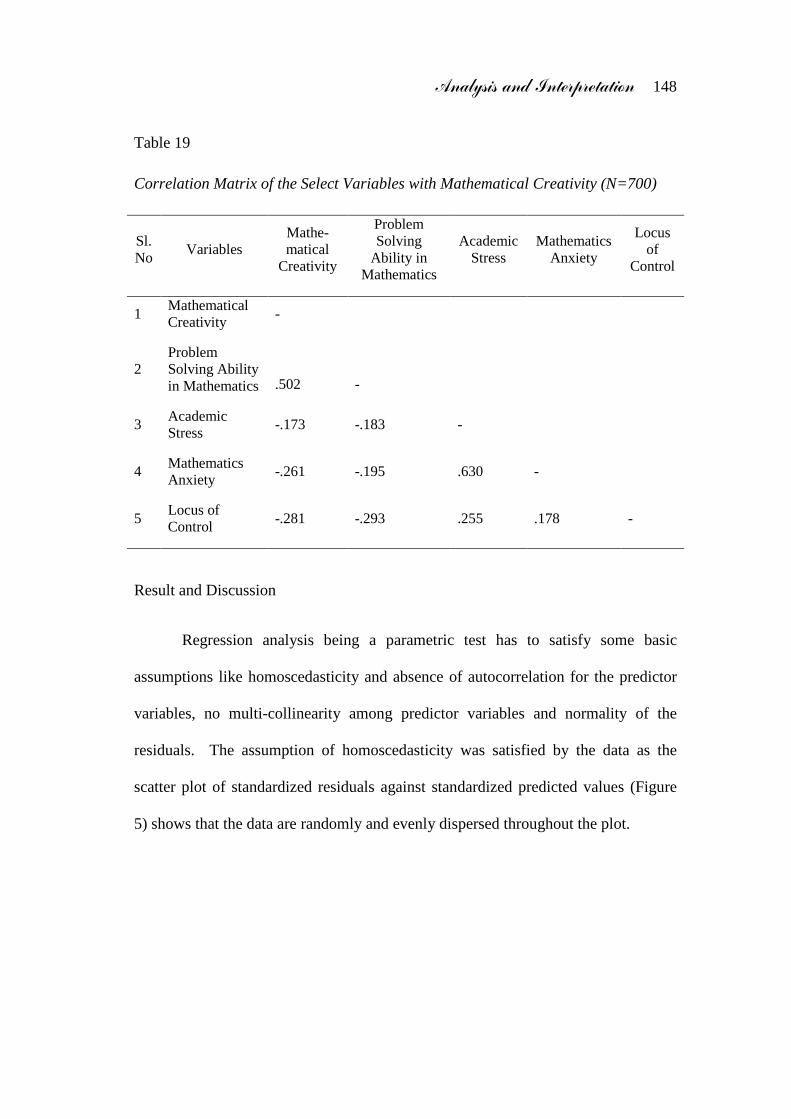
Analysis and Interpretation 148
Table 19
Correlation Matrix of the Select Variables with Mathematical Creativity (N=700)
Sl. No
Variables Mathe-matical
Creativity
Problem Solving
Ability in Mathematics
Academic Stress
Mathematics Anxiety
Locus of
Control
1 Mathematical Creativity
-
2 Problem Solving Ability in Mathematics
.502
-
3 Academic Stress
-.173 -.183 -
4 Mathematics Anxiety
-.261 -.195 .630 -
5 Locus of Control
-.281 -.293 .255 .178 -
Result and Discussion
Regression analysis being a parametric test has to satisfy some basic
assumptions like homoscedasticity and absence of autocorrelation for the predictor
variables, no multi-collinearity among predictor variables and normality of the
residuals. The assumption of homoscedasticity was satisfied by the data as the
scatter plot of standardized residuals against standardized predicted values (Figure
5) shows that the data are randomly and evenly dispersed throughout the plot.

Analysis and Interpretation 149
Figure 5. Scatter plot of ZResidual against ZPredicted (Mathematical Creativity).
Assumption of independence of data or absence of autocorrelation was tested
by calculating Durbin Watson statistic and the value is given in table 20.
Table 20
Statistics for Ensuring Absence of Autocorrelation
Autocorrelation DW Statistic p
.381 1.24 <.01
Durbin Watson test statistic near to 2 indicates that the autocorrelation in the
set of data can be neglected.
The assumption of multicollinearity was tested using Variance Inflation
Factors (VIF) and the values are given as table 21.

Analysis and Interpretation 150
Table 21
Variation Inflation factor of the predictor variables
VIF Tolerance
Problem solving ability 1.12 0.892
Mathematics Anxiety 1.68 0.596
Locus of control 1.15 0.872
Academic stress 1.72 0.581
The values of VIF for the variables are almost 1 and the tolerance values are
greater than .4. Hence there is low level of multicollinearity between the
independent variables or the correlation of each independent variable with other
independent variables is negligible. That is, multicollinearity of the predictor
variables is not remarkable and hence the assumption of multicollinearity is
satisfied.
The normality of the residuals was tested using Shapiro – Wilk test, the value
obtained is .991 (p≤ .01) which shows a deviation from normality. As the sample
size is large, even a small variation from normality will be marked as significant by
the test. A Q-Q plot was drawn to depict the distribution and is given as figure 6.

Analysis and Interpretation 151
Figure 6. Normal Q-Q Plot on the scores of Mathematical Creativity
The points lie on the line indicating the normality of the data but at the ends
of the line, points are deviating from the line which can be considered as outliers.
Also the sample size is large enough to assume normality.
Multiple regression analysis was done for Mathematical Creativity with the
predictors Problem Solving Ability in Mathematics, Academic Stress, Mathematics
Anxiety and Locus of Control. Optimism was excluded from the list as it was found
that Optimism is not significantly related to Mathematical Creativity.
The details of regression analysis are given as table 22 and 23.

Analysis and Interpretation 152
Table 22
Value of R, R 2 and Adjusted R 2 for Model 1
R R2 Adjusted R2
.544 .296 .292
Table 23
Details of Regression Coefficients
Predictor Regression Coefficients t p
Intercept 81.081 8.67 < .01
Problem solving ability in Mathematics 3.822 12.95 < .01
Academic stress 0.122 1.48 0.139
Mathematics Anxiety -0.458 -4.63 < .01
Locus of control -1.036 -3.95 < .01
In this model with the predictors Problem Solving Ability in Mathematics,
Academic Stress, Mathematics Anxiety and Locus of Control, the unstandardized
regression coefficient for the variable Academic Stress is found to be not
significantly different from zero as the t value obtained is less than 1.96. Hence
another model 2 was tried excluding the variable Academic Stress, the details of the
regression analysis with the predictors Problem Solving Ability in Mathematics,
Mathematics Anxiety and Locus of Control is given as table 24 and 25.

Analysis and Interpretation 153
Table 24
Values of R, R2 and Adjusted R2 of Model 2
Model R R² Adjusted R² Overall Model Test
F df1 df2 p
2 0.542 0.294 0.291 96.5 3 696 < .01
Table 25
Details of Regression Coefficients b, Beta and Structure Coefficient for Model 2
Predictor Regression Coefficients
t p Standardized Regression Coefficients
Structure Coefficient
Intercept 85.827 9.76 < .01
Problem Solving ability in Mathematics
3.808 12.90 < .01 0.435 .926
Mathematics Anxiety
-0.369 -4.70 < .01 -0.154 -.482
Locus of Control -0.969 -3.75 < .01 -0.126 -.518
Table 24 shows that the R2 value obtained for the model with Problem
Solving Ability in Mathematics, Mathematics Anxiety and Locus of Control as
predictors is .294. It means that 29.4 percent of variance in Mathematical Creativity
is explained by the regression model developed with variables Problem Solving
Ability in Mathematics, Mathematics Anxiety and Locus of Control. The F-value
obtained shows that this model is a good one (F= 96.5, p<.01) to predict
Mathematical Creativity. The value of the adjusted R2 is .291, the difference
between R2 and adjusted R2 being .003. It means that instead of a sample, if the

Analysis and Interpretation 154
model was derived from population, approximately 0.3% less variance will be in the
outcome variable. As this difference is negligible, the regression model is cross-
validated.
Table 25 gives t-values in each case which shows that the b-values obtained
differ significantly from zero. Hence the variables Problem Solving Ability in
Mathematics, Mathematics Anxiety and Locus of Control are significant predictors
of Mathematical Creativity.
With the values of b, the regression model can be expressed as
Y1 = 85.827+ 3.808 X1+ -0.369X2+ -0.969X3 where Y1 is the predicted value of
Mathematical Creativity, X1 score on Problem Solving Ability in Mathematics, X2
score on Mathematics Anxiety and X3 score on Locus of Control.
The standardized Beta values for the predictors were used to derive the
equation for predicting the standardized value of Mathematical Creativity.
The equation of the model is
Z1= .435 Z1+ -0.154Z2+ - 0. 126Z3
Where Z1 is the predicted standard score of Mathematical Creativity, Z1, Z2 and Z3
being the standard scores of Problem Solving Ability in Mathematics, Mathematics
Anxiety and Locus of Control respectively.
The degree to which each predictor variable affects the outcome variable
Mathematical Creativity provided the effects of all the other predictors are kept
constant as well as the relative predictor contribution to the total variance explained

Analysis and Interpretation 155
by the model by interpreting the regression coefficients and the structure coefficients
is attempted. The individual contribution of the predictor variables by calculating
proportional reduction in error (PRE) was also calculated and the results are
explained below.
Problem Solving Ability in Mathematics
The b- value obtained for Problem Solving Ability in Mathematics is 3.808
(Table 25) which indicates that when Problem Solving Ability in Mathematics
increases by one unit Mathematical Creativity increases by 3.808 units, when the
effects of Mathematics Anxiety and Locus of Control are kept constant.
A β value of 0.435 indicates that as Problem Solving Ability in Mathematics
increases by one standard deviation (4.05), Mathematical Creativity increases by
0.435 standard deviation, provided the effects of other two predictors are kept
constant. Thus for an increase of 4.05 in Problem Solving Ability in Mathematics,
an increase of 15.442 will be there in Mathematical Creativity score.
A structure coefficient (rs) of .923 for the variable Problem Solving Ability
in Mathematics gives a squared rs as .857indicating that .252 out of .294
(.857X.294), the variance in Mathematical Creativity explained by the model, is
accounted for by the variable Problem Solving Ability in Mathematics.
The residual sum of squares with Problem Solving Ability in Mathematics
and without the variable was calculated and is given as table 26 and table 27.

Analysis and Interpretation 156
Table 26
ANOVA details for the model with Problem solving ability in Mathematics
Sum of Squares df Mean Square F p
Problem Solving Ability in Mathematics
148715 1 148715 166.3 < .01
Mathematics Anxiety
19749 1 19749 22.1 < .01
Locus of Control 12583 1 12583 14.1 < .01
Residuals 622461 696 894
Table 27
ANOVA Details for the Model without Problem Solving Ability in Mathematics
Sum of Squares df Mean Square
F p
Mathematics Anxiety
40615 1 40615 36.7 < .01
Locus of Control 49994 1 49994 45.2 < .01
Residuals 771176 697 1106
The proportional reduction in error (PRE) for the variable Problem Solving
Ability in Mathematics is 19.28 which means that the effect size of the variable
Problem Solving Ability in Mathematics in predicting Mathematical Creativity is
19.28 or 19.28 percent of variance in Mathematical Creativity is the unique
contribution of Problem Solving Ability in Mathematics. The individual contribution
of Problem Solving Ability in Mathematics to the model is 21.84 % (.435X.502).
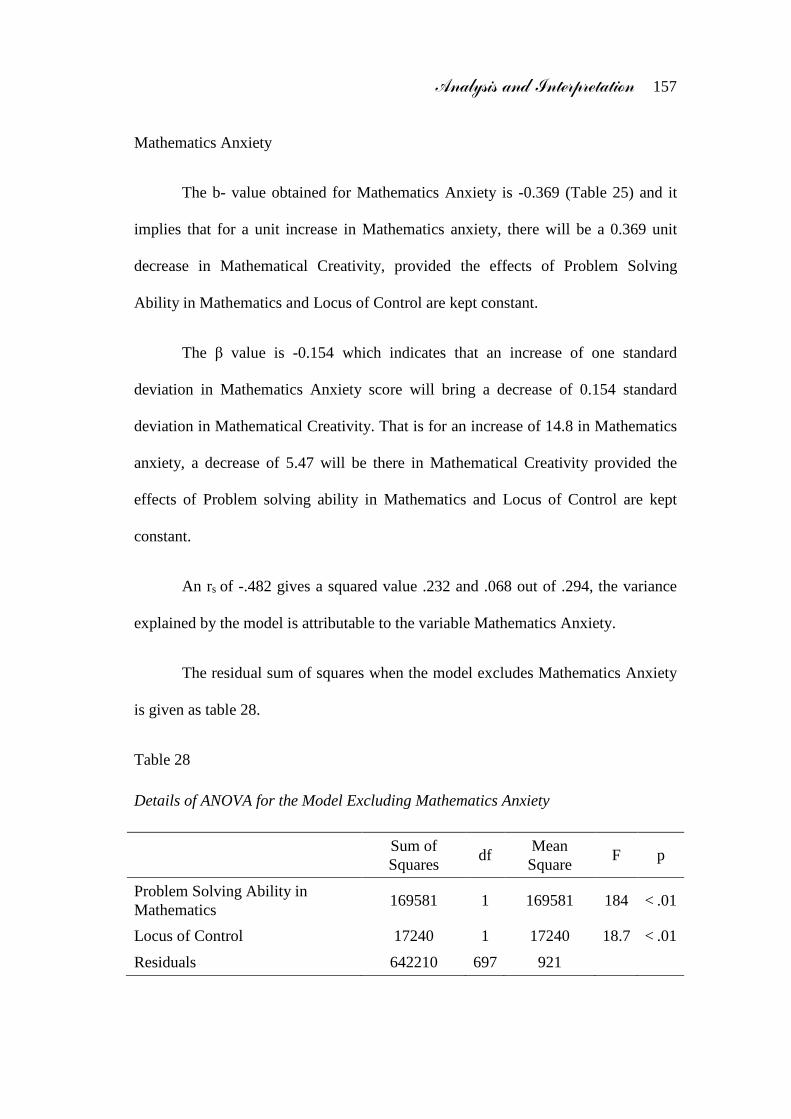
Analysis and Interpretation 157
Mathematics Anxiety
The b- value obtained for Mathematics Anxiety is -0.369 (Table 25) and it
implies that for a unit increase in Mathematics anxiety, there will be a 0.369 unit
decrease in Mathematical Creativity, provided the effects of Problem Solving
Ability in Mathematics and Locus of Control are kept constant.
The β value is -0.154 which indicates that an increase of one standard
deviation in Mathematics Anxiety score will bring a decrease of 0.154 standard
deviation in Mathematical Creativity. That is for an increase of 14.8 in Mathematics
anxiety, a decrease of 5.47 will be there in Mathematical Creativity provided the
effects of Problem solving ability in Mathematics and Locus of Control are kept
constant.
An rs of -.482 gives a squared value .232 and .068 out of .294, the variance
explained by the model is attributable to the variable Mathematics Anxiety.
The residual sum of squares when the model excludes Mathematics Anxiety
is given as table 28.
Table 28
Details of ANOVA for the Model Excluding Mathematics Anxiety
Sum of Squares
df Mean Square
F p
Problem Solving Ability in Mathematics
169581 1 169581 184 < .01
Locus of Control 17240 1 17240 18.7 < .01
Residuals 642210 697 921

Analysis and Interpretation 158
The PRE for the predictor variable Mathematics Anxiety is 3.07 which
shows that the percent of variance in Mathematical Creativity uniquely explained by
the predictor variable Mathematics Anxiety is 3.07. That is the effect size of
Mathematics Anxiety in predicting Mathematical Creativity is 3.07. The individual
contribution of Mathematics Anxiety to the model is only 4%.
Locus of Control
A value of -0.969 (Table 25) for b in the case of Locus of Control indicates
that for a unit increase in Locus of Control, there will be a decrease of 0.969 units in
Mathematical Creativity when the effects of other two predictors are kept constant.
The β value is -0.126 which means that for an increase of one standard
deviation in Locus of Control, there will be a decrease of 0.126 standard deviation in
Mathematical Creativity, the effects of other two predictors being kept constant.
That is for an increase of 4.62 in Locus of Control, Mathematical Creativity
decreases by 4.473.
The structure coefficient for the variable Locus of Control is -.518 and the
squared value is .268 indicating that 26.8% of the explained variance in
Mathematical Creativity by the model is accounted for by the variable Locus of
Control.
The residual sum of squares when the model excludes Locus of Control is
given as table 29.

Analysis and Interpretation 159
Table 29
Details of ANOVA for the Model Excluding Locus of Control
Sum of Squares
df Mean
Squares F P
Problem Solving Ability in Mathematics
186126 1 186126 204.3 <.01
Mathematics Anxiety 24406 1 24406 26.8 <.01
Residuals 635044 697 911
The PRE for the variable Locus of Control is 1.98 indicating that 1.98
percent of variance in Mathematical Creativity is the unique contribution of the
predictor variable Locus of Control. Also the effect size of Locus of Control as a
predictor of Mathematical Creativity is 1.98. The individual contribution of the
variable Locus of Control to the model is only 3.541%.
The beta weights, structure coefficient, individual contribution and PRE for
the predictor variables are consolidated in table 30.
Table 30
Standardized Regression Coefficients, Structure Coefficients, Individual
Contribution and Proportionate Reduction in Error of the predictor variables in
predicting Mathematical Creativity
Variable β rs Contribution (%) PRE
Problem Solving Ability in Mathematics 0.435 .926 21.84 19.28
Mathematics Anxiety -0.154 -.482 4 3.07
Locus of Control -0.126 -.518 3.541 1.98

Analysis and Interpretation 160
Table 30 reveals that based on all the three estimates of multiple regression
analysis, Problem Solving Ability in Mathematics is the powerful predictor of
Mathematical Creativity in the model. Based on β, individual contribution and PRE,
Mathematics Anxiety occupies the second position in the model for the efficiency of
predicting Mathematical Creativity, but the structure coefficient shows that Locus of
Control has a slight increase in contribution to the explained variance by the model
in predicting Mathematical Creativity. A change in the relative position may be due
to the relationship between the predictor variables, which are found to be not
remarkable through the test of multicollinearity.
Thus the variables in the order of effect size to predict Mathematical
Creativity in the model can be listed as Problem Solving Ability in Mathematics,
Mathematics Anxiety and Locus of Control. Sing (2000) has reported that anxiety
and test anxiety inhibit students' Mathematical Creativity, Thakur (2014) found
anxiety as not contributing to creativity of girls but is a facilitator for boys.
Conclusion
The extent of Mathematical Creativity among secondary school students is
not up to a satisfactory level, the mean score being 79.1 with standard deviation
35.5. The deciles also show that secondary school students are not having high level
of Mathematical Creativity measured through the test on Mathematical Creativity.
The mean score of Mathematical Creativity obtained for boys and girls are
80.9 and 77.5 with standard deviation 35.3 and 35.6. Mean score for boys are
slightly greater than the mean score of Mathematical Creativityfor the entire group.

Analysis and Interpretation 161
The deciles also show that secondary school boys and girls are not having high level
of Mathematical Creativity. The mean score of Mathematical Creativity obtained for
the government and aided secondary school students are 73.9 and 84.9 with standard
deviation 33.2 and 37.1.The mean score for aided school students is higher than that
of government school students and the total group. The deciles show that
government and aided secondary school students are not having high level of
Mathematical Creativity. The mean score of Mathematical Creativity obtained for
the urban and rural secondary school students are 81.1 and 76.8 with standard
deviations 30.7 and 40.4. Urban secondary school students have higher mean score
in Mathematical Creativity than rural students and the total sample.The deciles show
that urban and rural secondary school students are not having high level of
Mathematical Creativity.
Problem Solving Ability in Mathematics, Academic Stress, Mathematics
Anxiety and Locus of Control (external) are found to be significantly related to
Mathematical Creativity, among which the correlation between Problem Solving
Ability in Mathematics and Mathematical Creativity is positive and moderate, but all
other correlations are negative and low. Optimism is found to be not significantly
related to Mathematical Creativity.
Among the components of Mathematical Creativity- Fluency, Flexibility and
Originality are significantly related to Problem Solving Ability in Mathematics,
Academic Stress, Mathematics Anxiety and Locus of Control (external). Optimism
is found to be not significantly related to Fluency, Flexibility and Originality. The
correlation between Fluency and Problem Solving Ability in Mathematics is positive
Analysis and Interpretation 162
and substantial but the correlation with Academic Stress, Mathematics Anxiety and
Locus of Control (external) are negative and low. Correlations of Flexibility and
Originality with Problem Solving Ability in Mathematics are positive, but all other
correlations are negative and low.
The model defined by the predictor variables Problem Solving Ability in
Mathematics, Mathematics Anxiety and Locus of Control ( External) is a significant
one with R2 .294 and Problem Solving Ability in Mathematics is the most powerful
predictor of Mathematical Creativity among the variables in the model. Individual
contribution of the predictor variables in predicting Mathematical Creativity are
Problem Solving Ability in Mathematics (21.84)
Mathematics Anxiety (4)
Locus of Control (3.54)

Chapter 5
SUMMARY, CONCLUSION AND
SUGGESTIONS
❖ Study in Retrospect
❖ Major Findings of the Study
❖ Tenability of Hypotheses
❖ Conclusions
❖ Educational Implications
❖ Suggestions for Further Research

This chapter gives a bird’s-eye view of the study under the headings Study in
Retrospect, Major Findings of the Study, Tenability of Hypotheses, Conclusion,
Educational Implications and Suggestions for Further Research in the area.
Study in Retrospect
The various aspects at different stages of the present investigation like the
Title, Variables, Research questions, Objectives, Hypotheses, Methodology used are
viewed retrospectively.
Restatement of the Problem
The study focused on finding the efficiency of some select psychological
variables to predict Mathematical Creativity of secondary school students of Kerala.
Thus the study was entitled as “CERTAIN PSYCHOLOGICAL VARIABLES
PREDICTING MATHEMATICAL CREATIVITY AMONG SECONDARY
SCHOOL STUDENTS”.
Variables Selected for the Study
As the study was to find out the efficiency of the select psychological
variables to predict Mathematical Creativity among secondary school students, the
outcome variable was Mathematical Creativity and the select psychological

Summary, Conclusion and Suggestions 164
variables viz., Problem Solving Ability in Mathematics, Mathematics Anxiety,
Academic Stress, Locus of Control and Optimism were the predictor variables.
Objectives of the Study
The following are the objectives of the study. To find out the extent of
Mathematical Creativity among secondary school students of Kerala.
i. To find out whether the select psychological variables are significantly
related to Mathematical Creativity of secondary school students.
ii. To develop a regression equation for predicting Mathematical Creativity
among secondary school students with the select psychological variables.
iii. To find out the relative efficiency of the select psychological variables in
predicting Mathematical Creativity of secondary school students.
Hypotheses of the Study
The hypotheses of the study are the following.
i. There exists significant relationship between Problem Solving Ability in
Mathematics and Mathematical Creativity of secondary school students.
ii. There exists significant relationship between Mathematics Anxiety and
Mathematical Creativity of secondary school students.
iii. There exists significant relationship between Academic Stress and
Mathematical Creativity of secondary school students.

Summary, Conclusion and Suggestions 165
iv. There exists significant relationship between Locus of Control and
Mathematical Creativity of secondary school students.
v. There exists significant relationship between Optimism and Mathematical
Creativity of secondary school students.
vi. The select psychological variables significantly predict Mathematical
Creativity among secondary school students.
Methodology
Participants of the Study
The study was conducted on a sample of 700 Secondary School Students
selected from Kozhikode, Wayanad, Kasargod, Palakkad, and Kollam Districts of
Kerala. Due weightage was given to the relevant subgroups of the population such
as Gender, Type of Management and Locale of the school. Stratified sampling
technique was used for the selection of the sample.
Instruments Used for the Study
The instruments used for collecting data from the sample are
Mathematical Creativity Test (Vijayakumari & Midhundas, 2017)
Test of Problem Solving Ability in Mathematics (Sumangala & Rinsa, 2008)
Mathematics Anxiety Scale (Sumangala & Malini, 1993)
Scale on Academic Stress (Vijayakumari, Sajmadas & Midhundas, 2015)
Locus of Control Scale (Kunhikrishnan & Mathew, 1987)
Optimism Inventory (Vijayakumari & Midhundas, 2016)

Summary, Conclusion and Suggestions 166
Statistical Techniques Used
The Statistical techniques used are
Preliminary Analysis
Descriptive statistical measures such as mean, standard deviation, deciles,
skewness and kurtosis of the scores on dependent variable were calculated for the
total sample and subsamples based on the gender, locality of the school and type of
management of school. 99 percent Confidence Interval for Mean of Mathematical
Creativity was also calculated.
Pearson’s Product Moment Coefficient of Correlation
Pearson’s Product Moment Coefficient of Correlation ‘r’ was used to
estimate the extent of relation between the select Psychological Variables and
Mathematical Creativity. The correlation coefficient was also calculated for the three
components of Mathematical Creativity viz., Fluency, Flexibility and Originality to
find the relationship with the select psychological variables. Shared variance was
also calculated for each predictor variable.
Multiple Regression Analysis
Multiple regression analysis was used for predicting individual and joint
effect of the select psychological variables in predicting Mathematical Creativity.

Summary, Conclusion and Suggestions 167
Major Findings of the Study
❖ The extent of Mathematical Creativity among secondary school students is
low [Table 15 & 16, Mean = 79.1, SD = 35.5 CI.99 = (75.63, 82.56), P50 =
76]
❖ Mathematical Creativity among boys and girls are found to be not at
satisfactory level. But boys are found to have a higher mean score in
Mathematical Creativity than girls.
[Table 15 & 16, Boys; Mean = 80.9, SD = 35.3, CI.99 = (75.91, 85.89), P50 =
80; Girls; Mean = 77.5, SD = 35.6, CI.99 = (72.72, 82.28), P50 = 75]
❖ Mathematical Creativity among Government and Aided secondary school
students are found to be not satisfactory. Aided school students are found to
have a higher mean score in Mathematical Creativity than Government
school students.
[Table 15 & 16, Government; Mean = 73.9, SD = 33.2, CI.99 = (69.48,
78.31), P50 = 73; Aided; Mean = 84.9, SD = 37.1, CI.99 = (79.65, 90.14), P50
= 82]
❖ Mathematical Creativity among Urban and Rural secondary school students
are not at a satisfactory level. A higher mean score is found for Urban school
students compared to that of Rural school students.
[Table 15 & 16, Urban; Mean = 81.1, SD = 30.7, CI.99 = (77.03, 85.16), P50 =
79; Rural; Mean = 76.8, SD = 40.4, CI.99 = (70.98, 82.61), P50 = 74]

Summary, Conclusion and Suggestions 168
❖ There exists significant, positive and substantial relationship between
Problem Solving Ability in Mathematics and Mathematical Creativity of
secondary school students of Kerala (Table 18, r = .502, p≤.01).
❖ A significant, negative but very low relationship was found between
Academic Stress and Mathematical Creativity of secondary school students
of Kerala (Table 18, r = -.173, p≤.01).
❖ There exists significant, negative but low relationship between Mathematics
Anxiety and Mathematical Creativity of secondary school students of Kerala
(Table 18, r = -.261, p≤.01).
❖ There exists a significant, negative low relationship between Locus of
Control and Mathematical Creativity of secondary school students of Kerala
(Table 18, r = -.281, p≤.01).
❖ The relationship between Optimism and Mathematical Creativity is not
significant at .05 level (Table 18, r = .047, p>.05).
❖ Problem Solving Ability in Mathematics is significantly related to Fluency
and the relationship is positive and substantial (Table 18, r = .489, p≤.01).
❖ A significant negative and very low relationship is found between Academic
Stress and Fluency of secondary school students of Kerala (Table 18, r = -
.165, p≤.01).

Summary, Conclusion and Suggestions 169
❖ There exists significant, negative but low relationship between Mathematics
Anxiety and Fluency of secondary school students of Kerala (Table 18, r = -
.258, p≤.01).
❖ There exists a significant, negative and low relationship between Locus of
Control and Fluency of secondary school students of Kerala (Table 18, r =-
.284, p≤.01).
❖ The relationship between Optimism and Fluency is not significant at .05
level (Table 18, r = .025, p>.05).
❖ Problem Solving Ability in Mathematics is significantly related to Flexibility
and the relationship is positive and low (Table 18, r = .398, p≤.01).
❖ A significant negative and very low relationship is found between Academic
Stress and Flexibility of secondary school students of Kerala (Table 18,
r = -.151, p≤.01).
❖ There exists significant, negative but very low relationship between
Mathematics Anxiety and Flexibility of secondary school students of Kerala
(Table 18, r = -.185, p≤.01)
❖ There exists a significant negative low relationship between Locus of
Control and Flexibility of secondary school students of Kerala (Table 18,
r = -.209, p≤.01)
❖ The relationship between Optimism and Flexibility is not significant at .05
level (Table 18, r = .068, p>.05).

Summary, Conclusion and Suggestions 170
❖ There exists a significant, positive and low relationship between Problem
Solving Ability in Mathematics and Originality of secondary school students
of Kerala (Table 18, r = .367, p≤.01).
❖ A significant, negative and very low relationship is seen between Academic
Stress and Originality of secondary school students of Kerala (Table 18, r = -
.125, p≤.01).
❖ There exists significant, negative but low relationship between Mathematics
Anxiety and Originality of secondary school students of Kerala (Table 18, r
= -.200,p≤.01)
❖ There exists a significant, negative, very low relationship between Locus of
Control and Originality of secondary school students of Kerala (Table 18, r =
-.190)
❖ The relationship between Optimism and Originality is not significant at .05
level (Table 18, r = .097, p>.05).
❖ The prediction equation for Mathematical Creativity is
Y1 = 85.827+ 3.808 X1+ -0.369X2+ -0.969X3 (Unstandardized) or
Z1= .435 Z1+ -0.154Z2+ - 0. 126Z3 (Standardized)
The model is good at predicting Mathematical Creativity among secondary
school students (Table 24, F =96.5, p≤.01).
❖ 29.4 percent of variation in Mathematical Creativity is predicted by the
model with the predictor variables, Problem Solving Ability in Mathematics,

Summary, Conclusion and Suggestions 171
Mathematics Anxiety and Locus of Control (external) (Table 24, R=.542,
R2= .294).
❖ When Problem Solving Ability in Mathematics increases by one unit
Mathematical Creativity increases by 3.808 units, when the effects of
Mathematics Anxiety and Locus of Control are kept constant. (Table 25,
b=3.808).
❖ When Mathematics Anxiety increases by one unit 0.369 unit decrease in
Mathematical Creativity, provided the effects of Problem Solving Ability in
Mathematics and Locus of Control are kept constant. (Table 25, b= -.369).
❖ For a unit increase in Locus of Control, there will be a decrease of 0.969
units in Mathematical Creativity, when the effects of other two predictors are
kept constant. (Table 25, b= -.969).
❖ The effect size of the predictor variables, Problem Solving Ability in
Mathematics, Mathematics Anxiety and Locus of Control(external) in
predicting Mathematical Creativity are 19.28, 3.07 and 1.98 respectively
(Table 30).
❖ Academic Stress is not a significant predictor of Mathematical Creativity
among secondary school students (Table 23, b= 0.122, t= 1.48, p> .05).
❖ The Variables in the order of individual contribution in predicting
Mathematical Creativity among secondary school students are Problem
solving ability in Mathematics (21.84), Mathematics Anxiety (4) and Locus
of Control External (3.541). (Table 30).

Summary, Conclusion and Suggestions 172
Tenability of Hypotheses
The tenability of hypotheses was examined on the basis of analysis and its
findings.
1. The first hypothesis states that ‘There exists significant relationship
between Problem Solving Ability in Mathematics and Mathematical
Creativity of secondary school students’.
The study found that there exists a significant positive and substantial
relationship between Problem Solving Ability in Mathematics and Mathematical
Creativity of secondary school students. Hence the first hypothesis is substantiated.
2. The second hypothesis is ‘There exists significant relationship between
Academic Stress and Mathematical Creativity of secondary school
students’.
The study shows that a significant, negative but very low relationship exists
between Academic Stress and Mathematical Creativity of secondary school students.
Hence the second hypothesis is substantiated
3. The third hypothesis states that ‘There exists significant relationship
between Mathematics Anxiety and Mathematical Creativity of
secondary school students’.
It was found that there exists significant, negative but low relationship
between Mathematics Anxiety and Mathematical Creativity of secondary school
students. Hence the third hypothesis is substantiated

Summary, Conclusion and Suggestions 173
4. The fourth hypothesis is ‘There exists significant relationship between
Locus of Control and Mathematical Creativity of secondary school
students’.
The study found that there exists a significant negative very low relationship
between Locus of Control and Mathematical Creativity of secondary school
students. Hence the fourth hypothesis is substantiated
5. The fifth hypothesis states that ‘There exists significant relationship
between Optimism and Mathematical Creativity of secondary school
students’.
It was found that there is no significant relationship between Optimism and
Mathematical Creativity. This finding does not substantiate the hypothesis and hence
the fifth hypothesis is not substantiated.
6. The sixth hypothesis is ‘The select psychological variables significantly
predict Mathematical Creativity among secondary school students’.
The study revealed that Problem Solving Ability in Mathematics,
Mathematics Anxiety and Locus of Control are significant predictors of
Mathematical Creativity among secondary school students.. But Academic Stress
and Optimism are found to be not significantly contributing to predict Mathematical
Creativity. Hence the sixth hypothesis is not completely substantiated.

Summary, Conclusion and Suggestions 174
Conclusion
The present study was to find out the efficiency of certain psychological
variables in predicting Mathematical Creativity among secondary school students.
Analysis of data revealed that the secondary school students of Kerala are not up to a
satisfactory level in Mathematical Creativity. Problem solving ability in
Mathematics is found to have a substantial positive relationship with Mathematical
Creativity and its component, Fluency but the relationship is low with Flexibility
and Originality.
Academic Stress is found to have a negative very low relationship with
Mathematical Creativity and its components fluency, flexibility and originality. In
the case of Mathematics Anxiety, the relationship with Mathematical Creativity and
its components fluency and originality are negative and low but the relationship is
negative but very low with flexibility. The relationship of External Locus of Control
with Mathematical Creativity and its components fluency and flexibility are negative
and low but the relationship is negative and very low with originality. Optimism is
found to have no significant relation with Mathematical Creativity or its
components. The regression model with Problem Solving Ability in Mathematics,
Mathematics Anxiety and Locus of Control (External) was found to be good for
predicting Mathematical Creativity of secondary school students. Problem Solving
Ability in Mathematics, Mathematics Anxiety and Locus of Control are found to be
significant predictors of Mathematical Creativity. But only 29.4 percent of variance
in Mathematical Creativity was accounted for with the model and 70.6 percent of the
variance is explained by variables other than the select ones.

Summary, Conclusion and Suggestions 175
Educational Implications
Present study has implications in various dimensions for students, teachers,
parents, educational administrators and curriculum developers. It is essential that
students have a high level of mathematical creativity so that they can think like a
mathematician and become experts in the field.
The study found that secondary school students of Kerala are not up to a
satisfactory level of Mathematical Creativity. Mathematics teachers have to reflect
on the classroom environment. The classroom environment must encourage
divergent thinking among students. Problem Solving Ability in mathematics is
moderately related to Mathematical Creativity and the relationship is positive. Hence
problem based approach in which more life related, unstructured problems are used
for teaching- learning process may be adopted in teaching Mathematics. This will
increase the ability to solve problems among students and foster Fluency, Flexibility
and Originality in dealing with mathematical concepts and principles. Teachers must
be given enough freedom to adopt different methods and strategies and they are
expected to be resourceful for being flexible in their approach. The practice of over
emphasizing the textbook and the exercise problems should be discouraged. The
assessment practices also have to be changed to make the learning more original,
flexible and creative. Structuring questions and posing problems based on the
content discussed in the class and experimenting with various methods to arrive at a
solution can be recommended for assessment, instead of asking students to
reproduce the answers taught in the class.

Summary, Conclusion and Suggestions 176
Though the extent of relationship is very low, Academic stress is found to be
negatively related to mathematical creativity of secondary school students. The
overcrowded curriculum for secondary education will make the learning
monotonous and students may feel stress in completing academic activities. This
will negatively affect the creative approach to teaching and learning mathematics
and reduce the mathematical creativity of students. It is recommended to reduce the
curriculum at secondary level and include more activities related to mathematics so
that students will enjoy learning mathematics. The approaches of teaching and
assessment followed in the education system create anxiety among students and
anxiety in mathematics is found to be a negative contributor to mathematical
creativity. Together with more transparent, sound assessment practices, regular,
effective guidance and counseling must be a part of the education system. The
phobia in learning mathematics should be minimized through arranging interesting,
motivating classroom activity, proper counseling and sympathetic approach of
teachers and parents.
An average or a below average teacher will completely demolish the spark of
creative thinking among students. Only creative and talented teachers can kindle the
minds of learners with originality in thinking. The youth who are creative and
talented have to be attracted to the field of mathematics education.
Students have to adopt better learning styles which encourage the use of
divergent thinking instead of cramming the formulae and method of arriving at
solutions. Group discussions and activities are to be done in order to share novel
ideas and methods to arrive at solutions.

Summary, Conclusion and Suggestions 177
External locus of control was found to be a factor that hinder mathematical
creativity. That is, how the student perceives the causes of his academic success or
failure has a role, though minor one, on mathematical creativity. Parents should
know the belief of their wards on the factors that influence their success or failure,
whether external factors that are beyond their control or their hard work and the
efforts they invest in education. The habit of attributing success or failure to factors
beyond their control must be discouraged by parents. Children must be encouraged
to take up the responsibility for their success or failure. Cognitive Behavior Therapy
can be used to change the external locus of control to internal locus of control.
Parents and teachers must appreciate student abilities and support the learners in
setting goals and their successful achievement.
Teachers, curriculum developers and parents must take initiatives to improve
the level of mathematical creativity among students, an essential element for which
is ensuring mastery of the essential knowledge in mathematics. Bridge courses at
different levels of education will help in this regard and self learning must be
promoted among learners.
Teachers can predict the mathematical creativity of students using the scores
on problem solving ability, mathematics anxiety and external locus of control. Based
on the level of creativity, teachers can individualize instruction.
Suggestions for Further Research
At each stage of the study, the researcher has admitted certain delimitations
as well as limitations. It is difficult, if not impossible, to conduct such a study

Summary, Conclusion and Suggestions 178
perfectly. Experience of conducting this study made the investigator put forward
some suggestions for further research.
● The study can be replicated on other groups of students of different levels
like primary, upper primary, higher secondary and higher education
including more variables like Self- confidence and Intelligence, related to
Mathematical Creativity.
● Studies of similar nature can be conducted in other subjects like science.
● The study can be replicated by adopting problem based approach to
Mathematical Creativity.
● Development and validation of instructional or learning packages for
fostering Mathematical Creativity can be done.
● Study can be conducted on development of ICT integrated mathematical
modules to foster Mathematical Creativity among secondary school students.
● Theoretical models for predicting Mathematical or Scientific Creativity can
be developed by incorporating better predictors and moderator variables.

REFERENCES

Abbasi, M., Samadzadeh, M., & Shahbazzadegan, B. (2013). Study of mathematics
anxiety in high school students and its relationship with self-esteem and
teachers’ personality characteristics. Procedia-Social and Behavioral
Sciences, 83(4), 672-677.
Act, R.T.E. (2009). The right of children to free and compulsory education act. The
Gazette of India. Ministry of Law and Justice, Government of India, New
Delhi.
Adey, P. (1999). The Science of Thinking, and Science for Thinking: A Description
of Cognitive Acceleration through Science Education (CASE). Innodata
Monographs 2. Retrieved from https://eric.ed.gov/?id=ED442622.
Aizikovitsh-Udi, E. (2014). The extent of mathematical creativity and Aesthetics in
solving problems among students attending the mathematically talented
youth program. Creative Education, 2014.
Akgul, S., & Kahveci, N. G. (2017). Developing a model to explain the
Mathematical Creativity of Gifted Students. European Journal of Education
Studies, 3(8), 125-147.
Akinsola, M. K. (2008). Relationship of some psychological variables in predicting
problem solving ability of in-service mathematics teachers. The Mathematics
Enthusiast, 5(1), 79-100.

References 180
Al Mutawah, M. A. (2015). The Influence of Mathematics Anxiety in Middle and
High School Students Math Achievement. International Education Studies,
8(11), 239-252.
Alam, M. (2009). Academic achievement in relation to creativity and achievement
motivation a correlational study. Edutracks, 8(3), 31-35.
Anderson, L. W., & Krathwohl, D. R. (2001). Bloom’s Taxonomy Revised.
Understanding the New Version of Bloom’s Taxonomy. Retrieved from
www.thesecondprinciple.com/teaching-essentials/beyond-bloom-cognitive.
Angelova, N. V. (2016). Locus of control and its relationship with some social-
demographic factors. Psychological Thought, 9(2), 248-258.
Anjali, S. (2013). Role of play schools with regard to the behavioral profile,
creativity, problem solving ability and social cognition of pre-schoolers.
(Doctoral Thesis). M. G. University, Kerala.
Anwar, M. N., Shamim-ur-Rasool, S., & Haq, R. (2012). A comparison of creative
thinking abilities of high and low achievers secondary school students.
International Interdisciplinary Journal of Education, 1(217), 1-10.
Archana, A.K. (2006). Interaction effect of Academic Anxiety. Achievement
motivation and sex on performance in Biology of secondary school pupils of
Kerala. (Unpublished Master’s Thesis). University of Calicut, Kerala.
Arieti, S. (1976). Creativity: The magical synthesis. New York: Basic Books.

References 181
Ashalatha, M. (1990). Problem solving ability in biology of high average and low
creative secondary school pupils. (Unpublished Master’s Thesis). University
of Calicut, Kerala.
Asharani, K. & Anu Francis (2015).Effect of Vedic Mathematics on speed and
Accuracy in Problem Solving Ability in Mathematics among Upper Primary
Secondary Level. Journal of research and Extension in Education.10(1),8-
16.
Ashcraft, M. H., & Kirk, E. P. (2001). The relationships among working memory,
math anxiety, and performance. Journal of experimental psychology:
General, 130(2), 224.
Aspinwall, L., & Taylor, S. (1992). Modeling cognitive adaptation: A longitudinal
investigation of the impact of individual differences and coping on college
adjustment and performance. Journal of Personality and Social Psychology,
63(6), 989-1003.
Ausubel, D. P. (1963). The psychology of meaningful verbal learning- An
introduction to school learning. New York: Printice Hall.
Ayllon, M. F., Gomez, I. A., & Ballesta-Claver, J. (2016). Mathematical Thinking
and Creativity through Mathematical Problem Posing and Solving. Journal
of Educational Psychology-Propósitosy Representaciones, 4(1), 195-218.
Badrinath, S., & Sathyanaryanana, S. B. (1979). Correlates of creative thinking of
high school students. Creativity News Letters, 7, 16-23.

References 182
Bahar, A. K., & Maker, C. J. (2011). Exploring the relationship between
mathematical creativity and mathematical achievement. Asia-Pacific Journal
of Gifted and Talented Education, 3(1), 33-48.
Banerjee, D. (2003). Self concept and cognitive style creative and non creative
students in Calcutta University. (Doctoral Thesis). University of Calcutta,
West Bengal.
Banerjee, R. (2012). Innovations and initiatives in mathematics education in India.
In R. Ramanujam and K. Subramaniam (Eds.) Mathematics education in
India: Status and outlook. HBCSE: TIFR, Mumbai, India.
Baran, G., Erdogan, S., & Cakmak, A. (2011). A study on the relationship between
six-year-old children’s creative and mathematical ability. International
Education Studies, 4(1), 105-111.
Barron, F. (1965). The creative process and the psychedelic experience,
Explorations Magazine, 4(2), 48-51.
Bartwal, R. S., & Raj, A. (2014.) Academic stress among school going adolescents
in relation to their Social intelligence. Indian Streams Research Journal, 4,1-
6. Retrieved from http://www.srjis.com/pages/pdfFiles/151281255326.%
20Kamal%20Upreti.pdf
Barwal, S. K., & Sharma, P. (2013). Academic Achievement of High School
Students in relation to their Mathematics Anxiety. Researchers organization
Bilaspur, 47.
References 183
Betty, P. J. (2013). Mathematical creativity and ability for fundamental
mathematical operations of primary school students with dyscalculia.
(Unpublished Doctoral Thesis). M. G. University, Kerala.
Bharathi, S. (2017). Influence of Self concept Locus of control and Maths Anxiety on
the computation Ability of Mathematics students at secondary level.
(Unpublished Doctoral Thesis). Alagappa University, Tamilnadu.
Bhogayata, C. K. (1998). A study on the relationship among creativity, self-concept
& locus of control, Edutrack, 7, 25-26.
BSK, S. C., Senthilkumar, R., & Sivapragasam (2016). A study on problem solving
ability in mathematics of IX standard students in Dindigul district.
International Journal of Applied Research, 2(1), 797-799.
Byron, K., Khazanchi, S., & Nazarian, D. (2010). The relationship between stressors
and creativity: a meta-analysis examining competing theoretical models.
Journal of Applied Psychology, 95(1), 201.
Cates, G. L., & Rhymer, K. N. (2003). Examining the Relationship Between
Mathematics Anxiety and Mathematics Perfomance: An Instructional
Heirarchy Perspective. Journal of Behavioural Education. 12(1), 23-24.
Chamberlin, S. A., & Moon, S. M. (2005). Model-eliciting activities as a tool to
develop and identify creatively gifted mathematicians. Journal of Secondary
Gifted Education, 17(1), 37-47.

References 184
Chan, D. W. (2007). Creative teaching in Hong Kong schools: Constraints and
challenges. Educational Research Journal, 22(1), 1-12.
Chandini, K. S. (1989). Efficiency of some social familial variables in predicting
creativity (Unpublished M.Ed.Dissertation). University of Calicut. Kerala.
Ciftci, S. K. (2019). The effect of mathematics teacher candidate’s locus of control
on Math Anxiety: Structural Equation Modeling. European Journal of
Education Studies. 5(10). 148-161.
Cropley, A. J. (1992). More ways than one: Fostering creativity. New Jersey: Ablex
Publishing Corporation.
Cropley, A. J. (2005). Problem-solving and creativity: Implications for classroom
assessment. Leicester, UK: British Psychological Society.
Cropley, D. H., Le, D. H., & Gleaves, D. H. (2015). Examining the relationship
between mental health, creative thought, and optimism. The International
Journal of Creativity and Problem Solving, 25(1), 5-21.
Csikszentmihalyi, M. (2000). Implications of a systems perspective for the study of
creativity. In R. J. Sternberg (Ed.). Handbook of Creativity, 313-338.
Cambridge: Cambridge University Press.
Dahiya, S. S. (1995). Effect of mastery learning strategy on pupil achievement in
mathematics and their creative abilities. (Unpublished Doctoral Thesis) M.
S. University, Baroda.

References 185
Daker, R. J., Cortes, R. A., Lyons, I. M., & Green, A. E. (2020). Creativity anxiety:
Evidence for anxiety that is specific to creative thinking, from STEM to the
arts. Journal of Experimental Psychology: General, 149(1), 42.
Dhadhich, A. (2016).A study of Problem Solving Ability of IX STD Students.
Journal of Educational & Psychological Research. 6(1), 82-84.
Enger, J. M., Howerton, D. L., & Cobbs, C. R. (1994). Internal/external locus of
control, self-esteem, and parental verbal interaction of at-risk black male
adolescents. The Journal of Social Psychology, 134(3), 269-274.
Ervynck, G. (1991). Mathematical creativity: Advanced mathematical thinking, New
York: Khuwer Academic publishers.
Fadlelmula, F. K. (2010). Mathematical problem solving and self-regulated
learning. International Journal of Learning, 17(3).
Fetterly, J. M. (2010). Exploratory Study of the Use of a Problem-Posing Approach
on Pre-Service Elementary Education Teachers' Mathematical Creativity,
Beliefs, and Anxiety. (Unpublished Doctoral Thesis). Florida State
University.
Finke, R. (1992). Creative imagery, discoveries and inventions in visualization. New
York: Psychology press.
Fisher, R. (2004). What is creativity?. In R. Fisher & M. Williams (Eds.). Unlocking
creativity: Teaching across the curriculum. London: David Fulton Publishers.

References 186
Franken, R. E. (1998). Human motivation. Pacific Grove, California: Brooks/Cole
Publishing Company.
Freud, S. (1976). Creative writers and day dreaming. In A. Rothenberg & C. R.
Lauman (Eds.), The creativity question (pp.48-54). USA: Duke University
Press.
Gabora, L. (1997). The origin and evolution of culture and creativity: Evolutionary
models of information transmission. Journal of Mathematics, 1(1), 54-59.
Galton, F. (1870). Hereditary genius: An inquiry into its laws and consequences.
New York: Appleton & Co.
Gangadharrao, K.M., & Marathwada, B. A. (2012). Scientific Creativity of
Secondary Level Students: A Study. Research Expo International
Multidisciplinary Research Journal, 2(2), 70-75.
George, T. (1994). A study of the mathematical creativity of secondary school
Students in relation to their intelligence and maths achievement.
(Unpublished M. Phil Thesis). Kerala University, Kerala.
Ghanbari, A., Talb, M.G., Karimzade, N & Saeed, G. (2014). The effect of teaching
problem solving skills and locus of control on the academic achievement of
mathematics students. Elixir International Journal. 70 (2014), 24417-24421.
Githua, B. N., & Njubi, J. N. (2013). Effects of practicing mathematical creativity
enhancing learning/teaching strategy during instruction on secondary school

References 187
student’s mathematics achievement by gender in kenya’s nakuru
municipality. technology, 2(2).
Gnanadevan & Selvaraj. (2013). Reasoning Ability, science attitude and academic
achievement among higher secondary students. Journal of Educational
Research and Extension, 50(4), 23.
Gordon, R. A. (2008). Attributional style and athletic performance: Strategic
optimism and defensive pessimism. Psychology of sport and exercise, 9(3),
336-350.
Griffin, D. P. (2014). Locus of control and psychological well-being: Separating the
measurement of internal and external constructs--a pilot study. Retrieved
from https://encompass.eku.edu/cgi/viewcontent.cgi?article=1017&context
=ugra.
Guilford, J. P. (1950). Creativity. American Psychologist, 5(9), 444-454.
Guilford, J. P. (1967). The nature of human intelligence. New York: McGraw- Hill.
Gupta & Khan. (1987). A study of the effect of the trait, anxiety, Psychological
Stress and Intelligence on state and performance, Indian D. Abstract July-
Sept, 1988, 360-365.
Hadamard, J. (1945). The psychology of invention in the mathematical field. New
York: Mineola.
Hans, A., Deshpande, A., Pillai, A. E., Fernandes, C. J., Arora, S., Kariya, P., &
Uppoor, A. (2017). A Study on Self-Efficacy, Locus of Control and

References 188
Commitment in Select Private Management Colleges in Oman. Amity
Journal of Management Research, 2(1), 1-9.
Haylock, D. (1997). Recognizing mathematical creativity in school children.
International Reviews on Mathematical Education, ZDM, 29(3), 68-74.
Haylock, D. W. (1987). A framework for assessing mathematical creativity in school
children. Education Studies in Mathematics, 18(1), 59-74.
Haylock, D.W. (1987). Mathematical creativity in school children. The Journal of
Creative Behavior, 21(1), 48-59.
Helie, S., & Sun, R. (2010). Incubation, insight and creative problem solving.
Psychological Review at American Psychological Association, 117(3), 994-
1024.
Hill, F., Mammarella, I. C., Devine, A., Caviola, S., Passolunghi, M. C., & Szűcs, D.
(2016). Maths anxiety in primary and secondary school students: Gender
differences, developmental changes and anxiety specificity. Learning and
Individual Differences, 48, 45-53.
Hong, E., & Aqui, Y. (2004). Cognitive and motivational characteristics of
adolescents gifted in mathematics: Comparison among students with
different types of giftedness. The Gifted Child Quarterly, 48 (3), 191- 201.
Hungi, S. K., & Changeiywo, J. M. (2009). Influence Of Creativity Teaching
Strategy On Students’ Performance And Motivation In The Topic “Energy”

References 189
In Secondary School Physics In Nakuru District, Kenya. Journal of
Technology and Education in Nigeria, 14(1-2).
Hussain, A., Kumar, A. H. (2008). Academic Stress and Adjustment among High
School Students. Journal of the Indian Academy of Applied Psychology, 34,
70-73. Retrieved from http://medind.nic.in/jak/t08/s1/jakt08s1p70.pdf.
Ibrahim, M., & Irawan, A. (2015). Effectivity of Peer Tutoring Learning to Increase
Mathematical Creative Thinking Ability of Class XI IPA SMAN 3 Kendari
2014. International Journal of Education and Research, 3(1), 16.
Idris, N., & Nor, N. M. (2010). Mathematical creativity: usage of technology.
Procedia-social and behavioral sciences, 2(2), 1963-1967.
India Knowledge @ Wharton. (2008, August,3). Former President APJ Abdul
Kalam: ‘A Leader Should Know How to Manage Failure’. Retrieved from
https://knowledge.wharton.upenn.edu/article/former-president-apj-abdul-
kalam-a-leader-should-know-how-to-manage-failure
International Commission on Mathematical Instruction. (2004). Retrieved from
http://www. ams.org /notices/200406/comm-bass.pdf.
Isnani., Waluya, S. B., Rochmad., & Wardono (2020). Analysis of mathematical
creativity in mathematics learning is open ended. In Journal of Physics:
Conference Series. 1511, 1-5. IOP Publishing.
Jacob, A. K. (2007). Relationship between creativity and self-concept. Edutrack,
7(2), 25-26.

References 190
Jain, S. (1992). A study of creativity in relation to the teaching aptitude, skills &
personality variables of pupil teacher. (Unpublished Doctoral Thesis).
Nagpur University, Maharashtra. Retrieved from ERIC data base
(EJ078372).
Jaleel, S., & Titus, B. (2015). Effectiveness of gaming strategy on mathematical
creativity of students at secondary level. Indian Journal of Applied Research,
5(10), 35-37.
Jarmas, B., & Raed, Z. (2017). Mathematical creativity among excellent 8th grade
pupils. European Journal of Education Studies, 3(6), 374-395.
Jayasree, S. U. (1988). Effect of select attitude variables on creativity among
secondary school pupils. (Unpublished Masters Dissertation). University of
Calicut., Kerala.
Jensen, L. R. (1973). The relationships among mathematical creativity, numerical
aptitude and mathematical achievement. Dissertation Abstract International,
34(05), 2168. Retrieved from ERIC database (EJ086530).
Jinu, M. K., & Vijayakumari, K. (2018). Influence of gender and Intelligence on
Mathematical Creativity. International Journal of Research and Analytical
Reviews. 5(4), 122-125.
Jinu, M.K. (2018). Development of a package on geometry to foster Mathematical
Creativity among upper primary students (Unpublished Doctoral Theis).
Farook Training College, University of Calicut. Kerala.

References 191
Johny, S. (2008). Effects of some environmental factors on mathematical creativity
of secondary students of Kerala (India). Proceedings of the Discussing
Group 9: Promoting Creativity for all Students of Mathematics Education,
11, 308-313.
Joo, Y. J., Lim, K. Y., & Kim, J. (2013). Locus of control, self-efficacy, and task
value as predictors of learning outcome in an online university context.
Computers & Education, 62, 149-158.
Jose, N.M. &Thomas, R.P. (2011).Problem Solving Ability and Scholastic
Achievement of Secondary School Students. Journal of research and
Extension in Education. 6(1), 141-144.
Joshi, R. J. (1981). A study of creativity and personality traits of the intellectually
gifted children. (Unpublished Doctoral Thesis). M. S University, Baroda.
Retrieved from http://shodhganga.inflibnet.ac.in/bitstream/10603/
60570/10/10.
Jyothi, V., & Renuka,P. (2017). Problem Solving Ability in Mathematics of
Secondary School Students – A Study. International Journal of Research in
Science & Engineering. 61-66.
Kalamu, E. H., Badu, S. Q., & Panai, H. (2018). The Effect of Locus Control on
Mathematical Problem Solving Ability of Gorontalo City State Middle
School Students. Journal of Education and Practice, 9(34). 57-63.
Kanhai, A. (2016). A study of mathematical creativity in relation to self-concept in
mathematics emotional intelligence and school environment of elementary
References 192
school children. (Unpublished Doctoral Thesis). Banaras Hindu University,
Varanasi.
Kanhai, A., & Singh, B. (2016). Some environmental and attitudinal characteristics
as predictors of mathematical creativity. International Journal of
Mathematical Education in Science and Technology, 48(3), 327-337.
Karasel, N., Ayda, O., & Tezer, M. (2010). The relationship between mathematics
anxiety and mathematical problem solving skills among primary school
students. Procedia-Social and Behavioral Sciences, 2(2), 5804-5807.
Kargar, M., Tarmizi, R. A., & Bayat, S. (2010). Relationship between mathematical
thinking, mathematics anxiety and mathematics attitudes among university
students. Procedia-Social and Behavioral Sciences, 8, 537-542.
Karimi, A. (2000). The relationship between anxiety, creativity, gender, academic
achievement and social prestige among secondary school. Shiraz: University
of Shiraz.
Karimi, A., & Venkatesan, S. (2009). Mathematics Anxiety, Mathematics
performance and academic Hardiness in High School Students. International
Journal of Educational Science. 1(1),33-37.
Kattou, M., Kontoyianni, K., Pitta-Pantazi, D., & Christou, C. (2013). Connecting
Mathematical Creativity to Mathematical Ability. Zdm-Mathematics
Education, 45(2), 167-181.
References 193
Kattou, M., Kontoyianni, K., Pitta-Pantazi, D., Christou, C., & Cleanthous. (2014).
Predicting Mathematical Creativity. Department of Education, University of
Cyprus.https://www.researchgate.net/publication/261286808_Predicting_mat
hematical_creativity.
Kavitha, M. (2009). Interaction effect of mathematical creativity, intelligence and
problem solving ability on achievement in mathematics of IX standard
students of Bangalore district (Unpublished Doctoral Thesis). Alagappa
University.
Keshavarz, S., & Baharudin, R. (2013). Perceived parenting style of fathers and
adolescents’ locus of control in a collectivist culture of Malaysia: The
moderating role of fathers’ education. The Journal of genetic psychology,
174(3), 253-270.
Kim, K. H. (2008). Underachievement and creativity: Are gifted underachievers
highly creative?. Creativity Journal, 20, 234-242.
Klusmann, U., Kunter, M., Trautwein, U., Ludtke, O., & Baumert, J. (2008).
Engagement and emotional exhaustion in teachers: Does the school context
make a difference?. International Association of Applied Psychology, 57,
127-151.
Kothari, D.S. (1964). Education Commission Report, New Delhi. Retrieved from
http://www.teindia.nic.in/files/reports/ccr/KC/KC_V1.pdf.
Krutetskii, V. A. (1976). The psychology of mathematical abilities in school
children. Chicago: University of Chicago Press.

References 194
Kumari, A. T. (2000). Identifying some correlates of creativity and nurturing the
creative potential at the Preschool. (Unpublished Doctoral Thesis)
University of Calicut, Kerala.
Kumari, M., Ram, L., Barwal, S. K. (2016). A Study of the Relationship between
Stress and Mathematic Achievement of High School Students. International
Journal of Advanced Research in Education & Technology, 3(2), 203-206.
Kumari, P.A.V.S. (2005). Different Theories of Creativity. In M. R. Sarsani (Eds.).
Creativity in Education. New Delhi: Sarup & Sons.
Kunhikrishnan, K., & Mathew, M.K. (1987). Development of a Locus of Control
scale in Malayalam. Psychological studies, 32(1), 55-57.
Kutanis, R. O., Mesci, M., & Ovdur, Z. (2011). The effects of locus of control on
learning performance: A case of an academic organization. Journal of
Economic and Social Studies, 1(2), 113.
Kwon, O. N., Park, J. H., & Park, J. S. (2006). Cultivating divergent thinking in
mathematics through an open-ended approach. Asia Pacific Education
Review, 7(1), 51-61.
Lal, K. (2014). Academic stress among adolescent in relation to intelligence and
demographic factors. American International Journal of Research in
Humanities, Arts and Social Sciences, 5(1), 123-129.

References 195
Lather, A. S., Jain, S., & Shukla, A. (2014). Student’s creativity in relation to locus
of control: A study of Mysore University, India. The international Journal of
Indian Psychology, 2(1), 146-165.
Latterell, C. M. (2000). Assessing NCTM standards-oriented and traditional
students' problem-solving ability using multiple-choice and open-ended
questions (Unpublished Doctoral Thesis), University of Iowa.
Laycock, M. (1970). Creative mathematics at nueva. Arithmetic Teacher, 17, 325-
328.
Leikin, R. & Lev, M. (2013). Mathematical creativity in generally gifted and
mathematically excelling adolescents: What makes the difference? ZDM -
The International Journal on Mathematics Education, 45(2), 183–197.
Leikin, R., & Lev, M. (2007). Multiple solution task as a magnifying glass for
observation of mathematical creativity. Proceedings of the 31st conference
of the international group for the psychology of mathematics education, 167-
174. Retrieved from http://ermeweb.free.Fr/Cerme5.pdf.
Leikin, R., & Lev, M. (2013). Relationship between high mathematical ability and
mathematical creativity in secondary school children. University of Haifa,
Israerl. Retrieved from http://ecat.education.gov.il/Attachment/Download
File?downloadId=7744.
Levin, M. J. (1978). Psychology: A biographical approach, New York: McGraw
Hill.

References 196
Lew, K. H., & Cho, J. (2013). Relationship among creativity, motivation and
creative home environment of young children. In Proceedings of the 5th
International Conference on Advanced Science and Technology,
Washington, DC.
Lim, K. K., Ismail, Z., & Yusof, Y. M. (2019). Fostering Mathematical Creativity
among Engineering Undergraduates. International Journal of Engineering
Education, 1(1), 31-40.
Lin, Y. M., & Chen, F. S. (2009). Academic stress inventory of students at
universities and colleges of technology. World Transactions on Engineering
and Technology Education, 7(2), 157-162.
Lizzie, J.(2017). ProblemSolving Ability in Mathematics in Relation to their
Academic Achievement among higher Secondary School Students. Journal
of Educational & Psychological Research, 7(1), 36-40.
Loudon, G. H., & Deininger, G. M. (2016). The physiological response during
divergent thinking. Journal of Behavioral and Brain Science, 6(1), 28-37.
Mahapatra, P. (2000). Developing creative expression in elementary grades through
enrichment programmes. Journal of All India Association for Educational
Research, 12(3&4), 72-78.
Mahasneh, A. M., Al-Zoubi, Z. H., & Batayeneh, O. T. (2013). The Relationship
between Optimism-Pessimism and Personality Traits among Students in the
Hashemite University. International Education Studies, 6(8), 71-82.

References 197
Maksic, S., & Sevkusic, S. (2012). Creativity of students’ stories: case study at
primary school. Zbornik Instituta za pedagoska istrazivanja, 44(1), 128-143.
Malini, P.M. (1995). A Study of Gender Differences in Certain Psychological
Variables of Mathematical Domain at Secondary School level. (Unpublished
doctoral dissertation). University of Calicut, Kerala.
Manikandan, K., & Neethu, A. T. (2018). Student engagement in relation to
academic stress and self-efficacy. Guru Journal of Behavioural and Social
Sciences. 6 (1), 775-784.
Mann, E. L. (2005). Mathematical creativity and school mathematics: Indicators of
mathematical creativity in middle school students. (Unpublished Doctoral
Thesis). University of Connecticut. USA. Retrieved from
http://www.gifted.uconn.edu/siegle/Dissertations/Eric%20Mann.pdf.
Mason, J., Burton, L., & Stacey, K. (1982). Thinking mathematically. Harlow:
Pearson Prentice Hall. Retrieved from http://mehrmohammadi.ir/wp-
content/uploads/2019/ 11/Thinking-Mathematically.pdf.
Mathai, S. M. (2015). The Mediating Effect of Coping Styles on the Optimism
Athletic Performance Relationship among Track and Field Athletes. The
International Journal of Indian Psychology, 2(2), 127-136.
Mathur, R., & Sharma, R. (2015). Academic stress in relation with optimism and
resilience. International Research Journal of Interdisciplinary and
Multidisciplinary Studies, 1(7), 129-134.
References 198
Meissner, H. (2000). Creativity in mathematics education- A paper presented at the
meeting of the international congress on mathematics education. Tokyo,
Japan.
Menaga, S., & Chandrasekaran, V. (2014). A study on academic stress of higher
secondary school students. Scholarly Research Journal for Interdisciplinary
Studies, 2(14), 1973-1981.
Midhundas, A. M., & Vijayakumari, K. (2016). Influence of Mathematics anxiety on
Mathematical creativity among secondary school students. Guru Journal of
Behavioural and Social Sciences. 4 (1), 495-502.
Midhundas, A. M., & Vijayakumari, K. (2017). Influence of optimism on
mathematical creativity of secondary school students. Compendium of
AIAER Annual Cum International Conference. 171-173.
Mihaela, P, L., Magdalenaa, S. M., & Loredanaa, T. S. (2013). A study on the
relation between locus of control and creative attitudes in the structure of
didactic competence. Procedia-Social and Behavioral Sciences, 84, 1381-
1385.
Mohamed, S. H., & Tarmizi, R. A. (2010). Anxiety in mathematics learning among
secondary school learners: A comparative study between Tanzania and
Malaysia. Procedia-Social and Behavioral Sciences, 8, 498-504.
Moore-Russo, D., & Demler, E. L. (2018). Linking Mathematical Creativity to
Problem Solving: Views from the Field. In Broadening the Scope of
Research on Mathematical Problem Solving (pp. 321-345). Springer, Cham.

References 199
Morsanyi, K., Busdraghi, C., & Primi, C. (2014). Does maths anxiety make people
bad decision-makers? The link between mathematical anxiety and cognitive
reflection. In Proceedings of the Annual Meeting of the Cognitive Science
Society. 36(36). 1042-1047.
Mudaliyar commission report. (1952). Report of the secondary education
commission. Retrieved from http://www.teindia.nic.in/Files/CCR/
Secondary_Education_Commision_Report.pdf.
Naderi, H., Abdullah, R., Aizan, H. T., Sharir, J., & Kumar, V. (2009). Creativity,
age and gender as predictors of academic achievement among undergraduate
students. Journal of American Science, 5(5), 101-112.
Nagoba, B.S., & Mantri, S.B. (2015). Role of Teachers in Quality Enhancement in
Higher Education. Department of Microbiology, Department of Community
Medicine, Maharashtra Institute of Medical Sciences & Research, Medical
College, India. 4(1), 177-182.
Naik, A. R. (2015). A study on locus of control among college students of Gulbarga
City. The International Journal of Indian Psychology, 2(4), 47-54.
Naja, S. (1989). An investigation into the relationship between the factors of
creativity and achievement in Mathematics of ninth standard pupils of
Thrissur and Palakkad revenue district. (Unpublished Master’s Thesis).
University of Calicut, Kerala.
References 200
National Council of Teachers of Mathematics. (2000). Principles and standards for
school mathematics. Reston, VA: National Council of Teachers of
Mathematics.
NCF (2005). National curriculum framework. New Delhi: National Council of
Educational Research and Training. New Delhi.
Newell, A., Shaw, J. C., & Simon, H. A. (1962). The process of creative thinking. In
H. E. Gruber, G. Terrel & M. Wertheimer (Eds.), Contemporary approaches
to creative thinking. New York: Mc Grow Hill.
Ng, L. K. (2012). Mathematics Anxiety in Secondary School Students. Mathematics
Education Research Group of Australasia.
Nifsa, C. (2007). Interaction effect of creativity and formal reasoning on problem
solving ability in physics of secondary school students. (Unpublished M.Ed.
Dissertation).University of Calicut, Kerala.
Nikitha, S., Jose, T. T., & Valsaraj, B. P. (2014). A correlational study on academic
stress and self-esteem among higher secondary students in selected schools
of Udupi district. Nitte university journal of health science, 4(1), 106.
Nisha, S. R. (2010). A study of the influence of commercialized learning materials
for developing creativity in Mathematics in secondary school students.
(Unpublished Master’s Thesis). Kerala University, Kerala.
NPE (2020). National Policy on Education. Retrieved from https://www.mhrd.
gov.in/sites/upload_files/mhrd/files/Draft_NEP_2019_EN_Revised.pdf.

References 201
Osborn, A. F. (1953). Applied imagination, principles & procedures of creative
thinking. New York: Scribner.
Owolabi, B.G. (2013). The impact of emotional intelligence training on academic
stress and self- efficacy among senior secondary school students. Journal of
Capital Development in Behavioral Science. 1(1). Retrieved from
http://www.academix.ng/search/paper.html?idd=3300012810.
Oxford dictionary of current English (2006). Oxford University Press.
Parnes, S. J. (1992). Sourcebook for creative problem solving. Buffalo, New York:
Creative Education Foundation Press.
Pehkonen, E. (1997). The state-of-art in mathematical creativity. ZDM, 29 (3). 63-67
.Retrieved from https://www.emis.de/journals/ZDM/zdm973a1.pdf.
Perez-Tyteca, P., Castro, E., Segovia Alex, I., Castro, E., Fernandez, F., & Cano
Garcia, F. (2009). The Role of Mathematics Anxiety when Moving from
Secondary Education to University Education. Journal of Research in
Didactics of Mathematics 4(1), 23-35.
Perkins, DN (1981) The Mind's Best Work. Cambridge, MA: Harvard University
Press.
Petrovici, C., & Havarneanu, G. (2015). An Educational Program of Mathematical
Creativity. Acta Didactica Napocensia, 8(1), 13-18.
Philip, R. (2008). A study of the relationship between intelligence, scientific
creativity, achievement motivation, home environment and achievement in

References 202
science of higher secondary school pupils of Kerala (Unpublished Doctoral
Thesis). M G University, Kerala.
Poincare, H. (1948). Science and method. New York: Dover.
Poincare, H. (1956). Mathematical creation: The world mathematics. New York:
Simon and Schuster.
Prasad, B. A. (1993). Sex difference in creativity: a study in Navodaya vidyalayas.
Indian Educational Abstracts, 19(2), 20-25.
Preethy, E.P.(2008). Relative efficiency of problem solving ability, mathematical
interest and awareness in the utility of mathematics in predicting
achievement in mathematics of secondary school pupils of Kerala
(Unpublished M.Ed. Dissertation).University of Calicut, Kerala..
Ramanujam, R. (2012). Mathematics education in India - An overview. Mathematics
education in India: Status and outlook. HBCSE TIFR: Mumbai, India.
Rana, R., & Mahmood, N. (2010). The relationship between test anxiety and
academic achievement. Bulletin of Education and Research, 32(2), 63-74.
Rani, M. G., & Dalal, D. S. (2013). Relationship of Creativity and Achievement
Motivation of Senior Secondary Students. Research in Education, 2(7).
Reddy, B. S. V. (2008). Creativity of student teachers of colleges of education.
Edutracks, 7(1), 12-13.

References 203
Remadevy, A. (1993). Relationship between attitude towards science and creativity
in science of secondary school pupils (Unpublished M.Ed. Dissertation).
University of Calicut, Kerala.
Resmi, S. (1997). Interaction effect of mathematics study approach and
mathematical creativity on achievement in mathematics of secondary school
pupils in Kerala (Unpublished M.Ed. Dissertation).University of Calicut,
Kerala.
Rezaei, S. G., Mousavi, S. S. S., Safari, F., Bahrami, H., & Menshadi, S. M. D.
(2015). Study of relationship between optimism, pessimism and coping
strategies with mental health among university students of Lorestan. Open
Journal of Social Sciences, 3(12), 190.
Rinsa, P.V. (2008). Interaction effect of thinking style and deductive reasoning on
problem solving ability in mathematics of secondary school students.
(Unpublished M.Ed dissertation) University of Calicut, Kerala.
Romey, W. D. (1970). What is your creativity quotient?. School Science and
Mathematics, 70, 3-8.
Rotter, J. B. (1960). Some implications of a social learning theory for the prediction
of goal directed behavior from testing procedures. Psychological Review,
67(5), 301.
Rudski, J. (2004). The illusion of control, superstitious belief, and optimism.
Current Psychology, 22(4), 306-315.

References 204
Sagar, P., & Singh, B. (2017). A Study of Academic Stress among Higher
Secondary School Students. International Journal of Creative Research
Thoughts (IJCRT), 5(4), 1864-1869.
Sak, U., & Maker, C. J. (2006) Developmental variations in children’s creative
mathematical thinking as a function of schooling, age, and knowledge.
Creativity Research Journal, 18(3), 279-291.
Sambo, S., & Ibrahim, M. O. (2012). Mathematical creative development among
children: a precusor for counselors and mathematics teachers. European
Scientific Journal, 8(24).
Sanchez, O., Brufau, R., Mendez, F. X., Corbalan, F. J., & Liminana, R. M. (2010).
The relationship between optimism, creativity and psychopathological
symptoms in university students. Electronic journal of research in
educational psychology, 8(3), 1151-1178.
Sangh, H. T. (1938). Basic National Education: Report of the Zakir Hussain
Committee and the Detailed Syllabus with a Foreword by Mahatma Gandhi.
Segaon, Wardha.
Saragih, S., & Habeahan, W. L. (2014). The improving of problem solving ability
and students’ creativity mathematical by using problem based learning in
SMP Negeri 2 Siantar. Journal of Education and Practice, 5(35), 123-133.
Schumacher, B. (2006). Assessing the relationship between optimism and academic
success. MA diss., Athabasca University, Alberta.

References 205
Sebastian, N. (2013). Relationship between mathematical creativity achievements in
mathematics of secondary school pupil. Journal of Studies in Teacher
Education. 61 (1). 66-69.
Seligman, M. E. (1990). Learned optimism: How to change your mind and life. New
York: Vintage Books.
Sharma, Y. (2013). Mathematical creativity: Exploring the effects of divergent
mathematical exercises and creativity. Experiments in Education, 18(2), 5-
11.
Sharma, Y. (2014). The effects of strategy and mathematics anxiety on mathematical
creativity of school students. International Electronic Journal of
Mathematics Education, 9(1), 25-37.
Sherman, B. F., & Wither, D. P. (2003). Mathematics anxiety and mathematics
achievement. Mathematics Education Research Journal, 15(2), 138-150.
Shridhar, M. P. (2014). A Study on Scientific Creativity among secondary school
students. (Unpublished Master’s Thesis). Indira Gandhi National Open
University, New Delhi.
Silver, E. A. (1997). Fostering creativity through instruction rich in mathematical
problem solving and problem posing. Zdm, 29(3), 75-80. Retrieved from
http://www.fiz. karlsruhe.de/fiz/ publications/zdm.

References 206
Singer, F. M., & Voica, C. (2015). Is problem posing a tool for identifying and
developing mathematical creativity?. Research in Mathematics Education
book Services, 5, 141-174.
Singh, A, (2013). Predicting academic achievement on the basis of achievement
motivation, emotional intelligence and creativity of student teachers. Journal
of Educational Research and Extension, 50(1), 25-34.
Singh, B. (1985). The development of test to measure mathematical creativity.
International Journal of Mathematics Education in Science Technology, 18,
181 -186.
Siswono, T. Y. E. (2004). Identifying creative thinking process of students through
mathematics problem posing. International Conference on Statistics and
Mathematics and Its Application in the Development of Science and
Technology. Universitas Islam Bandung, 85-89. Retrieved from
https://www.academia.edu/3750480/Identifying_Creative_Thinking_Process
_of_Students_through_Mathematics_Problem_Posing.
Siswono, T. Y. E. (2010). Leveling Students' Creative Thinking in Solving and
Posing Mathematical Problem. Indonesian Mathematical Society Journal on
Mathematics Education, 1(1), 17-40.
Skaalvik, E. M., & Skaalvik, S. (2007). Dimensions of teacher self-efficacy and
relations with strain factors, perceived collective teacher efficacy, and
teacher burnout. Journal of educational psychology, 99(3), 611.
References 207
Slavica, M. (2004). Creativity of students’ stories: Case study at primary level.
Retrieved from www.ipisr.org.rs
Sonia, R.S.R., & Bindu, R.L. (2017). Relationship between Problem Solving Ability
in Mathematics and Numerical Ability of Secondary Level Students. Journal
of research and Extension in Education 12(1), 62 - 66.
Soumya, U.N. (2007). Relationship between creative thinking and problem solving
ability of IX standard students of Ernakulum district. (Unpublished M.Ed.
Dissertation). M.G.University, Kerala.
Sreekala, C. (1991). Effect of certain attitude variables and intelligence on creativity
of secondary school pupil of Kerala. (Unpublished Master’s Dissertation).
University of Calicut, Kerala.
Sreekant, Y. (2004). Societal role in development of creativity children. Edutracks,
6(2), 14-05.
Sreerekha, R. (2001). A study of relationship between self-concept, intelligence,
mathematical creativity and achievement in mathematics of secondary
school pupils. (Unpublished Master’s Dissertation). Kerala University,
Kerala.
Sriraman, B. (2004). The characteristics of mathematical creativity. The
International Journal on Mathematics Education, 41, 13-27.

References 208
Sriraman, B. (2005). Are giftedness and creativity synonyms in mathematics? An
analysis of constructs within the professional and school realm. The Journal
of Secondary Gifted Education, 17, 20-36.
Srivastav, R., Imam, A., Sing, G. P., & Sing, S. P. (2016). A study of Mathematics
Anxiety among secondary school students in relation to personal and school
related factors. International Journal of Multidisciplinary Research and
Development. 3(1), 134-137.
Srivastava, S. S. (1977). Creativity as related to birth order and number of siblings.
Indian Psychological Review, 14, 1-4.
Sternberg, R. J., & Lubart, T. I. (1995). Investing creativity. American Psychologist
51(7), 677-688.
Sternberg, R. J., (1988). The nature of creativity: Contemporary psychology
perspectives. Cambridge, London: Cambridge University Press.
Stevens, M. (1998). How to be a better problem solver, London: The Industrial
Society. https://link.springer.com/content/pdf/10.1007%2F978-3-319-40730-
2.pdf.
Sukla, J. P., & Sharma. V. P. (1987). A cross cultural study of scientific creativity.
Indian Journal of Applied Psychology, 24(2), 101-106.
Sunitha, K. (1997). Creativity in relation to achievement in Malayalam of secondary
schoolstudents. (Unpublished M.Ed Dessertation).University of Calicut,
Kerala.

References 209
Suresh, M. (2016). A Study on Creativity and Problem Solving Ability among
Higher Secondary School Students. Paripex - Indian Journal of Research.
5(1). 294-296.
Talawar, M. S., & Madhusudhanan, K. (2010). Mathematical creativity among
secondary school students: A study. International Educator, 22, 42-47.
Thakur, M. (2014). Self efficacy mathematical attitude and anxiety as correlates of
creativity among secondary school students (Unpublished Doctoral Thesis).
Punjabi University, Patiala.
The SAGE dictionary of social research methods (2006). London: SAGE
Publications, Ltd doi: 10.4135/9780857020116.
Thurstone, L. L. (1952). Creative talent: Applications of psychology. New York :
Harper & Row.
Tok, S., Bahtiyar, A., & Karalok, S. (2015). The effects of teaching mathematics
creatively on academic achievement, attitudes towards mathematics, and
mathematics anxiety. International Journal of Innovation in Science and
Mathematics Education (formerly CAL-laborate International), 23(4), 1-24.
Torrance, E. P. (1960). Guiding creative talent. Eaglewood Cliffs, New Jersy:
Prentice Hall.
Torrance, E. P. (1987). Recent trends in teaching children and adults to think
creatively. Frontiers of creativity research: Beyond the basics, 204-215.
References 210
Trujillo, K. M., & Hadfield, O. D. (1999). Tracing the roots of mathematics anxiety
through in-depth interviews with preservice elementary teachers. College
student journal, 33(2), 219-219.
Tschannen‐Moran, M., Bankole, R. A., Mitchell, R. M., & Moore, D. M. (2013).
Student academic Optimism: A confirmatory factor analysis. Journal of
Educational Administration. 51(2), 150-175.
Tuli, M. R. (1980). Mathematical creativity as related to aptitude for achievement in
and attitude towards mathematics. Dissertation Abstracts International, 42
(1), 122-125.
Tyagi, T. K. (2015). A Study to Examine the Relationship between Mathematical
Creativity and Mathematical Problem-solving Performance. Journal of
Indian Education, 40(3), 80-89.
Tyagi, T. K. (2015). Is there a causal relation between mathematical creativity and
mathematical problem solving performance?. International Journal of
Mathematics Education in Science and Technology, 1-7. Retrieved from
doi:10.108010020739x.2015.107561.
Tyagi, T. K. (2017) Mathematical intelligence and mathematical creativity. A causal
relationship. Creativity Research Journal, 29 (2), 212 -217.
UNICEF, I., & Unicef. (2000, June). Defining quality in education. In A paper
presented by UNICEF at the meeting of the International Working Group on
Education Florence, Italy June.

References 211
Vidya, R. R., & Malin,P.M. (2016). A Study on the relationship between Critical
Thinking Skills and Problem Solving Ability among Adolescence. Journal of
research and Extension in Education. 11 (2). 62-66.
Vijayakumari, K. (2000). Some Psychological Variables Contributing to
Mathematical Giftedness of Secondary School Pupils of Kerala.
(Unpublished Doctoral Thesis) University of Calicut, Kerala.
Vijayakumari, K., & Kavithamole, M. G. (2014). Mind Mapping: A tool for
Mathematical Creativity. Guru Journal of Behavioral and Social Sciences,
2(1), 241-246.
Vijitha, P. (2016). Influence of spatial ability on mathematical creativity of higher
secondary school students of Kerala. (Unpublished Master’s Thesis).
University of Calicut, Kerala.
Vitasari, P., Herawan, T., Wahab, M. N. A., Othman, A., & Sinnadurai, S. K.
(2010). Exploring mathematics anxiety among engineering
students. Procedia-Social and Behavioral Sciences, 8, 482-489.
Walia, P. & Walia, P. (2017). Development and Standardization of Mathematical
Creativity Test. International Journal of Advanced Research. 5(7), 1293-
1300.
Wallas, G., (1926). The art of thought. New York: Harcourt Brace.

References 212
Walsh, S. (2015). How to Transform your Problem-Solving and Creativity.
Smashing magazine. Retrieved from https://www.smashingmagazine.com/
2015/01/transforming-problem-solving-creativity/.
Waluya, S. B. (2020, April). Analysis of mathematical creativity in mathematics
learning is open ended. Journal of Physics: Conference Series, 1511, 1-5.
Retrieved from https://iopscience.iop.org/article/10.1088/1742-6596/1511/
1/012102/pdf.
Ward. K. (2003). Entrepreneurialism urbanism: State Restructuring and civilizing.
International Journal of Urban and Regional Research, 35, 116-127.
Yadav, S. K., & Wadhwa, S. (2011). Creativity and academic achievement of
adolescents studying in English medium and Hindi medium schools. Journal
of Educational Research and Extention, 48(1), 119-125.
Yaftian, N., Nadjafikhah, M., & Bakhshalizadeh, S (2010) Mathematical Creativity
and Mathematics Education. Procedia of the National Conference on
Modern Instructional Methods, 1-8.
Zaidi, I. H., & Mohsin, M. N. (2013). Locus of control in graduation students.
International Journal of Psychological Research, 6(1), 15-20.
Zakaria, E., & Nordin, N. M. (2008). The effects of mathematics anxiety on
matriculation students as related to motivation and achievement. Eurasia
Journal of Mathematics, Science and Technology Education, 4(1), 27-30.

References 213
Zakaria, E., Zain, N. M., Ahmad, N. A., & Erlina, A. (2012). Mathematics anxiety
and achievement among secondary school students. American Journal of
Applied Sciences, 9(11), 18-28.
Ziglari, L. (2017). Interpreting multiple regression results: weights and structure
coefficients. General Linear Model Journal, 43 (2), 13-22.
Zunhammer, M., Eberle, H., Eichhammer, P., & Busch, V. (2013). Somatic
symptoms evoked by exam stress in university students: the role of
alexithymia, neuroticism, anxiety and depression. Plos One, 8(12), 1-11.
Retrieved from https://journals.plos.org/plosone/article?id=10.1371/journal.
pone.0084911.

APPENDICES
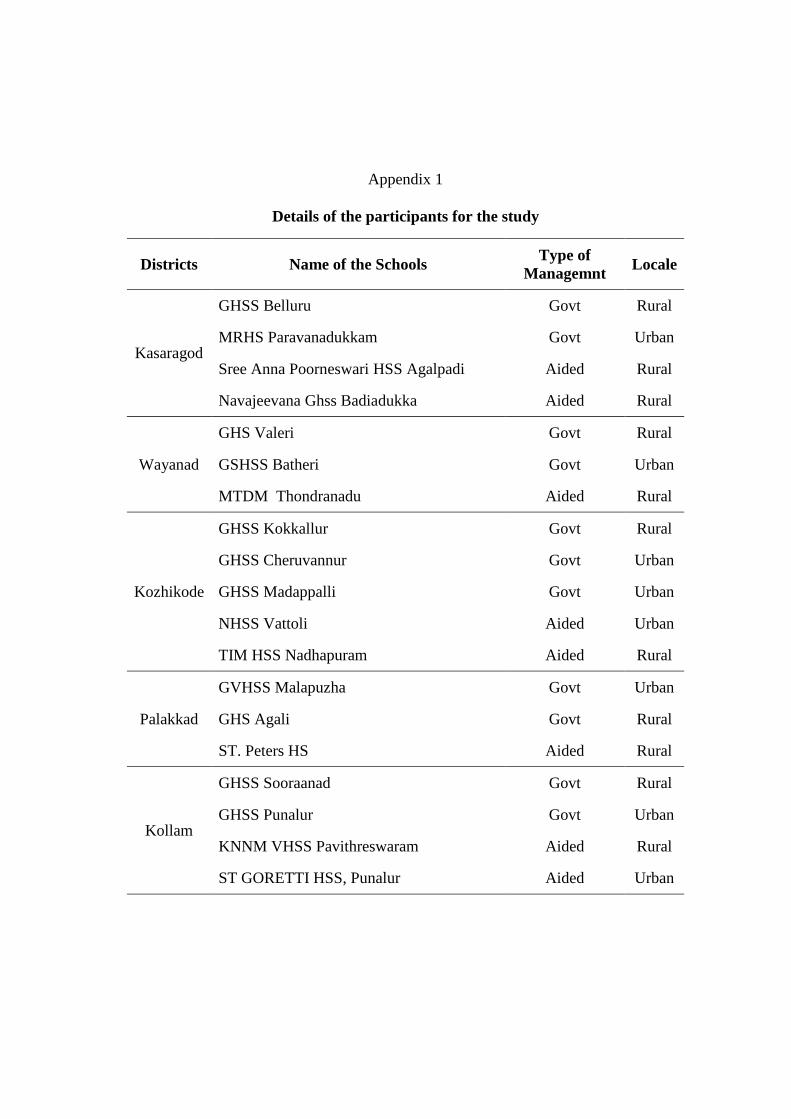
Appendix 1
Details of the participants for the study
Districts Name of the Schools Type of
Managemnt Locale
Kasaragod
GHSS Belluru Govt Rural
MRHS Paravanadukkam Govt Urban
Sree Anna Poorneswari HSS Agalpadi Aided Rural
Navajeevana Ghss Badiadukka Aided Rural
Wayanad
GHS Valeri Govt Rural
GSHSS Batheri Govt Urban
MTDM Thondranadu Aided Rural
Kozhikode
GHSS Kokkallur Govt Rural
GHSS Cheruvannur Govt Urban
GHSS Madappalli Govt Urban
NHSS Vattoli Aided Urban
TIM HSS Nadhapuram Aided Rural
Palakkad
GVHSS Malapuzha Govt Urban
GHS Agali Govt Rural
ST. Peters HS Aided Rural
Kollam
GHSS Sooraanad Govt Rural
GHSS Punalur Govt Urban
KNNM VHSS Pavithreswaram Aided Rural
ST GORETTI HSS, Punalur Aided Urban
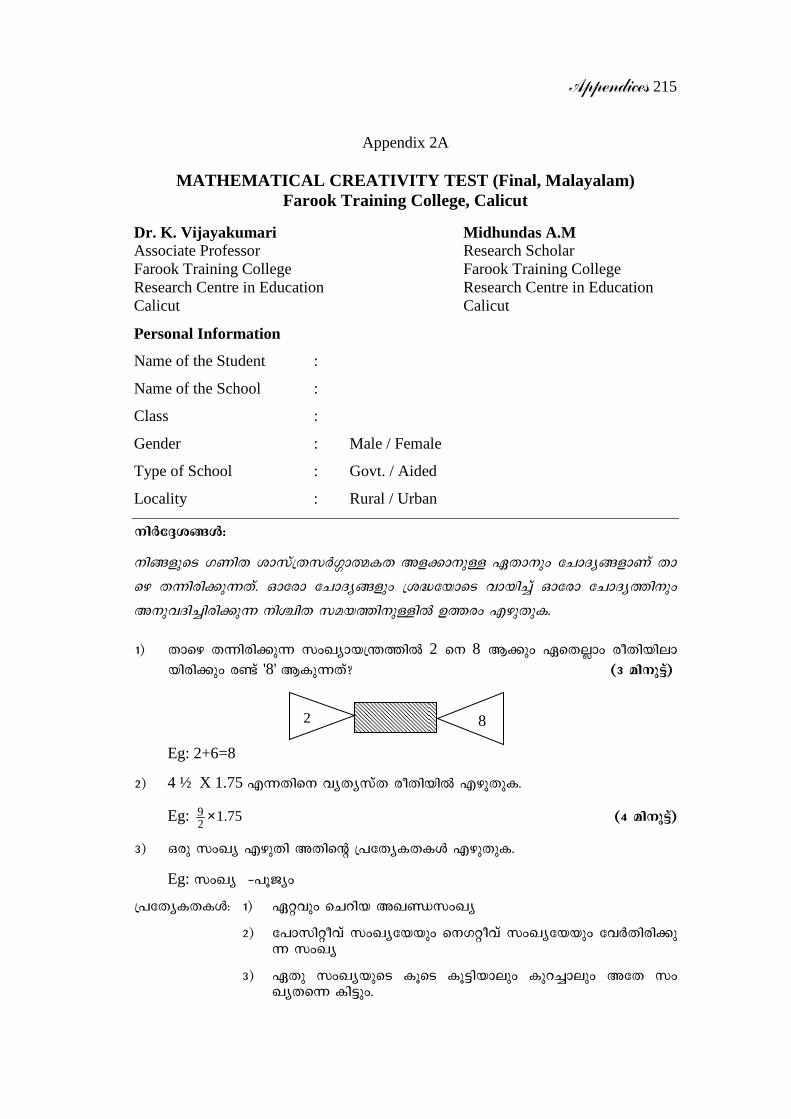
Appendices 215
Appendix 2A
MATHEMATICAL CREATIVITY TEST (Final, Malayalam) Farook Training College, Calicut
Dr. K. Vijayakumari Midhundas A.M Associate Professor Research Scholar Farook Training College Farook Training College Research Centre in Education Research Centre in Education Calicut Calicut
Personal Information
Name of the Student :
Name of the School :
Class :
Gender : Male / Female
Type of School : Govt. / Aided
Locality : Rural / Urban
\nÀ-t±-i§Ä:
\n-§-fp-sS K-Wn-X im-kv-{X-kÀ-¤m-ß-I-X A-f-¡m-\p-Å G-Xm-\pw- tNm-Zy-§-fm-Wv Xm-
sg- X-¶n-cn-¡p-¶Xv. Hmtcm tNm-Zy-§-fpw {i-²-tbm-sS hm-bn¨v Hmtcm tNm-Zy-¯n\pw
A-\p-h-Zn-¨n-cn-¡p-¶ \nÝn-X k-a-b-¯n-\p-Ån D-¯-cw F-gp-XpI.
1) Xm-sg X-¶n-cn-¡p-¶ kw-Jym-b-{ -́¯n 2 s\ 8 B¡pw G-sXÃmw co-Xn-bn-em-
bn-cn-¡pw c−v '8' B-Ip-¶Xv? (3 an-\p«v)
Eg: 2+6=8
2) 4 ½ X 1.75 F-¶-Xn-s\ hy-Xykv-X co-Xn-bn F-gp-Xp-I.
Eg: 75.129 × (4 an-\p«v)
3) Hcp kw-Jy- F-gp-Xn A-Xn-sâ {]-tXy-I-X-IÄ F-gp-XpI.
Eg: kwJy - þ]qPyw
-{]tXy-I-X-IÄ: 1) G-ähpw sNdn-b A-J-Þ-kw-Jy
2) t]m-kn-äo-hv kw-Jy-tbbpw s\-K-äo-hv kw-Jy-tbbpw thÀ-Xn-cn-¡p-¶ kw-Jy
3) G-Xp kw-Jy-bp-sS Iq-sS Iq-«n-bmepw Ip-d-¨mepw A-tX kw-JyX-s¶ In-«pw.
2 8

Appendices 216
4) G-Xp kw-Jy-bp-sS Iq-sS Kp-Wn-¨m-epw ]qPyw X-s¶ In-«pw.
(3 an-\p«v)
4) 0, 1 F-¶o kw-Jy-I-fpw (kwJy-IÄ B-hÀ-¯n-¨p-]-tbm-Kn¡mw) KWn-X Nn-Ó-§fpw D-]-tbm-Kn-¨v D¯cw "H¶v' In-«-¯-¡-hn-[-¯n ]-c-amh-[n k-a-hm-Iy-§Ä D-−m-¡pI.
Eg: 0 X 0+1=1 (3 an-\p«v)
5) Xmsg X-¶n-cn-¡p-¶ Nn-{X-§Ä D-]-tbm-Kn-¨v hy-Xy-kv-X- AÀ-°-h¯m-b cq-]-§Ä D-−m-¡pI.
(3 an-\p«v)
6) Xm-sg X-¶n-cn-¡p-¶ Nn-{X-¯n 'A' bn \n¶pw 'F'  F-¯n-t¨-cm-\p-Å hy-Xykv-X h-gn-IÄ I-s−-̄ p-I. (2 an-\p«v)
7) 1 enäÀ, 1/2enäÀ, 1/4enäÀ A-f-hp-I-fn-ep-Å ]m-{X-§Ä D-]-tbm-Kn-¨v 3 en-äÀ ]m-en-s\ \n-d-bv-¡m-hp-¶ hy-Xykv-X co-Xn-IÄ F-gp-XpI.
Eg: 3L = 1, ½, ¼, ¼, 1 (3 an-\p«v)
8) kw-Jy-bn-se A-¡-§-fp-sS XpI '9' h-cp-¶ ]-c-amh-[n kw-Jy-IÄ F-gp-Xp-I.
Eg: 18, 1+8=9 (3 an-\p«v)
9) \m-ev k-a-N-Xp-c-§Ä D-]-tbm-Kn-¨v ]-e-X-c-¯n-ep-Å cq-]-§Ä X-¿m-dm-¡pI.
Eg (3 an-\p«v)
10) '5' H-¶p-IÄ sIm-−v \nÀ-½n-¡m³ I-gn-bp-¶ ]-c-amh-[n kw-Jy-IÄ F-gp-XpI.
Eg: 1 1 1 1 1 (3 an-\p«v)
A
B D
F
E C

Appendices 217
Appendix 2B
MATHEMATICAL CREATIVITY TEST (Final, English) Farook Training College, Calicut
Dr. K. Vijayakumari Midhundas A.M Associate Professor Research Scholar Farook Training College Farook Training College Research Centre in Education Research Centre in Education Calicut Calicut
Personal Information
Name of the Student :
Name of the School :
Class :
Gender : Male / Female
Type of School : Govt. / Aided
Locality : Rural / Urban
Instructions:
Below are a few questions to measure your mathematical creativity. Read each
question carefully and answer each question within the allotted time
1) Let 2 be 8 in the number machine given below. Write the ways that make 2 to 8. (3 Minutes)
Eg: 2+6=8
2) Write 4 ½ X 1.75 differently.
Eg: 75.129 × (4 Minutes)
3) Write a number and its characteristics.
Eg: Zero
Characteristics:
1) The smallest whole number
2) The number that separates the positive number from the negative number
3) Adding or subtracting any number gives the same number
4) Multiply by any number and you get zero (3 Minutes)
2 8

Appendices 218
4) Create maximum equations with numbers 0 and 1 (Numbers can be used repeatedly) and mathematical symbols to get 1 as answer.
Eg: 0 X 0+1=1 (3 Minutes)
5) Create different meaningful shapes using the pictures below. (3 Minutes)
6) Find different ways to reach from A to F in the figure. (2 Minutes)
7) Write different methods of filling 3 liters of milk with 1 liter, .5 liter and .25 liter containers.
Eg: 3L = 1, ½, ¼, ¼ , 1 (3 Minutes)
8) Write the numbers in which the sum of the digits is 9.
Eg: 18, 1+8=9 (3 Minutes)
9) Make a variety of shapes using four squares.
Eg: (3 Minutes)
10) Write numbers that can be made with five ones.
Eg: 1 1 1 1 1 (3 Minutes)
A
B D
F
E C
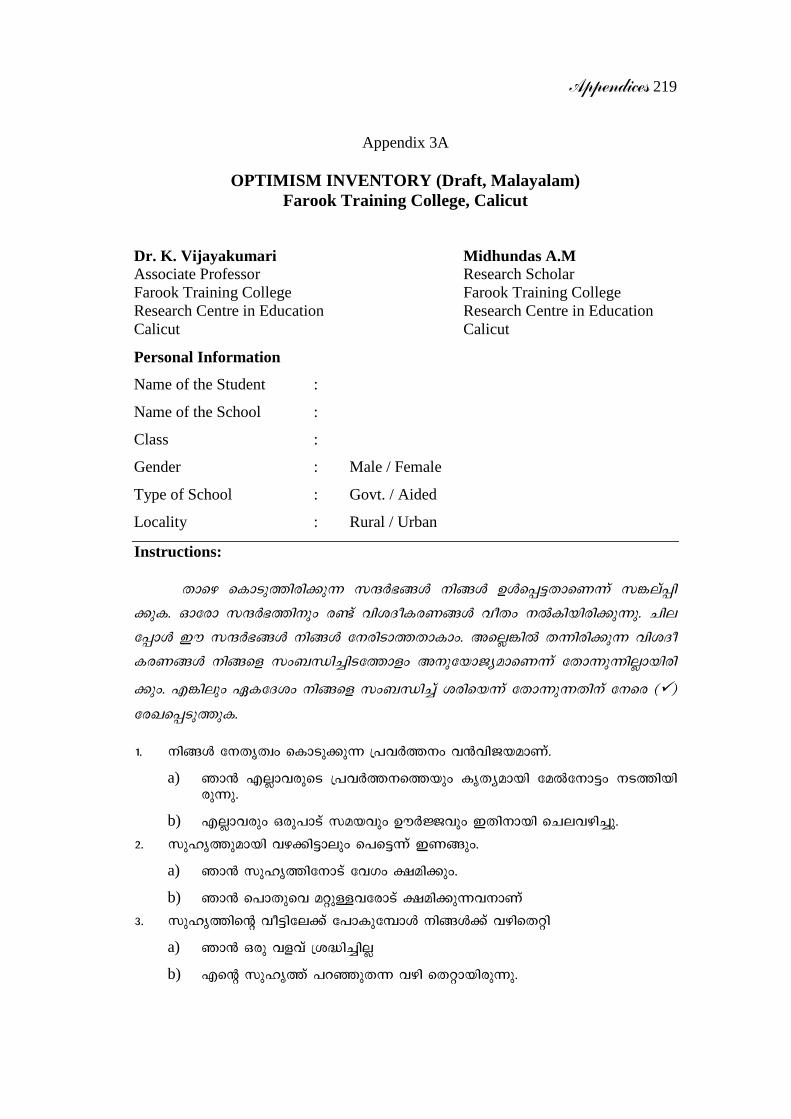
Appendices 219
Appendix 3A
OPTIMISM INVENTORY (Draft, Malayalam) Farook Training College, Calicut
Dr. K. Vijayakumari Midhundas A.M Associate Professor Research Scholar Farook Training College Farook Training College Research Centre in Education Research Centre in Education Calicut Calicut
Personal Information
Name of the Student :
Name of the School :
Class :
Gender : Male / Female
Type of School : Govt. / Aided
Locality : Rural / Urban
Instructions:
Xmsg sIm-Sp-¯n-cn-¡p-¶ k-µÀ- -̀§Ä \n-§Ä DÄ-s¸-«-Xm-sW-¶v k-¦-ev-̧ n-
¡pI. Hmtcm k-µÀ-̀ -¯n\pw c-−v hn-i-Zo-I-c-W-§Ä ho-Xw \Â-In-b-n-cn-¡p¶p. Nn-e-
t¸mÄ Cu k-µÀ-`-§Ä \n-§Ä t\-cn-Sm-¯-Xm-Imw. A-sÃ-¦n X-¶n-cn-¡p-¶ hn-i-Zo-
I-c-W-§Ä \n§-sf kw-_-Ôn-¨n-S-t¯m-fw A\p-tbm-Py-am-sW-¶v tXm-¶p-¶nÃm-bn-cn-
¡pw. F-¦nepw G-I-tZ-iw \n§-sf kw-_-Ôn-¨v i-cn-sb-¶v tXm-¶p-¶-Xn-\v t\-sc ()
tc-J-s¸-Sp-¯pI.
1. \n§Ä t\-XrXzw sIm-Sp-¡p-¶ {]-hÀ¯-\w h³-hn-P-b-amWv.
a) Rm³ FÃm-h-cp-sS {]-hÀ-¯-\-s¯bpw Ir-Xy-am-bn taÂ-t\m-«w \-S-¯n-bn-cp¶p.
b) FÃm-h-cp-w H-cp-]m-Sv k-a-bhpw DuÀ-Öhpw C-Xn-\m-bn sN-e-h-gn¨p.
2. kp-lr-¯p-am-bn h-g-¡n-«mepw s]-s«-¶v C-W-§pw.
a) Rm³ kp-lr-¯n-t\m-Sv th-Kw £-an-¡pw.
b) Rm³ s]m-Xp-sh aäpÅ-h-tcmSv £-an-¡p-¶-h-\mWv
3. kp-lr-¯n-sâ ho-«n-te-¡v t]m-Ip-t¼mÄ \n§Ä¡v h-gn-sX-än
a) Rm³ H-cp hf-hv {i-²n-¨nÃ
b) F-sâ kp-lr-¯v ]-d-ªp-X-¶ h-gn sX-äm-bn-cp¶p.

Appendices 220
4. kp-lr-¯v Hcp k-½m-\wX-¶v \n§sf A-Ûp-X-s¸-Sp¯n.
a) kp-lr-¯n-\v ]-co-£-bn D-bÀ-¶ amÀ-¡v e-`n¨p.
b) I-gn-ª Znh-kw Rm\pw H-cp k-½m-\w \Â-In-bn-cp¶p.
5. kp-lr-¯n-sâ ]n-d-¶mÄ \n§Ä a-dp¶p-t]mbn.
a) Rm³ C§-s\ Zn-\§Ä HmÀ-¯p-sh-¡p-¶-Xn ]n-d-tIm-«mWv.
b) Rm³ ]-e Im-cy-§-fm Xn-c-¡n-em-bn-cp¶p.
6. kv-Iq-fn-se Hcp Ip-«n-bn \n¶pw \n§Ä¡v A\p-tamZ-\w e-`n¨p.
a) F-s¶ A-hÀ-¡v hf-sc C-ã-amWv.
b) Rm³ hf-sc {]-i-kv-X\m-b B-fmWv.
7. kv-IqÄ eo-UÀ Øm-\-t¯-¡v ]-cn-{i-an-¨p \n§Ä A-Xn hn-P-bn¨p.
a) Rm³ H-cp-]m-Sv k-a-bhpw DuÀ-Öhpw {]-N-c-W-¯n-\m-bn sN-e-h-gn¨p.
b) sN-¿p-¶-sX-´n\pw Rm³ \-¶m-bn I-ã-s¸-Spw.
8. \n§Ä kv-Iq-fn-se {]-[m-\-s¸-« H-cp ]-cn-]m-Sn a-d¶p-t]m-bn.
a) Nn-e k-ab-¯v Fsâ HmÀ-½ i-àn ]n-d-tIm-«mWv.
b) Rm³ F-sâ kv-IqÄ Ub-dn t\m-¡m³ a-d¶p-t]mbn.
9. kvIqÄ Xn-c-sª-Sp-¸n \n-§Ä ]-cm-P-b-s¸«p.
a) Rm³ \-¶m-bn {]-Nc-Ww \-S-¯n-bnÃ.
b) C-Xn hn-P-bn-¨ Ip-«n-¡v H-cp-]m-Sv Ip-«n-I-fp-am-bn \Ã_-Ôw D-−m-bn-cp¶p.
10. hnP-b-I-c-am-bn {]-kw-Kn-¡m-³ \n-§Ä-¡v km-[n¨p.
a) Rm³ A-¶v hfsc DuÀ-Ön-X-\m-bn-cp¶p.
b) Rm³ \-sÃm-cp A-h-Xm-c-I-\mWv.
11. IrXy-k-ab-¯v A-[n-Im-cnI-sf A-dn-bn-¨-Xn-\m H-cp Ip-ä-IrXyw X-S-bm³ \n-§Ä-¡v I-gnªp.
a) A-]-cn-Nn-X-am-b Ft´m H-¶v F-sâ {i-²-bnÂ-s¸«p.
b) Rm³ A-¶v hf-sc {i-²m-Ip-e-\m-bn-cp¶p.
12. \n§Ä F-t¸mgpw hf-sc B-tcm-Ky-hm-\mWv.
a) A-kp-J-ap-Å-h-cp-am-bn Rm³ A-[n-Iw A-Sp-¯v C-S-s]-Sm-dnÃ.
b) Rm³ Ir-Xy-k-ab-¯v `-£-Whpw hn-{i-ahpw D-d-̧ p-h-cp-¯m-dp−v.
13. \n§Ä ]-d-ª Znh-kw sse-{_-dn ]p-kvX-Iw Xn-cn-¨p-\Â-Im-¯-Xn-\v ]n-g A-S-t¡-−n h¶p.
a) hm-b-\-bn ap-gp-In-b-t¸mÄ ]p-kvX-Iw Xn-cn-¨p \Â-tI-− Znh-kw a-d¶p-t]mbn.
b) ]co-£-bp-sS Xn-c-¡n-em-bn-cp¶p.
14. K-Wn-X-im-kv-{Xta-f-bn \n§Ä¡ H¶mw k-½m-\w e-`n¨p.
a) ]pXn-b Im-cy-§Ä I-−p-]-n-Sn-¡m³ Rm³ B-{K-ln-¡p¶p.

Appendices 221
b) KWn-X A-[ym-]-I³ hf-sc {]-i-kv-X-\mWv.
15. \n§Ä H-cp A-Xv-e-än-Iv ao-än hn-P-bn-¨p.
a) tXm-äp-sIm-Sp-¡m³ C-ã-s¸-Sm-¯ hy-àn-bmWv Rm³.
b) Rm³ H-cp-]m-Sv ]-cn-{i-an¨p.
16. \n§Ä {][m-\ ]-co-£-bn Rm³ tXmäp-t]mbn.
a) a-äp Ip-«n-IÄ F-t¶-¡mÄ an-I-¨-h-cm-bn-cp¶p.
b) Rm³ \-¶m-bn X-¿m-sd-Sp-¯nÃ.
17. \n§Ä kp-lr-¯n-\v H-cp Nn{Xw hc-¨v sIm-Sp-¯-t¸mÄ kp-lr-¯v A-Xv th-−-hn-[-¯n Ku-\n-¨nÃ.
a) Rm³ \-sÃm-cp Nn-{X-Im-c\Ã.
b) Rm³ Xn-c-¡p-]n-Sn-¨m-Wv B Nn{Xw h-c-¨Xv.
18. ]-co-£- F-gp-Xn-s¡m-−n-cn-s¡ t]-\-bp-sS a-jn XoÀ¶p-t]mbn.
a) t]-\-bn a-jn Dt−m F-¶v Rm³ t\m-¡n-bn-cp-¶nÃ.
b) C{X-b-[n-Iw F-gp-tX-−n h-cp-sa-¶v F-\n-¡-dn-bnÃm-bn-cp¶p.
19. kp-lr¯n-t\m-Sv \n-§Ä tZ-jy-s¸«p.
a) Fs¶ F-t¸mgpw Ipä-s¸-Sp-¯n-s¡m-−n-cn¡pw.
b) B k-ab-s¯ kp-lr-¯n-sâ s]-cp-am-äw i-cn-bm-bnÃ.
20. H-cp sKbnw \-S-¶p-sIm-−n-cn-s¡ \n§sf I-fn-bn-te-¡v £-Wn¨p.
a) Rm³ ap³-\n-c-bn C-cn-¡p-¶p-−m-bn-cp¶p.
b) F-s¶-bm-Wv G-ähpw B-th-i-t¯m-sS I-fn-Im-Wp-¶ H-cm-fm-bn A-hÀ-¡v tXm-¶n-bXv.
21. Km-Ôn-P-b´n-tbm-S-\p-_-Ôn-¨p-Å tk-h-\-hm-cw ]-cn-]m-Sn-¡v \n§-tfmSv t\-XrXzw \Â-Im³ B-h-iy-s¸«p.
a) Rm³ B ]-cn-]m-Sn-bn \n-¶pw hn-«p-\nÂ-¡pw.
b) Rm³ B ]-cn-]m-Sn hf-sc Ir-Xy-am-bn \nÀ-Æ-ln-¡pw.
22. \n§Ä kp-lr-¯n-\v H-cp k-½m-\w hm-§n ]-t£ kp-lr-¯n-\v A-Xv C-ã-am-bnÃ.
a) A-§-s\-bp-Å Im-cy-§-fn Rm³ A-{X {i-²n-¡m-dnÃ.
b) F-sâ kp-lr-¯n-sâ C-ã§-Ä h-f-sc hy-Xy-kv-X-amWv.
23. \n§Ä H-cp sk-an-\mÀ \-¶m-bn A-h-X-cn-¸n¨p.
a) B k-ab-¯v F-\n-¡v \-Ã ss[cyw In-«n-bn-cp¶.p
b) Rm³ \-¶m-bn ]-cn-{i-an-¨n-cp¶p.
24. \n§-fp-sS Xam-i FÃm-h-scbpw Nn-cn-¸n¨p.
a) AXv hf-sc lm-ky-I-c-am-bn-cp¶p.
b) F-sâ ka-bw hf-sc \-¶m-bn-cp¶p.
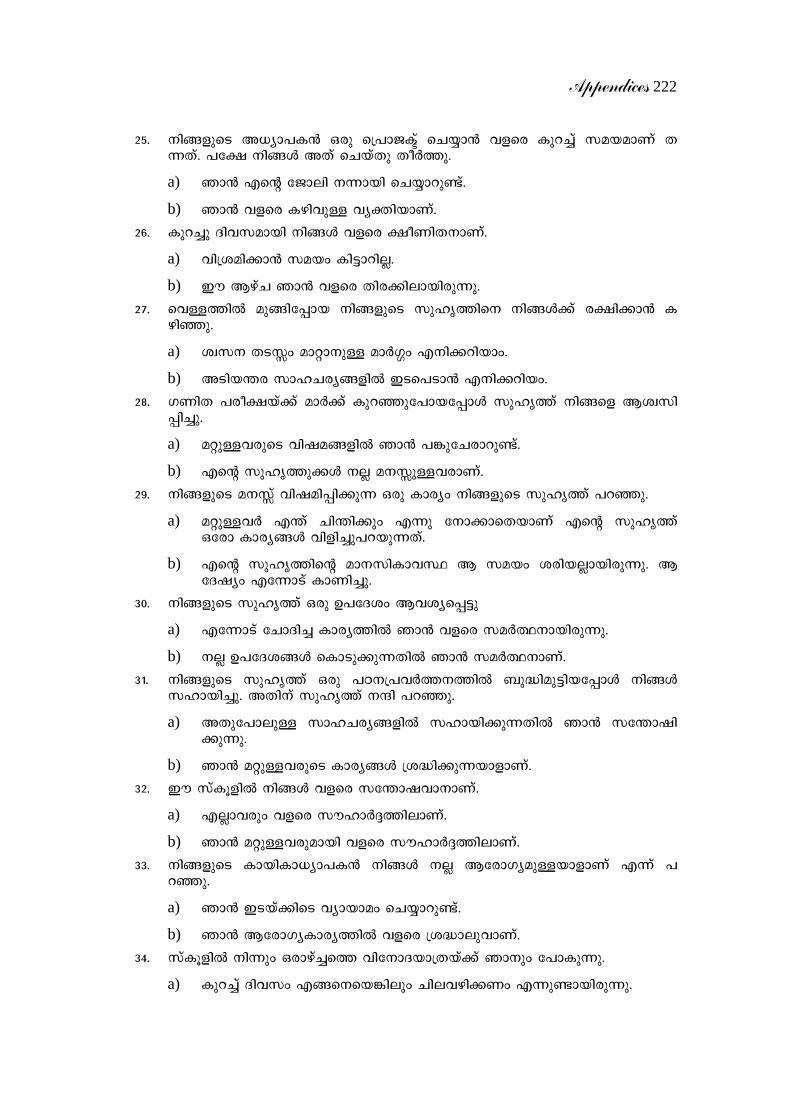
Appendices 222
25. \n§-fp-sS A-[ym-]-I³ H-cp s{]mP-Îv sN-¿m³ h-f-sc Ipd-¨v k-a-b-am-Wv X-¶Xv. ]-t£ \n§Ä A-Xv sN-bv-Xp XoÀ¯p.
a) Rm³ F-sâ tPm-en \-¶m-bn sN-¿m-dp−v.
b) Rm³ h-f-sc I-gn-hp-Å hy-àn-bmWv.
26. Ipd-¨p Znh-k-ambn \n§Ä hfsc £o-Wn-X-\m-Wv.
a) hn-{i-an-¡m³ ka-bw In-«m-dnÃ.
b) Cu Bgv-N Rm³ hf-sc Xn-c-¡n-em-bn-cp¶p.
27. sh-Å-¯n ap-§n-t¸m-b \n§-fp-sS kp-lr-¯n-s\ \n-§Ä¡v c-£n-¡m³ I-gnªp.
a) iz-k-\ XS-Êw am-äm-\p-Å amÀ-¤w F-\n-¡-dn-bmw.
b) A-Snb- -́c km-l-N-cy-§-fn C-S-s]-Sm³ F-\n-¡-dnbw.
28. K-Wn-X ]co-£-bv¡v amÀ-¡v Ip-dªp-t]m-b-t¸mÄ kp-lr-¯v \n§sf B-iz-kn-¸n¨p.
a) aäp-Å-h-cp-sS hn-j-a-§-fn Rm³ ]-¦p-tN-cm-dp−v.
b) Fsâ kp-lr-¯p-¡Ä \Ã a-\-Êp-Å-h-cmWv.
29. \n§-fp-sS a-\-Êv hn-j-an-¸n-¡p-¶ H-cp Imcyw \n§-fp-sS kp-lr-¯v ]-dªp.
a) a-äp-Å-hÀ F- v́ Nn-´n¡pw F-¶p t\m-¡m-sX-bm-Wv F-sâ kp-lr- v̄ Htcm Im-cy-§Ä hn-fn-¨p-]-d-bp-¶Xv.
b) F-sâ kp-lr-¯n-sâ am-\-kn-Im-hØ B ka-bw i-cn-bÃm-bn-cp¶p. B tZjyw F-t¶m-Sv Im-Wn¨p.
30. \n§-fp-sS kp-lr-¯v H-cp D]tZiw Bhiy-s¸«p
a) F-t¶m-Sv tNm-Zn-¨ Im-cy-̄ n Rm³ hf-sc k-aÀ-°-\m-bn-cp¶p.
b) \à D-]-tZ-i-§Ä sIm-Sp-¡p-¶-Xn Rm³ k-aÀ-°-\mWv.
31. \n§-fpsS kp-lr-¯v H-cp ]T\-{]-hÀ-¯-\-¯n _p-²n-ap-«n-b-t¸mÄ \n§Ä k-lm-bn¨p. A-Xn-\v kp-lr-¯v \-µn ]-dªp.
a) AXp-t]m-ep-Å km-l-N-cy-§-fn k-lm-bn-¡p-¶-Xn Rm³ k-t´m-jn-¡p¶p.
b) Rm³ a-äp-Å-h-cp-sS Im-cy-§Ä {i-²n-¡p-¶-bm-fmWv.
32. Cu kv-Iq-fn \n§Ä hf-sc k-t´m-j-hm-\mWv.
a) FÃm-hcpw hf-sc ku-lmÀ-±-¯n-emWv.
b) Rm³ a-äp-Å-h-cp-am-bn hf-sc ku-lmÀ-±-¯n-emWv.
33. \n§-fpsS Im-bn-Im-[ym-]-I³ \n-§Ä \à B-tcm-Ky-ap-Å-bm-fm-Wv F-¶v ]-dªp.
a) Rm³ C-S-bv-¡n-sS hym-bm-aw sN-¿m-dp-−v.
b) Rm³ B-tcm-Ky-Im-cy-¯n hf-sc {i-²m-ep-hmWv.
34. kv-Iq-fn \n¶pw H-cm-gv¨-s¯ hn-t\m-Z-bm-{X-bv-¡v Rm\pw t]m-Ip¶p.
a) Ipd-¨v Znh-kw F-§-s\-sb-¦nepw Nn-e-h-gn¡-Ww F-¶p-−m-bn-cp¶p.

Appendices 223
b) ]pXn-b ]p-Xn-b Ø-e-§Ä Im-Wm³ C-ã-amWv.
35. \n§-tfmSv A-an-X-am-bn a-[p-cw I-gn-¡-cp-Xv F-¶v tUm-ÎÀ A-`n-{]m-b-s¸«p.
a) `-£-W-Im-cy-§-fn Rm³ A-{X {i-²m-ephÃ.
b) F-\n-¡v a-[p-cw H-gn-hm-¡m-\m-hnÃ. FÃm-¯n\pw a-[p-cw thWw.
36. ¢m-kn-se H-cp {]-hÀ¯-\w \n-b-{´n-¡m³ ¢m-kv So¨À B-h-iy-s¸«p.
a) A-Xn-\p k-am-\am-b H-cp {]-hÀ¯-\w Rm³ hn-P-b-I-c-am-bn ]qÀ-¯n-bm-¡n-bn-cp¶p.
b) Rm³ \-sÃm-cp \n-co-£-I\mWv.
37. \n§fpw kp-lr¯pw Ip-d-¨p-Im-e-am-bn h-g-¡n-emWv.
a) Cu-bn-sS-bm-bn F-sâ a\-Êv H«pw i-cnbÃ.
b) Ipd-¨p Im-e-am-bn F-sâ kp-lr-¯v H-cp i-{Xp-a-t\m-`m-h-am-Wv Im-Wn-¡p-¶Xv.
38. \n§Ä KWn-X ]-co-£-bn tXmäp-t]mbn.
a) ]co-£ hf-sc _p-²n-ap-«m-bn-cp¶p.
b) FÃm tNm-Zy-§fpw a-\-Ên-em-¡m³ X-s¶ ]-äm-¯-Xm-bn-cp¶p.
39. \n§sf ¢m-kv eo-U-dm-bn \n-b-an¨p.
a) Rm³ ¢m-kn-se H-cp {][m-\ {]-iv-\w ]-cn-l-cn¨p.
b) Rm³ B-bn-cp-¶p ¢m-kn-se an-I-¨ hn-ZymÀ°n.
40. Cu I-gn-ª -]-co-£-bn In«n-b amÀ-¡v \n§-fpsS C-Xp-h-sc e-̀ n-¨p-h-¶ amÀ-¡p-I-fn G-ähpw Ip-d-ª-XmWv.
a) C-t¸mg-s¯ ]-co-£-sb-¡p-dn-¨v \-sÃm-cp [m-c-W F-\n-¡nÃm-bn-cp¶p.
b) \n§Ä {]-[m-\-s¸-«-Xm-Wv F-¶v I-cp-Xn ]Tn-¨-sXm¶pw ]-co-£-bv-¡v tNm-Zn-¨nÃ.
41. kvIq-fn \-S¯n-b H-cp \-dp-s¡-Sp-̧ v a-Õ-c-¯n \n-§Ä-¡v k-½m-\w e-`n-¡p-I-bm-sW-¦nÂ
a) AXn-\p-Å km[y-X hf-sc Ip-d-hmWv
b) A\p-tbm-Pyam-b H-cp \-¼-dm-Wv Rm³ Xn-c-sª-Sp¯Xv

Appendices 224
Appendix 3B
OPTIMISM INVENTORY (Final, Malayalam) Farook Training College, Calicut
Dr. K. Vijayakumari Midhundas A.M Associate Professor Research Scholar Farook Training College Farook Training College Research Centre in Education Research Centre in Education Calicut Calicut
Personal Information
Name of the Student :
Name of the School :
Class :
Gender : Male / Female
Type of School : Govt. / Aided
Locality : Rural / Urban
Instructions:
Xmsg sIm-Sp-¯n-cn-¡p-¶ k-µÀ-`-§Ä \n-§Ä DÄ-s¸-«-Xm-sW-¶v k-¦-ev-¸n-¡pI.
Hmtcm k-µÀ-`-¯n\pw c-−v hn-i-Zo-I-c-W-§Ä ho-Xw \Â-In-b-n-cn-¡p¶p. Nn-e-t¸mÄ
Cu k-µÀ-`-§Ä \n-§Ä t\-cn-Sm-¯-Xm-Imw. A-sÃ-¦n X-¶n-cn-¡p-¶ hn-i-Zo-I-c-W-
§Ä \n§-sf kw-_-Ôn-¨n-S-t¯m-fw A\p-tbm-Py-am-sW-¶v tXm-¶p-¶nÃm-bn-cn-¡pw.
F-¦nepw G-I-tZ-iw \n§-sf kw-_-Ôn-¨v i-cn-sb-¶v tXm-¶p-¶-Xn-\v t\-sc () tc-J-
s¸-Sp-¯pI.
1. \n§Ä t\-XrXzw sIm-Sp-¡p-¶ {]-hÀ¯-\w h³-hn-P-b-amWv.
a) Rm³ FÃm-h-cp-sS {]-hÀ-¯-\-s¯bpw Ir-Xy-am-bn taÂ-t\m-«w \-S-¯n-bn-cp¶p.
b) FÃm-h-cp-w H-cp-]m-Sv k-a-bhpw DuÀ-Öhpw C-Xn-\m-bn sN-e-h-gn¨p.
2. kp-lr-¯p-am-bn h-g-¡n-«mepw s]-s«-¶v C-W-§pw.
a) Rm³ kp-lr-¯n-t\m-Sv th-Kw £-an-¡pw.
b) Rm³ s]m-Xp-sh aäpÅ-h-tcmSv £-an-¡p-¶-h-\mWv
3. kp-lr-¯v Hcp k-½m-\wX-¶v \n§sf A-Ûp-X-s¸-Sp¯n.
a) kp-lr-¯n-\v ]-co-£-bn D-bÀ-¶ amÀ-¡v e-`n¨p.
b) I-gn-ª Znh-kw Rm\pw H-cp k-½m-\w \Â-In-bn-cp¶p.

Appendices 225
4. kp-lr-¯n-sâ ]n-d-¶mÄ \n§Ä a-dp¶p-t]mbn.
a) Rm³ C§-s\ Zn-\§Ä HmÀ-¯p-sh-¡p-¶-Xn ]n-d-tIm-«mWv.
b) Rm³ ]-e Im-cy-§-fm Xn-c-¡n-em-bn-cp¶p.
5. \n§Ä kv-Iq-fn-se {]-[m-\-s¸-« H-cp ]-cn-]m-Sn a-d¶p-t]m-bn.
a) Nn-e k-ab-¯v Fsâ HmÀ-½ i-àn ]n-d-tIm-«mWv.
b) Rm³ F-sâ kv-IqÄ Ub-dn t\m-¡m³ a-d¶p-t]mbn.
6. kvIqÄ Xn-c-sª-Sp-¸n \n-§Ä ]-cm-P-b-s¸«p.
a) Rm³ \-¶m-bn {]-Nc-Ww \-S-¯n-bnÃ.
b) C-Xn hn-P-bn-¨ Ip-«n-¡v H-cp-]m-Sv Ip-«n-I-fp-am-bn \Ã_-Ôw D-−m-bn-cp¶p.
7. \n§Ä F-t¸mgpw hf-sc B-tcm-Ky-hm-\mWv.
a) A-kp-J-ap-Å-h-cp-am-bn Rm³ A-[n-Iw A-Sp-¯v C-S-s]-Sm-dnÃ.
b) Rm³ Ir-Xy-k-ab-¯v `-£-Whpw hn-{i-ahpw D-d-̧ p-h-cp-¯m-dp−v.
8. \n§Ä ]-d-ª Znh-kw sse-{_-dn ]p-kvX-Iw Xn-cn-¨p-\Â-Im-¯-Xn-\v ]n-g A-S-t¡-−n h¶p.
a) hm-b-\-bn ap-gp-In-b-t¸mÄ ]p-kvX-Iw Xn-cn-¨p \Â-tI-− Znh-kw a-d¶p-t]mbn.
b) ]co-£-bp-sS Xn-c-¡n-em-bn-cp¶p.
9. K-Wn-X-im-kv-{Xta-f-bn \n§Ä¡ H¶mw k-½m-\w e-`n¨p.
a) ]pXn-b Im-cy-§Ä I-−p-]-n-Sn-¡m³ Rm³ B-{K-ln-¡p¶p.
b) KWn-X A-[ym-]-I³ hf-sc {]-i-kv-X-\mWv.
10. \n§Ä H-cp A-Xv-e-än-Iv ao-än hn-P-bn-¨p.
a) tXm-äp-sIm-Sp-¡m³ C-ã-s¸-Sm-¯ hy-àn-bmWv Rm³.
b) Rm³ H-cp-]m-Sv ]-cn-{i-an¨p.
11. \n§Ä kp-lr-¯n-\v H-cp Nn{Xw hc-¨v sIm-Sp-¯-t¸mÄ kp-lr-¯v A-Xv th-−-hn-[-¯n Ku-\n-¨nÃ.
a) Rm³ \-sÃm-cp Nn-{X-Im-c\Ã.
b) Rm³ Xn-c-¡p-]n-Sn-¨m-Wv B Nn{Xw h-c-¨Xv.
12. H-cp sKbnw \-S-¶p-sIm-−n-cn-s¡ \n§sf I-fn-bn-te-¡v £-Wn¨p.
a) Rm³ ap³-\n-c-bn C-cn-¡p-¶p-−m-bn-cp¶p.
b) F-s¶-bm-Wv G-ähpw B-th-i-t¯m-sS I-fn-Im-Wp-¶ H-cm-fm-bn A-hÀ-¡v tXm-¶n-bXv.
13. Km-Ôn-P-b´n-tbm-S-\p-_-Ôn-¨p-Å tk-h-\-hm-cw ]-cn-]m-Sn-¡v \n§-tfmSv t\-XrXzw \Â-Im³ B-h-iy-s¸«p.
a) Rm³ B ]-cn-]m-Sn-bn \n-¶pw hn-«p-\nÂ-¡pw.
b) Rm³ B ]-cn-]m-Sn hf-sc Ir-Xy-am-bn \nÀ-Æ-ln-¡pw.

Appendices 226
14. Ipd-¨p Znh-k-ambn \n§Ä hfsc £o-Wn-X-\m-Wv.
a) hn-{i-an-¡m³ ka-bw In-«m-dnÃ.
b) Cu Bgv-N Rm³ hf-sc Xn-c-¡n-em-bn-cp¶p.
15. \n§-fp-sS a-\-Êv hn-j-an-¸n-¡p-¶ H-cp Imcyw \n§-fp-sS kp-lr-¯v ]-dªp.
a) a-äp-Å-hÀ F- v́ Nn-´n¡pw F-¶p t\m-¡m-sX-bm-Wv F-sâ kp-lr- v̄ Htcm Im-cy-§Ä hn-fn-¨p-]-d-bp-¶Xv.
b) F-sâ kp-lr-¯n-sâ am-\-kn-Im-hØ B ka-bw i-cn-bÃm-bn-cp¶p. B tZjyw F-t¶m-Sv Im-Wn¨p.
16. \n§-fp-sS kp-lr-¯v H-cp D]tZiw Bhiy-s¸«p
a) F-t¶m-Sv tNm-Zn-¨ Im-cy-̄ n Rm³ hf-sc k-aÀ-°-\m-bn-cp¶p.
b) \à D-]-tZ-i-§Ä sIm-Sp-¡p-¶-Xn Rm³ k-aÀ-°-\mWv.
17. Cu kv-Iq-fn \n§Ä hf-sc k-t´m-j-hm-\mWv.
a) FÃm-hcpw hf-sc ku-lmÀ-±-¯n-emWv.
b) Rm³ a-äp-Å-h-cp-am-bn hf-sc ku-lmÀ-±-¯n-emWv.
18. \n§-fpsS Im-bn-Im-[ym-]-I³ \n-§Ä \à B-tcm-Ky-ap-Å-bm-fm-Wv F-¶v ]-dªp.
a) Rm³ C-S-bv-¡n-sS hym-bm-aw sN-¿m-dp-−v.
b) Rm³ B-tcm-Ky-Im-cy-¯n hf-sc {i-²m-ep-hmWv.
19. kv-Iq-fn \n¶pw H-cm-gv¨-s¯ hn-t\m-Z-bm-{X-bv-¡v Rm\pw t]m-Ip¶p.
a) Ipd-¨v Znh-kw F-§-s\-sb-¦nepw Nn-e-h-gn¡-Ww F-¶p-−m-bn-cp¶p.
b) ]pXn-b ]p-Xn-b Ø-e-§Ä Im-Wm³ C-ã-amWv.
20. \n§-tfmSv A-an-X-am-bn a-[p-cw I-gn-¡-cp-Xv F-¶v tUm-ÎÀ A-`n-{]m-b-s¸«p.
a) `-£-W-Im-cy-§-fn Rm³ A-{X {i-²m-ephÃ.
b) F-\n-¡v a-[p-cw H-gn-hm-¡m-\m-hnÃ. FÃm-¯n\pw a-[p-cw thWw.
21. ¢m-kn-se H-cp {]-hÀ¯-\w \n-b-{´n-¡m³ ¢m-kv So¨À B-h-iy-s¸«p.
a) A-Xn-\p k-am-\am-b H-cp {]-hÀ¯-\w Rm³ hn-P-b-I-c-am-bn ]qÀ-¯n-bm-¡n-bn-cp¶p.
b) Rm³ \-sÃm-cp \n-co-£-I\mWv.
22. \n§fpw kp-lr¯pw Ip-d-¨p-Im-e-am-bn h-g-¡n-emWv.
a) Cu-bn-sS-bm-bn F-sâ a\-Êv H«pw i-cnbÃ.
b) Ipd-¨p Im-e-am-bn F-sâ kp-lr-¯v H-cp i-{Xp-a-t\m-`m-h-am-Wv Im-Wn-¡p-¶Xv.
23. \n§sf ¢m-kv eo-U-dm-bn \n-b-an¨p.
a) Rm³ ¢m-kn-se H-cp {][m-\ {]-iv-\w ]-cn-l-cn¨p.

Appendices 227
b) Rm³ B-bn-cp-¶p ¢m-kn-se an-I-¨ hn-ZymÀ°n.
24. Cu I-gn-ª -]-co-£-bn In«n-b amÀ-¡v \n§-fpsS C-Xp-h-sc e-̀ n-¨p-h-¶ amÀ-¡p-I-fn G-ähpw Ip-d-ª-XmWv.
a) C-t¸mg-s¯ ]-co-£-sb-¡p-dn-¨v \-sÃm-cp [m-c-W F-\n-¡nÃm-bn-cp¶p.
b) \n§Ä {]-[m-\-s¸-«-Xm-Wv F-¶v I-cp-Xn ]Tn-¨-sXm¶pw ]-co-£-bv-¡v tNm-Zn-¨nÃ.
25. kvIq-fn \-S¯n-b H-cp \-dp-s¡-Sp-̧ v a-Õ-c-¯n \n-§Ä-¡v k-½m-\w e-`n-¡p-I-bm-sW-¦nÂ
a) AXn-\p-Å km[y-X hf-sc Ip-d-hmWv
b) A\p-tbm-Pyam-b H-cp \-¼-dm-Wv Rm³ Xn-c-sª-Sp¯Xv

Appendices 228
Appendix 3C
OPTIMISM INVENTORY (Final, English) Farook Training College, Calicut
Dr. K. Vijayakumari Midhundas A.M Associate Professor Research Scholar Farook Training College Farook Training College Research Centre in Education Research Centre in Education Calicut Calicut
Personal Information
Name of the Student :
Name of the School :
Class :
Gender : Male / Female
Type of School : Govt. / Aided
Locality : Rural / Urban
Instructions: Imagine that you are involved in the following situations. Two explanations are
given for each situations. Sometimes you may have encountered these situations or
the explanations give may not seem appropriate to you. However mark () against
what seems to be almost correct about you.
1. The activities that you monitored are always a success
a) I regularly monitored the activities of all.
b) All of them spent a lot of time and energy for their work.
2. Though I quarrel with my friend, I can befriend him again shortly.
a) I will forgive him soon.
b) I am generous to forgive others.
3. My friend surprised me by giving a gift.
a) Friend got high score in exam.
b) I also gave a gift last day.
4. You forgot the birthday of your friend.
a) I am very weak to remember those days.
b) I was busy with other things.

Appendices 229
5. You forgot an important event at school.
a) Sometimes my memory is backwards.
b) I forgot to look at my school diary.
6. You failed the election.
a) I did not make a good campaign.
b) The student who win the election had good relationship with many studnets.
7. You are always healthy.
a) I used to keep distance from sick persons.
b) I used to maintain food and rest on time.
8. As I couldn’t return the book on due date from the library, I had to pay fine.
a) Forgot myself in reading.
b) I was busy with exam preparation.
9. You got first prize in mathematics fair.
a) I like to explore new ideas.
b) Maths teacher is very famous.
10. You won an athletic meet.
a) I never like to give up.
b) I tried a lot.
11. You drew a picture and gave it to your friend, but he didn't give much attention to it.
a) I am not a good artist
b) I drew the picture in a hurry
12. You were invited to a game which was going on.
a) I was sitting in the front row
b) They found me as an enthusiastic audient.
13. I am asked to take leadership on Gandhijayanti labour week programme.
a) I will abstain from the programme.
b) I will participate and complete the programme effectively.
14. You have been very tired for a few days.
a) Not get enough time for rest
b) I was so busy in this week.
15. Your friend told something that hurt you.
a) My friend used to talk without concerning what others will think.

Appendices 230
b) My friend’s mind was not good at that time and showed his anger towards me.
16. Your friend asked for an advice
a) I was an expert in that matter.
b) I am an expert in giving advices
17. You are happy in this school.
a) All are very friendly.
b) I am friendly with others.
18. Your physical trainers said that you are very healthy.
a) I often do exercises.
b) I am very conscious in my health.
19. I am going to the one week vecation trip from school.
a) Anyway I want to spend some days.
b) I like to see new places.
20. Doctor adviced you not to eat too much sweets.
a) I am not careful in my food habits.
b) I can not avoid sweets, everything needs to be sweet.
21. The class teacher was asked to control an activity in the class.
a) I have successfully completed a similar activity.
b) I am a good observer.
22. You and your friends have been at loggerheads for some time.
a) Now a days my mind is not well.
b) My friend shows enemity towards me for few days.
23. You are appointed as the class leader.
a) I solved a major problem in the class.
b) I was the best student in the class.
24. The marks you got in this last exam are the lowest marks you have got yet.
a) I did not have clear idea about this examination.
b) Those content which you considered as important were excluded in the exam.
25. If you win a prize in a draw held at school.
a) Chances for that is very small.
b) I chose a suitable number.

Appendices 231
Appendix 4A
SCALE ON ACADEMIC STRESS (Final, Malayalam) Farook Training College, Calicut
Dr. K. Vijayakumari Sajmadas K.K Midhundas A.M Associate Professor Research Scholar Research Scholar Farook Training College Farook Training College Farook Training College Personal Information
Name of the Student :
Name of the School :
Class :
Gender : Male / Female
Type of School : Govt. / Aided
Locality : Rural / Urban
\nÀt±-i-§Ä
\n§-fpsS ]T-\-hp-ambn _Ô-s¸« Nne {]kvXm-h-\-I-fmWv Xmsg sIm-
Sp-¯n-cn-¡p-¶Xv. Hmtcm {]kvXm-h-\bpw hmbn v̈ \n§Ä AXn-t\mSv F{X-
t¯mfw tbmPn-¡p¶p AsÃ-¦n hntbm-Pn-¡p¶p F¶v Xmsg sIm-Sp-¯n-cn-
¡p¶ kqNnI D]-tbm-Kn v̈ {]kvXm-h-\¡v t\sc sIm-Sp-¯n-cn-¡p¶ Øe¯v
\¼-dn«v tcJ-s¸-Sp-¯p-I. \n§-fpsS D¯-c-§Ä Kth-j-Wm-h-iy-¯n\v am{Xta
D]-tbm-K-s¸-Sp-¯p-I-bpÅp F¶v Dd¸v Xcp-¶p. \n§-fpsS {]tXyIw X¶n-cn-
¡p¶ D¯-c-¡-S-em-kn tcJ-s¸-Sp-¯p-I.
{Ia- \-¼À
{]kvXm-h\
1 Nn-e A-[ym-]-IÀ ]Tn-¸n-¡p-¶ ]mT-`m-K-¯n-se D-ÅS-¡w Xo-sc a-\-kn-em-Ip-¶nÃ.
2 Nn-e A-[ym-]-I-cp-sS ]-cn-io-e-\ ]-²-Xnbpw dn-t¸mÀ-«p-Ifpw hf-sc IÀ-i\-am-sW-¶v F-\n-¡v A-\p-`-h-s -̧Sp¶p.
3 sN-dpXpw h-ep-Xpam-b ]-co-£-IÄ-¡v Rm³ Iq-Sp-XÂ ka-bw Nn-e-h-gn-¡p-¶p.
4 A-Sp-¯n-sS \-S-¶ ¢m-kv ]-co-£m-^-e-§-fn Rm³ ]qÀ-® Xr-]v-X\Ã.

Appendices 232
{Ia- \-¼À
{]kvXm-h\
5 ]-co-£-I-sf-¡p-dn-¨p-Å D-Xv-IWvT Imc-Ww F-\n-¡v \-¶m-bn D-d-§m³ km-[n-¡m-dnÃ.
6 ]-co-£m-^-e-hp-am-bn _-Ô-s -̧«v c-£n-Xm-¡-fp-am-bn F-\n-¡v XÀ-¡n-t¡-−n h-cm-dp−v.
7 F-sâ C-t¸m-gp-Å ]-co-£m^-e-w bp.]n. kv-IqÄ ]-co-£m-^-e-hp-am-bn hf-sc A-[n-Iw hy-Xym-k-ap-Å-Xm-bn F-\n-¡v tXm-¶p¶p.
8 F-sâ ]T-\-s -̄¡p-dn-̈ v F-\n-¡v Ku-c-h-an-sÃ-¶v am-Xm-]n-Xm-¡Ä I-cp-Xp-¶p F-¶v F-\n-¡v tXm-¶p¶p.
9 Nn-e {]-_-Ô-§-fp-sS h-kv-Xp-¡fpw hn-h-c-§fpw ti-J-cn-¡p-¶-Xn-\v Iq-Sp-XÂ ka-bw Nn-e-h-gn-t¡-−n h-cp¶p.
10 Nn-e A-[ym-]-IÀ \Â-Ip-¶ \nÀ-t±-i-§-fp-sS th-K-X-bv-s¡m-̄ v F-¯m³ F-\n-¡v I-gn-bp-¶nÃ.
11 Nn-e A-[ym-]-I-cp-sS A-[ym-]-\-co-Xn-bp-am-bn s]m-cp- -̄s -̧Sm³ F-\n-¡v km-[n-¡m-dnÃ.
12 Nn-e A-[ym-]-IÀ \Â-Ip-¶ hn-h-c-§-fp-sS B-[nIyw ]T-\w ]qÀ-¯n-bm-¡p-¶-Xn\pw D-ÅS-¡w lr-Zy-Ø-am-¡p-¶-Xn\pw X-S-Ê-am-Ip¶p.
13 ]-co-£-mth-f-bn ]Tn-¨-Im-cy§Ä HmÀ-s -̄Sp-¡m³ F-\n-¡v I-gn-bp-¶nÃ.
14 s]m-Xp-]-co-£-bn ]-cm-P-b-s -̧«mÂ, ]-cm-P-b-s -̧« hn-j-b-§Ä ho−pw F-gp-tX-−n h-cp-atÃm F-¶ D-Xv-IWvT F-\n-¡p−v.
15 ¢m-kv ]-co-£bpw hn-j-b-§-fp-sS D-Å-S-¡hpw C-S-bv-¡n-sS am-dp¶-Xv Imc-Ww F-\n-¡v Ir-Xy-am-bn ]Tn-¡m\pw ]-cn-ioe-\w \-S-¯p-hm\pw I-gn-bp-¶nÃ.
16 ]T-\-{]-hÀ- -̄\-§Ä k-l-]mTn-I-tfm-sSm-̧ w sN-¿p-t¼mÄ {]-iv-\-§Ä D-−m-hm-dp−v.
17 {]-kw-Kn-¡p-t¼mgpw ]mT-`m-Kw A-h-X-cn-¸n-¡p-t¼mgpw F-sâ I-gn-hnÃmbv-a I-−v k-l-]mTn-IÄ ]-cn-l-kn-¡ptam F-¶ Nn-´ F-\n-¡v D-−m-Im-dp−v.
18 k-Z-Ên-s\ A-`n-ap-Jo-I-cn-¡p-t¼mÄ DÄ`-bw D-−m-hm-dp−v.
19 A-¡m-Zan-I {]-I-S-\-§-fp-sS `m-K-am-bn k-l-]mTn-I-fp-am-bn t\-cn«pw AÃm-sXbpw XÀ-¡-§-fp-−m-hm-dp-−v.

Appendices 233
{Ia- \-¼À
{]kvXm-h\
20 ]-co-£-^-e-§-fp-sS Im-cy-¯n k-l-]mTn-I-fp-tS-Xn-t\-¡mÄ tam-i-amIptam F-tâ-sX-¶ D-Xv-IWvT F-\n-¡p-−v.
21 ]T-\hpw ]m-tTy-X-c {]-hÀ- -̄\-§fpw H-cp-an-¨v sIm-−v t]m-Ip-¶-Xn {]-bm-kw A-\p-`-h-s -̧Sp¶p.
22 ]T-\-¯n\pw ]m-tTy-X-c {]-hÀ- -̄\-§Ä-¡p-ap-Å ka-bw {I-ao-I-cn-¡m³ F-\n-¡v I-gn-bp-¶nÃ.
23 ]-co-£-I-fn k-a-b-\njvT ]m-en-¡m³ I-gn-bm -̄Xv F-s¶ A-e-«m-dp−v.
24 F-sâ ]T-\ \n-e-hm-cw k-l-]Tn-I-fp-tSXp-t]m-se an-I-¨-X-sÃ-¶v tXm-¶p¶p.
25 ]-e ]-co-£-Ifpw ]T-\-{]-hÀ- -̄\-§fpw F-s¶ izm-kw ap-«n-¡p¶p.
26 Nn-e ]T-\-hn-j-b-§-fn F-\n-¡v Xo-sc XmÂ-]-cy-anÃ.
27 ssl-kv-Iq-fn tNÀ-¶ ti-jw Rm³ {]-Xo-£n¨-Xp t]m-ep-Å H-cp {]-IS-\w Im-gv-N-sh-bv-¡m³ F-\n-¡v km-[n-̈ n-«nÃ.
28 F-sâ tlmw-hÀ-¡p-Ifpw dn-t¸mÀ-«p-Ifpw sa-¨-s -̧«p-sh-¶v Rm³ {]-Xo-£n-¡p¶p.
29 F-sâ {]-Xo-£-bv-s¡m-¯ {]-IS-\w Im-gv-N-h-bv-¡m³ km-[n-¡m-sX h-cp-t¼mÄ Rm³ \n-cm-i-\m-Im-dp−v.
30 F-sâ ]-co-£m-^e-s¯ a-äp-Å Ip-«n-I-fp-am-bn Xm-c-Xayw sN-¿p-¶-Xv F-s¶ A-kz-Ø-\m-¡m-dp-−v.
31 ]T-\ \n-e-hmc-s¯ Ip-dn-¨-dn-bm³ am-Xm-]n-Xm-¡Ä {i-an-¡m -̄Xv F-¶n hnj-aw D-−m-¡m-dp−v.
32 am-Xm-]n-Xm-¡-fp-sS {]-Xo-£-s¡m- v̄ ]-co-£m-^-e-§-fn D-b-cm³ km-[n¡ptam F-¶ Nn-´ F-s¶ A-kz-Ø-\m-¡m-dp−v.

Appendices 234
\
¼À
]qÀ
-W-amb
pw
tbm-P
n-¡p-¶
p
tbm-P
n-¡p-¶
p
A
-`n-{]
m-b-anÃ
h
n-tb
m-Pn-¡
p-¶p
]
qÀ-W
-amb
pw
hn-t
bm-P
n-¡p-¶
p
\¼
À
]qÀ
-W-amb
pw
tbm-P
n-¡p-¶
p
tbm-P
n-¡p-¶
p
A-`n-{]
m-b-anÃ
h
n-tb
m-Pn-¡
p-¶p
]
qÀ-W
-amb
pw
hn-t
bm-P
n-¡p-¶
p
1 17
2 18
3 19
4 20
5 21
6 22
7 23
8 24
9 25
10 26
11 27
12 28
13 29
14 30
15 31
16 32

Appendices 235
Appendix 4B
SCALE ON ACADEMIC STRESS (Final, English) Farook Training College, Calicut
Dr. K. Vijayakumari Sajmadas K.K Midhundas A.M Associate Professor Research Sholar Research Scholar Farook Training College Farook Training College Farook Training College Personal Information
Name of the Student :
Name of the School :
Class :
Gender : Male / Female
Type of School : Govt. / Aided
Locality : Rural / Urban
Instructions:
The following are some statements related to your study. Read each statement and
record how much you agree or disagree with it, numbered in the space provided
against the statement. Assures that your answers will be used for research purposes
only. Write your answers on the answer sheet given.
Item No
Statements
1 The content taught by some teachers are not completely understood.
2 I feel that the instructional plan and reports of some teachers are very strict.
3 I spend more time on exams.
4 I am not completely satisfied with the results of the recent class exams.
5 I can't sleep well because of anxiety about exams.
6 I have to argue with my parents on the exam results.
7 My current exam result seems to be very different from the UP school exam results.
8 I feel like my parents think I am not serious about my studies.
9 Some essays require more time to gather material and information.

Appendices 236
Item No Statements
10 I can't keep up with the speed of the instructions given by some teachers
11 I can not pace with the teaching style of some teachers
12 Excessive amount of information provided by some teachers hinders the completion of the study and memorization of the content.
13 During the exam, I could not remember what I had learned.
14 I am worried about re-writing the exams if I fail in it.
15 I am not able to study and practice accurately because the class exams and the content of the subjects change from time to time.
16 While doing learning activities with classmates, issues are commen.
17 I am afraid of my incompetence while presenting something.
18 I am anxious while facing an audience.
19 Disputes are there among classmates regarding academic activities.
20 I am worried about my exam results getting worse than my classmates.
21 I feel difficulty in managing time for curricular and co-curricular activities.
22 I can't schedule time for study and extracurricular activities.
23 Inability to keep in time during exam worries me.
24 My level of learning does not seem to be as good as that of my classmates.
25 Many exams and learning activities make me gasp.
26 I am not interested in some subjects of study.
27 In high school I failed to perform as I expected.
28 I hope my homeworks and reports have improved.
29 I am frustrated when I fail to perform well.
30 Comparing my exam results with other children makes me uncomfortable.
31 Negligence of parents on my academic level bothers me.
32 I am anxious on whether I could perform as my parents expect.
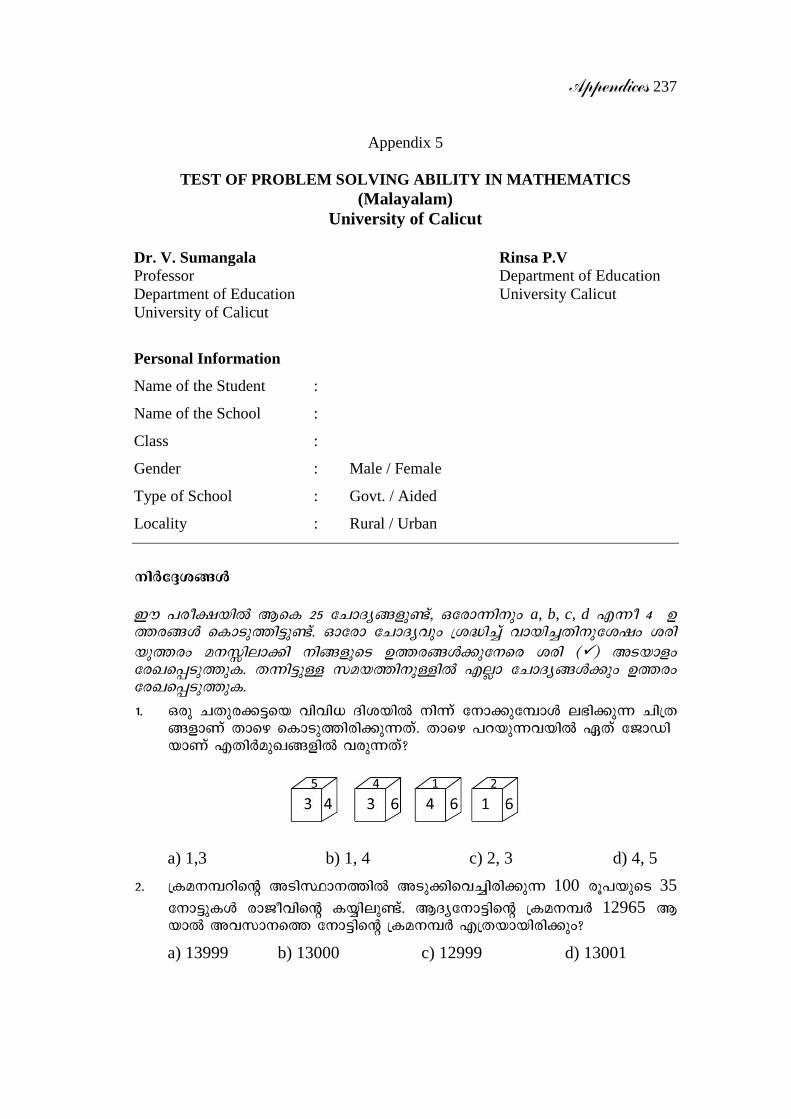
Appendices 237
Appendix 5
TEST OF PROBLEM SOLVING ABILITY IN MATHEMATICS (Malayalam)
University of Calicut
Dr. V. Sumangala Rinsa P.V Professor Department of Education Department of Education University Calicut University of Calicut
Personal Information
Name of the Student :
Name of the School :
Class :
Gender : Male / Female
Type of School : Govt. / Aided
Locality : Rural / Urban
\nÀ-t±-i-§Ä
Cu ]-co-£-bn B-sI 25 tNm-Zy-§-fp−v, H-tcm-¶n\pw a, b, c, d F-¶o 4 D-¯-c-§-Ä sIm-Sp-¯n-«p−v. Hmtcm tNm-Zyhpw {i-²n- v̈ hm-bn- -̈Xn-\p-ti-jw i-cn-bp¯-cw a-\-Ên-em-¡n \n-§-fp-sS D-¯-c-§Ä¡pt\sc icn () AS-bmfw tcJ-s¸-Sp-¯pI. X-¶n-«p-Å k-a-b-¯n-\p-Ån FÃm tNm-Zy-§Ä¡pw D¯-cw tc-J-s¸-Sp-¯pI.
1. H-cp N-Xp-c-¡«-sb hn-hn-[ Zn-i-bn \n-¶v t\m-¡p-t¼mÄ e-`n-¡p-¶ Nn-{X-§-fm-Wv Xm-sg sIm-Sp-¯n-cn-¡p-¶Xv. Xm-sg ]-d-bp-¶-h-bn G-Xv tPm-Un -bm-Wv F-XnÀ-ap-J-§-fn h-cp¶Xv?
a) 1,3 b) 1, 4 c) 2, 3 d) 4, 5
2. {I-a-\-¼-dn-sâ A-Sn-Øm-\-¯n A-S-p-¡n-sh-¨n-cn-¡p-¶ 100 cq-]-bp-sS 35 t\m-«p-IÄ cm-Po-hn-sâ I-¿n-ep−v. BZy-t\m-«n-sâ {I-a-\-¼À 12965 B-bm A-h-km\-s¯ t\m-«n-sâ {I-a-\-¼À F-{X-bm-bn-cn-¡pw?
a) 13999 b) 13000 c) 12999 d) 13001

Appendices 238
3. cm-a³ Ir-jvW-sâ ap-¶n-epw, cm-P³ cma-sâ ap-¶n-epw, tk-Xp cmP-sâ ap-¶nepw ko-X cma-sâ ap-¶nepw \-S-¡p-¶p. B-cm-Wv G-ähpw ]p-d-In-ep-ÅXv?
a) ko-X b) Ir-jv-W³ c) tkXp d) cm-P³
4. H-cp t¢m-¡v 12.00 a-Wn F-¶ ka-bw Im-Wn-¡p-t¼mÄ an-\p-«v kq-Nnbpw a-Wn-¡qÀ kq-Nnbpw X-½n-epÅ tIm-Wf-hv F{X?
a) 300 b) 310 c) 290 d) 30.50
5. 3, 2, 7, 6, 11 . . . ASp-¯ kw-Jy GXv?
a) 8 b) 4 c) 10 d) 2
6. 50 D-tZy-KmÀ-°n-IÄ-¡v th-−n ]-»n-Iv kÀ-Æo-kv I-½o-j³ \-S¯n-b ]-
co-£-bn H-cmÄ-¡v 20 ma-s¯ dm-¦v In«n. Xm-sg \n¶pw Abm-fpsS dm-¦v F-{X-bmWv?
a) 31 b) 30 c) 29 d) 28
7. H-cp ¢m-kn-se 4 Ip-«n-IÄ H-cp _-©n-en-cn-¡p¶p. kp\n- am-Xyp-hn-sâ CS-Xv h-i-¯pw, d-lo-an-sâ he-Xp h-i-¯p-am-bn«v C-cn-¡p-¶p. A-\n-en-sâ C-S-Xv h-i-¯m-Wv d-low. F-¶m B-cm-Wv G-ähpw CS-t¯ Aä-¯v C-cn-¡p-¶Xv?
a) kp-\n b) am-Xyp c) d-low d) A-\nÂ
8. C-t¸mÄ k-a-bw 12.00 a-Wn-bm-sW-¦n 12.30 B-Im³ B-sI F-{X sk¡âv I-gn-bWw?
a) 30 b) 3600 c) 1800 d) 60
9. a-\o-jv H-cp ^pSv-t_mÄ I-fn-¡m-c-\m-Wv FÃm ^pSv-t_mÄ I-fn-¡mcpw D-b-cp-ap-Å-h-cmWv. F-¦n Xm-sg ]-d-bp-¶-h-bn G-Xv \n-K-a-\-am-Wv FÃm-bv-t¸mgpw i-cn-bm-Ip-¶Xv?
a) a-\o-jv D-b-c-ap-Å-h-\mWv
b) D-b-c-ap-Å-h-scÃmw ^pSv-t_mÄ I-fn-¡m-cmWv
c) D-b-c-ap-Å-h-scÃmw ^pSv-t_mÄ I-fn-¡m-c\Ã
d) a-\o-jv D-b-c-ap-Å-h-\Ã.
10. hypÂ-{I-a-§-fp-sS Xp-I F-®Â kw-Jy-bm-bn h-cp-¶ aq-¶v hy-Xykv-X kw-Jy-I-tf-sX-Ãmw?
a) 1,2,3 b) 2,56 c) 1,3,6 d) C-h-sbm-¶p-aÃ

Appendices 239
11. (a+b)2 sâ hn-]p-eo-I-c-W-¯n 3 ]-Z-§-fp−v
(a+b)3 sâ hn-]p-eo-I-c-W-¯n 4 ]-Z-§-fp−v
(a+b)4 sâ hn-]p-eo-I-c-W-¯n 5 ]-Z-§-fp−v.
F¦n (a+b)n sâ hn-]p-eo-I-c-W-¯n F-{X ]-Z-§-fp−v?
a) n ]-Z§Ä b) n-1 ]-Z§Ä c) n +1 ]-Z§Ä d) n2 ]-Z§Ä
12. 1+2+3+4+5 = ( )2
155 +× , 1+2+3+4+5+6 = ( )2
166 +× , 1+2+3+4+5+6+7 =
( )2
177 +× BsW-¦n 1+2+3+4+5+6+7+8 +9+10= --2 F-{X-bm-bn-cn¡pw?
a) ( )2
188 +× b)
( )[ ]4
155 +× c)
( )2
11010 +× d)
( )2
11010 ++
13. 13=12, 13+23=32, 13 + 23 + 33 + 43 =102 BsW-¦n 13 + 23 + 33 + 43 + 53 + 63 = F-{X-bm-bn-cn¡pw?
a) 212 b) 152 c) 62 d) 21
14. 3x=2y, 2y=z Bbm Iq-Sp-X hn-e-bp-ŠNcw GXv?
a) x b) y c) z d) FÃm N-c-¯n\pw Xp-ey-hne.
15. Xmsg X-¶n-cn-¡p-¶-h-bn FÃm-bv-t¸mgpw C-c-«-kw-Jy-bm-bn h-cp-¶ {In-b-tbXv?
a) Cc«-kw-Jy x H-ä-kwJy b) C-c-«-kw-Jy + H-ä-kw-Jy
c) H-ä-kwJy x H-ä-kw-Jy d) C-c-«-kw-Jy % C-c-«-kw-Jy
16. Xmsg X-¶n-cn-¡p-¶-h-bn G-Xv k-a-hmIyw D-]-tbm-Kn-¨m X0 sâ hn-e ImWmw?
a) 1800=90 X 2x0 b) 1800=900 + x2
c) 900 + x2 = 1800 d) Chsbm-¶paÃ

Appendices 240
17. Xmsg X-¶n-cn-¡p-¶- Nn-{X-¯n N-Xp-cw hmÀ-¯m-hm-b-\-¡m-tcbpw {Xn-tIm-Ww A-h-Xm-c-I-tc-bpw, hr¯w ]m-«p-Im-tcbpw kq-Nn-¸n-¡p¶p. F-
¦n A F-¶ A£-cw F-´n-s\ kq-Nn-¸n-¡p¶p?
a) ]m-«p-Imcm-b A-h-Xm-cIsc
b) hÀ-¯m-hm-b-\-¡mcm-b A-h-Xm-cIsc
c) ]m-«p-Imcm-b hmÀ-¯m-hm-b-\-¡msc
d) A-h-Xm-cI-sc
18. Hcp kw-Jy-tbmSv A-tX kw-Jy X-s¶ Iq-«n In-«n-b Xp-I-bn \n¶pw B kw-Jy Ipd-¨p In-«n-b inã-s¯ kw-Jy-bp-am-bn Kp-Wn¨p. Kp-W-\-^-ew 100 B-bm kw-Jy-tbXv?
a) 100 b) 50 c) 20 d) 10 19. Hcp kw-Jy-bp-sS 6 a-S-§pw, 8 a-S§pw X-½n-ep-Å hy-Xym-kw 40 B-bmÂ
kw-Jy-tbXv?
a) 240 b) 320 c) 40 d) 20 20. c−v kw-Jy-I-fp-sS Xp-I 30 Dw hy-Xym-kw 20 Dw B-bm kw-Jy-I-tfXv?
a) 15, 15 b) 38,10 c) 25, 5 d) 28,2 21. XpSÀ-¨-bmb 4 kw-Jy-I-fp-sS Xp-I 50 BWv. A-h-bn-se G-ähpw hen-b
kw-Jy-tbXv?
a) 14 b) 24 c) 21 d) 11
22. Hcp ¢m-kn-se s]¬-Ip-«n-I-fp-sS F-®w B¬-Ip-«n-I-fp-sS F-®-¯n-sâ 5 C-c-«n-bm-Wv F-¦n B ¢m-Ên-se B-sI Ip-«n-I-fp-sS F-®-am-bn h-cm³ km-[y-X-bnÃm¯-Xv Xm-sg ]-d-bp-¶-h-bn G-Xv kw-Jy-bmWv?
a) 36 b) 48 c) 54 d) 62
23. Hcѳ X-sâ aq-¯-aI-\v kz-´w kz-¯n-sâ ]-Ip-Xnbpw c-−ma-s¯ aI-\v _m-¡n-bp-Å-Xn-sâ ]-Ip-Xnbpw aq-¶ma-s¯ aI-\v ]n-s¶bpw _m-¡n-h-cp-¶Xpw sIm-Sp-¡p-hm³ Xo-cp-am-\n¨p. ]n-Xm-hv aq-¶a-s¯ aI-\v sIm-Sp-¡p-hm³ Xo-cp-am-\n-¨-Xv?
a) kz-´w kz-¯n-sâ \m-en-sem-cp `m-K-amWv.
b) kz-´w kz-¯n-sâ c-−n H-cp `m-K-amWv.
c) kz-´w kz-¯n-sâ aq-¶n H-cp `m-K-amWv.
d) kz-´w kz-¯n-sâ F-«n H-cp `m-K-amWv.
24. AXn-cm-hn-se kq-tcym-Z-b-¯n-\p-ti-jw _n-a \-S-¡m³ C-d-§n. Ipd-¨v I-gn-ª-t¸mÄ F-XnÀ-Zn-i-bn h-cn-I-bm-bn-cp-¶ kv-äo-^-\p-am-bn I-−p-ap«n. Ìo-^-\p-am-bn kw-km-cn-¨p-sIm-−n-cp-¶-t¸mÄ kv-äo^-sâ \n-g _n-a-en-sâ he-Xv hi-¯v Im-Wp-I-bp-−mbn. F-¦n _n-a G-Xv Zn-i-¡-`n-ap-J-am-bm-Wv \n-¶Xv?
a) Ing¡v b) ]-Sn-ªmdv c) sX¡v d) hS¡v

Appendices 241
25. Hcp tkm-¸n-sâ A-f-hp-IÄ 5 cm X 4 cm X1.5 cm BWv. C-¯-c-¯n-ep-Å
F-{X tkm-¸pIÄ 55 cm X 48 cm X 15 cm A-f-thm-Sp-IqSn-b ImÀ-Uv t_mÀ-Uv s]-«n-bn sIm-Åp-sa-¶v I-−p-]n-Sn-¡p-¶-Xn-\v Xm-sg sIm-Sp-¯n-cp-¶-h-bn G-Xv {In-b D-]-tbm-Kn-¡mw?
a) 154855
5.145
××××
b) 154855
5.145
++××
c) 5.145
154855
××××
c) 5.145
154855
××××

Appendices 242
Appendix 6
Mathematics Anxiety Scale (Modified-Malayalam) University of Calicut
Dr. V Sumangala Malini P.M Professor Department of Education Department of Education University of Calicut University of Calicut Personal Information
Name of the Student :
Name of the School :
Class :
Gender : Male / Female
Type of School : Govt. / Aided
Locality : Rural / Urban
Instructions:
\nÀ-t±-i-§Ä: KWn-X-im-kv-{X-]T-\-¯n \n-§Ä t\-cn-Sp-¶ {]-iv-\-§Ä B-Wv Xm-sg
sIm-Sp-¯n-cn-¡p-¶Xv. Hmtcm {]-kv-Xm-h-\bpw hm-bn-¨v A-Xn-\v t\-sc \Â-In-bn-«p-Å
"]qÀ-W-ambpw tbm-Pn-¡p-¶p', "tbm-Pn-¡p-¶p', "A-̀ n-{]m-b-anÃ', "hn-tbm-Pn-¡p-¶p', "]qÀ-
W-ambpw tbm-Pn-¡p-¶p' t\-sc \n-§-fp-sS {]-Xn-Ic-Ww tc-J-s¸-Sp-¯p-I.
1. IW-¡v sN-¿p-t¼mÄ So-¨À F-s¶ {i-²n-¡p-I-bm-sW-¦n F-\n-¡v _p-²n-ap-«v tXm-¶m-dp−v.
2. So-¨À tNmZyw tNm-Zn-¡p-t¼mÄ D-Xv-IWvT Imc-Ww F-\n-¡v D-¯-cw ]-d-bm³ I-gn-bm-dnÃ.
3. AX-Xp Zn-h-k-§-fn-se K-Wn-X-`m-K-§Ä ]Tn-¡m-\n-cp-¶m F-\n-¡v A-kz-Ø-X A-\p-`-h-s¸-Sm-dp−v.
4. sX-än-t¸mIpw F-¶v t]-Sn-bp-Å Imc-Ww Nn-e k-a-b-§-fn F-\n-¡v IW-¡v sN-¿m³ I-gn-bm-dnÃ.
5. F-fp-¸-am-bn F-\n-¡v tXm-¶m-dpÅ tNm-Zy-§Ä t]mepw Nn-e k-a-b-§-fn Rm³ sX-än-¡m-dp−v.
6. Pym-anXo-b I-W-¡p-I-fn Rm³ F-Sp-¡p-¶ A-f-hp-IÄ sXämtWm F-¶pÅ tXm-¶Â F-s¶ A-e«m-dp−v.
7. So-¨-dp-sS {i-² In-«m-Xn-cn-¡m³ th-−n Rm³ ¢m-kn-se ]p-d-In-se _-©n B-Wv C-cn-¡m-dp-ÅXv.
8. \Ãh-®w ]Tn-¨mepw F-\n-¡v KWn-X ]co-£ \-¶m-bn F-gp-Xm³ I-gn-bm-dnÃ.
9. K-Wn-X-]T-\w an-I-hp-ä-Xm-¡m-\p-Å {i-a-¯n F-\n-¡v _p-²n-ap-«v tXm-¶m-dnÃ.

Appendices 243
10. F-{X X-h-W ]mT-̀ m-K-§Ä ]Tn-¨mepw ]co-£ \-¶m-bn F-gp-Xm³ I-gnbptam F-¶ B-i-¦ F-\n-¡v tXm-¶m-dp-−v.
11. Rm³ tam-i-s¸-« Ip-«n-bmhpw F-¶ `-b-¯m K-Wn-X-¯n-se kw-i-b-§Ä H¶pw Zq-co-I-cn-¡m-dnÃ.
12. I-W-¡p-IÄ sN-¿p-¶ h-gn sX-äm-bn t]mIptam F-¶ t]-Sn Imc-Ww Rm³ H-ä-bv-¡v I-W-¡p-IÄ sN-¿m-dnÃ.
13. So-¨À KWn-X {]-iv-\-§Ä t_mÀ-Un sN-bv-Xp X-cp¶-Xv t\m-¡n F-gp-Xp-¶-Xn Rm³ kw-Xr-]v-X\mWv.
14. Zn-htk-\ D-]-tbm-Kn-¡p-¶ K-Wn-X-{In-b-IÄ h-sc- ¢m-kn sN-¿p-¶ k-ab-¯v F-\n-¡v _p-²n-ap-«v A-\p-`-h-s¸-Sm-dp−v
15. D¯-cw sX-än-t¸m-bm So-¨À h-g-¡p-]-dbptam F-¶ t]-Sn-bp-Å-Xn-\m A-Sp-¯p-Å Ip-«n-bp-sS t\m-«v-_p-¡v t\m-¡n F-gp-Xm-dp−v.
16. D¯-cw A-dn-bm-sa-¦n t]m-epw K-Wn-X-{In-b-IÄ sN-¿p-t¼mÄ F-\n-¡v _p-²n-ap-«v A-\p-`-h-s¸-Smdp−v.
17. ]-W-an-S-]m-Sp-I-fn F-sâ I-W-¡p-Iq-«-ep-IÄ sX-än-t¸mIptam F-¶ t]-Sn Imc-Ww A¯-cw A-h-kc-§-fn Rm³ am-dn-\nÂ-¡m-dp−v.
18. I-W-¡p-]-co-£-bp-sS k-a-b-am-Ip-t¼mÄ km-[m-c-W-bm-bn ]\n, h-b-dp-th-Z-\ F-¶n-§-s\-bp-Å tZlm-kz-Ø-X-IÄ F-\n-¡v D-−m-Im-dp-−v.
19. i-cnbm-b D¯-cw ]-d-bm³ km-[n-¡nà F-¶ t]-Sn Imc-Ww Rm³ Izn-kv a-Õ-c-§-fn ]-s¦-Sp-¡mdnÃ.
20. Hmtcm ]pXn-b {]-iv-\-§Ä sN-¿p-t¼mgpw ap³-]-s¯-t¸m-se sX-än-t¸mIpw F-¶v Rm³ A-kz-Ø-\mIm-dp−v.
21. D-Xv-IWvT Imc-Ww F-\n-¡v F-t¸mgpw I-W-¡n Ipd-hv amÀ-¡m-Wv e-`n-¡m-dp-ÅXv.
22. I-W-¡n-ep-Å F-sâ D-Xv-IWvT Xc-Ww sN-¿m-sX I-W-¡n F-\n-¡v {]-Xo-£n-¨ \n-e-hm-cw ssI-h-cn¡m³ km-[n-¡m-dnÃ.
23. K-Wn-X-¯n hy-àam-b A-dn-hnÃm-sX a-Õ-c-]-co-£-IÄ P-bn-¡m³ km-[n-¡nà F-¶-Xn F-\n-¡v D-Xv-I-WvT-bp-−v.
24. k-a-hm-Iy-§Ä \-¶m-bn ]Tn-¨n-«p-s−-¦nepw ]-co-£m t]-Sn Imc-Ww Rm³ a-d-¶p-t]m-Im-dp−v.

Appendices 244
\¼
À
]qÀ
-W-amb
pw
tbm-P
n-¡p-¶
p
tbm-P
n-¡p-¶
p
A-`n-{]
m-b-anÃ
hn-t
bm-P
n-¡p-¶
p
]qÀ
-W-amb
pw
hn-t
bm-P
n-¡p-¶
p
\¼
À
]qÀ
-W-amb
pw
tbm-P
n-¡p-¶
p
tbm-P
n-¡p-¶
p
A-`n-{]
m-b-anÃ
hn-t
bm-P
n-¡p-¶
p
]qÀ
-W-amb
pw
hn-t
bm-P
n-¡p-¶
p
1 13
2 14
3 15
4 16
5 17
6 18
7 19
8 20
9 21
10 22
11 23
12 24

Appendices 245
Appendix 7A
LOCUS OF CONTROL SCALE (Malayalam) Department of Psychology
University of Calicut
\nÀt±-i-§Ä: ssZ\w-Zn\ Pohn-X-hp-ambn _Ô-s¸-Sp¶ GXm\pw {]kvXm-h-\-IÄ Cu tNmZym-h-en-bn sImSp-¯n-cn-¡p-¶p. Hmtcm {]kvXm-h-\bpw \n§sf kw_-Ôn-¨n-S-t¯mfw icnbm-tWm, AY-hm, \n§Ä {]kvXm-h-\-tbmSv tbmPn-¡p-¶pthm CÃtbm F¶-XmWv D¯-c-¡-S-em-Ên tcJ-s¸-Sp-t¯-−-Xv. \n§-fpsS A`n-{]mbw {]tXymIw X¶n-cn-¡p¶ D¯-c-¡-S-em-Ên icn/sXäv F¶n-h-bv¡m-bpÅ GsX-¦nepw Hcp {_m¡-än {]kvXm-h-\-bpsS {Ia-\-¼À A\p-k-cn¨v A[nI NnÓw (+) D]-tbm-Kn¨v tcJ-s¸-Sp-¯p-I. {]kvXm-h-\-IÄ hmbn¨v DS³Xs¶ a\-Ên tXm¶p¶ D¯-c-§-fmWv AS-bm-f-s¸-Sp-t¯-−-Xv.
tNmZym-h-en-bn sImSp-¡p¶ D¯-c-§Ä Kth-jW ]T-\-§Ä¡v am{Xw D]-tbm-Kn-¡m-\p-Å-Xm-Wv. Ah XnI¨pw kzIm-cy-ambn kq£n-¡p-¶-Xm-Wv. \n§-fpsS kl-I-c-W-¯n\v {]tXyIw \µn ]d-bp-¶p. tNmZy-]p-kvX-I-¯n bmsXm¶pw AS-bm-f-s¸-Sp-¯m-Xn-cn-¡m³ {i²n-¡p-I.
1. Hcp Znhkw \¶mbn Bcw-`n-¡m³ Ign-ªm A¶s¯ asäÃm {]hr-¯n-Ifpw \¶m-bn-cn-¡pw.
2. \½psS CjvS-a-\p-k-cn¨v kplr-¯p-¡sf Xnc-sª-Sp-¡p-hm³ \ap¡v [mcmfw Ah-k-c-§Ä D−v.
3. aäp-Å-hÀ GXp-hn-[-¯n \s½ CjvS-s¸-Sp¶p F¶Xv \½psS s]cp-am-äs¯ B{i-bn-¨m-Wn-cn-¡p-¶-Xv.
4. BI-kvanI kw`-h-§Ä Pohn-Xs¯ F{X-am{Xw kzm[o-\n-¡p¶p F¶Xv an¡-hÀ¡pw Adn-bn-Ã.
5. F´n\v th−n ]cn-{i-an-¡p-¶pthm AXn-\pÅ AwKo-Imcw \ap¡v Pohn-X-¯n e`n-¡m-Xn-cn-¡n-Ã.
6. bmZr-ÝnI kw`-h-§Ä X§-fpsS ]co-£m-^-es¯ F{X-am{Xw kzm[o-\n-¡p-¶p-sh¶v an¡-hmdpw hnZymÀ°n-IÄ a\-Ên-em-¡n-bn-«n-Ã.
7. aäp-Å-h-cp-sam¯v CW-§n-¡-gn-ªp-t]m-Im³ Ign-bm-¯-hÀ¡v aäp-Å-hsc X§sf CjvS-s¸-Sp-¶-h-cm-¡m³ Ign-bn-Ã.
8. ]co-£bv¡v \¶mbn X¿m-dm-bn-«pÅ Hcp hnZymÀ°n-bpsS Imcy-¯n A\p-Nn-X-amb ]co£ Fs¶m-¶n-Ã.
9. asäm-cmÄ \n§sf BßmÀ°-ambpw CjvS-s¸-Sp-¶pt−m CÃtbm F¶v IrXy-ambpw Adn-bm³ hfsc {]bm-k-am-Wv.
10. Hcp-hn-[-¯nepw \mw Dt±-in-¡p-¶-Xp-t]mse Imcy-§Ä \S-¡p-I-bn-Ãm-¯-Xp-sIm−v \mw ITn-\-ambn {]b-Xv\n-t¡− Bh-iy-an-Ã.
11. `mKy-t¯-¡mÄ t{]mÕm-l-\-amWv Hcp Soansâ hnP-b-¯n\v hgn-sbm-cp-¡p-I.
12. \½psS amXm-]n-Xm-¡Ä¡v GXn-t\m-SpÅ A`n-{]mbw amän-sb-Sp-¡pI Akm-²y-am-Wv.
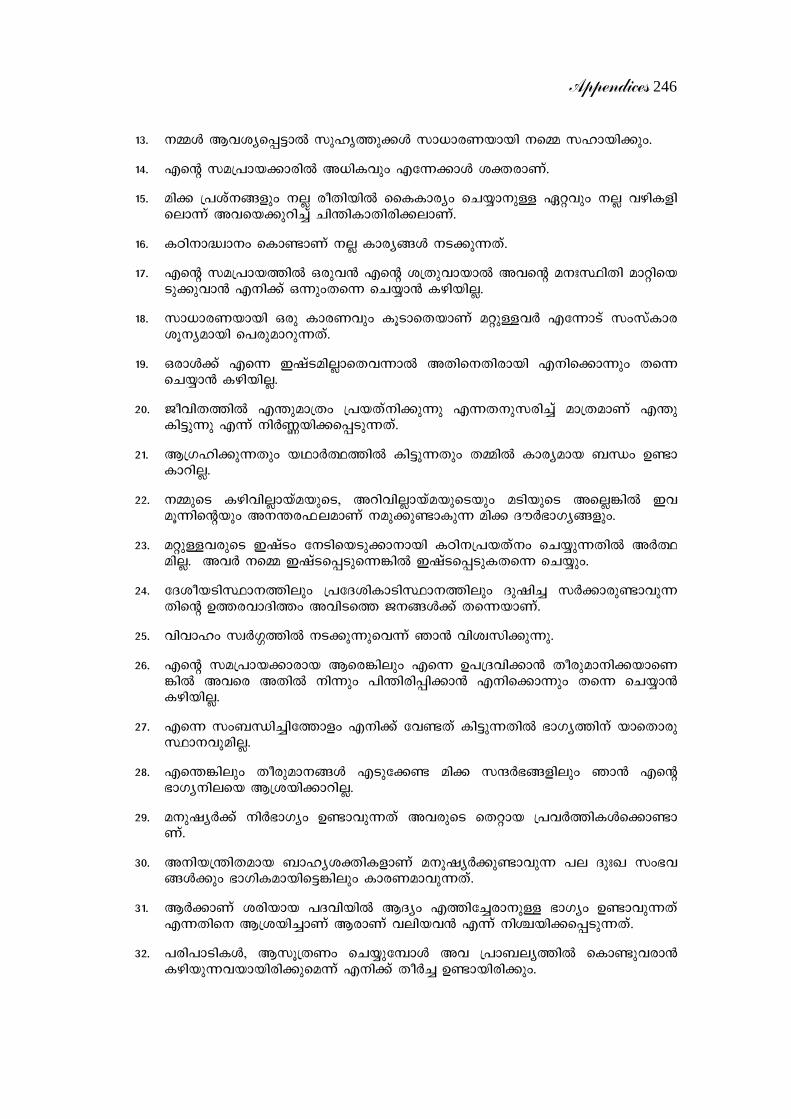
Appendices 246
13. \½Ä Bh-iy-s¸-«m kplr-¯p-¡Ä km[m-c-W-bmbn \s½ klm-bn-¡pw.
14. Fsâ ka-{]m-b-¡m-cn A[n-Ihpw Ft¶-¡mÄ ià-cm-Wv.
15. an¡ {]iv\-§fpw \à coXn-bn ssIImcyw sN¿m-\pÅ Gähpw \à hgn-I-fn-sem¶v Ah-sb-¡p-dn¨v Nn´n-Im-Xn-cn-¡-em-Wv.
16. ITn-\m-²zm\w sIm−mWv \à Imcy-§Ä \S-¡p-¶-Xv.
17. Fsâ ka-{]m-b-¯n Hcp-h³ Fsâ i{Xp-hm-bm Ahsâ a\x-ØnXn amän-sb-Sp-¡p-hm³ F\n¡v H¶pw-Xs¶ sN¿m³ Ign-bn-Ã.
18. km[m-c-W-bmbn Hcp Imc-Whpw IqSm-sX-bmWv aäp-Å-hÀ Ft¶mSv kwkvIm-c-iq-\y-ambn s]cp-am-dp-¶-Xv.
19. HcmÄ¡v Fs¶ CjvS-an-Ãm-sX-h-¶m AXn-s\-Xn-cmbn F\n-s¡m¶pw Xs¶ sN¿m³ Ign-bn-Ã.
20. Pohn-X-¯n F´p-am{Xw {]b-Xv\n-¡p¶p F¶-X-\p-k-cn¨v am{X-amWv F´p In«p¶p F¶v \nÀ®-bn-¡-s¸-Sp-¶-Xv.
21. B{K-ln-¡p-¶Xpw bYmÀ°-¯n In«p-¶Xpw X½n Imcy-amb _Ôw D−m-Im-dn-Ã.
22. \½psS Ign-hn-Ãm-bva-bp-sS, Adn-hn-Ãm-bva-bp-sSbpw aSn-bpsS AsÃ-¦n Ch aq¶n-sâbpw A\- -́c-^-e-amWv \ap-¡p-−m-Ip¶ an¡ ZuÀ`m-Ky-§-fpw.
23. aäp-Å-h-cpsS CjvSw t\Sn-sb-Sp-¡m-\mbn ITn-\-{]-bXv\w sN¿p-¶-Xn AÀ°-an-Ã. AhÀ \s½ CjvS-s¸-Sp-s¶-¦n CjvS-s¸-Sp-I-Xs¶ sN¿pw.
24. tZio-b-Sn-Øm-\-¯nepw {]tZ-in-Im-Sn-Øm-\-¯nepw Zpjn¨ kÀ¡m-cp-−m-hp-¶-Xnsâ D¯-c-hm-Zn¯w Ahn-Ss¯ P\-§Ä¡v X-s¶-bm-Wv.
25. hnhmlw kzÀ¤-¯n \S-¡p-¶p-sh¶v Rm³ hniz-kn-¡p-¶p.
26. Fsâ ka-{]m-b-¡m-cmb Bsc-¦nepw Fs¶ D]-{Z-hn-¡m³ Xocp-am-\n-¡-bm-sW-¦n Ahsc AXn \n¶pw ]n´n-cn-̧ n-¡m³ F\n-s¡m¶pw Xs¶ sN¿m³ Ign-bn-Ã.
27. Fs¶ kw_-Ôn-¨n-t¯mfw F\n¡v th−Xv In«p-¶-Xn `mKy-¯n\v bmsXmcp Øm\-hp-an-Ã.
28. Fs -́¦nepw Xocp-am-\-§Ä FSp-t¡− an¡ kµÀ -̀§-fnepw Rm³ Fsâ `mKy-\n-esb B{i-bn-¡m-dn-Ã.
29. a\p-jyÀ¡v \nÀ`mKyw D−m-hp-¶Xv Ah-cpsS sXämb {]hÀ¯n-IÄs¡m-−m-Wv.
30. A\n-b-{´n-X-amb _mly-i-àn-I-fmWv a\p-jyÀ¡p-−m-hp¶ ]e ZpxJ kw`-h-§Ä¡pw `mKn-I-am-bn-s«-¦nepw Imc-W-am-hp-¶-Xv.
31. BÀ¡mWv icn-bmb ]Z-hn-bn BZyw F¯n-t¨-cm-\pÅ `mKyw D−m-hp-¶Xv F¶-Xns\ B{i-bn-¨mWv BcmWv hen-b-h³ F¶v \nÝ-bn-¡-s¸-Sp-¶-Xv.
32. ]cn-]m-Sn-IÄ, Bkq-{XWw sN¿p-t¼mÄ Ah {]m_-ey-¯n sIm−p-h-cm³ Ign-bp-¶-h-bm-bn-cn-¡p-sa¶v F\n¡v XoÀ¨ D−m-bn-cn-¡pw.
Appendices 247
33. Hcm-fpsS B{K-l-§fpw Ign-hp-I-fp-amWv Abm-fpsS Pohn-X-¯nsâ KXn \nÀ®-bn-¡p-¶-Xv.
34. Fsâ amXm-]n-Xm-¡-fmWv F\n-¡p-th−n Imcy-§Ä Xocp-am-\n-¡p-¶-Xv.
35. Hmtcm hyàn-bnepw Abm-fpsS `mhn-Xo-cp-am-\n-¡m-\pÅ Ignhv IpSn-sIm-Åp-¶p-−v.
36. km[m-cW ]ucsâ hnPbw ITn-\m-²zm-\s¯ B{i-bn-¨m-Wn-cn-¡p-¶Xv; `mKy-¯n\v AXn Imcy-amb ]¦v H¶pw Xs¶-bn-Ã.
37. `mKyw Fs¶m¶v BÀ¡pw CÃ.
38. kw`-hn-¡m-\p-ÅXv kw`-hn-¡p-I-Xs¶ sN¿p-sa¶v an¡-t¸mgpw Rm³ I−n-«p-−v.
39. `mKy-\nÀ`m-Ky-§Ä¡-\p-k-cn¨v Imcy-§Ä amdp-sa-¶p-Å-Xp-sIm−v hfsc ap³Iq«n Imcy-§Ä ¹m³ sN¿p-¶Xv _p²n-b-Ã.
40. th−{X ]cn-{i-an-¨m cmjv{Sobm-gn-a-Xn-IÄ XpS-¨p-am-äm³ \ap¡v Ign-bpw.
41. F\n¡p kw`-hn-¡p¶ ]e Imcy-§-fp-sS-taepw F\n¡p hfsc Ipd¨p kzm[o\w am{XtabpÅp F¶v an¡-t¸mgpw tXm¶m-dp-−v.
42. hmZn¨v Fs¶ hnUvVn-bm-¡m³ aäp-Å-hÀs¡-fp¸w Ign-bp-¶p.
43. t\XrXzw \nÝ-bn-¡-s¸-Sp-¶Xv ]cn-io-e-\-¯n-eq-sStbm ITn\ {]b-Xv\-¯n-eq-sStbm AÃ adn¨v P·-kn-²n-bn-eq-sS-bm-Wv.
44. {]hÀ¯\ ]²-Xn-I-tf-¡mÄ {Kl-\n-e-bmWv Hcm-fpsS Pohn-Xs¯ IqSp-X \nb-{´n-¡p-¶-Xv.
45. Rm³ PmX-I-^-e-§Ä hmbn-¡p-Ibpw B {]h-N-c-§-fn [mcmfw kXyw AS-§n-bn-cn-¡p-¶p-sh¶v hniz-kn-¡p-Ibpw sN¿p-¶p.
46. \msf \S-t¶-¡m-hp¶ H«p-an¡ kw`-h-§-sfbpw C¶s¯ \½psS {]hÀ¯n-sIm−v \nb-{´n-¡m³ Ign-tª-¡pw.