predicting relations between variables · predicting relations between variables ... many of the...
TRANSCRIPT

Predicting Relations between Variables
Where we have been• Hypotheses: conjectures about the way some
phenomenon behaves • Need to be tested by predictions • Can be stated in terms of variables
• Variables: things that vary • Variables differ in the way they can be
measured • Nominal & ordinal vs score variables
• Hypotheses about how a single variable is distributed
• Ages of people in food court • Amount of time animal spends foraging • Amount of time you spend studying 2
Hypotheses involving more than one variable
Many of the hypotheses of interest in science and in ordinary life involve relations between variables
• Amount of sleep and ability to recall information
• Pressure, volume, and temperature of a gas • Experience and job performance • SAT score and grades in college • Vitamin intake and health condition • Sexual activity and sexually transmitted
diseases • Smoking and lung cancer • Miles per gallon and horsepower of cars
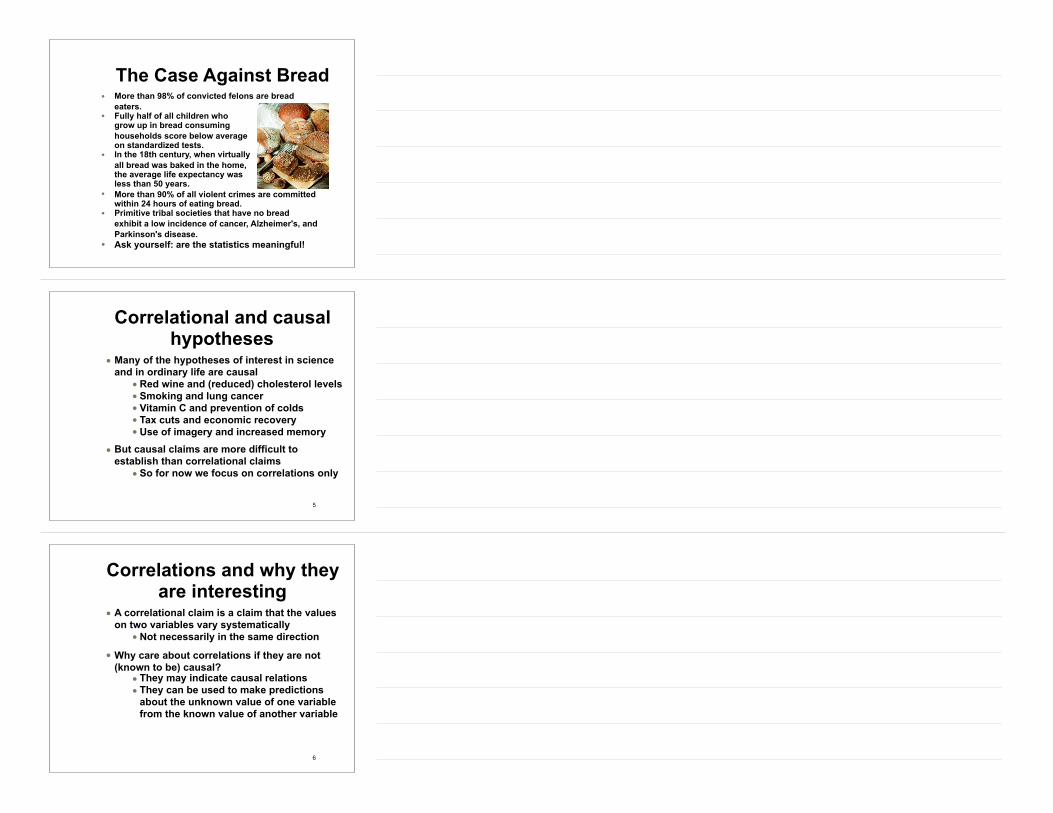
The Case Against Bread• More than 98% of convicted felons are bread
eaters. • Fully half of all children who
grow up in bread consuming households score below average on standardized tests.
• In the 18th century, when virtually all bread was baked in the home, the average life expectancy was less than 50 years.
• More than 90% of all violent crimes are committed within 24 hours of eating bread.
• Primitive tribal societies that have no bread exhibit a low incidence of cancer, Alzheimer's, and Parkinson's disease.
• Ask yourself: are the statistics meaningful!
Correlational and causal hypotheses
• Many of the hypotheses of interest in science and in ordinary life are causal
• Red wine and (reduced) cholesterol levels • Smoking and lung cancer • Vitamin C and prevention of colds • Tax cuts and economic recovery • Use of imagery and increased memory
• But causal claims are more difficult to establish than correlational claims
• So for now we focus on correlations only
5
Correlations and why they are interesting
• A correlational claim is a claim that the values on two variables vary systematically
• Not necessarily in the same direction
• Why care about correlations if they are not (known to be) causal?
• They may indicate causal relations • They can be used to make predictions
about the unknown value of one variable from the known value of another variable
6

SAT and College Grades
• Should the SAT be used as a (or maybe the) basis for admission to the University of California?
• If so, then it must be justified • Does it predict success in college? • If it doesn’t, then it may be an inappropriate
measure to use in judging admissions
• Compare: basing admissions to UC on • Running speed for the mile • Length of one’s index finger
Clicker QuestionFor shoe size to be used as a basis for deciding on life insurance rates
A. Shoe size must be a score variable B. There must be a high percentage of those with large
shoe sizes among those who live long C. An individual’s shoe size must be a good predictor of
life expectancy D. Shoe size could never be employed as a basis for
deciding on life insurance rates
Correlational Research Examples
• Is there a relationship between family income and grade point average?
• Is there a relationship between number of hours of part time employment and grade point average?
• Is there a relationship between years of education and income later in life?

From the general to the testable
• Not all hypotheses relating variables are directly testable—hypotheses presented in general terms
• Force is equal to mass x acceleration • Fitter people live longer • Better education correlates with greater
happiness • Greater pollution correlates with greater
global warming • Animals living in colder climates are larger • Former players of contact sports suffer more
brain damage
Testable predictions• To test hypotheses such as these, we need to
make specific predictions • Predictions which can be evaluated
• Must predict something that we can detect and measure, either with our senses directly or via instruments
11
Operational “definitions”• Relate the variables used in the hypothesis to
measurable variables
• Variables such as force, memory ability, happiness, brain injury, etc., are not directly measurable (observable).
• Must specify a measurement procedure and a variable we can measure
• The operational definitions of any non-observational terms are major auxiliary assumptions in any test of a hypothesis

Distance• Inch: width of a grown man’s thumb
• King Edward II (14th C.): the length of an inch shall be equal to three grains of barley, dry and round, placed end to end lengthwise
• Foot: the name gives away its original reference
• Standardized to 12 inches
• Yard: the length of a person’s belt • King Henry I (13th C.): distance from his
nose to the thumb of his outstretched arm, which was about 36 inches
13
The meter standard
• The meter introduced by the French in 1791 as one ten-millionth of the distance from the equator to the north pole along a meridian through Paris
• Standard meter bar: A platinum bar with a rectangular cross section and polished parallel ends at a specific temperature
• 1859: J.C. Maxwell defined it in terms of the wavelength of the yellow spectral line of sodium
• 1892: A.A. Michelson 1,553,164.13 times the wavelength of cadmium red in air, at 760 mm of atmospheric pressure at 15° C.
The standard meter - 2
1960: 1,650,763.73 vacuum wavelengths of light resulting from orange-red light, in a vacuum, produced by burning the element krypton (Kr-86).
1983: length of the path traveled by light in vacuum during 1/299,792,458 of a second

The case of IQ• In 1904 Alfred Binet was commissioned by the
French government to devise a test to differentiate children who would not do well in usual schools from those who would
The latter were to be assigned to special schools with greater individual attention but where they would not disrupt the intellectually normal children
• "It seems to us that in intelligence there is a fundamental faculty, the alteration or the lack of which, is of the utmost importance for practical life. This faculty is judgment, otherwise called good sense, practical sense, initiative, the faculty of adapting one's self to circumstances. A person may be a moron or an imbecile if he is lacking in judgment; but with good judgment he can never be either. Indeed the rest of the intellectual faculties seem of little importance in comparison with judgment" (Binet & Simon, 1916, 1973, pp.42-43).
The case of IQ - 2• 30 item test, with different questions typically
solved by children at different ages
• attend to simple instructions • name parts of the body • compare lengths and weights • count coins • assess which of several faces is “prettier” • name objects in a picture • remember digits from a list • define words • fill in the missing words in sentences
The case of IQ - 3• Intelligence Quotient (William Stern—1914):
age level of test results/chronological age, normed to 100 • an 8 year old who passes the 10 year-old's test
would have an IQ of 10/8 x 100
• Lewis Terman of Stanford (1916): • Items on Binet’s test didn’t predict well in
California so revised the test—Stanford-Binet • Extended test to adults: instead of ratios,
employed standard deviations (1 SD= 15 pts) • Introduced “IQ” • Studied, and promoted, 1000+ of those who
scored high • Advocated forced sterilization of "feebleminded"
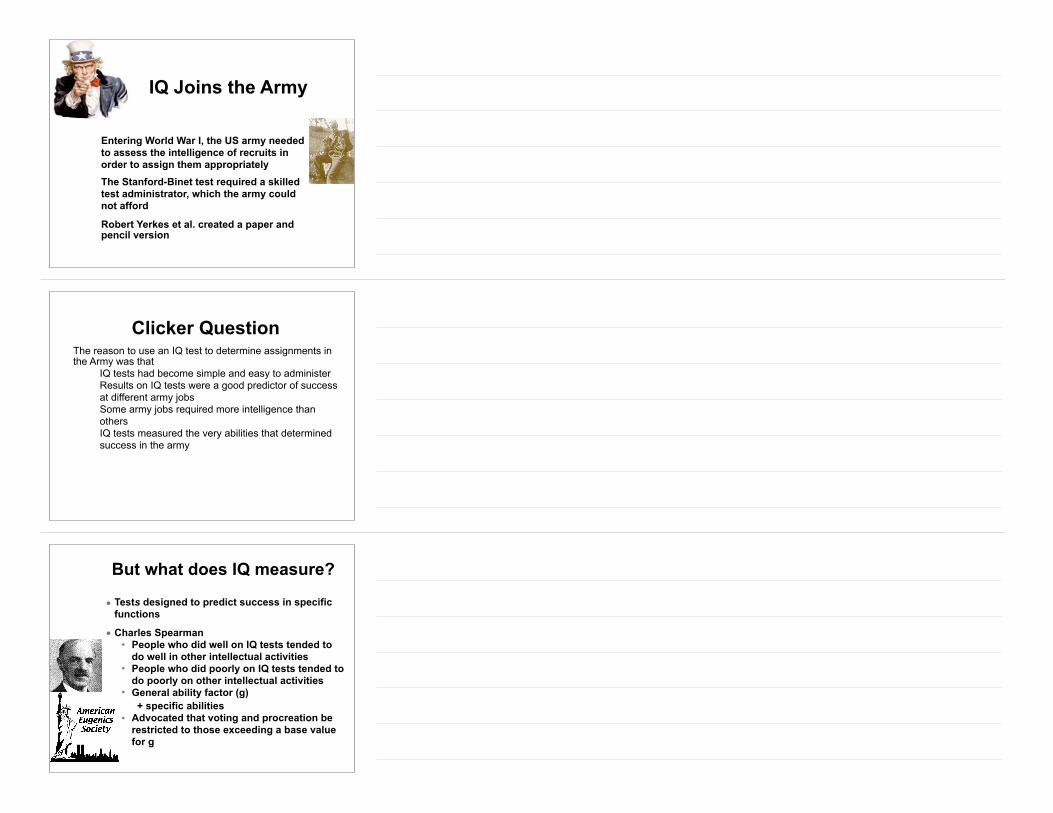
IQ Joins the Army
Entering World War I, the US army needed to assess the intelligence of recruits in order to assign them appropriately The Stanford-Binet test required a skilled test administrator, which the army could not afford
Robert Yerkes et al. created a paper and pencil version
Clicker QuestionThe reason to use an IQ test to determine assignments in the Army was that
A. IQ tests had become simple and easy to administer B. Results on IQ tests were a good predictor of success
at different army jobs C. Some army jobs required more intelligence than
others D. IQ tests measured the very abilities that determined
success in the army
But what does IQ measure?
• Tests designed to predict success in specific functions
• Charles Spearman • People who did well on IQ tests tended to
do well in other intellectual activities • People who did poorly on IQ tests tended to
do poorly on other intellectual activities • General ability factor (g)
+ specific abilities • Advocated that voting and procreation be
restricted to those exceeding a base value for g

Beyond IQ?• Howard Gardner: multiple
intelligences • Verbal • Mathematical • Musical • Spatial • Kinaesthetic • Interpersonal (social skills) • Intrapersonal (self-understanding)
• Robert Sternberg: three kinds of intelligence • Academic • Practical • Creative
Changing IQ• In the early 1980s James Flynn, a
New Zealand political scientist, discovered that the IQ in various groups of people increased on average 3 points per 10 years.
• Effect replicated throughout the industrialized world
• Hidden by the fact that IQ tests are regularly renormed to keep the mean at 100
• Increases apparently not linked to learning—greatest increases in non-verbal tests of intelligence
• Explanation ? ? ? 23
Construct Validity• Does the way you operationalize a variable
really measure that variable? • Does a ruler (do grains of barley) really
measure height? • Does an intelligence test measure
intelligence? • Does a word-list test measure memory?
• The degree to which a measure measures what it is supposed to measure is referred to as its construct validity
24
Clicker QuestionAn operational definition
A. Aims to provide necessary and sufficient conditions for the variable being being measured
B. Employs operations to determine what something is C. Relates a variable used in a hypothesis to a way to
measure it D. Provides sufficient, but not necessary conditions for
the variable being measured
Clicker QuestionConstruct validity is concerned with
A. Whether the argument for the construct is valid B. Whether the operational definition really measures
the variable used in the hypothesis C. Is only important if there is doubt about how to assign
values to variables D. Replacing operational definitions with real definitions
Operational definitions are not definitions
An operational definition provides one way to measure a variable
There will typically be alternatives The alternatives may not always agree
Even when construct validity is high, the operational definition does not provide necessary and sufficient conditions for the term
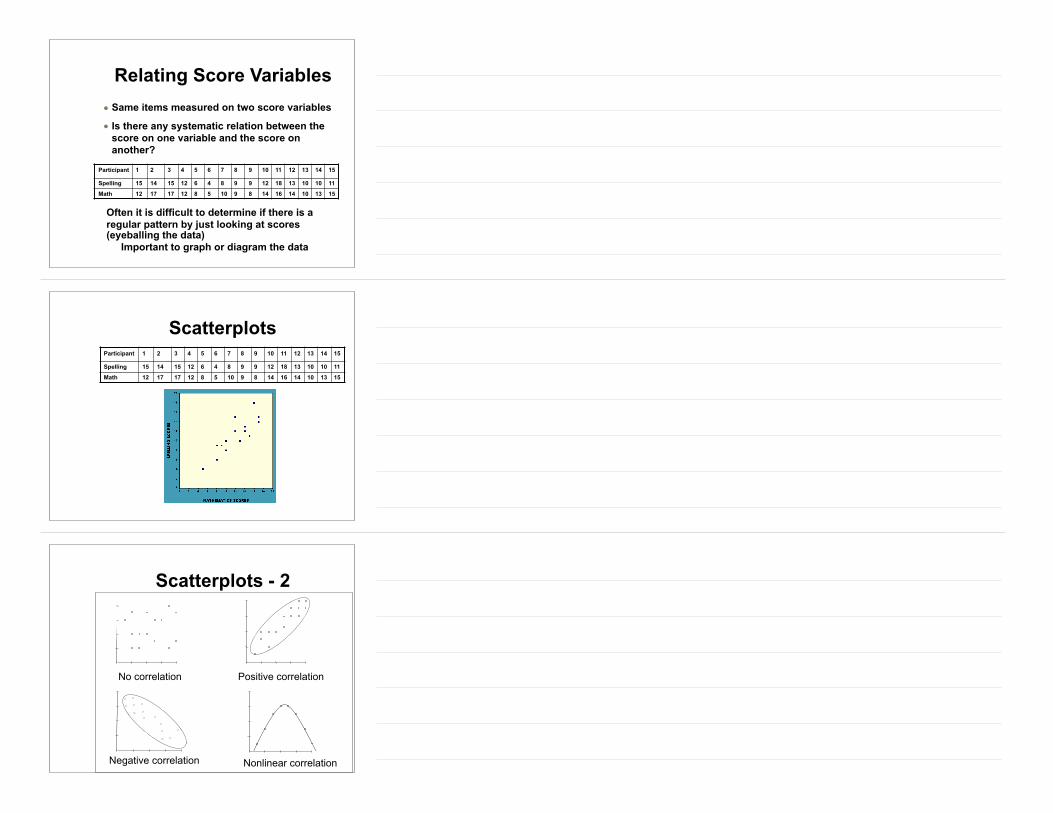
Relating Score Variables• Same items measured on two score variables
• Is there any systematic relation between the score on one variable and the score on another?
Participant 1 2 3 4 5 6 7 8 9 10 11 12 13 14 15
Spelling 15 14 15 12 6 4 8 9 9 12 18 13 10 10 11
Math 12 17 17 12 8 5 10 9 8 14 16 14 10 13 15
Often it is difficult to determine if there is a regular pattern by just looking at scores (eyeballing the data)
Important to graph or diagram the data
ScatterplotsParticipant 1 2 3 4 5 6 7 8 9 10 11 12 13 14 15
Spelling 15 14 15 12 6 4 8 9 9 12 18 13 10 10 11
Math 12 17 17 12 8 5 10 9 8 14 16 14 10 13 15
Scatterplots - 2
No correlation Positive correlation
Negative correlation Nonlinear correlation

Measuring correlationKarl Pearson developed a measure of correlation, known as Pearson’s Product Moment Correlation (r)
-1.0_________________0_________________1.0 Perfect negative No Correlation Perfect Positive A Z score for an individual is how many standard deviations that individual is from the mean. From that there is an easy calculation of Pearson’s r:
r = ∑(ZxZy) / N
Pearson Correlation Coefficient
• Pearson’s Product Moment Correlation r = .857 • Note: Positive Value—positively
correlated • Value close to 1—strongly or highly
correlated
• Strong positive correlation
Participant 1 2 3 4 5 6 7 8 9 10 11 12 13 14 15
Spelling 15 14 15 12 6 4 8 9 9 12 18 13 10 10 11Math 12 17 17 12 8 5 10 9 8 14 16 14 10 13 15
Clicker QuestionA Pearson correlation of 4.25 between height and salary
A. Represents a very strong positive correlation B. Means that height is a very good predictor of salary C. Means that height is a poor predictor of salary D. Makes no sense
Clicker QuestionA study correlating age and interest in health care resulted in a correlation -0.37. This indicates
A. Increased age is a very strong predictor of greater interest in health care
B. Increased age is a moderate predictor of greater interest in health care
C. Increased age is a moderate predictor of lesser interest in health care
D. There is no basis for predicting interest in health
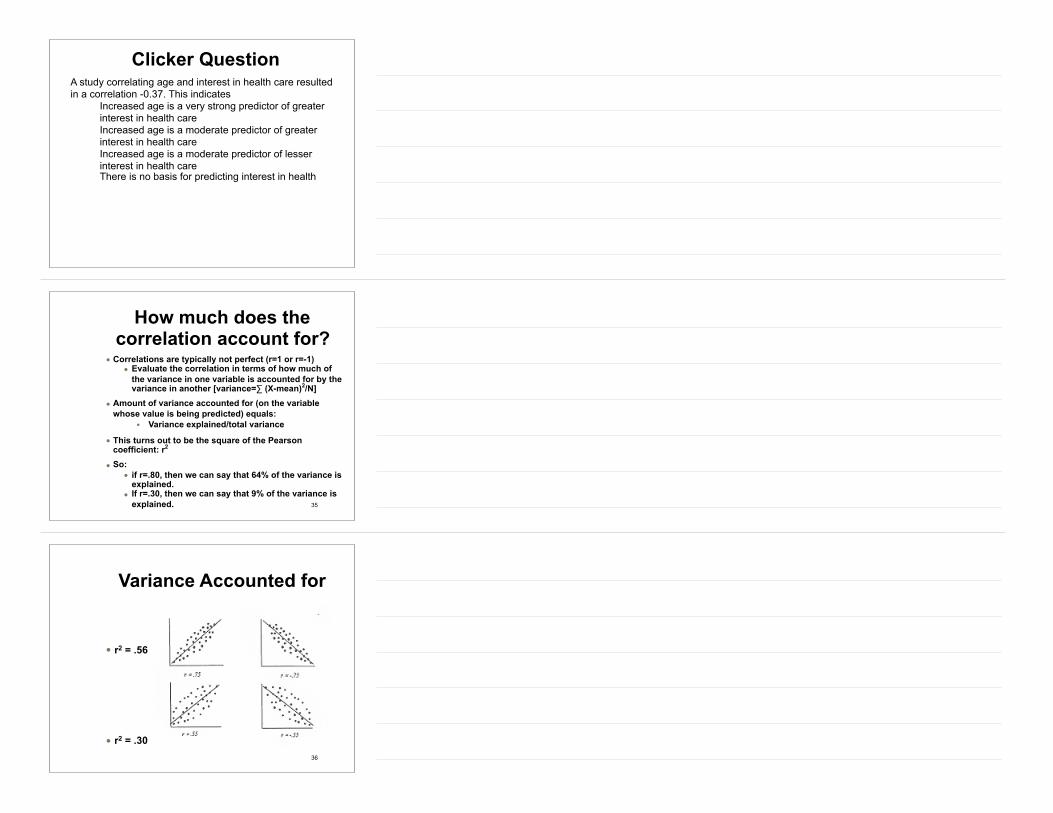
How much does the correlation account for?
• Correlations are typically not perfect (r=1 or r=-1) • Evaluate the correlation in terms of how much of
the variance in one variable is accounted for by the variance in another [variance=∑ (X-mean)2/N]
• Amount of variance accounted for (on the variable whose value is being predicted) equals:
• Variance explained/total variance
• This turns out to be the square of the Pearson coefficient: r2
• So: • if r=.80, then we can say that 64% of the variance is
explained. • If r=.30, then we can say that 9% of the variance is
explained. 35
Variance Accounted for
• r2 = .56
• r2 = .3036
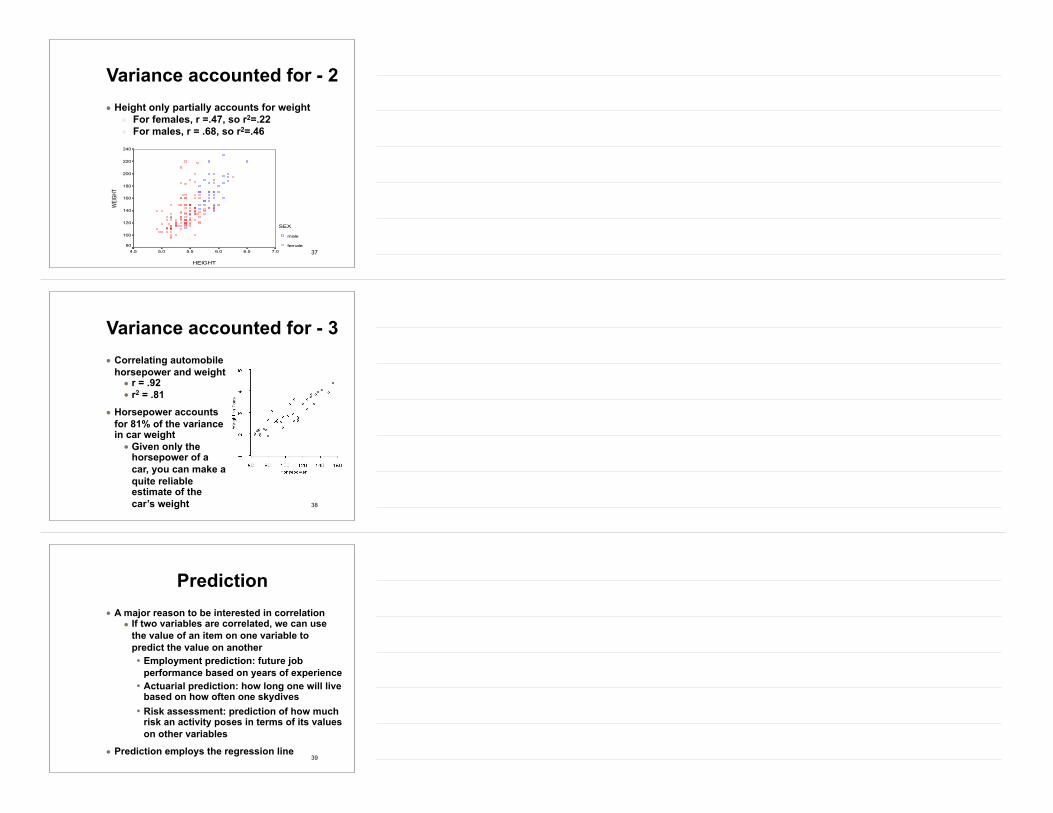
Variance accounted for - 2• Height only partially accounts for weight
• For females, r =.47, so r2=.22 • For males, r = .68, so r2=.46
37
Variance accounted for - 3• Correlating automobile
horsepower and weight • r = .92 • r2 = .81
• Horsepower accounts for 81% of the variance in car weight
• Given only the horsepower of a car, you can make a quite reliable estimate of the car’s weight 38
Prediction• A major reason to be interested in correlation
• If two variables are correlated, we can use the value of an item on one variable to predict the value on another • Employment prediction: future job
performance based on years of experience • Actuarial prediction: how long one will live
based on how often one skydives • Risk assessment: prediction of how much
risk an activity poses in terms of its values on other variables
• Prediction employs the regression line39

Regression line• Start with scatter plot of
data points
• Find line which allows for the best prediction of the criterion variable (one to be predicted) from that of the predictor variable
• Line which minimizes the (square of the) distances of the blue lines
40
Predictor variable
Crit
erio
n v
aria
ble
Regression line• y = a + bx
• y = predicted or criterion variable
• x = predictor variable
• a = y-intercept—regression constant
• b = slope—regression coefficient
• Note: the regression coefficient is not the same as the Pearson coefficient r
41
Clicker QuestionIf the Pearson coefficient (r) between age and liking for chocolate is -.62, what can you infer about the slope of the regression line?
A. Nothing B. The slope is also -.62 C. The slope will be .62 D. The slope will be negative
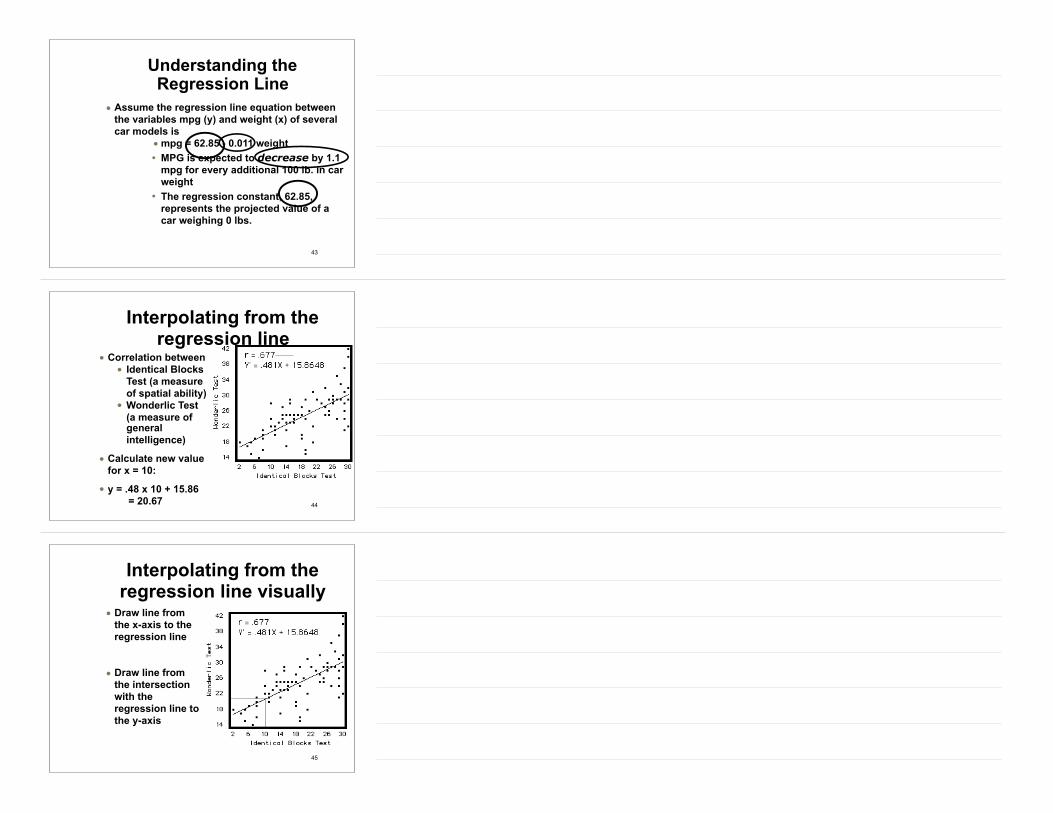
Understanding the Regression Line
• Assume the regression line equation between the variables mpg (y) and weight (x) of several car models is
• mpg = 62.85 - 0.011 weight • MPG is expected to decrease by 1.1
mpg for every additional 100 lb. in car weight
• The regression constant, 62.85, represents the projected value of a car weighing 0 lbs.
43
Interpolating from the regression line
• Correlation between • Identical Blocks
Test (a measure of spatial ability)
• Wonderlic Test (a measure of general intelligence)
• Calculate new value for x = 10:
• y = .48 x 10 + 15.86 = 20.67 44
Interpolating from the regression line visually
• Draw line from the x-axis to the regression line
• Draw line from the intersection with the regression line to the y-axis
45
Clicker QuestionYou are told that the regression line relating a reasoning test score and a memory test score is reasoning score = -3.25 + .7 memory score You know that
A. There is a positive correlation between the scores B. There is a negative correlation between the scores C. Pearson’s r = .7 D. Pearson’s r = -3.25