cesium isotherm testing with spherical resorcinol ... · cesium isotherm testing with spherical...
TRANSCRIPT
PNNL-25277 RPT-SRFBC-001, Rev. 0
Prepared for the U.S. Department of Energy under Contract DE-AC05-76RL01830
Cesium Isotherm Testing with Spherical Resorcinol-Formaldehyde Resin at High Sodium Concentrations April 2016
RL Russell MR Smoot SK Fiskum DE Rinehart


PNNL-25277 RPT-SRFBC-001, Rev. 0
Cesium Isotherm Testing with Spherical Resorcinol-Formaldehyde Resin at High Sodium Concentrations April 2016 RL Russell MR Smoot SK Fiskum DE Rinehart Prepared for the U.S. Department of Energy under Contract DE-AC05-76RL01830 Pacific Northwest National Laboratory Richland, Washington 99352

PNNL-25277 RPT-SRFBC-001, Rev. 0
ii
Executive Summary
Washington River Protection Solutions (WRPS) is developing a Low-Activity Waste Pretreatment System (LAWPS) to provide low-activity waste (LAW) directly to the Hanford Tank Waste Treatment and Immobilization Plant (WTP) Low-Activity Waste Vitrification Facility for immobilization. The pretreatment that will be conducted on tank waste supernate at the LAWPS facility entails filtration to remove entrained solids and cesium (Cs) ion exchange to remove Cs from the product sent to the WTP. Currently, spherical resorcinol-formaldehyde (sRF) resin (Microbeads AS, Skedsmokorset, Norway) is the Cs ion exchange resin of choice. Most work on Cs ion exchange efficacy in Hanford tank waste has been conducted at nominally 5 M sodium (Na) supernatant. WRPS is examining the possibility of processing supernatant at high Na concentrations—up to 8 M Na—to maximize processing efficiency through the LAWPS. Minimal Cs ion exchange work has been conducted at 6 M and 8 M Na supernatant concentrations.
WRPS contracted the Pacific Northwest National Laboratory (PNNL) to develop, in accordance with a WRPS-approved Test Plan(1), Cs isotherms(2) at 6.5 and 8.0 M Na supernatant concentrations with sRF resin, Lot 1F-370/1392, which was produced by Microbeads AS in August 2011. PNNL tested five initial Cs concentrations (i.e., 5.0×10⁻⁶ M, 5.0×10⁻⁵ M, 5.0×10⁻⁴ M, 5.0×10⁻³ M, and 5.0×10⁻² M Cs) to show the impacts and interdependencies of Cs loading onto the sRF resin in a matrix of the following initial conditions:
• 6.5 and 8 M Na • 0, 0.035, 0.35, and 0.5 M potassium (K) • 0.1 and 1 M free hydroxide (OH−) • 25, 35, and 50 °C.
In addition, a small subset of contacts was tested at 5 M Na, 1.0 M OH, three K concentrations, and four Cs concentrations to replicate previous test matrix conditions at the current test conditions for comparisons.
Numerous isotherms were developed from 336 batch contacts of small amounts of sRF H-form resin with a simple simulant (nominally 0.25 g of dry H-form resin with nominally 25 mL of simulant) contacted under inert nitrogen cover gas for 72 hours (to assure equilibrium conditions). The simulant was analyzed before and after batch contact for Na, K, Cs, OH, density, and water content. The Cs results were used to assess the Cs isotherms.
The following conclusions were developed from the isotherm testing:
• Efficacy: Tie back to previous data with the 5 M Na matrix conditions showed that the sRF had maintained its effectiveness since production and storage (5 years aging).
• Sodium Effect: Cs loading is virtually identical between 6.5 and 8 M Na at low Cs concentrations and slightly enhanced at 6.5 M Na and high Cs concentrations.
• Potassium Effect: The K effect varies with Cs concentrations. As K concentration increases, Cs loading decreases. However, the K effect diminishes as the Cs concentration increases, essentially resulting in convergence of isotherms at the highest Cs concentration tested.
(1) TP-SRFBC-001, sRF Resin Batch Contact Testing FY 2016, SK Fiskum, August 31, 2015 (not publicly
available). (2) Isotherms are graphical representations of the Cs loading capacity on ion exchange media as a function of
equilibrium Cs concentration.
PNNL-25277 RPT-SRFBC-001, Rev. 0
iii
• Hydroxide Effect: The equilibrium OH in this test was nominally 0.03 and 0.91 M (from the neutralization of feed matrix OH with the H-form resin). The effect of OH on Cs loading is slightly larger at higher Na levels. The more OH present, the more of a positive effect on the Cs loading is seen.
• Temperature Effect: At both 6.5 and 8 M Na, increasing temperature decreases Cs load capacity, regardless of K and OH concentrations. The depression at 8 M Na is slightly enhanced relative to the 6.5 M Na matrix.


PNNL-25277 RPT-SRFBC-001, Rev. 0
v
Acknowledgments
The authors gratefully acknowledge the efforts of Dr. Garrett Brown in his thorough technical review of the data; Mr. Matt Landon, Mr. Kevin Ard, and Dr. Clark Carlson for their consulting during the course of the testing; Mr. Bill Dey for quality assurance and quality control reviews; and Mr. Mike Parker for his efforts in technically editing this document.

PNNL-25277 RPT-SRFBC-001, Rev. 0
vii
Acronyms and Abbreviations
DOE U.S. Department of Energy ILAW immobilized low-activity waste LAW low-activity waste LAWPS Low-Activity Waste Pretreatment System PNNL Pacific Northwest National Laboratory QA quality assurance R&D research and development RF resorcinol formaldehyde RV resin volume sRF spherical resorcinol-formaldehyde (resin) SwRI Southwest Research Institute TI test instruction WRPS Washington River Protection Solutions WTP Hanford Tank Waste Treatment and Immobilization Plant WWFTP WRPS Waste Form Testing Program


PNNL-25277 RPT-SRFBC-001, Rev. 0
ix
Contents
Executive Summary ...................................................................................................................................... ii Acknowledgments ......................................................................................................................................... v Acronyms and Abbreviations ..................................................................................................................... vii 1.0 Introduction ....................................................................................................................................... 1.1
1.1 Quality Assurance ..................................................................................................................... 1.2 2.0 Experimental ...................................................................................................................................... 2.1
2.1 Spherical RF Resin .................................................................................................................... 2.1 2.2 Resin Pretreatment Processing .................................................................................................. 2.2 2.3 Simulant Preparation and Analysis ........................................................................................... 2.3 2.4 Batch Contact Experiments ..................................................................................................... 2.11
3.0 Isotherm Results and Discussion ....................................................................................................... 3.1 3.1 Isotherms-General ..................................................................................................................... 3.1
3.1.1 Na Effect on Resin Cs Loading ...................................................................................... 3.1 3.1.2 K Effect on Resin Cs Loading ........................................................................................ 3.4 3.1.3 OH Effect on Resin Cs Loading Capacity ...................................................................... 3.6 3.1.4 Temperature Effect on Resin Cs Loading Capacity ....................................................... 3.7
3.2 A Comparison of FY12 (from Russell et al. 2014) and FY16 Testing ................................... 3.10 3.3 Isotherm Comparison with Previous Isotherms ...................................................................... 3.10
4.0 Matrix Conditions Post-Contact Testing ........................................................................................... 4.1 5.0 Conclusions ....................................................................................................................................... 5.1 6.0 References ......................................................................................................................................... 6.1 Appendix A – As-Prepared Composition of Feed Simulant ..................................................................... A.1 Appendix B – Batch Testing Parameters ...................................................................................................B.1 Appendix C – Analytical Data ...................................................................................................................C.1 Appendix D – Isotherm Cs Loading Values ............................................................................................. D.1
PNNL-25277 RPT-SRFBC-001, Rev. 0
x
Figures
2.1 Finncont Containing sRF Resin ...................................................................................................... 2.1 2.2 Spherical Resorcinol-Formaldehyde Resin Lot Number 1F-370-1392, H-form Retrieved
Sample and Light Microscopy Image ............................................................................................. 2.2 2.3 Targeted Concentrations for the Batch Contact Simulants ............................................................. 2.4 2.4 IKA KS 4000 Temperature-Controlled Orbital Shaker Table ...................................................... 2.13 3.1 Replicate Isotherms for Precision Evaluation Log-Log Plot Linear-Linear Plot ........................... 3.2 3.2 Na Effect on Cs Loading at 50 °C, 0.35 M K, and 1.0 M OH ........................................................ 3.3 3.3 Na Effect on Cs Loading at 50 °C, 0.005 M K, and 0.1 M OH and 0 M K and 0.1 M OH ........... 3.3 3.4 Na Effect on Cs Loading at 25 °C, 0.35 M K, and 1.0 M OH ........................................................ 3.4 3.5 K Effect on Cs Loading at 50 °C, 6.5 and 8 M Na, and 0.1 M OH ................................................ 3.5 3.6 K Effect on Cs Loading at 25 °C, 6.5 and 8 M Na, and 0.1 M OH ................................................ 3.5 3.7 OH Effect on Cs Loading at 50°C and 0.00 M K ........................................................................... 3.6 3.8 OH Effect on Cs Loading at 25°C and 0.00 M K ........................................................................... 3.7 3.9 Temperature Effect of Na on Cs Loading at 0.1 M OH and 0.00 M K .......................................... 3.8 3.10 Temperature Effect of K on Cs Loading at 0.1 M OH and 6.5 M Na ............................................ 3.8 3.11 Temperature Effect of OH on Cs Loading at 6.5 M Na and 0.00 M K .......................................... 3.9 3.12 Temperature Effect of OH on Cs Loading at 8 M Na and 0.00 M K ............................................. 3.9 3.13 Temperature Effect on Cs Loading at 5 M Na, 1.0 M OH and 0.05 M K .................................... 3.10 3.14 Isotherm Comparison of Current Testing to Previous Work Log-Log Plot Linear-Linear
Plot ................................................................................................................................................ 3.11
Tables
2.1 Ion Exchange Pretreatment Process Steps ...................................................................................... 2.3 2.2 Batch Contact Feed Simulants – Target Concentrations, Measured Density and Water
Content ........................................................................................................................................... 2.5 2.3 Batch Contact Feed Simulants – Sodium and Hydroxide Contents ............................................... 2.7 2.4 Batch Contact Feed Simulants – K and Cs Contents ...................................................................... 2.9 4.1 Comparison of Pre- and Post-Contacted Solution Analysis ........................................................... 4.1 4.2 Calculated Equilibrium Hydroxide Concentration ......................................................................... 4.2

PNNL-25277 RPT-SRFBC-001, Rev. 0
1.1
1.0 Introduction
The U.S. Department of Energy (DOE) Hanford Site contains more than 53 million gallons of legacy waste generated as a byproduct of plutonium production and reprocessing operations. The waste consists of insoluble sludge, saltcake, and supernate and is stored in underground waste tanks. The supernates are complex mixtures composed mostly of NaNO3, NaNO2, NaOH, NaAlO2, Na3PO4, and Na2SO4, with a number of minor and trace metals, organics, and radionuclides, primarily 137Cs. The Low-Activity Waste Pretreatment System (LAWPS) project provides for the early production of immobilized low-activity waste (ILAW) by feeding low-activity waste (LAW) directly from Tank Farms to the Hanford Tank Waste Treatment and Immobilization Plant (WTP) LAW Vitrification Facility for immobilization. Prior to the transfer of feed to the WTP LAW Vitrification Facility, tank supernatant waste is intended to be pretreated in the LAWPS to meet the WTP LAW acceptance criteria. The key process operations for treating the waste include solids filtration and cesium (Cs) removal. Current planning requires the solids filtration activity be accomplished by the use of cross-flow filtration and the Cs removal be accomplished through the use of spherical resorcinol-formaldehyde (sRF) ion exchange resin.
Tasks related to technology maturation of the sRF resin are identified in RPP-PLAN-57181, Technology Maturation Plan for the Low-Activity Waste Pretreatment System Project (Ard 2014). One of those tasks (i.e., sRF-3) includes obtaining data on expanded isotherm testing above 6 M sodium (Na). Expanded isotherm testing was identified by the LAWPS project, during planning meetings, to aid in the optimization efficiency to be performed for waste concentrations up to 8 M Na. In addition, extending the Na range to 8 M may allow for increasing the waste acceptance criteria as described in RPP-RPT-58649, Waste Acceptance Criteria for the Low Activity Waste Pretreatment System (Reynolds 2015).
Test data for sRF batch distribution exist for Na concentrations ranging from 0.1 to 6.26 M and with potassium (K) concentrations ranging from 0 to 0.75 M (Russell et al. 2014; King et al. 2004; Nash and Isom 2010; Nash et al. 2006; Fiskum et al. 2004; Dwivedi et al. 2013). Test data for sRF small column testing exist for Na concentrations ranging from 2 to 8 M and with K concentrations ranging from 0 to 0.03 M (Russell et al. 2014; Russell et al. 2012). In addition, testing using a variety of simulated and actual Hanford tank wastes was conducted with nominally 5 M Na matrix (Fiskum et al. 2006a; Fiskum et al. 2006b; Fiskum et al. 2006c; Fiskum et al. 2007; Nash et al. 2006). These existing data are expected to cover the nominal conditions to which the ion exchange resin will be exposed. As described above, additional data are needed for Na concentrations up to 8.0 M. These additional data for the higher Na concentrations may support future optimization efficiency at the LAWPS.
This work was conducted with funding from Washington River Protection Solutions (WRPS) under contract 36437-186, Expanded Isotherm Testing for sRF Resin. The work was conducted as part of Pacific Northwest National Laboratory (PNNL) Project 68072 in accordance to a client-approved test plan(1) and four test instructions (i.e., TI-SRFBC0002(2), TI-SRFBC-003(3), TI-SRFBC-004(4), and TI-SRFBC-005(5)). The purpose of the work described in this report is to develop a series of isotherms at (1) TP-SRFBC-001, sRF Resin Batch Contact Testing FY 2016, SK Fiskum, August 31, 2015 (not publicly
available). (2) TI-SRFBC-002, Simulant Preparation for Extended Isotherm Batch Contact Testing, October 6, 2015 (not
publicly available). (3) TI-SRFBC-003. sRF Expanded Batch Contact Loading Tests at 25 °C. RL Russell, October 19, 2015 (not
publicly available). (4) TI-SRFBC-004. sRF Expanded Batch Contact Loading Tests at 35 °C. RL Russell, October 19, 2015 (not
publicly available). (5) TI-SRFBC-005. sRF Expanded Batch Contact Loading Tests at 50 °C. RL Russell, October 19, 2015 (not
publicly available).

PNNL-25277 RPT-SRFBC-001, Rev. 0
1.2
five Cs concentrations to show the impacts and interdependencies of Cs loading onto the sRF in a matrix with varying K, hydroxide (OH), and Na levels, and at three different temperatures.
This report is divided into sections as follows:
• Section 1.0 provides a brief introduction and details the basis of the PNNL Quality Assurance (QA) Program as applied to the WRPS quality requirements.
• Section 2.0 describes the test design, simplified simulant solution and sRF resin preparations, equipment, process steps, and chemical analyses.
• Section 3.0 provides a summary of the experimental isotherm data and includes discussions of the Na, K, and OH concentration and temperature effects on the Cs loading onto the sRF.
• Section 4.0 provides a discussion of the post-batch-contacted simulant solution properties inclusive of water content, simulant density, and OH concentration.
• Section 5.0 provides a list of conclusions and recommendations obtained from this experimental work.
• Section 6.0 provides the full reference list.
• Appendix A provides the simple simulant composition, as prepared.
• Appendix B lists the specific batch contact experimental conditions on a sample-by-sample basis.
• Appendix C provides the Na, Cs, K, and OH analytical data provided by Southwest Research Institute (SwRI) on the simulant feed and post-contacted solutions.
• Appendix D provides the isotherm data set summary inclusive of the sample identification (ID), equilibrium Cs concentration, and the calculated millimoles Cs per gram H-form resin.
1.1 Quality Assurance
All research and development (R&D) work at PNNL is performed in accordance with PNNL’s laboratory-level Quality Management Program, which is based on a graded application of NQA-1-2000, Quality Assurance Requirements for Nuclear Facility Applications, to R&D activities. In addition to the PNNL-wide QA controls, the QA controls of the WRPS Waste Form Testing Program (WWFTP) QA program were also implemented for the work. The WWFTP QA program consists of the WWFTP Quality Assurance Plan (QA-WWFTP-001) and associated QA-NSLW-numbered procedures that provide detailed instructions for implementing NQA-1 requirements for R&D work. The WWFTP QA program is based on the requirements of NQA-1-2008, Quality Assurance Requirements for Nuclear Facility Applications, and NQA-1a-2009, Addenda to ASME NQA-1-2008 Quality Assurance Requirements for Nuclear Facility Applications, graded on the approach presented in NQA-1-2008, Part IV, Subpart 4.2, “Guidance on Graded Application of Quality Assurance (QA) for Nuclear-Related Research and Development”. Preparation of this report and performance of the associated experimental work were assigned the technology level “Applied Research” and were conducted in accordance with procedure QA-NSLW-1102, Scientific Investigation for Applied Research. All staff members contributing to the work have technical expertise in the subject matter and received QA training prior to performing quality-affecting work. The “Applied Research” technology level provides adequate controls to ensure that the activities were performed correctly. Use of both the PNNL-wide and WWFTP QA controls ensured that all client QA expectations were addressed in performing the work.

PNNL-25277 RPT-SRFBC-001, Rev. 0
2.1
2.0 Experimental
This section describes the sRF test resin, resin preparation, simple simulant preparation, batch ion exchange processing conditions, and post-batch-contacted solution analysis. Experimental conditions and analytical data are provided in Appendix A and Appendix B, respectively.
2.1 Spherical RF Resin
The sRF resin used in these tests was prepared by Microbeads (Skedsmokorset, Norway), Lot Number 1F-370-1392 (sometimes referred to as 1F-370/1392) manufactured in August 2011. The resin had been stored as manufactured in the H-form in water under pressurized nitrogen gas (0.26 bar). These storage conditions were maintained in the storage container: a sealed Finncont(1) as shown in Figure 2.1. Because the resin is known to degrade on contact with oxygen from air, purging with inert gas is considered necessary. The oxidation-degradation is not a physical hazard, but it will damage active Cs exchange sites and thus reduce effectiveness as a Cs ion exchanger.
Figure 2.1. Finncont Containing sRF Resin
WRPS received the resin from the manufacturer in April 2015 and stored the Finncont in a climate-controlled area until transferring it to PNNL. The Finncont was received at PNNL on September 1, 2015. The internal pressure was recorded at 0.26 bar based on the Nuova FIMA gage installed on the Finncont on September 2, 2015. A ~1 L representative sample was removed from the Finncont on November 5, 2015 with the aid of vacuum transfer for use in the batch contact tests. After removal of the resin sample
(1) See http://www.finncont.com/index.php/en/products/tailored-active-container for a description of the vessel
manufactured by FINNCONT Oy, Kiertotie 10-12, PL 44, 34801 VIRRAT Finland.
PNNL-25277 RPT-SRFBC-001, Rev. 0
2.2
from the Finncont, the headspace in the Finncont was purged with nitrogen gas to remove the air (and oxygen) and left slightly pressurized at 0.155 bar. The headspace in the sample container was also purged with nitrogen gas to protect the resin from oxygen, but was not pressurized.
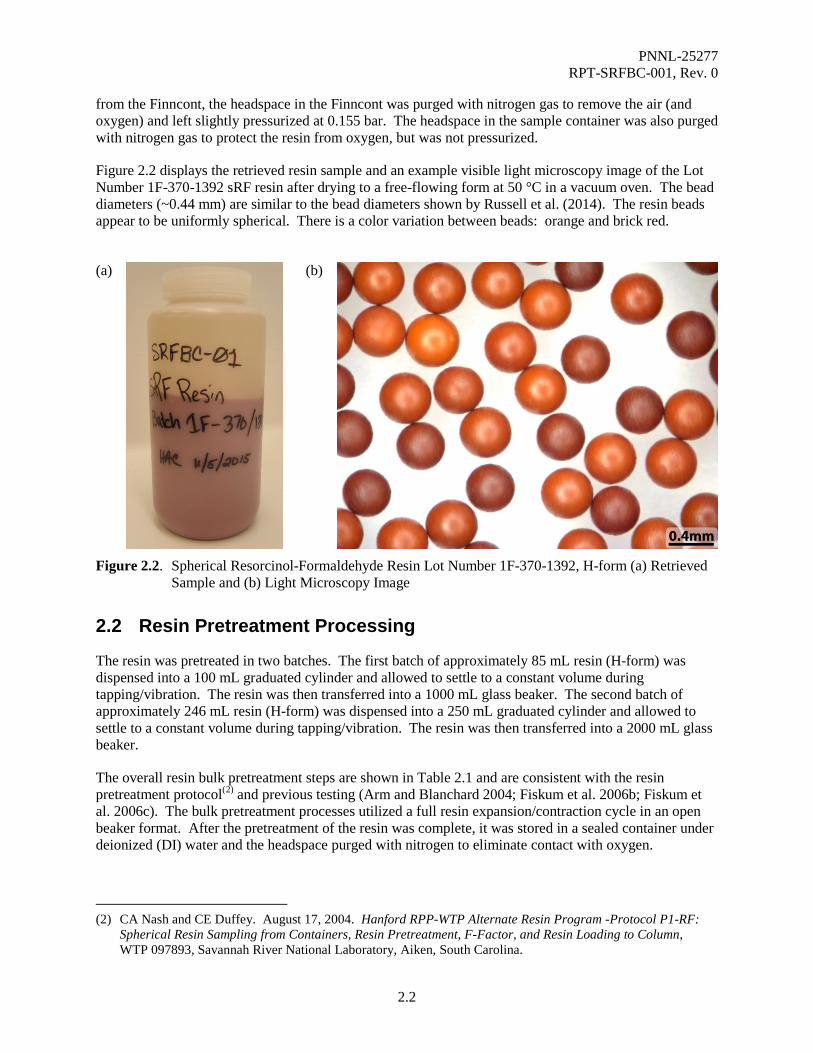
Figure 2.2 displays the retrieved resin sample and an example visible light microscopy image of the Lot Number 1F-370-1392 sRF resin after drying to a free-flowing form at 50 °C in a vacuum oven. The bead diameters (~0.44 mm) are similar to the bead diameters shown by Russell et al. (2014). The resin beads appear to be uniformly spherical. There is a color variation between beads: orange and brick red.
(a)
(b)
Figure 2.2. Spherical Resorcinol-Formaldehyde Resin Lot Number 1F-370-1392, H-form (a) Retrieved
Sample and (b) Light Microscopy Image
2.2 Resin Pretreatment Processing
The resin was pretreated in two batches. The first batch of approximately 85 mL resin (H-form) was dispensed into a 100 mL graduated cylinder and allowed to settle to a constant volume during tapping/vibration. The resin was then transferred into a 1000 mL glass beaker. The second batch of approximately 246 mL resin (H-form) was dispensed into a 250 mL graduated cylinder and allowed to settle to a constant volume during tapping/vibration. The resin was then transferred into a 2000 mL glass beaker.
The overall resin bulk pretreatment steps are shown in Table 2.1 and are consistent with the resin pretreatment protocol(2) and previous testing (Arm and Blanchard 2004; Fiskum et al. 2006b; Fiskum et al. 2006c). The bulk pretreatment processes utilized a full resin expansion/contraction cycle in an open beaker format. After the pretreatment of the resin was complete, it was stored in a sealed container under deionized (DI) water and the headspace purged with nitrogen to eliminate contact with oxygen.
(2) CA Nash and CE Duffey. August 17, 2004. Hanford RPP-WTP Alternate Resin Program -Protocol P1-RF:
Spherical Resin Sampling from Containers, Resin Pretreatment, F-Factor, and Resin Loading to Column, WTP 097893, Savannah River National Laboratory, Aiken, South Carolina.

PNNL-25277 RPT-SRFBC-001, Rev. 0
2.3
Table 2.1. Ion Exchange Pretreatment Process Steps
Process/Pretreatment Step Solution Volume Time Mixing Bulk Pretreatment
Water Rinse DI Water 5 RV(a) 40 min Swirl(b) Resin Expansion 1 M NaOH 5 RV 1 h Swirl Resin Expansion 1 M NaOH -- 20 h Soak Water Rinse – 1st DI Water 5 RV 30 min Swirl Water Rinse – 2nd DI Water 5 RV 45 min Swirl Water Rinse – 3rd DI Water 5 RV 30 min Swirl Resin Conversion 0.5 M HNO3 10 RV 2 h Swirl Water Rinse – 4th DI Water 6 RV 30 min Swirl Water Rinse – 5th DI Water 6 RV 30 min Swirl Water Rinse – 6th DI Water 6 RV 30 min Swirl
(a) Resin volume (RV), original volume of resin subsample collected for pretreatment. (b) Gently swirling by hand every 10 min.
2.3 Simulant Preparation and Analysis
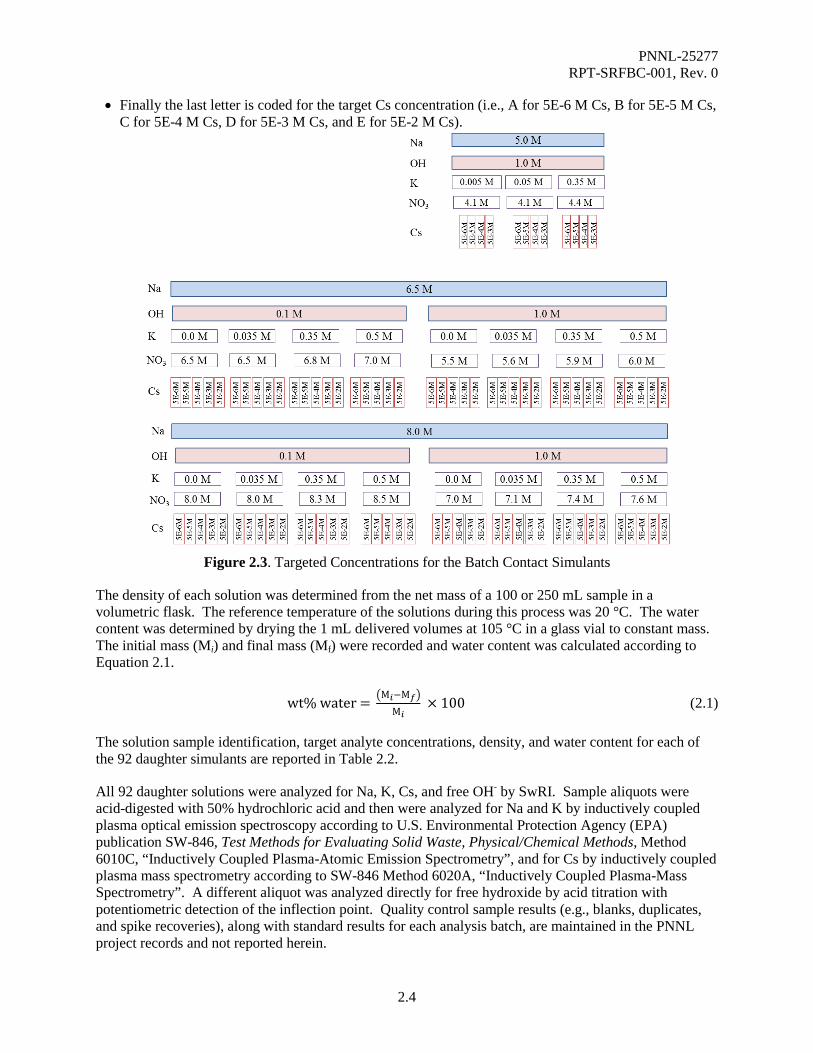
A total of 92 aqueous non-radioactive simulant stock solutions were prepared for use in batch contact testing. The simulants were prepared stepwise by first preparing 19 ‘mother’ simulant solutions. The mother simulant solutions’ targeted concentrations for Na, K, and OH are shown in Figure 2.3. The ‘daughter’ simulants were prepared by spiking subsamples of the mother simulant with CsNO3 at varying concentrations as shown in Figure 2.3 to achieve the 92 daughter simulant solutions.
The mother simulants were prepared by dissolving sodium nitrate (NaNO3) and potassium nitrate (KNO3) salts and adding 50% (w/w) sodium hydroxide (NaOH) and deionized water (18 MΩ resistivity). Solubility limitations of all nitrate solutions precluded achieving 8 M Na. Therefore, to achieve 8 M Na solutions for the mother simulants, sodium nitrite (NaNO2) was used in addition to sodium nitrate and sodium hydroxide. Both sodium nitrate and sodium nitrite are expected to act as spectator anions with no effect on the Cs batch equilibrium. Note that the exclusion of other anions (aluminate, sulfate, etc.) from the simulant impacts the ionic strength of the solution; comparisons to other data should account for this difference. The complete simulant composition, inclusive of anions, is shown in Appendix A.
The 5 M Na matrix testing was limited in scope. It was intended to be a direct link to previously reported data (Russell et al. 2014, Fiskum et al. 2004, and Nash et al. 2006). The testing reported herein uses altered parameters relative to those used by Russell et al. (2014): resin lot, resin age, phase ratio, and inerting the batch contact vessel. Thus, should the isotherm results differ for the identical simulant matrix, the difference may be attributed to the altered test parameters.
Each of the 92 daughter simulants was tracked with identification such as 5-H-2-A.
• The first number represents the nominal Na concentration (i.e., 5 for 5 M Na, 6 for 6.5 M Na, and 8 for 8 M Na).
• The middle letter designates the hydroxide content (i.e., L for 0.1 M hydroxide and H for 1 M hydroxide).
• The middle digit signifies the K concentration (i.e., 1 for 0 M K, 2 for 0.005 M K, 3 for 0.035 M K, 4 for 0.05 M K, 5 for 0.35 M K and 6 for 0.5 M K).
PNNL-25277 RPT-SRFBC-001, Rev. 0
2.4
• Finally the last letter is coded for the target Cs concentration (i.e., A for 5E-6 M Cs, B for 5E-5 M Cs, C for 5E-4 M Cs, D for 5E-3 M Cs, and E for 5E-2 M Cs).
Figure 2.3. Targeted Concentrations for the Batch Contact Simulants
The density of each solution was determined from the net mass of a 100 or 250 mL sample in a volumetric flask. The reference temperature of the solutions during this process was 20 °C. The water content was determined by drying the 1 mL delivered volumes at 105 °C in a glass vial to constant mass. The initial mass (Mi) and final mass (Mf) were recorded and water content was calculated according to Equation 2.1.
wt% water = M𝑖𝑖−M𝑓𝑓M𝑖𝑖
× 100 (2.1)
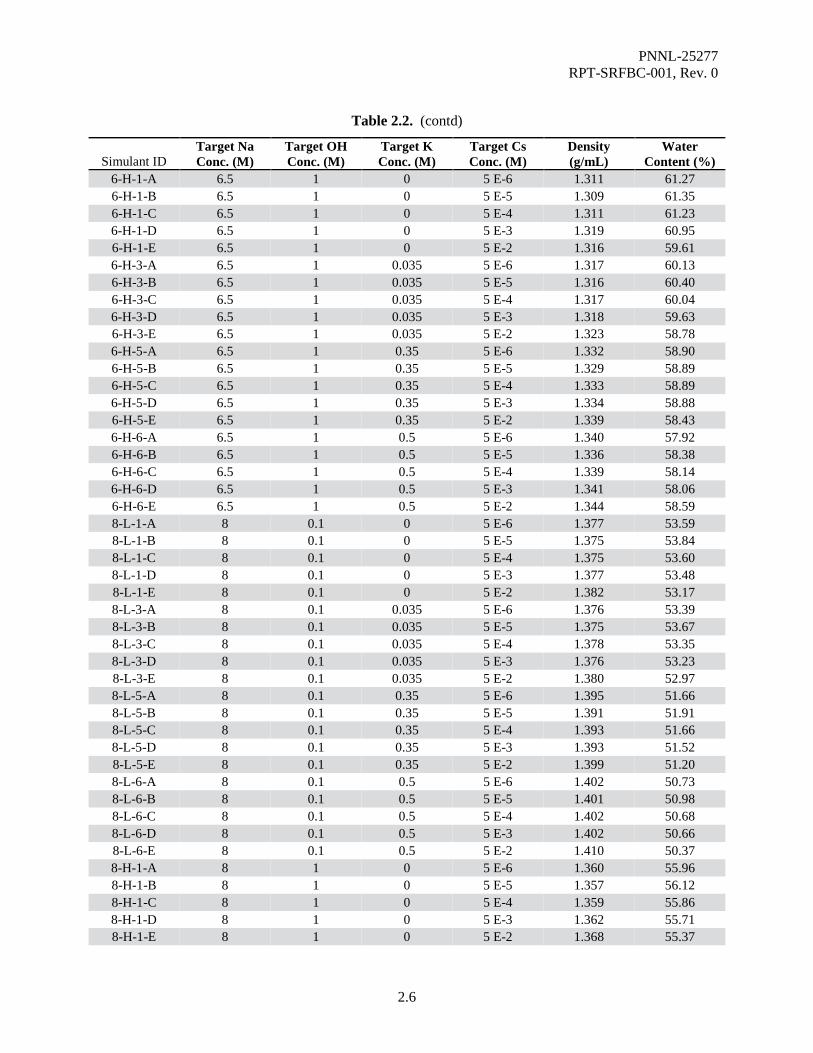
The solution sample identification, target analyte concentrations, density, and water content for each of the 92 daughter simulants are reported in Table 2.2.
All 92 daughter solutions were analyzed for Na, K, Cs, and free OH- by SwRI. Sample aliquots were acid-digested with 50% hydrochloric acid and then were analyzed for Na and K by inductively coupled plasma optical emission spectroscopy according to U.S. Environmental Protection Agency (EPA) publication SW-846, Test Methods for Evaluating Solid Waste, Physical/Chemical Methods, Method 6010C, “Inductively Coupled Plasma-Atomic Emission Spectrometry”, and for Cs by inductively coupled plasma mass spectrometry according to SW-846 Method 6020A, “Inductively Coupled Plasma-Mass Spectrometry”. A different aliquot was analyzed directly for free hydroxide by acid titration with potentiometric detection of the inflection point. Quality control sample results (e.g., blanks, duplicates, and spike recoveries), along with standard results for each analysis batch, are maintained in the PNNL project records and not reported herein.

PNNL-25277 RPT-SRFBC-001, Rev. 0
2.5
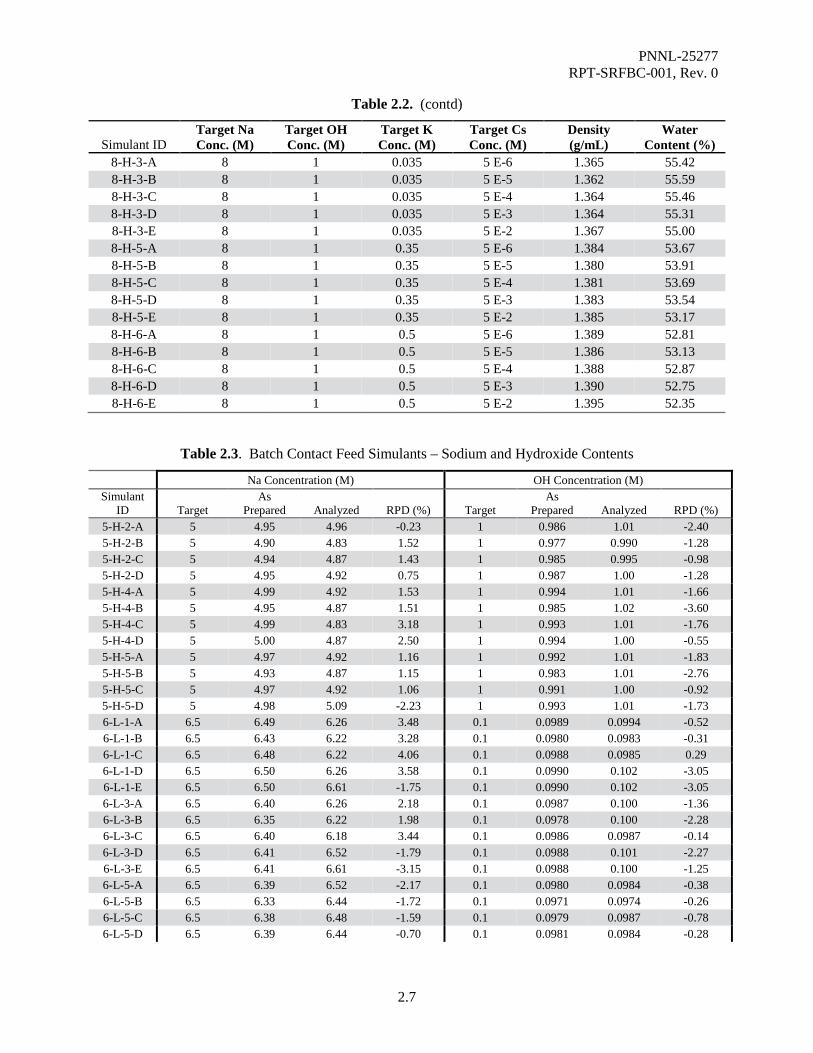
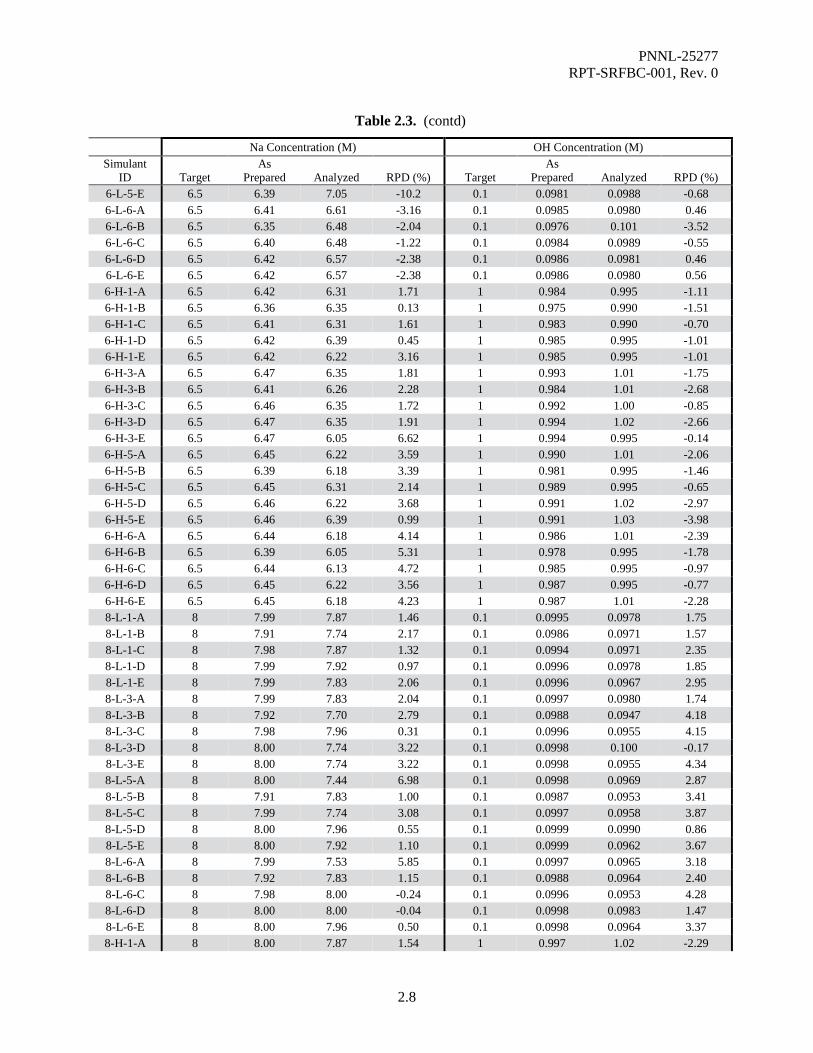
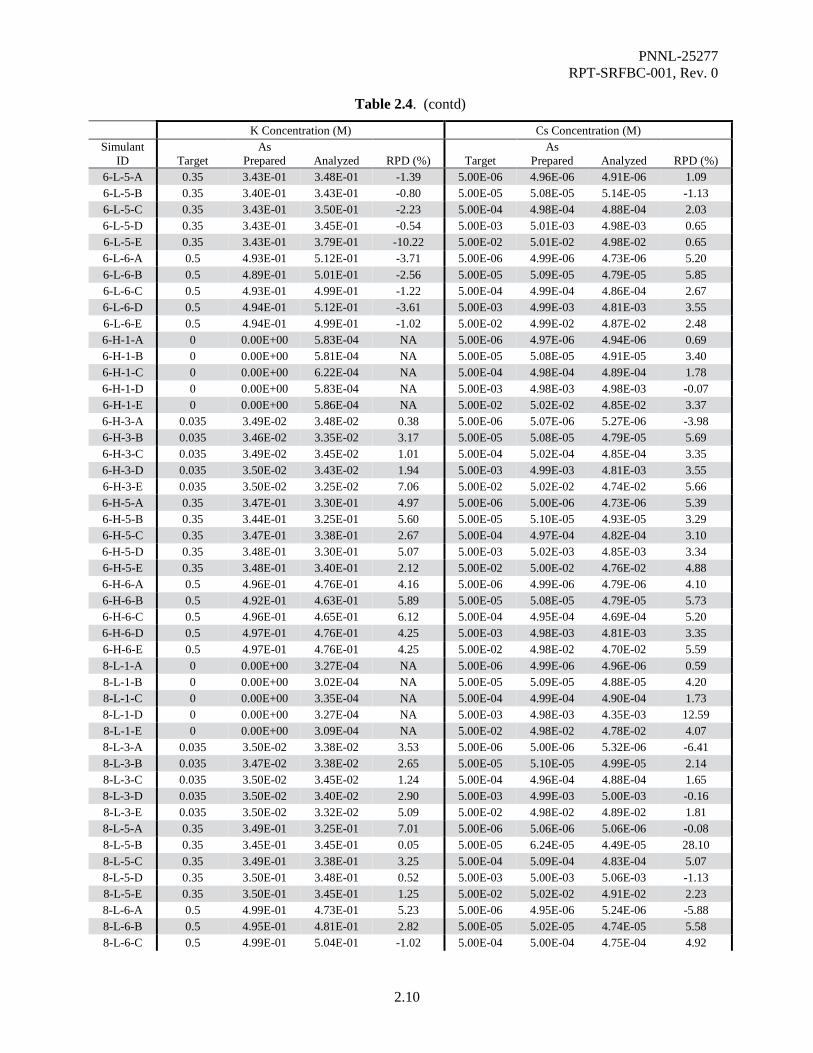
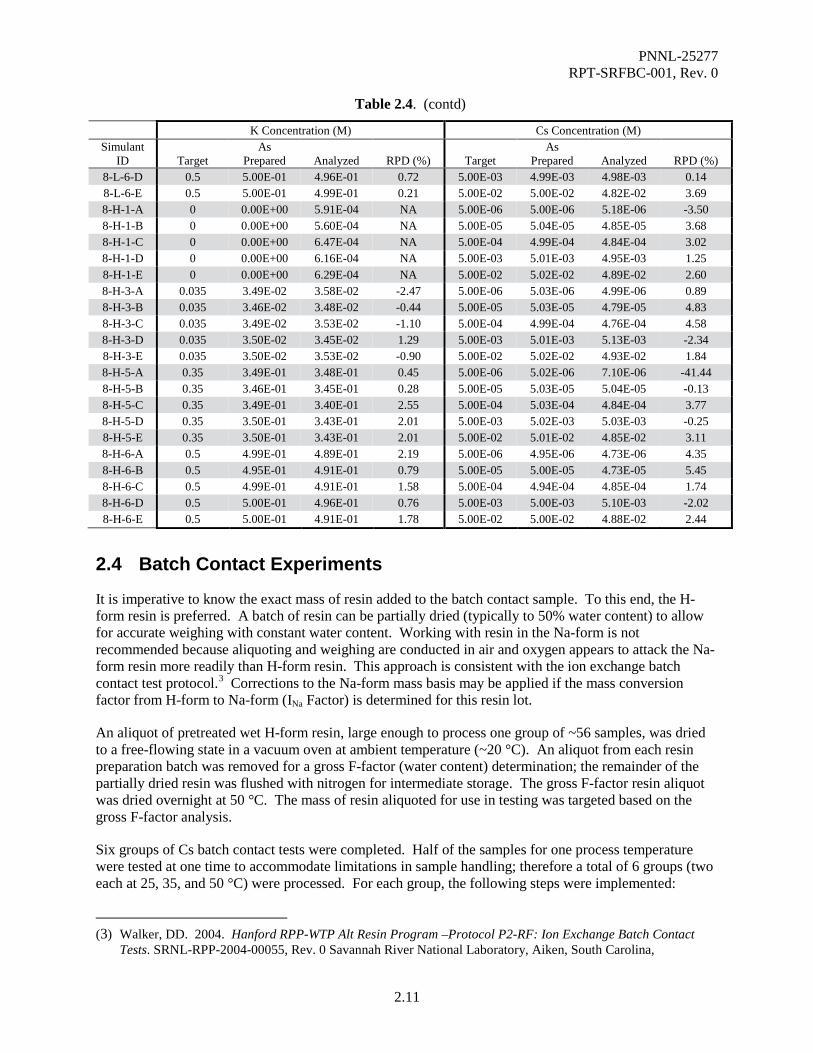
In most cases the measured analyte concentrations were within 10% of the calculated as-prepared concentrations, confirming accuracy of the simulant preparation. In some cases, the analyzed concentration deviated more than 10% from the calculated concentration. The Na and K content in one simulant (6-L-5-E at 6.5 M Na) deviated by 10.2%. In the case of K analysis, the 5 M Na simulant with 0.005 M K had analysis values approximately 15-22% higher than calculated as prepared. In all cases, the 0 M K simulants had reportable K levels in the 10-4 M range, likely a contaminant in the Na salts. For the Cs analysis, four simulants (6-L-3-A, 8-L-1-D, 8-L-5-B, and 8-H-5-A) deviated >10% from the calculated as-prepared value. Table 2.3 lists each daughter simulant, its target Na and hydroxide concentrations, as-prepared concentrations for Na and hydroxide, analyzed concentrations for Na and hydroxide, and the relative percent difference (RPD) between as-prepared and analyzed for each analyte. Table 2.4 lists each daughter simulant, its target K and Cs concentrations, as-prepared concentrations for K and Cs, analyzed concentrations for K and Cs, and the RPD between as-prepared and analyzed for each analyte. For the purposes of batch contact sample data analysis, the measured analyte concentrations were used as the definitive feed analyte concentrations.
Table 2.2. Batch Contact Feed Simulants – Target Concentrations, Measured Density and Water Content
Simulant ID Target Na Conc. (M)
Target OH Conc. (M)
Target K Conc. (M)
Target Cs Conc. (M)
Density (g/mL)
Water Content (%)
5-H-2-A 5 1 0.005 5 E-6 1.242 68.65 5-H-2-B 5 1 0.005 5 E-5 1.241 69.10 5-H-2-C 5 1 0.005 5 E-4 1.242 68.71 5-H-2-D 5 1 0.005 5 E-3 1.242 68.49 5-H-4-A 5 1 0.05 5 E-6 1.244 67.79 5-H-4-B 5 1 0.05 5 E-5 1.243 67.95 5-H-4-C 5 1 0.05 5 E-4 1.246 67.82 5-H-4-D 5 1 0.05 5 E-3 1.247 67.43 5-H-5-A 5 1 0.35 5 E-6 1.261 66.83 5-H-5-B 5 1 0.35 5 E-5 1.259 66.93 5-H-5-C 5 1 0.35 5 E-4 1.260 66.81 5-H-5-D 5 1 0.35 5 E-3 1.262 66.74 6-L-1-A 6.5 0.1 0 5 E-6 1.349 58.37 6-L-1-B 6.5 0.1 0 5 E-5 1.330 58.74 6-L-1-C 6.5 0.1 0 5 E-4 1.331 58.43 6-L-1-D 6.5 0.1 0 5 E-3 1.332 58.29 6-L-1-E 6.5 0.1 0 5 E-2 1.335 57.89 6-L-3-A 6.5 0.1 0.035 5 E-6 1.327 58.63 6-L-3-B 6.5 0.1 0.035 5 E-5 1.324 58.92 6-L-3-C 6.5 0.1 0.035 5 E-4 1.326 58.69 6-L-3-D 6.5 0.1 0.035 5 E-3 1.327 58.57 6-L-3-E 6.5 0.1 0.035 5 E-2 1.333 58.21 6-L-5-A 6.5 0.1 0.35 5 E-6 1.344 56.81 6-L-5-B 6.5 0.1 0.35 5 E-5 1.341 57.13 6-L-5-C 6.5 0.1 0.35 5 E-4 1.345 56.83 6-L-5-D 6.5 0.1 0.35 5 E-3 1.345 56.73 6-L-5-E 6.5 0.1 0.35 5 E-2 1.350 56.31 6-L-6-A 6.5 0.1 0.5 5 E-6 1.354 55.84 6-L-6-B 6.5 0.1 0.5 5 E-5 1.352 56.14 6-L-6-C 6.5 0.1 0.5 5 E-4 1.353 55.86 6-L-6-D 6.5 0.1 0.5 5 E-3 1.355 55.77 6-L-6-E 6.5 0.1 0.5 5 E-2 1.357 55.38
PNNL-25277 RPT-SRFBC-001, Rev. 0
2.6
Table 2.2. (contd)
Simulant ID Target Na Conc. (M)
Target OH Conc. (M)
Target K Conc. (M)
Target Cs Conc. (M)
Density (g/mL)
Water Content (%)
6-H-1-A 6.5 1 0 5 E-6 1.311 61.27 6-H-1-B 6.5 1 0 5 E-5 1.309 61.35 6-H-1-C 6.5 1 0 5 E-4 1.311 61.23 6-H-1-D 6.5 1 0 5 E-3 1.319 60.95 6-H-1-E 6.5 1 0 5 E-2 1.316 59.61 6-H-3-A 6.5 1 0.035 5 E-6 1.317 60.13 6-H-3-B 6.5 1 0.035 5 E-5 1.316 60.40 6-H-3-C 6.5 1 0.035 5 E-4 1.317 60.04 6-H-3-D 6.5 1 0.035 5 E-3 1.318 59.63 6-H-3-E 6.5 1 0.035 5 E-2 1.323 58.78 6-H-5-A 6.5 1 0.35 5 E-6 1.332 58.90 6-H-5-B 6.5 1 0.35 5 E-5 1.329 58.89 6-H-5-C 6.5 1 0.35 5 E-4 1.333 58.89 6-H-5-D 6.5 1 0.35 5 E-3 1.334 58.88 6-H-5-E 6.5 1 0.35 5 E-2 1.339 58.43 6-H-6-A 6.5 1 0.5 5 E-6 1.340 57.92 6-H-6-B 6.5 1 0.5 5 E-5 1.336 58.38 6-H-6-C 6.5 1 0.5 5 E-4 1.339 58.14 6-H-6-D 6.5 1 0.5 5 E-3 1.341 58.06 6-H-6-E 6.5 1 0.5 5 E-2 1.344 58.59 8-L-1-A 8 0.1 0 5 E-6 1.377 53.59 8-L-1-B 8 0.1 0 5 E-5 1.375 53.84 8-L-1-C 8 0.1 0 5 E-4 1.375 53.60 8-L-1-D 8 0.1 0 5 E-3 1.377 53.48 8-L-1-E 8 0.1 0 5 E-2 1.382 53.17 8-L-3-A 8 0.1 0.035 5 E-6 1.376 53.39 8-L-3-B 8 0.1 0.035 5 E-5 1.375 53.67 8-L-3-C 8 0.1 0.035 5 E-4 1.378 53.35 8-L-3-D 8 0.1 0.035 5 E-3 1.376 53.23 8-L-3-E 8 0.1 0.035 5 E-2 1.380 52.97 8-L-5-A 8 0.1 0.35 5 E-6 1.395 51.66 8-L-5-B 8 0.1 0.35 5 E-5 1.391 51.91 8-L-5-C 8 0.1 0.35 5 E-4 1.393 51.66 8-L-5-D 8 0.1 0.35 5 E-3 1.393 51.52 8-L-5-E 8 0.1 0.35 5 E-2 1.399 51.20 8-L-6-A 8 0.1 0.5 5 E-6 1.402 50.73 8-L-6-B 8 0.1 0.5 5 E-5 1.401 50.98 8-L-6-C 8 0.1 0.5 5 E-4 1.402 50.68 8-L-6-D 8 0.1 0.5 5 E-3 1.402 50.66 8-L-6-E 8 0.1 0.5 5 E-2 1.410 50.37 8-H-1-A 8 1 0 5 E-6 1.360 55.96 8-H-1-B 8 1 0 5 E-5 1.357 56.12 8-H-1-C 8 1 0 5 E-4 1.359 55.86 8-H-1-D 8 1 0 5 E-3 1.362 55.71 8-H-1-E 8 1 0 5 E-2 1.368 55.37
PNNL-25277 RPT-SRFBC-001, Rev. 0
2.7
Table 2.2. (contd)
Simulant ID Target Na Conc. (M)
Target OH Conc. (M)
Target K Conc. (M)
Target Cs Conc. (M)
Density (g/mL)
Water Content (%)
8-H-3-A 8 1 0.035 5 E-6 1.365 55.42 8-H-3-B 8 1 0.035 5 E-5 1.362 55.59 8-H-3-C 8 1 0.035 5 E-4 1.364 55.46 8-H-3-D 8 1 0.035 5 E-3 1.364 55.31 8-H-3-E 8 1 0.035 5 E-2 1.367 55.00 8-H-5-A 8 1 0.35 5 E-6 1.384 53.67 8-H-5-B 8 1 0.35 5 E-5 1.380 53.91 8-H-5-C 8 1 0.35 5 E-4 1.381 53.69 8-H-5-D 8 1 0.35 5 E-3 1.383 53.54 8-H-5-E 8 1 0.35 5 E-2 1.385 53.17 8-H-6-A 8 1 0.5 5 E-6 1.389 52.81 8-H-6-B 8 1 0.5 5 E-5 1.386 53.13 8-H-6-C 8 1 0.5 5 E-4 1.388 52.87 8-H-6-D 8 1 0.5 5 E-3 1.390 52.75 8-H-6-E 8 1 0.5 5 E-2 1.395 52.35
Table 2.3. Batch Contact Feed Simulants – Sodium and Hydroxide Contents
Na Concentration (M) OH Concentration (M) Simulant
ID Target As
Prepared Analyzed RPD (%) Target As
Prepared Analyzed RPD (%) 5-H-2-A 5 4.95 4.96 -0.23 1 0.986 1.01 -2.40 5-H-2-B 5 4.90 4.83 1.52 1 0.977 0.990 -1.28 5-H-2-C 5 4.94 4.87 1.43 1 0.985 0.995 -0.98 5-H-2-D 5 4.95 4.92 0.75 1 0.987 1.00 -1.28 5-H-4-A 5 4.99 4.92 1.53 1 0.994 1.01 -1.66 5-H-4-B 5 4.95 4.87 1.51 1 0.985 1.02 -3.60 5-H-4-C 5 4.99 4.83 3.18 1 0.993 1.01 -1.76 5-H-4-D 5 5.00 4.87 2.50 1 0.994 1.00 -0.55 5-H-5-A 5 4.97 4.92 1.16 1 0.992 1.01 -1.83 5-H-5-B 5 4.93 4.87 1.15 1 0.983 1.01 -2.76 5-H-5-C 5 4.97 4.92 1.06 1 0.991 1.00 -0.92 5-H-5-D 5 4.98 5.09 -2.23 1 0.993 1.01 -1.73 6-L-1-A 6.5 6.49 6.26 3.48 0.1 0.0989 0.0994 -0.52 6-L-1-B 6.5 6.43 6.22 3.28 0.1 0.0980 0.0983 -0.31 6-L-1-C 6.5 6.48 6.22 4.06 0.1 0.0988 0.0985 0.29 6-L-1-D 6.5 6.50 6.26 3.58 0.1 0.0990 0.102 -3.05 6-L-1-E 6.5 6.50 6.61 -1.75 0.1 0.0990 0.102 -3.05 6-L-3-A 6.5 6.40 6.26 2.18 0.1 0.0987 0.100 -1.36 6-L-3-B 6.5 6.35 6.22 1.98 0.1 0.0978 0.100 -2.28 6-L-3-C 6.5 6.40 6.18 3.44 0.1 0.0986 0.0987 -0.14 6-L-3-D 6.5 6.41 6.52 -1.79 0.1 0.0988 0.101 -2.27 6-L-3-E 6.5 6.41 6.61 -3.15 0.1 0.0988 0.100 -1.25 6-L-5-A 6.5 6.39 6.52 -2.17 0.1 0.0980 0.0984 -0.38 6-L-5-B 6.5 6.33 6.44 -1.72 0.1 0.0971 0.0974 -0.26 6-L-5-C 6.5 6.38 6.48 -1.59 0.1 0.0979 0.0987 -0.78 6-L-5-D 6.5 6.39 6.44 -0.70 0.1 0.0981 0.0984 -0.28
PNNL-25277 RPT-SRFBC-001, Rev. 0
2.8
Table 2.3. (contd)
Na Concentration (M) OH Concentration (M) Simulant
ID Target As
Prepared Analyzed RPD (%) Target As
Prepared Analyzed RPD (%) 6-L-5-E 6.5 6.39 7.05 -10.2 0.1 0.0981 0.0988 -0.68 6-L-6-A 6.5 6.41 6.61 -3.16 0.1 0.0985 0.0980 0.46 6-L-6-B 6.5 6.35 6.48 -2.04 0.1 0.0976 0.101 -3.52 6-L-6-C 6.5 6.40 6.48 -1.22 0.1 0.0984 0.0989 -0.55 6-L-6-D 6.5 6.42 6.57 -2.38 0.1 0.0986 0.0981 0.46 6-L-6-E 6.5 6.42 6.57 -2.38 0.1 0.0986 0.0980 0.56 6-H-1-A 6.5 6.42 6.31 1.71 1 0.984 0.995 -1.11 6-H-1-B 6.5 6.36 6.35 0.13 1 0.975 0.990 -1.51 6-H-1-C 6.5 6.41 6.31 1.61 1 0.983 0.990 -0.70 6-H-1-D 6.5 6.42 6.39 0.45 1 0.985 0.995 -1.01 6-H-1-E 6.5 6.42 6.22 3.16 1 0.985 0.995 -1.01 6-H-3-A 6.5 6.47 6.35 1.81 1 0.993 1.01 -1.75 6-H-3-B 6.5 6.41 6.26 2.28 1 0.984 1.01 -2.68 6-H-3-C 6.5 6.46 6.35 1.72 1 0.992 1.00 -0.85 6-H-3-D 6.5 6.47 6.35 1.91 1 0.994 1.02 -2.66 6-H-3-E 6.5 6.47 6.05 6.62 1 0.994 0.995 -0.14 6-H-5-A 6.5 6.45 6.22 3.59 1 0.990 1.01 -2.06 6-H-5-B 6.5 6.39 6.18 3.39 1 0.981 0.995 -1.46 6-H-5-C 6.5 6.45 6.31 2.14 1 0.989 0.995 -0.65 6-H-5-D 6.5 6.46 6.22 3.68 1 0.991 1.02 -2.97 6-H-5-E 6.5 6.46 6.39 0.99 1 0.991 1.03 -3.98 6-H-6-A 6.5 6.44 6.18 4.14 1 0.986 1.01 -2.39 6-H-6-B 6.5 6.39 6.05 5.31 1 0.978 0.995 -1.78 6-H-6-C 6.5 6.44 6.13 4.72 1 0.985 0.995 -0.97 6-H-6-D 6.5 6.45 6.22 3.56 1 0.987 0.995 -0.77 6-H-6-E 6.5 6.45 6.18 4.23 1 0.987 1.01 -2.28 8-L-1-A 8 7.99 7.87 1.46 0.1 0.0995 0.0978 1.75 8-L-1-B 8 7.91 7.74 2.17 0.1 0.0986 0.0971 1.57 8-L-1-C 8 7.98 7.87 1.32 0.1 0.0994 0.0971 2.35 8-L-1-D 8 7.99 7.92 0.97 0.1 0.0996 0.0978 1.85 8-L-1-E 8 7.99 7.83 2.06 0.1 0.0996 0.0967 2.95 8-L-3-A 8 7.99 7.83 2.04 0.1 0.0997 0.0980 1.74 8-L-3-B 8 7.92 7.70 2.79 0.1 0.0988 0.0947 4.18 8-L-3-C 8 7.98 7.96 0.31 0.1 0.0996 0.0955 4.15 8-L-3-D 8 8.00 7.74 3.22 0.1 0.0998 0.100 -0.17 8-L-3-E 8 8.00 7.74 3.22 0.1 0.0998 0.0955 4.34 8-L-5-A 8 8.00 7.44 6.98 0.1 0.0998 0.0969 2.87 8-L-5-B 8 7.91 7.83 1.00 0.1 0.0987 0.0953 3.41 8-L-5-C 8 7.99 7.74 3.08 0.1 0.0997 0.0958 3.87 8-L-5-D 8 8.00 7.96 0.55 0.1 0.0999 0.0990 0.86 8-L-5-E 8 8.00 7.92 1.10 0.1 0.0999 0.0962 3.67 8-L-6-A 8 7.99 7.53 5.85 0.1 0.0997 0.0965 3.18 8-L-6-B 8 7.92 7.83 1.15 0.1 0.0988 0.0964 2.40 8-L-6-C 8 7.98 8.00 -0.24 0.1 0.0996 0.0953 4.28 8-L-6-D 8 8.00 8.00 -0.04 0.1 0.0998 0.0983 1.47 8-L-6-E 8 8.00 7.96 0.50 0.1 0.0998 0.0964 3.37 8-H-1-A 8 8.00 7.87 1.54 1 0.997 1.02 -2.29

PNNL-25277 RPT-SRFBC-001, Rev. 0
2.9
Table 2.3. (contd)
Na Concentration (M) OH Concentration (M) Simulant
ID Target As
Prepared Analyzed RPD (%) Target As
Prepared Analyzed RPD (%) 8-H-1-B 8 7.92 7.92 0.09 1 0.988 0.965 2.35 8-H-1-C 8 7.99 8.00 -0.20 1 0.996 0.970 2.63 8-H-1-D 8 8.00 8.00 0.00 1 0.998 0.950 4.82 8-H-1-E 8 8.00 7.96 0.55 1 0.998 0.965 3.32 8-H-3-A 8 7.99 8.18 -2.32 1 0.997 1.02 -2.28 8-H-3-B 8 7.92 7.92 0.04 1 0.988 1.00 -1.19 8-H-3-C 8 7.98 8.09 -1.34 1 0.996 1.01 -1.38 8-H-3-D 8 8.00 7.83 2.13 1 0.998 1.01 -1.18 8-H-3-E 8 8.00 8.00 -0.05 1 0.998 1.01 -1.18 8-H-5-A 8 8.00 8.00 -0.07 1 0.997 1.02 -2.30 8-H-5-B 8 7.93 8.00 -0.98 1 0.988 1.02 -3.23 8-H-5-C 8 7.99 7.96 0.38 1 0.996 1.03 -3.41 8-H-5-D 8 8.01 7.92 1.12 1 0.998 1.01 -1.19 8-H-5-E 8 8.01 7.92 1.12 1 0.998 1.00 -0.19 8-H-6-A 8 7.99 7.87 1.50 1 0.997 1.00 -0.29 8-H-6-B 8 7.92 7.83 1.16 1 0.988 1.00 -1.20 8-H-6-C 8 7.99 7.87 1.41 1 0.996 1.00 -0.39 8-H-6-D 8 8.00 7.96 0.51 1 0.998 1.00 -0.19 8-H-6-E 8 8.00 7.87 1.60 1 0.998 1.00 -0.19
Table 2.4. Batch Contact Feed Simulants – K and Cs Contents
K Concentration (M) Cs Concentration (M) Simulant
ID Target As
Prepared Analyzed RPD (%) Target As
Prepared Analyzed RPD (%) 5-H-2-A 0.005 4.93E-03 6.01E-03 -21.88 5.00E-06 5.01E-06 5.06E-06 -1.00 5-H-2-B 0.005 4.89E-03 5.63E-03 -15.21 5.00E-05 5.04E-05 4.86E-05 3.52 5-H-2-C 0.005 4.93E-03 5.65E-03 -14.69 5.00E-04 4.99E-04 4.88E-04 2.22 5-H-2-D 0.005 4.94E-03 5.83E-03 -18.11 5.00E-03 5.01E-03 4.96E-03 1.05 5-H-4-A 0.05 4.98E-02 4.81E-02 3.36 5.00E-06 4.97E-06 4.94E-06 0.59 5-H-4-B 0.05 4.93E-02 4.78E-02 3.00 5.00E-05 5.08E-05 4.89E-05 3.80 5-H-4-C 0.05 4.97E-02 4.76E-02 4.29 5.00E-04 4.98E-04 4.70E-04 5.65 5-H-4-D 0.05 4.98E-02 4.83E-02 2.95 5.00E-03 4.99E-03 4.86E-03 2.55 5-H-5-A 0.35 3.48E-01 3.40E-01 2.19 5.00E-06 5.02E-06 4.97E-06 1.09 5-H-5-B 0.35 3.45E-01 3.35E-01 2.78 5.00E-05 5.12E-05 4.91E-05 4.16 5-H-5-C 0.35 3.47E-01 3.40E-01 2.09 5.00E-04 4.98E-04 4.86E-04 2.34 5-H-5-D 0.35 3.48E-01 3.53E-01 -1.39 5.00E-03 5.02E-03 4.95E-03 1.45 6-L-1-A 0 0.00E+00 3.09E-04 NA 5.00E-06 5.03E-06 5.17E-06 -2.87 6-L-1-B 0 0.00E+00 3.17E-04 NA 5.00E-05 5.07E-05 4.94E-05 2.57 6-L-1-C 0 0.00E+00 2.92E-04 NA 5.00E-04 5.05E-04 4.93E-04 2.40 6-L-1-D 0 0.00E+00 3.04E-04 NA 5.00E-03 5.02E-03 4.84E-03 3.50 6-L-1-E 0 0.00E+00 3.09E-04 NA 5.00E-02 4.99E-02 4.73E-02 5.26 6-L-3-A 0.035 3.45E-02 3.27E-02 5.16 5.00E-06 4.94E-06 6.94E-06 -40.37 6-L-3-B 0.035 3.42E-02 3.25E-02 5.04 5.00E-05 5.08E-05 4.85E-05 4.51 6-L-3-C 0.035 3.45E-02 3.27E-02 5.06 5.00E-04 4.96E-04 4.73E-04 4.58 6-L-3-D 0.035 3.46E-02 3.50E-02 -1.41 5.00E-03 5.02E-03 5.08E-03 -1.14 6-L-3-E 0.035 3.46E-02 3.53E-02 -2.15 5.00E-02 5.01E-02 5.01E-02 -0.07
PNNL-25277 RPT-SRFBC-001, Rev. 0
2.10
Table 2.4. (contd)
K Concentration (M) Cs Concentration (M) Simulant
ID Target As
Prepared Analyzed RPD (%) Target As
Prepared Analyzed RPD (%) 6-L-5-A 0.35 3.43E-01 3.48E-01 -1.39 5.00E-06 4.96E-06 4.91E-06 1.09 6-L-5-B 0.35 3.40E-01 3.43E-01 -0.80 5.00E-05 5.08E-05 5.14E-05 -1.13 6-L-5-C 0.35 3.43E-01 3.50E-01 -2.23 5.00E-04 4.98E-04 4.88E-04 2.03 6-L-5-D 0.35 3.43E-01 3.45E-01 -0.54 5.00E-03 5.01E-03 4.98E-03 0.65 6-L-5-E 0.35 3.43E-01 3.79E-01 -10.22 5.00E-02 5.01E-02 4.98E-02 0.65 6-L-6-A 0.5 4.93E-01 5.12E-01 -3.71 5.00E-06 4.99E-06 4.73E-06 5.20 6-L-6-B 0.5 4.89E-01 5.01E-01 -2.56 5.00E-05 5.09E-05 4.79E-05 5.85 6-L-6-C 0.5 4.93E-01 4.99E-01 -1.22 5.00E-04 4.99E-04 4.86E-04 2.67 6-L-6-D 0.5 4.94E-01 5.12E-01 -3.61 5.00E-03 4.99E-03 4.81E-03 3.55 6-L-6-E 0.5 4.94E-01 4.99E-01 -1.02 5.00E-02 4.99E-02 4.87E-02 2.48 6-H-1-A 0 0.00E+00 5.83E-04 NA 5.00E-06 4.97E-06 4.94E-06 0.69 6-H-1-B 0 0.00E+00 5.81E-04 NA 5.00E-05 5.08E-05 4.91E-05 3.40 6-H-1-C 0 0.00E+00 6.22E-04 NA 5.00E-04 4.98E-04 4.89E-04 1.78 6-H-1-D 0 0.00E+00 5.83E-04 NA 5.00E-03 4.98E-03 4.98E-03 -0.07 6-H-1-E 0 0.00E+00 5.86E-04 NA 5.00E-02 5.02E-02 4.85E-02 3.37 6-H-3-A 0.035 3.49E-02 3.48E-02 0.38 5.00E-06 5.07E-06 5.27E-06 -3.98 6-H-3-B 0.035 3.46E-02 3.35E-02 3.17 5.00E-05 5.08E-05 4.79E-05 5.69 6-H-3-C 0.035 3.49E-02 3.45E-02 1.01 5.00E-04 5.02E-04 4.85E-04 3.35 6-H-3-D 0.035 3.50E-02 3.43E-02 1.94 5.00E-03 4.99E-03 4.81E-03 3.55 6-H-3-E 0.035 3.50E-02 3.25E-02 7.06 5.00E-02 5.02E-02 4.74E-02 5.66 6-H-5-A 0.35 3.47E-01 3.30E-01 4.97 5.00E-06 5.00E-06 4.73E-06 5.39 6-H-5-B 0.35 3.44E-01 3.25E-01 5.60 5.00E-05 5.10E-05 4.93E-05 3.29 6-H-5-C 0.35 3.47E-01 3.38E-01 2.67 5.00E-04 4.97E-04 4.82E-04 3.10 6-H-5-D 0.35 3.48E-01 3.30E-01 5.07 5.00E-03 5.02E-03 4.85E-03 3.34 6-H-5-E 0.35 3.48E-01 3.40E-01 2.12 5.00E-02 5.00E-02 4.76E-02 4.88 6-H-6-A 0.5 4.96E-01 4.76E-01 4.16 5.00E-06 4.99E-06 4.79E-06 4.10 6-H-6-B 0.5 4.92E-01 4.63E-01 5.89 5.00E-05 5.08E-05 4.79E-05 5.73 6-H-6-C 0.5 4.96E-01 4.65E-01 6.12 5.00E-04 4.95E-04 4.69E-04 5.20 6-H-6-D 0.5 4.97E-01 4.76E-01 4.25 5.00E-03 4.98E-03 4.81E-03 3.35 6-H-6-E 0.5 4.97E-01 4.76E-01 4.25 5.00E-02 4.98E-02 4.70E-02 5.59 8-L-1-A 0 0.00E+00 3.27E-04 NA 5.00E-06 4.99E-06 4.96E-06 0.59 8-L-1-B 0 0.00E+00 3.02E-04 NA 5.00E-05 5.09E-05 4.88E-05 4.20 8-L-1-C 0 0.00E+00 3.35E-04 NA 5.00E-04 4.99E-04 4.90E-04 1.73 8-L-1-D 0 0.00E+00 3.27E-04 NA 5.00E-03 4.98E-03 4.35E-03 12.59 8-L-1-E 0 0.00E+00 3.09E-04 NA 5.00E-02 4.98E-02 4.78E-02 4.07 8-L-3-A 0.035 3.50E-02 3.38E-02 3.53 5.00E-06 5.00E-06 5.32E-06 -6.41 8-L-3-B 0.035 3.47E-02 3.38E-02 2.65 5.00E-05 5.10E-05 4.99E-05 2.14 8-L-3-C 0.035 3.50E-02 3.45E-02 1.24 5.00E-04 4.96E-04 4.88E-04 1.65 8-L-3-D 0.035 3.50E-02 3.40E-02 2.90 5.00E-03 4.99E-03 5.00E-03 -0.16 8-L-3-E 0.035 3.50E-02 3.32E-02 5.09 5.00E-02 4.98E-02 4.89E-02 1.81 8-L-5-A 0.35 3.49E-01 3.25E-01 7.01 5.00E-06 5.06E-06 5.06E-06 -0.08 8-L-5-B 0.35 3.45E-01 3.45E-01 0.05 5.00E-05 6.24E-05 4.49E-05 28.10 8-L-5-C 0.35 3.49E-01 3.38E-01 3.25 5.00E-04 5.09E-04 4.83E-04 5.07 8-L-5-D 0.35 3.50E-01 3.48E-01 0.52 5.00E-03 5.00E-03 5.06E-03 -1.13 8-L-5-E 0.35 3.50E-01 3.45E-01 1.25 5.00E-02 5.02E-02 4.91E-02 2.23 8-L-6-A 0.5 4.99E-01 4.73E-01 5.23 5.00E-06 4.95E-06 5.24E-06 -5.88 8-L-6-B 0.5 4.95E-01 4.81E-01 2.82 5.00E-05 5.02E-05 4.74E-05 5.58 8-L-6-C 0.5 4.99E-01 5.04E-01 -1.02 5.00E-04 5.00E-04 4.75E-04 4.92
PNNL-25277 RPT-SRFBC-001, Rev. 0
2.11
Table 2.4. (contd)
K Concentration (M) Cs Concentration (M) Simulant
ID Target As
Prepared Analyzed RPD (%) Target As
Prepared Analyzed RPD (%) 8-L-6-D 0.5 5.00E-01 4.96E-01 0.72 5.00E-03 4.99E-03 4.98E-03 0.14 8-L-6-E 0.5 5.00E-01 4.99E-01 0.21 5.00E-02 5.00E-02 4.82E-02 3.69 8-H-1-A 0 0.00E+00 5.91E-04 NA 5.00E-06 5.00E-06 5.18E-06 -3.50 8-H-1-B 0 0.00E+00 5.60E-04 NA 5.00E-05 5.04E-05 4.85E-05 3.68 8-H-1-C 0 0.00E+00 6.47E-04 NA 5.00E-04 4.99E-04 4.84E-04 3.02 8-H-1-D 0 0.00E+00 6.16E-04 NA 5.00E-03 5.01E-03 4.95E-03 1.25 8-H-1-E 0 0.00E+00 6.29E-04 NA 5.00E-02 5.02E-02 4.89E-02 2.60 8-H-3-A 0.035 3.49E-02 3.58E-02 -2.47 5.00E-06 5.03E-06 4.99E-06 0.89 8-H-3-B 0.035 3.46E-02 3.48E-02 -0.44 5.00E-05 5.03E-05 4.79E-05 4.83 8-H-3-C 0.035 3.49E-02 3.53E-02 -1.10 5.00E-04 4.99E-04 4.76E-04 4.58 8-H-3-D 0.035 3.50E-02 3.45E-02 1.29 5.00E-03 5.01E-03 5.13E-03 -2.34 8-H-3-E 0.035 3.50E-02 3.53E-02 -0.90 5.00E-02 5.02E-02 4.93E-02 1.84 8-H-5-A 0.35 3.49E-01 3.48E-01 0.45 5.00E-06 5.02E-06 7.10E-06 -41.44 8-H-5-B 0.35 3.46E-01 3.45E-01 0.28 5.00E-05 5.03E-05 5.04E-05 -0.13 8-H-5-C 0.35 3.49E-01 3.40E-01 2.55 5.00E-04 5.03E-04 4.84E-04 3.77 8-H-5-D 0.35 3.50E-01 3.43E-01 2.01 5.00E-03 5.02E-03 5.03E-03 -0.25 8-H-5-E 0.35 3.50E-01 3.43E-01 2.01 5.00E-02 5.01E-02 4.85E-02 3.11 8-H-6-A 0.5 4.99E-01 4.89E-01 2.19 5.00E-06 4.95E-06 4.73E-06 4.35 8-H-6-B 0.5 4.95E-01 4.91E-01 0.79 5.00E-05 5.00E-05 4.73E-05 5.45 8-H-6-C 0.5 4.99E-01 4.91E-01 1.58 5.00E-04 4.94E-04 4.85E-04 1.74 8-H-6-D 0.5 5.00E-01 4.96E-01 0.76 5.00E-03 5.00E-03 5.10E-03 -2.02 8-H-6-E 0.5 5.00E-01 4.91E-01 1.78 5.00E-02 5.00E-02 4.88E-02 2.44
2.4 Batch Contact Experiments
It is imperative to know the exact mass of resin added to the batch contact sample. To this end, the H-form resin is preferred. A batch of resin can be partially dried (typically to 50% water content) to allow for accurate weighing with constant water content. Working with resin in the Na-form is not recommended because aliquoting and weighing are conducted in air and oxygen appears to attack the Na-form resin more readily than H-form resin. This approach is consistent with the ion exchange batch contact test protocol.3 Corrections to the Na-form mass basis may be applied if the mass conversion factor from H-form to Na-form (INa Factor) is determined for this resin lot.
An aliquot of pretreated wet H-form resin, large enough to process one group of ~56 samples, was dried to a free-flowing state in a vacuum oven at ambient temperature (~20 °C). An aliquot from each resin preparation batch was removed for a gross F-factor (water content) determination; the remainder of the partially dried resin was flushed with nitrogen for intermediate storage. The gross F-factor resin aliquot was dried overnight at 50 °C. The mass of resin aliquoted for use in testing was targeted based on the gross F-factor analysis.
Six groups of Cs batch contact tests were completed. Half of the samples for one process temperature were tested at one time to accommodate limitations in sample handling; therefore a total of 6 groups (two each at 25, 35, and 50 °C) were processed. For each group, the following steps were implemented:
(3) Walker, DD. 2004. Hanford RPP-WTP Alt Resin Program –Protocol P2-RF: Ion Exchange Batch Contact
Tests. SRNL-RPP-2004-00055, Rev. 0 Savannah River National Laboratory, Aiken, South Carolina,
PNNL-25277 RPT-SRFBC-001, Rev. 0
2.12
1. 25 mL aliquots of the feed simulants were placed into 30 mL Nalgene, polyethylene, narrow-mouth bottles,
2. the bottles with simulant were placed into an IKA KS 4000 orbital shaker table (IKA Works, Wilmington, North Carolina) and equilibrated to the target temperature (25, 35, or 50 °C),
3. an initial F-factor resin sample was collected from the free-flowing partially dried resin,
4. the required amount of resin aliquots (targeting 0.25 g dry, H-form mass basis) were added to the bottles containing temperature-equilibrated simulant,
5. the headspaces of the bottles were purged with nitrogen and capped,
6. the bottles were returned to the IKA KS 4000 orbital shaker table,
7. a closing F-factor resin sample was collected.
The F-factor was measured for each batch of samples by taking a sample of resin at the beginning of the batching and another one at the completion of the batching. These F-factor samples were placed in an open glass vial in a vacuum oven at 50 °C and dried to constant mass. The F-factor was then calculated by dividing the weight of the dry resin by the initial undried weight of the resin. The batch-to-batch F-factors ranged from 0.44 to 0.70; within the test batch the initial and final F-factors agreed within 1%. The mass of resin added to each simulant batch contact sample was multiplied by the average of the initial and final batch F-factors to determine the dry H-form resin mass contacted with simulant.
A picture of the IKA KS 4000 orbital shaker table is shown in Figure 2.4. The batch contact temperature was measured using a calibrated Type K thermocouple and Fluke 52II temperature readout (Fluke, Everett, Washington) to maintain temperature within ±2 °C. The samples were rotated at 140 rpm in a 2 cm radius to ensure that samples were mixed thoroughly for the entire 72-hour contact time (equilibrium conditions are expected to be attained after 48 hours [Nash et al. 2006]).
Approximately 0.25 g dry H-form resin was contacted with ~25 mL of feed simulant solution, resulting in a phase ratio of ~100:1 solution volume to dry H-form resin mass (the phase ratios ranged from 76 to 120 with an average of 96). The batch-contacted sample IDs are the same as the simulant IDs with the additional suffix denoting the contact temperature. Selected simulants were processed in duplicate (designated with “D” suffix in the sample name). A total of 336 batch contact samples were processed.
PNNL-25277 RPT-SRFBC-001, Rev. 0
2.13
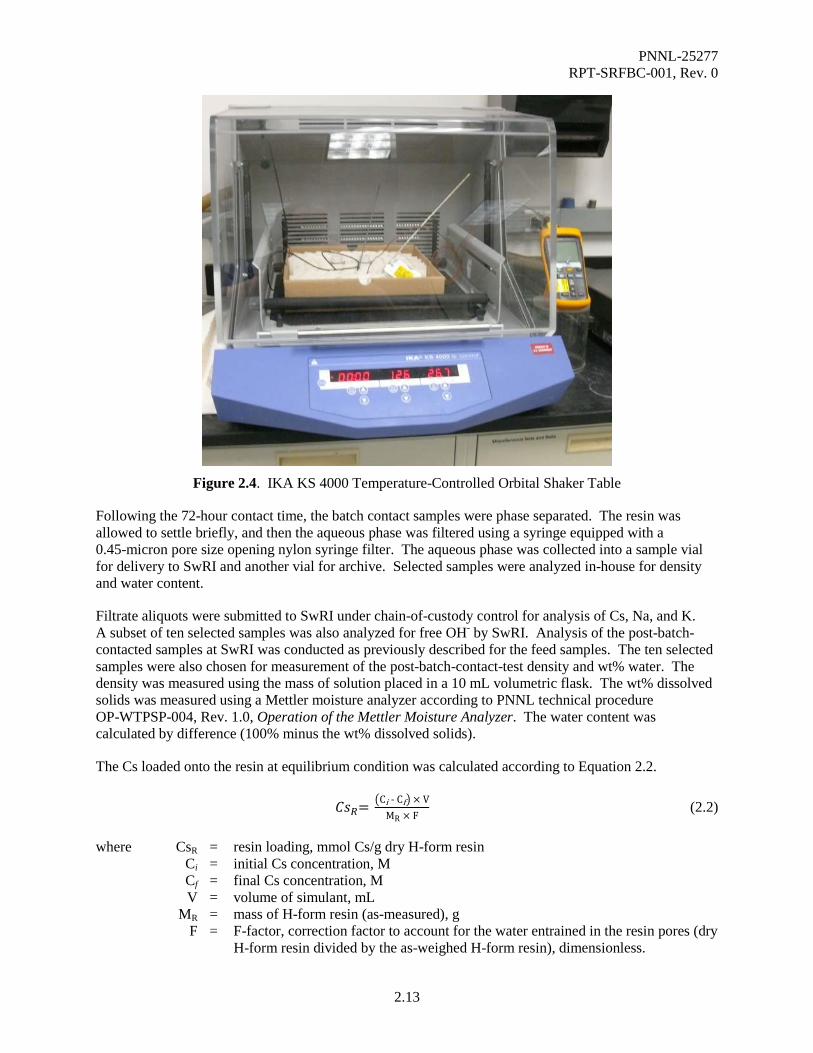
Figure 2.4. IKA KS 4000 Temperature-Controlled Orbital Shaker Table
Following the 72-hour contact time, the batch contact samples were phase separated. The resin was allowed to settle briefly, and then the aqueous phase was filtered using a syringe equipped with a 0.45-micron pore size opening nylon syringe filter. The aqueous phase was collected into a sample vial for delivery to SwRI and another vial for archive. Selected samples were analyzed in-house for density and water content.
Filtrate aliquots were submitted to SwRI under chain-of-custody control for analysis of Cs, Na, and K. A subset of ten selected samples was also analyzed for free OH- by SwRI. Analysis of the post-batch-contacted samples at SwRI was conducted as previously described for the feed samples. The ten selected samples were also chosen for measurement of the post-batch-contact-test density and wt% water. The density was measured using the mass of solution placed in a 10 mL volumetric flask. The wt% dissolved solids was measured using a Mettler moisture analyzer according to PNNL technical procedure OP-WTPSP-004, Rev. 1.0, Operation of the Mettler Moisture Analyzer. The water content was calculated by difference (100% minus the wt% dissolved solids).
The Cs loaded onto the resin at equilibrium condition was calculated according to Equation 2.2.
𝐶𝐶𝐶𝐶𝑅𝑅= Ci - Cf × VMR × F
(2.2) where CsR = resin loading, mmol Cs/g dry H-form resin Ci = initial Cs concentration, M Cf = final Cs concentration, M V = volume of simulant, mL MR = mass of H-form resin (as-measured), g F = F-factor, correction factor to account for the water entrained in the resin pores (dry
H-form resin divided by the as-weighed H-form resin), dimensionless.

PNNL-25277 RPT-SRFBC-001, Rev. 0
2.14

PNNL-25277 RPT-SRFBC-001, Rev. 0
3.1
3.0 Isotherm Results and Discussion
The effect of the initial Na concentration (5, 6.5, and 8 M), initial K concentration (0.00, 0.035, 0.05, 0.35, and 0.50 M), and initial OH concentration (0.1 and 1 M) on the sRF resin’s Cs loading at temperatures of 25, 35, and 50 °C was tested using batch contact tests. The results of this research are discussed in this section. All post-contacted batch equilibrium Na, K, Cs, and OH concentration results are provided in Appendix C for use in detailed isotherm modeling.
3.1 Isotherms-General
The isotherms plotted in this section show the equilibrium Cs loading (mmoles) on the sRF resin (dry H-form mass basis) as a function of the equilibrium Cs concentration (M) in the aqueous phase. In general, isotherms are presented on log-log plots to best show effects at low Cs concentrations. However, linear-linear plots are more useful for observing differences at high Cs concentrations. All data can be replotted using the input data provided in Appendix C and Appendix D.
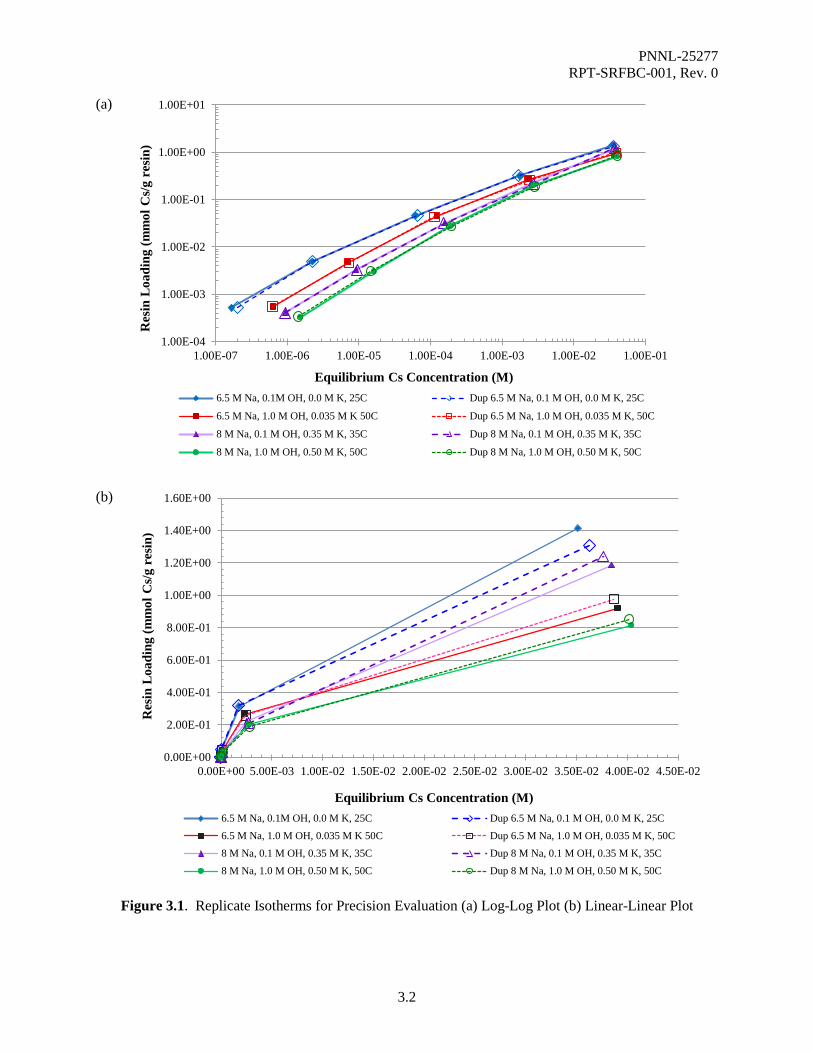
The experimental precision was evaluated by conducting 12 batch contact isotherms in duplicate. Figure 3.1 shows 4 examples of the 12 replicate isotherms in both a log-log plot and linear-linear plot. In this example, the largest discrepancy is at the highest Cs concentration in the 6.5 M Na, 0.1 M OH, 0.0 M K tested at 25 °C isotherm where the sample and duplicate differ by 8% in the Cs loading capacity and 3% in the equilibrium Cs concentration. With one exception, all duplicate Cs load capacities for the sample and duplicate agreed within 10%; the majority agreed within 5%. The differences in these isotherms, attributed to overall experimental error, are very small. The Figure 3.1 isotherm set provides a visual guide for how much variation can be expected from one isotherm to the next simply from experimental error. This awareness of experimental uncertainty allows for a better understanding of the evaluation of matrix effects presented in the following sections.
3.1.1 Na Effect on Resin Cs Loading
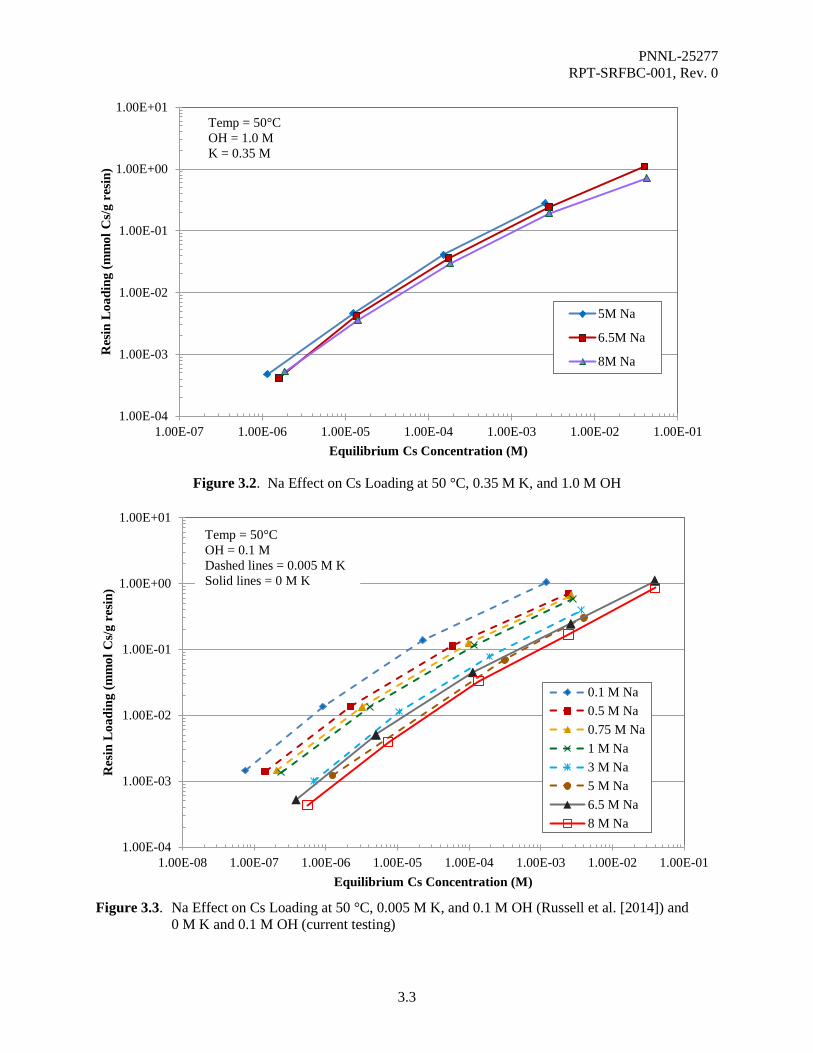
Figure 3.2 presents the effect of different Na levels on resin Cs loading at 50 °C with K and OH concentrations of 0.35 and 1.0 M, respectively. These specific matrix conditions are presented in this graphical representation because they were tested herein at 5 M as well as 6.5 and 8 M Na and thus had the minimum amounts of the other variable conditions that could confound comparisons. Changes in Na concentration affects the Cs resin loading; as Na concentration increases, Cs loading decreases (see Figure 3.3). However, at the high Na concentrations of 6.5 and 8 M, the effect on the Cs loading is less pronounced than previously observed at lower (0.1 to 5 M) Na concentrations (Russell et al. 2014). Lower Na concentration appears to allow Cs to compete for the resin ion exchange sites more effectively as shown in Figure 3.3 (reproduced from Russell et al. [2014]) with current results added. The same effects were seen at 25 °C (Figure 3.4); however, at these Na levels the effect was even less pronounced with essentially no difference between the 6.5 and 8 M Na. Previous work (i.e., Nash et al. [2006] and Russell et al. [2014]) also observed this effect.
PNNL-25277 RPT-SRFBC-001, Rev. 0
3.2
(a)
(b)
Figure 3.1. Replicate Isotherms for Precision Evaluation (a) Log-Log Plot (b) Linear-Linear Plot
1.00E-04
1.00E-03
1.00E-02
1.00E-01
1.00E+00
1.00E+01
1.00E-07 1.00E-06 1.00E-05 1.00E-04 1.00E-03 1.00E-02 1.00E-01
Res
in L
oadi
ng (m
mol
Cs/
g re
sin)
Equilibrium Cs Concentration (M) 6.5 M Na, 0.1M OH, 0.0 M K, 25C Dup 6.5 M Na, 0.1 M OH, 0.0 M K, 25C
6.5 M Na, 1.0 M OH, 0.035 M K 50C Dup 6.5 M Na, 1.0 M OH, 0.035 M K, 50C
8 M Na, 0.1 M OH, 0.35 M K, 35C Dup 8 M Na, 0.1 M OH, 0.35 M K, 35C
8 M Na, 1.0 M OH, 0.50 M K, 50C Dup 8 M Na, 1.0 M OH, 0.50 M K, 50C
0.00E+00
2.00E-01
4.00E-01
6.00E-01
8.00E-01
1.00E+00
1.20E+00
1.40E+00
1.60E+00
0.00E+00 5.00E-03 1.00E-02 1.50E-02 2.00E-02 2.50E-02 3.00E-02 3.50E-02 4.00E-02 4.50E-02
Res
in L
oadi
ng (m
mol
Cs/
g re
sin)
Equilibrium Cs Concentration (M) 6.5 M Na, 0.1M OH, 0.0 M K, 25C Dup 6.5 M Na, 0.1 M OH, 0.0 M K, 25C6.5 M Na, 1.0 M OH, 0.035 M K 50C Dup 6.5 M Na, 1.0 M OH, 0.035 M K, 50C8 M Na, 0.1 M OH, 0.35 M K, 35C Dup 8 M Na, 0.1 M OH, 0.35 M K, 35C8 M Na, 1.0 M OH, 0.50 M K, 50C Dup 8 M Na, 1.0 M OH, 0.50 M K, 50C
PNNL-25277 RPT-SRFBC-001, Rev. 0
3.3
Figure 3.2. Na Effect on Cs Loading at 50 °C, 0.35 M K, and 1.0 M OH
Figure 3.3. Na Effect on Cs Loading at 50 °C, 0.005 M K, and 0.1 M OH (Russell et al. [2014]) and
0 M K and 0.1 M OH (current testing)
1.00E-04
1.00E-03
1.00E-02
1.00E-01
1.00E+00
1.00E+01
1.00E-07 1.00E-06 1.00E-05 1.00E-04 1.00E-03 1.00E-02 1.00E-01
Res
in L
oadi
ng (m
mol
Cs/
g re
sin)
Equilibrium Cs Concentration (M)
5M Na
6.5M Na
8M Na
1.00E-04
1.00E-03
1.00E-02
1.00E-01
1.00E+00
1.00E+01
1.00E-08 1.00E-07 1.00E-06 1.00E-05 1.00E-04 1.00E-03 1.00E-02 1.00E-01
Res
in L
oadi
ng (m
mol
Cs/
g re
sin)
Equilibrium Cs Concentration (M)
0.1 M Na0.5 M Na0.75 M Na1 M Na3 M Na5 M Na6.5 M Na8 M Na
Temp = 50°C OH = 1.0 M K = 0.35 M
Temp = 50°C OH = 0.1 M Dashed lines = 0.005 M K Solid lines = 0 M K
PNNL-25277 RPT-SRFBC-001, Rev. 0
3.4
Figure 3.4. Na Effect on Cs Loading at 25 °C, 0.35 M K, and 1.0 M OH
3.1.2 K Effect on Resin Cs Loading
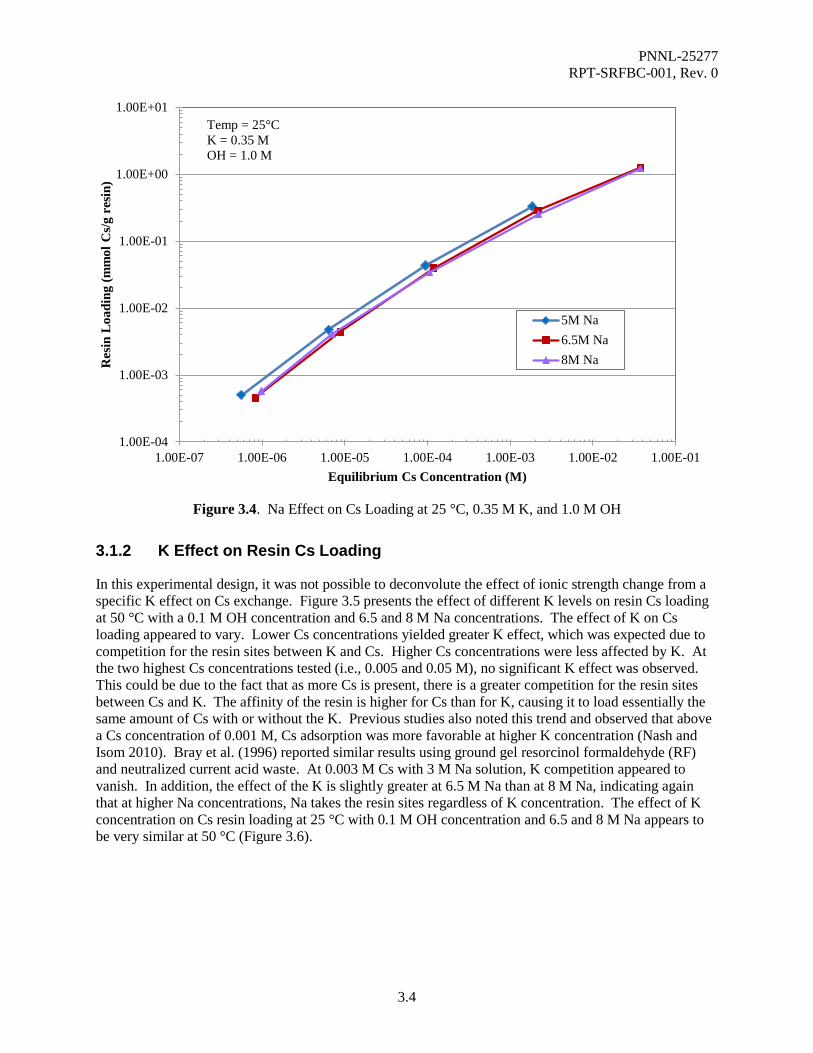
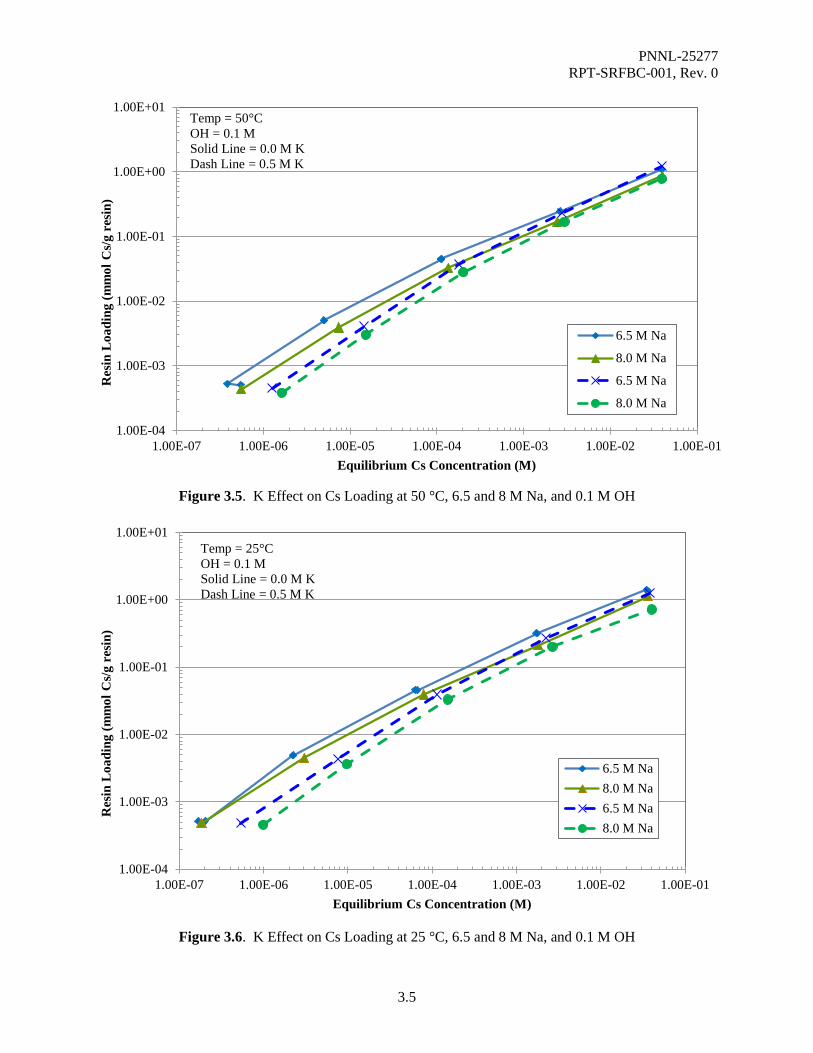
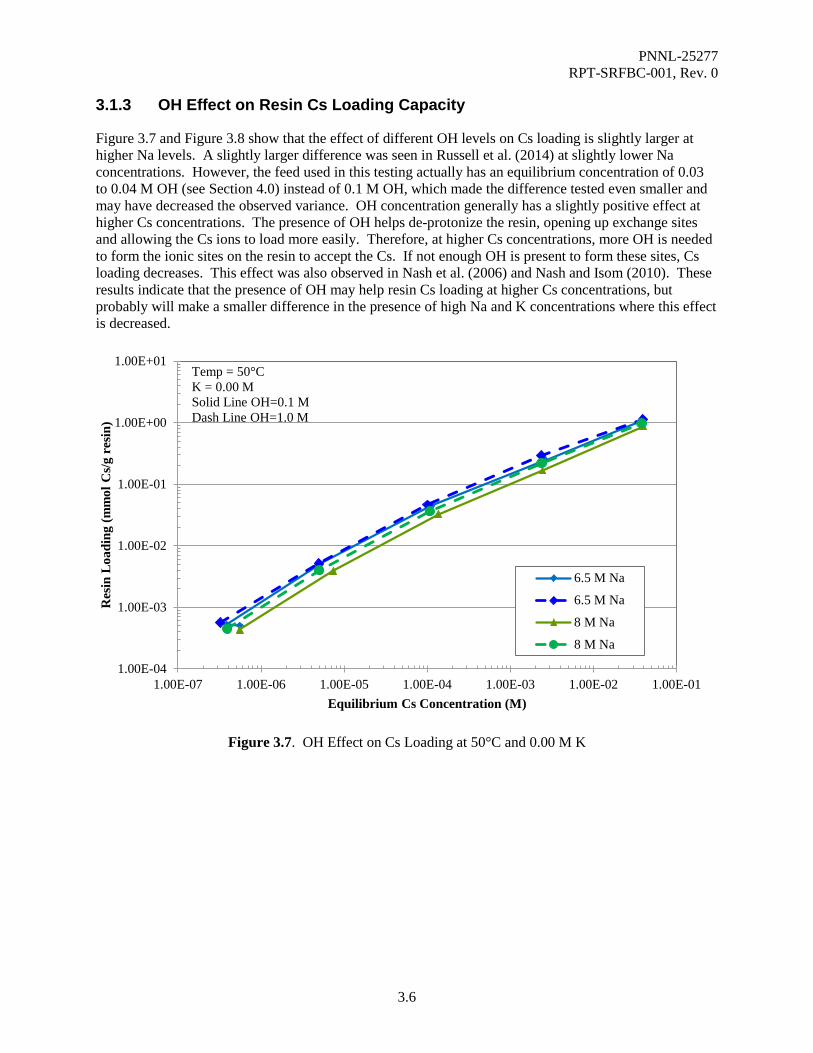
In this experimental design, it was not possible to deconvolute the effect of ionic strength change from a specific K effect on Cs exchange. Figure 3.5 presents the effect of different K levels on resin Cs loading at 50 °C with a 0.1 M OH concentration and 6.5 and 8 M Na concentrations. The effect of K on Cs loading appeared to vary. Lower Cs concentrations yielded greater K effect, which was expected due to competition for the resin sites between K and Cs. Higher Cs concentrations were less affected by K. At the two highest Cs concentrations tested (i.e., 0.005 and 0.05 M), no significant K effect was observed. This could be due to the fact that as more Cs is present, there is a greater competition for the resin sites between Cs and K. The affinity of the resin is higher for Cs than for K, causing it to load essentially the same amount of Cs with or without the K. Previous studies also noted this trend and observed that above a Cs concentration of 0.001 M, Cs adsorption was more favorable at higher K concentration (Nash and Isom 2010). Bray et al. (1996) reported similar results using ground gel resorcinol formaldehyde (RF) and neutralized current acid waste. At 0.003 M Cs with 3 M Na solution, K competition appeared to vanish. In addition, the effect of the K is slightly greater at 6.5 M Na than at 8 M Na, indicating again that at higher Na concentrations, Na takes the resin sites regardless of K concentration. The effect of K concentration on Cs resin loading at 25 °C with 0.1 M OH concentration and 6.5 and 8 M Na appears to be very similar at 50 °C (Figure 3.6).
1.00E-04
1.00E-03
1.00E-02
1.00E-01
1.00E+00
1.00E+01
1.00E-07 1.00E-06 1.00E-05 1.00E-04 1.00E-03 1.00E-02 1.00E-01
Res
in L
oadi
ng (m
mol
Cs/
g re
sin)
Equilibrium Cs Concentration (M)
5M Na6.5M Na8M Na
Temp = 25°C K = 0.35 M OH = 1.0 M
PNNL-25277 RPT-SRFBC-001, Rev. 0
3.5
Figure 3.5. K Effect on Cs Loading at 50 °C, 6.5 and 8 M Na, and 0.1 M OH
Figure 3.6. K Effect on Cs Loading at 25 °C, 6.5 and 8 M Na, and 0.1 M OH
1.00E-04
1.00E-03
1.00E-02
1.00E-01
1.00E+00
1.00E+01
1.00E-07 1.00E-06 1.00E-05 1.00E-04 1.00E-03 1.00E-02 1.00E-01
Res
in L
oadi
ng (m
mol
Cs/
g re
sin)
Equilibrium Cs Concentration (M)
6.5 M Na
8.0 M Na
6.5 M Na
8.0 M Na
Temp = 50°C OH = 0.1 M Solid Line = 0.0 M K Dash Line = 0.5 M K
1.00E-04
1.00E-03
1.00E-02
1.00E-01
1.00E+00
1.00E+01
1.00E-07 1.00E-06 1.00E-05 1.00E-04 1.00E-03 1.00E-02 1.00E-01
Res
in L
oadi
ng (m
mol
Cs/
g re
sin)
Equilibrium Cs Concentration (M)
6.5 M Na8.0 M Na6.5 M Na8.0 M Na
Temp = 25°C OH = 0.1 M Solid Line = 0.0 M K Dash Line = 0.5 M K
PNNL-25277 RPT-SRFBC-001, Rev. 0
3.6
3.1.3 OH Effect on Resin Cs Loading Capacity
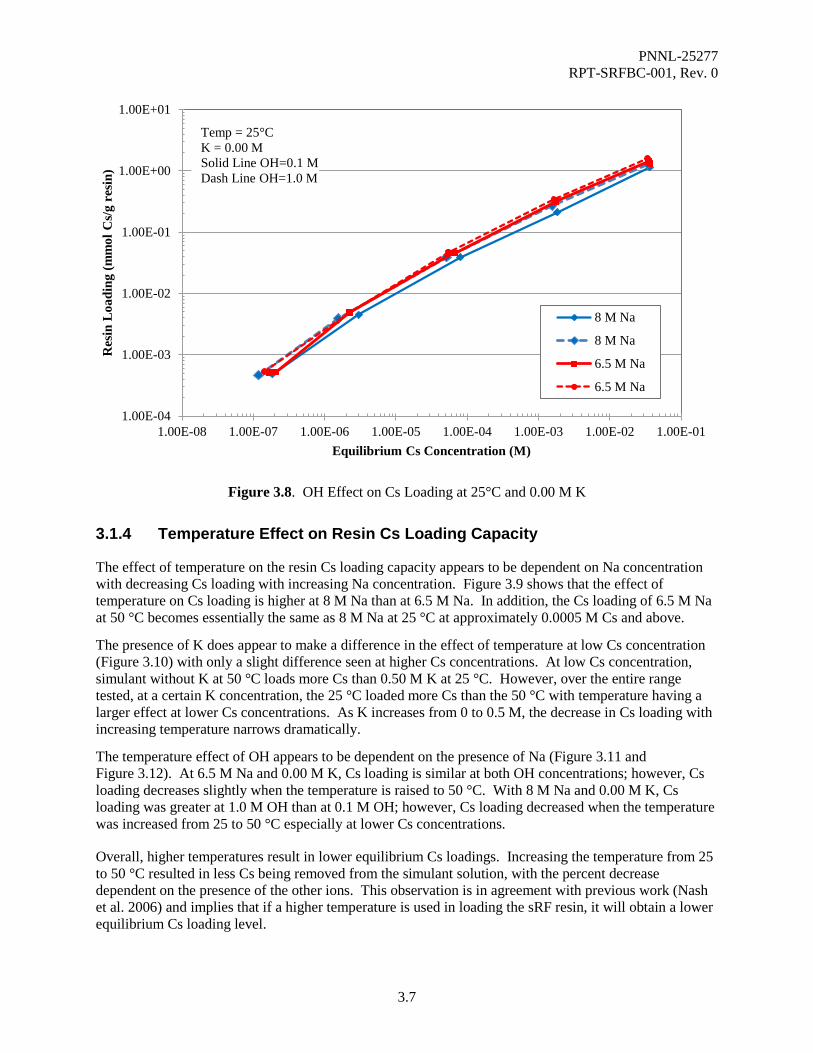
Figure 3.7 and Figure 3.8 show that the effect of different OH levels on Cs loading is slightly larger at higher Na levels. A slightly larger difference was seen in Russell et al. (2014) at slightly lower Na concentrations. However, the feed used in this testing actually has an equilibrium concentration of 0.03 to 0.04 M OH (see Section 4.0) instead of 0.1 M OH, which made the difference tested even smaller and may have decreased the observed variance. OH concentration generally has a slightly positive effect at higher Cs concentrations. The presence of OH helps de-protonize the resin, opening up exchange sites and allowing the Cs ions to load more easily. Therefore, at higher Cs concentrations, more OH is needed to form the ionic sites on the resin to accept the Cs. If not enough OH is present to form these sites, Cs loading decreases. This effect was also observed in Nash et al. (2006) and Nash and Isom (2010). These results indicate that the presence of OH may help resin Cs loading at higher Cs concentrations, but probably will make a smaller difference in the presence of high Na and K concentrations where this effect is decreased.
Figure 3.7. OH Effect on Cs Loading at 50°C and 0.00 M K
1.00E-04
1.00E-03
1.00E-02
1.00E-01
1.00E+00
1.00E+01
1.00E-07 1.00E-06 1.00E-05 1.00E-04 1.00E-03 1.00E-02 1.00E-01
Res
in L
oadi
ng (m
mol
Cs/
g re
sin)
Equilibrium Cs Concentration (M)
6.5 M Na
6.5 M Na
8 M Na
8 M Na
Temp = 50°C K = 0.00 M Solid Line OH=0.1 M Dash Line OH=1.0 M
PNNL-25277 RPT-SRFBC-001, Rev. 0
3.7
Figure 3.8. OH Effect on Cs Loading at 25°C and 0.00 M K
3.1.4 Temperature Effect on Resin Cs Loading Capacity
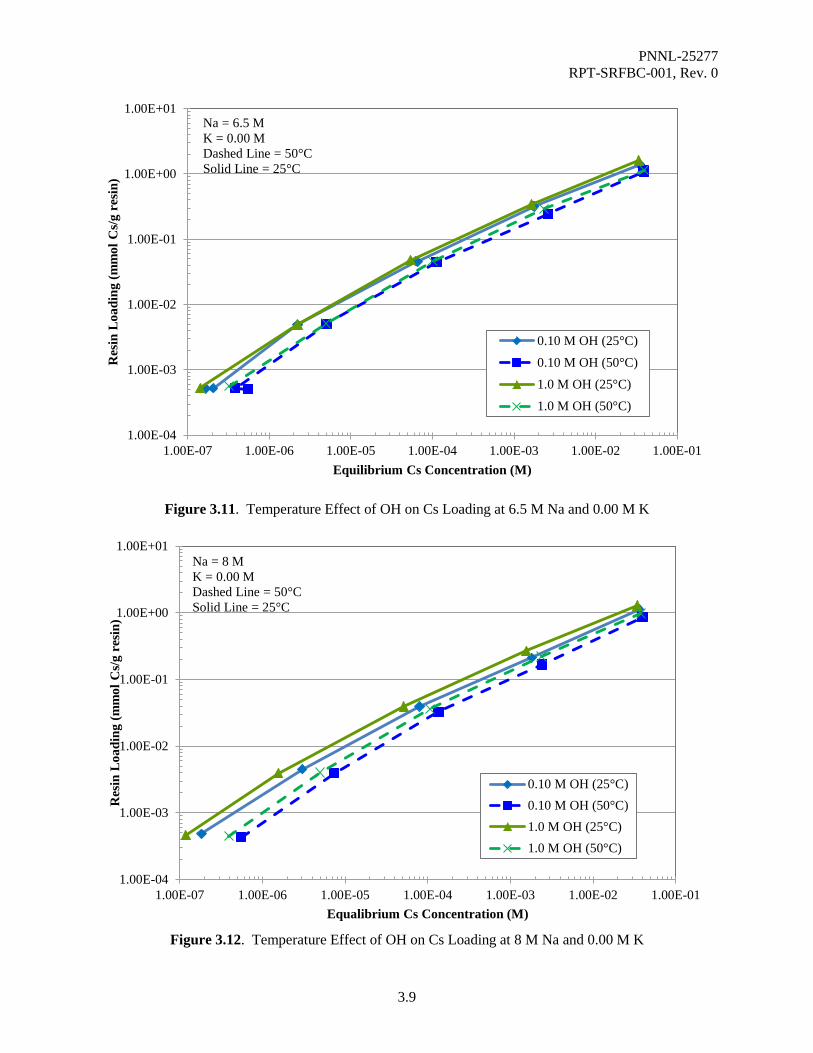
The effect of temperature on the resin Cs loading capacity appears to be dependent on Na concentration with decreasing Cs loading with increasing Na concentration. Figure 3.9 shows that the effect of temperature on Cs loading is higher at 8 M Na than at 6.5 M Na. In addition, the Cs loading of 6.5 M Na at 50 °C becomes essentially the same as 8 M Na at 25 °C at approximately 0.0005 M Cs and above.
The presence of K does appear to make a difference in the effect of temperature at low Cs concentration (Figure 3.10) with only a slight difference seen at higher Cs concentrations. At low Cs concentration, simulant without K at 50 °C loads more Cs than 0.50 M K at 25 °C. However, over the entire range tested, at a certain K concentration, the 25 °C loaded more Cs than the 50 °C with temperature having a larger effect at lower Cs concentrations. As K increases from 0 to 0.5 M, the decrease in Cs loading with increasing temperature narrows dramatically.
The temperature effect of OH appears to be dependent on the presence of Na (Figure 3.11 and Figure 3.12). At 6.5 M Na and 0.00 M K, Cs loading is similar at both OH concentrations; however, Cs loading decreases slightly when the temperature is raised to 50 °C. With 8 M Na and 0.00 M K, Cs loading was greater at 1.0 M OH than at 0.1 M OH; however, Cs loading decreased when the temperature was increased from 25 to 50 °C especially at lower Cs concentrations.
Overall, higher temperatures result in lower equilibrium Cs loadings. Increasing the temperature from 25 to 50 °C resulted in less Cs being removed from the simulant solution, with the percent decrease dependent on the presence of the other ions. This observation is in agreement with previous work (Nash et al. 2006) and implies that if a higher temperature is used in loading the sRF resin, it will obtain a lower equilibrium Cs loading level.
1.00E-04
1.00E-03
1.00E-02
1.00E-01
1.00E+00
1.00E+01
1.00E-08 1.00E-07 1.00E-06 1.00E-05 1.00E-04 1.00E-03 1.00E-02 1.00E-01
Res
in L
oadi
ng (m
mol
Cs/
g re
sin)
Equilibrium Cs Concentration (M)
8 M Na
8 M Na
6.5 M Na
6.5 M Na
Temp = 25°C K = 0.00 M Solid Line OH=0.1 M Dash Line OH=1.0 M

PNNL-25277 RPT-SRFBC-001, Rev. 0
3.8
Figure 3.9. Temperature Effect of Na on Cs Loading at 0.1 M OH and 0.00 M K
Figure 3.10. Temperature Effect of K on Cs Loading at 0.1 M OH and 6.5 M Na
1.00E-04
1.00E-03
1.00E-02
1.00E-01
1.00E+00
1.00E+01
1.00E-07 1.00E-06 1.00E-05 1.00E-04 1.00E-03 1.00E-02 1.00E-01
Res
in L
oadi
ng (m
mol
Cs/
g re
sin)
Equilibrium Cs Concentration (M)
8 M Na (25°C)
8 M Na (50°C)
6.5 M Na (25°C)
6.5 M Na (50°C)
K = 0.00 M OH = 0.10 M
1.00E-04
1.00E-03
1.00E-02
1.00E-01
1.00E+00
1.00E+01
1.00E-07 1.00E-06 1.00E-05 1.00E-04 1.00E-03 1.00E-02 1.00E-01
Res
in L
oadi
ng (m
mol
Cs/
g re
sin)
Equilibrium Cs Concentration (M)
0.00 M K (25°C)0.00 M K (50°C)0.50 M K (25°C)0.50 M K (50°C)
Na = 6.5 M OH = 0.1 M Dashed Line = 50°C Solid Line = 25°C
PNNL-25277 RPT-SRFBC-001, Rev. 0
3.9
Figure 3.11. Temperature Effect of OH on Cs Loading at 6.5 M Na and 0.00 M K
Figure 3.12. Temperature Effect of OH on Cs Loading at 8 M Na and 0.00 M K
1.00E-04
1.00E-03
1.00E-02
1.00E-01
1.00E+00
1.00E+01
1.00E-07 1.00E-06 1.00E-05 1.00E-04 1.00E-03 1.00E-02 1.00E-01
Res
in L
oadi
ng (m
mol
Cs/
g re
sin)
Equilibrium Cs Concentration (M)
0.10 M OH (25°C)0.10 M OH (50°C)1.0 M OH (25°C)1.0 M OH (50°C)
Na = 6.5 M K = 0.00 M Dashed Line = 50°C Solid Line = 25°C
1.00E-04
1.00E-03
1.00E-02
1.00E-01
1.00E+00
1.00E+01
1.00E-07 1.00E-06 1.00E-05 1.00E-04 1.00E-03 1.00E-02 1.00E-01
Res
in L
oadi
ng (m
mol
Cs/
g re
sin)
Equalibrium Cs Concentration (M)
0.10 M OH (25°C)0.10 M OH (50°C)1.0 M OH (25°C)1.0 M OH (50°C)
Na = 8 M K = 0.00 M Dashed Line = 50°C Solid Line = 25°C

PNNL-25277 RPT-SRFBC-001, Rev. 0
3.10
3.2 A Comparison of FY12 (from Russell et al. 2014) and FY16 Testing
A comparison of the temperature effect was made between this testing and previous PNNL testing (Russell et al. 2014) at 5 M Na, 0.05 M K, and 1.0 M OH. As shown in Figure 3.13, the isotherm slopes were essentially the same, but the actual loading was slightly lower in the previous PNNL work. One reason for this may be that this current testing was performed under a nitrogen atmosphere and the previous PNNL work was performed under an air atmosphere. The presence of oxygen is known to degrade the resin, reducing its capacity.1
Figure 3.13. Temperature Effect on Cs Loading at 5 M Na, 1.0 M OH and 0.05 M K
3.3 Isotherm Comparison with Previous Isotherms
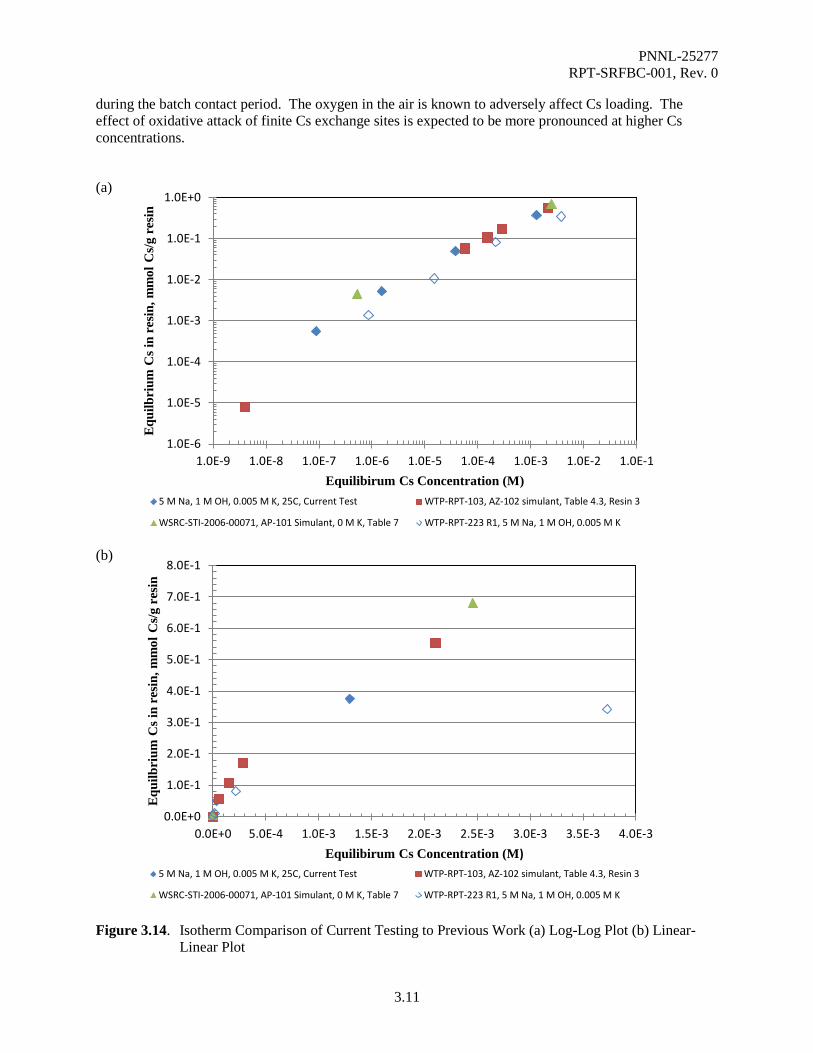
A small subset of batch contacts was tested at 5 M Na and 1 M hydroxide and various K concentrations to compare directly with isotherm data presented in Russell et al. (2014). Results of these tests are provided in the following sections where applicable. Figure 3.14 compares current isotherm testing results using the 5 M Na, 1 M OH, and 0.005 M K matrix at 25 °C with the corresponding Russell et al. (2014) isotherm data. Isotherm comparison results are shown using two different axis formats (log-log and linear-linear). At low Cs concentrations, the current data set appears to be slightly higher in Cs loading than reported by Russell et al. (2014). Significant divergence is evident at high Cs concentration where the Russell et al. (2014) data shows a strong leveling off of Cs load capacity at about 0.34 mmol Cs per gram dry H-form resin. These observations are consistent with the use of an inert cover gas during the course of the batch contact period. The Russell et al. (2014) data set used ambient air as the cover gas
(1) Other experimental differences included a different sRF production lot, sRF storage conditions before testing,
and higher phase ratio.
1.00E-04
1.00E-03
1.00E-02
1.00E-01
1.00E+00
1.00E-07 1.00E-06 1.00E-05 1.00E-04 1.00E-03 1.00E-02 1.00E-01
Res
in L
oadi
ng (m
mol
Cs/
g re
sin)
Equilibrium Cs Concentration (M)
25°C
35°C
50°C
25°C (FY12)
35°C (FY12)
50°C (FY12)
Na = 5 M K = 0.05 M OH = 1.0 M
PNNL-25277 RPT-SRFBC-001, Rev. 0
3.11
during the batch contact period. The oxygen in the air is known to adversely affect Cs loading. The effect of oxidative attack of finite Cs exchange sites is expected to be more pronounced at higher Cs concentrations.
(a)
(b)
Figure 3.14. Isotherm Comparison of Current Testing to Previous Work (a) Log-Log Plot (b) Linear-
Linear Plot
1.0E-6
1.0E-5
1.0E-4
1.0E-3
1.0E-2
1.0E-1
1.0E+0
1.0E-9 1.0E-8 1.0E-7 1.0E-6 1.0E-5 1.0E-4 1.0E-3 1.0E-2 1.0E-1
Equ
ilbri
um C
s in
resi
n, m
mol
Cs/
g re
sin
Equilibirum Cs Concentration (M) 5 M Na, 1 M OH, 0.005 M K, 25C, Current Test WTP-RPT-103, AZ-102 simulant, Table 4.3, Resin 3
WSRC-STI-2006-00071, AP-101 Simulant, 0 M K, Table 7 WTP-RPT-223 R1, 5 M Na, 1 M OH, 0.005 M K
0.0E+0
1.0E-1
2.0E-1
3.0E-1
4.0E-1
5.0E-1
6.0E-1
7.0E-1
8.0E-1
0.0E+0 5.0E-4 1.0E-3 1.5E-3 2.0E-3 2.5E-3 3.0E-3 3.5E-3 4.0E-3
Equ
ilbri
um C
s in
resi
n, m
mol
Cs/
g re
sin
Equilibirum Cs Concentration (M) 5 M Na, 1 M OH, 0.005 M K, 25C, Current Test WTP-RPT-103, AZ-102 simulant, Table 4.3, Resin 3
WSRC-STI-2006-00071, AP-101 Simulant, 0 M K, Table 7 WTP-RPT-223 R1, 5 M Na, 1 M OH, 0.005 M K
PNNL-25277 RPT-SRFBC-001, Rev. 0
3.12
To better evaluate if the isotherm difference is strictly associated with the cover gas test condition, the current data set was also compared to other previously published data in Figure 3.14. Fiskum et al. (2004) tested sRF “Resin #3” (among others) with AZ-102 simulant composed of 5.2 M Na, 0.21 M OH, and 0.15 M K. Nash et al. (2006) tested sRF with a modified AP-101 simulant composed of 5 M Na, 1.9 M OH, and 0 M K. The current data set isotherm aligns well at high and low Cs concentrations with the Fiskum et al. (2004) and Nash et al. (2006) isotherms, despite the experimental differences (e.g., OH and K concentrations, sRF resin lot number, and sRF resin age). In these three inert batch contact cases, the isotherm curves matched well and with the maximum Cs loading likely extending well beyond 0.7 mmol/g dry H-form resin (see Figure 3.14).
PNNL-25277 RPT-SRFBC-001, Rev. 0
4.1
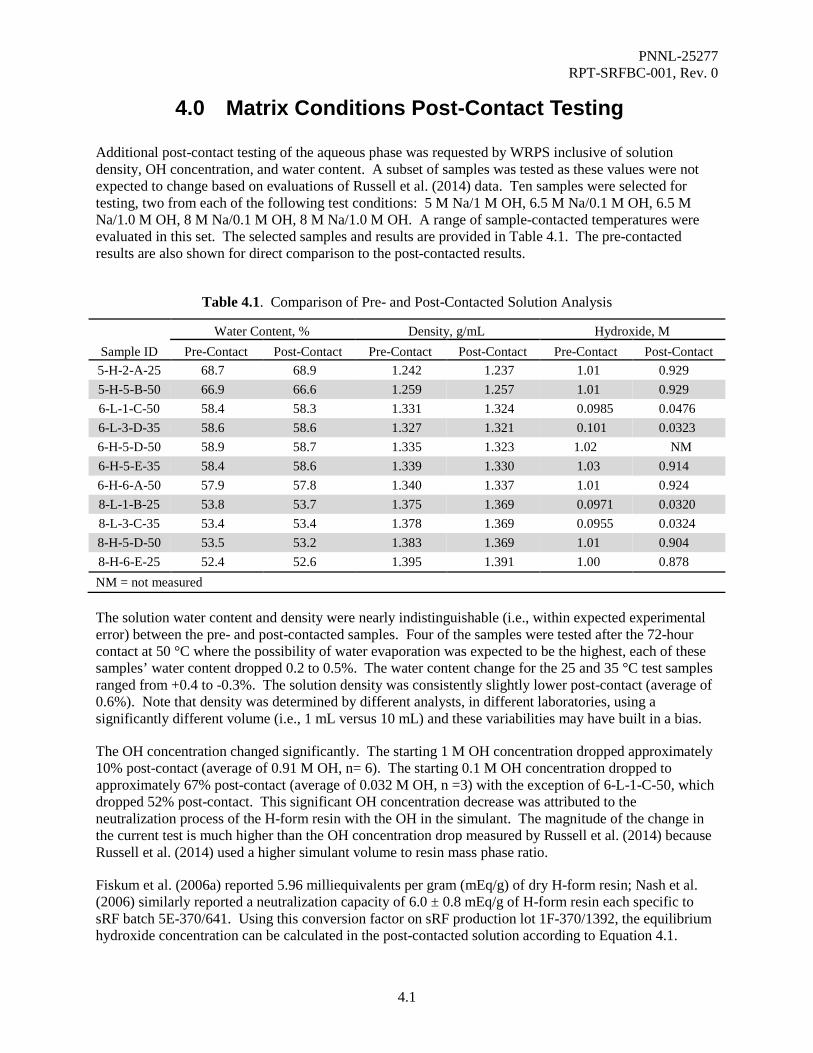
4.0 Matrix Conditions Post-Contact Testing
Additional post-contact testing of the aqueous phase was requested by WRPS inclusive of solution density, OH concentration, and water content. A subset of samples was tested as these values were not expected to change based on evaluations of Russell et al. (2014) data. Ten samples were selected for testing, two from each of the following test conditions: 5 M Na/1 M OH, 6.5 M Na/0.1 M OH, 6.5 M Na/1.0 M OH, 8 M Na/0.1 M OH, 8 M Na/1.0 M OH. A range of sample-contacted temperatures were evaluated in this set. The selected samples and results are provided in Table 4.1. The pre-contacted results are also shown for direct comparison to the post-contacted results.
Table 4.1. Comparison of Pre- and Post-Contacted Solution Analysis
Sample ID Water Content, % Density, g/mL Hydroxide, M
Pre-Contact Post-Contact Pre-Contact Post-Contact Pre-Contact Post-Contact 5-H-2-A-25 68.7 68.9 1.242 1.237 1.01 0.929 5-H-5-B-50 66.9 66.6 1.259 1.257 1.01 0.929 6-L-1-C-50 58.4 58.3 1.331 1.324 0.0985 0.0476 6-L-3-D-35 58.6 58.6 1.327 1.321 0.101 0.0323 6-H-5-D-50 58.9 58.7 1.335 1.323 1.02 NM 6-H-5-E-35 58.4 58.6 1.339 1.330 1.03 0.914 6-H-6-A-50 57.9 57.8 1.340 1.337 1.01 0.924 8-L-1-B-25 53.8 53.7 1.375 1.369 0.0971 0.0320 8-L-3-C-35 53.4 53.4 1.378 1.369 0.0955 0.0324 8-H-5-D-50 53.5 53.2 1.383 1.369 1.01 0.904 8-H-6-E-25 52.4 52.6 1.395 1.391 1.00 0.878 NM = not measured
The solution water content and density were nearly indistinguishable (i.e., within expected experimental error) between the pre- and post-contacted samples. Four of the samples were tested after the 72-hour contact at 50 °C where the possibility of water evaporation was expected to be the highest, each of these samples’ water content dropped 0.2 to 0.5%. The water content change for the 25 and 35 °C test samples ranged from +0.4 to -0.3%. The solution density was consistently slightly lower post-contact (average of 0.6%). Note that density was determined by different analysts, in different laboratories, using a significantly different volume (i.e., 1 mL versus 10 mL) and these variabilities may have built in a bias.
The OH concentration changed significantly. The starting 1 M OH concentration dropped approximately 10% post-contact (average of 0.91 M OH, n= 6). The starting 0.1 M OH concentration dropped to approximately 67% post-contact (average of 0.032 M OH, n =3) with the exception of 6-L-1-C-50, which dropped 52% post-contact. This significant OH concentration decrease was attributed to the neutralization process of the H-form resin with the OH in the simulant. The magnitude of the change in the current test is much higher than the OH concentration drop measured by Russell et al. (2014) because Russell et al. (2014) used a higher simulant volume to resin mass phase ratio.
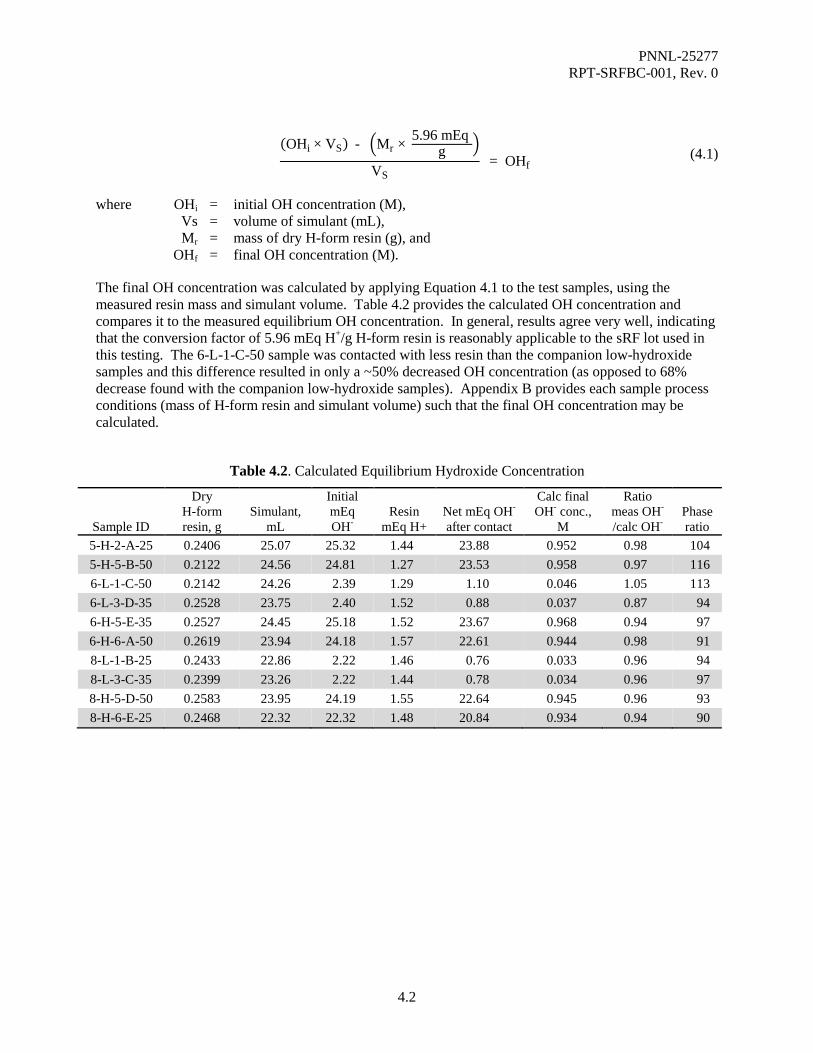
Fiskum et al. (2006a) reported 5.96 milliequivalents per gram (mEq/g) of dry H-form resin; Nash et al. (2006) similarly reported a neutralization capacity of 6.0 ± 0.8 mEq/g of H-form resin each specific to sRF batch 5E-370/641. Using this conversion factor on sRF production lot 1F-370/1392, the equilibrium hydroxide concentration can be calculated in the post-contacted solution according to Equation 4.1.
PNNL-25277 RPT-SRFBC-001, Rev. 0
4.2
(OHi × VS) - Mr × 5.96 mEq
g
VS = OHf
(4.1)
where OHi = initial OH concentration (M), Vs = volume of simulant (mL), Mr = mass of dry H-form resin (g), and OHf = final OH concentration (M).
The final OH concentration was calculated by applying Equation 4.1 to the test samples, using the measured resin mass and simulant volume. Table 4.2 provides the calculated OH concentration and compares it to the measured equilibrium OH concentration. In general, results agree very well, indicating that the conversion factor of 5.96 mEq H+/g H-form resin is reasonably applicable to the sRF lot used in this testing. The 6-L-1-C-50 sample was contacted with less resin than the companion low-hydroxide samples and this difference resulted in only a ~50% decreased OH concentration (as opposed to 68% decrease found with the companion low-hydroxide samples). Appendix B provides each sample process conditions (mass of H-form resin and simulant volume) such that the final OH concentration may be calculated.
Table 4.2. Calculated Equilibrium Hydroxide Concentration
Sample ID
Dry H-form resin, g
Simulant, mL
Initial mEq OH-
Resin mEq H+
Net mEq OH- after contact
Calc final OH- conc.,
M
Ratio meas OH-
/calc OH- Phase ratio
5-H-2-A-25 0.2406 25.07 25.32 1.44 23.88 0.952 0.98 104 5-H-5-B-50 0.2122 24.56 24.81 1.27 23.53 0.958 0.97 116 6-L-1-C-50 0.2142 24.26 2.39 1.29 1.10 0.046 1.05 113 6-L-3-D-35 0.2528 23.75 2.40 1.52 0.88 0.037 0.87 94 6-H-5-E-35 0.2527 24.45 25.18 1.52 23.67 0.968 0.94 97 6-H-6-A-50 0.2619 23.94 24.18 1.57 22.61 0.944 0.98 91 8-L-1-B-25 0.2433 22.86 2.22 1.46 0.76 0.033 0.96 94 8-L-3-C-35 0.2399 23.26 2.22 1.44 0.78 0.034 0.96 97 8-H-5-D-50 0.2583 23.95 24.19 1.55 22.64 0.945 0.96 93 8-H-6-E-25 0.2468 22.32 22.32 1.48 20.84 0.934 0.94 90

PNNL-25277 RPT-SRFBC-001, Rev. 0
5.1
5.0 Conclusions
Small sRF resin samples were contacted with a simple simulant consisting of variable concentrations of Na, K, Cs, OH-, NO3
-, and NO2- for 72 hours at 25, 35, and 50 °C. The Cs was measured in the pre- and
post-contacted samples so that the Cs loading on the sRF could be calculated at each process condition. A large number of isotherms were developed from these data allowing trends to be observed as functions of matrix and temperature parameters. The following conclusions were developed from the isotherm testing:
• Use of aged resin: Tie back to previous data with the 5 M Na matrix conditions showed that the sRF had maintained its effectiveness since production and aging (i.e., 5 years).
• Sodium effect: There was virtually no difference in cesium loading between 6.5 and 8 M sodium at low cesium concentrations and slightly enhanced cesium loading at 6.5 M Na and high cesium concentrations.
• Potassium effect: The potassium effect varied with cesium concentrations. As potassium concentration increases, cesium loading decreases. However, the potassium effect diminishes as the cesium concentration increases essentially resulting in convergence of isotherms at the highest cesium concentration tested. The K concentration has a greater effect at both lower Cs and Na levels. This is attributable to competition for the resin sites between the K and the Cs.
• Hydroxide effect: The equilibrium hydroxide concentration in these tests were nominally 0.03 M and 0.91 M (from the neutralization of feed matrix hydroxide with the H-form resin). The effect of OH on Cs loading is slightly larger at higher Na levels. The more OH present, the more of a positive effect on the Cs loading is seen.
• Temperature effect: At both 6.5 and 8 M sodium increasing temperature decreased the cesium load capacity, regardless of potassium and hydroxide concentrations. The depression at 8 M Na was slightly enhanced relative to the 6.5 M Na matrix.
• It is recommended that ion exchange column and cycle modeling, that addresses plant constraints, be applied to optimize Cs loading efficiency.
•


PNNL-25277 RPT-SRFBC-001, Rev. 0
6.1
6.0 References
Ard KE. 2014. Technology Maturation Plan for the Low-Activity Waste Pretreatment System Project (T5L01). RPP-PLAN-57181, Rev. 1, Washington River Protection Solutions, LLC, Richland, Washington.
Arm ST and DL Blanchard Jr. 2004. Pre-Conditioning and Regeneration Requirements of Ground Gel Resorcinol Formaldehyde Ion Exchange Resin. PNWD-3390, WTP-RPT-104, Battelle–Pacific Northwest Division, Richland, Washington.
Bray LA, KJ Carson, RJ Elovich, and DE Kurath. 1996. Equilibrium Data for Cesium Ion Exchange of Hanford CC and NCAW Tank Waste. PNNL-11123, Pacific Northwest National Laboratory, Richland, Washington.
Dwivedi C, SK Pathak, M Kumar, SC Tripathi, and PN Bajaj. 2013. "Removal of cesium by spherical resorcinol-formaldehyde resin beads: Sorption and kinetic studies." Journal of Radioanalytical and Nuclear Chemistry 297(1):1-8.
Fiskum SK, ST Arm, WC Buchmiller, T Trang-Le, JE Martinez, J Matyas, MJ Steele, KK Thomas, and DL Blanchard, Jr. 2006a. Comparison Testing of Multiple Spherical Resorcinol-Formaldehyde Resins for the River Protection Project-Waste Treatment Plant. PNWD-3785; WTP-RPT-143, Rev. 1, Battelle–Pacific Northwest Division, Richland, Washington.
Fiskum SK, ST Arm, MS Fountain, MJ Steele, and DL Blanchard, Jr. 2006b. Spherical Resorcinol-Formaldehyde Resin Testing for Cs-137 Removal from Simulated and Actual Hanford Waste Tank 241-AP-101 Diluted Feed (Envelope A) Using Small Column Ion Exchange. PNWD-3697; WTP-RPT-134, Rev. 0, Battelle–Pacific Northwest Division, Richland, Washington.
Fiskum SK, MJ Steele, and DL Blanchard, Jr. 2006c. Small Column Ion Exchange Testing of Spherical Resorcinol-Formaldehyde Resin for Cs-137 Removal from Pre-Treated Hanford Tank 241-AN-102 Waste (Envelope C). PNWD-3751; WTP-RPT-135, Rev. 1, Battelle–Pacific Northwest Division, Richland, Washington.
Fiskum SK, BS Augspurger, KP Brooks, WC Buchmiller, RL Russell, MJ Schweiger, LA Snow, MJ Steele, KK Thomas, DE Wallace, NH Wong, JD Yeager, and DL Blanchard, Jr. 2004. Comparison Testing of Multiple Resorcinol-Formaldehyde Resins for the River Protection Project–Waste Treatment Plant. PNWD-3387; WTP-RPT-103, Rev. 0, Battelle Pacific Northwest Division, Richland, Washington.
Fiskum SK, ST Arm, MK Edwards, MJ Steele, and KK Thomas. 2007. Storage and Aging Effects on Spherical Resorcinol-Formaldehyde Resin Ion Exchange Performance. PNNL-16832; WTP-RPT-148, Rev. 0, Pacific Northwest National Laboratory, Richland, Washington.
King WD, CE Duffey, and SH Malene. 2004. Determination of Cesium (Cs+) Adsorption Kinetics and Equilibrium Isotherms from Hanford Waste Simulants using Resorcinol-Formaldehyde Resins. WSRC-TR-2003-00574, SRT-RPP-2003-00252, Rev. 0, Savannah River National Laboratory, Aiken, South Carolina.
Nash CA, MR Duignan, and CE Duffey. 2006. Batch, Kinetics, and Column Data from Spherical Resorcinol-Formaldehyde Resin. WSRC-STI-2006-00071, SRNL-RPP-2006-00024, Savannah River National Laboratory, Aiken, South Carolina.
PNNL-25277 RPT-SRFBC-001, Rev. 0
6.2
Nash CA and ST Isom. 2010. "Characterization of Spherical Resorcinol-Formaldehyde Resin Cesium Adsorption with Batch Contact Tests." Separation Science and Technology 45(12-13):1822-1827.
Reynolds JG. 2015. Waste Acceptance Criteria for the Low Activity Waste Pretreatment System. RPP-RPT-58649 Rev. 0, Washington River Protection Solutions, Richland Washington.
Russell RL, DE Rinehart, GN Brown, and RA Peterson. 2012. "Cesium Ion Exchange Loading Kinetics Testing with SRF Resin." Separation Science and Technology 47(14-15):2129-2135.
Russell RL, DE Rinehart, and RA Peterson. 2014. Ion Exchange Testing with SRF Resin FY 2012. PNNL-21645 Rev 1; WTP-RPT-223 Rev 1, Pacific Northwest National Laboratory, Richland, Washington.
PNNL-25277 RPT-SRFBC-001, Rev. 0
Appendix A –
As-Prepared Composition of Feed Simulant

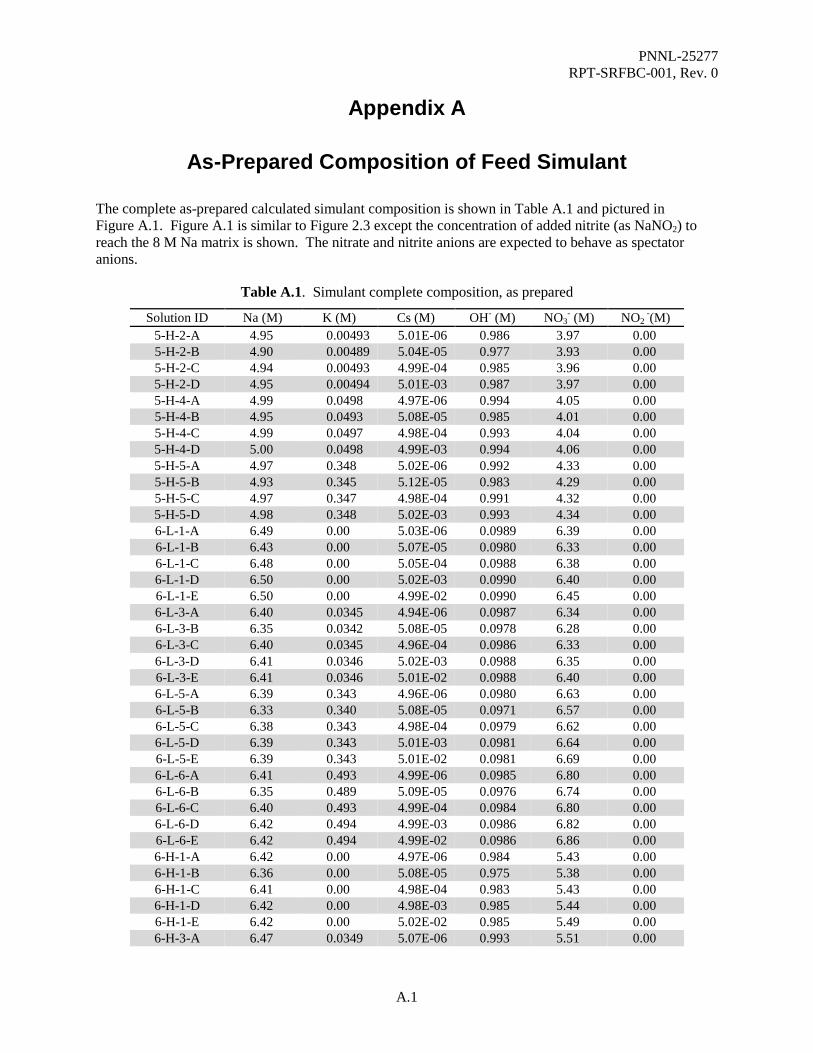
PNNL-25277 RPT-SRFBC-001, Rev. 0
A.1
Appendix A
As-Prepared Composition of Feed Simulant
The complete as-prepared calculated simulant composition is shown in Table A.1 and pictured in Figure A.1. Figure A.1 is similar to Figure 2.3 except the concentration of added nitrite (as NaNO2) to reach the 8 M Na matrix is shown. The nitrate and nitrite anions are expected to behave as spectator anions.
Table A.1. Simulant complete composition, as prepared
Solution ID Na (M) K (M) Cs (M) OH- (M) NO3- (M) NO2
-(M) 5-H-2-A 4.95 0.00493 5.01E-06 0.986 3.97 0.00 5-H-2-B 4.90 0.00489 5.04E-05 0.977 3.93 0.00 5-H-2-C 4.94 0.00493 4.99E-04 0.985 3.96 0.00 5-H-2-D 4.95 0.00494 5.01E-03 0.987 3.97 0.00 5-H-4-A 4.99 0.0498 4.97E-06 0.994 4.05 0.00 5-H-4-B 4.95 0.0493 5.08E-05 0.985 4.01 0.00 5-H-4-C 4.99 0.0497 4.98E-04 0.993 4.04 0.00 5-H-4-D 5.00 0.0498 4.99E-03 0.994 4.06 0.00 5-H-5-A 4.97 0.348 5.02E-06 0.992 4.33 0.00 5-H-5-B 4.93 0.345 5.12E-05 0.983 4.29 0.00 5-H-5-C 4.97 0.347 4.98E-04 0.991 4.32 0.00 5-H-5-D 4.98 0.348 5.02E-03 0.993 4.34 0.00 6-L-1-A 6.49 0.00 5.03E-06 0.0989 6.39 0.00 6-L-1-B 6.43 0.00 5.07E-05 0.0980 6.33 0.00 6-L-1-C 6.48 0.00 5.05E-04 0.0988 6.38 0.00 6-L-1-D 6.50 0.00 5.02E-03 0.0990 6.40 0.00 6-L-1-E 6.50 0.00 4.99E-02 0.0990 6.45 0.00 6-L-3-A 6.40 0.0345 4.94E-06 0.0987 6.34 0.00 6-L-3-B 6.35 0.0342 5.08E-05 0.0978 6.28 0.00 6-L-3-C 6.40 0.0345 4.96E-04 0.0986 6.33 0.00 6-L-3-D 6.41 0.0346 5.02E-03 0.0988 6.35 0.00 6-L-3-E 6.41 0.0346 5.01E-02 0.0988 6.40 0.00 6-L-5-A 6.39 0.343 4.96E-06 0.0980 6.63 0.00 6-L-5-B 6.33 0.340 5.08E-05 0.0971 6.57 0.00 6-L-5-C 6.38 0.343 4.98E-04 0.0979 6.62 0.00 6-L-5-D 6.39 0.343 5.01E-03 0.0981 6.64 0.00 6-L-5-E 6.39 0.343 5.01E-02 0.0981 6.69 0.00 6-L-6-A 6.41 0.493 4.99E-06 0.0985 6.80 0.00 6-L-6-B 6.35 0.489 5.09E-05 0.0976 6.74 0.00 6-L-6-C 6.40 0.493 4.99E-04 0.0984 6.80 0.00 6-L-6-D 6.42 0.494 4.99E-03 0.0986 6.82 0.00 6-L-6-E 6.42 0.494 4.99E-02 0.0986 6.86 0.00 6-H-1-A 6.42 0.00 4.97E-06 0.984 5.43 0.00 6-H-1-B 6.36 0.00 5.08E-05 0.975 5.38 0.00 6-H-1-C 6.41 0.00 4.98E-04 0.983 5.43 0.00 6-H-1-D 6.42 0.00 4.98E-03 0.985 5.44 0.00 6-H-1-E 6.42 0.00 5.02E-02 0.985 5.49 0.00 6-H-3-A 6.47 0.0349 5.07E-06 0.993 5.51 0.00

PNNL-25277 RPT-SRFBC-001, Rev. 0
A.2
Table A.1. (contd)
Solution ID Na (M) K (M) Cs (M) OH- (M) NO3- (M) NO2
-(M) 6-H-3-B 6.41 0.0346 5.08E-05 0.984 5.46 0.00 6-H-3-C 6.46 0.0349 5.02E-04 0.992 5.50 0.00 6-H-3-D 6.47 0.0350 4.99E-03 0.994 5.52 0.00 6-H-3-E 6.47 0.0350 5.02E-02 0.994 5.57 0.00 6-H-5-A 6.45 0.347 5.00E-06 0.990 5.81 0.00 6-H-5-B 6.39 0.344 5.10E-05 0.981 5.76 0.00 6-H-5-C 6.45 0.347 4.97E-04 0.989 5.80 0.00 6-H-5-D 6.46 0.348 5.02E-03 0.991 5.82 0.00 6-H-5-E 6.46 0.348 5.00E-02 0.991 5.87 0.00 6-H-6-A 6.44 0.496 4.99E-06 0.986 5.95 0.00 6-H-6-B 6.39 0.492 5.08E-05 0.978 5.90 0.00 6-H-6-C 6.44 0.496 4.95E-04 0.985 5.95 0.00 6-H-6-D 6.45 0.497 4.98E-03 0.987 5.96 0.00 6-H-6-E 6.45 0.497 4.98E-02 0.987 6.01 0.00 8-L-1-A 7.99 0.00 4.99E-06 0.0995 5.93 1.96 8-L-1-B 7.91 0.00 5.09E-05 0.0986 5.87 1.94 8-L-1-C 7.98 0.00 4.99E-04 0.0994 5.92 1.96 8-L-1-D 7.99 0.00 4.98E-03 0.0996 5.94 1.96 8-L-1-E 7.99 0.00 4.98E-02 0.0996 5.98 1.96 8-L-3-A 7.99 0.0350 5.00E-06 0.0997 5.96 1.97 8-L-3-B 7.92 0.0347 5.10E-05 0.0988 5.90 1.95 8-L-3-C 7.98 0.0350 4.96E-04 0.0996 5.95 1.97 8-L-3-D 8.00 0.0350 4.99E-03 0.0998 5.97 1.97 8-L-3-E 8.00 0.0350 4.98E-02 0.0998 6.01 1.97 8-L-5-A 8.00 0.349 5.06E-06 0.0998 6.28 1.97 8-L-5-B 7.91 0.345 6.24E-05 0.0987 6.21 1.95 8-L-5-C 7.99 0.349 5.09E-04 0.0997 6.27 1.97 8-L-5-D 8.00 0.350 5.00E-03 0.0999 6.29 1.97 8-L-5-E 8.00 0.350 5.02E-02 0.0999 6.33 1.97 8-L-6-A 7.99 0.499 4.95E-06 0.0997 6.42 1.97 8-L-6-B 7.92 0.495 5.02E-05 0.0988 6.37 1.95 8-L-6-C 7.98 0.499 5.00E-04 0.0996 6.42 1.97 8-L-6-D 8.00 0.500 4.99E-03 0.0998 6.43 1.97 8-L-6-E 8.00 0.500 5.00E-02 0.0998 6.48 1.97 8-H-1-A 8.00 0.00 5.00E-06 0.997 5.25 1.75 8-H-1-B 7.92 0.00 5.04E-05 0.988 5.20 1.74 8-H-1-C 7.99 0.00 4.99E-04 0.996 5.24 1.75 8-H-1-D 8.00 0.00 5.01E-03 0.998 5.26 1.75 8-H-1-E 8.00 0.00 5.02E-02 0.998 5.30 1.75 8-H-3-A 7.99 0.0349 5.03E-06 0.997 5.29 1.74 8-H-3-B 7.92 0.0346 5.03E-05 0.988 5.24 1.73 8-H-3-C 7.98 0.0349 4.99E-04 0.996 5.28 1.74 8-H-3-D 8.00 0.0350 5.01E-03 0.998 5.30 1.74 8-H-3-E 8.00 0.0350 5.02E-02 0.998 5.34 1.74 8-H-5-A 8.00 0.349 5.02E-06 0.997 5.60 1.75 8-H-5-B 7.93 0.346 5.03E-05 0.988 5.55 1.74 8-H-5-C 7.99 0.349 5.03E-04 0.996 5.59 1.75 8-H-5-D 8.01 0.350 5.02E-03 0.998 5.61 1.75 8-H-5-E 8.01 0.350 5.01E-02 0.998 5.65 1.75 8-H-6-A 7.99 0.499 4.95E-06 0.997 5.75 1.75
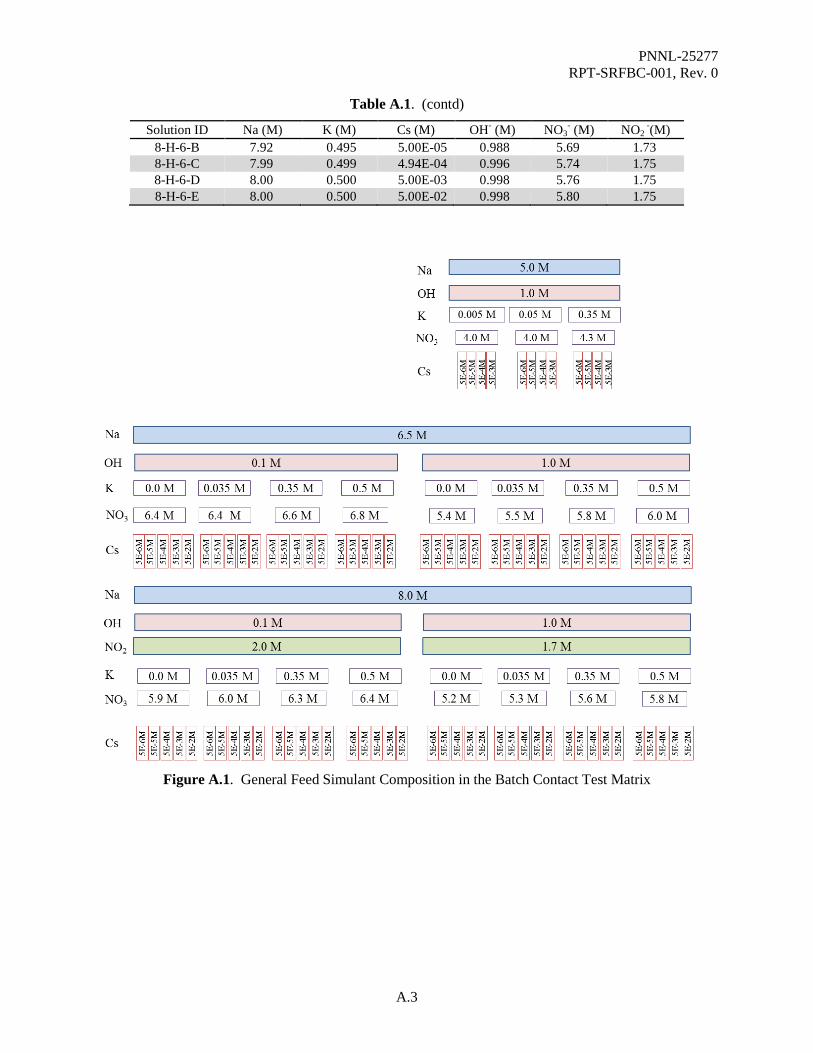
PNNL-25277 RPT-SRFBC-001, Rev. 0
A.3
Table A.1. (contd)
Solution ID Na (M) K (M) Cs (M) OH- (M) NO3- (M) NO2
-(M) 8-H-6-B 7.92 0.495 5.00E-05 0.988 5.69 1.73 8-H-6-C 7.99 0.499 4.94E-04 0.996 5.74 1.75 8-H-6-D 8.00 0.500 5.00E-03 0.998 5.76 1.75 8-H-6-E 8.00 0.500 5.00E-02 0.998 5.80 1.75
Figure A.1. General Feed Simulant Composition in the Batch Contact Test Matrix


PNNL-25277 RPT-SRFBC-001, Rev. 0
Appendix B –
Batch Testing Parameters


PNNL-25277 RPT-SRFBC-001, Rev. 0
B.1
Appendix B
Batch Testing Parameters
Table B.1. Datasheet for 50 °C Batch Loading Tests
Sample Simulant ID Used
Mass of Wet Resin Added
Mass of Dry Resin
Added
Mass of Simulant Added
Vol of Simulant Added Resin Added
Resin Removed
ID No. (g) (g) (g) (mL) Date/Time Date/Time 5-H-2-A-50 5-H-2-A 0.4181 0.2131 30.310 24.41 11/30/15 9:28 12/3/15 9:38 5-H-2-B-50 5-H-2-B 0.4182 0.2131 30.463 24.55 11/30/15 9:30 12/3/15 9:40 5-H-2-C-50 5-H-2-C 0.4173 0.2126 30.145 24.28 11/30/15 9:32 12/3/15 9:41 5-H-2-D-50 5-H-2-D 0.4188 0.2134 30.416 24.50 11/30/15 9:34 12/3/15 9:42 5-H-4-A-50 5-H-4-A 0.4331 0.2207 30.805 24.76 11/30/15 9:35 12/3/15 9:44 5-H-4-B-50 5-H-4-B 0.4171 0.2125 30.332 24.39 11/30/15 9:36 12/3/15 9:45 5-H-4-C-50 5-H-4-C 0.4180 0.2130 30.518 24.49 11/30/15 9:37 12/3/15 9:47 5-H-4-D-50 5-H-4-D 0.4231 0.2156 30.580 24.53 11/30/15 9:39 12/3/15 9:48 5-H-5-A-50 5-H-5-A 0.4210 0.2145 30.945 24.54 11/30/15 9:40 12/3/15 9:50 5-H-5-B-50 5-H-5-B 0.4165 0.2122 30.918 24.56 11/30/15 9:42 12/3/15 9:51 5-H-5-C-50 5-H-5-C 0.4188 0.2134 31.118 24.69 11/30/15 9:45 12/3/15 9:53 5-H-5-D-50 5-H-5-D 0.4187 0.2134 30.924 24.50 11/30/15 9:47 12/3/15 9:54 6-L-1-A-50 6-L-1-A 0.4244 0.2163 32.421 24.04 11/30/15 9:48 12/3/15 9:56 6-L-1-A-50D 6-L-1-A 0.4215 0.2148 32.364 24.00 11/30/15 9:49 12/3/15 9:57 6-L-1-B-50 6-L-1-B 0.4183 0.2132 32.346 24.32 11/30/15 9:51 12/3/15 10:00 6-L-1-B-50D 6-L-1-B 0.4202 0.2141 32.525 24.46 11/30/15 9:53 12/3/15 10:02 6-L-1-C-50 6-L-1-C 0.4203 0.2142 32.296 24.26 11/30/15 9:55 12/3/15 10:03 6-L-1-C-50D 6-L-1-C 0.4198 0.2139 32.602 24.49 11/30/15 9:57 12/3/15 10:05 6-L-1-D-50 6-L-1-D 0.4287 0.2185 32.349 24.29 11/30/15 10:00 12/3/15 10:06 6-L-1-D-50D 6-L-1-D 0.4182 0.2131 32.442 24.36 11/30/15 10:01 12/3/15 10:08 6-L-1-E-50 6-L-1-E 0.4187 0.2134 32.724 24.51 11/30/15 10:04 12/3/15 10:09 6-L-1-E-50D 6-L-1-E 0.4180 0.2130 32.709 24.49 11/30/15 10:06 12/3/15 10:12 6-H-1-A-50 6-H-1-A 0.4227 0.2154 32.394 24.71 11/30/15 10:08 12/3/15 10:14 6-H-1-B-50 6-H-1-B 0.4184 0.2132 32.267 24.66 11/30/15 10:09 12/3/15 10:16 6-H-1-C-50 6-H-1-C 0.4207 0.2144 32.012 24.42 11/30/15 10:11 12/3/15 10:17 6-H-1-D-50 6-H-1-D 0.4244 0.2163 32.334 24.51 11/30/15 10:13 12/3/15 10:19 6-H-1-E-50 6-H-1-E 0.4195 0.2138 32.440 24.65 11/30/15 10:14 12/3/15 10:20 6-L-3-A-50 6-L-3-A 0.4214 0.2147 32.616 24.58 11/30/15 10:16 12/3/15 10:23 6-L-3-B-50 6-L-3-B 0.4215 0.2148 32.428 24.50 11/30/15 10:17 12/3/15 10:25 6-L-3-C-50 6-L-3-C 0.4247 0.2164 32.550 24.55 11/30/15 10:18 12/3/15 10:26 6-L-3-D-50 6-L-3-D 0.4216 0.2148 32.511 24.50 11/30/15 10:19 12/3/15 10:28 6-L-3-E-50 6-L-3-E 0.4211 0.2146 32.527 24.39 11/30/15 10:21 12/3/15 10:30 6-H-3-A-50 6-H-3-A 0.4231 0.2156 31.627 24.02 11/30/15 10:22 12/3/15 10:31
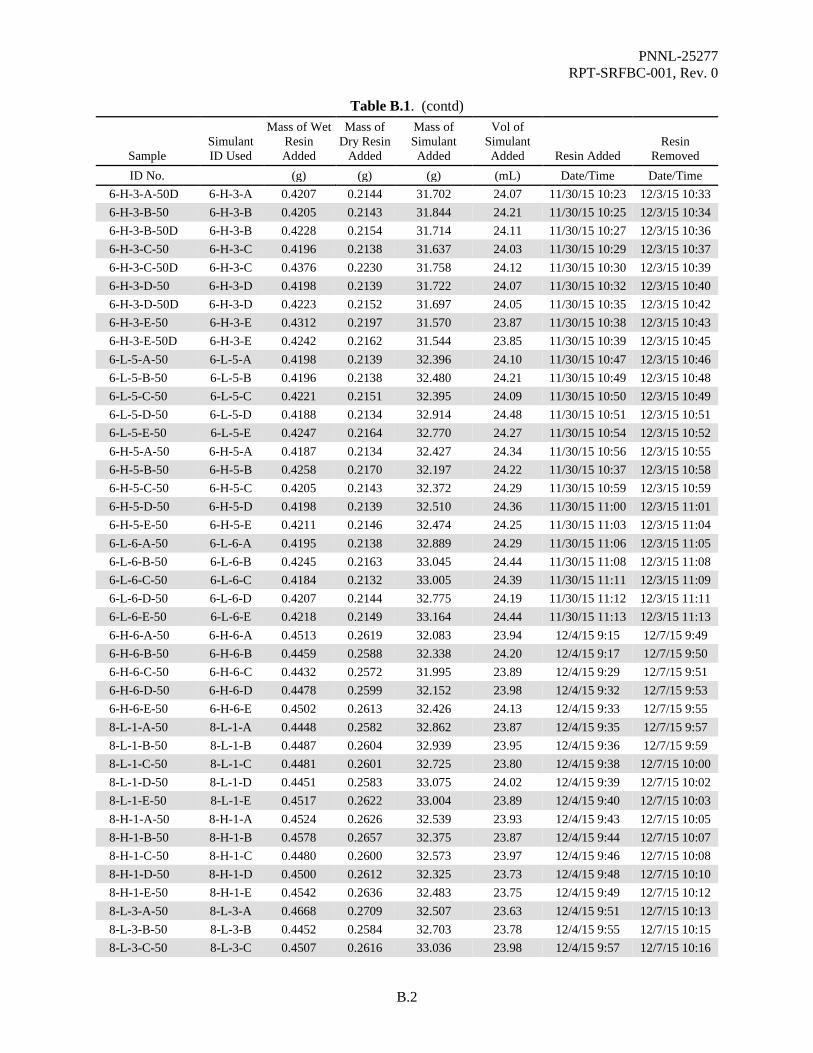
PNNL-25277 RPT-SRFBC-001, Rev. 0
B.2
Table B.1. (contd)
Sample Simulant ID Used
Mass of Wet Resin Added
Mass of Dry Resin
Added
Mass of Simulant Added
Vol of Simulant Added Resin Added
Resin Removed
ID No. (g) (g) (g) (mL) Date/Time Date/Time 6-H-3-A-50D 6-H-3-A 0.4207 0.2144 31.702 24.07 11/30/15 10:23 12/3/15 10:33 6-H-3-B-50 6-H-3-B 0.4205 0.2143 31.844 24.21 11/30/15 10:25 12/3/15 10:34 6-H-3-B-50D 6-H-3-B 0.4228 0.2154 31.714 24.11 11/30/15 10:27 12/3/15 10:36 6-H-3-C-50 6-H-3-C 0.4196 0.2138 31.637 24.03 11/30/15 10:29 12/3/15 10:37 6-H-3-C-50D 6-H-3-C 0.4376 0.2230 31.758 24.12 11/30/15 10:30 12/3/15 10:39 6-H-3-D-50 6-H-3-D 0.4198 0.2139 31.722 24.07 11/30/15 10:32 12/3/15 10:40 6-H-3-D-50D 6-H-3-D 0.4223 0.2152 31.697 24.05 11/30/15 10:35 12/3/15 10:42 6-H-3-E-50 6-H-3-E 0.4312 0.2197 31.570 23.87 11/30/15 10:38 12/3/15 10:43 6-H-3-E-50D 6-H-3-E 0.4242 0.2162 31.544 23.85 11/30/15 10:39 12/3/15 10:45 6-L-5-A-50 6-L-5-A 0.4198 0.2139 32.396 24.10 11/30/15 10:47 12/3/15 10:46 6-L-5-B-50 6-L-5-B 0.4196 0.2138 32.480 24.21 11/30/15 10:49 12/3/15 10:48 6-L-5-C-50 6-L-5-C 0.4221 0.2151 32.395 24.09 11/30/15 10:50 12/3/15 10:49 6-L-5-D-50 6-L-5-D 0.4188 0.2134 32.914 24.48 11/30/15 10:51 12/3/15 10:51 6-L-5-E-50 6-L-5-E 0.4247 0.2164 32.770 24.27 11/30/15 10:54 12/3/15 10:52 6-H-5-A-50 6-H-5-A 0.4187 0.2134 32.427 24.34 11/30/15 10:56 12/3/15 10:55 6-H-5-B-50 6-H-5-B 0.4258 0.2170 32.197 24.22 11/30/15 10:37 12/3/15 10:58 6-H-5-C-50 6-H-5-C 0.4205 0.2143 32.372 24.29 11/30/15 10:59 12/3/15 10:59 6-H-5-D-50 6-H-5-D 0.4198 0.2139 32.510 24.36 11/30/15 11:00 12/3/15 11:01 6-H-5-E-50 6-H-5-E 0.4211 0.2146 32.474 24.25 11/30/15 11:03 12/3/15 11:04 6-L-6-A-50 6-L-6-A 0.4195 0.2138 32.889 24.29 11/30/15 11:06 12/3/15 11:05 6-L-6-B-50 6-L-6-B 0.4245 0.2163 33.045 24.44 11/30/15 11:08 12/3/15 11:08 6-L-6-C-50 6-L-6-C 0.4184 0.2132 33.005 24.39 11/30/15 11:11 12/3/15 11:09 6-L-6-D-50 6-L-6-D 0.4207 0.2144 32.775 24.19 11/30/15 11:12 12/3/15 11:11 6-L-6-E-50 6-L-6-E 0.4218 0.2149 33.164 24.44 11/30/15 11:13 12/3/15 11:13 6-H-6-A-50 6-H-6-A 0.4513 0.2619 32.083 23.94 12/4/15 9:15 12/7/15 9:49 6-H-6-B-50 6-H-6-B 0.4459 0.2588 32.338 24.20 12/4/15 9:17 12/7/15 9:50 6-H-6-C-50 6-H-6-C 0.4432 0.2572 31.995 23.89 12/4/15 9:29 12/7/15 9:51 6-H-6-D-50 6-H-6-D 0.4478 0.2599 32.152 23.98 12/4/15 9:32 12/7/15 9:53 6-H-6-E-50 6-H-6-E 0.4502 0.2613 32.426 24.13 12/4/15 9:33 12/7/15 9:55 8-L-1-A-50 8-L-1-A 0.4448 0.2582 32.862 23.87 12/4/15 9:35 12/7/15 9:57 8-L-1-B-50 8-L-1-B 0.4487 0.2604 32.939 23.95 12/4/15 9:36 12/7/15 9:59 8-L-1-C-50 8-L-1-C 0.4481 0.2601 32.725 23.80 12/4/15 9:38 12/7/15 10:00 8-L-1-D-50 8-L-1-D 0.4451 0.2583 33.075 24.02 12/4/15 9:39 12/7/15 10:02 8-L-1-E-50 8-L-1-E 0.4517 0.2622 33.004 23.89 12/4/15 9:40 12/7/15 10:03 8-H-1-A-50 8-H-1-A 0.4524 0.2626 32.539 23.93 12/4/15 9:43 12/7/15 10:05 8-H-1-B-50 8-H-1-B 0.4578 0.2657 32.375 23.87 12/4/15 9:44 12/7/15 10:07 8-H-1-C-50 8-H-1-C 0.4480 0.2600 32.573 23.97 12/4/15 9:46 12/7/15 10:08 8-H-1-D-50 8-H-1-D 0.4500 0.2612 32.325 23.73 12/4/15 9:48 12/7/15 10:10 8-H-1-E-50 8-H-1-E 0.4542 0.2636 32.483 23.75 12/4/15 9:49 12/7/15 10:12 8-L-3-A-50 8-L-3-A 0.4668 0.2709 32.507 23.63 12/4/15 9:51 12/7/15 10:13 8-L-3-B-50 8-L-3-B 0.4452 0.2584 32.703 23.78 12/4/15 9:55 12/7/15 10:15 8-L-3-C-50 8-L-3-C 0.4507 0.2616 33.036 23.98 12/4/15 9:57 12/7/15 10:16

PNNL-25277 RPT-SRFBC-001, Rev. 0
B.3
Table B.1. (contd)
Sample Simulant ID Used
Mass of Wet Resin Added
Mass of Dry Resin
Added
Mass of Simulant Added
Vol of Simulant Added Resin Added
Resin Removed
ID No. (g) (g) (g) (mL) Date/Time Date/Time 8-L-3-D-50 8-L-3-D 0.4516 0.2621 32.717 23.77 12/4/15 9:58 12/7/15 10:18 8-L-3-E-50 8-L-3-E 0.4424 0.2568 32.865 23.81 12/4/15 9:59 12/7/15 10:19 8-H-3-A-50 8-H-3-A 0.4434 0.2573 32.558 23.85 12/4/15 10:00 12/7/15 10:22 8-H-3-B-50 8-H-3-B 0.4517 0.2622 32.417 23.80 12/4/15 10:02 12/7/15 10:23 8-H-3-C-50 8-H-3-C 0.4463 0.2590 32.414 23.76 12/4/15 10:20 12/7/15 10:25 8-H-3-D-50 8-H-3-D 0.4418 0.2564 32.717 23.99 12/4/15 10:22 12/7/15 10:26 8-H-3-E-50 8-H-3-E 0.4553 0.2643 32.784 23.98 12/4/15 10:23 12/7/15 10:28 8-L-5-A-50 8-L-5-A 0.4502 0.2613 33.179 23.79 12/4/15 10:26 12/7/15 10:29 8-L-5-A-50D 8-L-5-A 0.4472 0.2596 33.193 23.80 12/4/15 10:27 12/7/15 10:31 8-L-5-B-50 8-L-5-B 0.4439 0.2576 33.434 24.04 12/4/15 10:31 12/7/15 10:33 8-L-5-B-50D 8-L-5-B 0.4507 0.2616 33.333 23.97 12/4/15 10:32 12/7/15 10:34 8-L-5-C-50 8-L-5-C 0.4467 0.2593 33.339 23.93 12/4/15 10:34 12/7/15 10:36 8-L-5-C-50D 8-L-5-C 0.4471 0.2595 33.341 23.93 12/4/15 10:37 12/7/15 10:37 8-L-5-D-50 8-L-5-D 0.4541 0.2636 33.469 24.02 12/4/15 10:41 12/7/15 10:38 8-L-5-D-50D 8-L-5-D 0.4498 0.2611 33.331 23.92 12/4/15 10:47 12/7/15 10:40 8-L-5-E-50 8-L-5-E 0.4499 0.2611 33.442 23.90 12/4/15 10:48 12/7/15 10:43 8-L-5-E-50D 8-L-5-E 0.4448 0.2582 33.411 23.88 12/4/15 10:50 12/7/15 10:44 8-H-5-A-50 8-H-5-A 0.4423 0.2567 33.684 24.33 12/4/15 10:51 12/7/15 10:46 8-H-5-B-50 8-H-5-B 0.4490 0.2606 32.821 23.78 12/4/15 10:53 12/7/15 10:47 8-H-5-C-50 8-H-5-C 0.4454 0.2585 33.003 23.89 12/4/15 10:54 12/7/15 10:49 8-H-5-D-50 8-H-5-D 0.4450 0.2583 33.128 23.95 12/4/15 10:55 12/7/15 10:50 8-H-5-E-50 8-H-5-E 0.4548 0.2640 32.373 23.38 12/4/15 10:56 12/7/15 10:52 8-L-6-A-50 8-L-6-A 0.4505 0.2615 33.622 23.98 12/4/15 10:58 12/7/15 10:53 8-L-6-B-50 8-L-6-B 0.4508 0.2616 33.557 23.96 12/4/15 11:00 12/7/15 10:55 8-L-6-C-50 8-L-6-C 0.4438 0.2576 33.513 23.91 12/4/15 11:01 12/7/15 10:56 8-L-6-D-50 8-L-6-D 0.4516 0.2621 33.633 23.98 12/4/15 11:03 12/7/15 10:58 8-L-6-E-50 8-L-6-E 0.4506 0.2615 33.678 23.89 12/4/15 11:04 12/7/15 10:59 8-H-6-A-50 8-H-6-A 0.4544 0.2637 33.105 23.84 12/4/15 11:06 12/7/15 11:02 8-H-6-A-50D 8-H-6-A 0.4415 0.2562 32.941 23.72 12/4/15 11:08 12/7/15 11:03 8-H-6-B-50 8-H-6-B 0.4430 0.2571 32.753 23.63 12/4/15 11:11 12/7/15 11:06 8-H-6-B-50D 8-H-6-B 0.4563 0.2648 32.519 23.46 12/4/15 11:12 12/7/15 11:07 8-H-6-C-50 8-H-6-C 0.4423 0.2567 32.715 23.57 12/4/15 11:14 12/7/15 11:08 8-H-6-C-50D 8-H-6-C 0.4488 0.2605 32.603 23.49 12/4/15 11:15 12/7/15 11:10 8-H-6-D-50 8-H-6-D 0.4401 0.2554 32.639 23.49 12/4/15 11:17 12/7/15 11:12 8-H-6-D-50D 8-H-6-D 0.4465 0.2591 32.487 23.38 12/4/15 11:18 12/7/15 11:13 8-H-6-E-50 8-H-6-E 0.4553 0.2643 32.711 23.45 12/4/15 11:19 12/7/15 11:15 8-H-6-E-50D 8-H-6-E 0.4448 0.2582 32.654 23.41 12/4/15 11:22 12/7/15 11:16
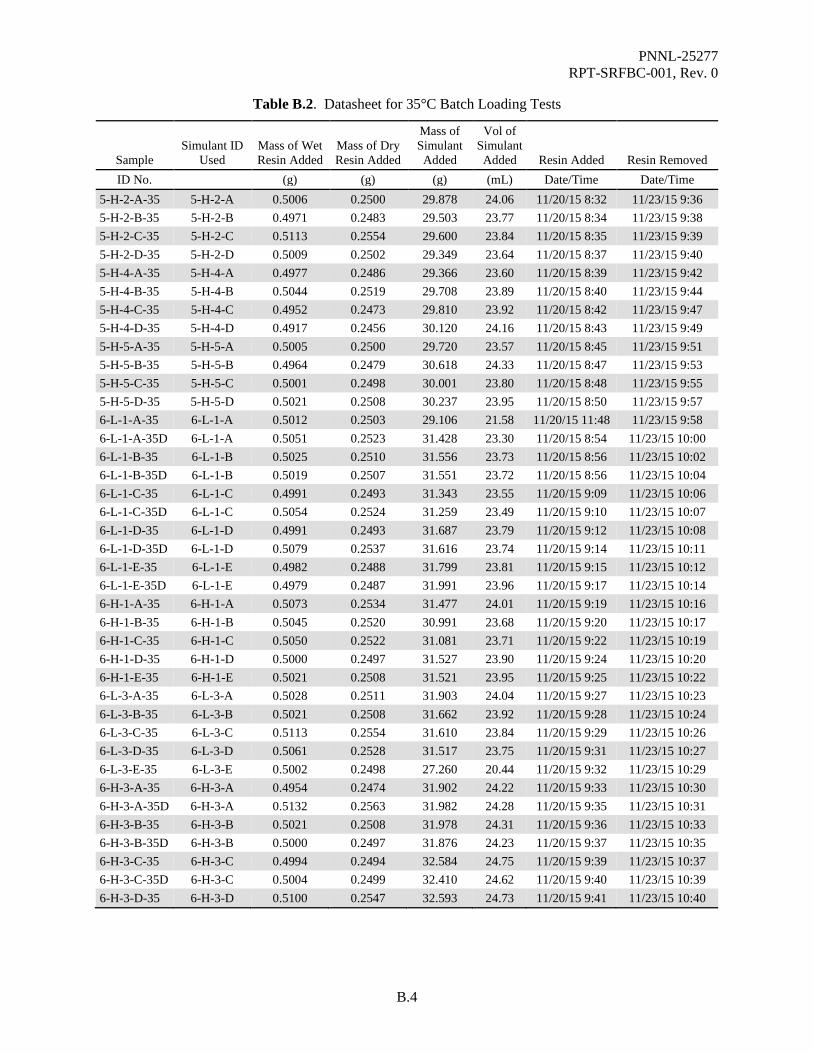
PNNL-25277 RPT-SRFBC-001, Rev. 0
B.4
Table B.2. Datasheet for 35°C Batch Loading Tests
Sample Simulant ID
Used Mass of Wet Resin Added
Mass of Dry Resin Added
Mass of Simulant Added
Vol of Simulant Added Resin Added Resin Removed
ID No. (g) (g) (g) (mL) Date/Time Date/Time 5-H-2-A-35 5-H-2-A 0.5006 0.2500 29.878 24.06 11/20/15 8:32 11/23/15 9:36 5-H-2-B-35 5-H-2-B 0.4971 0.2483 29.503 23.77 11/20/15 8:34 11/23/15 9:38 5-H-2-C-35 5-H-2-C 0.5113 0.2554 29.600 23.84 11/20/15 8:35 11/23/15 9:39 5-H-2-D-35 5-H-2-D 0.5009 0.2502 29.349 23.64 11/20/15 8:37 11/23/15 9:40 5-H-4-A-35 5-H-4-A 0.4977 0.2486 29.366 23.60 11/20/15 8:39 11/23/15 9:42 5-H-4-B-35 5-H-4-B 0.5044 0.2519 29.708 23.89 11/20/15 8:40 11/23/15 9:44 5-H-4-C-35 5-H-4-C 0.4952 0.2473 29.810 23.92 11/20/15 8:42 11/23/15 9:47 5-H-4-D-35 5-H-4-D 0.4917 0.2456 30.120 24.16 11/20/15 8:43 11/23/15 9:49 5-H-5-A-35 5-H-5-A 0.5005 0.2500 29.720 23.57 11/20/15 8:45 11/23/15 9:51 5-H-5-B-35 5-H-5-B 0.4964 0.2479 30.618 24.33 11/20/15 8:47 11/23/15 9:53 5-H-5-C-35 5-H-5-C 0.5001 0.2498 30.001 23.80 11/20/15 8:48 11/23/15 9:55 5-H-5-D-35 5-H-5-D 0.5021 0.2508 30.237 23.95 11/20/15 8:50 11/23/15 9:57 6-L-1-A-35 6-L-1-A 0.5012 0.2503 29.106 21.58 11/20/15 11:48 11/23/15 9:58 6-L-1-A-35D 6-L-1-A 0.5051 0.2523 31.428 23.30 11/20/15 8:54 11/23/15 10:00 6-L-1-B-35 6-L-1-B 0.5025 0.2510 31.556 23.73 11/20/15 8:56 11/23/15 10:02 6-L-1-B-35D 6-L-1-B 0.5019 0.2507 31.551 23.72 11/20/15 8:56 11/23/15 10:04 6-L-1-C-35 6-L-1-C 0.4991 0.2493 31.343 23.55 11/20/15 9:09 11/23/15 10:06 6-L-1-C-35D 6-L-1-C 0.5054 0.2524 31.259 23.49 11/20/15 9:10 11/23/15 10:07 6-L-1-D-35 6-L-1-D 0.4991 0.2493 31.687 23.79 11/20/15 9:12 11/23/15 10:08 6-L-1-D-35D 6-L-1-D 0.5079 0.2537 31.616 23.74 11/20/15 9:14 11/23/15 10:11 6-L-1-E-35 6-L-1-E 0.4982 0.2488 31.799 23.81 11/20/15 9:15 11/23/15 10:12 6-L-1-E-35D 6-L-1-E 0.4979 0.2487 31.991 23.96 11/20/15 9:17 11/23/15 10:14 6-H-1-A-35 6-H-1-A 0.5073 0.2534 31.477 24.01 11/20/15 9:19 11/23/15 10:16 6-H-1-B-35 6-H-1-B 0.5045 0.2520 30.991 23.68 11/20/15 9:20 11/23/15 10:17 6-H-1-C-35 6-H-1-C 0.5050 0.2522 31.081 23.71 11/20/15 9:22 11/23/15 10:19 6-H-1-D-35 6-H-1-D 0.5000 0.2497 31.527 23.90 11/20/15 9:24 11/23/15 10:20 6-H-1-E-35 6-H-1-E 0.5021 0.2508 31.521 23.95 11/20/15 9:25 11/23/15 10:22 6-L-3-A-35 6-L-3-A 0.5028 0.2511 31.903 24.04 11/20/15 9:27 11/23/15 10:23 6-L-3-B-35 6-L-3-B 0.5021 0.2508 31.662 23.92 11/20/15 9:28 11/23/15 10:24 6-L-3-C-35 6-L-3-C 0.5113 0.2554 31.610 23.84 11/20/15 9:29 11/23/15 10:26 6-L-3-D-35 6-L-3-D 0.5061 0.2528 31.517 23.75 11/20/15 9:31 11/23/15 10:27 6-L-3-E-35 6-L-3-E 0.5002 0.2498 27.260 20.44 11/20/15 9:32 11/23/15 10:29 6-H-3-A-35 6-H-3-A 0.4954 0.2474 31.902 24.22 11/20/15 9:33 11/23/15 10:30 6-H-3-A-35D 6-H-3-A 0.5132 0.2563 31.982 24.28 11/20/15 9:35 11/23/15 10:31 6-H-3-B-35 6-H-3-B 0.5021 0.2508 31.978 24.31 11/20/15 9:36 11/23/15 10:33 6-H-3-B-35D 6-H-3-B 0.5000 0.2497 31.876 24.23 11/20/15 9:37 11/23/15 10:35 6-H-3-C-35 6-H-3-C 0.4994 0.2494 32.584 24.75 11/20/15 9:39 11/23/15 10:37 6-H-3-C-35D 6-H-3-C 0.5004 0.2499 32.410 24.62 11/20/15 9:40 11/23/15 10:39 6-H-3-D-35 6-H-3-D 0.5100 0.2547 32.593 24.73 11/20/15 9:41 11/23/15 10:40
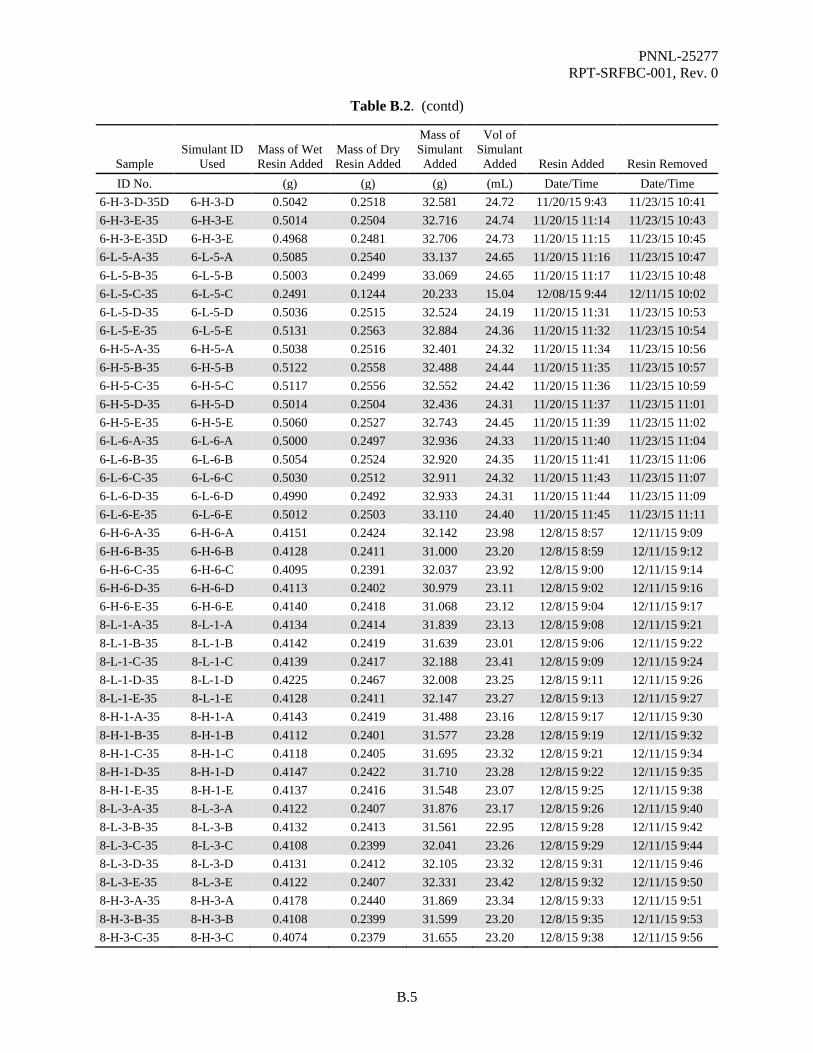
PNNL-25277 RPT-SRFBC-001, Rev. 0
B.5
Table B.2. (contd)
Sample Simulant ID
Used Mass of Wet Resin Added
Mass of Dry Resin Added
Mass of Simulant Added
Vol of Simulant Added Resin Added Resin Removed
ID No. (g) (g) (g) (mL) Date/Time Date/Time 6-H-3-D-35D 6-H-3-D 0.5042 0.2518 32.581 24.72 11/20/15 9:43 11/23/15 10:41 6-H-3-E-35 6-H-3-E 0.5014 0.2504 32.716 24.74 11/20/15 11:14 11/23/15 10:43 6-H-3-E-35D 6-H-3-E 0.4968 0.2481 32.706 24.73 11/20/15 11:15 11/23/15 10:45 6-L-5-A-35 6-L-5-A 0.5085 0.2540 33.137 24.65 11/20/15 11:16 11/23/15 10:47 6-L-5-B-35 6-L-5-B 0.5003 0.2499 33.069 24.65 11/20/15 11:17 11/23/15 10:48 6-L-5-C-35 6-L-5-C 0.2491 0.1244 20.233 15.04 12/08/15 9:44 12/11/15 10:02 6-L-5-D-35 6-L-5-D 0.5036 0.2515 32.524 24.19 11/20/15 11:31 11/23/15 10:53 6-L-5-E-35 6-L-5-E 0.5131 0.2563 32.884 24.36 11/20/15 11:32 11/23/15 10:54 6-H-5-A-35 6-H-5-A 0.5038 0.2516 32.401 24.32 11/20/15 11:34 11/23/15 10:56 6-H-5-B-35 6-H-5-B 0.5122 0.2558 32.488 24.44 11/20/15 11:35 11/23/15 10:57 6-H-5-C-35 6-H-5-C 0.5117 0.2556 32.552 24.42 11/20/15 11:36 11/23/15 10:59 6-H-5-D-35 6-H-5-D 0.5014 0.2504 32.436 24.31 11/20/15 11:37 11/23/15 11:01 6-H-5-E-35 6-H-5-E 0.5060 0.2527 32.743 24.45 11/20/15 11:39 11/23/15 11:02 6-L-6-A-35 6-L-6-A 0.5000 0.2497 32.936 24.33 11/20/15 11:40 11/23/15 11:04 6-L-6-B-35 6-L-6-B 0.5054 0.2524 32.920 24.35 11/20/15 11:41 11/23/15 11:06 6-L-6-C-35 6-L-6-C 0.5030 0.2512 32.911 24.32 11/20/15 11:43 11/23/15 11:07 6-L-6-D-35 6-L-6-D 0.4990 0.2492 32.933 24.31 11/20/15 11:44 11/23/15 11:09 6-L-6-E-35 6-L-6-E 0.5012 0.2503 33.110 24.40 11/20/15 11:45 11/23/15 11:11 6-H-6-A-35 6-H-6-A 0.4151 0.2424 32.142 23.98 12/8/15 8:57 12/11/15 9:09 6-H-6-B-35 6-H-6-B 0.4128 0.2411 31.000 23.20 12/8/15 8:59 12/11/15 9:12 6-H-6-C-35 6-H-6-C 0.4095 0.2391 32.037 23.92 12/8/15 9:00 12/11/15 9:14 6-H-6-D-35 6-H-6-D 0.4113 0.2402 30.979 23.11 12/8/15 9:02 12/11/15 9:16 6-H-6-E-35 6-H-6-E 0.4140 0.2418 31.068 23.12 12/8/15 9:04 12/11/15 9:17 8-L-1-A-35 8-L-1-A 0.4134 0.2414 31.839 23.13 12/8/15 9:08 12/11/15 9:21 8-L-1-B-35 8-L-1-B 0.4142 0.2419 31.639 23.01 12/8/15 9:06 12/11/15 9:22 8-L-1-C-35 8-L-1-C 0.4139 0.2417 32.188 23.41 12/8/15 9:09 12/11/15 9:24 8-L-1-D-35 8-L-1-D 0.4225 0.2467 32.008 23.25 12/8/15 9:11 12/11/15 9:26 8-L-1-E-35 8-L-1-E 0.4128 0.2411 32.147 23.27 12/8/15 9:13 12/11/15 9:27 8-H-1-A-35 8-H-1-A 0.4143 0.2419 31.488 23.16 12/8/15 9:17 12/11/15 9:30 8-H-1-B-35 8-H-1-B 0.4112 0.2401 31.577 23.28 12/8/15 9:19 12/11/15 9:32 8-H-1-C-35 8-H-1-C 0.4118 0.2405 31.695 23.32 12/8/15 9:21 12/11/15 9:34 8-H-1-D-35 8-H-1-D 0.4147 0.2422 31.710 23.28 12/8/15 9:22 12/11/15 9:35 8-H-1-E-35 8-H-1-E 0.4137 0.2416 31.548 23.07 12/8/15 9:25 12/11/15 9:38 8-L-3-A-35 8-L-3-A 0.4122 0.2407 31.876 23.17 12/8/15 9:26 12/11/15 9:40 8-L-3-B-35 8-L-3-B 0.4132 0.2413 31.561 22.95 12/8/15 9:28 12/11/15 9:42 8-L-3-C-35 8-L-3-C 0.4108 0.2399 32.041 23.26 12/8/15 9:29 12/11/15 9:44 8-L-3-D-35 8-L-3-D 0.4131 0.2412 32.105 23.32 12/8/15 9:31 12/11/15 9:46 8-L-3-E-35 8-L-3-E 0.4122 0.2407 32.331 23.42 12/8/15 9:32 12/11/15 9:50 8-H-3-A-35 8-H-3-A 0.4178 0.2440 31.869 23.34 12/8/15 9:33 12/11/15 9:51 8-H-3-B-35 8-H-3-B 0.4108 0.2399 31.599 23.20 12/8/15 9:35 12/11/15 9:53 8-H-3-C-35 8-H-3-C 0.4074 0.2379 31.655 23.20 12/8/15 9:38 12/11/15 9:56
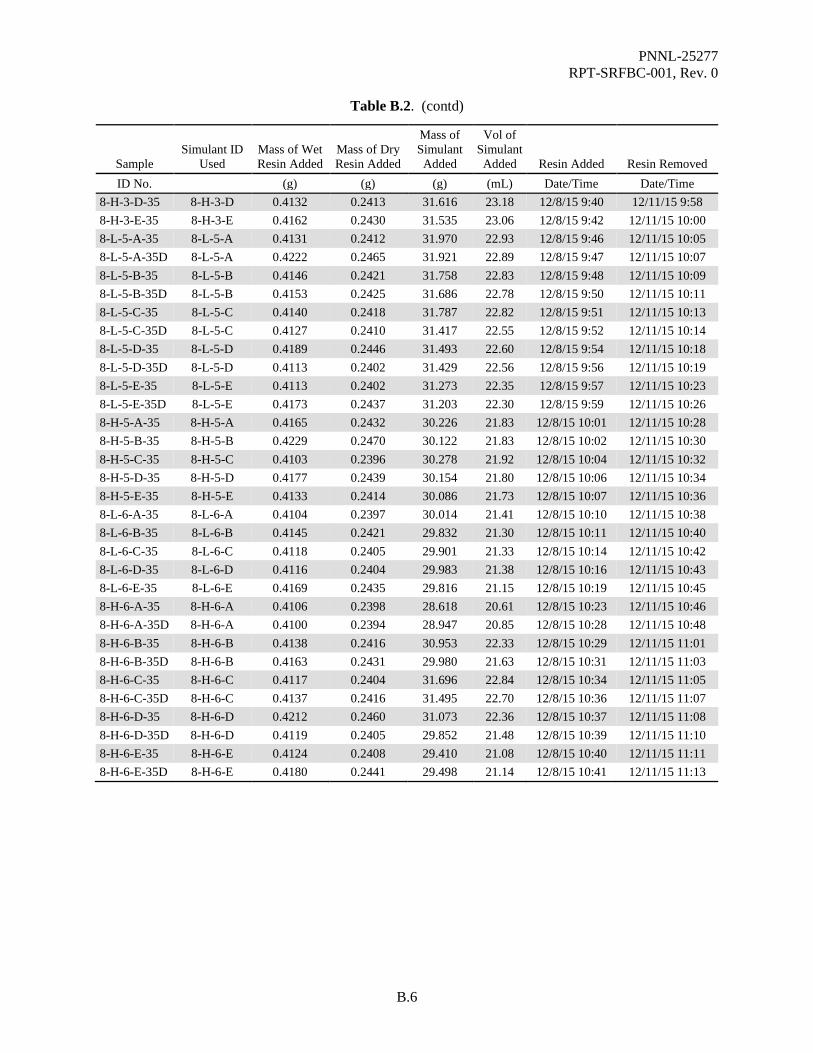
PNNL-25277 RPT-SRFBC-001, Rev. 0
B.6
Table B.2. (contd)
Sample Simulant ID
Used Mass of Wet Resin Added
Mass of Dry Resin Added
Mass of Simulant Added
Vol of Simulant Added Resin Added Resin Removed
ID No. (g) (g) (g) (mL) Date/Time Date/Time 8-H-3-D-35 8-H-3-D 0.4132 0.2413 31.616 23.18 12/8/15 9:40 12/11/15 9:58 8-H-3-E-35 8-H-3-E 0.4162 0.2430 31.535 23.06 12/8/15 9:42 12/11/15 10:00 8-L-5-A-35 8-L-5-A 0.4131 0.2412 31.970 22.93 12/8/15 9:46 12/11/15 10:05 8-L-5-A-35D 8-L-5-A 0.4222 0.2465 31.921 22.89 12/8/15 9:47 12/11/15 10:07 8-L-5-B-35 8-L-5-B 0.4146 0.2421 31.758 22.83 12/8/15 9:48 12/11/15 10:09 8-L-5-B-35D 8-L-5-B 0.4153 0.2425 31.686 22.78 12/8/15 9:50 12/11/15 10:11 8-L-5-C-35 8-L-5-C 0.4140 0.2418 31.787 22.82 12/8/15 9:51 12/11/15 10:13 8-L-5-C-35D 8-L-5-C 0.4127 0.2410 31.417 22.55 12/8/15 9:52 12/11/15 10:14 8-L-5-D-35 8-L-5-D 0.4189 0.2446 31.493 22.60 12/8/15 9:54 12/11/15 10:18 8-L-5-D-35D 8-L-5-D 0.4113 0.2402 31.429 22.56 12/8/15 9:56 12/11/15 10:19 8-L-5-E-35 8-L-5-E 0.4113 0.2402 31.273 22.35 12/8/15 9:57 12/11/15 10:23 8-L-5-E-35D 8-L-5-E 0.4173 0.2437 31.203 22.30 12/8/15 9:59 12/11/15 10:26 8-H-5-A-35 8-H-5-A 0.4165 0.2432 30.226 21.83 12/8/15 10:01 12/11/15 10:28 8-H-5-B-35 8-H-5-B 0.4229 0.2470 30.122 21.83 12/8/15 10:02 12/11/15 10:30 8-H-5-C-35 8-H-5-C 0.4103 0.2396 30.278 21.92 12/8/15 10:04 12/11/15 10:32 8-H-5-D-35 8-H-5-D 0.4177 0.2439 30.154 21.80 12/8/15 10:06 12/11/15 10:34 8-H-5-E-35 8-H-5-E 0.4133 0.2414 30.086 21.73 12/8/15 10:07 12/11/15 10:36 8-L-6-A-35 8-L-6-A 0.4104 0.2397 30.014 21.41 12/8/15 10:10 12/11/15 10:38 8-L-6-B-35 8-L-6-B 0.4145 0.2421 29.832 21.30 12/8/15 10:11 12/11/15 10:40 8-L-6-C-35 8-L-6-C 0.4118 0.2405 29.901 21.33 12/8/15 10:14 12/11/15 10:42 8-L-6-D-35 8-L-6-D 0.4116 0.2404 29.983 21.38 12/8/15 10:16 12/11/15 10:43 8-L-6-E-35 8-L-6-E 0.4169 0.2435 29.816 21.15 12/8/15 10:19 12/11/15 10:45 8-H-6-A-35 8-H-6-A 0.4106 0.2398 28.618 20.61 12/8/15 10:23 12/11/15 10:46 8-H-6-A-35D 8-H-6-A 0.4100 0.2394 28.947 20.85 12/8/15 10:28 12/11/15 10:48 8-H-6-B-35 8-H-6-B 0.4138 0.2416 30.953 22.33 12/8/15 10:29 12/11/15 11:01 8-H-6-B-35D 8-H-6-B 0.4163 0.2431 29.980 21.63 12/8/15 10:31 12/11/15 11:03 8-H-6-C-35 8-H-6-C 0.4117 0.2404 31.696 22.84 12/8/15 10:34 12/11/15 11:05 8-H-6-C-35D 8-H-6-C 0.4137 0.2416 31.495 22.70 12/8/15 10:36 12/11/15 11:07 8-H-6-D-35 8-H-6-D 0.4212 0.2460 31.073 22.36 12/8/15 10:37 12/11/15 11:08 8-H-6-D-35D 8-H-6-D 0.4119 0.2405 29.852 21.48 12/8/15 10:39 12/11/15 11:10 8-H-6-E-35 8-H-6-E 0.4124 0.2408 29.410 21.08 12/8/15 10:40 12/11/15 11:11 8-H-6-E-35D 8-H-6-E 0.4180 0.2441 29.498 21.14 12/8/15 10:41 12/11/15 11:13
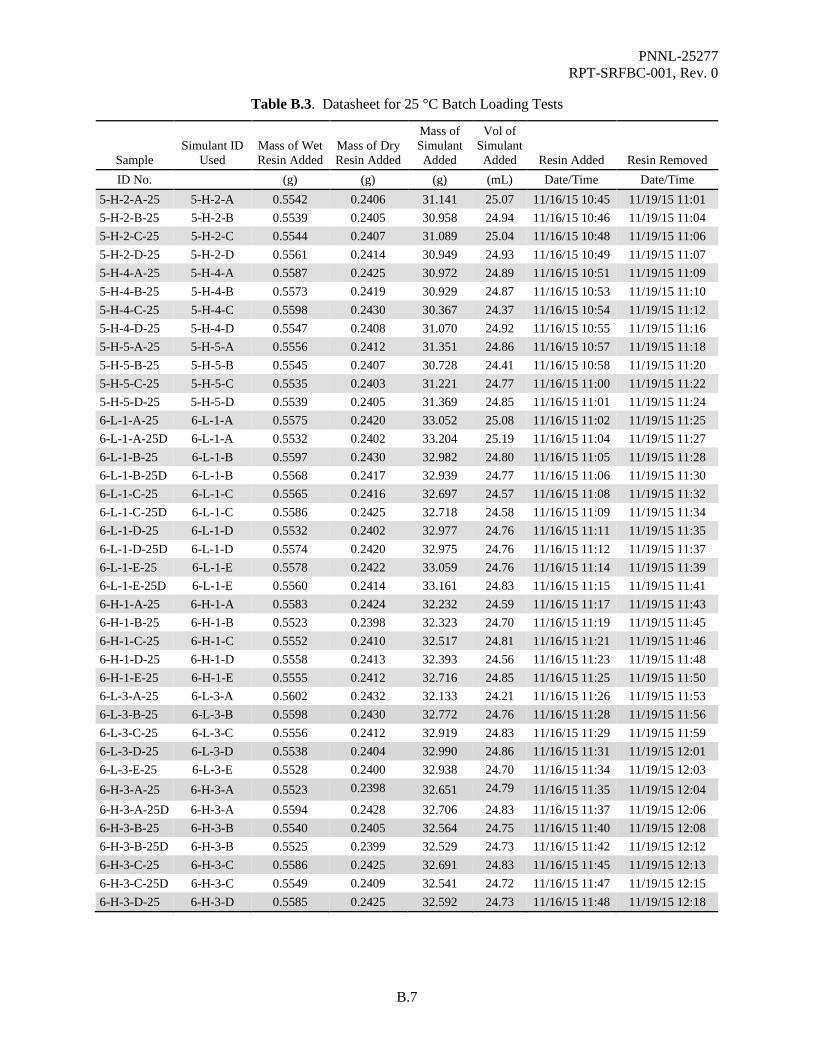
PNNL-25277 RPT-SRFBC-001, Rev. 0
B.7
Table B.3. Datasheet for 25 °C Batch Loading Tests
Sample Simulant ID
Used Mass of Wet Resin Added
Mass of Dry Resin Added
Mass of Simulant Added
Vol of Simulant Added Resin Added Resin Removed
ID No. (g) (g) (g) (mL) Date/Time Date/Time 5-H-2-A-25 5-H-2-A 0.5542 0.2406 31.141 25.07 11/16/15 10:45 11/19/15 11:01 5-H-2-B-25 5-H-2-B 0.5539 0.2405 30.958 24.94 11/16/15 10:46 11/19/15 11:04 5-H-2-C-25 5-H-2-C 0.5544 0.2407 31.089 25.04 11/16/15 10:48 11/19/15 11:06 5-H-2-D-25 5-H-2-D 0.5561 0.2414 30.949 24.93 11/16/15 10:49 11/19/15 11:07 5-H-4-A-25 5-H-4-A 0.5587 0.2425 30.972 24.89 11/16/15 10:51 11/19/15 11:09 5-H-4-B-25 5-H-4-B 0.5573 0.2419 30.929 24.87 11/16/15 10:53 11/19/15 11:10 5-H-4-C-25 5-H-4-C 0.5598 0.2430 30.367 24.37 11/16/15 10:54 11/19/15 11:12 5-H-4-D-25 5-H-4-D 0.5547 0.2408 31.070 24.92 11/16/15 10:55 11/19/15 11:16 5-H-5-A-25 5-H-5-A 0.5556 0.2412 31.351 24.86 11/16/15 10:57 11/19/15 11:18 5-H-5-B-25 5-H-5-B 0.5545 0.2407 30.728 24.41 11/16/15 10:58 11/19/15 11:20 5-H-5-C-25 5-H-5-C 0.5535 0.2403 31.221 24.77 11/16/15 11:00 11/19/15 11:22 5-H-5-D-25 5-H-5-D 0.5539 0.2405 31.369 24.85 11/16/15 11:01 11/19/15 11:24 6-L-1-A-25 6-L-1-A 0.5575 0.2420 33.052 25.08 11/16/15 11:02 11/19/15 11:25 6-L-1-A-25D 6-L-1-A 0.5532 0.2402 33.204 25.19 11/16/15 11:04 11/19/15 11:27 6-L-1-B-25 6-L-1-B 0.5597 0.2430 32.982 24.80 11/16/15 11:05 11/19/15 11:28 6-L-1-B-25D 6-L-1-B 0.5568 0.2417 32.939 24.77 11/16/15 11:06 11/19/15 11:30 6-L-1-C-25 6-L-1-C 0.5565 0.2416 32.697 24.57 11/16/15 11:08 11/19/15 11:32 6-L-1-C-25D 6-L-1-C 0.5586 0.2425 32.718 24.58 11/16/15 11:09 11/19/15 11:34 6-L-1-D-25 6-L-1-D 0.5532 0.2402 32.977 24.76 11/16/15 11:11 11/19/15 11:35 6-L-1-D-25D 6-L-1-D 0.5574 0.2420 32.975 24.76 11/16/15 11:12 11/19/15 11:37 6-L-1-E-25 6-L-1-E 0.5578 0.2422 33.059 24.76 11/16/15 11:14 11/19/15 11:39 6-L-1-E-25D 6-L-1-E 0.5560 0.2414 33.161 24.83 11/16/15 11:15 11/19/15 11:41 6-H-1-A-25 6-H-1-A 0.5583 0.2424 32.232 24.59 11/16/15 11:17 11/19/15 11:43 6-H-1-B-25 6-H-1-B 0.5523 0.2398 32.323 24.70 11/16/15 11:19 11/19/15 11:45 6-H-1-C-25 6-H-1-C 0.5552 0.2410 32.517 24.81 11/16/15 11:21 11/19/15 11:46 6-H-1-D-25 6-H-1-D 0.5558 0.2413 32.393 24.56 11/16/15 11:23 11/19/15 11:48 6-H-1-E-25 6-H-1-E 0.5555 0.2412 32.716 24.85 11/16/15 11:25 11/19/15 11:50 6-L-3-A-25 6-L-3-A 0.5602 0.2432 32.133 24.21 11/16/15 11:26 11/19/15 11:53 6-L-3-B-25 6-L-3-B 0.5598 0.2430 32.772 24.76 11/16/15 11:28 11/19/15 11:56 6-L-3-C-25 6-L-3-C 0.5556 0.2412 32.919 24.83 11/16/15 11:29 11/19/15 11:59 6-L-3-D-25 6-L-3-D 0.5538 0.2404 32.990 24.86 11/16/15 11:31 11/19/15 12:01 6-L-3-E-25 6-L-3-E 0.5528 0.2400 32.938 24.70 11/16/15 11:34 11/19/15 12:03 6-H-3-A-25 6-H-3-A 0.5523 0.2398 32.651 24.79 11/16/15 11:35 11/19/15 12:04 6-H-3-A-25D 6-H-3-A 0.5594 0.2428 32.706 24.83 11/16/15 11:37 11/19/15 12:06 6-H-3-B-25 6-H-3-B 0.5540 0.2405 32.564 24.75 11/16/15 11:40 11/19/15 12:08 6-H-3-B-25D 6-H-3-B 0.5525 0.2399 32.529 24.73 11/16/15 11:42 11/19/15 12:12 6-H-3-C-25 6-H-3-C 0.5586 0.2425 32.691 24.83 11/16/15 11:45 11/19/15 12:13 6-H-3-C-25D 6-H-3-C 0.5549 0.2409 32.541 24.72 11/16/15 11:47 11/19/15 12:15 6-H-3-D-25 6-H-3-D 0.5585 0.2425 32.592 24.73 11/16/15 11:48 11/19/15 12:18
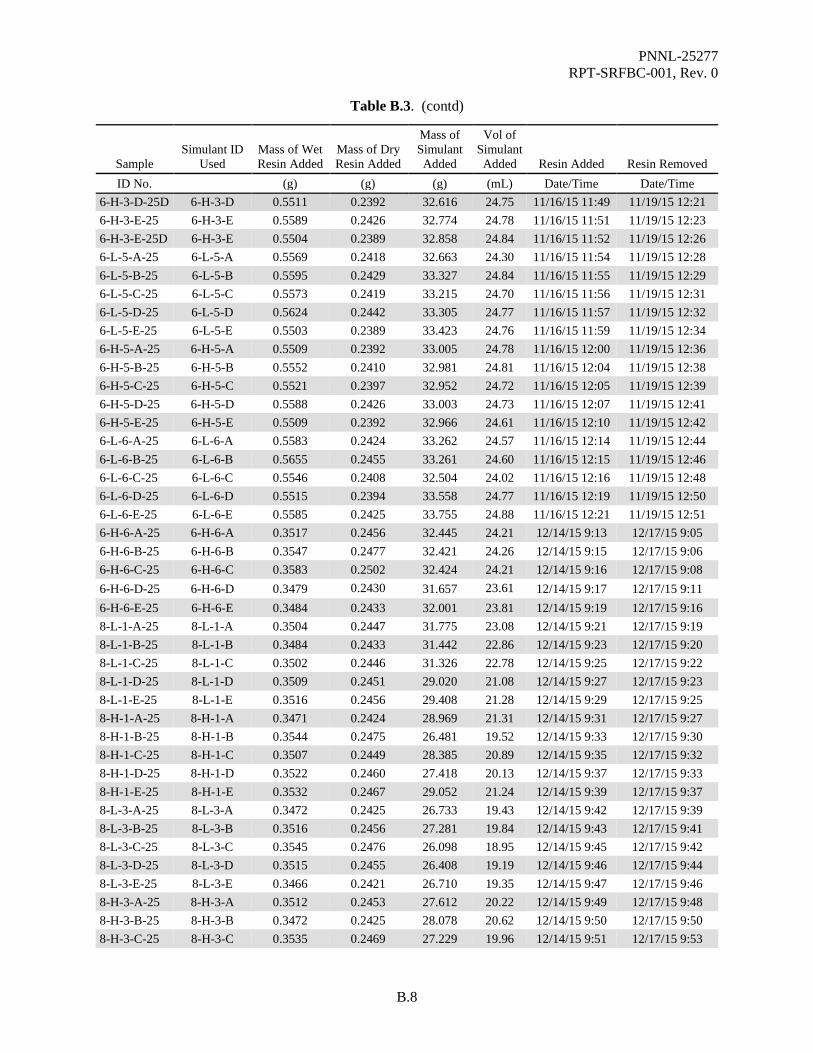
PNNL-25277 RPT-SRFBC-001, Rev. 0
B.8
Table B.3. (contd)
Sample Simulant ID
Used Mass of Wet Resin Added
Mass of Dry Resin Added
Mass of Simulant Added
Vol of Simulant Added Resin Added Resin Removed
ID No. (g) (g) (g) (mL) Date/Time Date/Time 6-H-3-D-25D 6-H-3-D 0.5511 0.2392 32.616 24.75 11/16/15 11:49 11/19/15 12:21 6-H-3-E-25 6-H-3-E 0.5589 0.2426 32.774 24.78 11/16/15 11:51 11/19/15 12:23 6-H-3-E-25D 6-H-3-E 0.5504 0.2389 32.858 24.84 11/16/15 11:52 11/19/15 12:26 6-L-5-A-25 6-L-5-A 0.5569 0.2418 32.663 24.30 11/16/15 11:54 11/19/15 12:28 6-L-5-B-25 6-L-5-B 0.5595 0.2429 33.327 24.84 11/16/15 11:55 11/19/15 12:29 6-L-5-C-25 6-L-5-C 0.5573 0.2419 33.215 24.70 11/16/15 11:56 11/19/15 12:31 6-L-5-D-25 6-L-5-D 0.5624 0.2442 33.305 24.77 11/16/15 11:57 11/19/15 12:32 6-L-5-E-25 6-L-5-E 0.5503 0.2389 33.423 24.76 11/16/15 11:59 11/19/15 12:34 6-H-5-A-25 6-H-5-A 0.5509 0.2392 33.005 24.78 11/16/15 12:00 11/19/15 12:36 6-H-5-B-25 6-H-5-B 0.5552 0.2410 32.981 24.81 11/16/15 12:04 11/19/15 12:38 6-H-5-C-25 6-H-5-C 0.5521 0.2397 32.952 24.72 11/16/15 12:05 11/19/15 12:39 6-H-5-D-25 6-H-5-D 0.5588 0.2426 33.003 24.73 11/16/15 12:07 11/19/15 12:41 6-H-5-E-25 6-H-5-E 0.5509 0.2392 32.966 24.61 11/16/15 12:10 11/19/15 12:42 6-L-6-A-25 6-L-6-A 0.5583 0.2424 33.262 24.57 11/16/15 12:14 11/19/15 12:44 6-L-6-B-25 6-L-6-B 0.5655 0.2455 33.261 24.60 11/16/15 12:15 11/19/15 12:46 6-L-6-C-25 6-L-6-C 0.5546 0.2408 32.504 24.02 11/16/15 12:16 11/19/15 12:48 6-L-6-D-25 6-L-6-D 0.5515 0.2394 33.558 24.77 11/16/15 12:19 11/19/15 12:50 6-L-6-E-25 6-L-6-E 0.5585 0.2425 33.755 24.88 11/16/15 12:21 11/19/15 12:51 6-H-6-A-25 6-H-6-A 0.3517 0.2456 32.445 24.21 12/14/15 9:13 12/17/15 9:05 6-H-6-B-25 6-H-6-B 0.3547 0.2477 32.421 24.26 12/14/15 9:15 12/17/15 9:06 6-H-6-C-25 6-H-6-C 0.3583 0.2502 32.424 24.21 12/14/15 9:16 12/17/15 9:08 6-H-6-D-25 6-H-6-D 0.3479 0.2430 31.657 23.61 12/14/15 9:17 12/17/15 9:11 6-H-6-E-25 6-H-6-E 0.3484 0.2433 32.001 23.81 12/14/15 9:19 12/17/15 9:16 8-L-1-A-25 8-L-1-A 0.3504 0.2447 31.775 23.08 12/14/15 9:21 12/17/15 9:19 8-L-1-B-25 8-L-1-B 0.3484 0.2433 31.442 22.86 12/14/15 9:23 12/17/15 9:20 8-L-1-C-25 8-L-1-C 0.3502 0.2446 31.326 22.78 12/14/15 9:25 12/17/15 9:22 8-L-1-D-25 8-L-1-D 0.3509 0.2451 29.020 21.08 12/14/15 9:27 12/17/15 9:23 8-L-1-E-25 8-L-1-E 0.3516 0.2456 29.408 21.28 12/14/15 9:29 12/17/15 9:25 8-H-1-A-25 8-H-1-A 0.3471 0.2424 28.969 21.31 12/14/15 9:31 12/17/15 9:27 8-H-1-B-25 8-H-1-B 0.3544 0.2475 26.481 19.52 12/14/15 9:33 12/17/15 9:30 8-H-1-C-25 8-H-1-C 0.3507 0.2449 28.385 20.89 12/14/15 9:35 12/17/15 9:32 8-H-1-D-25 8-H-1-D 0.3522 0.2460 27.418 20.13 12/14/15 9:37 12/17/15 9:33 8-H-1-E-25 8-H-1-E 0.3532 0.2467 29.052 21.24 12/14/15 9:39 12/17/15 9:37 8-L-3-A-25 8-L-3-A 0.3472 0.2425 26.733 19.43 12/14/15 9:42 12/17/15 9:39 8-L-3-B-25 8-L-3-B 0.3516 0.2456 27.281 19.84 12/14/15 9:43 12/17/15 9:41 8-L-3-C-25 8-L-3-C 0.3545 0.2476 26.098 18.95 12/14/15 9:45 12/17/15 9:42 8-L-3-D-25 8-L-3-D 0.3515 0.2455 26.408 19.19 12/14/15 9:46 12/17/15 9:44 8-L-3-E-25 8-L-3-E 0.3466 0.2421 26.710 19.35 12/14/15 9:47 12/17/15 9:46 8-H-3-A-25 8-H-3-A 0.3512 0.2453 27.612 20.22 12/14/15 9:49 12/17/15 9:48 8-H-3-B-25 8-H-3-B 0.3472 0.2425 28.078 20.62 12/14/15 9:50 12/17/15 9:50 8-H-3-C-25 8-H-3-C 0.3535 0.2469 27.229 19.96 12/14/15 9:51 12/17/15 9:53

PNNL-25277 RPT-SRFBC-001, Rev. 0
B.9
Table B.3. (contd)
Sample Simulant ID
Used Mass of Wet Resin Added
Mass of Dry Resin Added
Mass of Simulant Added
Vol of Simulant Added Resin Added Resin Removed
ID No. (g) (g) (g) (mL) Date/Time Date/Time 8-H-3-D-25 8-H-3-D 0.3499 0.2444 27.359 20.06 12/14/15 9:53 12/17/15 9:56 8-H-3-E-25 8-H-3-E 0.3488 0.2436 26.813 19.61 12/14/15 9:54 12/17/15 9:58 8-L-5-A-25 8-L-5-A 0.3527 0.2463 27.129 19.45 12/14/15 9:55 12/17/15 10:02 8-L-5-A-25D 8-L-5-A 0.3531 0.2466 27.587 19.78 12/14/15 9:57 12/17/15 10:03 8-L-5-B-25 8-L-5-B 0.3491 0.2438 26.001 18.70 12/14/15 9:58 12/17/15 10:05 8-L-5-B-25D 8-L-5-B 0.3506 0.2449 27.324 19.65 12/14/15 10:00 12/17/15 10:07 8-L-5-C-25 8-L-5-C 0.3497 0.2442 27.136 19.48 12/14/15 10:01 12/17/15 10:09 8-L-5-C-25D 8-L-5-C 0.3486 0.2435 29.157 20.93 12/14/15 10:02 12/17/15 10:11 8-L-5-D-25 8-L-5-D 0.3479 0.2430 28.038 20.12 12/14/15 10:04 12/17/15 10:13 8-L-5-D-25D 8-L-5-D 0.3531 0.2466 31.609 22.69 12/14/15 10:05 12/17/15 10:15 8-L-5-E-25 8-L-5-E 0.3521 0.2459 28.458 20.34 12/14/15 10:07 12/17/15 10:18 8-L-5-E-25D 8-L-5-E 0.3527 0.2463 28.206 20.16 12/14/15 10:08 12/17/15 10:20 8-H-5-A-25 8-H-5-A 0.3427 0.2393 28.510 20.59 12/14/15 10:11 12/17/15 10:22 8-H-5-B-25 8-H-5-B 0.3469 0.2423 28.900 20.94 12/14/15 10:13 12/17/15 10:23 8-H-5-C-25 8-H-5-C 0.3489 0.2437 28.559 20.67 12/14/15 10:15 12/17/15 10:25 8-H-5-D-25 8-H-5-D 0.3506 0.2449 30.472 22.03 12/14/15 10:18 12/17/15 10:27 8-H-5-E-25 8-H-5-E 0.3491 0.2438 31.937 23.06 12/14/15 10:20 12/17/15 10:31 8-L-6-A-25 8-L-6-A 0.3482 0.2432 31.646 22.57 12/14/15 10:23 12/17/15 10:33 8-L-6-B-25 8-L-6-B 0.3498 0.2443 31.686 22.62 12/14/15 10:25 12/17/15 10:35 8-L-6-C-25 8-L-6-C 0.3486 0.2435 31.593 22.54 12/14/15 10:26 12/17/15 10:36 8-L-6-D-25 8-L-6-D 0.3521 0.2459 31.793 22.67 12/14/15 10:28 12/17/15 10:38 8-L-6-E-25 8-L-6-E 0.3487 0.2435 32.125 22.79 12/14/15 10:29 12/17/15 10:40 8-H-6-A-25 8-H-6-A 0.3500 0.2444 31.438 22.64 12/14/15 10:31 12/17/15 10:42 8-H-6-A-25D 8-H-6-A 0.3492 0.2439 31.486 22.68 12/14/15 10:32 12/17/15 10:44 8-H-6-B-25 8-H-6-B 0.3540 0.2472 31.745 22.90 12/14/15 10:33 12/17/15 10:45 8-H-6-B-25D 8-H-6-B 0.3500 0.2444 31.778 22.92 12/14/15 10:38 12/17/15 10:47 8-H-6-C-25 8-H-6-C 0.3558 0.2485 31.725 22.86 12/14/15 10:39 12/17/15 10:50 8-H-6-C-25D 8-H-6-C 0.3508 0.2450 31.621 22.79 12/14/15 10:41 12/17/15 10:52 8-H-6-D-25 8-H-6-D 0.3444 0.2405 31.252 22.49 12/14/15 10:42 12/17/15 10:54 8-H-6-D-25D 8-H-6-D 0.3563 0.2488 31.373 22.58 12/14/15 10:43 12/17/15 10:56 8-H-6-E-25 8-H-6-E 0.3534 0.2468 31.135 22.32 12/14/15 10:45 12/17/15 10:58 8-H-6-E-25D 8-H-6-E 0.3431 0.2396 31.167 22.34 12/14/15 10:47 12/17/15 11:00
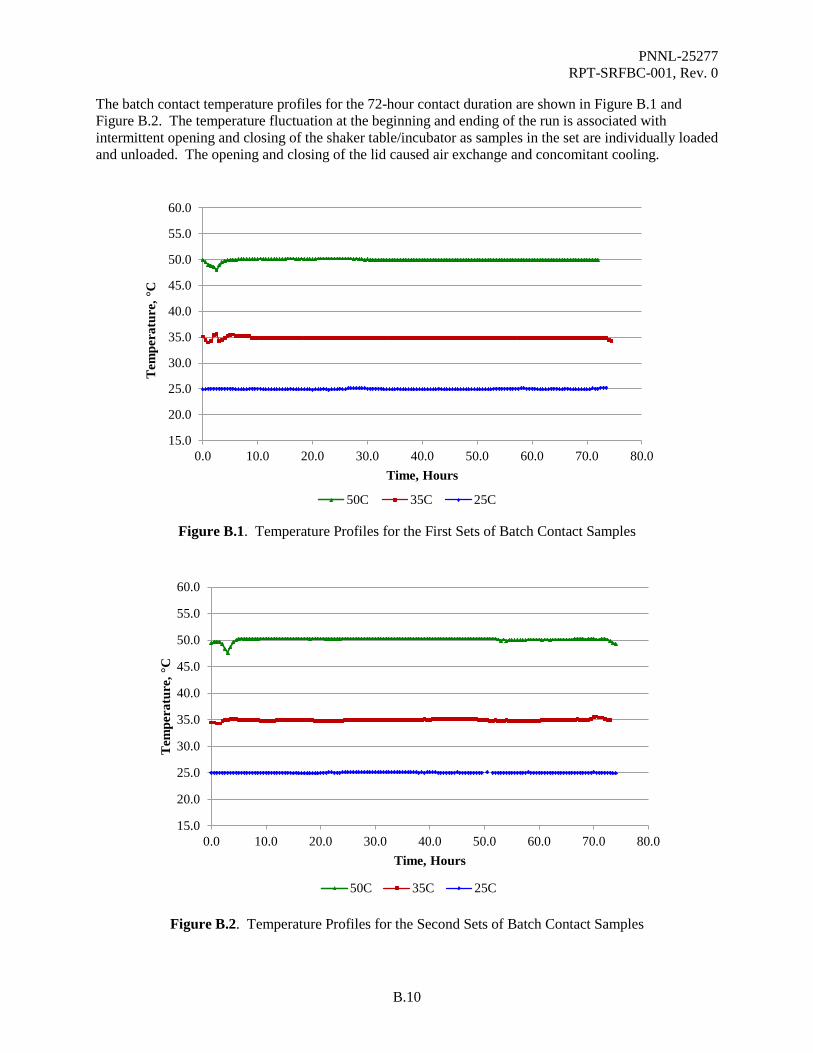
PNNL-25277 RPT-SRFBC-001, Rev. 0
B.10
The batch contact temperature profiles for the 72-hour contact duration are shown in Figure B.1 and Figure B.2. The temperature fluctuation at the beginning and ending of the run is associated with intermittent opening and closing of the shaker table/incubator as samples in the set are individually loaded and unloaded. The opening and closing of the lid caused air exchange and concomitant cooling.
Figure B.1. Temperature Profiles for the First Sets of Batch Contact Samples
Figure B.2. Temperature Profiles for the Second Sets of Batch Contact Samples
15.0
20.0
25.0
30.0
35.0
40.0
45.0
50.0
55.0
60.0
0.0 10.0 20.0 30.0 40.0 50.0 60.0 70.0 80.0
Tem
pera
ture
, °C
Time, Hours
50C 35C 25C
15.0
20.0
25.0
30.0
35.0
40.0
45.0
50.0
55.0
60.0
0.0 10.0 20.0 30.0 40.0 50.0 60.0 70.0 80.0
Tem
pera
ture
, °C
Time, Hours
50C 35C 25C

PNNL-25277 RPT-SRFBC-001, Rev. 0
Appendix C –
Analytical Data


PNNL-25277 RPT-SRFBC-001, Rev. 0
C.1
Appendix C
Analytical Data
Table C.1. Initial Simulant Analytical Data
Sample ID Cs
(mg/L) K
(mg/L) Na
(mg/L) OH- (M) Sample ID
Cs (mg/L)
K (mg/L)
Na (mg/L)
OH- (M)
5-H-2-A 0.670 234 113500 1.010 6-L-5-E 6620 14800 162000 0.099 5-H-2-B 6.46 220 111000 0.990 6-L-6-A 0.629 20000 152000 0.098 5-H-2-C 64.9 221 112000 0.995 6-L-6-B 6.36 19600 149000 0.101 5-H-2-D 659 228 113000 1.000 6-L-6-C 64.6 19500 149000 0.099 5-H-4-A 0.657 1880 113000 1.010 6-L-6-D 639 20000 151000 0.098 5-H-4-B 6.50 1870 112000 1.020 6-L-6-E 6470 19500 151000 0.098 5-H-4-C 62.4 1860 111000 1.010 8-H-1-A 0.689 23.1 181000 1.020 5-H-4-D 646 1890 112000 1.000 8-H-1-B 6.45 21.9 182000 0.965 5-H-5-A 0.660 13300 113000 1.010 8-H-1-C 64.3 25.3 184000 0.970 5-H-5-B 6.52 13100 112000 1.010 8-H-1-D 658 24.1 184000 0.950 5-H-5-C 64.6 13300 113000 1.000 8-H-1-E 6500 24.6 183000 0.965 5-H-5-D 658 13800 117000 1.010 8-H-3-A 0.663 1400 188000 1.020 6-H-1-A 0.656 22.8 145000 0.995 8-H-3-B 6.36 1360 182000 1.000 6-H-1-B 6.53 22.7 146000 0.990 8-H-3-C 63.3 1380 186000 1.010 6-H-1-C 65.0 24.3 145000 0.990 8-H-3-D 670 1360 182500 1.010 6-H-1-D 662 22.8 147000 0.995 8-H-3-E 6550 1380 184000 1.010 6-H-1-E 6440 22.9 143000 0.995 8-H-5-A 0.944 13600 184000 1.020 6-H-3-A 0.700 1360 146000 1.010 8-H-5-B 6.70 13500 184000 1.020 6-H-3-B 6.36 1310 144000 1.010 8-H-5-C 64.3 13300 183000 1.030 6-H-3-C 64.4 1350 146000 1.000 8-H-5-D 668 13400 182000 1.010 6-H-3-D 643 1345 147000 1.020 8-H-5-E 6450 13400 182000 1.000 6-H-3-E 6300 1270 139000 0.995 8-H-6-A 0.628 19100 181000 1.000 6-H-5-A 0.628 12900 143000 1.010 8-H-6-B 6.28 19200 180000 1.000 6-H-5-B 6.55 12700 142000 0.995 8-H-6-C 64.5 19200 181000 1.000 6-H-5-C 64.0 13200 145000 0.995 8-H-6-D 678 19400 183000 1.000 6-H-5-D 644 12900 143000 1.020 8-H-6-E 6480 19200 181000 1.000 6-H-5-E 6330 13300 147000 1.030 8-L-1-A 0.659 12.8 181000 0.098 6-H-6-A 0.637 18600 142000 1.010 8-L-1-B 6.48 11.8 178000 0.097 6-H-6-B 6.37 18100 139000 0.995 8-L-1-C 65.1 13.1 181000 0.097 6-H-6-C 62.3 18200 141000 0.995 8-L-1-D 578 12.8 182000 0.098 6-H-6-D 639 18600 143000 0.995 8-L-1-E 6350 12.1 180000 0.097 6-H-6-E 6240 18600 142000 1.010 8-L-3-A 0.707 1320 180000 0.098 6-L-1-A 0.687 12.1 144000 0.099 8-L-3-B 6.63 1320 177000 0.095 6-L-1-B 6.56 12.4 143000 0.098 8-L-3-C 64.8 1350 183000 0.096 6-L-1-C 65.5 11.4 143000 0.099 8-L-3-D 665 1325 178500 0.100 6-L-1-D 643 11.9 144000 0.102 8-L-3-E 6500 1300 178000 0.096 6-L-1-E 6280 12.1 152000 0.102 8-L-5-A 0.672 12700 171000 0.097 6-L-3-A 0.922 1280 144000 0.100 8-L-5-B 5.97 13500 180000 0.095 6-L-3-B 6.44 1270 143000 0.100 8-L-5-C 64.2 13200 178000 0.096

PNNL-25277 RPT-SRFBC-001, Rev. 0
C.2
Table C.1. (contd)
Sample ID Cs
(mg/L) K
(mg/L) Na
(mg/L) OH- (M) Sample ID
Cs (mg/L)
K (mg/L)
Na (mg/L)
OH- (M)
6-L-3-C 62.9 1280 142000 0.099 8-L-5-D 673 13600 183000 0.099 6-L-3-D 681 1370 149500 0.101 8-L-5-E 6520 13500 182000 0.096 6-L-3-E 6660 1380 152000 0.100 8-L-6-A 0.697 18500 173000 0.097 6-L-5-A 0.653 13600 150000 0.098 8-L-6-B 6.30 18800 180000 0.096 6-L-5-B 6.83 13400 148000 0.097 8-L-6-C 63.1 19700 184000 0.095 6-L-5-C 64.9 13700 149000 0.099 8-L-6-D 662 19400 184000 0.098 6-L-5-D 662 13500 148000 0.098 8-L-6-E 6410 19500 183000 0.096
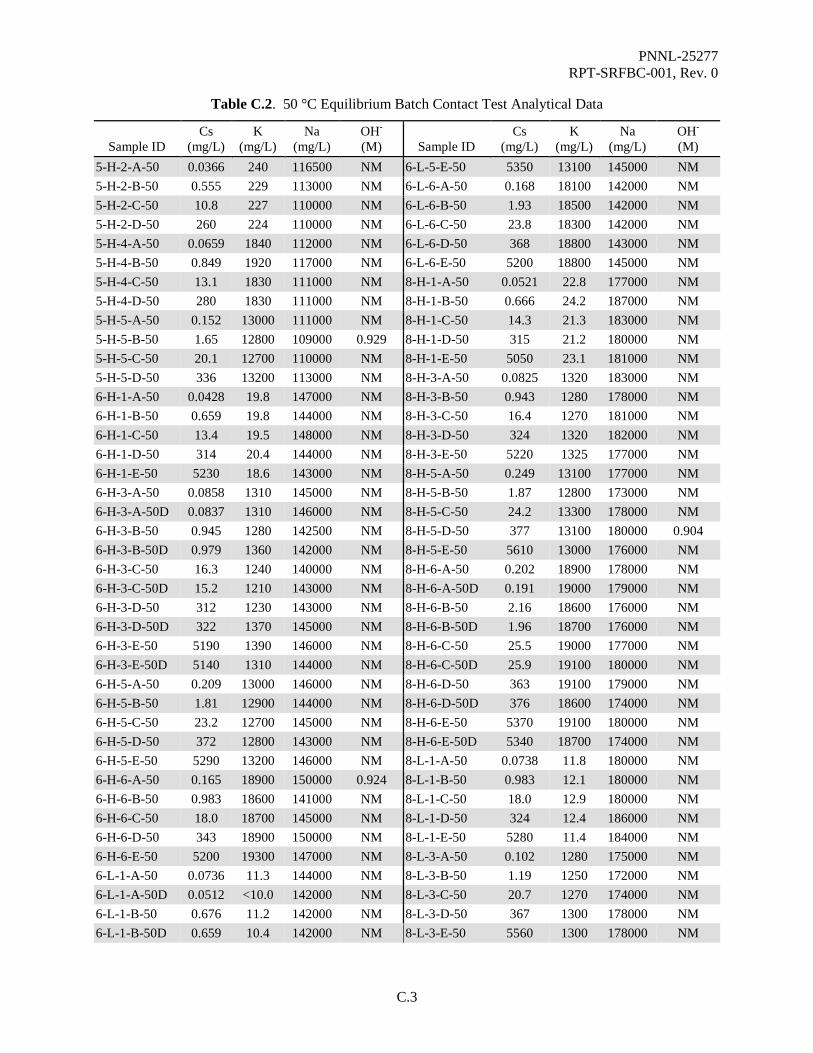
PNNL-25277 RPT-SRFBC-001, Rev. 0
C.3
Table C.2. 50 °C Equilibrium Batch Contact Test Analytical Data
Sample ID Cs
(mg/L) K
(mg/L) Na
(mg/L) OH- (M) Sample ID
Cs (mg/L)
K (mg/L)
Na (mg/L)
OH- (M)
5-H-2-A-50 0.0366 240 116500 NM 6-L-5-E-50 5350 13100 145000 NM 5-H-2-B-50 0.555 229 113000 NM 6-L-6-A-50 0.168 18100 142000 NM 5-H-2-C-50 10.8 227 110000 NM 6-L-6-B-50 1.93 18500 142000 NM 5-H-2-D-50 260 224 110000 NM 6-L-6-C-50 23.8 18300 142000 NM 5-H-4-A-50 0.0659 1840 112000 NM 6-L-6-D-50 368 18800 143000 NM 5-H-4-B-50 0.849 1920 117000 NM 6-L-6-E-50 5200 18800 145000 NM 5-H-4-C-50 13.1 1830 111000 NM 8-H-1-A-50 0.0521 22.8 177000 NM 5-H-4-D-50 280 1830 111000 NM 8-H-1-B-50 0.666 24.2 187000 NM 5-H-5-A-50 0.152 13000 111000 NM 8-H-1-C-50 14.3 21.3 183000 NM 5-H-5-B-50 1.65 12800 109000 0.929 8-H-1-D-50 315 21.2 180000 NM 5-H-5-C-50 20.1 12700 110000 NM 8-H-1-E-50 5050 23.1 181000 NM 5-H-5-D-50 336 13200 113000 NM 8-H-3-A-50 0.0825 1320 183000 NM 6-H-1-A-50 0.0428 19.8 147000 NM 8-H-3-B-50 0.943 1280 178000 NM 6-H-1-B-50 0.659 19.8 144000 NM 8-H-3-C-50 16.4 1270 181000 NM 6-H-1-C-50 13.4 19.5 148000 NM 8-H-3-D-50 324 1320 182000 NM 6-H-1-D-50 314 20.4 144000 NM 8-H-3-E-50 5220 1325 177000 NM 6-H-1-E-50 5230 18.6 143000 NM 8-H-5-A-50 0.249 13100 177000 NM 6-H-3-A-50 0.0858 1310 145000 NM 8-H-5-B-50 1.87 12800 173000 NM 6-H-3-A-50D 0.0837 1310 146000 NM 8-H-5-C-50 24.2 13300 178000 NM 6-H-3-B-50 0.945 1280 142500 NM 8-H-5-D-50 377 13100 180000 0.904 6-H-3-B-50D 0.979 1360 142000 NM 8-H-5-E-50 5610 13000 176000 NM 6-H-3-C-50 16.3 1240 140000 NM 8-H-6-A-50 0.202 18900 178000 NM 6-H-3-C-50D 15.2 1210 143000 NM 8-H-6-A-50D 0.191 19000 179000 NM 6-H-3-D-50 312 1230 143000 NM 8-H-6-B-50 2.16 18600 176000 NM 6-H-3-D-50D 322 1370 145000 NM 8-H-6-B-50D 1.96 18700 176000 NM 6-H-3-E-50 5190 1390 146000 NM 8-H-6-C-50 25.5 19000 177000 NM 6-H-3-E-50D 5140 1310 144000 NM 8-H-6-C-50D 25.9 19100 180000 NM 6-H-5-A-50 0.209 13000 146000 NM 8-H-6-D-50 363 19100 179000 NM 6-H-5-B-50 1.81 12900 144000 NM 8-H-6-D-50D 376 18600 174000 NM 6-H-5-C-50 23.2 12700 145000 NM 8-H-6-E-50 5370 19100 180000 NM 6-H-5-D-50 372 12800 143000 NM 8-H-6-E-50D 5340 18700 174000 NM 6-H-5-E-50 5290 13200 146000 NM 8-L-1-A-50 0.0738 11.8 180000 NM 6-H-6-A-50 0.165 18900 150000 0.924 8-L-1-B-50 0.983 12.1 180000 NM 6-H-6-B-50 0.983 18600 141000 NM 8-L-1-C-50 18.0 12.9 180000 NM 6-H-6-C-50 18.0 18700 145000 NM 8-L-1-D-50 324 12.4 186000 NM 6-H-6-D-50 343 18900 150000 NM 8-L-1-E-50 5280 11.4 184000 NM 6-H-6-E-50 5200 19300 147000 NM 8-L-3-A-50 0.102 1280 175000 NM 6-L-1-A-50 0.0736 11.3 144000 NM 8-L-3-B-50 1.19 1250 172000 NM 6-L-1-A-50D 0.0512 <10.0 142000 NM 8-L-3-C-50 20.7 1270 174000 NM 6-L-1-B-50 0.676 11.2 142000 NM 8-L-3-D-50 367 1300 178000 NM 6-L-1-B-50D 0.659 10.4 142000 NM 8-L-3-E-50 5560 1300 178000 NM
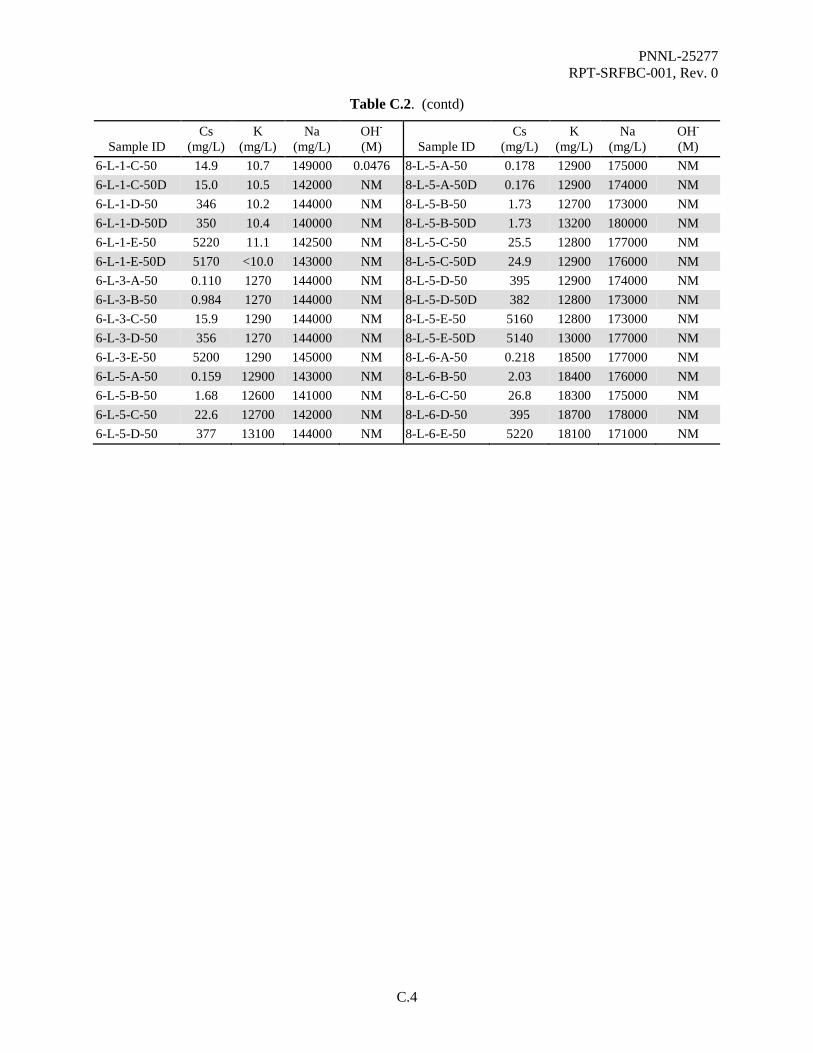
PNNL-25277 RPT-SRFBC-001, Rev. 0
C.4
Table C.2. (contd)
Sample ID Cs
(mg/L) K
(mg/L) Na
(mg/L) OH- (M) Sample ID
Cs (mg/L)
K (mg/L)
Na (mg/L)
OH- (M)
6-L-1-C-50 14.9 10.7 149000 0.0476 8-L-5-A-50 0.178 12900 175000 NM 6-L-1-C-50D 15.0 10.5 142000 NM 8-L-5-A-50D 0.176 12900 174000 NM 6-L-1-D-50 346 10.2 144000 NM 8-L-5-B-50 1.73 12700 173000 NM 6-L-1-D-50D 350 10.4 140000 NM 8-L-5-B-50D 1.73 13200 180000 NM 6-L-1-E-50 5220 11.1 142500 NM 8-L-5-C-50 25.5 12800 177000 NM 6-L-1-E-50D 5170 <10.0 143000 NM 8-L-5-C-50D 24.9 12900 176000 NM 6-L-3-A-50 0.110 1270 144000 NM 8-L-5-D-50 395 12900 174000 NM 6-L-3-B-50 0.984 1270 144000 NM 8-L-5-D-50D 382 12800 173000 NM 6-L-3-C-50 15.9 1290 144000 NM 8-L-5-E-50 5160 12800 173000 NM 6-L-3-D-50 356 1270 144000 NM 8-L-5-E-50D 5140 13000 177000 NM 6-L-3-E-50 5200 1290 145000 NM 8-L-6-A-50 0.218 18500 177000 NM 6-L-5-A-50 0.159 12900 143000 NM 8-L-6-B-50 2.03 18400 176000 NM 6-L-5-B-50 1.68 12600 141000 NM 8-L-6-C-50 26.8 18300 175000 NM 6-L-5-C-50 22.6 12700 142000 NM 8-L-6-D-50 395 18700 178000 NM 6-L-5-D-50 377 13100 144000 NM 8-L-6-E-50 5220 18100 171000 NM
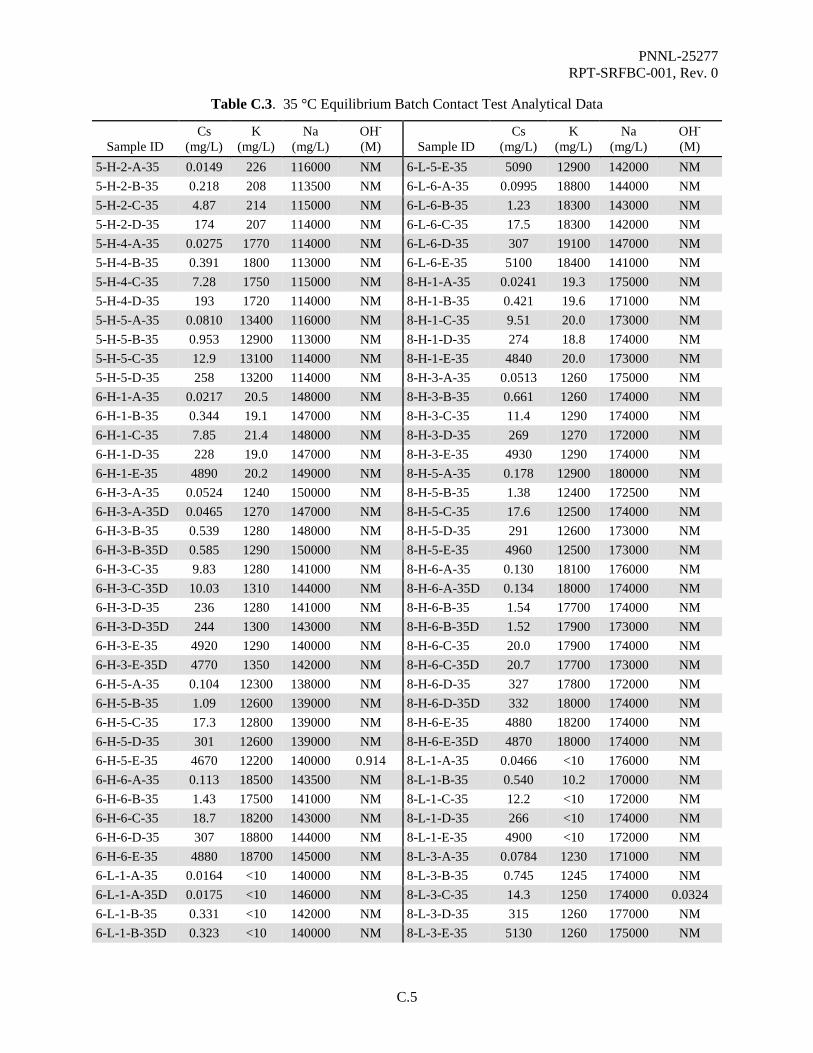
PNNL-25277 RPT-SRFBC-001, Rev. 0
C.5
Table C.3. 35 °C Equilibrium Batch Contact Test Analytical Data
Sample ID Cs
(mg/L) K
(mg/L) Na
(mg/L) OH-
(M) Sample ID Cs
(mg/L) K
(mg/L) Na
(mg/L) OH- (M)
5-H-2-A-35 0.0149 226 116000 NM 6-L-5-E-35 5090 12900 142000 NM 5-H-2-B-35 0.218 208 113500 NM 6-L-6-A-35 0.0995 18800 144000 NM 5-H-2-C-35 4.87 214 115000 NM 6-L-6-B-35 1.23 18300 143000 NM 5-H-2-D-35 174 207 114000 NM 6-L-6-C-35 17.5 18300 142000 NM 5-H-4-A-35 0.0275 1770 114000 NM 6-L-6-D-35 307 19100 147000 NM 5-H-4-B-35 0.391 1800 113000 NM 6-L-6-E-35 5100 18400 141000 NM 5-H-4-C-35 7.28 1750 115000 NM 8-H-1-A-35 0.0241 19.3 175000 NM 5-H-4-D-35 193 1720 114000 NM 8-H-1-B-35 0.421 19.6 171000 NM 5-H-5-A-35 0.0810 13400 116000 NM 8-H-1-C-35 9.51 20.0 173000 NM 5-H-5-B-35 0.953 12900 113000 NM 8-H-1-D-35 274 18.8 174000 NM 5-H-5-C-35 12.9 13100 114000 NM 8-H-1-E-35 4840 20.0 173000 NM 5-H-5-D-35 258 13200 114000 NM 8-H-3-A-35 0.0513 1260 175000 NM 6-H-1-A-35 0.0217 20.5 148000 NM 8-H-3-B-35 0.661 1260 174000 NM 6-H-1-B-35 0.344 19.1 147000 NM 8-H-3-C-35 11.4 1290 174000 NM 6-H-1-C-35 7.85 21.4 148000 NM 8-H-3-D-35 269 1270 172000 NM 6-H-1-D-35 228 19.0 147000 NM 8-H-3-E-35 4930 1290 174000 NM 6-H-1-E-35 4890 20.2 149000 NM 8-H-5-A-35 0.178 12900 180000 NM 6-H-3-A-35 0.0524 1240 150000 NM 8-H-5-B-35 1.38 12400 172500 NM 6-H-3-A-35D 0.0465 1270 147000 NM 8-H-5-C-35 17.6 12500 174000 NM 6-H-3-B-35 0.539 1280 148000 NM 8-H-5-D-35 291 12600 173000 NM 6-H-3-B-35D 0.585 1290 150000 NM 8-H-5-E-35 4960 12500 173000 NM 6-H-3-C-35 9.83 1280 141000 NM 8-H-6-A-35 0.130 18100 176000 NM 6-H-3-C-35D 10.03 1310 144000 NM 8-H-6-A-35D 0.134 18000 174000 NM 6-H-3-D-35 236 1280 141000 NM 8-H-6-B-35 1.54 17700 174000 NM 6-H-3-D-35D 244 1300 143000 NM 8-H-6-B-35D 1.52 17900 173000 NM 6-H-3-E-35 4920 1290 140000 NM 8-H-6-C-35 20.0 17900 174000 NM 6-H-3-E-35D 4770 1350 142000 NM 8-H-6-C-35D 20.7 17700 173000 NM 6-H-5-A-35 0.104 12300 138000 NM 8-H-6-D-35 327 17800 172000 NM 6-H-5-B-35 1.09 12600 139000 NM 8-H-6-D-35D 332 18000 174000 NM 6-H-5-C-35 17.3 12800 139000 NM 8-H-6-E-35 4880 18200 174000 NM 6-H-5-D-35 301 12600 139000 NM 8-H-6-E-35D 4870 18000 174000 NM 6-H-5-E-35 4670 12200 140000 0.914 8-L-1-A-35 0.0466 <10 176000 NM 6-H-6-A-35 0.113 18500 143500 NM 8-L-1-B-35 0.540 10.2 170000 NM 6-H-6-B-35 1.43 17500 141000 NM 8-L-1-C-35 12.2 <10 172000 NM 6-H-6-C-35 18.7 18200 143000 NM 8-L-1-D-35 266 <10 174000 NM 6-H-6-D-35 307 18800 144000 NM 8-L-1-E-35 4900 <10 172000 NM 6-H-6-E-35 4880 18700 145000 NM 8-L-3-A-35 0.0784 1230 171000 NM 6-L-1-A-35 0.0164 <10 140000 NM 8-L-3-B-35 0.745 1245 174000 NM 6-L-1-A-35D 0.0175 <10 146000 NM 8-L-3-C-35 14.3 1250 174000 0.0324 6-L-1-B-35 0.331 <10 142000 NM 8-L-3-D-35 315 1260 177000 NM 6-L-1-B-35D 0.323 <10 140000 NM 8-L-3-E-35 5130 1260 175000 NM
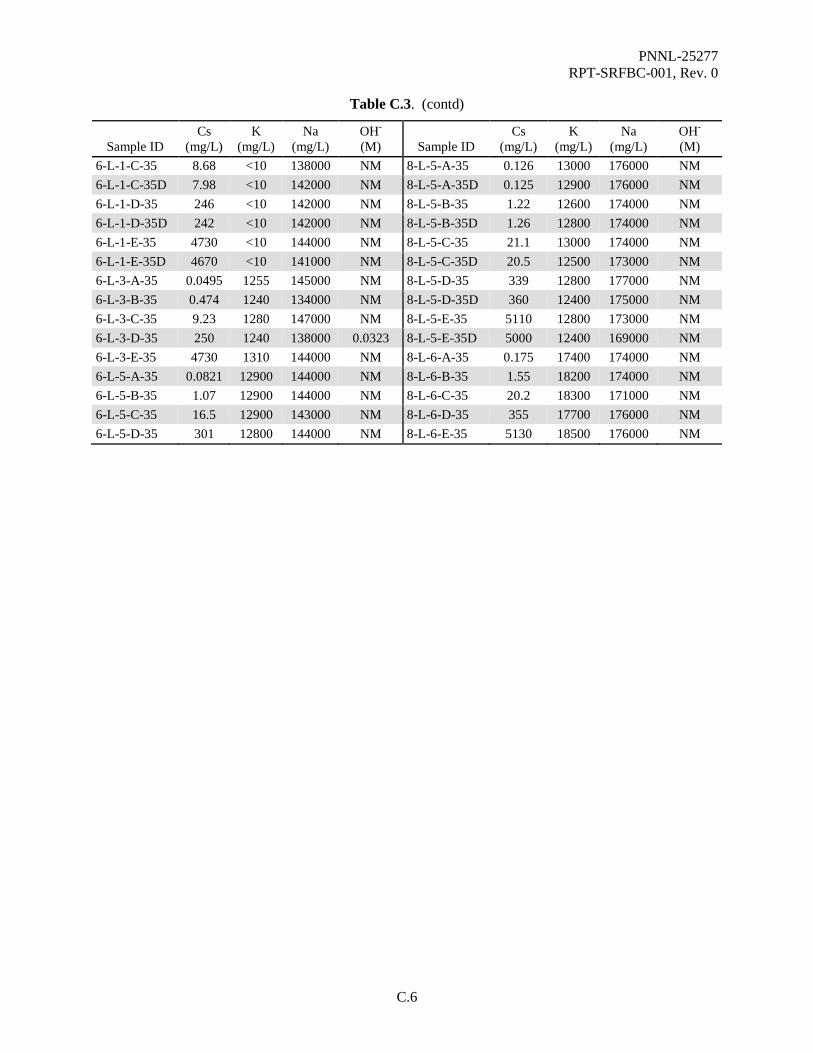
PNNL-25277 RPT-SRFBC-001, Rev. 0
C.6
Table C.3. (contd)
Sample ID Cs
(mg/L) K
(mg/L) Na
(mg/L) OH-
(M) Sample ID Cs
(mg/L) K
(mg/L) Na
(mg/L) OH- (M)
6-L-1-C-35 8.68 <10 138000 NM 8-L-5-A-35 0.126 13000 176000 NM 6-L-1-C-35D 7.98 <10 142000 NM 8-L-5-A-35D 0.125 12900 176000 NM 6-L-1-D-35 246 <10 142000 NM 8-L-5-B-35 1.22 12600 174000 NM 6-L-1-D-35D 242 <10 142000 NM 8-L-5-B-35D 1.26 12800 174000 NM 6-L-1-E-35 4730 <10 144000 NM 8-L-5-C-35 21.1 13000 174000 NM 6-L-1-E-35D 4670 <10 141000 NM 8-L-5-C-35D 20.5 12500 173000 NM 6-L-3-A-35 0.0495 1255 145000 NM 8-L-5-D-35 339 12800 177000 NM 6-L-3-B-35 0.474 1240 134000 NM 8-L-5-D-35D 360 12400 175000 NM 6-L-3-C-35 9.23 1280 147000 NM 8-L-5-E-35 5110 12800 173000 NM 6-L-3-D-35 250 1240 138000 0.0323 8-L-5-E-35D 5000 12400 169000 NM 6-L-3-E-35 4730 1310 144000 NM 8-L-6-A-35 0.175 17400 174000 NM 6-L-5-A-35 0.0821 12900 144000 NM 8-L-6-B-35 1.55 18200 174000 NM 6-L-5-B-35 1.07 12900 144000 NM 8-L-6-C-35 20.2 18300 171000 NM 6-L-5-C-35 16.5 12900 143000 NM 8-L-6-D-35 355 17700 176000 NM 6-L-5-D-35 301 12800 144000 NM 8-L-6-E-35 5130 18500 176000 NM

PNNL-25277 RPT-SRFBC-001, Rev. 0
C.7
Table C.4. 25 °C Equilibrium Batch Contact Test Analytical Data
Sample ID Cs
(mg/L) K
(mg/L) Na
(mg/L) OH- (M) Sample ID
Cs (mg/L)
K (mg/L)
Na (mg/L)
OH- (M)
5-H-2-A-25 0.0117 211 104000 0.929 6-L-5-E-25 4930 12800 149000 NM 5-H-2-B-25 0.204 198 103000 NM 6-L-6-A-25 0.0717 17900 149000 NM 5-H-2-C-25(1) 5.04 215 105000 NM 6-L-6-B-25 1.02 18300 144000 NM 5-H-2-D-25(1) 172 218 105000 NM 6-L-6-C-25 15.3 18200 149000 NM 5-H-4-A-25 0.0296 1730 104000 NM 6-L-6-D-25 297 18200 147000 NM 5-H-4-B-25 0.395 1720 104000 NM 6-L-6-E-25 5040 18300 148000 NM 5-H-4-C-25 6.56 1790 104000 NM 8-H-1-A-25 0.016 20.1 173000 NM 5-H-4-D-25 186 1800 105000 NM 8-H-1-B-25 0.207 20.5 175000 NM 5-H-5-A-25 0.0745 11900 103000 NM 8-H-1-C-25 6.80 18.3 175000 NM 5-H-5-B-25 0.853 12000 104000 NM 8-H-1-D-25 207 22.2 174000 NM 5-H-5-C-25 12.6 11800 104000 NM 8-H-1-E-25 4540 20.1 173000 NM 5-H-5-D-25 245 12000 105000 NM 8-H-3-A-25 0.036 1280 174000 NM 6-H-1-A-25 0.019 18.3 135000 NM 8-H-3-B-25 0.415 1280 175000 NM 6-H-1-B-25 0.295 17.9 135000 NM 8-H-3-C-25 7.80 1290 176000 NM 6-H-1-C-25 7.21 18.1 136000 NM 8-H-3-D-25 229 1280 176000 NM 6-H-1-D-25 219 19.9 139000 NM 8-H-3-E-25 4700 1260 171000 NM 6-H-1-E-25 4510 20.4 136000 NM 8-H-5-A-25 0.130 12900 175000 NM 6-H-3-A-25 0.0319 1240 139000 NM 8-H-5-B-25 0.924 12400 165000 NM 6-H-3-A-25D 0.040 1330 140000 NM 8-H-5-C-25 14.1 12500 170000 NM 6-H-3-B-25 0.556 1250 140000 NM 8-H-5-D-25 291 12200 163000 NM 6-H-3-B-25D 0.571 1280 140000 NM 8-H-5-E-25 4980 12200 175000 NM 6-H-3-C-25 9.43 1260 142000 NM 8-H-6-A-25 0.120 17700 169000 NM 6-H-3-C-25D 10.2 1320 142000 NM 8-H-6-A-25D 0.106 17700 172000 NM 6-H-3-D-25 233 1340 143000 NM 8-H-6-B-25 1.19 17750 169000 NM 6-H-3-D-25D 234 1240 140000 NM 8-H-6-B-25D 1.27 17800 171000 NM 6-H-3-E-25 4860 1300 143000 NM 8-H-6-C-25 17.5 18300 174000 NM 6-H-3-E-25D 4920 1330 141000 NM 8-H-6-C-25D 17.6 18200 174000 NM 6-H-5-A-25 0.111 12700 141000 NM 8-H-6-D-25 334 18400 176000 NM 6-H-5-B-25 1.18 12500 140000 NM 8-H-6-D-25D 322 18000 171000 NM 6-H-5-C-25 15.7 12700 141000 NM 8-H-6-E-25 5040 18700 175000 0.878 6-H-5-D-25 286 12800 140000 NM 8-H-6-E-25D 5070 18400 175000 NM 6-H-5-E-25 5010 12700 141000 NM 8-L-1-A-25 0.0245 10.9 175000 NM 6-H-6-A-25 0.103 18200 145000 NM 8-L-1-B-25 0.403 <10 171000 0.0320 6-H-6-B-25 1.15 17600 135000 NM 8-L-1-C-25 10.6 10.8 178000 NM 6-H-6-C-25 15.6 18300 148000 NM 8-L-1-D-25 242 11.4 179000 NM 6-H-6-D-25 286 18500 144000 NM 8-L-1-E-25 4830 <10 175000 NM 6-H-6-E-25 4680 18000 141000 NM 8-L-3-A-25 0.0383 1290 179000 NM 6-L-1-A-25 0.022 <10 144000 NM 8-L-3-B-25 0.474 1260 178000 NM 6-L-1-A-25D 0.027 <10 143000 NM 8-L-3-C-25 9.26 1240 177000 NM 6-L-1-B-25 0.296 <10 141000 NM 8-L-3-D-25 264 1260 177000 NM

PNNL-25277 RPT-SRFBC-001, Rev. 0
C.8
Table C.4. (contd)
Sample ID Cs
(mg/L) K
(mg/L) Na
(mg/L) OH- (M) Sample ID
Cs (mg/L)
K (mg/L)
Na (mg/L)
OH- (M)
6-L-1-B-25D 0.298 10.5 144000 NM 8-L-3-E-25 4860 1300 178000 NM 6-L-1-C-25 8.36 10.3 141000 NM 8-L-5-A-25 0.0871 13000 180000 NM 6-L-1-C-25D 8.79 <10 144000 NM 8-L-5-A-25D 0.0787 13000 178000 NM 6-L-1-D-25 235.5 <10 148000 NM 8-L-5-B-25 0.817 12500 178000 NM 6-L-1-D-25D 228 <10 150000 NM 8-L-5-B-25D 0.877 12900 179000 NM 6-L-1-E-25 4670 <10 148000 NM 8-L-5-C-25 15.8 13000 178000 NM 6-L-1-E-25D 4820 <10 150000 NM 8-L-5-C-25D 16.1 12700 174000 NM 6-L-3-A-25 0.0398 1210 146000 NM 8-L-5-D-25 300 12900 176000 NM 6-L-3-B-25 0.438 1260 144000 NM 8-L-5-D-25D 325 12900 175000 NM 6-L-3-C-25 8.58 1310 147000 NM 8-L-5-E-25 5050 12700 177000 NM 6-L-3-D-25 257 1260 147000 NM 8-L-5-E-25D 5100 12800 176000 NM 6-L-3-E-25 4640 1280 144000 NM 8-L-6-A-25 0.132 18650 178500 NM 6-L-5-A-25 0.0630 12600 146000 NM 8-L-6-B-25 1.29 17800 172000 NM 6-L-5-B-25 0.892 12700 146000 NM 8-L-6-C-25 20.4 18500 176000 NM 6-L-5-C-25 16.0 13000 150000 NM 8-L-6-D-25 355 18800 182000 NM 6-L-5-D-25 286 12400 148000 NM 8-L-6-E-25 5360 18000 176000 NM (1) Samples were reversed in the lab. Therefore, results were reversed in the table.
PNNL-25277 RPT-SRFBC-001, Rev. 0
Appendix D –
Isotherm Cs Loading Values

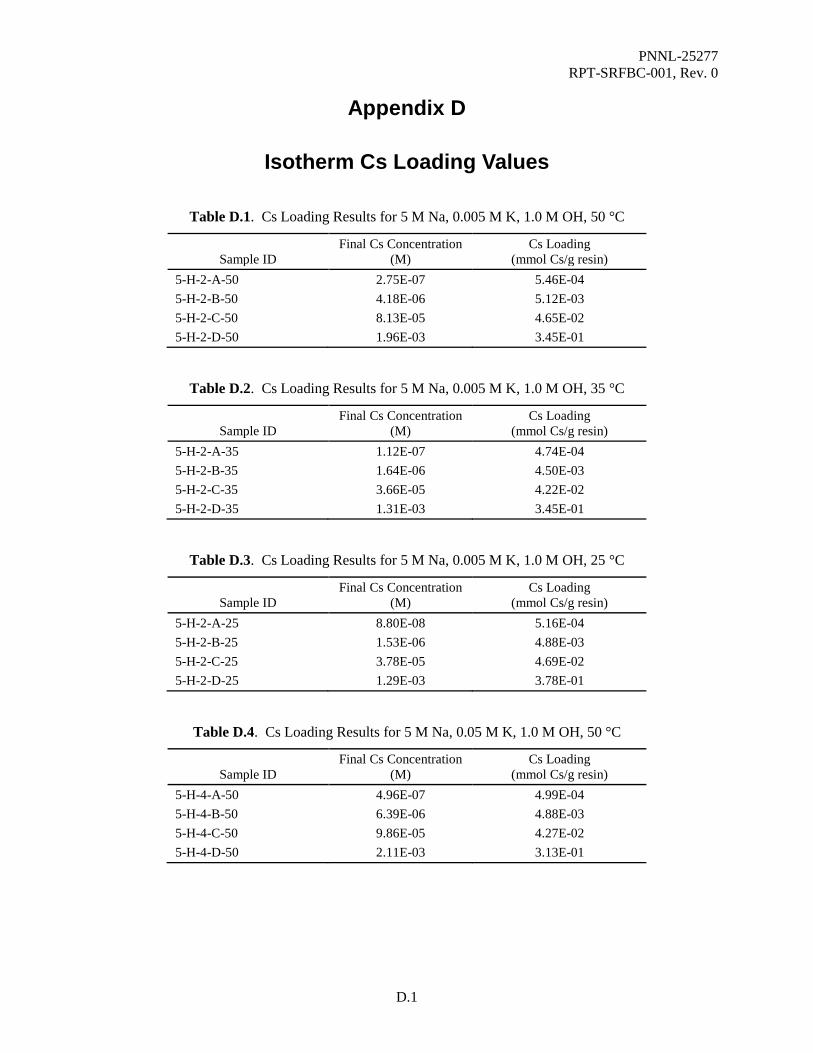
PNNL-25277 RPT-SRFBC-001, Rev. 0
D.1
Appendix D
Isotherm Cs Loading Values
Table D.1. Cs Loading Results for 5 M Na, 0.005 M K, 1.0 M OH, 50 °C
Sample ID Final Cs Concentration
(M) Cs Loading
(mmol Cs/g resin) 5-H-2-A-50 2.75E-07 5.46E-04 5-H-2-B-50 4.18E-06 5.12E-03 5-H-2-C-50 8.13E-05 4.65E-02 5-H-2-D-50 1.96E-03 3.45E-01
Table D.2. Cs Loading Results for 5 M Na, 0.005 M K, 1.0 M OH, 35 °C
Sample ID Final Cs Concentration
(M) Cs Loading
(mmol Cs/g resin) 5-H-2-A-35 1.12E-07 4.74E-04 5-H-2-B-35 1.64E-06 4.50E-03 5-H-2-C-35 3.66E-05 4.22E-02 5-H-2-D-35 1.31E-03 3.45E-01
Table D.3. Cs Loading Results for 5 M Na, 0.005 M K, 1.0 M OH, 25 °C
Sample ID Final Cs Concentration
(M) Cs Loading
(mmol Cs/g resin) 5-H-2-A-25 8.80E-08 5.16E-04 5-H-2-B-25 1.53E-06 4.88E-03 5-H-2-C-25 3.78E-05 4.69E-02 5-H-2-D-25 1.29E-03 3.78E-01
Table D.4. Cs Loading Results for 5 M Na, 0.05 M K, 1.0 M OH, 50 °C
Sample ID Final Cs Concentration
(M) Cs Loading
(mmol Cs/g resin) 5-H-4-A-50 4.96E-07 4.99E-04 5-H-4-B-50 6.39E-06 4.88E-03 5-H-4-C-50 9.86E-05 4.27E-02 5-H-4-D-50 2.11E-03 3.13E-01

PNNL-25277 RPT-SRFBC-001, Rev. 0
D.2
Table D.5. Cs Loading Results for 5 M Na, 0.05 M K, 1.0 M OH, 35 °C
Sample ID Final Cs Concentration
(M) Cs Loading
(mmol Cs/g resin) 5-H-4-A-35 2.07E-07 4.50E-04 5-H-4-B-35 2.94E-06 4.36E-03 5-H-4-C-35 5.48E-05 4.01E-02 5-H-4-D-35 1.45E-03 3.35E-01
Table D.6. Cs Loading Results for 5 M Na, 0.05 M K, 1.0 M OH, 25 °C
Sample ID Final Cs Concentration
(M) Cs Loading
(mmol Cs/g resin) 5-H-4-A-25 2.23E-07 4.84E-04 5-H-4-B-25 2.97E-06 4.72E-03 5-H-4-C-25 4.94E-05 4.21E-02 5-H-4-D-25 1.40E-03 3.58E-01
Table D.7. Cs Loading Results for 5 M Na, 0.35 M K, 1.0 M OH, 50 °C
Sample ID Final Cs Concentration
(M) Cs Loading
(mmol Cs/g resin) 5-H-5-A-50 1.14E-06 4.37E-04 5-H-5-B-50 1.24E-05 4.24E-03 5-H-5-C-50 1.51E-04 3.87E-02 5-H-5-D-50 2.53E-03 2.78E-01
Table D.8. Cs Loading Results for 5 M Na, 0.35 M K, 1.0 M OH, 35 °C
Sample ID Final Cs Concentration
(M) Cs Loading
(mmol Cs/g resin) 5-H-5-A-35 6.09E-07 4.11E-04 5-H-5-B-35 7.17E-06 4.11E-03 5-H-5-C-35 9.71E-05 3.71E-02 5-H-5-D-35 1.94E-03 2.88E-01
Table D.9. Cs Loading Results for 5 M Na, 0.35 M K, 1.0 M OH, 25 °C
Sample ID Final Cs Concentration
(M) Cs Loading
(mmol Cs/g resin) 5-H-5-A-25 5.61E-07 4.54E-04 5-H-5-B-25 6.42E-06 4.32E-03 5-H-5-C-25 9.48E-05 4.03E-02 5-H-5-D-25 1.84E-03 3.21E-01
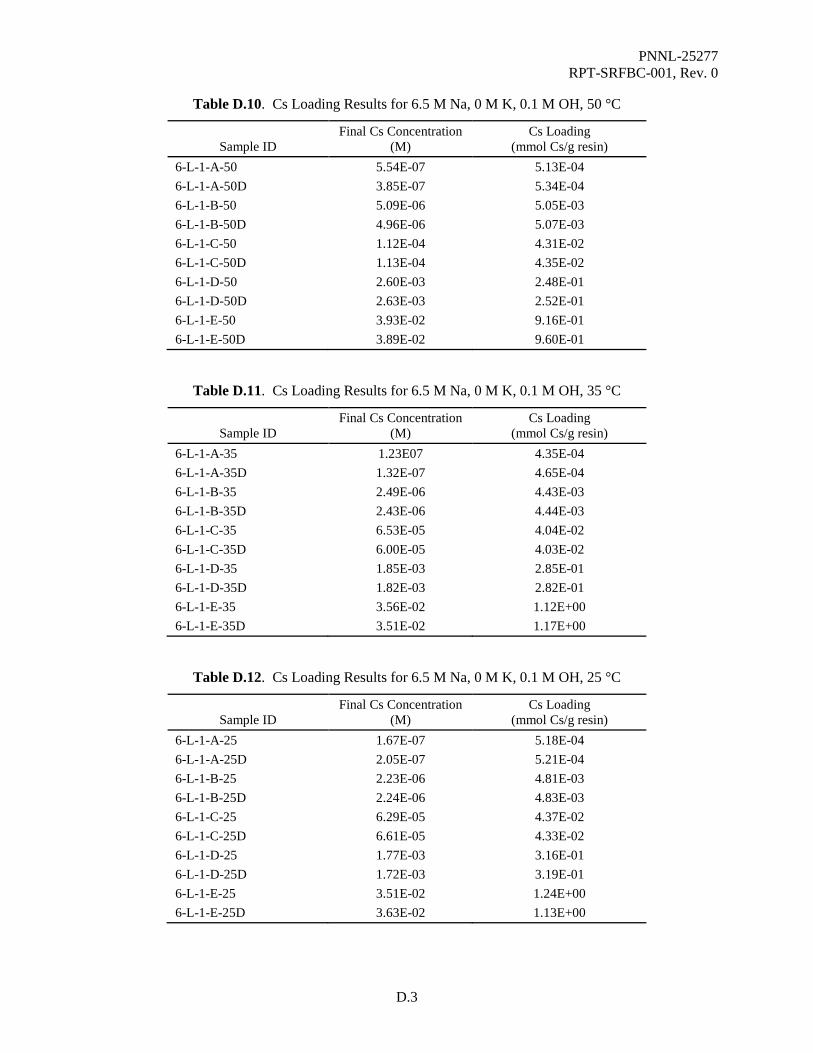
PNNL-25277 RPT-SRFBC-001, Rev. 0
D.3
Table D.10. Cs Loading Results for 6.5 M Na, 0 M K, 0.1 M OH, 50 °C
Sample ID Final Cs Concentration
(M) Cs Loading
(mmol Cs/g resin) 6-L-1-A-50 5.54E-07 5.13E-04 6-L-1-A-50D 3.85E-07 5.34E-04 6-L-1-B-50 5.09E-06 5.05E-03 6-L-1-B-50D 4.96E-06 5.07E-03 6-L-1-C-50 1.12E-04 4.31E-02 6-L-1-C-50D 1.13E-04 4.35E-02 6-L-1-D-50 2.60E-03 2.48E-01 6-L-1-D-50D 2.63E-03 2.52E-01 6-L-1-E-50 3.93E-02 9.16E-01 6-L-1-E-50D 3.89E-02 9.60E-01
Table D.11. Cs Loading Results for 6.5 M Na, 0 M K, 0.1 M OH, 35 °C
Sample ID Final Cs Concentration
(M) Cs Loading
(mmol Cs/g resin) 6-L-1-A-35 1.23E07 4.35E-04 6-L-1-A-35D 1.32E-07 4.65E-04 6-L-1-B-35 2.49E-06 4.43E-03 6-L-1-B-35D 2.43E-06 4.44E-03 6-L-1-C-35 6.53E-05 4.04E-02 6-L-1-C-35D 6.00E-05 4.03E-02 6-L-1-D-35 1.85E-03 2.85E-01 6-L-1-D-35D 1.82E-03 2.82E-01 6-L-1-E-35 3.56E-02 1.12E+00 6-L-1-E-35D 3.51E-02 1.17E+00
Table D.12. Cs Loading Results for 6.5 M Na, 0 M K, 0.1 M OH, 25 °C
Sample ID Final Cs Concentration
(M) Cs Loading
(mmol Cs/g resin) 6-L-1-A-25 1.67E-07 5.18E-04 6-L-1-A-25D 2.05E-07 5.21E-04 6-L-1-B-25 2.23E-06 4.81E-03 6-L-1-B-25D 2.24E-06 4.83E-03 6-L-1-C-25 6.29E-05 4.37E-02 6-L-1-C-25D 6.61E-05 4.33E-02 6-L-1-D-25 1.77E-03 3.16E-01 6-L-1-D-25D 1.72E-03 3.19E-01 6-L-1-E-25 3.51E-02 1.24E+00 6-L-1-E-25D 3.63E-02 1.13E+00
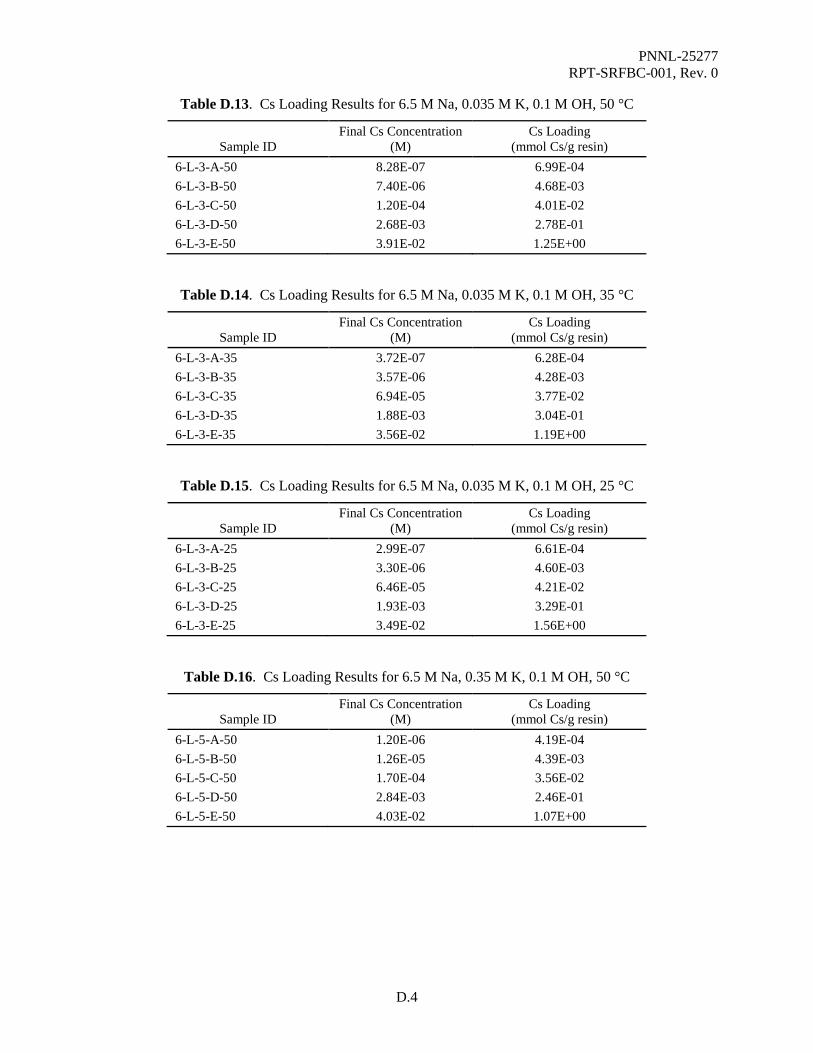
PNNL-25277 RPT-SRFBC-001, Rev. 0
D.4
Table D.13. Cs Loading Results for 6.5 M Na, 0.035 M K, 0.1 M OH, 50 °C
Sample ID Final Cs Concentration
(M) Cs Loading
(mmol Cs/g resin) 6-L-3-A-50 8.28E-07 6.99E-04 6-L-3-B-50 7.40E-06 4.68E-03 6-L-3-C-50 1.20E-04 4.01E-02 6-L-3-D-50 2.68E-03 2.78E-01 6-L-3-E-50 3.91E-02 1.25E+00
Table D.14. Cs Loading Results for 6.5 M Na, 0.035 M K, 0.1 M OH, 35 °C
Sample ID Final Cs Concentration
(M) Cs Loading
(mmol Cs/g resin) 6-L-3-A-35 3.72E-07 6.28E-04 6-L-3-B-35 3.57E-06 4.28E-03 6-L-3-C-35 6.94E-05 3.77E-02 6-L-3-D-35 1.88E-03 3.04E-01 6-L-3-E-35 3.56E-02 1.19E+00
Table D.15. Cs Loading Results for 6.5 M Na, 0.035 M K, 0.1 M OH, 25 °C
Sample ID Final Cs Concentration
(M) Cs Loading
(mmol Cs/g resin) 6-L-3-A-25 2.99E-07 6.61E-04 6-L-3-B-25 3.30E-06 4.60E-03 6-L-3-C-25 6.46E-05 4.21E-02 6-L-3-D-25 1.93E-03 3.29E-01 6-L-3-E-25 3.49E-02 1.56E+00
Table D.16. Cs Loading Results for 6.5 M Na, 0.35 M K, 0.1 M OH, 50 °C
Sample ID Final Cs Concentration
(M) Cs Loading
(mmol Cs/g resin) 6-L-5-A-50 1.20E-06 4.19E-04 6-L-5-B-50 1.26E-05 4.39E-03 6-L-5-C-50 1.70E-04 3.56E-02 6-L-5-D-50 2.84E-03 2.46E-01 6-L-5-E-50 4.03E-02 1.07E+00

PNNL-25277 RPT-SRFBC-001, Rev. 0
D.5
Table D.17. Cs Loading Results for 6.5 M Na, 0.35 M K, 0.1 M OH, 35 °C
Sample ID Final Cs Concentration
(M) Cs Loading
(mmol Cs/g resin) 6-L-5-A-35 6.18E-07 4.17E-04 6-L-5-B-35 8.05E-06 4.28E-03 6-L-5-C-35 1.24E-04 4.40E-02 6-L-5-D-35 2.26E-03 2.61E-01 6-L-5-E-35 3.83E-02 1.09E+00
Table D.18. Cs Loading Results for 6.5 M Na, 0.35 M K, 0.1 M OH, 25 °C
Sample ID Final Cs Concentration
(M) Cs Loading
(mmol Cs/g resin) 6-L-5-A-25 4.74E-07 4.46E-04 6-L-5-B-25 6.71E-06 4.57E-03 6-L-5-C-25 1.20E-04 3.76E-02 6-L-5-D-25 2.15E-03 2.87E-01 6-L-5-E-25 3.71E-02 1.32E+00
Table D.19. Cs Loading Results for 6.5 M Na, 0.50 M K, 0.1 M OH, 50 °C
Sample ID Final Cs Concentration
(M) Cs Loading
(mmol Cs/g resin) 6-L-6-A-50 1.26E-06 3.94E-04 6-L-6-B-50 1.45E-05 3.77E-03 6-L-6-C-50 1.79E-04 3.51E-02 6-L-6-D-50 2.77E-03 2.30E-01 6-L-6-E-50 3.91E-02 1.09E+00
Table D.20. Cs Loading Results for 6.5 M Na, 0.50 M K, 0.1 M OH, 35 °C
Sample ID Final Cs Concentration
(M) Cs Loading
(mmol Cs/g resin) 6-L-6-A-35 7.49E-07 3.88E-04 6-L-6-B-35 9.25E-06 3.72E-03 6-L-6-C-35 1.32E-04 3.43E-02 6-L-6-D-35 2.31E-03 2.44E-01 6-L-6-E-35 3.84E-02 1.00E+00
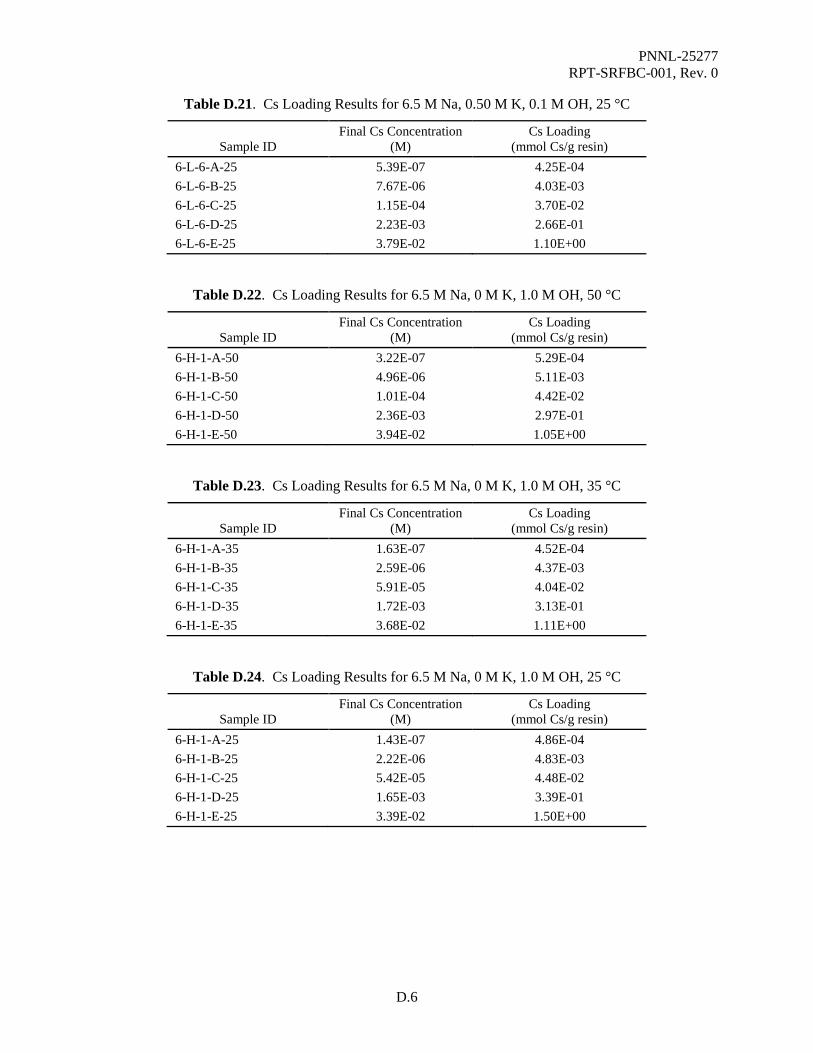
PNNL-25277 RPT-SRFBC-001, Rev. 0
D.6
Table D.21. Cs Loading Results for 6.5 M Na, 0.50 M K, 0.1 M OH, 25 °C
Sample ID Final Cs Concentration
(M) Cs Loading
(mmol Cs/g resin) 6-L-6-A-25 5.39E-07 4.25E-04 6-L-6-B-25 7.67E-06 4.03E-03 6-L-6-C-25 1.15E-04 3.70E-02 6-L-6-D-25 2.23E-03 2.66E-01 6-L-6-E-25 3.79E-02 1.10E+00
Table D.22. Cs Loading Results for 6.5 M Na, 0 M K, 1.0 M OH, 50 °C
Sample ID Final Cs Concentration
(M) Cs Loading
(mmol Cs/g resin) 6-H-1-A-50 3.22E-07 5.29E-04 6-H-1-B-50 4.96E-06 5.11E-03 6-H-1-C-50 1.01E-04 4.42E-02 6-H-1-D-50 2.36E-03 2.97E-01 6-H-1-E-50 3.94E-02 1.05E+00
Table D.23. Cs Loading Results for 6.5 M Na, 0 M K, 1.0 M OH, 35 °C
Sample ID Final Cs Concentration
(M) Cs Loading
(mmol Cs/g resin) 6-H-1-A-35 1.63E-07 4.52E-04 6-H-1-B-35 2.59E-06 4.37E-03 6-H-1-C-35 5.91E-05 4.04E-02 6-H-1-D-35 1.72E-03 3.13E-01 6-H-1-E-35 3.68E-02 1.11E+00
Table D.24. Cs Loading Results for 6.5 M Na, 0 M K, 1.0 M OH, 25 °C
Sample ID Final Cs Concentration
(M) Cs Loading
(mmol Cs/g resin) 6-H-1-A-25 1.43E-07 4.86E-04 6-H-1-B-25 2.22E-06 4.83E-03 6-H-1-C-25 5.42E-05 4.48E-02 6-H-1-D-25 1.65E-03 3.39E-01 6-H-1-E-25 3.39E-02 1.50E+00
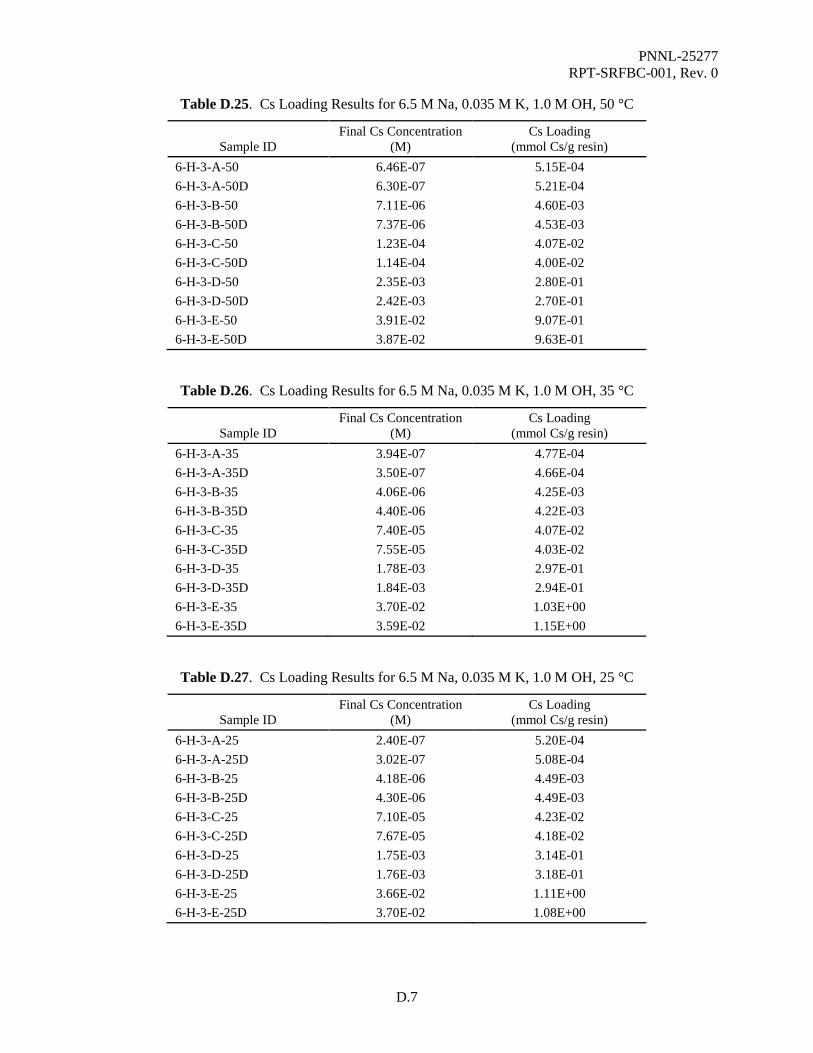
PNNL-25277 RPT-SRFBC-001, Rev. 0
D.7
Table D.25. Cs Loading Results for 6.5 M Na, 0.035 M K, 1.0 M OH, 50 °C
Sample ID Final Cs Concentration
(M) Cs Loading
(mmol Cs/g resin) 6-H-3-A-50 6.46E-07 5.15E-04 6-H-3-A-50D 6.30E-07 5.21E-04 6-H-3-B-50 7.11E-06 4.60E-03 6-H-3-B-50D 7.37E-06 4.53E-03 6-H-3-C-50 1.23E-04 4.07E-02 6-H-3-C-50D 1.14E-04 4.00E-02 6-H-3-D-50 2.35E-03 2.80E-01 6-H-3-D-50D 2.42E-03 2.70E-01 6-H-3-E-50 3.91E-02 9.07E-01 6-H-3-E-50D 3.87E-02 9.63E-01
Table D.26. Cs Loading Results for 6.5 M Na, 0.035 M K, 1.0 M OH, 35 °C
Sample ID Final Cs Concentration
(M) Cs Loading
(mmol Cs/g resin) 6-H-3-A-35 3.94E-07 4.77E-04 6-H-3-A-35D 3.50E-07 4.66E-04 6-H-3-B-35 4.06E-06 4.25E-03 6-H-3-B-35D 4.40E-06 4.22E-03 6-H-3-C-35 7.40E-05 4.07E-02 6-H-3-C-35D 7.55E-05 4.03E-02 6-H-3-D-35 1.78E-03 2.97E-01 6-H-3-D-35D 1.84E-03 2.94E-01 6-H-3-E-35 3.70E-02 1.03E+00 6-H-3-E-35D 3.59E-02 1.15E+00
Table D.27. Cs Loading Results for 6.5 M Na, 0.035 M K, 1.0 M OH, 25 °C
Sample ID Final Cs Concentration
(M) Cs Loading
(mmol Cs/g resin) 6-H-3-A-25 2.40E-07 5.20E-04 6-H-3-A-25D 3.02E-07 5.08E-04 6-H-3-B-25 4.18E-06 4.49E-03 6-H-3-B-25D 4.30E-06 4.49E-03 6-H-3-C-25 7.10E-05 4.23E-02 6-H-3-C-25D 7.67E-05 4.18E-02 6-H-3-D-25 1.75E-03 3.14E-01 6-H-3-D-25D 1.76E-03 3.18E-01 6-H-3-E-25 3.66E-02 1.11E+00 6-H-3-E-25D 3.70E-02 1.08E+00

PNNL-25277 RPT-SRFBC-001, Rev. 0
D.8
Table D.28. Cs Loading Results for 6.5 M Na, 0.35 M K, 1.0 M OH, 50 °C
Sample ID Final Cs Concentration
(M) Cs Loading
(mmol Cs/g resin) 6-H-5-A-50 1.57E-06 3.60E-04 6-H-5-B-50 1.36E-05 3.98E-03 6-H-5-C-50 1.75E-04 3.48E-02 6-H-5-D-50 2.80E-03 2.33E-01 6-H-5-E-50 3.98E-02 8.84E-01
Table D.29 Cs Loading Results for 6.5 M Na, 0.35 M K, 1.0 M OH, 35 °C
Sample ID Final Cs Concentration
(M) Cs Loading
(mmol Cs/g resin) 6-H-5-A-35 7.83E-07 3.81E-04 6-H-5-B-35 8.20E-06 3.92E-03 6-H-5-C-35 1.30E-04 3.36E-02 6-H-5-D-35 2.26E-03 2.51E-01 6-H-5-E-35 3.51E-02 1.21E+00
Table D.30. Cs Loading Results for 6.5 M Na, 0.35 M K, 1.0 M OH, 25 °C
Sample ID Final Cs Concentration
(M) Cs Loading
(mmol Cs/g resin) 6-H-5-A-25 8.35E-07 4.03E-04 6-H-5-B-25 8.88E-06 4.16E-03 6-H-5-C-25 1.18E-04 3.75E-02 6-H-5-D-25 2.15E-03 2.75E-01 6-H-5-E-25 3.77E-02 1.02E+00
Table D.31. Cs Loading Results for 6.5 M Na, 0.50 M K, 1.0 M OH, 50 °C
Sample ID Final Cs Concentration
(M) Cs Loading
(mmol Cs/g resin) 6-H-6-A-50 1.24E-06 3.25E-04 6-H-6-B-50 7.40E-06 3.79E-03 6-H-6-C-50 1.35E-04 3.10E-02 6-H-6-D-50 2.58E-03 2.06E-01 6-H-6-E-50 3.91E-02 7.23E-01
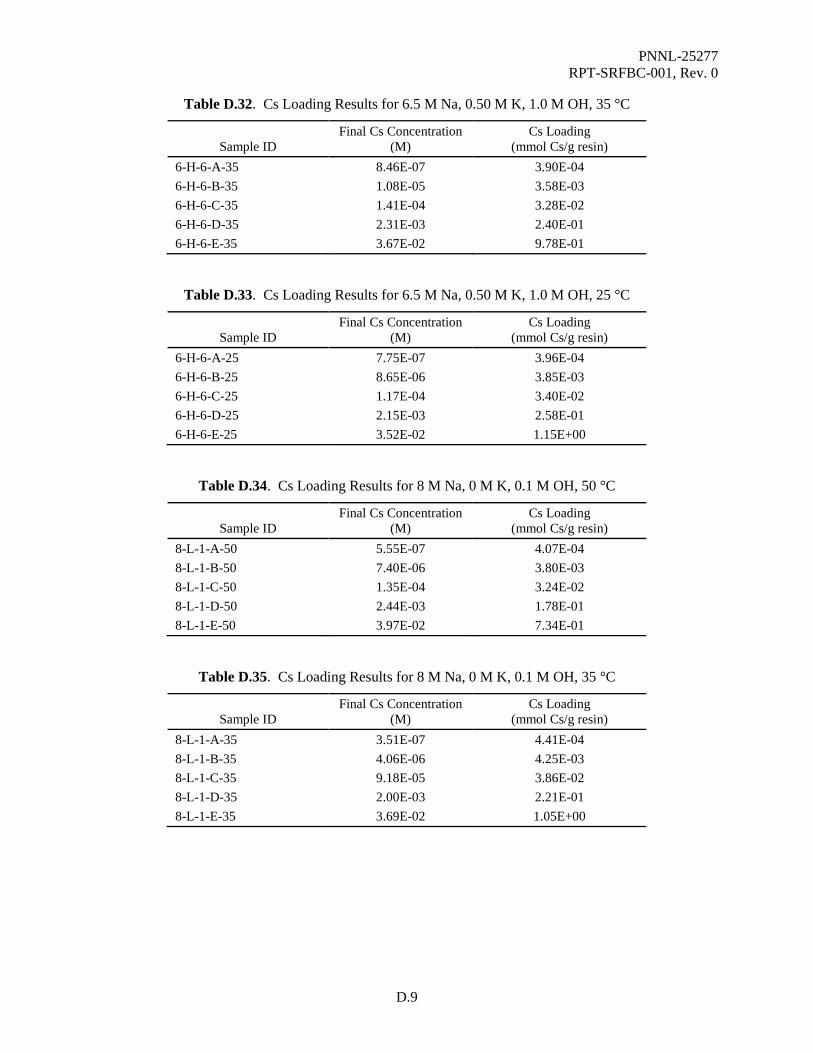
PNNL-25277 RPT-SRFBC-001, Rev. 0
D.9
Table D.32. Cs Loading Results for 6.5 M Na, 0.50 M K, 1.0 M OH, 35 °C
Sample ID Final Cs Concentration
(M) Cs Loading
(mmol Cs/g resin) 6-H-6-A-35 8.46E-07 3.90E-04 6-H-6-B-35 1.08E-05 3.58E-03 6-H-6-C-35 1.41E-04 3.28E-02 6-H-6-D-35 2.31E-03 2.40E-01 6-H-6-E-35 3.67E-02 9.78E-01
Table D.33. Cs Loading Results for 6.5 M Na, 0.50 M K, 1.0 M OH, 25 °C
Sample ID Final Cs Concentration
(M) Cs Loading
(mmol Cs/g resin) 6-H-6-A-25 7.75E-07 3.96E-04 6-H-6-B-25 8.65E-06 3.85E-03 6-H-6-C-25 1.17E-04 3.40E-02 6-H-6-D-25 2.15E-03 2.58E-01 6-H-6-E-25 3.52E-02 1.15E+00
Table D.34. Cs Loading Results for 8 M Na, 0 M K, 0.1 M OH, 50 °C
Sample ID Final Cs Concentration
(M) Cs Loading
(mmol Cs/g resin) 8-L-1-A-50 5.55E-07 4.07E-04 8-L-1-B-50 7.40E-06 3.80E-03 8-L-1-C-50 1.35E-04 3.24E-02 8-L-1-D-50 2.44E-03 1.78E-01 8-L-1-E-50 3.97E-02 7.34E-01
Table D.35. Cs Loading Results for 8 M Na, 0 M K, 0.1 M OH, 35 °C
Sample ID Final Cs Concentration
(M) Cs Loading
(mmol Cs/g resin) 8-L-1-A-35 3.51E-07 4.41E-04 8-L-1-B-35 4.06E-06 4.25E-03 8-L-1-C-35 9.18E-05 3.86E-02 8-L-1-D-35 2.00E-03 2.21E-01 8-L-1-E-35 3.69E-02 1.05E+00
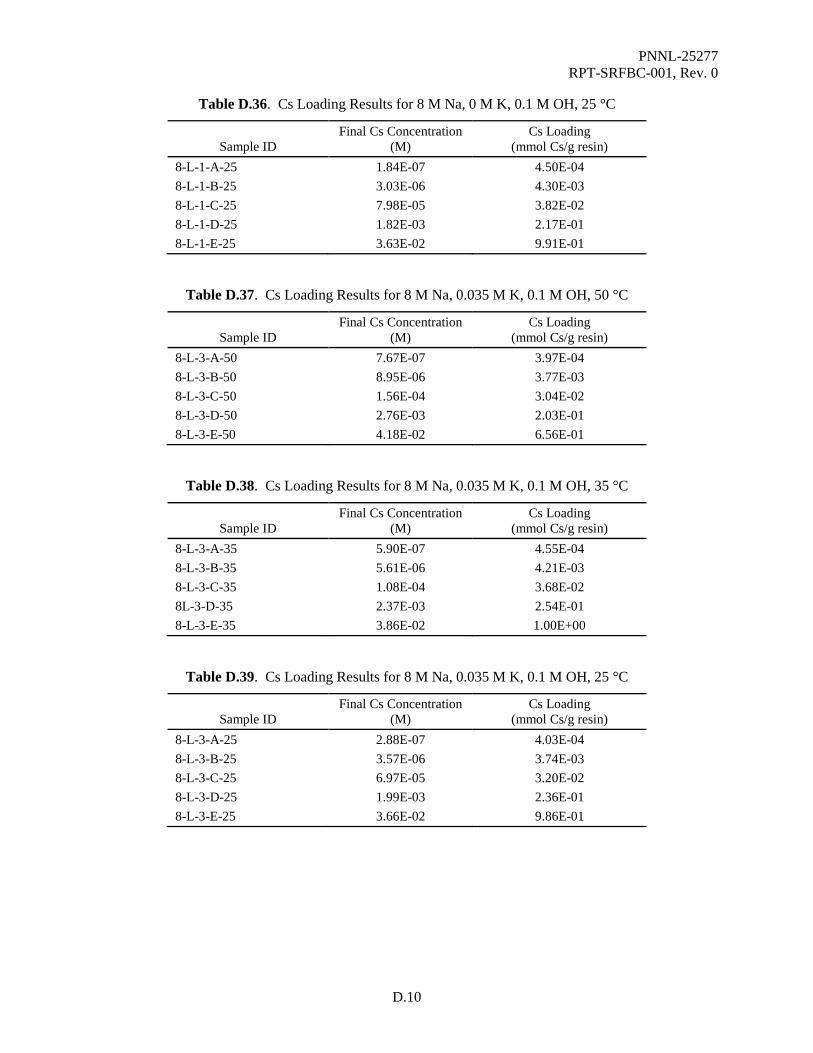
PNNL-25277 RPT-SRFBC-001, Rev. 0
D.10
Table D.36. Cs Loading Results for 8 M Na, 0 M K, 0.1 M OH, 25 °C
Sample ID Final Cs Concentration
(M) Cs Loading
(mmol Cs/g resin) 8-L-1-A-25 1.84E-07 4.50E-04 8-L-1-B-25 3.03E-06 4.30E-03 8-L-1-C-25 7.98E-05 3.82E-02 8-L-1-D-25 1.82E-03 2.17E-01 8-L-1-E-25 3.63E-02 9.91E-01
Table D.37. Cs Loading Results for 8 M Na, 0.035 M K, 0.1 M OH, 50 °C
Sample ID Final Cs Concentration
(M) Cs Loading
(mmol Cs/g resin) 8-L-3-A-50 7.67E-07 3.97E-04 8-L-3-B-50 8.95E-06 3.77E-03 8-L-3-C-50 1.56E-04 3.04E-02 8-L-3-D-50 2.76E-03 2.03E-01 8-L-3-E-50 4.18E-02 6.56E-01
Table D.38. Cs Loading Results for 8 M Na, 0.035 M K, 0.1 M OH, 35 °C
Sample ID Final Cs Concentration
(M) Cs Loading
(mmol Cs/g resin) 8-L-3-A-35 5.90E-07 4.55E-04 8-L-3-B-35 5.61E-06 4.21E-03 8-L-3-C-35 1.08E-04 3.68E-02 8L-3-D-35 2.37E-03 2.54E-01 8-L-3-E-35 3.86E-02 1.00E+00
Table D.39. Cs Loading Results for 8 M Na, 0.035 M K, 0.1 M OH, 25 °C
Sample ID Final Cs Concentration
(M) Cs Loading
(mmol Cs/g resin) 8-L-3-A-25 2.88E-07 4.03E-04 8-L-3-B-25 3.57E-06 3.74E-03 8-L-3-C-25 6.97E-05 3.20E-02 8-L-3-D-25 1.99E-03 2.36E-01 8-L-3-E-25 3.66E-02 9.86E-01
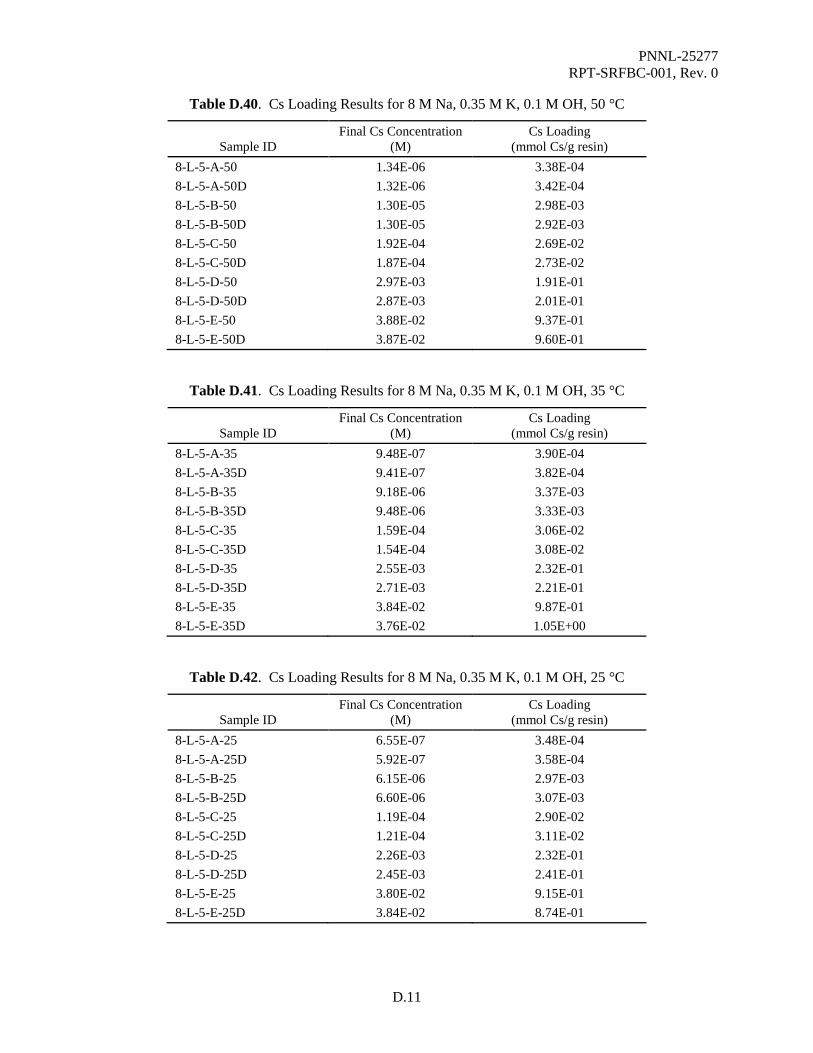
PNNL-25277 RPT-SRFBC-001, Rev. 0
D.11
Table D.40. Cs Loading Results for 8 M Na, 0.35 M K, 0.1 M OH, 50 °C
Sample ID Final Cs Concentration
(M) Cs Loading
(mmol Cs/g resin) 8-L-5-A-50 1.34E-06 3.38E-04 8-L-5-A-50D 1.32E-06 3.42E-04 8-L-5-B-50 1.30E-05 2.98E-03 8-L-5-B-50D 1.30E-05 2.92E-03 8-L-5-C-50 1.92E-04 2.69E-02 8-L-5-C-50D 1.87E-04 2.73E-02 8-L-5-D-50 2.97E-03 1.91E-01 8-L-5-D-50D 2.87E-03 2.01E-01 8-L-5-E-50 3.88E-02 9.37E-01 8-L-5-E-50D 3.87E-02 9.60E-01
Table D.41. Cs Loading Results for 8 M Na, 0.35 M K, 0.1 M OH, 35 °C
Sample ID Final Cs Concentration
(M) Cs Loading
(mmol Cs/g resin) 8-L-5-A-35 9.48E-07 3.90E-04 8-L-5-A-35D 9.41E-07 3.82E-04 8-L-5-B-35 9.18E-06 3.37E-03 8-L-5-B-35D 9.48E-06 3.33E-03 8-L-5-C-35 1.59E-04 3.06E-02 8-L-5-C-35D 1.54E-04 3.08E-02 8-L-5-D-35 2.55E-03 2.32E-01 8-L-5-D-35D 2.71E-03 2.21E-01 8-L-5-E-35 3.84E-02 9.87E-01 8-L-5-E-35D 3.76E-02 1.05E+00
Table D.42. Cs Loading Results for 8 M Na, 0.35 M K, 0.1 M OH, 25 °C
Sample ID Final Cs Concentration
(M) Cs Loading
(mmol Cs/g resin) 8-L-5-A-25 6.55E-07 3.48E-04 8-L-5-A-25D 5.92E-07 3.58E-04 8-L-5-B-25 6.15E-06 2.97E-03 8-L-5-B-25D 6.60E-06 3.07E-03 8-L-5-C-25 1.19E-04 2.90E-02 8-L-5-C-25D 1.21E-04 3.11E-02 8-L-5-D-25 2.26E-03 2.32E-01 8-L-5-D-25D 2.45E-03 2.41E-01 8-L-5-E-25 3.80E-02 9.15E-01 8-L-5-E-25D 3.84E-02 8.74E-01

PNNL-25277 RPT-SRFBC-001, Rev. 0
D.12
Table D.43. Cs Loading Results for 8 M Na, 0.50 M K, 0.1 M OH, 50 °C
Sample ID Final Cs Concentration
(M) Cs Loading
(mmol Cs/g resin) 8-L-6-A-50 1.64E-06 3.31E-04 8-L-6-B-50 1.53E-05 2.94E-03 8-L-6-C-50 2.02E-04 2.53E-02 8-L-6-D-50 2.97E-03 1.84E-01 8-L-6-E-50 3.93E-02 8.18E-01
Table D.44. Cs Loading Results for 8 M Na, 0.50 M K, 0.1 M OH, 35 °C
Sample ID Final Cs Concentration
(M) Cs Loading
(mmol Cs/g resin) 8-L-6-A-35 1.32E-06 3.51E-04 8-L-6-B-35 1.17E-05 3.15E-03 8-L-6-C-35 1.52E-04 2.86E-02 8-L-6-D-35 2.67E-03 2.05E-01 8-L-6-E-35 3.86E-02 8.37E-01
Table D.45. Cs Loading Results for 8 M Na, 0.50 M K, 0.1 M OH, 25 °C
Sample ID Final Cs Concentration
(M) Cs Loading
(mmol Cs/g resin) 8-L-6-A-25 9.89E-07 3.95E-04 8-L-6-B-25 9.71E-06 3.49E-03 8-L-6-C-25 1.53E-04 2.97E-02 8-L-6-D-25 2.67E-03 2.13E-01 8-L-6-E-25 4.03E-02 7.39E-01
Table D.46. Cs Loading Results for 8 M Na, 0 M K, 1.0 M OH, 50 °C
Sample ID Final Cs Concentration
(M) Cs Loading
(mmol Cs/g resin) 8-H-1-A-50 3.92E-07 4.37E-04 8-H-1-B-50 5.01E-06 3.91E-03 8-H-1-C-50 1.08E-04 3.47E-02 8-H-1-D-50 2.37E-03 2.34E-01 8-H-1-E-50 3.80E-02 9.83E-01

PNNL-25277 RPT-SRFBC-001, Rev. 0
D.13
Table D.47. Cs Loading Results for 8 M Na, 0 M K, 1.0 M OH, 35 °C
Sample ID Final Cs Concentration
(M) Cs Loading
(mmol Cs/g resin) 8-H-1-A-35 1.81E-07 4.79E-04 8-H-1-B-35 3.17E-06 4.40E-03 8-H-1-C-35 7.16E-05 4.00E-02 8-H-1-D-35 2.06E-03 2.78E-01 8-H-1-E-35 3.64E-02 1.19E+00
Table D.48. Cs Loading Results for 8 M Na, 0 M K, 1.0 M OH, 25 °C
Sample ID Final Cs Concentration
(M) Cs Loading
(mmol Cs/g resin) 8-H-1-A-25 1.19E-07 4.45E-04 8-H-1-B-25 1.56E-06 3.70E-03 8-H-1-C-25 5.12E-05 3.69E-02 8-H-1-D-25 1.56E-03 2.78E-01 8-H-1-E-25 3.42E-02 1.27E+00
Table D.49. Cs Loading Results for 8 M Na, 0.035 M K, 1.0 M OH, 50 °C
Sample ID Final Cs Concentration
(M) Cs Loading
(mmol Cs/g resin) 8-H-3-A-50 6.21E-07 4.05E-04 8-H-3-B-50 7.10E-06 3.70E-03 8-H-3-C-50 1.23E-04 3.24E-02 8-H-3-D-50 2.44E-03 2.44E-01 8-H-3-E-50 3.93E-02 9.08E-01
Table D.50. Cs Loading Results for 8 M Na, 0.035 M K, 1.0 M OH, 35 °C
Sample ID Final Cs Concentration
(M) Cs Loading
(mmol Cs/g resin) 8-H-3-A-35 3.86E-07 4.40E-04 8-H-3-B-35 4.97E-06 4.15E-03 8-H-3-C-35 8.58E-05 3.81E-02 8-H-3-D-35 2.02E-03 2.90E-01 8-H-3-E-35 3.71E-02 1.16E+00
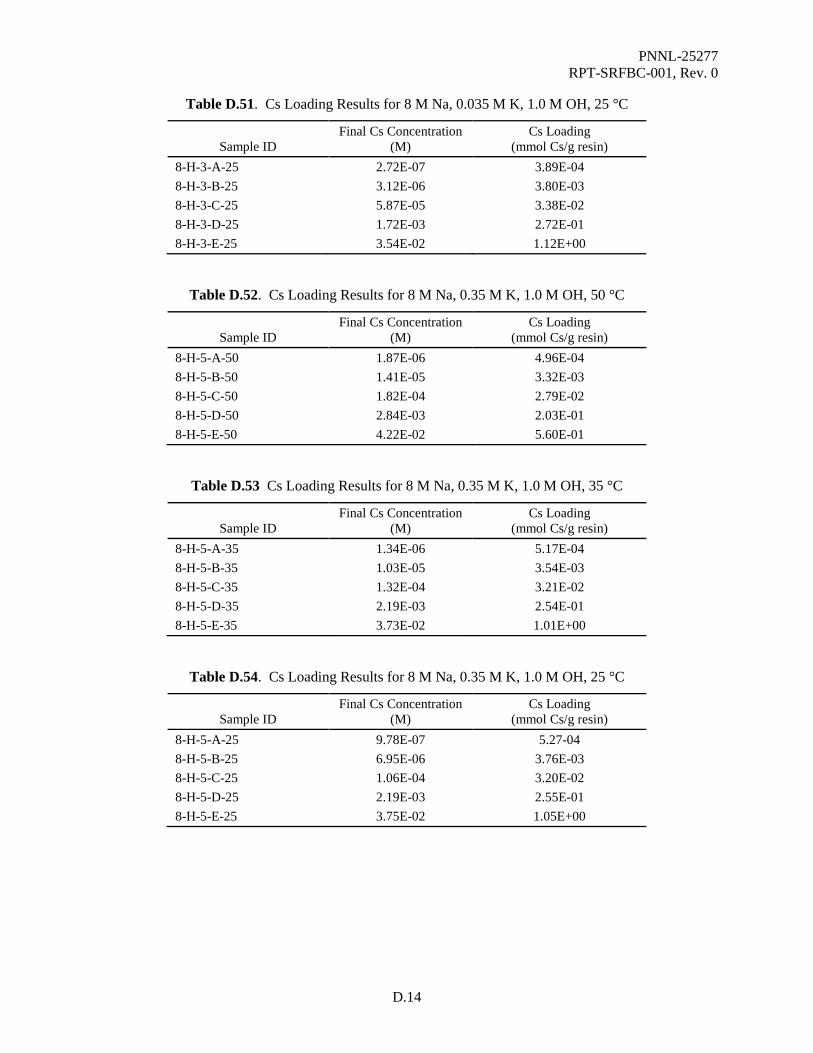
PNNL-25277 RPT-SRFBC-001, Rev. 0
D.14
Table D.51. Cs Loading Results for 8 M Na, 0.035 M K, 1.0 M OH, 25 °C
Sample ID Final Cs Concentration
(M) Cs Loading
(mmol Cs/g resin) 8-H-3-A-25 2.72E-07 3.89E-04 8-H-3-B-25 3.12E-06 3.80E-03 8-H-3-C-25 5.87E-05 3.38E-02 8-H-3-D-25 1.72E-03 2.72E-01 8-H-3-E-25 3.54E-02 1.12E+00
Table D.52. Cs Loading Results for 8 M Na, 0.35 M K, 1.0 M OH, 50 °C
Sample ID Final Cs Concentration
(M) Cs Loading
(mmol Cs/g resin) 8-H-5-A-50 1.87E-06 4.96E-04 8-H-5-B-50 1.41E-05 3.32E-03 8-H-5-C-50 1.82E-04 2.79E-02 8-H-5-D-50 2.84E-03 2.03E-01 8-H-5-E-50 4.22E-02 5.60E-01
Table D.53 Cs Loading Results for 8 M Na, 0.35 M K, 1.0 M OH, 35 °C
Sample ID Final Cs Concentration
(M) Cs Loading
(mmol Cs/g resin) 8-H-5-A-35 1.34E-06 5.17E-04 8-H-5-B-35 1.03E-05 3.54E-03 8-H-5-C-35 1.32E-04 3.21E-02 8-H-5-D-35 2.19E-03 2.54E-01 8-H-5-E-35 3.73E-02 1.01E+00
Table D.54. Cs Loading Results for 8 M Na, 0.35 M K, 1.0 M OH, 25 °C
Sample ID Final Cs Concentration
(M) Cs Loading
(mmol Cs/g resin) 8-H-5-A-25 9.78E-07 5.27-04 8-H-5-B-25 6.95E-06 3.76E-03 8-H-5-C-25 1.06E-04 3.20E-02 8-H-5-D-25 2.19E-03 2.55E-01 8-H-5-E-25 3.75E-02 1.05E+00

PNNL-25277 RPT-SRFBC-001, Rev. 0
D.15
Table D.55. Cs Loading Results for 8 M Na, 0.50 M K, 1.0 M OH, 50 °C
Sample ID Final Cs Concentration
(M) Cs Loading
(mmol Cs/g resin) 8-H-6-A-50 1.52E-06 2.90E-04 8-H-6-A-50D 1.44E-06 3.04E-04 8-H-6-B-50 1.63E-05 2.85E-03 8-H-6-B-50D 1.47E-05 2.88E-03 8-H-6-C-50 1.92E-04 2.69E-02 8-H-6-C-50D 1.95E-04 2.62E-02 8-H-6-D-50 2.73E-03 2.18E-01 8-H-6-D-50D 2.83E-03 2.05E-01 8-H-6-E-50 4.04E-02 7.41E-01 8-H-6-E-50D 4.02E-02 7.78E-01
Table D.56. Cs Loading Results for 8 M Na, 0.50 M K, 1.0 M OH, 35 °C
Sample ID Final Cs Concentration
(M) Cs Loading
(mmol Cs/g resin) 8-H-6-A-35 9.78E-07 3.22E-04 8-H-6-A-35D 1.01E-06 3.24E-04 8-H-6-B-35 1.16E-05 3.30E-03 8-H-6-B-35D 1.14E-05 3.19E-03 8-H-6-C-35 1.50E-04 3.18E-02 8-H-6-C-35D 1.56E-04 3.10E-02 8-H-6-D-35 2.46E-03 2.40E-01 8-H-6-D-35D 2.50E-03 2.32E-01 8-H-6-E-35 3.67E-02 1.05E+00 8-H-6-E-35D 3.66E-02 1.05E+00
Table D.57. Cs Loading Results for 8 M Na, 0.50 M K, 1.0 M OH, 25 °C
Sample ID Final Cs Concentration
(M) Cs Loading
(mmol Cs/g resin) 8-H-6-A-25 9.03E-07 3.54E-04 8-H-6-A-25D 7.98E-07 3.65E-04 8-H-6-B-25 8.95E-06 3.55E-03 8-H-6-B-25D 9.56E-06 3.54E-03 8-H-6-C-25 1.32E-04 3.25E-02 8-H-6-C-25D 1.32E-04 3.28E-02 8-H-6-D-25 2.51E-03 2.42E-01 8-H-6-D-25D 2.42E-03 2.43E-01 8-H-6-E-25 3.79E-02 9.80E-01 8-H-6-E-25D 3.81E-02 9.89E-01

PNNL-25277 RPT-SRFBC-001
Distribution
PDF PDF Copies Copies
Distr.1
8 Washington River Protection Solutions Richland, Washington 99354 Kevin E Ard
Rob Carter Paul A Cavanah Matt R Landon Jacob G Reynolds Rose M Russell Karen M Sanders Karthik H Subramanian
1 Office of River Protection Richland, Washington 99354 Sahid C Smith
7 Battelle, Pacific Northwest National Laboratory Richland, Washington 99354 Garrett Brown Clark D Carlson Heather Colburn Sandra Fiskum Renee Russell Margaret Smoot Project 68072 File


