fire safety tests for cesium-loaded spherical resorcinol ...€¦ · fire safety tests for...
TRANSCRIPT

PNNL-21490 WTP-RPT-220, Rev 0
Prepared for the U.S. Department of Energy under Contract DE-AC05-76RL01830
Fire Safety Tests for Cesium-Loaded Spherical Resorcinol Formaldehyde Resin: Data Summary Report D Kim MJ Schweiger RA Peterson September 2012


PNNL-21490 WTP-RPT-220, Rev 0
Fire Safety Tests for Cesium-Loaded Spherical Resorcinol Formaldehyde Resin: Data Summary Report D Kim MJ Schweiger RA Peterson September 2012 Test Specification: 24590 PTF-TSP-RT-09-002, Rev. 0 Test Plan: TP-WTPSP-002, Rev. 3.0 Test Exceptions: 24590-PTF-TEF-RT-11-00004, Rev. 0 R&T Focus Area: Pretreatment Test Scoping Statement: None Prepared for the U.S. Department of Energy Under Contract DE-AC05-76RL01830
Pacific Northwest National Laboratory Richland, Washington 99352


iii
Testing Summary
A preliminary safety evaluation of the scenario for spherical resorcinol formaldehyde (SRF) resin fire inside the ion exchange column was performed by the Hanford Tank Waste Treatment and Immobilization Plant (WTP) Fire Safety organization. The result of this evaluation suggested a potential change of the fire safety classification for the Cesium Ion Exchange Process System (CXP) emergency elution vessels, equipment, and piping. To resolve this question, the fire properties of the SRF resin were measured by Southwest Research Institute (SwRI) through a subcontract managed by Pacific Northwest National Laboratory (PNNL).
The results of initial fire safety tests on the SRF resin were documented in a previous report (PNNL-21321). The present report summarizes the results of additional tests performed by SwRI on the cesium-loaded SRF resin. The efforts by PNNL were limited to summarizing the test results provided by SwRI into one consolidated data report. The as-received SwRI report is attached to this report in the Appendix A. Where applicable, the precision and bias of each test method, as given by each American Society for Testing and Materials (ASTM) standard procedure, are included and compared with the SwRI test results of the cesium-loaded SRF resin.
Objectives
The objectives for the fire safety tests were:
to measure the thermal conductivity and heat capacity for sodium-form SRF resin,
to perform thermo-gravimetric analysis (TGA) with mass spectrometry of the nonradioactive cesium spiked resin offgas up to the auto ignition temperature and determine constituents of the offgas, and
to repeat ignition test using resin loaded with nonradioactive cesium.
Table S.1 provides the objectives that applied to the SRF resin fire safety tests.
Test Exceptions
The test exception in Test Plan TP-WTPSP-002 Rev 3 that was applicable to this testing is presented in Table S.2.
Results and Performance Against Success Criteria
The success criteria for achieving the test objectives are discussed in Table S.3.

iv
Table S.1. Summary of Test Objectives and Results
Test Objective Objective
Met? Discussion
Measure the thermal conductivity and heat capacity for sodium-form SRF resin.
Yes
The thermal conductivity of the cesium-loaded SRF resin was measured in accordance with ASTM D5930-09 and ASTM D5334-08. The thermal conductivity (λ in W/[mK]) as a function of temperature (T in °C) between 22 and 90°C was expressed by
0.000273 0.0769T . The specific heat capacity of the cesium-loaded SRF resin was measured by differential scanning calorimetry (DSC) in accordance with ASTM E1269-11. The average specific heat capacity ranged from 1.434 J/(gK) at 40°C to 2.001 J/(gK) at 90°C.
Perform TGA with mass spectrometry of the nonradioactive cesium spiked resin offgas up to the auto ignition temperature and determine constituents.
Partially Yes
From the TGA combined with DSC analysis, an endothermic transition near 102°C appeared with a total weight loss of approximately 25%. Small exothermic transitions occurred around 387°C and 619°C with a large exothermic transition near 864°C with corresponding weight losses of approximately 30%, 5%, and 20%, respectively. Because SwRI did not have a TGA setup with mass spectrometer, the sample was run with TGA setup integrated with Fourier transform infrared (FTIR) for offgas analyses. The result of FTIR analyses showed that the weight loss peak at 102°C was linked to H2O while all other peaks at higher temperature were linked to CO2 gas.
Repeat ignition test using resin loaded with nonradioactive cesium.
Yes
The flash ignition temperature (FIT) and spontaneous ignition temperature (SIT) of the cesium-loaded SRF resin were determined in accordance with ASTM D1929-96. The average values of FIT and SIT from duplicate tests were 555°C and 610°C, respectively. The FIT is 40°C lower than the previous result for the SRF resin without cesium and SIT is only 3°C lower, which is well below the repeatability limits of 11 to 31°C.
Table S.2. Test Exception
Test Exception Number Description of Test Exception
24590-PTF-TEF-RT-11-00004, Rev 0 This test exception was issued by Bechtel National, Inc. (BNI) on December 21, 2011. This test exception incorporates the approved Request for Technology Development (RTD), 24590-WTP-RTD-RT-11-0008_Rev_000, which requests data on thermal conductivity, heat capacity, and thermal analysis of the SRF resin and repeat of the ignition tests using the cesium-loaded SRF resin.

v
Table S.3. Success Criteria for Achieving Test Objectives
List Success Criteria Explain How the Tests Did or Did Not
Meet the Success Criteria
1. Provide test results for thermal conductivity and heat capacity measurements of sodium-form SRF resin.
This success criterion was met. The thermal conductivity (λ in W/[mK]) of the cesium-loaded SRF resin as a function of temperature (T in °C) between 22 and 90°C was expressed by
0.000273 0.0769T . The average thermal conductivity was 0.083 W/(mK) at 25°C, 0.088 W/(mK) at 45°C, and 0.102 W/(mK) at 90°C. The average specific heat capacity of the cesium-loaded SRF resin ranged from 1.434 J/(gK) at 40°C to 2.001 J/(gK) at 90°C.
2. Provide test results for TGA with mass spectrometry of the nonradioactive cesium spiked resin offgas up to the auto ignition temperature and the determined constituents.
This success criterion was partially met. From the TGA-DSC analysis, an endothermic transition near 102°C appeared with a total weight loss of approximately 25%. Small exothermic transitions occurred around 387°C and 619°C and a large exothermic transition near 864°C with corresponding weight losses of approximately 30%, 5%, and 20%, respectively. Because SwRI did not have a TGA setup with mass spectrometer, the sample was run with TGA-FTIR setup for offgas analyses. The result of FTIR analyses showed that the weight loss peak at 102°C was linked to H2O while all other peaks at higher temperature were linked to CO2 gas.
3. Provide test results for the spontaneous ignition temperature using resin loaded with nonradioactive cesium.
This success criterion was met. For the cesium-loaded SRF resin, the FIT was 555°C, and SIT was 610°C.
Quality Requirements
The PNNL Quality Assurance (QA) Program is based on the requirements defined in U.S. Department of Energy Order 414.1D, Quality Assurance, and 10 CFR 830, Energy/Nuclear Safety Management, Subpart A – Quality Assurance Requirements (a.k.a. the Quality Rule). PNNL has chosen to implement the following consensus standards in a graded approach:
ASME NQA-1-2000, Quality Assurance Requirements for Nuclear Facility Applications, Part I, Requirements for Quality Assurance Programs for Nuclear Facilities
ASME NQA-1-2000, Part II, Subpart 2.7, Quality Assurance Requirements for Computer Software for Nuclear Facility Applications
ASME NQA-1-2000, Part IV, Subpart 4.2, Graded Approach Application of Quality Assurance Requirements for Research and Development.
The Waste Treatment Plant Support Project (WTPSP) implements an NQA-1-2000 Quality Assurance Program, graded on the approach presented in NQA-1-2000, Part IV, Subpart 4.2. The WTPSP Quality Assurance Manual (QA-WTPSP-0002) describes the technology life-cycle stages under the WTPSP Quality Assurance Plan (QA-WTPSP-0001). The technology life cycle includes the progression of technology development, commercialization, and retirement in process phases of basic and applied research and development (R&D), engineering and production, and operation until process completion. The life cycle is characterized by flexible and informal quality assurance activities in basic research that become more structured and formalized through the applied R&D stages.

vi
The work described in this report has been completed under the QA technology level of Applied Research. The WTPSP addresses internal verification and validation activities by conducting an independent technical review of the final data report in accordance with WTPSP procedure QA-WTPSP-601, Document Preparation and Change. This review verifies that the reported results are traceable, that inferences and conclusions are soundly based, and that the reported work satisfies the test plan objectives.
The Southwest Research Institute, who performed the tests described in this report, is listed on the PNNL Approved Suppliers List.
Test Conditions
This report summarizes the fire test results performed by SwRI and submitted to PNNL.
All test conditions delineated by the test plan and test exceptions were met. A summary of test conditions is provided in Table S.4.
Simulant Use
Simulant was not developed for the tests summarized in this report. The SRF resin was manufactured by Microbeads AS, a Norwegian company (www.micro-beads.com), and shipped in an approximately100-L steel drum. WTP provided the entire drum to PNNL. About 20 L of the resin were shipped to SwRI in a 20-L carboy. The SRF resin was loaded with cesium by SwRI according to the procedure supplied by PNNL.
Table S.4. Test-Condition Summary
Test Conditions Were Test Conditions Followed?
1. The ignition temperature of the resin loaded with non-radioactive cesium will be determined along with the thermal conductivity and heat capacity of the resin in sodium-form. A TGA with mass spectrometry of the resin offgas up to the auto ignition temperature will also be performed and the constituents determined.
The FIT and SIT were determined in accordance with ASTM D1929-96, the thermal conductivity was measured in accordance with ASTM D5930-09 and ASTM D5334-08, and the specific heat capacity was measured by DSC in accordance with ASTM E1269-11. A TGA-DSC was performed along with FTIR to determine the gaseous constituents.
Discrepancies and Follow-On Tests
No discrepancies were observed.

vii
Acknowledgments
The authors thank the Southwest Research Institute (Eugene Horton and Radonna Spies, San Antonio, Texas) for test support. The authors also thank Jennifer Meehan and David Sherwood of the Hanford Tank Waste Treatment and Immobilization Plant project for their technical insights and much helpful discussion and support. The authors are grateful for the assistance of Renee Russell for her technical review. In addition, the authors thank Casey D. Emery, PNNL Contracts Department, for his diligent effort in negotiating this contract.


ix
Acronyms and Abbreviations
ASTM American Society for Testing and Materials
BNI Bechtel National, Inc.
CXP Cesium Ion Exchange Process System
DOE U.S. Department of Energy
DSC differential scanning calorimetry
FIT flash ignition temperature
FTIR Fourier transform infrared
GGRF ground gel resorcinol formaldehyde
NIST National Institute of Standards and Technology
NSSP non-steady-state probe
ORP Office of River Protection
PMMA poly methyl methacrylate
PNNL Pacific Northwest National Laboratory
PTF Pretreatment Facility
QA quality assurance
R&D research and development
R&T research and technology
RF resorcinol formaldehyde
RTD request for technology development
SIT spontaneous ignition temperature
SRF spherical resorcinol formaldehyde
SwRI Southwest Research Institute
TGA thermo-gravimetric analysis
WTP Hanford Tank Waste Treatment and Immobilization Plant
WTPSP Waste Treatment Plant Support Project

x
Symbols
C calibration constant
I current flowing through heater wire
L length of heated needle
Q heat input per unit length of heater
r repeatability limit
R reproducibility limit
RW total resistance of heater wire
S slop obtained from temperature versus ln(t) or ln[1/(t - t1)]
t time from the beginning of heating
t1 heating time
T temperature
ΔT temperature rise from time zero
λ thermal conductivity

xi
Contents
Testing Summary ......................................................................................................................................... iii
Acknowledgments ....................................................................................................................................... vii
Acronyms and Abbreviations ...................................................................................................................... ix
Symbols ........................................................................................................................................................ x
1.0 Introduction ....................................................................................................................................... 1.1
2.0 Quality Assurance .............................................................................................................................. 2.1
3.0 Experimental ...................................................................................................................................... 3.1
3.1 Sample Preparation ................................................................................................................... 3.1
3.2 Flash Ignition Temperature and Spontaneous Ignition Temperature Using Hot-Air Furnace ...................................................................................................................................... 3.1
3.3 Thermal Conductivity ............................................................................................................... 3.2
3.4 Specific Heat Capacity .............................................................................................................. 3.3
3.5 DSC-TGA-FTIR........................................................................................................................ 3.4
4.0 Results ............................................................................................................................................... 4.1
4.1 Flash Ignition Temperature and Spontaneous Ignition Temperature ........................................ 4.1
4.2 Thermal Conductivity Results ................................................................................................... 4.2
4.3 Specific Heat Capacity Results ................................................................................................. 4.3
4.4 DSC-TGA-FTIR Results ........................................................................................................... 4.5
5.0 Summary ............................................................................................................................................ 5.1
6.0 References ......................................................................................................................................... 6.1
Appendix A: SwRI Report ....................................................................................................................... A.1
Appendix B: Cesium Loading Procedure .................................................................................................B.1

xii
Figures
3.1. Schematic of Southwest Research Institute Hot-Air Furnace .......................................................... 3.2
4.1. Thermal Conductivity as a Function of Temperature ...................................................................... 4.3
4.2. Specific Heat Capacity as a Function of Temperature ..................................................................... 4.5
4.3. Weight Change from TGA and Heat Flow from DSC of the Cesium-Loaded SRF Resin .............. 4.6
4.4. Weight Change and Its Derivative from TGA of the Cesium-Loaded SRF Resin .......................... 4.6
4.5. Overlay of Weight Change, Its Derivative, and Heat Flow ............................................................. 4.7
4.6. Gram-Schmidt Reconstruction for FTIR of the Cesium-Loaded SRF Resin ................................... 4.8
4.7. DSC-TGA in N2 for the Cesium-Loaded SRF Resin ....................................................................... 4.9
4.8. Comparison of DSC-TGA Curves in Air and N2 for the Cesium-Loaded SRF Resin ..................... 4.9
Tables
3.1. Standard Procedures Used by Southwest Research Institute ........................................................... 3.4
4.1. Flash Ignition Temperature and Spontaneous Ignition Temperature of Cesium-Loaded SRF Resin ........................................................................................................................................ 4.2
4.2. Thermal Conductivity with Temperature ......................................................................................... 4.2
4.3. Specific Heat Capacity Test Results of SRF Resin .......................................................................... 4.4
4.4. Summary of FTIR Analysis Results on the Cesium-Loaded SRF Resin ......................................... 4.8

1.1
1.0 Introduction
Ion exchange using the spherical resorcinol formaldehyde (SRF) resin has been selected by Bechtel National, Inc. (BNI) and approved by the U.S. Department of Energy (DOE) Office of River Protection (ORP) for use in the Pretreatment Facility (PTF) of the Hanford Tank Waste Treatment and Immobilization Plant (WTP). SRF is an engineered spherical form of the older ground gel resorcinol formaldehyde (GGRF) resin, also termed resorcinol formaldehyde (RF).
A draft safety evaluation of the scenario for resin fire inside the ion exchange column was performed by the WTP Fire Safety organization. The result of this draft evaluation suggested a potential change of the fire safety classification for the Cesium Ion Exchange Process System (CXP) emergency elution vessels, equipment, and piping. To help resolve this question, the fire properties of the SRF resin were measured by Southwest Research Institute (SwRI), following the American Society for Testing and Materials (ASTM) standard procedures, through a subcontract managed by Pacific Northwest National Laboratory (PNNL). The results of initial fire safety tests on the SRF resin were documented in a previous report (PNNL-21321). The present report summarizes the results of additional tests performed by SwRI on the cesium-loaded SRF resin.
Section 2.0 details the basis of the PNNL Quality Assurance (QA) Program as applied to the WTP quality requirements. Section 3.0 describes the test methods and ASTM standard procedures used in this testing. Section 4.0 summarizes the results of the experimental tests performed by SwRI. Section 5.0 provides a summary of all test results. Section 6.0 provides a list of pertinent references. An as-received SwRI report is included in the Appendix A.


2.1
2.0 Quality Assurance
The PNNL QA Program is based on the requirements defined in U.S. Department of Energy Order 414.1D, Quality Assurance, and 10 CFR 830, Energy/Nuclear Safety Management, Subpart A – Quality Assurance Requirements (a.k.a. the Quality Rule). PNNL has chosen to implement the following consensus standards in a graded approach:
ASME NQA-1-2000, Quality Assurance Requirements for Nuclear Facility Applications, Part I, Requirements for Quality Assurance Programs for Nuclear Facilities.
ASME NQA-1-2000, Part II, Subpart 2.7, Quality Assurance Requirements for Computer Software for Nuclear Facility Applications.
ASME NQA-1-2000, Part IV, Subpart 4.2, Graded Approach Application of Quality Assurance Requirements for Research and Development.
The Waste Treatment Plant Support Project (WTPSP) implements an NQA-1-2000 Quality Assurance Program, graded on the approach presented in NQA-1-2000, Part IV, Subpart 4.2. The WTPSP Quality Assurance Manual (QA-WTPSP-0002) describes the technology life-cycle stages under the WTPSP Quality Assurance Plan (QA-WTPSP-0001). The technology life cycle includes the progression of technology development, commercialization, and retirement in process phases of basic and applied research and development (R&D), engineering and production, and operation until process completion. The life cycle is characterized by flexible and informal quality assurance activities in basic research that become more structured and formalized through the applied R&D stages.
The work described in this report has been completed under the QA technology level of Applied Research. WTPSP addresses internal verification and validation activities by conducting an independent technical review of the final data report in accordance with WTPSP’s procedure QA-WTPSP-601, Document Preparation and Change. This review verifies that the reported results are traceable, that inferences and conclusions are soundly based, and that the reported work satisfies the test plan objectives.
The Southwest Research Institute, who performed the tests described in this report, is listed on the PNNL Approved Suppliers List.


3.1
3.0 Experimental
This section describes the test methods and procedures used by SwRI to perform various tests on the cesium-loaded SRF resin. Table 3.1, presented at the end of this section, summarizes the ASTM standard test procedures used by SwRI for this testing.
3.1 Sample Preparation
PNNL provided SwRI with one 20-L carboy of SRF resin that consisted of a micro bead resin material dispersed in water. The SRF resin was loaded with cesium according to the procedure supplied by PNNL (Appendix B). For all tests described in this report, the sample was filtered and then dried for 2 to 12 hr depending on the amount of material required for each test in an oven at 70°C prior to testing. This temperature was chosen not to over-dry the resin. The resin was constantly monitored to achieve a consistency in drying condition gauged by the color.
3.2 Flash Ignition Temperature and Spontaneous Ignition Temperature Using Hot-Air Furnace
The flash ignition temperature (FIT) and spontaneous ignition temperature (SIT) of the cesium-loaded SRF resin were determined using a hot-air furnace according to ASTM D1929-96, Standard Test Method for Determining Ignition Temperature. The hot-air ignition furnace consists primarily of an electrical heating unit and specimen holder. The furnace tube is a vertical tube with an inside diameter of 100 ± 5 mm and a length of 230 ± 20 mm, made of ceramic that will withstand at least 750°C. The inner ceramic tube, with an inside diameter of 75 ± 5 mm, a length of 230 ± 20 mm, and a thickness of approximately 3 mm, is placed inside the furnace tube and positioned 20 ± 2 mm above the furnace floor on spacer blocks. The pilot flame is located immediately above the opening. The test apparatus is shown in Figure 3.1.
The FIT is the minimum temperature at which, under specified test conditions, sufficient flammable gases are emitted to ignite momentarily upon application of a small external pilot flame. The lowest initial air temperature at which a flash is observed during a 10-min period is recorded as the FIT.
The SIT is the minimum temperature at which the self-heating properties of the specimen lead to ignition or ignition occurs spontaneously, under specified test conditions, in the absence of any additional flame ignition source. The lowest initial air temperature at which the specimen ignites during a 10-min period is recorded as the SIT.

3.2
Figure 3.1. Schematic of Southwest Research Institute Hot-Air Furnace
3.3 Thermal Conductivity
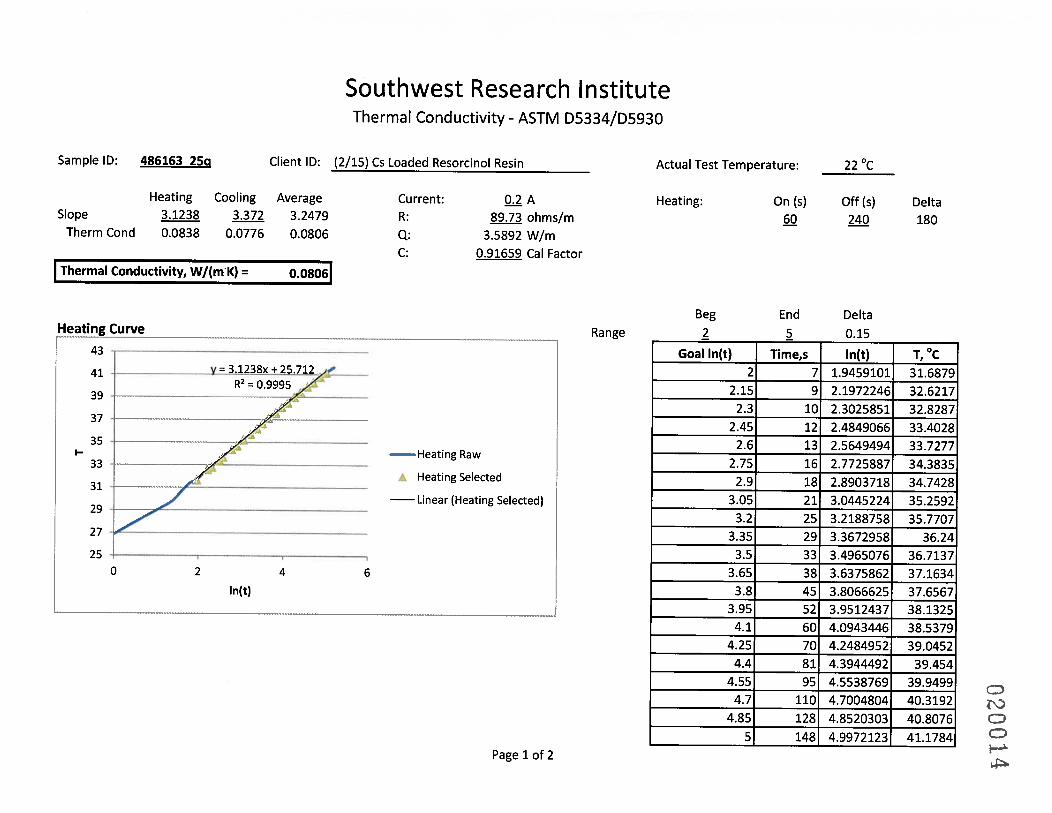
The thermal conductivity of the cesium-loaded SRF resin was measured using the method as described in ASTM D5930-09, Standard Test Method for Thermal Conductivity of Plastics by Means of a Transient Line-Source Technique and ASTM D5334-08, Standard Test Method for Thermal Conductivity of Soil and Soft Rock by Thermal Needle Probe Procedure. The Hukseflux TP02 Non-Steady-State Probe (NSSP) was used for the analysis. A Global Specialties 1305 Dual Output DC Power Supply (0-32V, 5A) was used to provide a constant current of 0.2A to the probe. Measurement Computing’s USB-TEMP with TracerDAQ® was utilized to acquire the time and temperature at 1 s intervals during the duration of the test. The test material was placed into a glass cylindrical vessel with a diameter of 55 mm and a length of 200 mm. The thermal conductivity probe was inserted into the material and temperature was monitored to ensure thermal equilibrium had been reached prior to beginning the test. The program was set up to monitor the stabilized temperature for 1 min prior to beginning the test. The time the power remained on (180 s) was the “heating phase”. Once the power was turned off, the temperature was acquired for an additional 6 min for the “cooling phase”.
The NSSP principle relies on a unique property of a line source. After a short transient period the temperature rise is given as:

3.3
1ln( ) 04
QT t t t
(1)
11
ln4
Q tT t t
t t
(2)
where ΔT is temperature rise from time zero (K), Q is heat input per unit length of heater (W/m), λ is thermal conductivity [W/(mK)], t is time from the beginning of heating (s), and t1 is heating time (s).
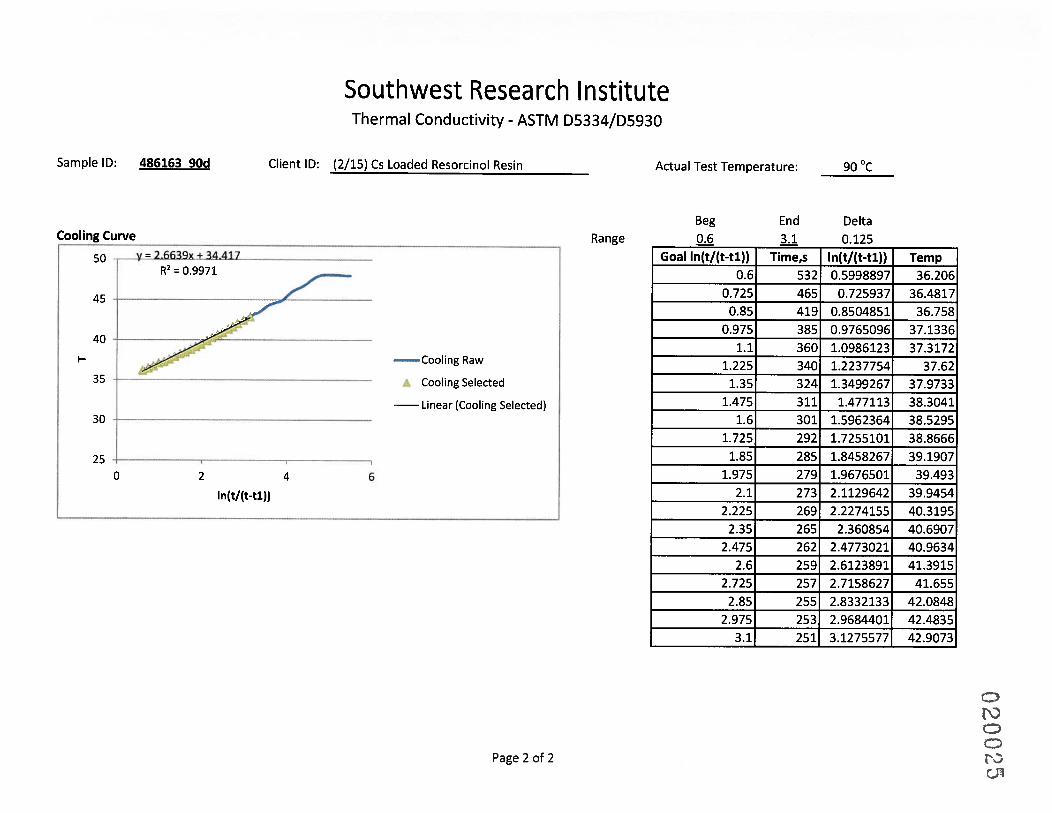
The thermal conductivity is calculated from the slope of the line representing the temperature versus ln(t) or ln[t /(t - t1)]. A graph was constructed for each set of data (heating and cooling). The early and late portions of the test were not used in the slope analysis. For the heating phase, the slope was calculated from the ln(t) range of 2 to 3, which corresponds to 7 to 148 s. For the cooling phase, the slope was calculated for the ln[t /(t - t1)] range of 0.5 to 3, which corresponds to 189 to 457 s. The thermal conductivity for the heating and cooling phases was calculated from the equations:
4
CQ
S
(3)
2
WI RQ
L (4)
where C is calibration constant and S is slope obtained from temperature versus ln(t) or ln[t /(t - t1)], I is current flowing through heater wire (A), RW is total resistance of heater wire, and L is length of heated needle (m). The final conductivity reported was calculated as the average of the heating and cooling phase thermal conductivities.
The thermal conductivity probe was calibrated before use with freshly prepared Agar water (2.5 g Agar and 500 mL deionized water). The calculated thermal conductivity differed slightly from Agar water’s published thermal conductivity of 0.607 W/(mK); therefore, the calibration factor, C, was 0.91659. Freshly purchased and opened glycerol was used for the calibration verifications. The thermal conductivity for the initial and final verifications was 100% of published value for glycerol.
3.4 Specific Heat Capacity
The specific heat capacity of the cesium-loaded SRF resin was measured by differential scanning calorimetry (DSC) in accordance with ASTM E1269-11, Standard Test Method for Determining Specific Heat Capacity by Differential Scanning Calorimetry. The test consists of heating the sample in a controlled atmosphere through a temperature region of interest. The difference in heat flow in the sample compared to a reference material and a blank pan are used to calculate the specific heat capacity.
Specific heat capacity measurement was performed using a Seiko DSC 210. The instrument was purged with 50 mL/min of nitrogen throughout the testing. For the DSC temperature program, the temperature was held isothermally at 25°C for 4 min; the temperature was then ramped at 20°C/min to 100°C and held for 5 min. The thermal curve was collected from each analytical run for sample,

3.4
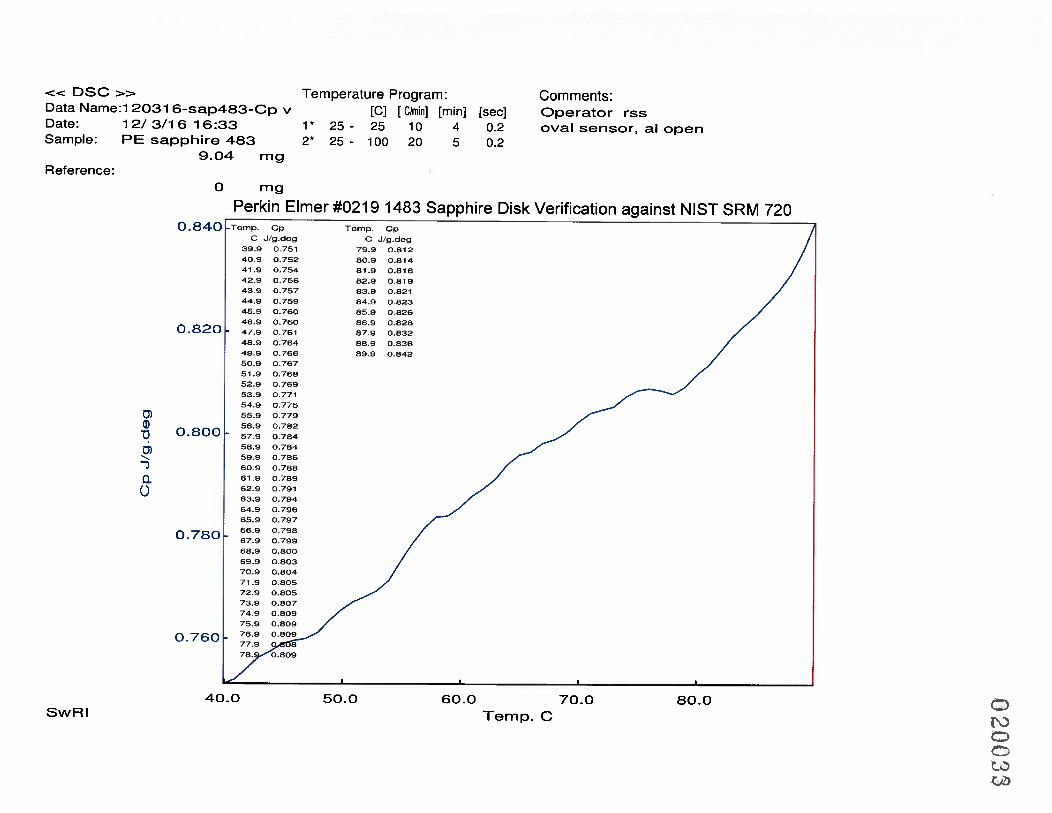
reference material, and blank pan. The thermal curve for the blank aluminum pan was collected to perform the blank subtraction. The DSC software performs the blank pan subtraction from samples and reference material automatically. The blank subtracted sample and reference material files were imported into the specific heat capacity calculation program. The program generated a specific heat capacity curve along with a table of specific heat capacities for the temperature range from 40°C to 90°C at 1°C interval for which sample heating rate was stable. Sapphire disk from the Perkin Elmer Specific Heat Kit (PN# 02190136) was used as the reference material. The instrument response was standardized against the Perkin Elmer sapphire disk and all sample results were reported using this standardization.
3.5 DSC-TGA-FTIR
Thermal and infrared analysis of the cesium-loaded SRF resin was performed using a TA Instruments Q600 SDT Simultaneous differential scanning calorimetry-thermo-gravimetric analysis (DSC-TGA) Heat Flow Analyzer and a Nicolet Magna-IR 560 Fourier Transform Infrared (FTIR) Analyzer. Two instruments were connected with a Nicolet TGA Interface. This allowed real time infrared analysis of the evolved gases from the thermal decomposition or volatilization of the sample.
DSC-TGA analysis was performed on a 14.39 mg sample placed in an alumina pan. The sample was heated from room temperature to 1000°C at a ramp rate of 20°C/min. An air purge flow rate of 60 mL/min was used to sweep the evolved gases through a heated transfer line (180°C) and then through the heated flow cell (225°C) of the TGA interface. The Nicolet Magna-IR 560 monitored the composition of the gas.
Table 3.1. Standard Procedures Used by Southwest Research Institute
Main Analysis/Property Test Equipment(s) Standard Procedures used by SwRI Flash ignition temperature and spontaneous ignition temperature
Hot-air ignition furnace
ASTM D1929-96, Standard Test Method for Determining Ignition Temperature of Plastics
Thermal conductivity [W/(mK)]
Non-steady-state probe with transient line-source technique
ASTM D5930-09, Standard Test Method for Thermal Conductivity of Plastics by Means of a Transient Line-Source Technique ASTM D5334-08, Standard Test Method for Thermal Conductivity of Soil and Soft Rock by Thermal Needle Probe Procedure
Specific heat capacity[J/(gK)]
Differential scanning calorimeter
ASTM E1269-11, Standard Test Method for Determining Specific Heat Capacity by Differential Scanning Calorimetry
Thermal and infrared analyses
Differential scanning calorimeter-thermo-gravimetric analyzer with Fourier transform Infrared analyzer
Not applicable

4.1
4.0 Results
The results of the cesium-loaded SRF resin fire tests reported by SwRI are summarized in this section. Where applicable, the precision and bias of each test method as given in each ASTM procedure are included. The precision and bias measures used in ASTM standards are defined as follows, per ASTM E177-10, Standard Practice for Use of the Terms Precision and Bias in ASTM Test Methods:
precision: the closeness of agreement between independent test results obtained under stipulated conditions
bias: the difference between the expectation of the test results and an accepted reference value repeatability: precision under repeatability conditions repeatability conditions: conditions where independent test results are obtained with the same
method on identical test items in the same laboratory by the same operator using the same equipment within short intervals of time
repeatability limit (r): the value below which the absolute difference between two individual test results obtained under repeatability conditions may be expected to occur with a probability of approximately 0.95 (95%)
reproducibility: precision under reproducibility conditions reproducibility conditions: conditions where test results are obtained with the same method on
identical test items in different laboratories with different operators using different equipment reproducibility limit (R): the value below which the absolute difference between two test results
obtained under reproducibility conditions may be expected to occur with a probability of approximately 0.95 (95%).
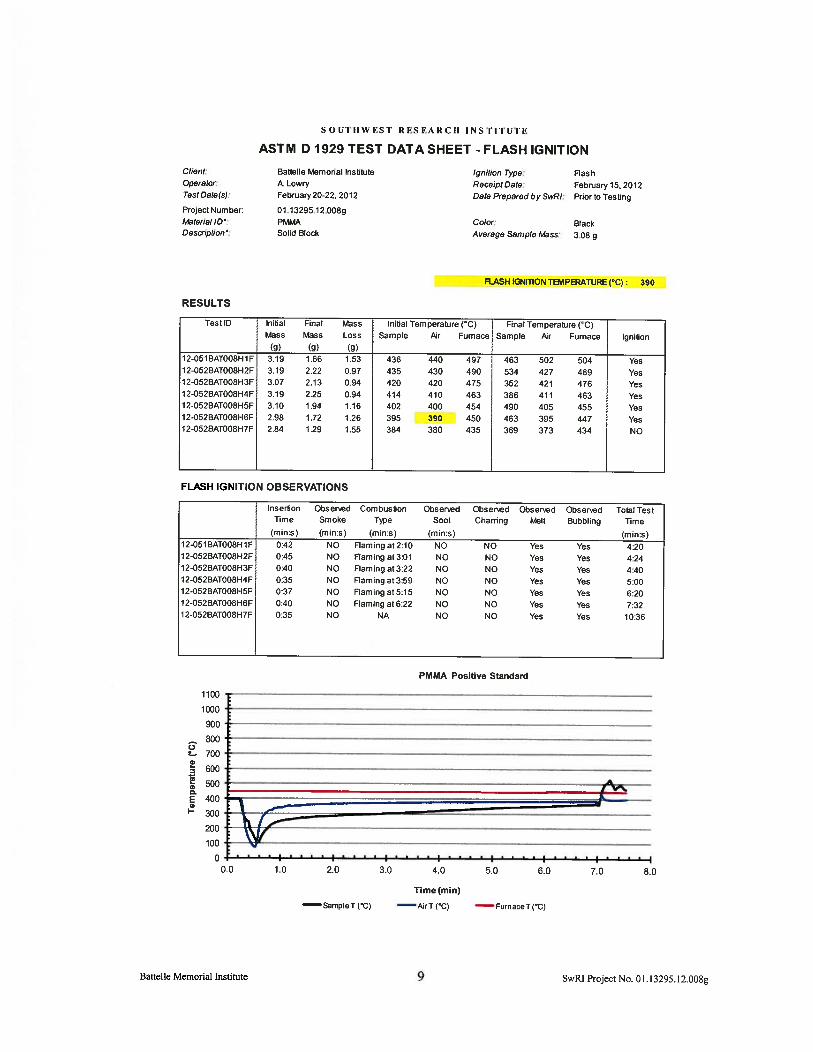
4.1 Flash Ignition Temperature and Spontaneous Ignition Temperature
The results of FIT and SIT measurements of the cesium-loaded SRF resin and negative and positive standards are summarized in Table 4.1. The negative test was performed on marinite, which is a non-combustible material and positive test was performed on poly methyl methacrylate (PMMA). Table 4.1 also includes the repeatability and reproducibility ranges determined from interlaboratory tests involving seven laboratories, on six polymeric materials, with triplicate tests of each material (ASTM D1929-96). The difference between two tests in this study is 0°C for SIT and 10°C for FIT, which is within the range of the repeatability limits for FIT (8 to 13°C). It should be noted that the ASTM precision estimate is for the difference between averages determined from triplicate tests, whereas the difference reported in this study is based on one test per each run. Information on bias of this test method is not available. It is noted that the FIT is 40°C lower than the previous results for the SRF resin without cesium although SIT is only 3°C lower, which is well below the repeatability limits of 11 to 31°C.

4.2
Table 4.1. Flash Ignition Temperature and Spontaneous Ignition Temperature of Cesium-Loaded SRF Resin
Property FIT (°C) SIT (°C)
Initial Run 550 610 Duplicate Run 560 610 Average 555 610 Difference 10 0
Precision estimates(a) r 8–13 11–31 R 27–117 47–103
Negative and positive standards Marinite (negative standard) No ignition No ignition PMMA (positive standard) 390 480 (a) Determined from interlaboratory tests involving seven laboratories on six
polymeric materials with triplicate tests (ASTM D1929-96).
4.2 Thermal Conductivity Results
Table 4.2 summarizes thermal conductivities of the cesium-loaded SRF resin measured at three temperatures with three measurements at a minimum at each temperature.
Table 4.2. Thermal Conductivity with Temperature
Temperature (°C)
Thermal Conductivity [W/(mK)]
Average Thermal Conductivity [W/(mK)]
22 0.0855 0.0834
22 0.0816
22 0.0860
22 0.0806
45 0.0872 0.0882
45 0.0899
45 0.0874
90 0.1010 0.1018
90 0.1021
90 0.1023
The thermal conductivity was plotted against temperature and a linear least-square fit was established as shown in Figure 4.1. The thermal conductivity at various temperatures between 22 and 90°C can be estimated from the following linear regression equation:
0.000273 0.0769 (22 C 90 C)T T (5)
where λ is thermal conductivity [W/(mK) ] and T is temperature (°C).
The results of an interlaboratory study involving this test method used for Ottawa sand and paraffin wax indicated a measurement precision of ± 10% and ± 15%, respectively, with a tendency to a positive bias (higher value) over the known values for the materials studied (ASTM D5334-08).

4.3
Figure 4.1. Thermal Conductivity as a Function of Temperature
4.3 Specific Heat Capacity Results
Table 4.3 summarizes the results of specific heat capacity measurements following the standard procedure ASTM E1269-11 for temperatures between 40°C and 90°C. Table 4.3 summarizes the results of duplicate tests and their average and Figure 4.2 shows the specific heat capacity as a function of temperature curves for duplicates tests and average.
The precision of the test method was determined from interlaboratory trials involving seven laboratories on three different solid materials (biphenyl ether, National Institute of Standards and Technology (NIST) linear polyethylene, and indium metal) over the temperature range from 40°C to 80°C. The relative repeatability limit was 6.2% and relative reproducibility limit was 8.4%. The relative difference from duplicate tests in this study ranged from 1.9% (at 40°C) to 3.7% (at 90°C), which is smaller than the relative repeatability limit of 6.2%.
The bias of the test method was obtained from the above mentioned interlaboratory study by comparing the mean specific heat capacity at 67°C to the literature value: the relative difference from the corresponding literature value was +0.95% for biphenyl ether, -1.1% for NIST linear polyethylene, and +0.8% or +1.8% for indium metal from two different references.

4.4
Table 4.3. Specific Heat Capacity Test Results of SRF Resin
T, C Specific Heat Capacity [J/(gK)]
T, C Specific Heat Capacity [J/(gK)]
1st run Duplicate Average 1st run Duplicate Average 40 1.420 1.447 1.434 66 1.643 1.688 1.666 41 1.432 1.459 1.446 67 1.653 1.699 1.676 42 1.442 1.469 1.456 68 1.664 1.712 1.688 43 1.450 1.478 1.464 69 1.675 1.724 1.700 44 1.459 1.486 1.473 70 1.687 1.736 1.712 45 1.468 1.495 1.482 71 1.699 1.748 1.724 46 1.477 1.505 1.491 72 1.713 1.763 1.738 47 1.487 1.516 1.502 73 1.727 1.780 1.754 48 1.494 1.525 1.510 74 1.741 1.794 1.768 49 1.501 1.532 1.517 75 1.755 1.809 1.782 50 1.509 1.541 1.525 76 1.770 1.826 1.798 51 1.515 1.549 1.532 77 1.787 1.845 1.816 52 1.523 1.560 1.542 78 1.804 1.864 1.834 53 1.531 1.569 1.550 79 1.818 1.879 1.849 54 1.538 1.576 1.557 80 1.830 1.893 1.862 55 1.545 1.585 1.565 81 1.844 1.908 1.876 56 1.554 1.594 1.574 82 1.858 1.923 1.891 57 1.562 1.603 1.583 83 1.871 1.938 1.905 58 1.569 1.609 1.589 84 1.885 1.953 1.919 59 1.577 1.616 1.597 85 1.898 1.968 1.933 60 1.585 1.624 1.605 86 1.912 1.984 1.948 61 1.595 1.634 1.615 87 1.926 1.998 1.962 62 1.604 1.644 1.624 88 1.941 2.013 1.977 63 1.615 1.655 1.635 89 1.954 2.026 1.990 64 1.624 1.666 1.645 90 1.965 2.037 2.001 65 1.633 1.676 1.655

4.5
Figure 4.2. Specific Heat Capacity as a Function of Temperature
4.4 DSC-TGA-FTIR Results
Figure 4.3 shows the thermal behavior of the sample as displayed with weight change and heat flow plotted as a function of temperature. From the DSC analysis, the heat flow curve shows an endothermic transition near 102°C. This endotherm corresponded to gradual weight loss between room temperature and roughly 300°C with a total weight loss of approximately 25%. Small exothermic transitions occur around 387°C and 619°C and a large exothermic transition takes place near 864°C. Each of these exotherms corresponded to weight losses of approximately 30%, 5%, and 20%, respectively.
Figure 4.4 displays the weight change curve with the derivative overlaid. In Figure 4.5 the weight change, its derivative, and the heat flow curves are overlaid. The derivative of weight change aids in distinguishing some subtle transitions as shown in Figure 4.5. The first weight loss peak at 91°C may be due to moisture. Major weight loss peaks occur at 356°C and 866°C. Other smaller peaks appear at 340, 365, 375, 614 and 624°C.

4.6
Figure 4.3. Weight Change from TGA and Heat Flow from DSC of the Cesium-Loaded SRF Resin
Figure 4.4. Weight Change and Its Derivative from TGA of the Cesium-Loaded SRF Resin

4.7
Figure 4.5. Overlay of Weight Change, Its Derivative, and Heat Flow
FTIR analysis utilized a Gram-Schmidt reconstruction to plot the change in infrared intensity as a function of time is shown in Figure 4.6. This was used to correlate infrared spectra with thermal events occurring during the temperature ramp on the TGA. The labeled peaks correspond closely with the derivative curve peaks shown in the TGA plots. Table 4.4 summarizes the FTIR analysis results produced by adding the data in a selected time range for the major peaks in Figure 4.6. The FTIR spectra collected from 2.95-3.89 min (84-103°C) show noisy H2O peaks at the wavenumber range of 4000-3400 cm-1 and 2000-1300 cm-1. All other spectra collected from the peaks approximately centered at 391, 575, 811, 863, and 931°C show CO2 peaks at 3900-3500 cm-1, 2400-2200 cm-1, and 750-600 cm-1. No peaks indicative of hydrocarbons or CO gas were observed.
For information purposes, the DSC-TGA was performed using a N2 purge of 100 mL/min instead of air. Figure 4.7 shows the DSC-TGA results performed under N2 purge and Figure 4.8 compares the TGA curves from tests under air and N2. Under the N2 purge the sample does not show the major weight loss peaks observed at 356 and 866°C but rather shows continuous weight loss from 150°C to the end of the test. A slight weight increase observed at 750°C from the test under N2 is likely an experimental noise.

4.8
Figure 4.6. Gram-Schmidt Reconstruction for FTIR of the Cesium-Loaded SRF Resin
Table 4.4. Summary of FTIR Analysis Results on the Cesium-Loaded SRF Resin
Gram-Schmidt Reconstruction
FTIR Results Peak time
(min) Time range
(min) Temperature range (°C)
3.1 2.95 - 3.89 84 - 103 Peaks at 4000-3400 cm-1 and 2000-1300 cm-1,
representing H2O
18.3 16.50 - 19.18 355 - 409
Peaks at 3900-3500 cm-1, 2400-2200 cm-1, and 750-600 cm-1, representing CO2
27.5 27.09 - 28.03 567 - 586
39.3 37.02 - 40.10 765 - 827
41.9 40.77 - 43.86 840 - 902
45.3 44.13 - 46.14 908 - 948

4.9
Figure 4.7. DSC-TGA in N2 for the Cesium-Loaded SRF Resin
Figure 4.8. Comparison of DSC-TGA Curves in Air and N2 for the Cesium-Loaded SRF Resin
Air purge
N2 purge


5.1
5.0 Summary
The average FIT and SIT of the cesium-loaded SRF resin were 555°C and 610°C, respectively, which were 40°C (for FIT) and 3°C (for SIT) lower than the previous results for the SRF resin without cesium. The thermal conductivity (λ in W/[mK]) of the cesium-loaded SRF resin as a function of temperature (T in °C) between 22 and 90°C was expressed by a linear regression equation, 0.000273 0.0769T . The average specific heat capacity of the cesium-loaded SRF resin ranged from 1.434 J/(gK) at 40°C to 2.001 J/(gK) at 90°C. From the TGA-DSC analysis, an endothermic transition near 102°C appeared with a total weight loss of approximately 25%. Small exothermic transitions occurred around 387°C and 619°C and a large exothermic transition near 864°C with corresponding weight losses of approximately 30%, 5%, and 20%, respectively. The result of FTIR analyses showed that the weight loss peak at 102°C is linked to H2O while all other peaks at higher temperature were linked to CO2 gas.


6.1
6.0 References
ASTM D1929-96. 1996. Standard Test Method for Determining Ignition Temperature of Plastics, ASTM International, West Conshohocken, PA.
ASTM D5334-08. 2008. Standard Test Method for Thermal Conductivity of Soil and Soft Rock by Thermal Needle Probe Procedure, ASTM International, West Conshohocken, PA.
ASTM D5930-09. 2009. Standard Test Method for Thermal Conductivity of Plastics by Means of a Transient Line-Source Technique, ASTM International, West Conshohocken, PA.
ASTM E1269-11. 2011. Standard Test Method for Determining Specific Heat Capacity by Differential Scanning Calorimetry, ASTM International, West Conshohocken, PA.
Kim, D, MJ Schweiger, and RA Peterson. 2012. Fire Safety Tests for Spherical Resorcinol Formaldehyde Resin: Data Summary Report, PNNL-21321, WTP-RPT-218, Rev 0, Pacific Northwest National Laboratory, Richland, WA.
Not Publically Available
24590-PTF-TSP-RT-09-002, Rev 0. 2009. RF Resin Cesium Removal with Expanded Load and Elution Conditions, River Protection Project Waste Treatment Plant, Richland, WA.
24590-PTF-TEF-RT-11-00004, Rev 0. 2011. Test Exception to 24590-QL-HC9-WA49-00001-02-00014, Rev 00C (TP-WTPSP-002, Rev 2.0), River Protection Project Waste Treatment Plant, Richland, WA.
TP-WTPSP-002, Rev 3.0. 2011. Cesium Ion Exchange Simulant Testing in Support of M-6, Pacific Northwest National Laboratory, Richland, WA.


Appendix A
SwRI Report


Appendix B
Cesium Loading Procedure


B.1
Spherical Resorcinol Formaldehyde (SRF) Resin Preparations for Loading with Cesium
Caution: It is important that the SRF resin not be allowed to dry. There is no potential for a safety hazard should this occur; however, the ion exchange performance of the SRF resin will be severely reduced and inaccurate data generated.
1. Determine the amount of SRF resin needed for experimental testing. Fill container, no more than 1/5th full, with SRF resin. Use volume measurement for performing each step.
Note: Given the relatively large volume of resin needed for testing, use a Büchner funnel to facilitate solution-resin contact.
2. The dry bed density of the SRF resin is approximately 0.456 g/mL. If the resin will be stored for a long period, bubble inert gas (e.g., Ar or N2) over the resin for >30 min and seal the container.
3. Complete the “Bulk Pretreatment” portion of Table 1 (e.g., water rinses, resin expansion, and conversion) as follows:
3.1 After adding the required solution volumes into the container, gently swirl by hand every 10 min during the specified duration. Alternatively, the analyst may choose to allow solution contact with the resin in a Büchner funnel.
3.2 Decant the solutions to a waste container and retain the resin in the beaker. Alternatively, the analyst may choose to allow solution contact with the resin in a Büchner funnel, pulling the solution slowly through the resin with vacuum. Use care not to allow the resin to fully dry between solution contacts.
3.3 Record each of the start/stop times, volumes, and solutions used in the space provided in Table 2.
3.4 After completing the bulk pretreatment steps, transfer the resin to the testing vessel.

B.2
Table 1. Ion Exchanger Pretreatment and Process Steps Process/Pretreatment Step Solution Volume Time Mixing Flowrate Bulk Pretreatment
Water Rinse DI Water 3 RV(a) 30 min Swirl(b) NA(c) Resin Expansion – 1st 1 M NaOH 3 RV 30 min Swirl NA Resin Expansion – 2nd 1 M NaOH 3 RV >4 h Soak NA
Water Rinse – 1st DI Water 3RV 30 min Swirl NA Water Rinse – 2nd DI Water 3RV 30 min Swirl NA Water Rinse – 3rd DI Water 3RV 30 min Swirl NA
Resin Conversion – 1st 0.5 M HNO3 3 RV 30 min Swirl NA Resin Conversion – 2nd 0.5 M HNO3 3 RV 30 min Swirl NA Resin Conversion – 3rd 0.5 M HNO3 3 RV 30 min Swirl NA
Water Rinse – 4th DI Water 3 RV 1 min Swirl NA Resin Expansion 1 M NaOH 3 RV 1 h Swirl NA
Cesium Loading(d) +0.01 M CsNO3 3 RV 1 h Swirl NA Water Rinse – 5th DI Water 10 RV 1 min Swirl NA
(a) Resin volume (RV). (b) Gently swirling by hand every 10 min. (c) Not applicable (NA). Alternatively, the analyst may choose to use a Büchner funnel and flow the
solutions slowly through the resin bed at less than 6 RV/hr. (d) Cesium loading should occur using a solution of 1 M NaOH plus 0.01 M CsNO3.
Note: Table 2 provides the analyst with the option of preconditioning up to five resin samples all at the same time or up to two different times. If additional preconditioning is needed, the analyst may photocopy the table for additional cycles or record the data directly into the LRB.

B.3
Table 2. Example Data Sheet for Bulk Ion Exchanger Pretreatment
Bulk Pretreatment Solution
Used Samples Processed?1st 2nd 3rd 4th 5th
Volume(mL)
Start Time
Stop Time
Step Duration
Water Rinse DI Water Resin Expansion – 1st 1 M NaOH Resin Expansion – 2nd 1 M NaOH
Water Rinse – 1st DI Water Water Rinse – 2nd DI Water Water Rinse – 3rd DI Water
Resin Conversion – 1st 0.5 M HNO3 Resin Conversion – 2nd 0.5 M HNO3 Resin Conversion – 3rd 0.5 M HNO3
Water Rinse – 4th DI Water Resin Expansion 1 M NaOH Cesium Loading +0.01 M CsNO3
Water Rinse – 5th DI Water
Bulk Pretreatment Solution
Used Samples Processed?1st 2nd 3rd 4th 5th
Volume(mL)
Start Time
Stop Time
Step Duration
Water Rinse DI Water Resin Expansion – 1st 1 M NaOH Resin Expansion – 2nd 1 M NaOH
Water Rinse – 1st DI Water Water Rinse – 2nd DI Water Water Rinse – 3rd DI Water
Resin Conversion – 1st 0.5 M HNO3 Resin Conversion – 2nd 0.5 M HNO3 Resin Conversion – 3rd 0.5 M HNO3
Water Rinse – 4th DI Water Resin Expansion 1 M NaOH Cesium Loading +0.01 M CsNO3
Water Rinse – 5th DI Water Observations:


PNNL-21490 WTP-RPT-220, Rev 0
Distribution*
No. of No. of Copies Copies
Distr.1
4 Bechtel National, Inc. SM Barnes H4-02 JL Meehan H4-02 DJ Sherwood H4-02 WTP R&T Docs H4-02
6 Pacific Northwest National Laboratory D Kim K6-24 DE Kurath K3-52 RA Peterson P7-22 RL Russell K6-24 MJ Schweiger K6-24 Project File K3-52 Information Release
*All distribution will be made electronically.


