cet quarterly news
TRANSCRIPT
The Centre for Exploration Targeting is a partnership between the University of Western Australia, the Government of Western Australia, Curtin University of Technology and the Minerals Exploration Industry. Photo (top): An exploration drill rig on Lake Lefroy, south of Kambalda. This photograph is reproduced with the kind permission of BHPBilliton Mineral Exploration, from the Western Mining Corporation Holdings Limited 1990 Annual Report to Shareholders
CET Quarterly News
.
VOLUME 2, ISSUE 7, MARCH 2009
In this issue...Fooling ourselves: recognizing uncertainty and bias in exploration targeting - T. Campbell McCuaig, A. Porwal, K. Gessner 1
Corporate Membership 2008/09 2
From the Director 3
Field trip to the Komati River: komatiite type locality, South Africa - Ignacio Gonzalez-Alvarez 4
Under the long white cloud – SEG UWA Student Chapter excursion to New Zealand - Marco Brenna 9
CET Projects by Location 10
Magnetotelluric Traverse across the Albany-Fraser Orogen & Adjacent Parts of the Yilgarn Carton - Mike Dentith, Shane Evans & Ian Ferguson 11
CET Research Themes & Leaders 14
CET Training Schedule 2009 15
CET Staff Profiles 16
CET - New Student PhD Students 17
The Best Dissertation Award goes to GTK’s Chief Scientist Vesa Nykänen 18
The Hammond - Nisbet Geoscience Fund 18
CET Publications 2008 19
MSc Ore Deposit Geology & Evaluation 22
Continued on page 5
What is the problem?
One of the key goals of any exploration company is the ability to target economic mineralization more accurately at a variety of scales, from greenfields to brownfields to near-mine. In undertaking such prospectivity analysis, be it manual drawing of targets on maps or sophisticated automated analysis in a GIS, exploration decisions are always plagued by two key sources of uncertainty:
The limitations of our datasets (stochastic uncertainty). *
These limitations include lack of key datasets, variation of quality or spatial resolution, areal/volumetric support of datasets, etc.
The limitations of our concepts (systemic uncertainty). * These limitations include:
Our imperfect ability to interpret datasets*
Our imperfect knowledge of the mineral * system style we are exploring for (imperfect genetic models)
Fooling ourselves: recognizing uncertainty and bias in exploration targeting - T. Campbell McCuaig, A. Porwal, K. Gessner.
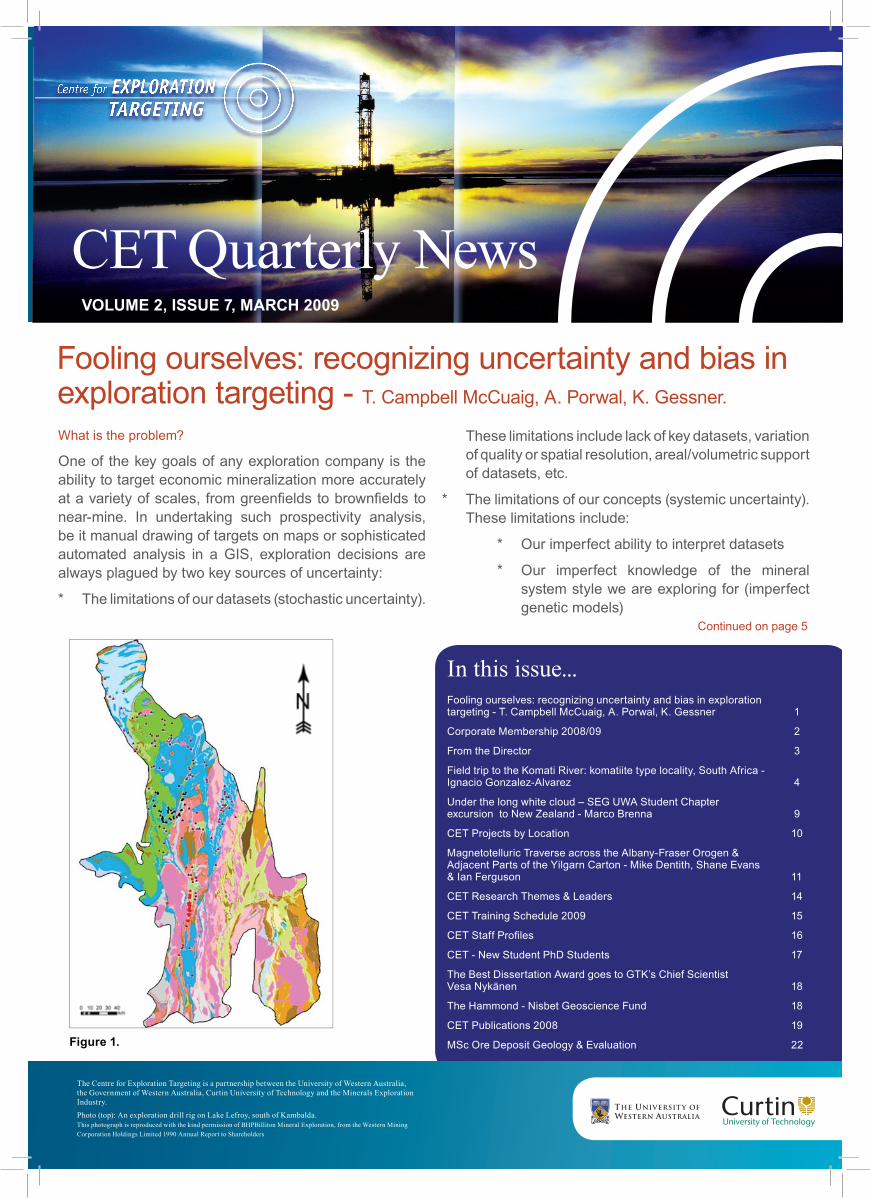
Figure 1.
2www.cet.uwa.edu.auhttp://members.cet.uwa.edu.au
Corporate Membership 2008/09
Major Producer
Anglo American Exploration (Aust) Pty Ltd
AngloGold Ashanti Australia Limited
Barrick Gold of Aust Ltd
BHP Billiton
Cameco Australia Pty Ltd
De Beers Australia
Gold Fields Australasia
Newcrest Mining Ltd
Newmont Mining Services Pty Ltd
Norilsk Nickel
OZ Minerals
Rio Tinto Exploration Pty Ltd
Teck Cominco Australia Pty Ltd
Vale Australia
Emerging Producer
Alkane Resources Limited
Consolidated Minerals Limited
Dominion Mining Ltd
Heron Resources Limited
Independence Group NL
Mincor Resources NL
Mineral Deposits Ltd
Mitchell River Group
Portman Iron Ore Limited
Sipa Resources Limited
St Barbara Limited
Troy Resources NL
Junior Explorer
Anglo Australian Resources NL
A1 Minerals Limited
Apex Minerals Limited
Breakaway Resources Limited
Brockman Resources Limited
Cryptodome Pty Ltd
Dragon Mountain Gold Ltd
Emmerson Resources
Encounter Resources Limited
Focus Minerals Limited
Hampton Hill Mining NL
Image Resources NL
Magma Metals Limited
Mr Mark G Creasy
Tanami Gold NL
Transcontinental Investments Pty Ltd
Universal Resources Ltd
In-Kind
Datamine
Earth Mapping Resourcing Ltd
Runge Limited
Gemcom Australia Pty Ltd
Geosoft Australia Pty Ltd
Inteirra Resource Intelligence
ioGlobal
Maptek Pty Ltd
Micromine Pty Ltd
Zaparo Limited
2008/09 Corporate Members
The benefits of becoming a Corporate Foundation Member of CET include:
Access to the Corporate Foundation Members secure site: • http://members.cet.uwa.edu.auUse of a CET Corporate Foundation Membership logo;• Receive quarterly CET Newsletters;• Prominent recognition of Foundation Members;• Becoming a preferred research partner – as CET staff develop new concepts and tools to apply to mineral • exploration, Corporate Members will have the first opportunity to participate;Early access to non-proprietary research outcomes and ideas in a user-friendly format;• Preferred access to CET research staff and distinguished visiting researchers;• Opportunities to network with students, your future employees, through our seminar series and networking • functions for Members;Discounts on training courses (20%).•
To register for Corporate Membership, please visit http://www.cet.uwa.edu.au/corporate_memberssponsors
3www.cet.uwa.edu.auhttp://members.cet.uwa.edu.au
From the DirectorAn article in the upcoming The Australian Geologist (Newsletter of the Geological Society of Australia), by Hronsky et al. (2009), eloquently spells out the need for a global renaissance of greenfields exploration. They clearly show how the seduction of exploration dollars to brownfields exploration has occurred during this last boom at the expense of greenfields exploration, and that the re-investment of the minerals industry in greenfields exploration (as a ratio of mine production) is at an historic low. There are well justified reasons for this, mostly boiling down to the fact that greenfields exploration requires a consistent long-term commitment for discovery, whereas brownfields exploration can be turned on and off quickly and is inherently lower uncertainty despite being lower reward. Most importantly, however, is that our industry, as with most industries, has evolved into an organism that is measured and rewarded on short time scales from 1 to at most 5 years, both in terms of external forces (political cycles, investor expectations) and internal systems (remuneration packages and KPI’s, which often are designed to align with external forces). A fundamental truth is that you get what you measure. In this light it is no wonder that the industry decision-makers gravitate towards the lower-uncertainty brownfields exploration, even if it is lower reward and often not recognized as potentially higher risk, because it is the strategy that will deliver in the time frame that impacts upon them and their KPI’s.
Given the above issues, there are a number of implicit challenges in achieving the vision of Hronsky et al. (2009). The first challenge is to have companies recognize the arguments as to why re-investment in greenfields is required, so that they can in turn champion greenfields programs within their companies. Only a minority of geologists or leading decision makers in industry recognize this in my experience. However, even where this requirement has been recognized, most of these companies fail to act upon it – Why? In my opinion it is again the timescale on which performance is measured in our industry, which brings us to our second challenge: to shorten the timeline of greenfields discovery programs within the time frame within which the industry is measured, i.e. from a 5-10 year time frame to <5 year time frame. This can only be achieved by better methods of predicting locations of high quality orebodies, in combination with improved detection technologies.
More importantly, meeting the above challenges is an
education issue. Consider this analogy – which of the following doctors would you want to treat you? (1) a person given a three-year education in human anatomy, then told to go out and start a medical practice learning it on the job? What if you were his first patient? Or (2) a person with an undergraduate degree, followed by a medical degree, in turn followed by several years as an intern under careful guidance before they were allowed to practice on their own? The first case is how doctors were trained in the 19th century. The second case is how doctors are trained in the 21st century.
Now consider how we train exploration geologists: we give them a 3-year or 4-year degree in general geosciences, then tell them to go out and find an ore body. Sure they get mentoring, but that mentoring is of variable quality and often biased towards certain subdisciplines or geology rather than comprehensive exploration geoscience. Too few geologists have formal training in corporate strategy, mineral economics, psychology, complexity science, decision science and spatial science, yet these are all essential ingredients for a successful explorer or exploration team. A key issue to recognize is that exploration targeting is a subdiscipline in its own right (Hronsky 2004). It is not just the application of traditional economic geology, but a combination of such non geoscience related disciplines with more traditional geosciences.
Essentially, we need to make the same step change in educating exploration geologists within the next generation that we did over several generations with medical practitioners. It is critical to recognize that this change will never happen within an undergraduate degree, which by necessity covers a broad range of geosciences it will only come at the postgraduate level.
The CET is addressing this by developing courses specifically on Exploration Targeting and its involvement in the Mineral Geoscience Honours (MGH) programs and Mineral Geoscience Masters (MGM) programs. (see CET Training schedule).
The CET is dedicated to assisting the industry make this generational change in how our industry approaches exploration targeting, and we look forward to working with all of our Corporate Members to achieve this.
Professor T. Campbell McCuaigDirector
4www.cet.uwa.edu.auhttp://members.cet.uwa.edu.au
Field trip to the Komati River: komatiite type locality, South Africa - Ignacio Gonzalez-Alvarez
Firstly described in 1969 by Morris and Richard Viljoen, komatiites are predominantly Archaean ultramafic mantle-derived volcanic rocks. They have low SiO2, K2O, Al2O3, and high MgO (>18 wt%; Le Bas 2000; Kerr and Arndt 2001) and formed by large degree partial melting of Archean magma at ~150-200 km depth.
Komatiites were named for their type locality along the Komati River in South Africa, within the 3.5–3.2 Ga Barberton greenstone belt (Fig. 1) near the eastern edge of the Kaapvaal Craton. The importance of these rocks lies partially within their exceptionally well-preserved textures, and relatively unaltered chemical compositions. They represent a key element for the understanding of Earth’s evolution and Archaean geology. Their unusually high eruption temperatures (~1600°C) and low SiO2 content allowed them to flow at low dynamic viscosities (0.1-1 Pa s). They generally display three main characteristics: (1) enrichment in olivine; (2) partially or wholly extrusive origin; and (3) the presence of so-called spinifex textures (Figs. 2 and 3). Komatiites stay under-saturated in sulfide during magma ascent and emplacement/eruption. They provide evidence for the progressive cooling of the Earth.
Komatiites host economically important NiS deposits in Australia, Zimbabwe and Canada. Archaean komatiites within greenstone belts constitute the most important host rocks for NiS deposits in Australia (Kambalda 1,388,820 Ni metal tones; Hoatson et al. 2006), and are temporally linked with global-scale metallogenic events at ~3.0 and 2.7 Ga. NiS deposits associated to komatiites are sub-divided into two types; Type I (Kambalda-type) consists of stratiform, basal massive to disseminated ores, whereas Type II (Mt. Keith-type) consists of strata-bound, internal, disseminated Ni-Cu-(PGE) ores.
This field trip to the Komati River was part of a series of courses, workshops and field excursions structured within the SEG-GSSA 2008 Conference: “Africa uncovered: mineral resources for the future” in Johannesburg, South Africa. The komatiite type locality allowed a clear examination of complete sequences of these spectacular lava flows at centimetre and meter scales in extraordinary detail. Komatiite sample collection from other localities in the Barberton greenstone belt (namely the Mendon and Weltevreden formations) was carried out for further research.
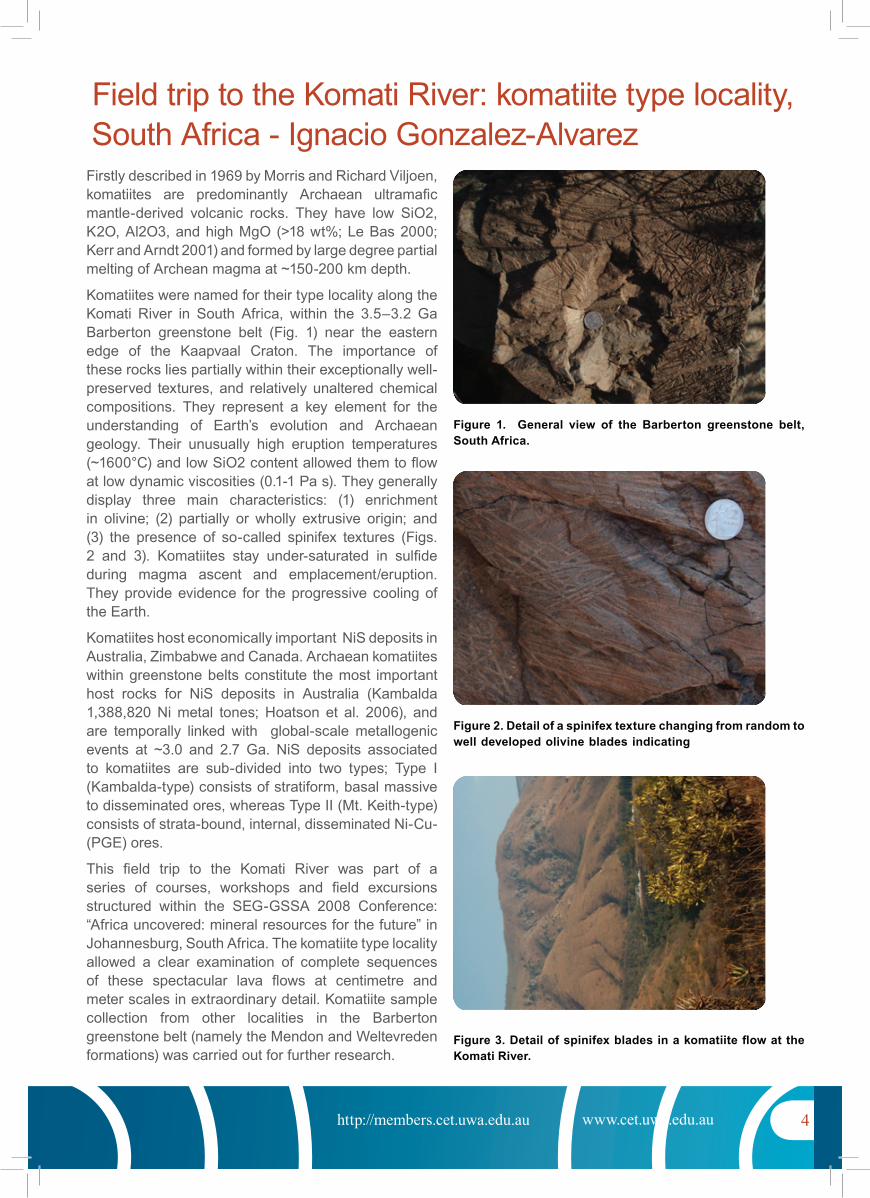
Figure 1. General view of the Barberton greenstone belt, South Africa.
Figure 2. Detail of a spinifex texture changing from random to well developed olivine blades indicating cooling conditions of the lava flow.
Figure 3. Detail of spinifex blades in a komatiite flow at the Komati River.
5www.cet.uwa.edu.auhttp://members.cet.uwa.edu.au
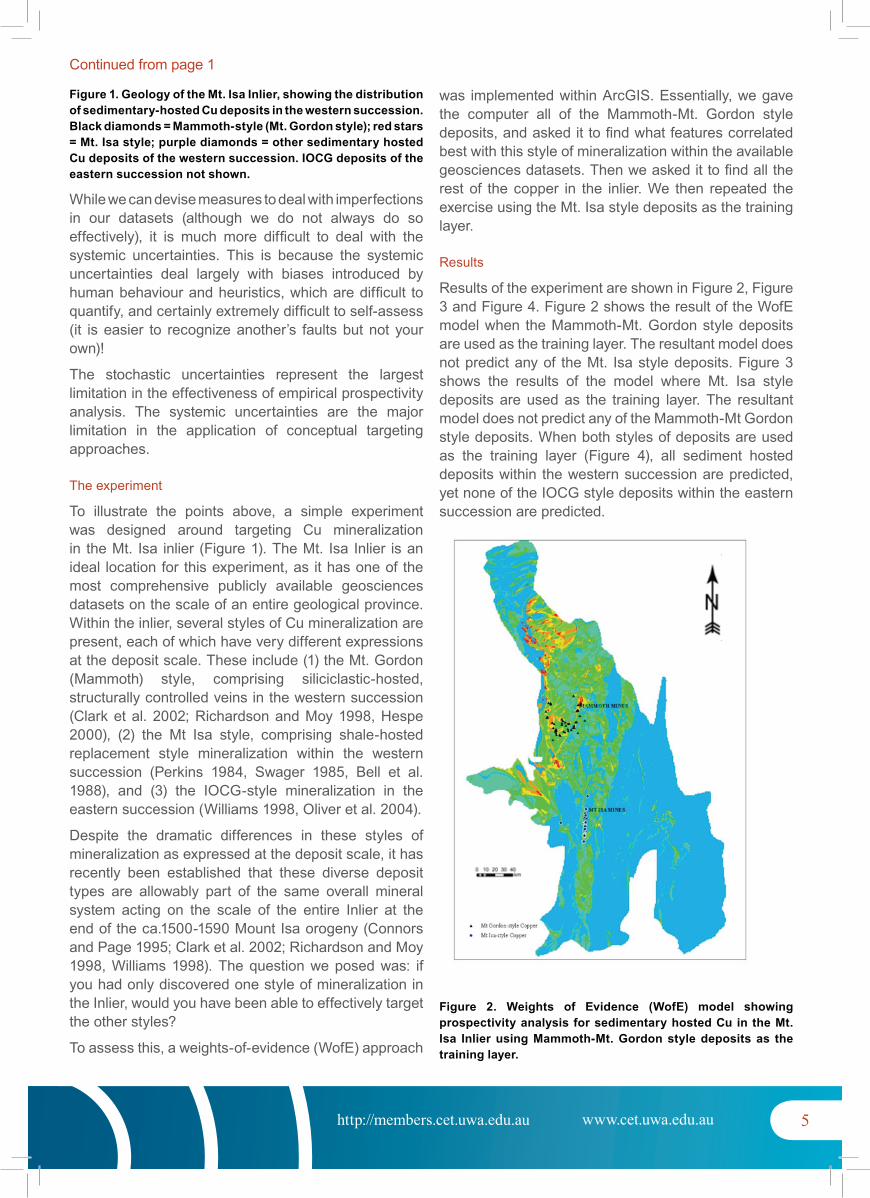
Figure 1. Geology of the Mt. Isa Inlier, showing the distribution of sedimentary-hosted Cu deposits in the western succession. Black diamonds = Mammoth-style (Mt. Gordon style); red stars = Mt. Isa style; purple diamonds = other sedimentary hosted Cu deposits of the western succession. IOCG deposits of the eastern succession not shown.
While we can devise measures to deal with imperfections in our datasets (although we do not always do so effectively), it is much more difficult to deal with the systemic uncertainties. This is because the systemic uncertainties deal largely with biases introduced by human behaviour and heuristics, which are difficult to quantify, and certainly extremely difficult to self-assess (it is easier to recognize another’s faults but not your own)!
The stochastic uncertainties represent the largest limitation in the effectiveness of empirical prospectivity analysis. The systemic uncertainties are the major limitation in the application of conceptual targeting approaches.
The experiment
To illustrate the points above, a simple experiment was designed around targeting Cu mineralization in the Mt. Isa inlier (Figure 1). The Mt. Isa Inlier is an ideal location for this experiment, as it has one of the most comprehensive publicly available geosciences datasets on the scale of an entire geological province. Within the inlier, several styles of Cu mineralization are present, each of which have very different expressions at the deposit scale. These include (1) the Mt. Gordon (Mammoth) style, comprising siliciclastic-hosted, structurally controlled veins in the western succession (Clark et al. 2002; Richardson and Moy 1998, Hespe 2000), (2) the Mt Isa style, comprising shale-hosted replacement style mineralization within the western succession (Perkins 1984, Swager 1985, Bell et al. 1988), and (3) the IOCG-style mineralization in the eastern succession (Williams 1998, Oliver et al. 2004).
Despite the dramatic differences in these styles of mineralization as expressed at the deposit scale, it has recently been established that these diverse deposit types are allowably part of the same overall mineral system acting on the scale of the entire Inlier at the end of the ca.1500-1590 Mount Isa orogeny (Connors and Page 1995; Clark et al. 2002; Richardson and Moy 1998, Williams 1998). The question we posed was: if you had only discovered one style of mineralization in the Inlier, would you have been able to effectively target the other styles?
To assess this, a weights-of-evidence (WofE) approach
was implemented within ArcGIS. Essentially, we gave the computer all of the Mammoth-Mt. Gordon style deposits, and asked it to find what features correlated best with this style of mineralization within the available geosciences datasets. Then we asked it to find all the rest of the copper in the inlier. We then repeated the exercise using the Mt. Isa style deposits as the training layer.
Results
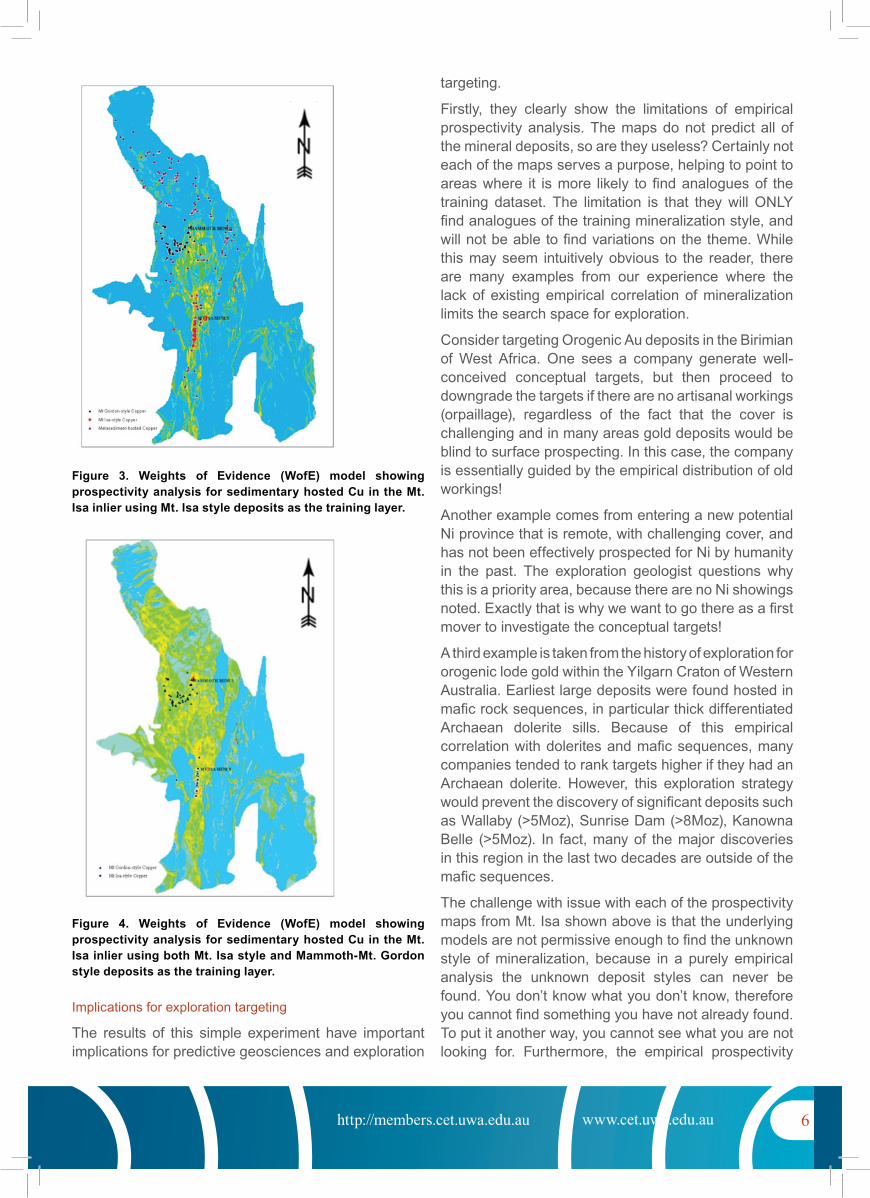
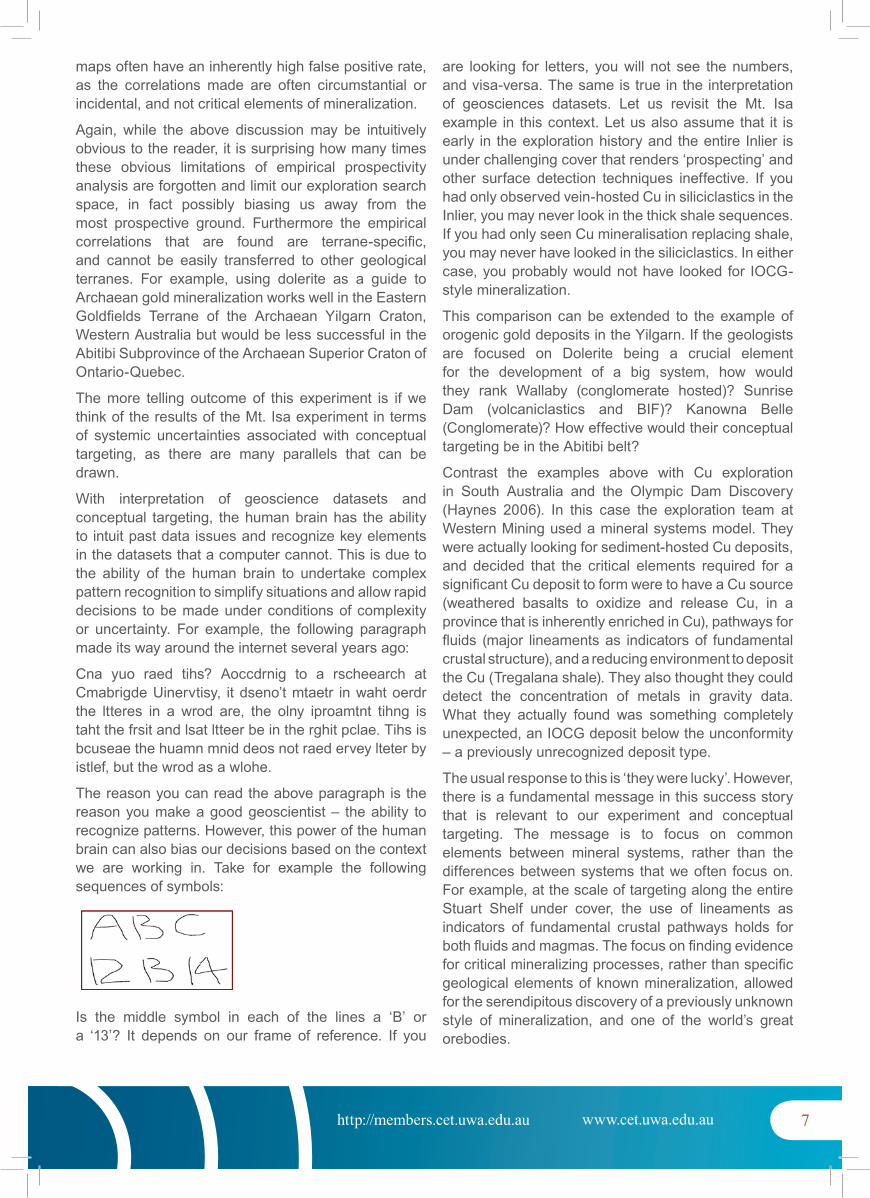
Results of the experiment are shown in Figure 2, Figure 3 and Figure 4. Figure 2 shows the result of the WofE model when the Mammoth-Mt. Gordon style deposits are used as the training layer. The resultant model does not predict any of the Mt. Isa style deposits. Figure 3 shows the results of the model where Mt. Isa style deposits are used as the training layer. The resultant model does not predict any of the Mammoth-Mt Gordon style deposits. When both styles of deposits are used as the training layer (Figure 4), all sediment hosted deposits within the western succession are predicted, yet none of the IOCG style deposits within the eastern succession are predicted.
Figure 2. Weights of Evidence (WofE) model showing prospectivity analysis for sedimentary hosted Cu in the Mt. Isa Inlier using Mammoth-Mt. Gordon style deposits as the training layer.
Continued from page 1
6www.cet.uwa.edu.auhttp://members.cet.uwa.edu.au
Figure 3. Weights of Evidence (WofE) model showing prospectivity analysis for sedimentary hosted Cu in the Mt. Isa inlier using Mt. Isa style deposits as the training layer.
Figure 4. Weights of Evidence (WofE) model showing prospectivity analysis for sedimentary hosted Cu in the Mt. Isa inlier using both Mt. Isa style and Mammoth-Mt. Gordon style deposits as the training layer.
Implications for exploration targeting
The results of this simple experiment have important implications for predictive geosciences and exploration
targeting.
Firstly, they clearly show the limitations of empirical prospectivity analysis. The maps do not predict all of the mineral deposits, so are they useless? Certainly not each of the maps serves a purpose, helping to point to areas where it is more likely to find analogues of the training dataset. The limitation is that they will ONLY find analogues of the training mineralization style, and will not be able to find variations on the theme. While this may seem intuitively obvious to the reader, there are many examples from our experience where the lack of existing empirical correlation of mineralization limits the search space for exploration.
Consider targeting Orogenic Au deposits in the Birimian of West Africa. One sees a company generate well-conceived conceptual targets, but then proceed to downgrade the targets if there are no artisanal workings (orpaillage), regardless of the fact that the cover is challenging and in many areas gold deposits would be blind to surface prospecting. In this case, the company is essentially guided by the empirical distribution of old workings!
Another example comes from entering a new potential Ni province that is remote, with challenging cover, and has not been effectively prospected for Ni by humanity in the past. The exploration geologist questions why this is a priority area, because there are no Ni showings noted. Exactly that is why we want to go there as a first mover to investigate the conceptual targets!
A third example is taken from the history of exploration for orogenic lode gold within the Yilgarn Craton of Western Australia. Earliest large deposits were found hosted in mafic rock sequences, in particular thick differentiated Archaean dolerite sills. Because of this empirical correlation with dolerites and mafic sequences, many companies tended to rank targets higher if they had an Archaean dolerite. However, this exploration strategy would prevent the discovery of significant deposits such as Wallaby (>5Moz), Sunrise Dam (>8Moz), Kanowna Belle (>5Moz). In fact, many of the major discoveries in this region in the last two decades are outside of the mafic sequences.
The challenge with issue with each of the prospectivity maps from Mt. Isa shown above is that the underlying models are not permissive enough to find the unknown style of mineralization, because in a purely empirical analysis the unknown deposit styles can never be found. You don’t know what you don’t know, therefore you cannot find something you have not already found. To put it another way, you cannot see what you are not looking for. Furthermore, the empirical prospectivity
7www.cet.uwa.edu.auhttp://members.cet.uwa.edu.au
maps often have an inherently high false positive rate, as the correlations made are often circumstantial or incidental, and not critical elements of mineralization.
Again, while the above discussion may be intuitively obvious to the reader, it is surprising how many times these obvious limitations of empirical prospectivity analysis are forgotten and limit our exploration search space, in fact possibly biasing us away from the most prospective ground. Furthermore the empirical correlations that are found are terrane-specific, and cannot be easily transferred to other geological terranes. For example, using dolerite as a guide to Archaean gold mineralization works well in the Eastern Goldfields Terrane of the Archaean Yilgarn Craton, Western Australia but would be less successful in the Abitibi Subprovince of the Archaean Superior Craton of Ontario-Quebec.
The more telling outcome of this experiment is if we think of the results of the Mt. Isa experiment in terms of systemic uncertainties associated with conceptual targeting, as there are many parallels that can be drawn.
With interpretation of geoscience datasets and conceptual targeting, the human brain has the ability to intuit past data issues and recognize key elements in the datasets that a computer cannot. This is due to the ability of the human brain to undertake complex pattern recognition to simplify situations and allow rapid decisions to be made under conditions of complexity or uncertainty. For example, the following paragraph made its way around the internet several years ago:
Cna yuo raed tihs? Aoccdrnig to a rscheearch at Cmabrigde Uinervtisy, it dseno’t mtaetr in waht oerdr the ltteres in a wrod are, the olny iproamtnt tihng is taht the frsit and lsat ltteer be in the rghit pclae. Tihs is bcuseae the huamn mnid deos not raed ervey lteter by istlef, but the wrod as a wlohe.
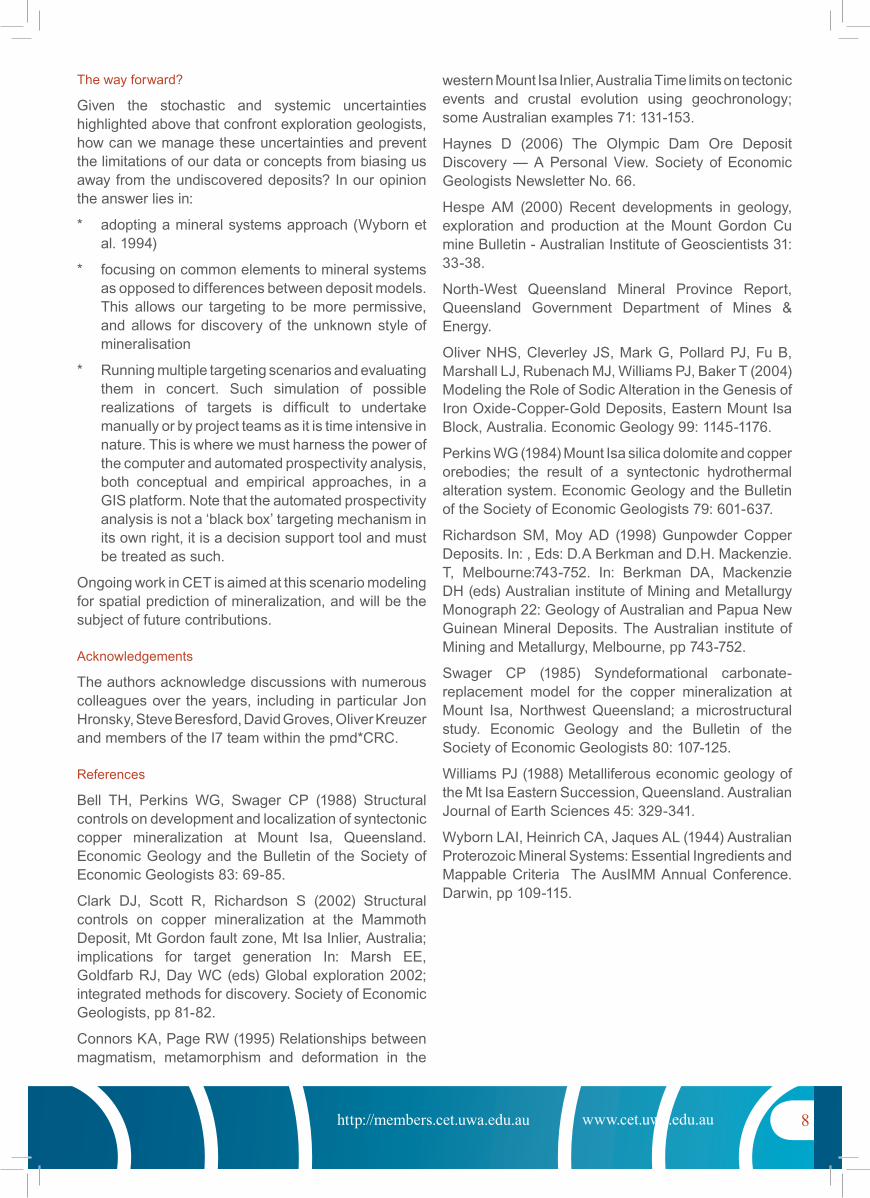
The reason you can read the above paragraph is the reason you make a good geoscientist – the ability to recognize patterns. However, this power of the human brain can also bias our decisions based on the context we are working in. Take for example the following sequences of symbols:
Is the middle symbol in each of the lines a ‘B’ or a ‘13’? It depends on our frame of reference. If you
are looking for letters, you will not see the numbers, and visa-versa. The same is true in the interpretation of geosciences datasets. Let us revisit the Mt. Isa example in this context. Let us also assume that it is early in the exploration history and the entire Inlier is under challenging cover that renders ‘prospecting’ and other surface detection techniques ineffective. If you had only observed vein-hosted Cu in siliciclastics in the Inlier, you may never look in the thick shale sequences. If you had only seen Cu mineralisation replacing shale, you may never have looked in the siliciclastics. In either case, you probably would not have looked for IOCG-style mineralization.
This comparison can be extended to the example of orogenic gold deposits in the Yilgarn. If the geologists are focused on Dolerite being a crucial element for the development of a big system, how would they rank Wallaby (conglomerate hosted)? Sunrise Dam (volcaniclastics and BIF)? Kanowna Belle (Conglomerate)? How effective would their conceptual targeting be in the Abitibi belt?
Contrast the examples above with Cu exploration in South Australia and the Olympic Dam Discovery (Haynes 2006). In this case the exploration team at Western Mining used a mineral systems model. They were actually looking for sediment-hosted Cu deposits, and decided that the critical elements required for a significant Cu deposit to form were to have a Cu source (weathered basalts to oxidize and release Cu, in a province that is inherently enriched in Cu), pathways for fluids (major lineaments as indicators of fundamental crustal structure), and a reducing environment to deposit the Cu (Tregalana shale). They also thought they could detect the concentration of metals in gravity data. What they actually found was something completely unexpected, an IOCG deposit below the unconformity – a previously unrecognized deposit type.
The usual response to this is ‘they were lucky’. However, there is a fundamental message in this success story that is relevant to our experiment and conceptual targeting. The message is to focus on common elements between mineral systems, rather than the differences between systems that we often focus on. For example, at the scale of targeting along the entire Stuart Shelf under cover, the use of lineaments as indicators of fundamental crustal pathways holds for both fluids and magmas. The focus on finding evidence for critical mineralizing processes, rather than specific geological elements of known mineralization, allowed for the serendipitous discovery of a previously unknown style of mineralization, and one of the world’s great orebodies.
8www.cet.uwa.edu.auhttp://members.cet.uwa.edu.au
The way forward?
Given the stochastic and systemic uncertainties highlighted above that confront exploration geologists, how can we manage these uncertainties and prevent the limitations of our data or concepts from biasing us away from the undiscovered deposits? In our opinion the answer lies in:
adopting a mineral systems approach (Wyborn et * al. 1994)
focusing on common elements to mineral systems * as opposed to differences between deposit models. This allows our targeting to be more permissive, and allows for discovery of the unknown style of mineralisation
Running multiple targeting scenarios and evaluating * them in concert. Such simulation of possible realizations of targets is difficult to undertake manually or by project teams as it is time intensive in nature. This is where we must harness the power of the computer and automated prospectivity analysis, both conceptual and empirical approaches, in a GIS platform. Note that the automated prospectivity analysis is not a ‘black box’ targeting mechanism in its own right, it is a decision support tool and must be treated as such.
Ongoing work in CET is aimed at this scenario modeling for spatial prediction of mineralization, and will be the subject of future contributions.
Acknowledgements
The authors acknowledge discussions with numerous colleagues over the years, including in particular Jon Hronsky, Steve Beresford, David Groves, Oliver Kreuzer and members of the I7 team within the pmd*CRC.
References
Bell TH, Perkins WG, Swager CP (1988) Structural controls on development and localization of syntectonic copper mineralization at Mount Isa, Queensland. Economic Geology and the Bulletin of the Society of Economic Geologists 83: 69-85.
Clark DJ, Scott R, Richardson S (2002) Structural controls on copper mineralization at the Mammoth Deposit, Mt Gordon fault zone, Mt Isa Inlier, Australia; implications for target generation In: Marsh EE, Goldfarb RJ, Day WC (eds) Global exploration 2002; integrated methods for discovery. Society of Economic Geologists, pp 81-82.
Connors KA, Page RW (1995) Relationships between magmatism, metamorphism and deformation in the
western Mount Isa Inlier, Australia Time limits on tectonic events and crustal evolution using geochronology; some Australian examples 71: 131-153.
Haynes D (2006) The Olympic Dam Ore Deposit Discovery — A Personal View. Society of Economic Geologists Newsletter No. 66.
Hespe AM (2000) Recent developments in geology, exploration and production at the Mount Gordon Cu mine Bulletin - Australian Institute of Geoscientists 31: 33-38.
North-West Queensland Mineral Province Report, Queensland Government Department of Mines & Energy.
Oliver NHS, Cleverley JS, Mark G, Pollard PJ, Fu B, Marshall LJ, Rubenach MJ, Williams PJ, Baker T (2004) Modeling the Role of Sodic Alteration in the Genesis of Iron Oxide-Copper-Gold Deposits, Eastern Mount Isa Block, Australia. Economic Geology 99: 1145-1176.
Perkins WG (1984) Mount Isa silica dolomite and copper orebodies; the result of a syntectonic hydrothermal alteration system. Economic Geology and the Bulletin of the Society of Economic Geologists 79: 601-637.
Richardson SM, Moy AD (1998) Gunpowder Copper Deposits. In: , Eds: D.A Berkman and D.H. Mackenzie. T, Melbourne:743-752. In: Berkman DA, Mackenzie DH (eds) Australian institute of Mining and Metallurgy Monograph 22: Geology of Australian and Papua New Guinean Mineral Deposits. The Australian institute of Mining and Metallurgy, Melbourne, pp 743-752.
Swager CP (1985) Syndeformational carbonate-replacement model for the copper mineralization at Mount Isa, Northwest Queensland; a microstructural study. Economic Geology and the Bulletin of the Society of Economic Geologists 80: 107-125.
Williams PJ (1988) Metalliferous economic geology of the Mt Isa Eastern Succession, Queensland. Australian Journal of Earth Sciences 45: 329-341.
Wyborn LAI, Heinrich CA, Jaques AL (1944) Australian Proterozoic Mineral Systems: Essential Ingredients and Mappable Criteria The AusIMM Annual Conference. Darwin, pp 109-115.
9www.cet.uwa.edu.auhttp://members.cet.uwa.edu.au
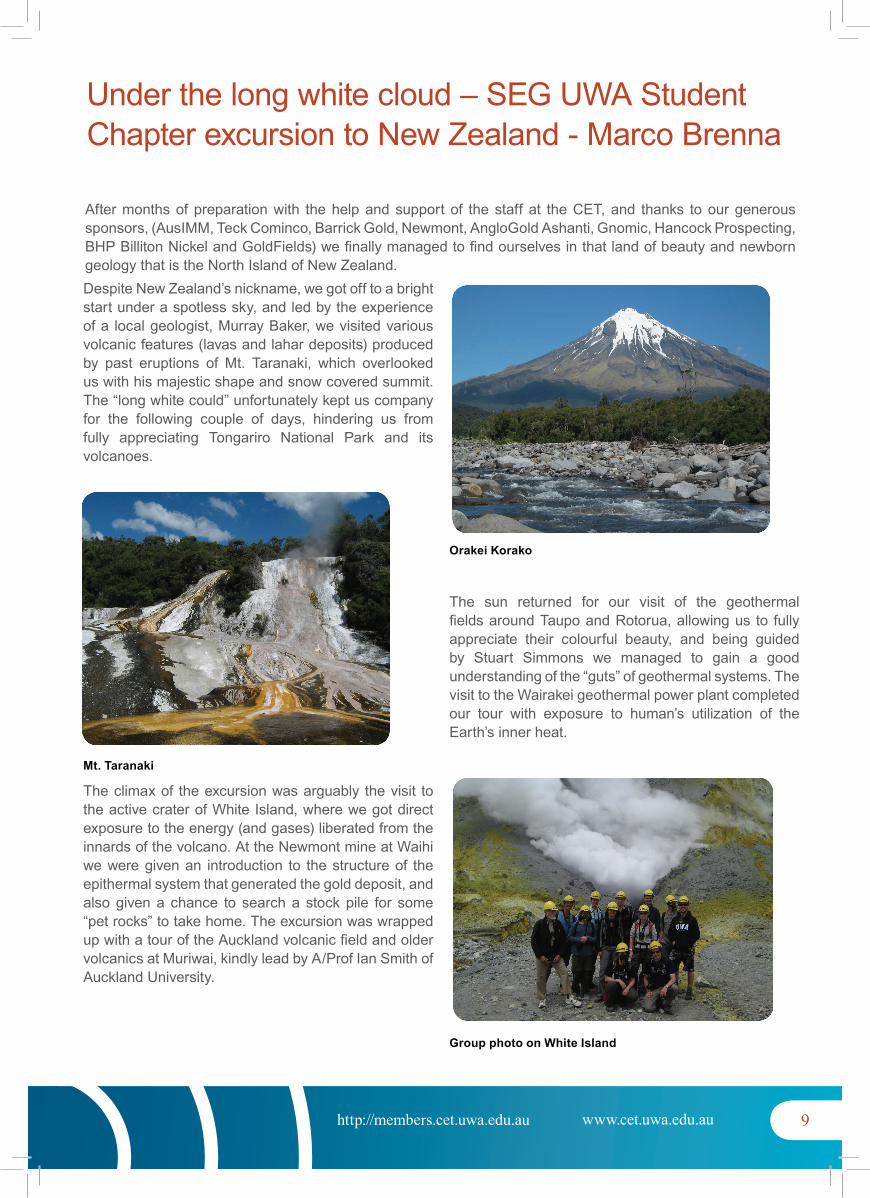
Despite New Zealand’s nickname, we got off to a bright start under a spotless sky, and led by the experience of a local geologist, Murray Baker, we visited various volcanic features (lavas and lahar deposits) produced by past eruptions of Mt. Taranaki, which overlooked us with his majestic shape and snow covered summit. The “long white could” unfortunately kept us company for the following couple of days, hindering us from fully appreciating Tongariro National Park and its volcanoes.
Mt. Taranaki
The climax of the excursion was arguably the visit to the active crater of White Island, where we got direct exposure to the energy (and gases) liberated from the innards of the volcano. At the Newmont mine at Waihi we were given an introduction to the structure of the epithermal system that generated the gold deposit, and also given a chance to search a stock pile for some “pet rocks” to take home. The excursion was wrapped up with a tour of the Auckland volcanic field and older volcanics at Muriwai, kindly lead by A/Prof Ian Smith of Auckland University.
Orakei Korako
The sun returned for our visit of the geothermal fields around Taupo and Rotorua, allowing us to fully appreciate their colourful beauty, and being guided by Stuart Simmons we managed to gain a good understanding of the “guts” of geothermal systems. The visit to the Wairakei geothermal power plant completed our tour with exposure to human’s utilization of the Earth’s inner heat.
Group photo on White Island
After months of preparation with the help and support of the staff at the CET, and thanks to our generous sponsors, (AusIMM, Teck Cominco, Barrick Gold, Newmont, AngloGold Ashanti, Gnomic, Hancock Prospecting, BHP Billiton Nickel and GoldFields) we finally managed to find ourselves in that land of beauty and newborn geology that is the North Island of New Zealand.
Under the long white cloud – SEG UWA Student Chapter excursion to New Zealand - Marco Brenna
10www.cet.uwa.edu.auhttp://members.cet.uwa.edu.au
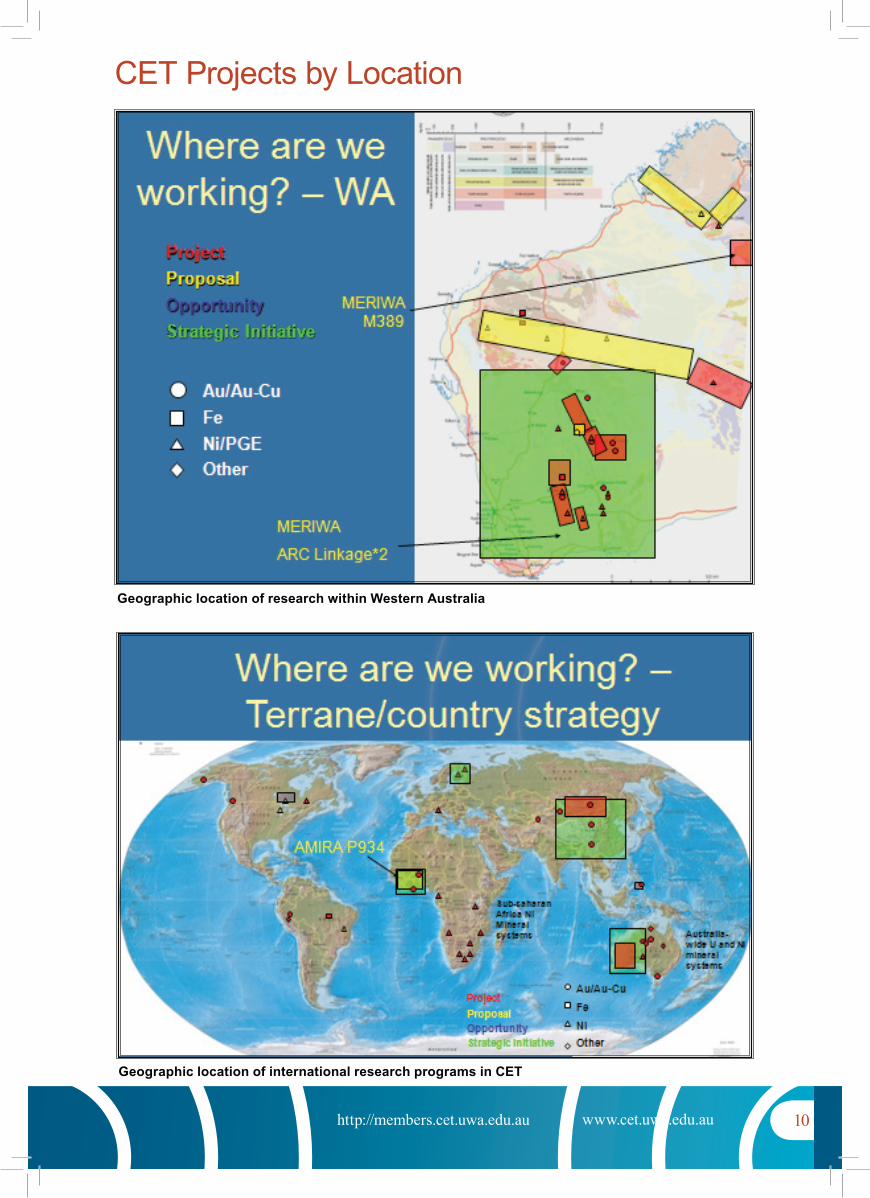
Geographic location of international research programs in CET
Geographic location of research within Western Australia
CET Projects by Location
11www.cet.uwa.edu.auhttp://members.cet.uwa.edu.au
Magnetotelluric Traverse across the Albany-Fraser Orogen and Adjacent Parts of the Yilgarn Carton - Mike Dentith, Shane Evans & Ian Ferguson
The magnetotelluric (MT) method is a form of electromagnetic surveying and so provides information on the electrical conductivity (or the reciprocal, resistivity) of the subsurface. The method involves measuring the natural time-varying electrical and magnetic fields at the surface of the Earth. Signal for MT is generated from interactions between solar winds and the ionosphere at low frequencies, and from distant lightning storms at higher frequencies. The main advantage of MT over other electrical/electromagnetic geophysical methods is that, in theory, any depth of penetration can be achieved. MT is a, very much cheaper, alterative to deep seismic reflection profiling as means of mapping structures in the deep crust. Although resolution is much less than seismic data and only large electrical conductivity contrasts will be seen, the cost of a deep crustal MT survey is about an order of magnitude less than that of a seismic survey.
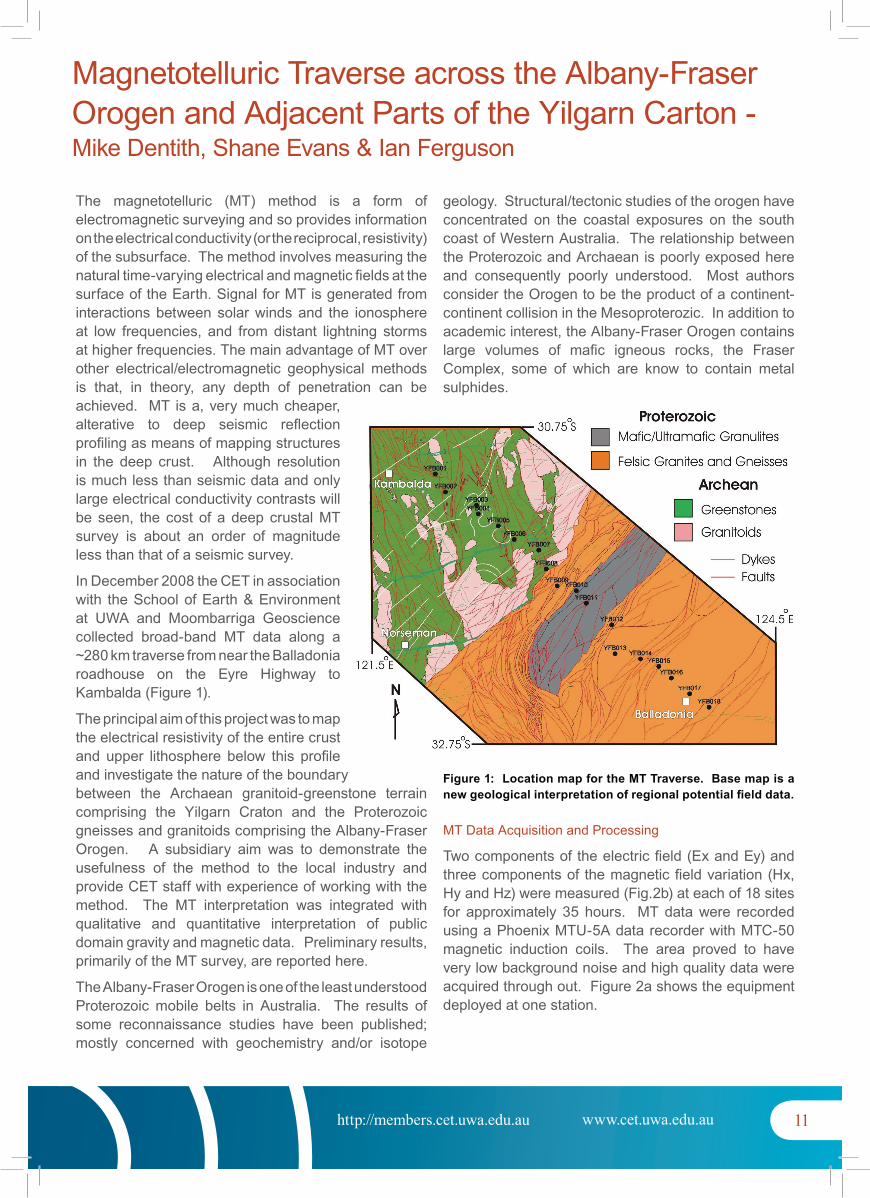
In December 2008 the CET in association with the School of Earth & Environment at UWA and Moombarriga Geoscience collected broad-band MT data along a ~280 km traverse from near the Balladonia roadhouse on the Eyre Highway to Kambalda (Figure 1).
The principal aim of this project was to map the electrical resistivity of the entire crust and upper lithosphere below this profile and investigate the nature of the boundary between the Archaean granitoid-greenstone terrain comprising the Yilgarn Craton and the Proterozoic gneisses and granitoids comprising the Albany-Fraser Orogen. A subsidiary aim was to demonstrate the usefulness of the method to the local industry and provide CET staff with experience of working with the method. The MT interpretation was integrated with qualitative and quantitative interpretation of public domain gravity and magnetic data. Preliminary results, primarily of the MT survey, are reported here.
The Albany-Fraser Orogen is one of the least understood Proterozoic mobile belts in Australia. The results of some reconnaissance studies have been published; mostly concerned with geochemistry and/or isotope
geology. Structural/tectonic studies of the orogen have concentrated on the coastal exposures on the south coast of Western Australia. The relationship between the Proterozoic and Archaean is poorly exposed here and consequently poorly understood. Most authors consider the Orogen to be the product of a continent-continent collision in the Mesoproterozic. In addition to academic interest, the Albany-Fraser Orogen contains large volumes of mafic igneous rocks, the Fraser Complex, some of which are know to contain metal sulphides.
Figure 1: Location map for the MT Traverse. Base map is a new geological interpretation of regional potential field data.
MT Data Acquisition and Processing
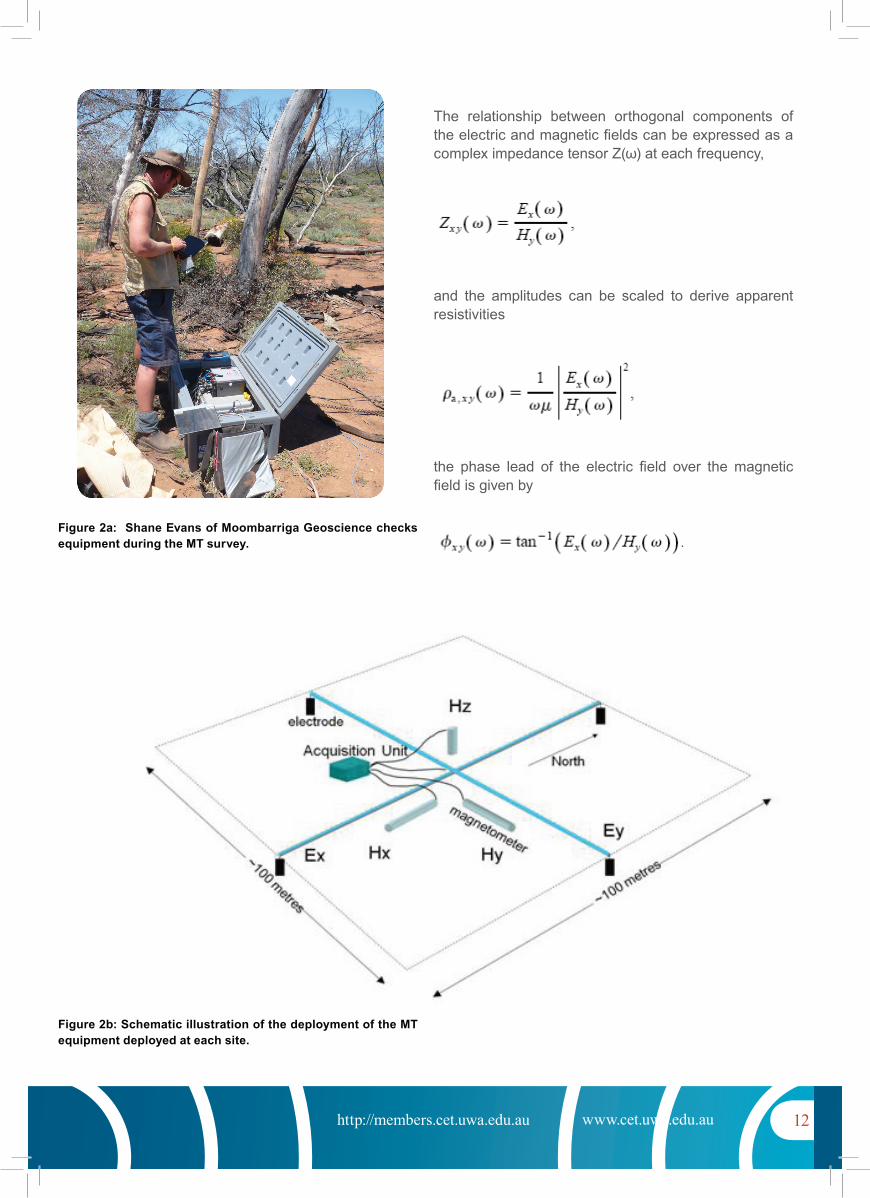
Two components of the electric field (Ex and Ey) and three components of the magnetic field variation (Hx, Hy and Hz) were measured (Fig.2b) at each of 18 sites for approximately 35 hours. MT data were recorded using a Phoenix MTU-5A data recorder with MTC-50 magnetic induction coils. The area proved to have very low background noise and high quality data were acquired through out. Figure 2a shows the equipment deployed at one station.
12www.cet.uwa.edu.auhttp://members.cet.uwa.edu.au
Figure 2a: Shane Evans of Moombarriga Geoscience checks equipment during the MT survey.
Figure 2b: Schematic illustration of the deployment of the MT equipment deployed at each site.
The relationship between orthogonal components of the electric and magnetic fields can be expressed as a complex impedance tensor Z(ω) at each frequency,
and the amplitudes can be scaled to derive apparent resistivities
the phase lead of the electric field over the magnetic field is given by
13www.cet.uwa.edu.auhttp://members.cet.uwa.edu.au
Figure 2a: Shane Evans of Moombarriga Geoscience checks equipment during the MT survey.
Figure 2b: Schematic illustration of the deployment of the MT equipment deployed at each site.
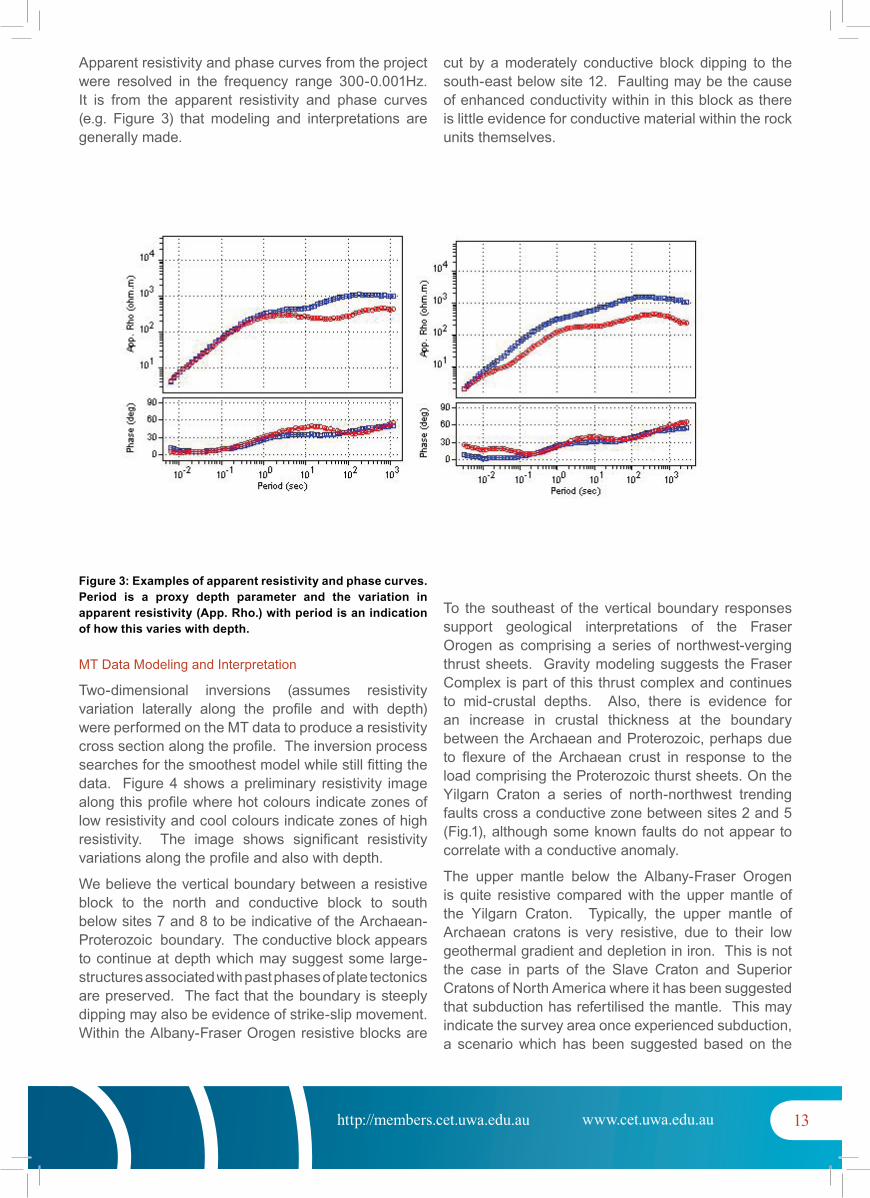
Apparent resistivity and phase curves from the project were resolved in the frequency range 300-0.001Hz. It is from the apparent resistivity and phase curves (e.g. Figure 3) that modeling and interpretations are generally made.
Figure 3: Examples of apparent resistivity and phase curves. Period is a proxy depth parameter and the variation in apparent resistivity (App. Rho.) with period is an indication of how this varies with depth.
MT Data Modeling and Interpretation
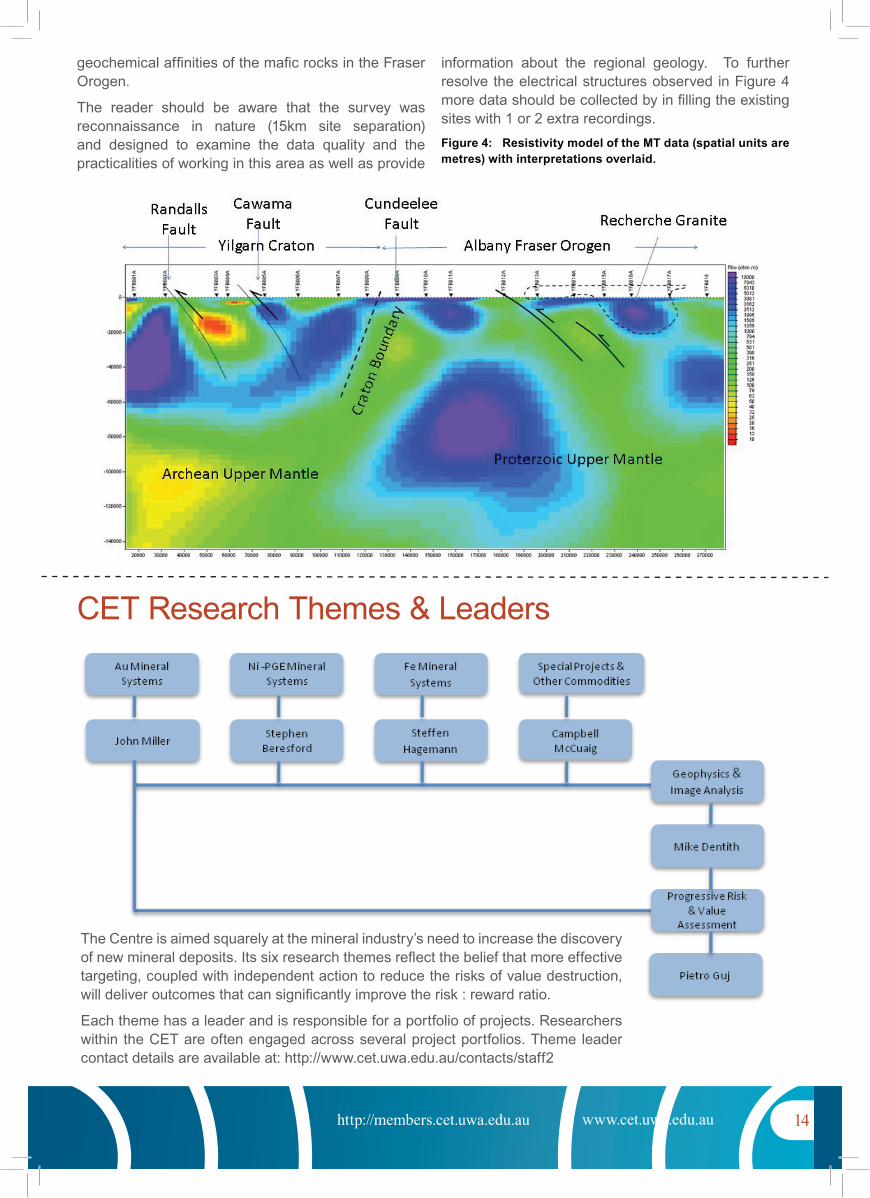
Two-dimensional inversions (assumes resistivity variation laterally along the profile and with depth) were performed on the MT data to produce a resistivity cross section along the profile. The inversion process searches for the smoothest model while still fitting the data. Figure 4 shows a preliminary resistivity image along this profile where hot colours indicate zones of low resistivity and cool colours indicate zones of high resistivity. The image shows significant resistivity variations along the profile and also with depth.
We believe the vertical boundary between a resistive block to the north and conductive block to south below sites 7 and 8 to be indicative of the Archaean-Proterozoic boundary. The conductive block appears to continue at depth which may suggest some large-structures associated with past phases of plate tectonics are preserved. The fact that the boundary is steeply dipping may also be evidence of strike-slip movement. Within the Albany-Fraser Orogen resistive blocks are
cut by a moderately conductive block dipping to the south-east below site 12. Faulting may be the cause of enhanced conductivity within in this block as there is little evidence for conductive material within the rock units themselves.
To the southeast of the vertical boundary responses support geological interpretations of the Fraser Orogen as comprising a series of northwest-verging thrust sheets. Gravity modeling suggests the Fraser Complex is part of this thrust complex and continues to mid-crustal depths. Also, there is evidence for an increase in crustal thickness at the boundary between the Archaean and Proterozoic, perhaps due to flexure of the Archaean crust in response to the load comprising the Proterozoic thurst sheets. On the Yilgarn Craton a series of north-northwest trending faults cross a conductive zone between sites 2 and 5 (Fig.1), although some known faults do not appear to correlate with a conductive anomaly.
The upper mantle below the Albany-Fraser Orogen is quite resistive compared with the upper mantle of the Yilgarn Craton. Typically, the upper mantle of Archaean cratons is very resistive, due to their low geothermal gradient and depletion in iron. This is not the case in parts of the Slave Craton and Superior Cratons of North America where it has been suggested that subduction has refertilised the mantle. This may indicate the survey area once experienced subduction, a scenario which has been suggested based on the
14www.cet.uwa.edu.auhttp://members.cet.uwa.edu.au
geochemical affinities of the mafic rocks in the Fraser Orogen.
The reader should be aware that the survey was reconnaissance in nature (15km site separation) and designed to examine the data quality and the practicalities of working in this area as well as provide
information about the regional geology. To further resolve the electrical structures observed in Figure 4 more data should be collected by in filling the existing sites with 1 or 2 extra recordings.Figure 4: Resistivity model of the MT data (spatial units are metres) with interpretations overlaid.
CET Research Themes & Leaders
The Centre is aimed squarely at the mineral industry’s need to increase the discovery of new mineral deposits. Its six research themes reflect the belief that more effective targeting, coupled with independent action to reduce the risks of value destruction, will deliver outcomes that can significantly improve the risk : reward ratio.
Each theme has a leader and is responsible for a portfolio of projects. Researchers within the CET are often engaged across several project portfolios. Theme leader contact details are available at: http://www.cet.uwa.edu.au/contacts/staff2
15www.cet.uwa.edu.auhttp://members.cet.uwa.edu.au
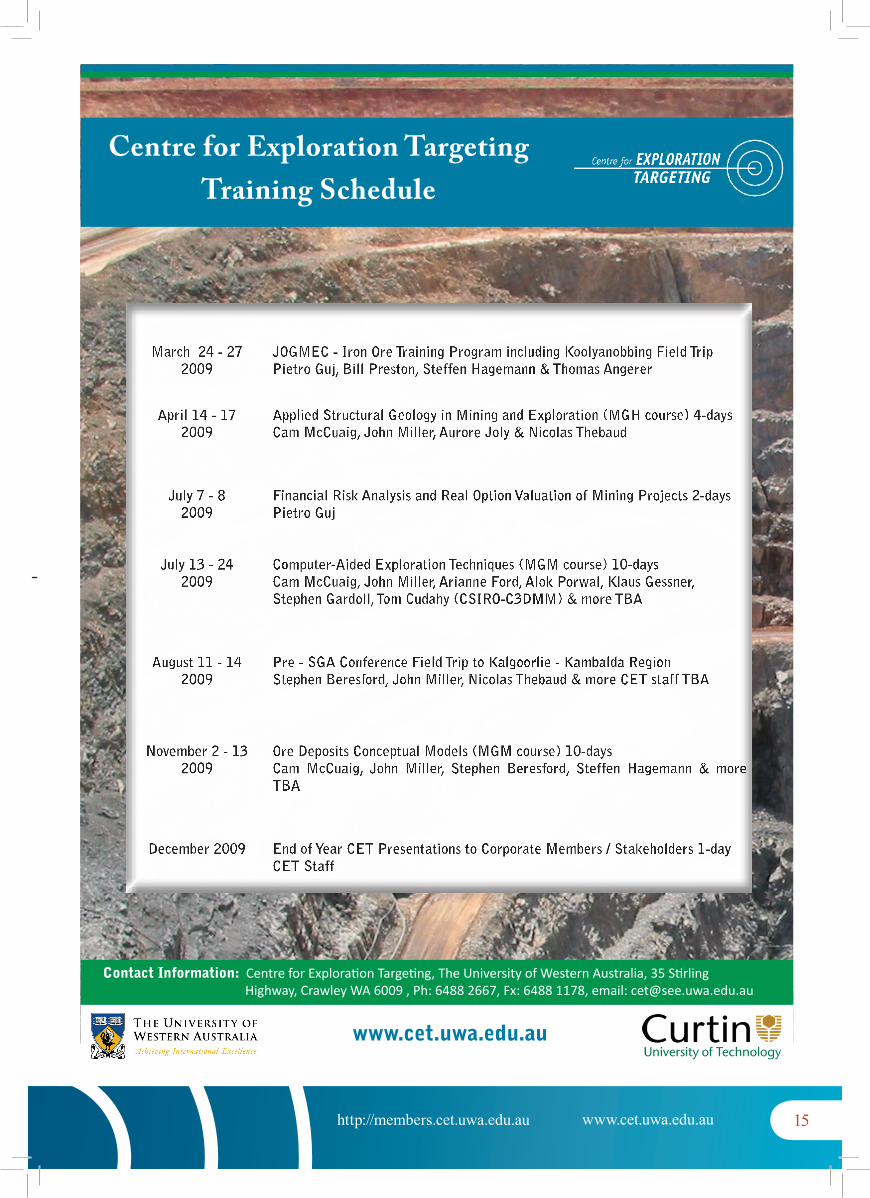
Centre for Exploration Targeting Training Schedule
Contact Information: Centre for Exploration Targeting, The University of Western Australia, 35 Stirling Highway, Crawley WA 6009 , Ph: 6488 2667, Fx: 6488 1178, email: [email protected]
www.cet.uwa.edu.au
16www.cet.uwa.edu.auhttp://members.cet.uwa.edu.au
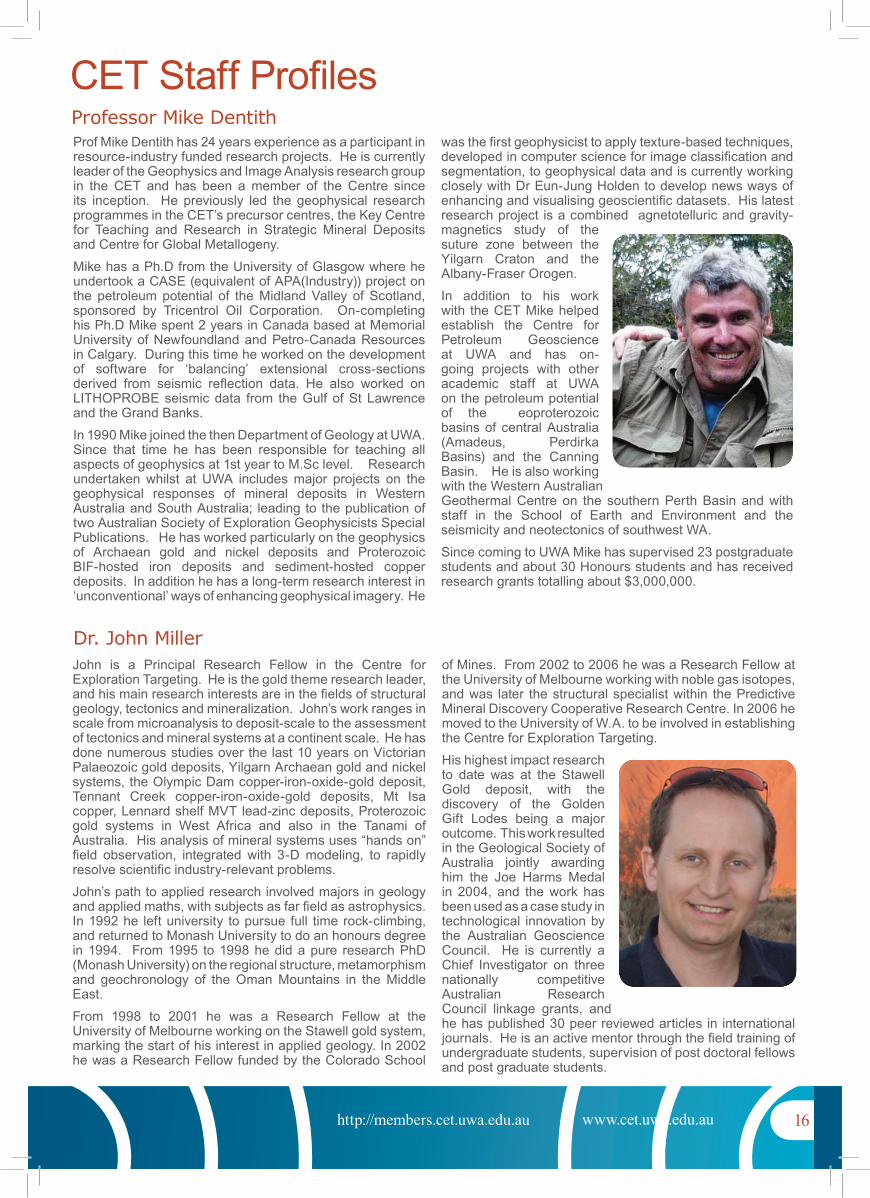
Prof Mike Dentith has 24 years experience as a participant in resource-industry funded research projects. He is currently leader of the Geophysics and Image Analysis research group in the CET and has been a member of the Centre since its inception. He previously led the geophysical research programmes in the CET’s precursor centres, the Key Centre for Teaching and Research in Strategic Mineral Deposits and Centre for Global Metallogeny.
Mike has a Ph.D from the University of Glasgow where he undertook a CASE (equivalent of APA(Industry)) project on the petroleum potential of the Midland Valley of Scotland, sponsored by Tricentrol Oil Corporation. On-completing his Ph.D Mike spent 2 years in Canada based at Memorial University of Newfoundland and Petro-Canada Resources in Calgary. During this time he worked on the development of software for ‘balancing’ extensional cross-sections derived from seismic reflection data. He also worked on LITHOPROBE seismic data from the Gulf of St Lawrence and the Grand Banks.
In 1990 Mike joined the then Department of Geology at UWA. Since that time he has been responsible for teaching all aspects of geophysics at 1st year to M.Sc level. Research undertaken whilst at UWA includes major projects on the geophysical responses of mineral deposits in Western Australia and South Australia; leading to the publication of two Australian Society of Exploration Geophysicists Special Publications. He has worked particularly on the geophysics of Archaean gold and nickel deposits and Proterozoic BIF-hosted iron deposits and sediment-hosted copper deposits. In addition he has a long-term research interest in ‘unconventional’ ways of enhancing geophysical imagery. He
was the first geophysicist to apply texture-based techniques, developed in computer science for image classification and segmentation, to geophysical data and is currently working closely with Dr Eun-Jung Holden to develop news ways of enhancing and visualising geoscientific datasets. His latest research project is a combined agnetotelluric and gravity-magnetics study of the suture zone between the Yilgarn Craton and the Albany-Fraser Orogen.
In addition to his work with the CET Mike helped establish the Centre for Petroleum Geoscience at UWA and has on-going projects with other academic staff at UWA on the petroleum potential of the eoproterozoic basins of central Australia (Amadeus, Perdirka Basins) and the Canning Basin. He is also working with the Western Australian Geothermal Centre on the southern Perth Basin and with staff in the School of Earth and Environment and the seismicity and neotectonics of southwest WA.
Since coming to UWA Mike has supervised 23 postgraduate students and about 30 Honours students and has received research grants totalling about $3,000,000.
Professor Mike Dentith
CET Staff Profiles
John is a Principal Research Fellow in the Centre for Exploration Targeting. He is the gold theme research leader, and his main research interests are in the fields of structural geology, tectonics and mineralization. John’s work ranges in scale from microanalysis to deposit-scale to the assessment of tectonics and mineral systems at a continent scale. He has done numerous studies over the last 10 years on Victorian Palaeozoic gold deposits, Yilgarn Archaean gold and nickel systems, the Olympic Dam copper-iron-oxide-gold deposit, Tennant Creek copper-iron-oxide-gold deposits, Mt Isa copper, Lennard shelf MVT lead-zinc deposits, Proterozoic gold systems in West Africa and also in the Tanami of Australia. His analysis of mineral systems uses “hands on” field observation, integrated with 3-D modeling, to rapidly resolve scientific industry-relevant problems.
John’s path to applied research involved majors in geology and applied maths, with subjects as far field as astrophysics. In 1992 he left university to pursue full time rock-climbing, and returned to Monash University to do an honours degree in 1994. From 1995 to 1998 he did a pure research PhD (Monash University) on the regional structure, metamorphism and geochronology of the Oman Mountains in the Middle East.
From 1998 to 2001 he was a Research Fellow at the University of Melbourne working on the Stawell gold system, marking the start of his interest in applied geology. In 2002 he was a Research Fellow funded by the Colorado School
of Mines. From 2002 to 2006 he was a Research Fellow at the University of Melbourne working with noble gas isotopes, and was later the structural specialist within the Predictive Mineral Discovery Cooperative Research Centre. In 2006 he moved to the University of W.A. to be involved in establishing the Centre for Exploration Targeting.
His highest impact research to date was at the Stawell Gold deposit, with the discovery of the Golden Gift Lodes being a major outcome. This work resulted in the Geological Society of Australia jointly awarding him the Joe Harms Medal in 2004, and the work has been used as a case study in technological innovation by the Australian Geoscience Council. He is currently a Chief Investigator on three nationally competitive Australian Research Council linkage grants, and he has published 30 peer reviewed articles in international journals. He is an active mentor through the field training of undergraduate students, supervision of post doctoral fellows and post graduate students.
Dr. John Miller
17www.cet.uwa.edu.auhttp://members.cet.uwa.edu.au
CET - New PhD Students
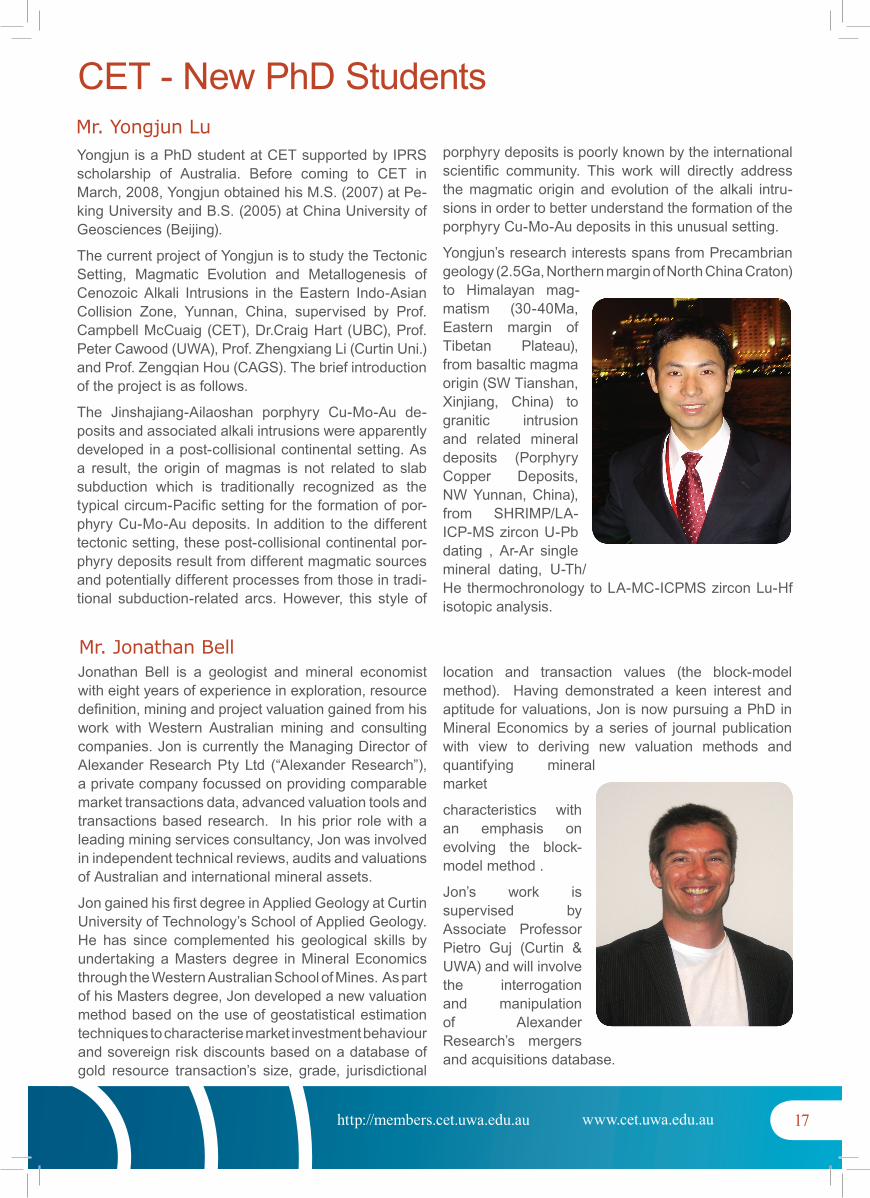
Yongjun is a PhD student at CET supported by IPRS scholarship of Australia. Before coming to CET in March, 2008, Yongjun obtained his M.S. (2007) at Pe-king University and B.S. (2005) at China University of Geosciences (Beijing).
The current project of Yongjun is to study the Tectonic Setting, Magmatic Evolution and Metallogenesis of Cenozoic Alkali Intrusions in the Eastern Indo-Asian Collision Zone, Yunnan, China, supervised by Prof.Campbell McCuaig (CET), Dr.Craig Hart (UBC), Prof. Peter Cawood (UWA), Prof. Zhengxiang Li (Curtin Uni.) and Prof. Zengqian Hou (CAGS). The brief introduction of the project is as follows.
The Jinshajiang-Ailaoshan porphyry Cu-Mo-Au de-posits and associated alkali intrusions were apparently developed in a post-collisional continental setting. As a result, the origin of magmas is not related to slab subduction which is traditionally recognized as the typical circum-Pacific setting for the formation of por-phyry Cu-Mo-Au deposits. In addition to the different tectonic setting, these post-collisional continental por-phyry deposits result from different magmatic sources and potentially different processes from those in tradi-tional subduction-related arcs. However, this style of
porphyry deposits is poorly known by the international scientific community. This work will directly address the magmatic origin and evolution of the alkali intru-sions in order to better understand the formation of the porphyry Cu-Mo-Au deposits in this unusual setting.
Yongjun’s research interests spans from Precambrian geology (2.5Ga, Northern margin of North China Craton) to Himalayan mag-matism (30-40Ma, Eastern margin of Tibetan Plateau), from basaltic magma origin (SW Tianshan, Xinjiang, China) to granitic intrusion and related mineral deposits (Porphyry Copper Deposits, NW Yunnan, China), from SHRIMP/LA-ICP-MS zircon U-Pb dating , Ar-Ar single mineral dating, U-Th/He thermochronology to LA-MC-ICPMS zircon Lu-Hf isotopic analysis.
Mr. Yongjun Lu
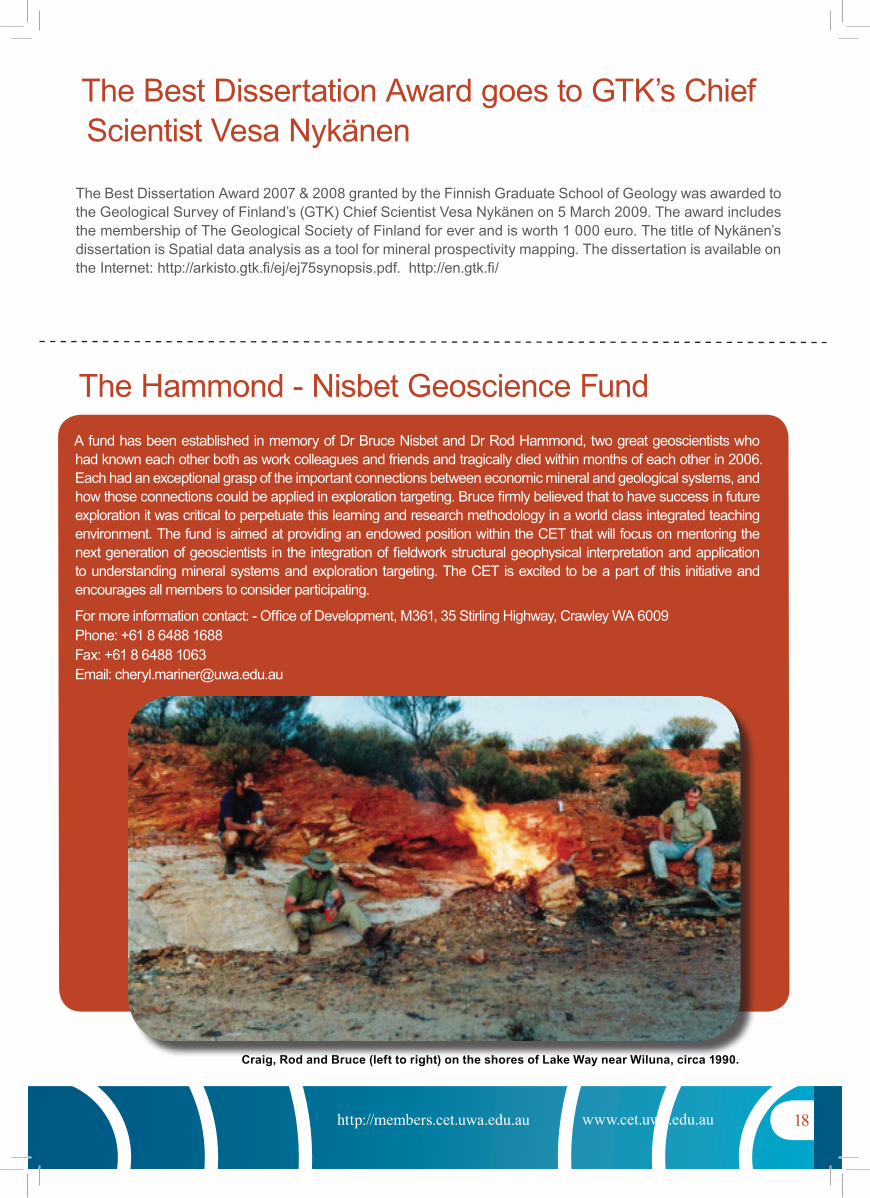
Jonathan Bell is a geologist and mineral economist with eight years of experience in exploration, resource definition, mining and project valuation gained from his work with Western Australian mining and consulting companies. Jon is currently the Managing Director of Alexander Research Pty Ltd (“Alexander Research”), a private company focussed on providing comparable market transactions data, advanced valuation tools and transactions based research. In his prior role with a leading mining services consultancy, Jon was involved in independent technical reviews, audits and valuations of Australian and international mineral assets.
Jon gained his first degree in Applied Geology at Curtin University of Technology’s School of Applied Geology. He has since complemented his geological skills by undertaking a Masters degree in Mineral Economics through the Western Australian School of Mines. As part of his Masters degree, Jon developed a new valuation method based on the use of geostatistical estimation techniques to characterise market investment behaviour and sovereign risk discounts based on a database of gold resource transaction’s size, grade, jurisdictional
location and transaction values (the block-model method). Having demonstrated a keen interest and aptitude for valuations, Jon is now pursuing a PhD in Mineral Economics by a series of journal publication with view to deriving new valuation methods and quantifying mineral market
characteristics with an emphasis on evolving the block-model method .
Jon’s work is supervised by Associate Professor Pietro Guj (Curtin & UWA) and will involve the interrogation and manipulation of Alexander Research’s mergers and acquisitions database.
Mr. Jonathan Bell
18www.cet.uwa.edu.auhttp://members.cet.uwa.edu.au
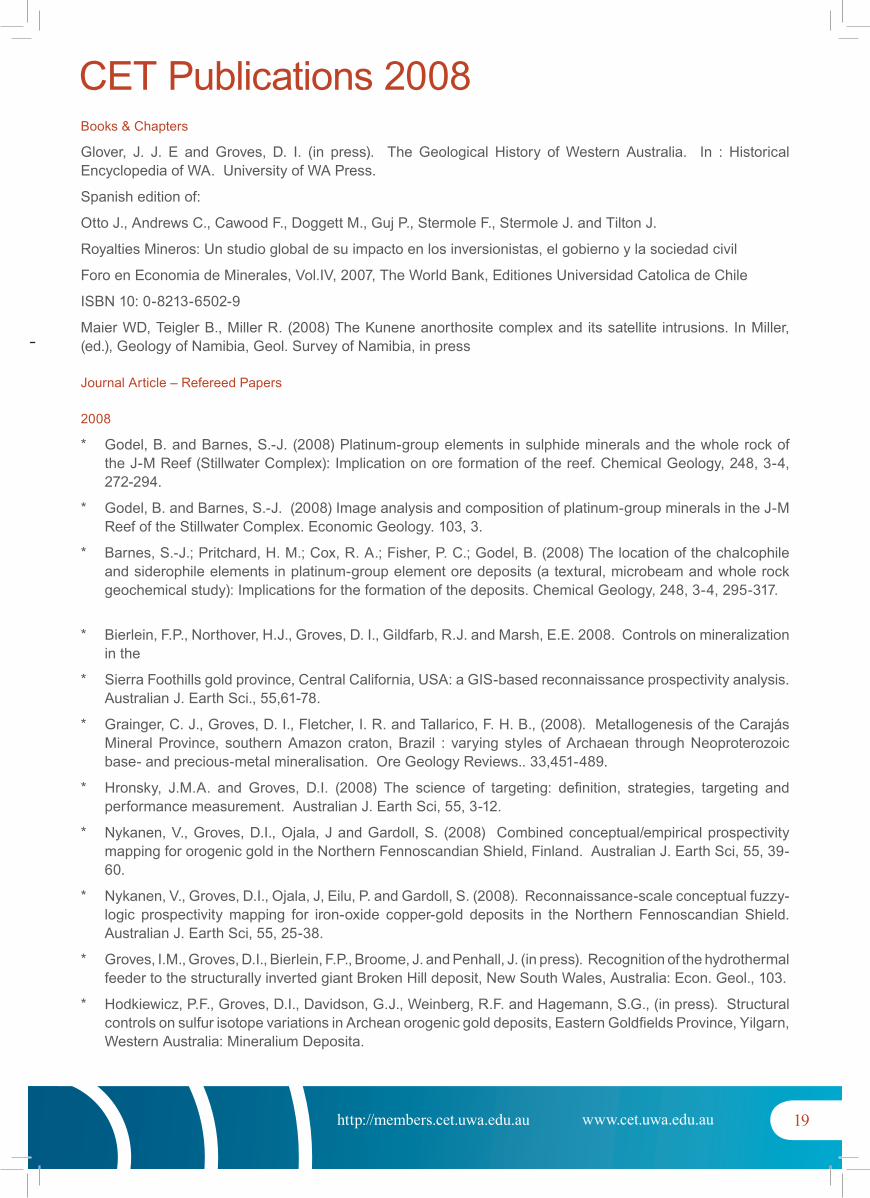
A fund has been established in memory of Dr Bruce Nisbet and Dr Rod Hammond, two great geoscientists who had known each other both as work colleagues and friends and tragically died within months of each other in 2006. Each had an exceptional grasp of the important connections between economic mineral and geological systems, and how those connections could be applied in exploration targeting. Bruce firmly believed that to have success in future exploration it was critical to perpetuate this learning and research methodology in a world class integrated teaching environment. The fund is aimed at providing an endowed position within the CET that will focus on mentoring the next generation of geoscientists in the integration of fieldwork structural geophysical interpretation and application to understanding mineral systems and exploration targeting. The CET is excited to be a part of this initiative and encourages all members to consider participating.
For more information contact: - Office of Development, M361, 35 Stirling Highway, Crawley WA 6009 Phone: +61 8 6488 1688 Fax: +61 8 6488 1063 Email: [email protected]
Craig, Rod and Bruce (left to right) on the shores of Lake Way near Wiluna, circa 1990.
The Best Dissertation Award 2007 & 2008 granted by the Finnish Graduate School of Geology was awarded to the Geological Survey of Finland’s (GTK) Chief Scientist Vesa Nykänen on 5 March 2009. The award includes the membership of The Geological Society of Finland for ever and is worth 1 000 euro. The title of Nykänen’s dissertation is Spatial data analysis as a tool for mineral prospectivity mapping. The dissertation is available on the Internet: http://arkisto.gtk.fi/ej/ej75synopsis.pdf. http://en.gtk.fi/
The Best Dissertation Award goes to GTK’s Chief Scientist Vesa Nykänen
The Hammond - Nisbet Geoscience Fund
19www.cet.uwa.edu.auhttp://members.cet.uwa.edu.au
Books & Chapters
Glover, J. J. E and Groves, D. I. (in press). The Geological History of Western Australia. In : Historical Encyclopedia of WA. University of WA Press.
Spanish edition of:
Otto J., Andrews C., Cawood F., Doggett M., Guj P., Stermole F., Stermole J. and Tilton J.
Royalties Mineros: Un studio global de su impacto en los inversionistas, el gobierno y la sociedad civil
Foro en Economia de Minerales, Vol.IV, 2007, The World Bank, Editiones Universidad Catolica de Chile
ISBN 10: 0-8213-6502-9
Maier WD, Teigler B., Miller R. (2008) The Kunene anorthosite complex and its satellite intrusions. In Miller, (ed.), Geology of Namibia, Geol. Survey of Namibia, in press
Journal Article – Refereed Papers
2008
Godel, B. and Barnes, S.-J. (2008) Platinum-group elements in sulphide minerals and the whole rock of * the J-M Reef (Stillwater Complex): Implication on ore formation of the reef. Chemical Geology, 248, 3-4, 272-294.
Godel, B. and Barnes, S.-J. (2008) Image analysis and composition of platinum-group minerals in the J-M * Reef of the Stillwater Complex. Economic Geology. 103, 3.
Barnes, S.-J.; Pritchard, H. M.; Cox, R. A.; Fisher, P. C.; Godel, B. (2008) The location of the chalcophile * and siderophile elements in platinum-group element ore deposits (a textural, microbeam and whole rock geochemical study): Implications for the formation of the deposits. Chemical Geology, 248, 3-4, 295-317.
Bierlein, F.P., Northover, H.J., Groves, D. I., Gildfarb, R.J. and Marsh, E.E. 2008. Controls on mineralization * in the
Sierra Foothills gold province, Central California, USA: a GIS-based reconnaissance prospectivity analysis. * Australian J. Earth Sci., 55,61-78.
Grainger, C. J., Groves, D. I., Fletcher, I. R. and Tallarico, F. H. B., (2008). Metallogenesis of the Carajás * Mineral Province, southern Amazon craton, Brazil : varying styles of Archaean through Neoproterozoic base- and precious-metal mineralisation. Ore Geology Reviews.. 33,451-489.
Hronsky, J.M.A. and Groves, D.I. (2008) The science of targeting: definition, strategies, targeting and * performance measurement. Australian J. Earth Sci, 55, 3-12.
Nykanen, V., Groves, D.I., Ojala, J and Gardoll, S. (2008) Combined conceptual/empirical prospectivity * mapping for orogenic gold in the Northern Fennoscandian Shield, Finland. Australian J. Earth Sci, 55, 39-60.
Nykanen, V., Groves, D.I., Ojala, J, Eilu, P. and Gardoll, S. (2008). Reconnaissance-scale conceptual fuzzy-* logic prospectivity mapping for iron-oxide copper-gold deposits in the Northern Fennoscandian Shield. Australian J. Earth Sci, 55, 25-38.
Groves, I.M., Groves, D.I., Bierlein, F.P., Broome, J. and Penhall, J. (in press). Recognition of the hydrothermal * feeder to the structurally inverted giant Broken Hill deposit, New South Wales, Australia: Econ. Geol., 103.
Hodkiewicz, P.F., Groves, D.I., Davidson, G.J., Weinberg, R.F. and Hagemann, S.G., (in press). Structural * controls on sulfur isotope variations in Archean orogenic gold deposits, Eastern Goldfields Province, Yilgarn, Western Australia: Mineralium Deposita.
CET Publications 2008
20www.cet.uwa.edu.auhttp://members.cet.uwa.edu.au
Sarma, S., Mc Naughton, N.J., Fletcher, I.R., Groves, D.I., Mohan, M.R. and Balaram, V. (submitted). * Timing of gold mineralization at the Hutti Gold Deposit, Dharwar Craton, South India. Econ. Geol.
Guj P., Statistical considerations of progressive value and risk in mineral exploration. Resources Policy, * accepted for publication 29 January 2008
Lobato, L., Figureiredo e Silva, R., Hagemann, S.G., Thorne, W., Zucchetti, M., Gutzmer, J., 2008, * Hypogene hydrothermal alteration associated with BIF-related iron ore mineralization in Hagemann, S.G., Rosiere, C. , Gutzmer, J., and Beukes, N., (eds), Reviews In Economic Geology, Volume 15: High-grade BIF-related iron mineralization, p. X-XX.
Figueiredo e Silva, R., Lobato, L. M., Rosiere, C.A., Zucchetti, M., Hagemann, S.G., Baars, F.J., Morais, * R., and Andrade, ,I., 2008, Hydrothermal origin for the jaspilite-hosted, giant Serra Norte iron ore deposits in the Carajás Mineral Province, Pará State, Brazil, in Hagemann, S.G., Rosiere, C. , Gutzmer, J., and Beukes, N., (eds), Reviews In Economic Geology, Volume 15: High-grade BIF-related iron mineralization, p. X-XX.
Thorne, W. , Hagemann, S.G., Webb, A., Lascelles, D. , and Clout, J., 2008, BIF-related deposits of the * Hamersley province, Western Australia, in Hagemann, S.G., Rosiere, C. , Gutzmer, J., and Beukes, N., (eds), Reviews In Economic Geology, Volume 15: High-grade BIF-related iron mineralization, p. X-XX.
Hagemann, S.G., Rosiere, C., Gutzmer, J., Beukes, N.J., 2008, Glossary of Terms Banded Iron-Formation-* related high-grade iron ore, in Hagemann, S.G., Rosiere, C. , Gutzmer, J., and Beukes, N., (eds), Reviews In Economic Geology, Volume 15: High-grade BIF-related iron mineralization, p. X-XX.
Hagemann, S.G., Rosiere, C., Gutzmer, J., Beukes, N.J., 2008, Introduction Banded Iron Formation-related * high-grade iron ore, in Hagemann, S.G., Rosiere, C. , Gutzmer, J., and Beukes, N., (eds), Reviews In Economic Geology, Volume 15: High-grade BIF-related iron mineralization, p. X-XX.
Hodkiewics, P.F., Groves, D.I., Hagemann, S.G., Davidson, G., in press, Controls on sulfur isotope * variations in Archean orogenic gold deposits, Western Goldfields Province, Yilgarn, Western Australia: Mineralium Deposita.
Le Y., Zhang, D., Holden, E. J., 2008, A fast and fully automatic registration approach based on point * features for multi-source remote-sensing images. Computers & Geosciences, 34(7): 838-848.
Baker, B., Gessner, K., Holden, E. J., Squelch, A., 2008, Automatic detection of anisotropic features on * rock surfaces, Geosphere, 4(2), April.
Guillen Antonio, Calcagno Philippe, Courrioux Gabriel, Joly Aurore, Ledru Patrick (2008). 3D realistic * modelling of geology from field data and geological knowledge, Part II – Modelling validation using of gravity and magnetic data inversion. Physics of the Earth and Planetary Interiors, doi:10.1016/j.pepi.2008.06.014
Joly Aurore, Chen Yan, Faure Michel and Martelet Guillaume (2008). A multidisciplinary study of a syntectonic * pluton close to a major lithospheric-scale fault: relationships between the Montmarault granitic massif and the Sillon Houiller Fault in the Variscan French Massif Central. Part Part II: Gravity, aeromagnetic investigations and 3D numeric modelling, J. Geophys. Res., doi:10.1029/2006JB004744, online (http://www.agu.org/pubs/crossref/2008/2006JB004744.shtml).
Martelet Guillaume, Truffert Catherine, Joly Aurore, Faure Michel, Chen Yan, Courrioux Gabriel (2008). * Modélisation géologique 3D des socles, Géochronique.
Lascelles, D.F. 2008. Banded iron-formation to high-grade ore - the fallacy of supergene enrichment. * PACRIM Congress, November 2008.
Manikyamba, C., Kerrich, R., González-Álvarez, I., Mathur, R., Khanna, T.C., 2008. Geochemistry of * Paleoproterozoic black shales from the Intracontinental Cuddapah basin, India: implications for provenance, tectonic setting, and weathering intensity. Precambrian Research, 162, 424–440.
Thébaud N, Philippot P, Rey P, Brugger J, Van Kranendonk M and Grassineau N, (2008). *
Protracted fluid-rock interaction in the Mesoarchaean and implication for gold mineralization: Example *
21www.cet.uwa.edu.auhttp://members.cet.uwa.edu.au
from the Warrawoona Syncline (WA). Earth Planetary Science Letters, (in-press).doi:10.1016/j.epsl.2008.05.030
Thébaud N, Hollingsworth D, (2008) The Paddy’s Flat Gold District (Murchison, W.A.): Insight into rheologically * and structurally controled gold mineralization, AESC Perth
Thébaud N, Hollingsworth D, (2008) The Prohibition gold deposit (Murchison, Western Australia), a BIF * hosted lode gold deposit with a protracted fluid-rock interaction history, AESC Perth
Journal Articles in press
Anderson, J., Barnes, S., Smith, T., Bagas, L., in press. The Mordor alkaline igneous complex of central * Australia: Economic Geology.
Bagas, L., Bierlein, F.P., English, L., Anderson, J., Maidment, D., Huston, D.L., in press. An example of a * Palaeoproteozoic back-arc basin: petrology and geochemistry of the ca. 1864 Ma Stubbins Formation as an aid towards an improved understanding of the Granites–Tanami Orogen, Western Australia: Precambrian Research.
Bagas, L., Bierlein, F.P., Bodorkos, S., Nelson, D.R., in press. Tectonic setting, evolution and orogenic * gold potential of the late Mesoarchaean Mosquito Creek Basin, North Pilbara Craton, Western Australia: Precambrian Research.
Maas, R., Bagas, L., in press. Kintyre U-deposit, Paterson Orogen, Western Australia: U-Pb and Sr-Nd * isotopic constraints on the genesis of a large unconformity-type U deposit and its link to sedimentary sequences of the Neoproterozoic Centralia Superbasin: Economic Geology.
Pirajno, F., Bagas, L., in press. A review of Australia’s Proterozoic mineral systems and genetic models: * Precambrian Research.
Barley M.E., Brown S.J.A., Krapež B. & Kositcin N., 2008. Physical volcanology, and geochemistry of Late * Archaean volcanic arc associated rocks in the Kurnalpi and Gindalbie Terranes, eastern Yilgarn Craton. Precambrian Res., 161, 53-76.
Krapež B., Barley M.E. & Brown S.J., 2008. Late Archaean synorogenic basins of the Eastern Goldfields * Province, Western Australia. Part I: Kalgoorlie and Gindalbie Terranes. Precambrian Res., 161, 135-153.
Krapež B., Standing J.G., Brown S.J. Barley M.E., 2008. Late Archaean synorogenic basins of the Eastern * Goldfields Province, Western Australia. Part II: Kurnalpi Terrane. Precambrian Res., 161, 154-182.
Krapež B., Barley M.E., 2008. Late Archaean synorogenic basins of the Eastern Goldfields Superterrane, * Yilgarn Craton, Western Australia. Part III: signatures of tectonic escape in an arc-continent collision zone. Precambrian Res., 161, 183-199.
Kositcin N., Brown S.J.A., Barley M.E., Cassidy, K. & Krapež, B., 2008. SHRIMP age constraints on * the tectonostratigraphic evolution of the Late Archaean Eastern Goldfields Province, Western Australia. Precambrian Res., 161, 5-33.
Fiorentini M.L., Beresford S.W., & Barley M.E., 2008. Ruthenium-Chromium variation: a new lithogeochemical * tool in the exploration for komatiite-hosted Fe-Ni-(PGE) deposits. Economic Geology, 103, 431-437.
Godel, B., Maier, W. D and Barnes, S.-J. Platinum-group element in the Merensky and J-M reefs: a review * of recent studies. Geological Society of India Special publication, Orthomagmatic ore deposits related to mafic-ultramafic rocks with special emphasis on chromite, Ni-Cu-sulfides, Ti-V-bearing magnetite, and PGE depositions.
Holden E. J., Dentith M. and Kovesi P., In Press, Towards the Automatic Analysis of Regional Aeromagnetic * Data to Identify Regions Prospective for Gold Deposits, Computers & Geosciences.
22www.cet.uwa.edu.auhttp://members.cet.uwa.edu.au
Conferences Publications / Abstracts
2008
Barley M.E., 2008. Sedimentological evidence for the origin of Paleoproterozoic, Banded Iron Formations in * the Hamersley Province of Western Australia. Abstracts 18th Annual Goldschmidt Conference. Vancouver.
Barley M.E., 2008. Banded Iron Formations and Paleoproterozoic high-grade iron ores: key rocks in Earth * evolution and a major mineral resource. Abstracts 33rd International Geological Congress. Oslo.
Barley M.E., Stein, H.J, Cummins B., Bekker A., 2008. The Spinifex Ridge 3.3 Ga porphyry-style Mo-Cu * deposit, East Pilbara, Western Australia. Abstracts 33rd International Geological Congress. Oslo.
Godel, B., Maier, W. D. and Barnes, S.-J. (2008) The Merensky Reef of the Bushveld Complex: a X-ray * computed tomography, microstructural, geochemical and mineralogical study. Australian Earth Sciences Convention, Perth.
Holden, E. J., Dentith, M. C, Moss, S. and Russell, K., 2008, Automated Polished Slab Image Analysis for * Olivine Crystal Size Distribution Detection, Australian Earth Science Convention, July, Perth, Australia
Holden, E. J. and Dentith, M. C, 2008, Interpretation of Aeromagnetic Datasets for Gold and Diamond * Exploration: An Image-Analysis Approach, Australian Earth Science Convention, July, Perth, Australia
Ian Gregory, John Miller, Geoff Heggie and Aurore Joly (2008). A collaborative approach to developing a * nickel exploration model in the Lake Johnston Greenstone Belt, Western Australia, AESC, 20-24 July, Perth, WA.
MSc Ore Deposit Geology & EvaluationThe coursework Masters program is designed for geoscientists who want to gain up to date knowledge and skills in economic geology and mineral exploration. The course at UWA is part of the national Minerals Geoscience Masters program and is supported by the Minerals Council of Australia. The program is run jointly between the Centre for Exploration Targeting (UWA), CODES (UTAS), EGRU (JCU) and Curtin University of Technolgy (CUT).
The Masters course can be completed in three ways:
Option 1 - (8 coursework units) Eight units of course work: at least two of which must be undertaken at UWA. The other units are done at UWA or at the other participating universities.
Option 2 - (6 coursework units + dissertation) Six units of course work and a dissertation (25% of overall assessment). Two of the units must be completed at UWA.
Option 3 - (3 coursework units + thesis) Three coursework units and a thesis which accounts for 62.5% of the overall assessment. The thesis is similar to an honours project in scope.
Courses offered by the CET:
Computer-Aided Exploration Techniques, Jul 2009 •
Ore Deposit Conceptual Models, Nov 2009•
Applied Structural & Field Geology, Jul 2010•
South African Ore Deposits Field Excursion, Nov 2010•
Contact InformationIf you would like to find out more about the CET, its Corporate Membership program, Applied Research opportunities or Training possibilities, please contact:
Centre for Exploration TargetingThe University of Western Australia 35 Stirling Highway CRAWLEY WA 6009
Phone: +61 8 6488 2667
Fax: +61 8 6488 1178
Email: [email protected]
Website: www.cet.uwa.edu.au
CRICOS Provider Code : 00126G