cf3 ch10eoc
TRANSCRIPT
Answers and Solutions: 10- 1
Chapter 10 The Basics of Capital Budgeting:
Evaluating Cash Flows ANSWERS TO END-OF-CHAPTER QUESTIONS
10-1 a. Capital budgeting is the whole process of analyzing projects and deciding whether they should be included in the capital budget. This process is of fundamental importance to the success or failure of the firm as the fixed asset investment decisions chart the course of a company for many years into the future. The payback, or payback period, is the number of years it takes a firm to recover its project investment. Payback may be calculated with either raw cash flows (regular payback) or discounted cash flows (discounted payback). In either case, payback does not capture a project's entire cash flow stream and is thus not the preferred evaluation method. Note, however, that the payback does measure a project's liquidity, and hence many firms use it as a risk measure.
b. Mutually exclusive projects cannot be performed at the same time. We can choose
either Project 1 or Project 2, or we can reject both, but we cannot accept both projects. Independent projects can be accepted or rejected individually.
c. The net present value (NPV) and internal rate of return (IRR) techniques are
discounted cash flow (DCF) evaluation techniques. These are called DCF methods because they explicitly recognize the time value of money. NPV is the present value of the project's expected future cash flows (both inflows and outflows), discounted at the appropriate cost of capital. NPV is a direct measure of the value of the project to shareholders. The internal rate of return (IRR) is the discount rate that equates the present value of the expected future cash inflows and outflows. IRR measures the rate of return on a project, but it assumes that all cash flows can be reinvested at the IRR rate.
d. The modified internal rate of return (MIRR) assumes that cash flows from all projects
are reinvested at the cost of capital as opposed to the project's own IRR. This makes the modified internal rate of return a better indicator of a project's true profitability. The profitability index is found by dividing the project’s PV of future cash flows by its initial cost. A profitability index greater than 1 is equivalent to a positive NPV project.
e. An NPV profile is the plot of a project's NPV versus its cost of capital. The crossover
rate is the cost of capital at which the NPV profiles for two projects intersect.
Answers and Solutions: 10 - 2
f. Capital projects with nonnormal cash flows have a large cash outflow either sometime during or at the end of their lives. A common problem encountered when evaluating projects with nonnormal cash flows is multiple IRRs. A project has normal cash flows if one or more cash outflows (costs) are followed by a series of cash inflows.
g. The hurdle rate is the project cost of capital, or discount rate. It is the rate used in
discounting future cash flows in the NPV method, and it is the rate that is compared to the IRR. The mathematics of the NPV method imply that project cash flows are reinvested at the cost of capital while the IRR method assumes reinvestment at the IRR. Since project cash flows can be replaced by new external capital which costs r, the proper reinvestment rate assumption is the cost of capital, and thus the best capital budget decision rule is NPV.
h. A replacement chain is a method of comparing mutually exclusive projects that have
unequal lives. Each project is replicated such that they will both terminate in a common year. If projects with lives of 3 years and 5 years are being evaluated, the 3-year project would be replicated 5 times and the 5-year project replicated 3 times; thus, both projects would terminate in 15 years. Not all projects maximize their NPV if operated over their engineering lives and therefore it may be best to terminate a project prior to its potential life. The economic life is the number of years a project should be operated to maximize its NPV, and is often less than the maximum potential life. Capital rationing occurs when management places a constraint on the size of the firm’s capital budget during a particular period.
10-2 Project requiring greater investments or that have greater risk should be given detailed
analysis the capital budgeting process. 10-3 The NPV is obtained by discounting future cash flows, and the discounting process
actually compounds the interest rate over time. Thus, an increase in the discount rate has a much greater impact on a cash flow in Year 5 than on a cash flow in Year 1.
10-4 This question is related to Question 10-3 and the same rationale applies. With regard to
the second part of the question, the answer is no; the IRR rankings are constant and independent of the firm's cost of capital.
10-5 The NPV and IRR methods both involve compound interest, and the mathematics of
discounting requires an assumption about reinvestment rates. The NPV method assumes reinvestment at the cost of capital, while the IRR method assumes reinvestment at the IRR. MIRR is a modified version of IRR which assumes reinvestment at the cost of capital.
10-6 Generally, the failure to employ common life analysis in such situations will bias the
NPV against the shorter project because it "gets no credit" for profits beyond its initial life, even though it could possibly be "renewed" and thus provide additional NPV.
Answers and Solutions: 10- 3
SOLUTIONS TO END-OF-CHAPTER PROBLEMS 10-1 NPV = -$52,125 + $12,000[(1/I)-(1/(I*(1+I)N)] = -$52,125 + $12,000[(1/0.12)-(1/(0.12*(1+0.12)8)]
= $7,486.68.
Financial calculator: Input the appropriate cash flows into the cash flow register, input I = 12, and then solve for NPV = $7,486.68.
10-2 Financial calculator: Input the appropriate cash flows into the cash flow register and then
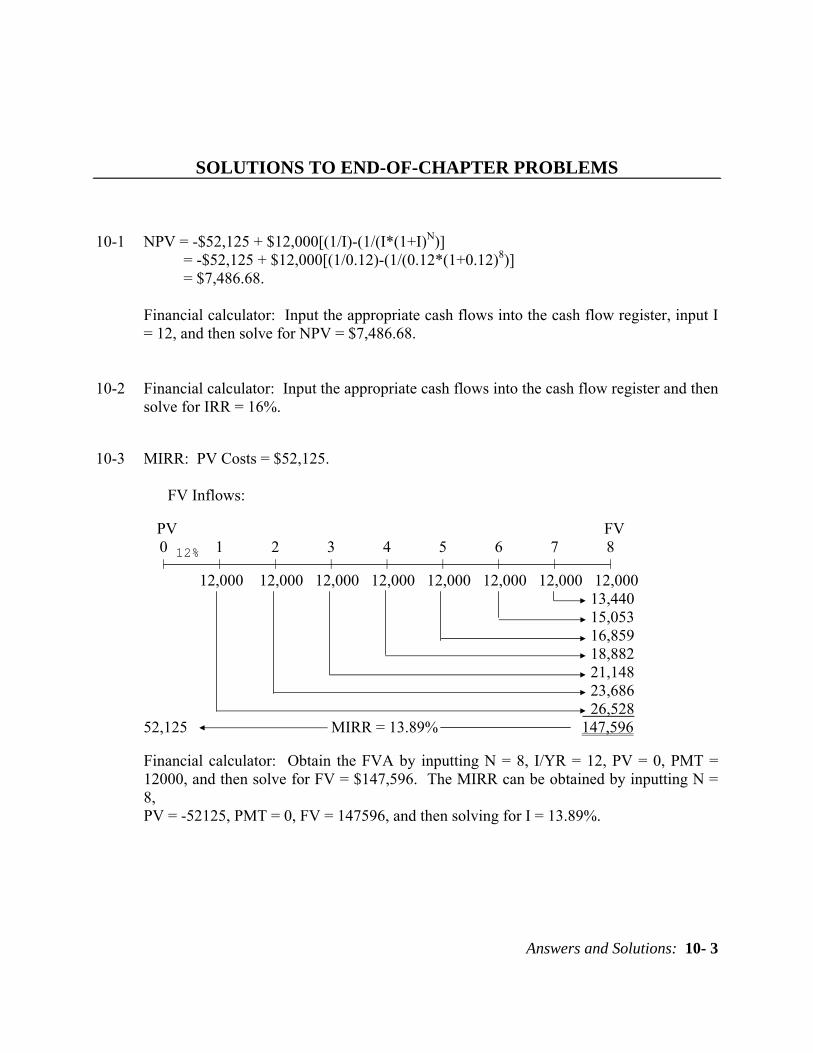
solve for IRR = 16%. 10-3 MIRR: PV Costs = $52,125.
FV Inflows: PV FV 0 1 2 3 4 5 6 7 8 | | | | | | | | | 12,000 12,000 12,000 12,000 12,000 12,000 12,000 12,000 13,440 15,053 16,859 18,882 21,148 23,686 26,528 52,125 MIRR = 13.89% 147,596 Financial calculator: Obtain the FVA by inputting N = 8, I/YR = 12, PV = 0, PMT = 12000, and then solve for FV = $147,596. The MIRR can be obtained by inputting N = 8, PV = -52125, PMT = 0, FV = 147596, and then solving for I = 13.89%.
12%
Answers and Solutions: 10 - 4
10-4 PV = $12,000[(1/I)-(1/(I*(1+I)N)] = $12,000[(1/0.12)-(1/(0.12*(1+0.12)8)]
= $59,611.68.
Financial calculator: Find present value of future cash flows by inputting N = 8, I/YR = 12, PMT = -12000, FV = 0, then solve for PV = $59,611.68. PI = PV of future cash flows / Initial cost = $59,611.68/$52,125 = 1.14.
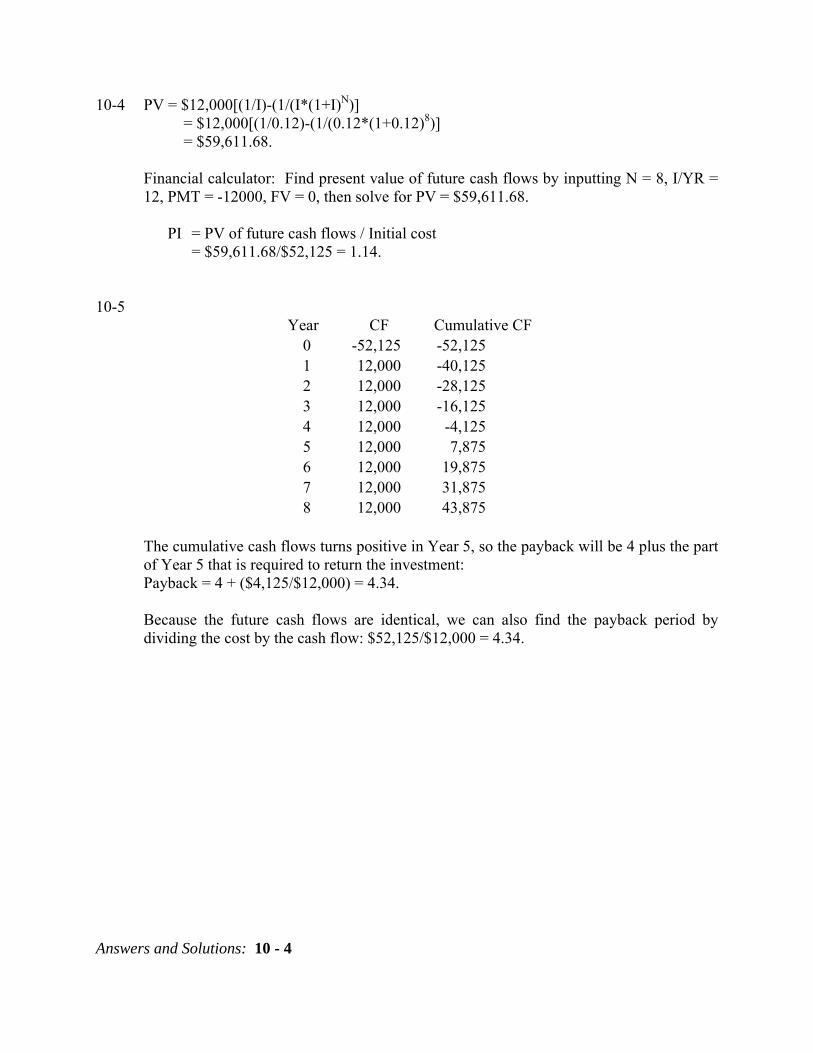
10-5
Year CF Cumulative CF 0 -52,125 -52,125 1 12,000 -40,125 2 12,000 -28,125 3 12,000 -16,125 4 12,000 -4,125 5 12,000 7,875 6 12,000 19,875 7 12,000 31,875 8 12,000 43,875
The cumulative cash flows turns positive in Year 5, so the payback will be 4 plus the part of Year 5 that is required to return the investment: Payback = 4 + ($4,125/$12,000) = 4.34.
Because the future cash flows are identical, we can also find the payback period by dividing the cost by the cash flow: $52,125/$12,000 = 4.34.
Answers and Solutions: 10- 5
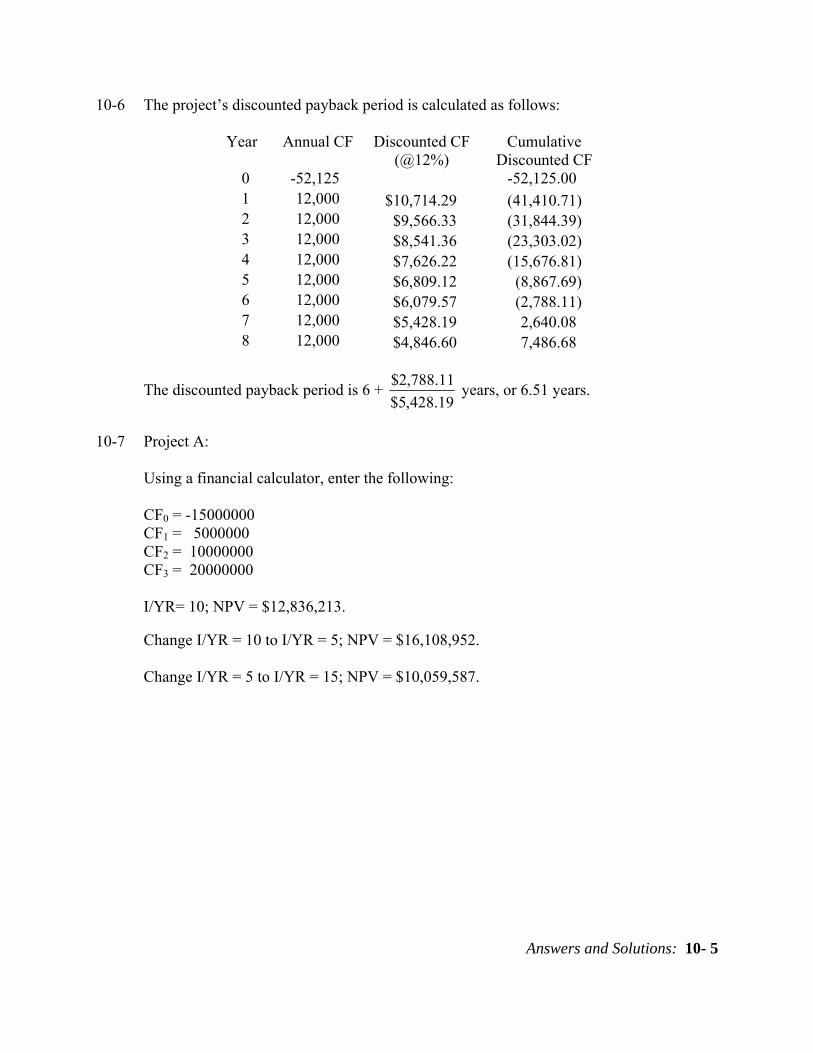
10-6 The project’s discounted payback period is calculated as follows:
Year Annual CF Discounted CF (@12%)
Cumulative Discounted CF
0 -52,125 -52,125.00 1 12,000 $10,714.29 (41,410.71) 2 12,000 $9,566.33 (31,844.39) 3 12,000 $8,541.36 (23,303.02) 4 12,000 $7,626.22 (15,676.81) 5 12,000 $6,809.12 (8,867.69) 6 12,000 $6,079.57 (2,788.11) 7 12,000 $5,428.19 2,640.08 8 12,000 $4,846.60 7,486.68
The discounted payback period is 6 + 19.428,5$11.788,2$ years, or 6.51 years.
10-7 Project A:
Using a financial calculator, enter the following:
CF0 = -15000000 CF1 = 5000000 CF2 = 10000000 CF3 = 20000000
I/YR= 10; NPV = $12,836,213.
Change I/YR = 10 to I/YR = 5; NPV = $16,108,952.
Change I/YR = 5 to I/YR = 15; NPV = $10,059,587.
Answers and Solutions: 10 - 6
Project B:
Using a financial calculator, enter the following:
CF0 = -15000000 CF1 = 20000000 CF2 = 10000000 CF3 = 6000000
I/YR = 10; NPV = $15,954,170.
Change I/YR = 10 to I/YR = 5; NPV = $18,300,939. Change I/YR = 5 to I/YR = 15; NPV = $13,897,838.
10-8 Truck:
NPV = -$17,100 + $5,100(PVIFA14%,5) = -$17,100 + $5,100(3.4331) = -$17,100 + $17,509 = $409. (Accept)
Financial calculator: Input the appropriate cash flows into the cash flow register, input I/YR = 14, and then solve for NPV = $409.
Financial calculator: Input the appropriate cash flows into the cash flow register and then solve for IRR = 14.99% ≈ 15%.
MIRR: PV Costs = $17,100.
FV Inflows:
PV FV 0 1 2 3 4 5 | | | | | | 5,100 5,100 5,100 5,100 5,100 5,814 6,628 7,556 8,614 17,100 MIRR = 14.54% (Accept) 33,712
Financial calculator: Obtain the FVA by inputting N = 5, I/YR = 14, PV = 0, PMT = 5100, and then solve for FV = $33,712. The MIRR can be obtained by inputting N = 5, PV = -17100, PMT = 0, FV = 33712, and then solving for I/YR = 14.54%.
14%
Answers and Solutions: 10- 7
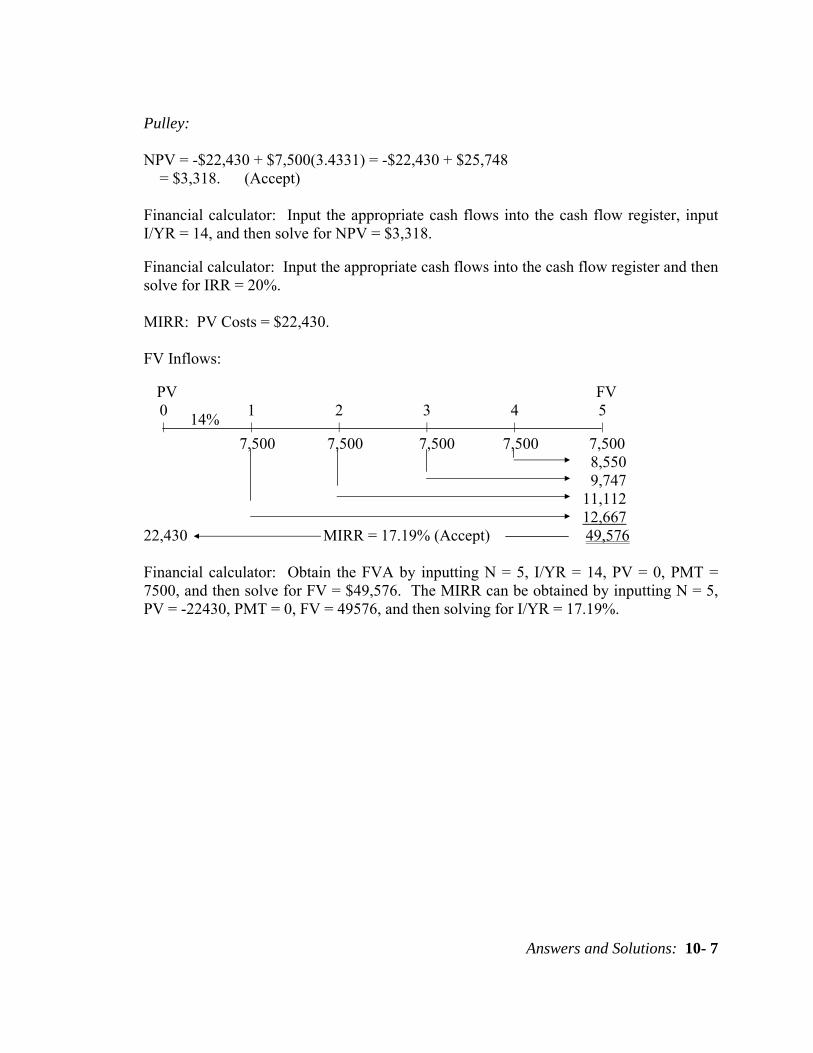
Pulley:
NPV = -$22,430 + $7,500(3.4331) = -$22,430 + $25,748 = $3,318. (Accept)
Financial calculator: Input the appropriate cash flows into the cash flow register, input I/YR = 14, and then solve for NPV = $3,318.
Financial calculator: Input the appropriate cash flows into the cash flow register and then solve for IRR = 20%.
MIRR: PV Costs = $22,430.
FV Inflows:
PV FV 0 1 2 3 4 5 | | | | | | 7,500 7,500 7,500 7,500 7,500 8,550 9,747 11,112 12,667 22,430 MIRR = 17.19% (Accept) 49,576
Financial calculator: Obtain the FVA by inputting N = 5, I/YR = 14, PV = 0, PMT = 7500, and then solve for FV = $49,576. The MIRR can be obtained by inputting N = 5, PV = -22430, PMT = 0, FV = 49576, and then solving for I/YR = 17.19%.
14%

Answers and Solutions: 10 - 8
10-9 Electric-powered:
NPVE = -$22,000 + $6,290 [(1/i)-(1/(i*(1+i)n)] = -$22,000 + $6,290 [(1/0.12)-(1/(0.12*(1+0.12)6)] = -$22,000 + $6,290(4.1114) = -$22,000 + $25,861 = $3,861.
Financial calculator: Input the appropriate cash flows into the cash flow register, input I/YR = 12, and then solve for NPV = $3,861.
Financial calculator: Input the appropriate cash flows into the cash flow register and then solve for IRR = 18%.
Gas-powered:
NPVG = -$17,500 + $5,000 [(1/i)-(1/(i*(1+i)n)] = -$17,500 + $5,000 [(1/0.12)-(1/(0.12*(1+0.12)6)] = -$17,500 + $5,000(4.1114) = -$17,500 + $20,557 = $3,057.
Financial calculator: Input the appropriate cash flows into the cash flow register, input I/YR = 12, and then solve for NPV = $3,057.
Financial calculator: Input the appropriate cash flows into the cash flow register and then solve for IRR = 17.97% ≈ 18%.
The firm should purchase the electric-powered forklift because it has a higher NPV than the gas-powered forklift. The company gets a high rate of return (18% > r = 12%) on a larger investment.
Answers and Solutions: 10- 9
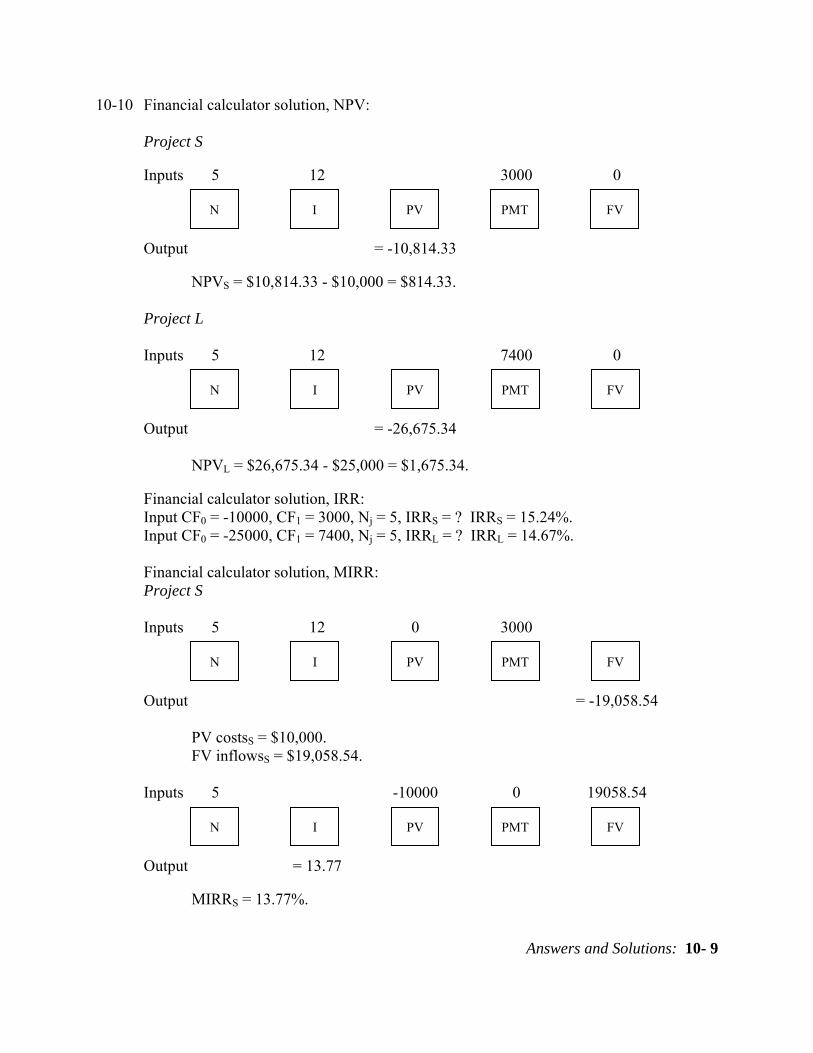
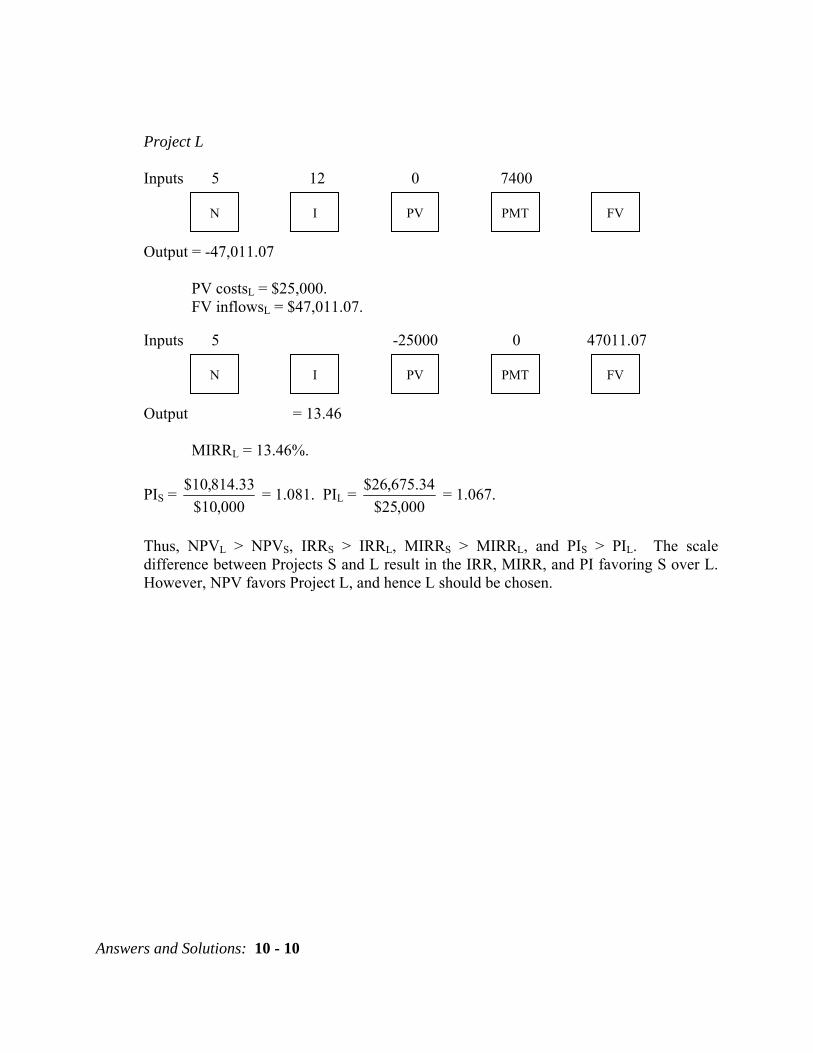
10-10 Financial calculator solution, NPV: Project S Inputs 5 12 3000 0 Output = -10,814.33 NPVS = $10,814.33 - $10,000 = $814.33. Project L Inputs 5 12 7400 0 Output = -26,675.34 NPVL = $26,675.34 - $25,000 = $1,675.34. Financial calculator solution, IRR: Input CF0 = -10000, CF1 = 3000, Nj = 5, IRRS = ? IRRS = 15.24%. Input CF0 = -25000, CF1 = 7400, Nj = 5, IRRL = ? IRRL = 14.67%.
Financial calculator solution, MIRR: Project S Inputs 5 12 0 3000 Output = -19,058.54 PV costsS = $10,000. FV inflowsS = $19,058.54. Inputs 5 -10000 0 19058.54 Output = 13.77 MIRRS = 13.77%.
N I FV PMT PV
N I FV PMT PV
N I FV PMT PV
N I FV PMT PV
Answers and Solutions: 10 - 10
Project L Inputs 5 12 0 7400 Output = -47,011.07 PV costsL = $25,000. FV inflowsL = $47,011.07. Inputs 5 -25000 0 47011.07 Output = 13.46 MIRRL = 13.46%.
PIS = 000,10$
33.814,10$ = 1.081. PIL = 000,25$
34.675,26$ = 1.067.
Thus, NPVL > NPVS, IRRS > IRRL, MIRRS > MIRRL, and PIS > PIL. The scale difference between Projects S and L result in the IRR, MIRR, and PI favoring S over L. However, NPV favors Project L, and hence L should be chosen.
N I FV PMT PV
N I FV PMT PV
Answers and Solutions: 10- 11
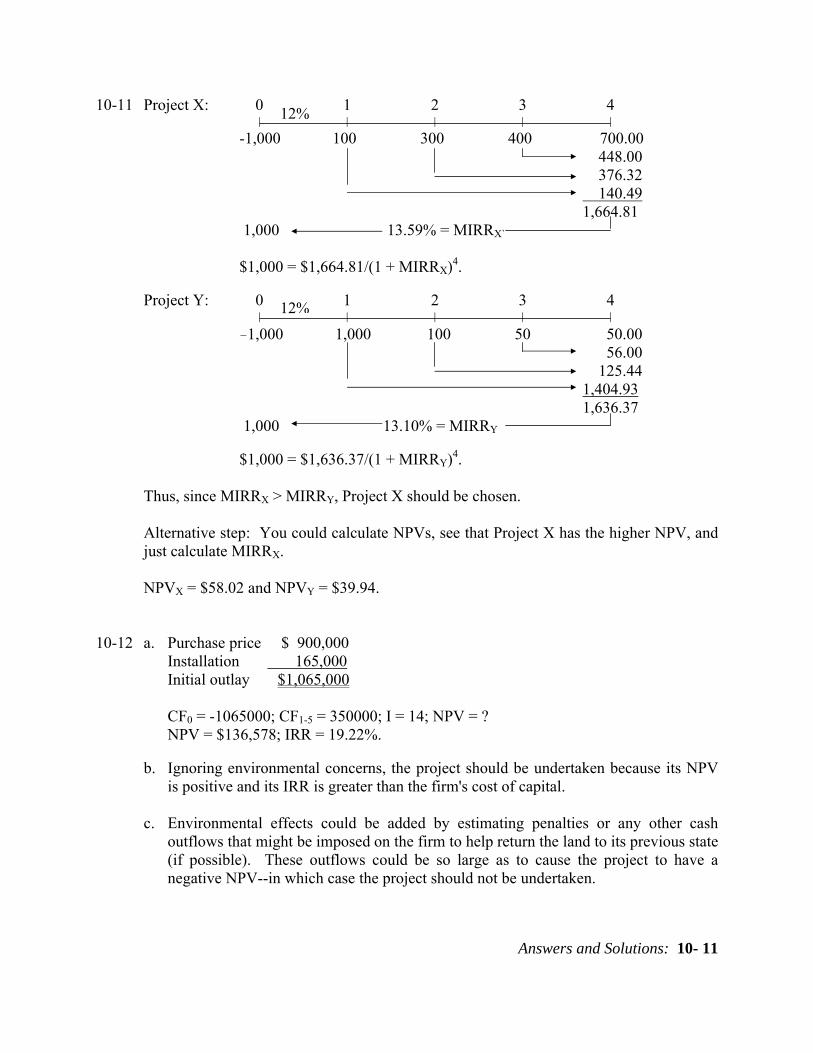
10-11 Project X: 0 1 2 3 4 | | | | | -1,000 100 300 400 700.00 448.00 376.32 140.49 1,664.81 1,000 13.59% = MIRRX` $1,000 = $1,664.81/(1 + MIRRX)4. Project Y: 0 1 2 3 4 | | | | | -1,000 1,000 100 50 50.00 56.00 125.44 1,404.93 1,636.37 1,000 13.10% = MIRRY $1,000 = $1,636.37/(1 + MIRRY)4.
Thus, since MIRRX > MIRRY, Project X should be chosen.
Alternative step: You could calculate NPVs, see that Project X has the higher NPV, and just calculate MIRRX.
NPVX = $58.02 and NPVY = $39.94.
10-12 a. Purchase price $ 900,000
Installation 165,000 Initial outlay $1,065,000
CF0 = -1065000; CF1-5 = 350000; I = 14; NPV = ? NPV = $136,578; IRR = 19.22%.
b. Ignoring environmental concerns, the project should be undertaken because its NPV
is positive and its IRR is greater than the firm's cost of capital.
c. Environmental effects could be added by estimating penalties or any other cash outflows that might be imposed on the firm to help return the land to its previous state (if possible). These outflows could be so large as to cause the project to have a negative NPV--in which case the project should not be undertaken.
12%
12%
Answers and Solutions: 10 - 12
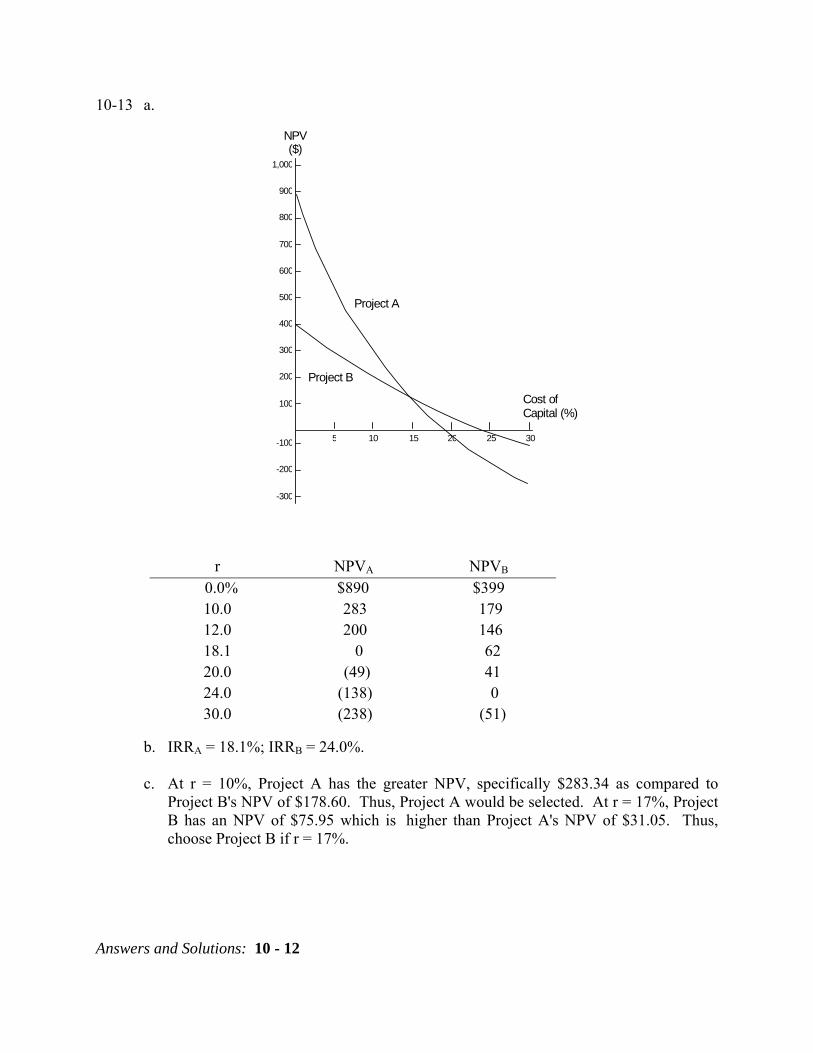
10-13 a.
b. IRRA = 18.1%; IRRB = 24.0%.
c. At r = 10%, Project A has the greater NPV, specifically $283.34 as compared to Project B's NPV of $178.60. Thus, Project A would be selected. At r = 17%, Project B has an NPV of $75.95 which is higher than Project A's NPV of $31.05. Thus, choose Project B if r = 17%.
r NPVA NPVB 0.0% $890 $399 10.0 283 179 12.0 200 146 18.1 0 62 20.0 (49) 41 24.0 (138) 0 30.0 (238) (51)
NPV ($)
Project A
Project B
Cost of Capital (%)
1,000
900
800
700
600
500
400
300
200
100
-100
-200
-300
5 10 15 20 25 30
Answers and Solutions: 10- 13
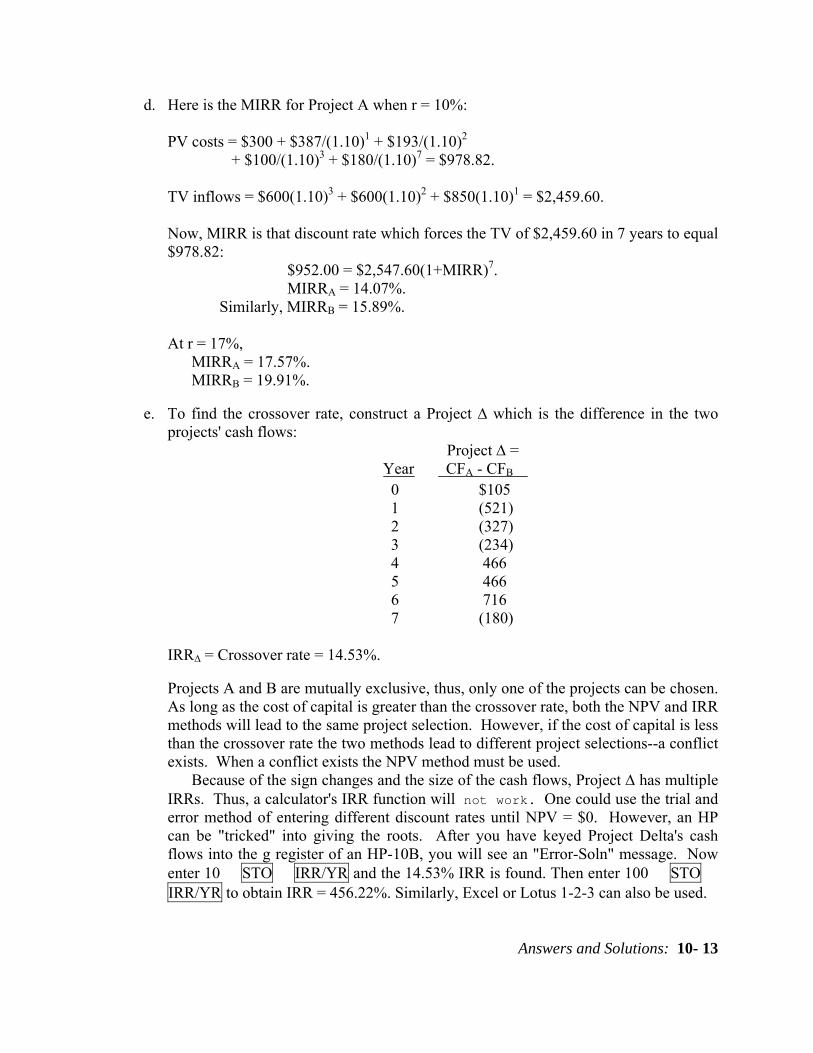
d. Here is the MIRR for Project A when r = 10%:
PV costs = $300 + $387/(1.10)1 + $193/(1.10)2 + $100/(1.10)3 + $180/(1.10)7 = $978.82.
TV inflows = $600(1.10)3 + $600(1.10)2 + $850(1.10)1 = $2,459.60.
Now, MIRR is that discount rate which forces the TV of $2,459.60 in 7 years to equal $978.82: $952.00 = $2,547.60(1+MIRR)7. MIRRA = 14.07%. Similarly, MIRRB = 15.89%. At r = 17%, MIRRA = 17.57%. MIRRB = 19.91%.
e. To find the crossover rate, construct a Project ∆ which is the difference in the two
projects' cash flows: Project ∆ = Year CFA - CFB 0 $105 1 (521) 2 (327) 3 (234) 4 466 5 466 6 716 7 (180)
IRR∆ = Crossover rate = 14.53%.
Projects A and B are mutually exclusive, thus, only one of the projects can be chosen. As long as the cost of capital is greater than the crossover rate, both the NPV and IRR methods will lead to the same project selection. However, if the cost of capital is less than the crossover rate the two methods lead to different project selections--a conflict exists. When a conflict exists the NPV method must be used.
Because of the sign changes and the size of the cash flows, Project ∆ has multiple IRRs. Thus, a calculator's IRR function will not work. One could use the trial and error method of entering different discount rates until NPV = $0. However, an HP can be "tricked" into giving the roots. After you have keyed Project Delta's cash flows into the g register of an HP-10B, you will see an "Error-Soln" message. Now enter 10 � STO � IRR/YR and the 14.53% IRR is found. Then enter 100 � STO � IRR/YR to obtain IRR = 456.22%. Similarly, Excel or Lotus 1-2-3 can also be used.
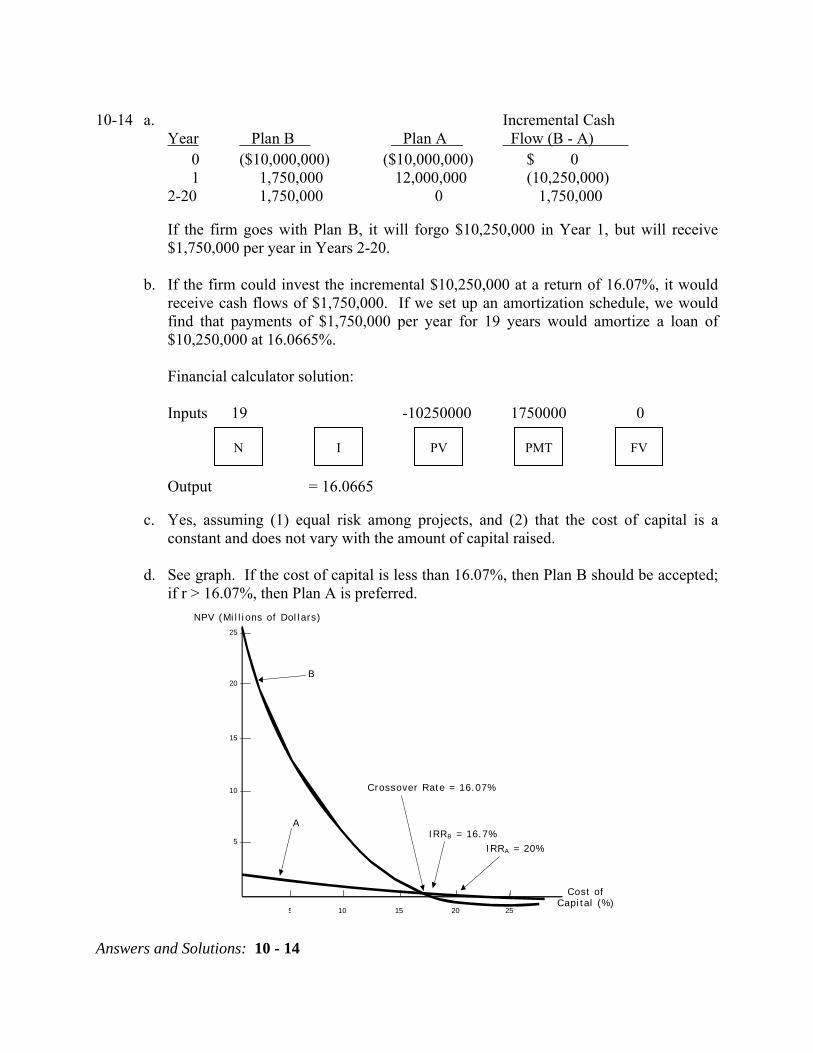
Answers and Solutions: 10 - 14
10-14 a. Incremental Cash Year Plan B Plan A Flow (B - A) 0 ($10,000,000) ($10,000,000) $ 0 1 1,750,000 12,000,000 (10,250,000) 2-20 1,750,000 0 1,750,000
If the firm goes with Plan B, it will forgo $10,250,000 in Year 1, but will receive $1,750,000 per year in Years 2-20.
b. If the firm could invest the incremental $10,250,000 at a return of 16.07%, it would
receive cash flows of $1,750,000. If we set up an amortization schedule, we would find that payments of $1,750,000 per year for 19 years would amortize a loan of $10,250,000 at 16.0665%.
Financial calculator solution:
Inputs 19 -10250000 1750000 0 Output = 16.0665
c. Yes, assuming (1) equal risk among projects, and (2) that the cost of capital is a
constant and does not vary with the amount of capital raised.
d. See graph. If the cost of capital is less than 16.07%, then Plan B should be accepted; if r > 16.07%, then Plan A is preferred.
N I FV PMT PV
NPV (Mi l l i ons of Dol l ars)
B
Crossover Rate = 16.07%
IRRB = 16.7%IRRA = 20%
A
Cost ofCapi tal (%)
5
25
10
20
15
15
20
10
25
5
Answers and Solutions: 10- 15
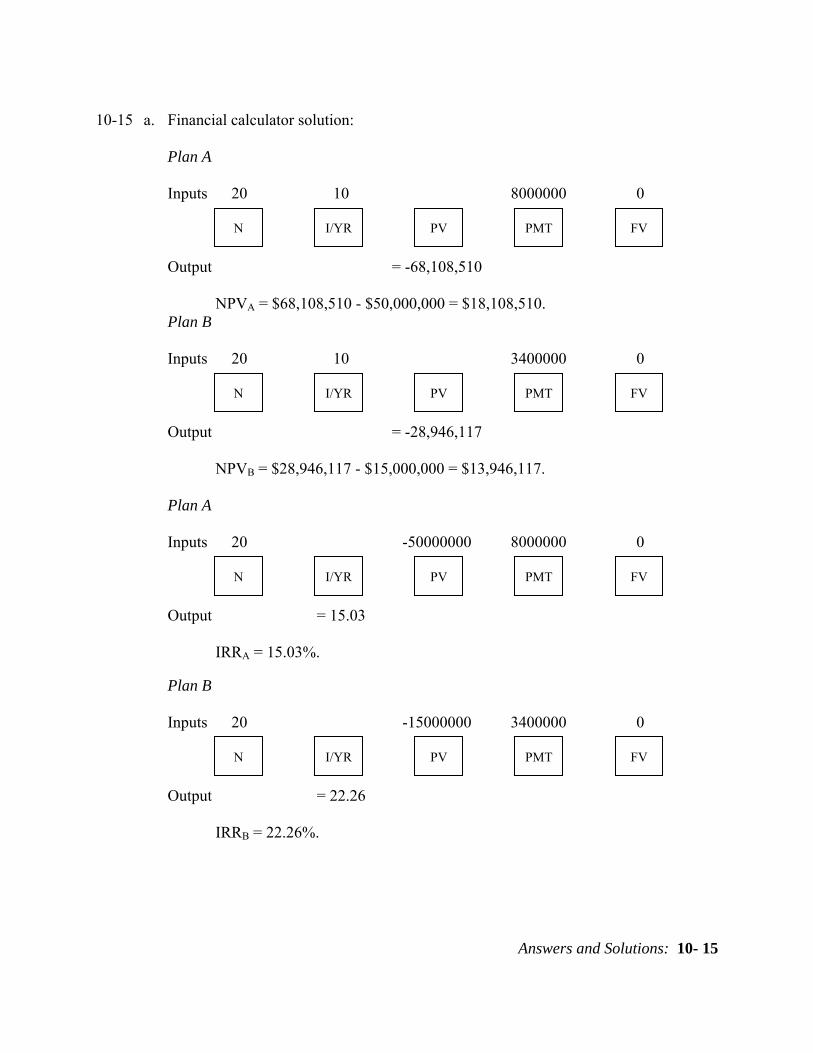
10-15 a. Financial calculator solution:
Plan A Inputs 20 10 8000000 0 Output = -68,108,510
NPVA = $68,108,510 - $50,000,000 = $18,108,510.
Plan B Inputs 20 10 3400000 0 Output = -28,946,117
NPVB = $28,946,117 - $15,000,000 = $13,946,117.
Plan A Inputs 20 -50000000 8000000 0 Output = 15.03
IRRA = 15.03%.
Plan B Inputs 20 -15000000 3400000 0 Output = 22.26
IRRB = 22.26%.
N I/YR FV PMT PV
N I/YR FV PMT PV
N I/YR FV PMT PV
N I/YR FV PMT PV
Answers and Solutions: 10 - 16
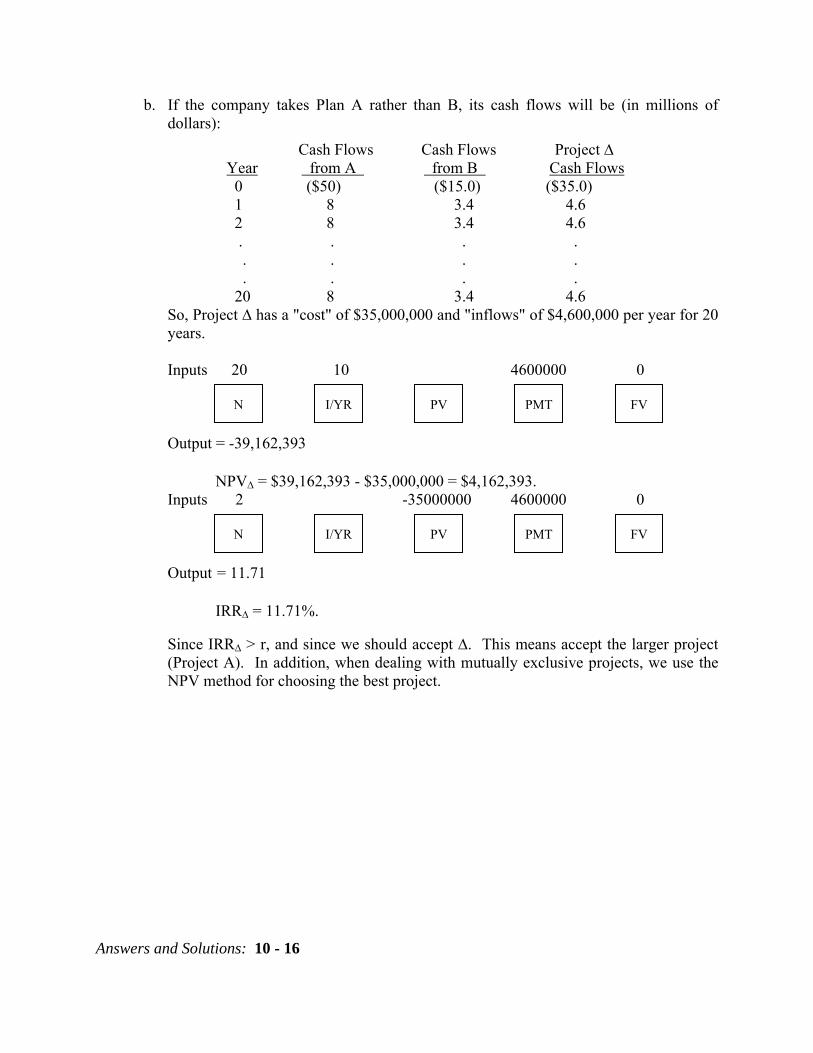
b. If the company takes Plan A rather than B, its cash flows will be (in millions of dollars):
Cash Flows Cash Flows Project ∆ Year from A from B Cash Flows 0 ($50) ($15.0) ($35.0) 1 8 3.4 4.6 2 8 3.4 4.6 . . . . . . . . . . . . 20 8 3.4 4.6 So, Project ∆ has a "cost" of $35,000,000 and "inflows" of $4,600,000 per year for 20 years.
Inputs 20 10 4600000 0 Output = -39,162,393
NPVΔ = $39,162,393 - $35,000,000 = $4,162,393.
Inputs 2 -35000000 4600000 0 Output = 11.71
IRRΔ = 11.71%.
Since IRR∆ > r, and since we should accept ∆. This means accept the larger project (Project A). In addition, when dealing with mutually exclusive projects, we use the NPV method for choosing the best project.
N I/YR FV PMT PV
N I/YR FV PMT PV
Answers and Solutions: 10- 17
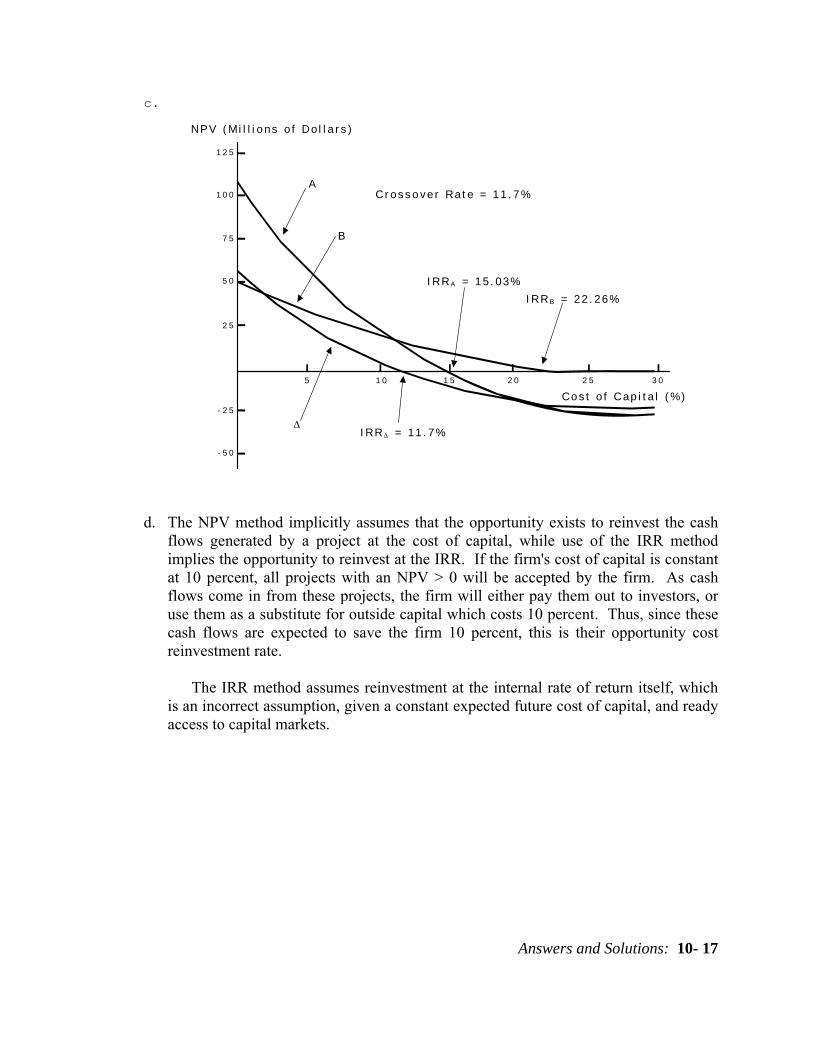
c.
d. The NPV method implicitly assumes that the opportunity exists to reinvest the cash flows generated by a project at the cost of capital, while use of the IRR method implies the opportunity to reinvest at the IRR. If the firm's cost of capital is constant at 10 percent, all projects with an NPV > 0 will be accepted by the firm. As cash flows come in from these projects, the firm will either pay them out to investors, or use them as a substitute for outside capital which costs 10 percent. Thus, since these cash flows are expected to save the firm 10 percent, this is their opportunity cost reinvestment rate.
The IRR method assumes reinvestment at the internal rate of return itself, which
is an incorrect assumption, given a constant expected future cost of capital, and ready access to capital markets.
NPV ( Mi l l i o ns o f Do l l a r s )
Cr os s o v e r Rat e = 1 1 . 7%
I RRA = 1 5 . 03%I RRB = 22 . 26%
A
B
Co s t o f Cap i t a l ( %)
1 2 5
ΔI RRΔ = 11 . 7%
1 0
1 0 0
7 5
1 5
5 0
2 0
2 5
2 5
- 2 5
3 0
- 5 0
5
Answers and Solutions: 10 - 18
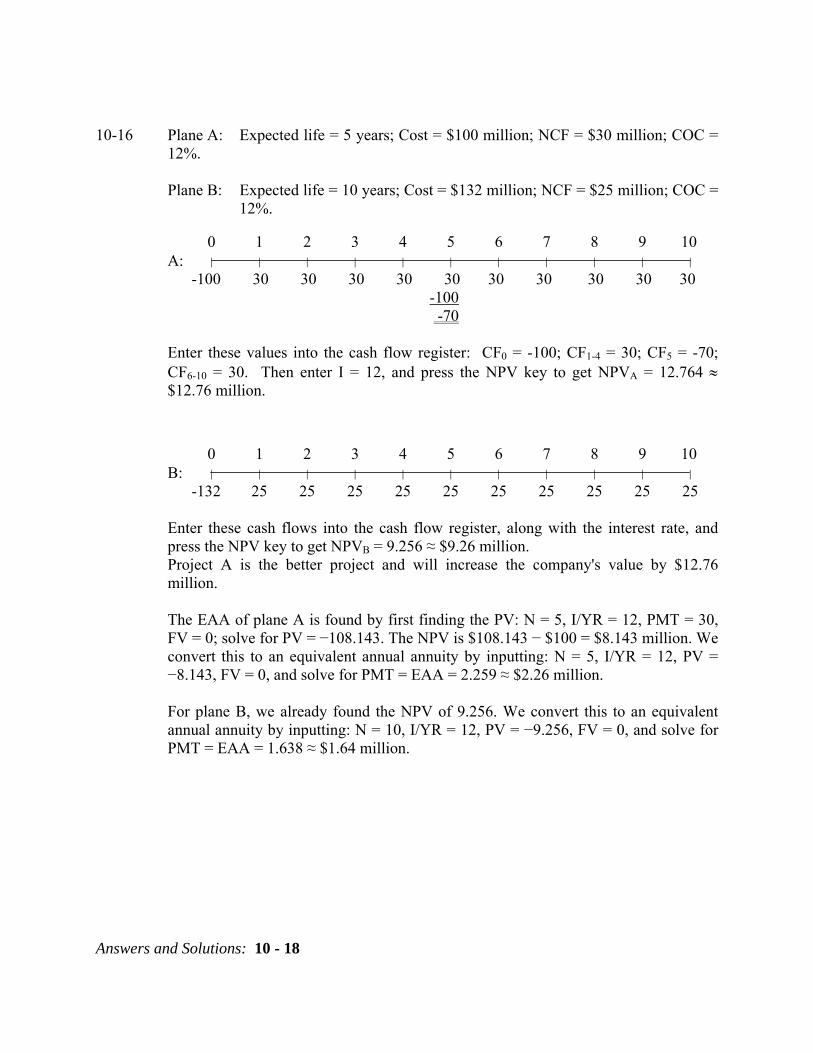
10-16 Plane A: Expected life = 5 years; Cost = $100 million; NCF = $30 million; COC =
12%.
Plane B: Expected life = 10 years; Cost = $132 million; NCF = $25 million; COC = 12%.
0 1 2 3 4 5 6 7 8 9 10 A: | | | | | | | | | | | -100 30 30 30 30 30 30 30 30 30 30 -100 -70
Enter these values into the cash flow register: CF0 = -100; CF1-4 = 30; CF5 = -70; CF6-10 = 30. Then enter I = 12, and press the NPV key to get NPVA = 12.764 ≈ $12.76 million.
0 1 2 3 4 5 6 7 8 9 10 B: | | | | | | | | | | | -132 25 25 25 25 25 25 25 25 25 25
Enter these cash flows into the cash flow register, along with the interest rate, and press the NPV key to get NPVB = 9.256 ≈ $9.26 million. Project A is the better project and will increase the company's value by $12.76 million. The EAA of plane A is found by first finding the PV: N = 5, I/YR = 12, PMT = 30, FV = 0; solve for PV = −108.143. The NPV is $108.143 − $100 = $8.143 million. We convert this to an equivalent annual annuity by inputting: N = 5, I/YR = 12, PV = −8.143, FV = 0, and solve for PMT = EAA = 2.259 ≈ $2.26 million. For plane B, we already found the NPV of 9.256. We convert this to an equivalent annual annuity by inputting: N = 10, I/YR = 12, PV = −9.256, FV = 0, and solve for PMT = EAA = 1.638 ≈ $1.64 million.
Answers and Solutions: 10- 19
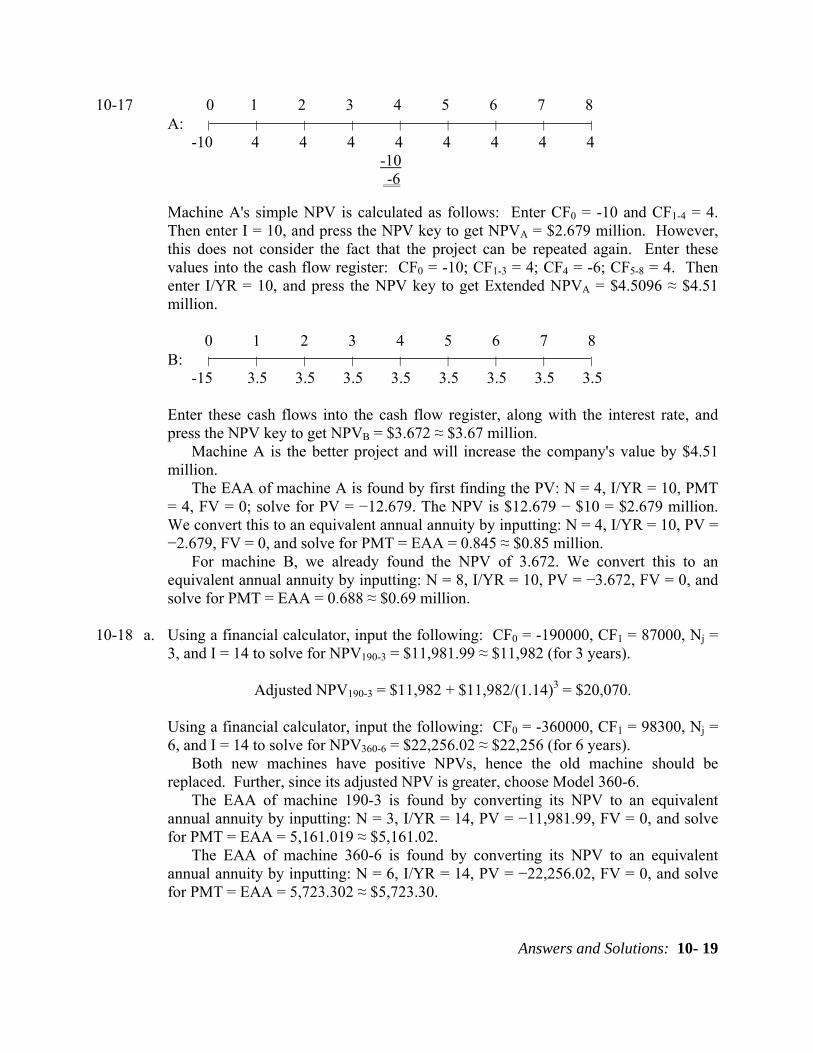
10-17 0 1 2 3 4 5 6 7 8 A: | | | | | | | | | -10 4 4 4 4 4 4 4 4 -10 -6
Machine A's simple NPV is calculated as follows: Enter CF0 = -10 and CF1-4 = 4. Then enter I = 10, and press the NPV key to get NPVA = $2.679 million. However, this does not consider the fact that the project can be repeated again. Enter these values into the cash flow register: CF0 = -10; CF1-3 = 4; CF4 = -6; CF5-8 = 4. Then enter I/YR = 10, and press the NPV key to get Extended NPVA = $4.5096 ≈ $4.51 million.
0 1 2 3 4 5 6 7 8 B: | | | | | | | | | -15 3.5 3.5 3.5 3.5 3.5 3.5 3.5 3.5
Enter these cash flows into the cash flow register, along with the interest rate, and press the NPV key to get NPVB = $3.672 ≈ $3.67 million.
Machine A is the better project and will increase the company's value by $4.51 million. The EAA of machine A is found by first finding the PV: N = 4, I/YR = 10, PMT = 4, FV = 0; solve for PV = −12.679. The NPV is $12.679 − $10 = $2.679 million. We convert this to an equivalent annual annuity by inputting: N = 4, I/YR = 10, PV = −2.679, FV = 0, and solve for PMT = EAA = 0.845 ≈ $0.85 million. For machine B, we already found the NPV of 3.672. We convert this to an equivalent annual annuity by inputting: N = 8, I/YR = 10, PV = −3.672, FV = 0, and solve for PMT = EAA = 0.688 ≈ $0.69 million.
10-18 a. Using a financial calculator, input the following: CF0 = -190000, CF1 = 87000, Nj =
3, and I = 14 to solve for NPV190-3 = $11,981.99 ≈ $11,982 (for 3 years).
Adjusted NPV190-3 = $11,982 + $11,982/(1.14)3 = $20,070.
Using a financial calculator, input the following: CF0 = -360000, CF1 = 98300, Nj = 6, and I = 14 to solve for NPV360-6 = $22,256.02 ≈ $22,256 (for 6 years).
Both new machines have positive NPVs, hence the old machine should be replaced. Further, since its adjusted NPV is greater, choose Model 360-6. The EAA of machine 190-3 is found by converting its NPV to an equivalent annual annuity by inputting: N = 3, I/YR = 14, PV = −11,981.99, FV = 0, and solve for PMT = EAA = 5,161.019 ≈ $5,161.02. The EAA of machine 360-6 is found by converting its NPV to an equivalent annual annuity by inputting: N = 6, I/YR = 14, PV = −22,256.02, FV = 0, and solve for PMT = EAA = 5,723.302 ≈ $5,723.30.
Answers and Solutions: 10 - 20
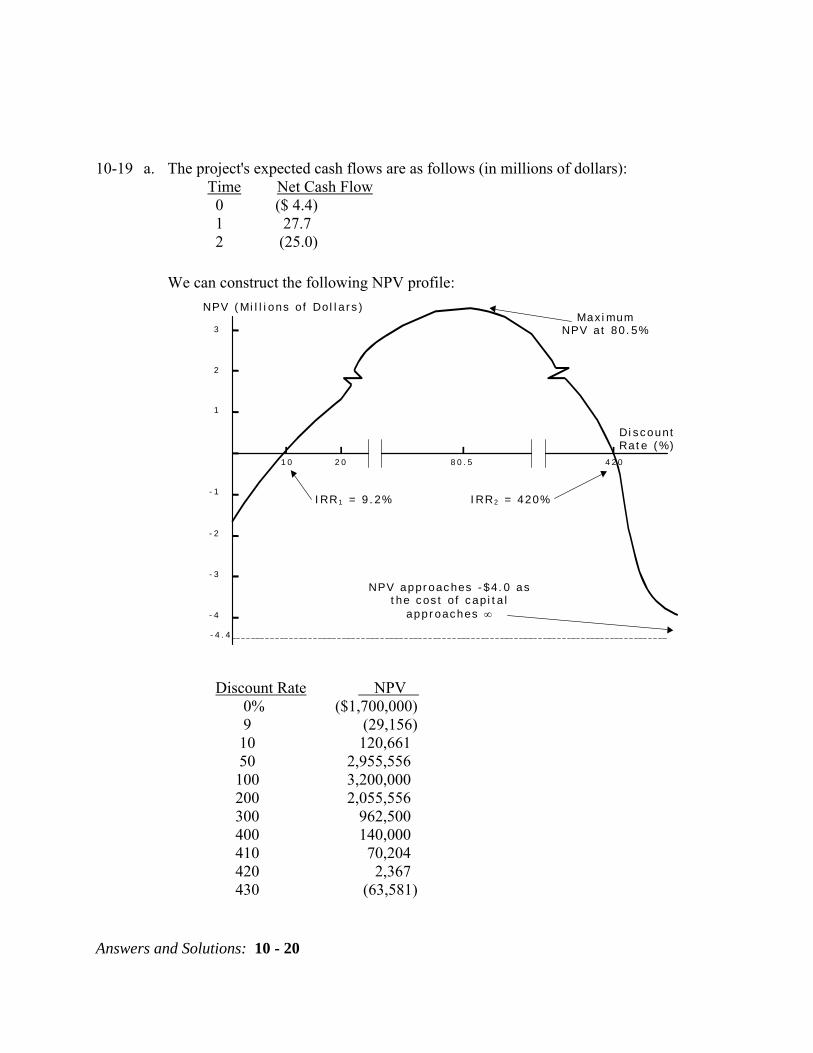
10-19 a. The project's expected cash flows are as follows (in millions of dollars): Time Net Cash Flow 0 ($ 4.4) 1 27.7 2 (25.0) We can construct the following NPV profile:
Discount Rate NPV 0% ($1,700,000) 9 (29,156) 10 120,661 50 2,955,556 100 3,200,000 200 2,055,556 300 962,500 400 140,000 410 70,204 420 2,367 430 (63,581)
NPV ( Mi l l i ons o f Dol l a r s )Max i mum
NPV at 80. 5%
Di sc ountRat e ( %)
I RR1 = 9 . 2% I RR2 = 420%
NPV appr oac hes - $4. 0 ast he c os t o f c ap i t a l
appr oaches ∞
3
2
- 4
1
- 2
1 0
- 3
- 1
- 4 . 4
2 0 8 0 . 5 4 2 0
Answers and Solutions: 10- 21
The table above was constructed using a financial calculator with the following inputs: CF0 = -4400000, CF1 = 27700000, CF2 = -25000000, and I = discount rate to solve for the NPV.
b. If r = 8%, reject the project since NPV < 0. But if r = 14%, accept the project because
NPV > 0.
c. Other possible projects with multiple rates of return could be nuclear power plants where disposal of radioactive wastes is required at the end of the project's life, or leveraged leases where the borrowed funds are repaid at the end of the lease life. (See Chapter 20 for more information on leases.)
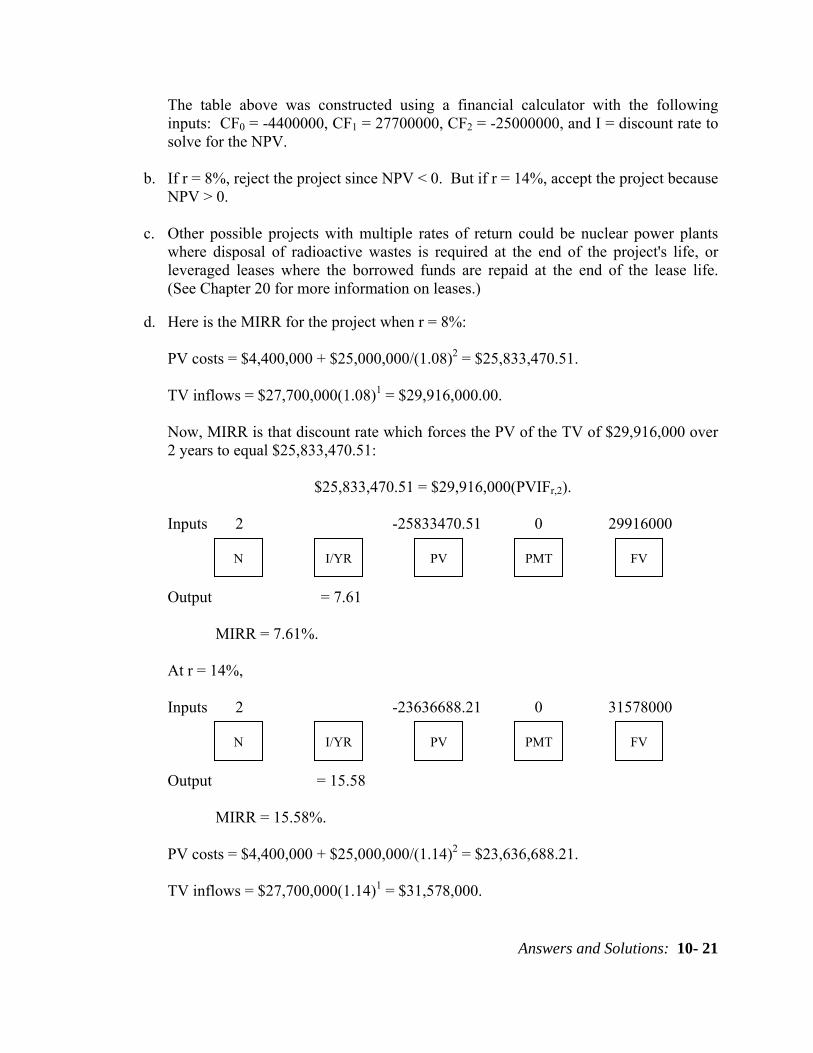
d. Here is the MIRR for the project when r = 8%:
PV costs = $4,400,000 + $25,000,000/(1.08)2 = $25,833,470.51. TV inflows = $27,700,000(1.08)1 = $29,916,000.00.
Now, MIRR is that discount rate which forces the PV of the TV of $29,916,000 over 2 years to equal $25,833,470.51:
$25,833,470.51 = $29,916,000(PVIFr,2).
Inputs 2 -25833470.51 0 29916000 Output = 7.61
MIRR = 7.61%.
At r = 14%,
Inputs 2 -23636688.21 0 31578000 Output = 15.58
MIRR = 15.58%.
PV costs = $4,400,000 + $25,000,000/(1.14)2 = $23,636,688.21.
TV inflows = $27,700,000(1.14)1 = $31,578,000.
N I/YR FV PMT PV
N I/YR FV PMT PV
Answers and Solutions: 10 - 22
Now, MIRR is that discount rate which forces the PV of the TV of $31,578,000 over 2 years to equal $23,636,688.21:
$23,636,688.21 = $31,578,000(PVIFr,2).
Yes. The MIRR method leads to the same conclusion as the NPV method. Reject the project if r = 8%, which is greater than the corresponding MIRR of 7.61%, and accept the project if r = 14%, which is less than the corresponding MIRR of 15.58%.
10-20 a. The IRRs of the two alternatives are undefined. To calculate an IRR, the cash flow
stream must include both cash inflows and outflows.
b. The PV of costs for the conveyor system is ($911,067), while the PV of costs for the forklift system is ($838,834). Thus, the forklift system is expected to be ($838,834) - ($911,067) = $72,233 less costly than the conveyor system, and hence the forklift trucks should be used.
Financial calculator solution:
Input: CF0 = -500000, CF1 = -120000, Nj = 4, CF2 = -20000, I/YR = 8, NPVC = ? NPVC = -911,067.
Input: CF0 = -200000, CF1 = -160000, N1 = 5, I/YR = 8, NPVF = ? NPVF = -838,834.
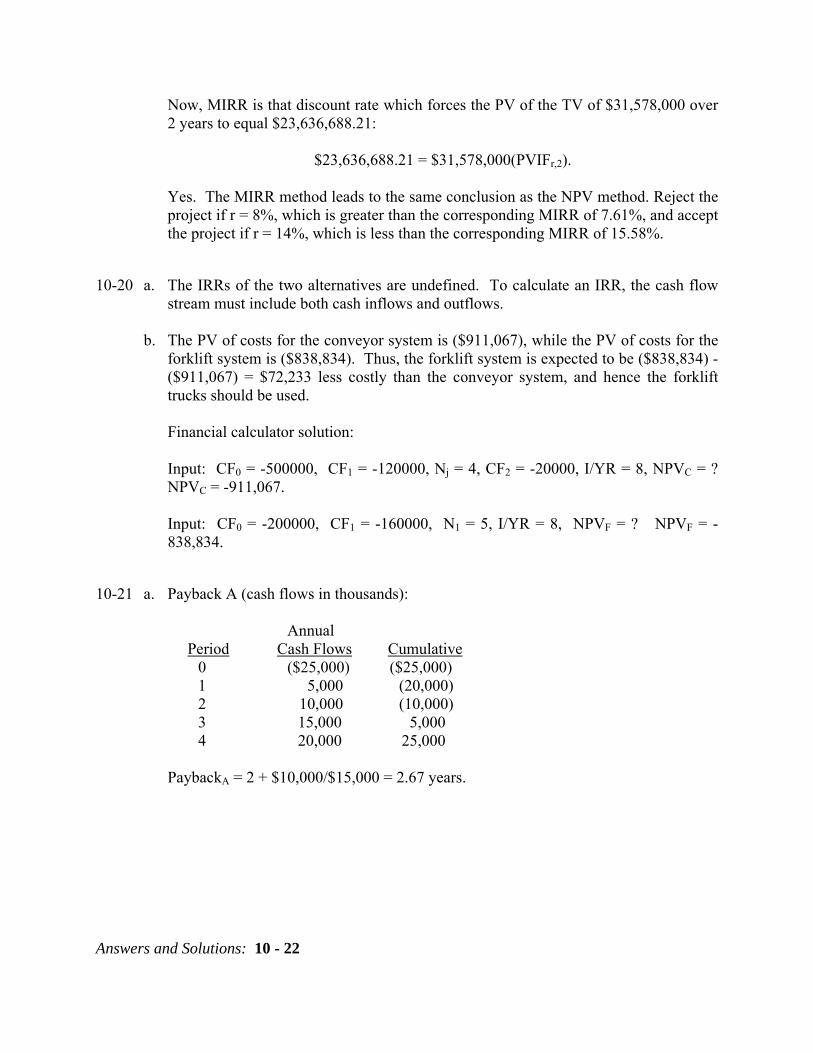
10-21 a. Payback A (cash flows in thousands): Annual Period Cash Flows Cumulative 0 ($25,000) ($25,000) 1 5,000 (20,000) 2 10,000 (10,000) 3 15,000 5,000 4 20,000 25,000
PaybackA = 2 + $10,000/$15,000 = 2.67 years.
Answers and Solutions: 10- 23
Payback B (cash flows in thousands):
Annual Period Cash Flows Cumulative 0 ($25,000) $25,000) 1 20,000 (5,000) 2 10,000 5,000 3 8,000 13,000 4 6,000 19,000
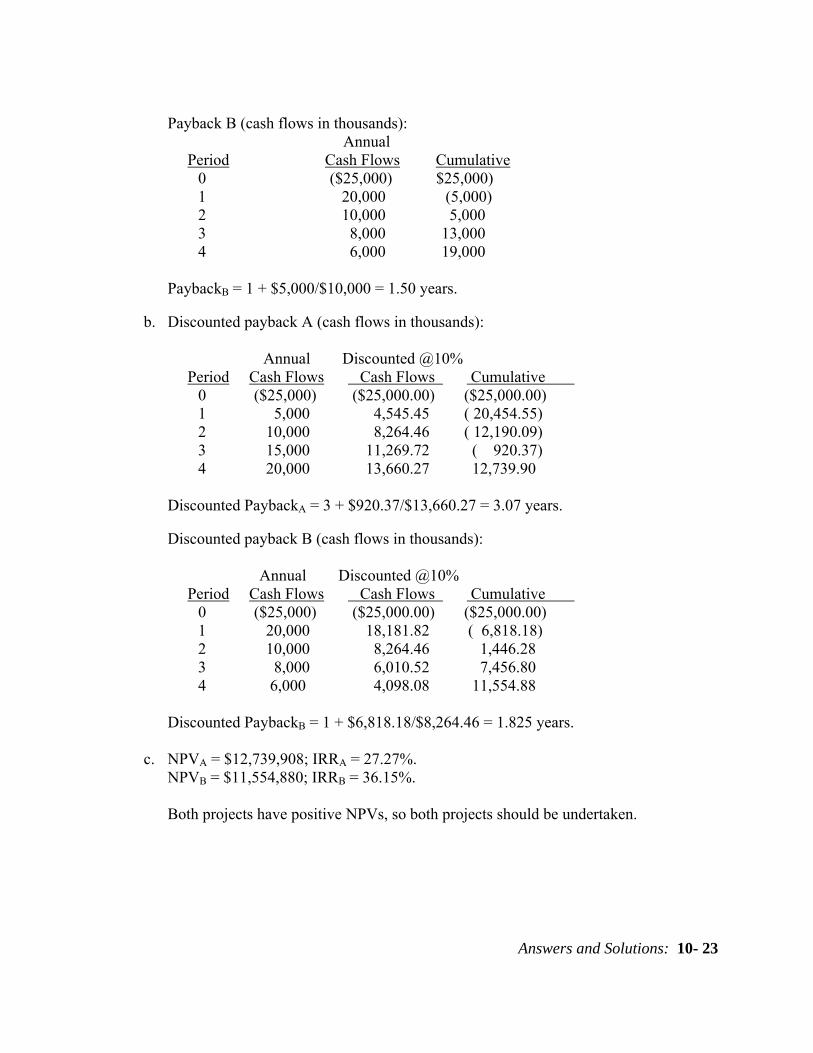
PaybackB = 1 + $5,000/$10,000 = 1.50 years. b. Discounted payback A (cash flows in thousands):
Annual Discounted @10% Period Cash Flows Cash Flows Cumulative 0 ($25,000) ($25,000.00) ($25,000.00) 1 5,000 4,545.45 ( 20,454.55) 2 10,000 8,264.46 ( 12,190.09) 3 15,000 11,269.72 ( 920.37) 4 20,000 13,660.27 12,739.90
Discounted PaybackA = 3 + $920.37/$13,660.27 = 3.07 years.
Discounted payback B (cash flows in thousands): Annual Discounted @10% Period Cash Flows Cash Flows Cumulative 0 ($25,000) ($25,000.00) ($25,000.00) 1 20,000 18,181.82 ( 6,818.18) 2 10,000 8,264.46 1,446.28 3 8,000 6,010.52 7,456.80 4 6,000 4,098.08 11,554.88
Discounted PaybackB = 1 + $6,818.18/$8,264.46 = 1.825 years.
c. NPVA = $12,739,908; IRRA = 27.27%. NPVB = $11,554,880; IRRB = 36.15%.
Both projects have positive NPVs, so both projects should be undertaken.
Answers and Solutions: 10 - 24
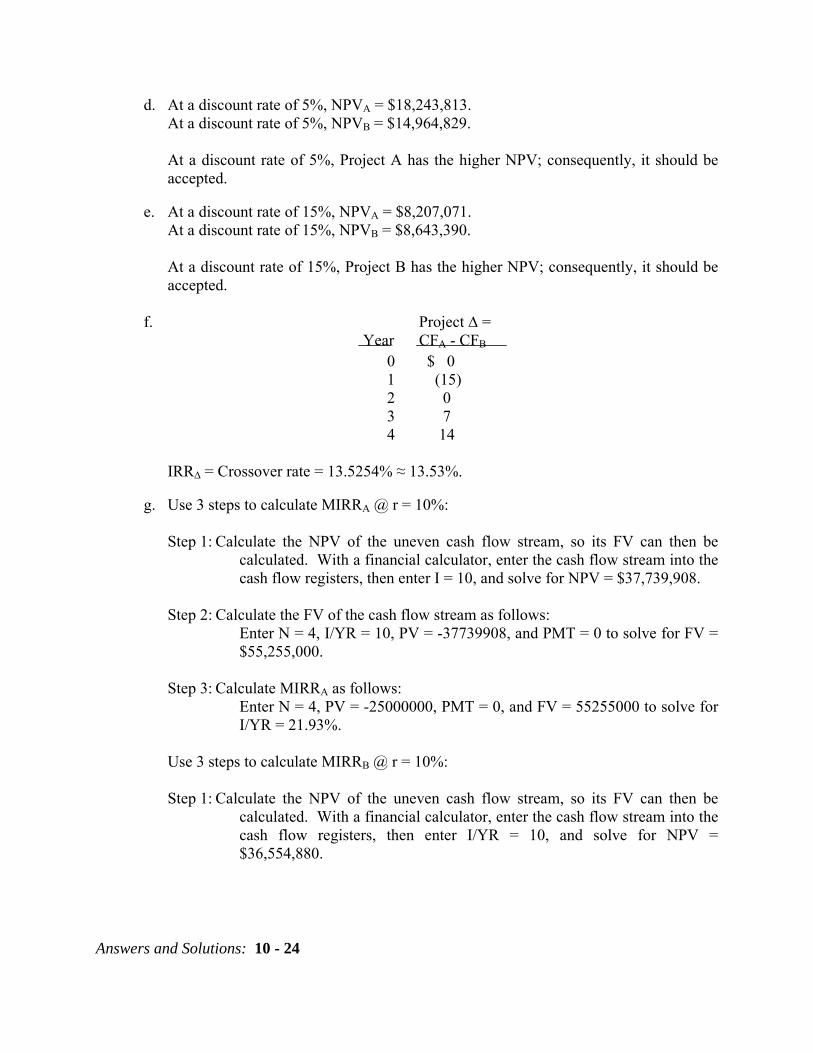
d. At a discount rate of 5%, NPVA = $18,243,813. At a discount rate of 5%, NPVB = $14,964,829.
At a discount rate of 5%, Project A has the higher NPV; consequently, it should be accepted.
e. At a discount rate of 15%, NPVA = $8,207,071.
At a discount rate of 15%, NPVB = $8,643,390.
At a discount rate of 15%, Project B has the higher NPV; consequently, it should be accepted.
f. Project ∆ =
Year CFA - CFB 0 $ 0 1 (15) 2 0 3 7 4 14
IRR∆ = Crossover rate = 13.5254% ≈ 13.53%. g. Use 3 steps to calculate MIRRA @ r = 10%:
Step 1: Calculate the NPV of the uneven cash flow stream, so its FV can then be
calculated. With a financial calculator, enter the cash flow stream into the cash flow registers, then enter I = 10, and solve for NPV = $37,739,908.
Step 2: Calculate the FV of the cash flow stream as follows: Enter N = 4, I/YR = 10, PV = -37739908, and PMT = 0 to solve for FV =
$55,255,000.
Step 3: Calculate MIRRA as follows: Enter N = 4, PV = -25000000, PMT = 0, and FV = 55255000 to solve for I/YR = 21.93%.
Use 3 steps to calculate MIRRB @ r = 10%:
Step 1: Calculate the NPV of the uneven cash flow stream, so its FV can then be
calculated. With a financial calculator, enter the cash flow stream into the cash flow registers, then enter I/YR = 10, and solve for NPV = $36,554,880.
Answers and Solutions: 10- 25
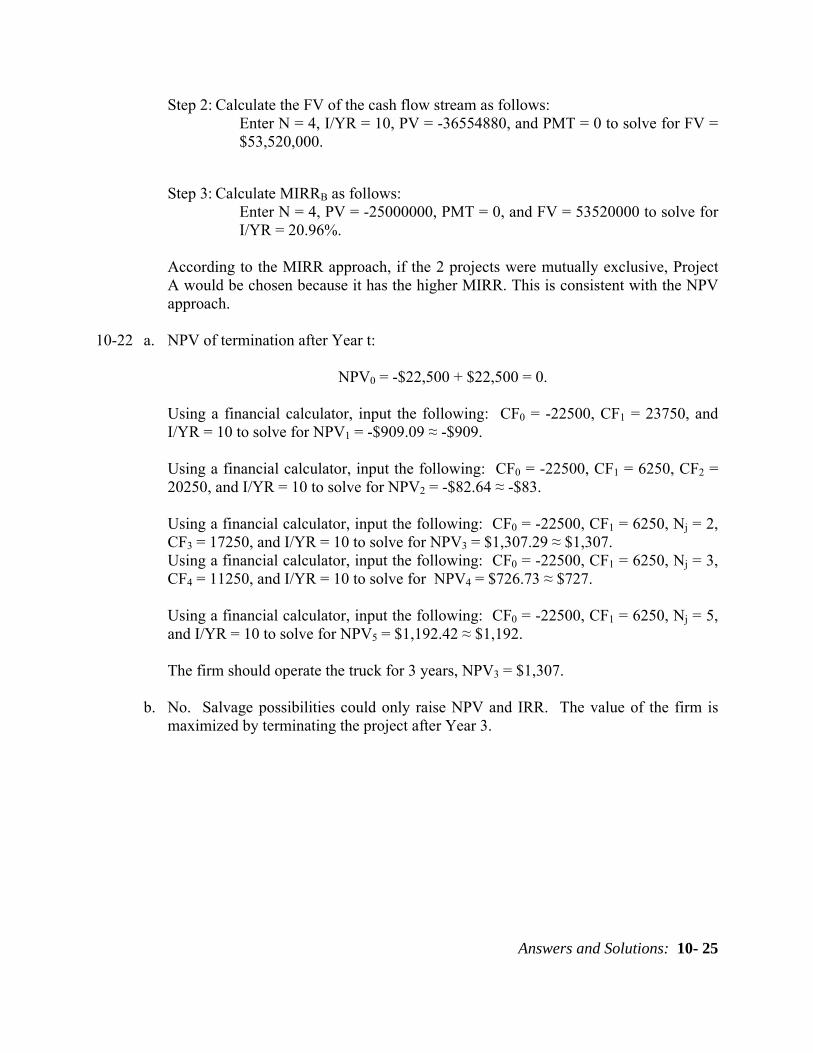
Step 2: Calculate the FV of the cash flow stream as follows: Enter N = 4, I/YR = 10, PV = -36554880, and PMT = 0 to solve for FV = $53,520,000.
Step 3: Calculate MIRRB as follows:
Enter N = 4, PV = -25000000, PMT = 0, and FV = 53520000 to solve for I/YR = 20.96%.
According to the MIRR approach, if the 2 projects were mutually exclusive, Project A would be chosen because it has the higher MIRR. This is consistent with the NPV approach.
10-22 a. NPV of termination after Year t:
NPV0 = -$22,500 + $22,500 = 0.
Using a financial calculator, input the following: CF0 = -22500, CF1 = 23750, and I/YR = 10 to solve for NPV1 = -$909.09 ≈ -$909. Using a financial calculator, input the following: CF0 = -22500, CF1 = 6250, CF2 = 20250, and I/YR = 10 to solve for NPV2 = -$82.64 ≈ -$83. Using a financial calculator, input the following: CF0 = -22500, CF1 = 6250, Nj = 2, CF3 = 17250, and I/YR = 10 to solve for NPV3 = $1,307.29 ≈ $1,307. Using a financial calculator, input the following: CF0 = -22500, CF1 = 6250, Nj = 3, CF4 = 11250, and I/YR = 10 to solve for NPV4 = $726.73 ≈ $727. Using a financial calculator, input the following: CF0 = -22500, CF1 = 6250, Nj = 5, and I/YR = 10 to solve for NPV5 = $1,192.42 ≈ $1,192.
The firm should operate the truck for 3 years, NPV3 = $1,307.
b. No. Salvage possibilities could only raise NPV and IRR. The value of the firm is
maximized by terminating the project after Year 3.

Answers and Solutions: 10 - 26
SOLUTION TO SPREADSHEET PROBLEM
10-23 The detailed solution for the problem is available in the file Solution for CF3 Ch10 P23
Build a Model.xls at the textbook’s Web site.
Mini Case: 10 - 27
MINI CASE
You have just graduated from the MBA program of a large university, and one of your favorite courses was “Today’s Entrepreneurs.” In fact, you enjoyed it so much you have decided you want to “be your own boss.” While you were in the master’s program, your grandfather died and left you $300,000 to do with as you please. You are not an inventor and you do not have a trade skill that you can market; however, you have decided that you would like to purchase at least one established franchise in the fast foods area, maybe two (if profitable). The problem is that you have never been one to stay with any project for too long, so you figure that your time frame is three years. After three years you will sell off your investment and go on to something else. You have narrowed your selection down to two choices; (1) Franchise L: Lisa’s Soups, Salads, & Stuff and (2) Franchise S: Sam’s Fabulous Fried Chicken. The net cash flows shown below include the price you would receive for selling the franchise in year 3 and the forecast of how each franchise will do over the three-year period. Franchise L’s cash flows will start off slowly but will increase rather quickly as people become more health conscious, while Franchise S’s cash flows will start off high but will trail off as other chicken competitors enter the marketplace and as people become more health conscious and avoid fried foods. Franchise L serves breakfast and lunch, while franchise S serves only dinner, so it is possible for you to invest in both franchises. You see these franchises as perfect complements to one another: you could attract both the lunch and dinner crowds and the health conscious and not so health conscious crowds with the franchises directly competing against one another. Here are the projects' net cash flows (in thousands of dollars): Expected Net Cash Flow Year Franchise L Franchise S 0 ($100) ($100) 1 10 70 2 60 50 3 80 20 Depreciation, salvage values, net working capital requirements, and tax effects are all included in these cash flows. You also have made subjective risk assessments of each franchise, and concluded that both franchises have risk characteristics that require a return of 10 percent. You must now determine whether one or both of the projects should be accepted.

Mini Case: 10 - 28
a. What is capital budgeting? Answer: Capital budgeting is the process of analyzing additions to fixed assets. Capital
budgeting is important because, more than anything else, fixed asset investment decisions chart a company's course for the future. Conceptually, the capital budgeting process is identical to the decision process used by individuals making investment decisions. These steps are involved:
1. Estimate the cash flows--interest and maturity value or dividends in the case of
bonds and stocks, operating cash flows in the case of capital projects.
2. Assess the riskiness of the cash flows.
3. Determine the appropriate discount rate, based on the riskiness of the cash flows and the general level of interest rates. This is called the project cost of capital in capital budgeting.
4. Evaluate the cash flows.
b. What is the difference between independent and mutually exclusive projects? Answer: Projects are independent if the cash flows of one are not affected by the acceptance of
the other. Conversely, two projects are mutually exclusive if acceptance of one impacts adversely the cash flows of the other; that is, at most one of two or more such projects may be accepted. Put another way, when projects are mutually exclusive it means that they do the same job. For example, a forklift truck versus a conveyor system to move materials, or a bridge versus a ferry boat.
Projects with normal cash flows have outflows, or costs, in the first year (or years) followed by a series of inflows. Projects with nonnormal cash flows have one or more outflows after the inflow stream has begun. Here are some examples:
Inflow (+) Or Outflow (-) In Year 0 1 2 3 4 5 Normal - + + + + + - - + + + + - - - + + + Nonnormal - + + + + - - + + - + - + + + - - -
Mini Case: 10 - 29
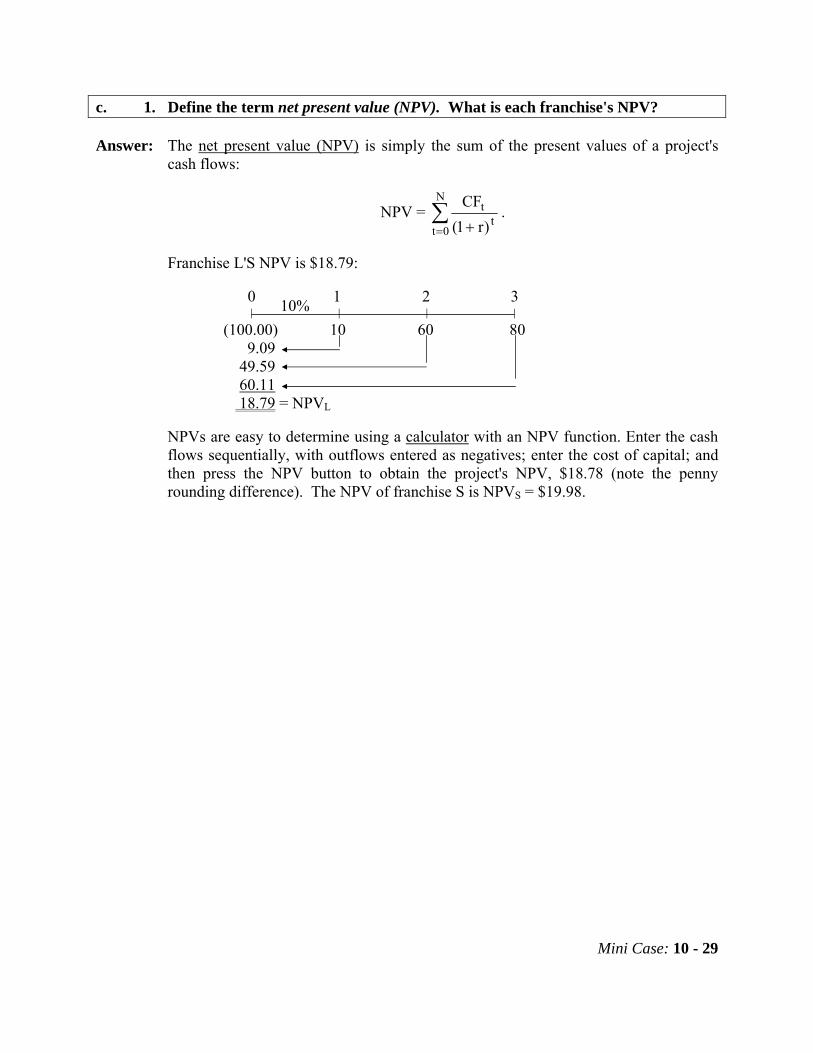
c. 1. Define the term net present value (NPV). What is each franchise's NPV? Answer: The net present value (NPV) is simply the sum of the present values of a project's
cash flows:
NPV = ∑= +
N
0tt
t
)r1(CF
.
Franchise L'S NPV is $18.79:
0 1 2 3 | | | | (100.00) 10 60 80 9.09 49.59 60.11 18.79 = NPVL
NPVs are easy to determine using a calculator with an NPV function. Enter the cash flows sequentially, with outflows entered as negatives; enter the cost of capital; and then press the NPV button to obtain the project's NPV, $18.78 (note the penny rounding difference). The NPV of franchise S is NPVS = $19.98.
10%
Mini Case: 10 - 30
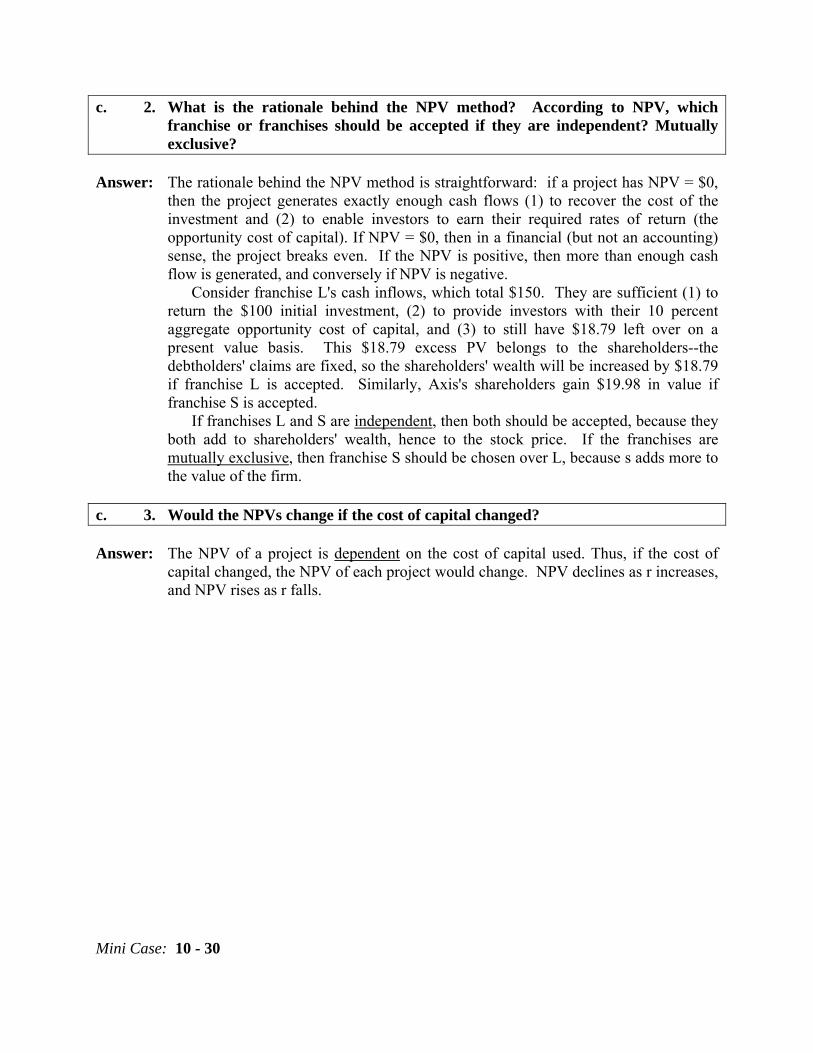
c. 2. What is the rationale behind the NPV method? According to NPV, which franchise or franchises should be accepted if they are independent? Mutually exclusive?
Answer: The rationale behind the NPV method is straightforward: if a project has NPV = $0,
then the project generates exactly enough cash flows (1) to recover the cost of the investment and (2) to enable investors to earn their required rates of return (the opportunity cost of capital). If NPV = $0, then in a financial (but not an accounting) sense, the project breaks even. If the NPV is positive, then more than enough cash flow is generated, and conversely if NPV is negative.
Consider franchise L's cash inflows, which total $150. They are sufficient (1) to return the $100 initial investment, (2) to provide investors with their 10 percent aggregate opportunity cost of capital, and (3) to still have $18.79 left over on a present value basis. This $18.79 excess PV belongs to the shareholders--the debtholders' claims are fixed, so the shareholders' wealth will be increased by $18.79 if franchise L is accepted. Similarly, Axis's shareholders gain $19.98 in value if franchise S is accepted.
If franchises L and S are independent, then both should be accepted, because they both add to shareholders' wealth, hence to the stock price. If the franchises are mutually exclusive, then franchise S should be chosen over L, because s adds more to the value of the firm.
c. 3. Would the NPVs change if the cost of capital changed? Answer: The NPV of a project is dependent on the cost of capital used. Thus, if the cost of
capital changed, the NPV of each project would change. NPV declines as r increases, and NPV rises as r falls.
Mini Case: 10 - 31
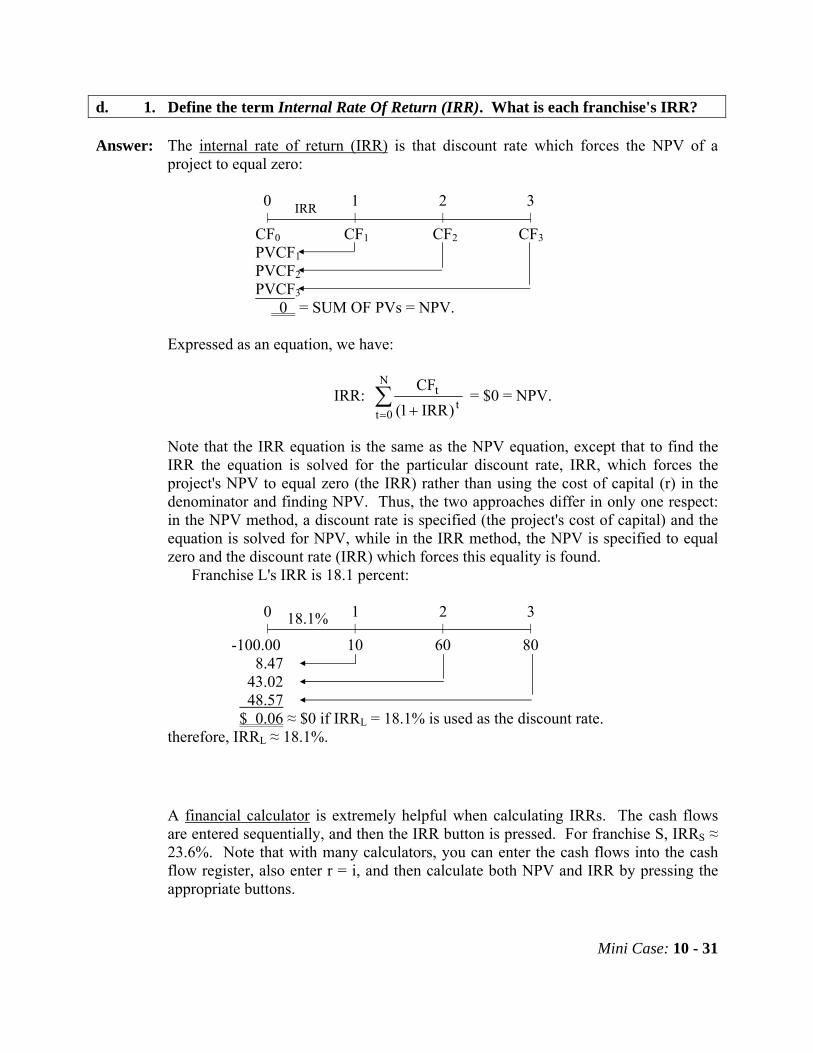
d. 1. Define the term Internal Rate Of Return (IRR). What is each franchise's IRR? Answer: The internal rate of return (IRR) is that discount rate which forces the NPV of a
project to equal zero: 0 1 2 3 | | | | CF0 CF1 CF2 CF3 PVCF1 PVCF2 PVCF3 0 = SUM OF PVs = NPV.
Expressed as an equation, we have:
IRR: ∑= +
N
0tt
t
)IRR1(CF
= $0 = NPV.
Note that the IRR equation is the same as the NPV equation, except that to find the IRR the equation is solved for the particular discount rate, IRR, which forces the project's NPV to equal zero (the IRR) rather than using the cost of capital (r) in the denominator and finding NPV. Thus, the two approaches differ in only one respect: in the NPV method, a discount rate is specified (the project's cost of capital) and the equation is solved for NPV, while in the IRR method, the NPV is specified to equal zero and the discount rate (IRR) which forces this equality is found.
Franchise L's IRR is 18.1 percent: 0 1 2 3 | | | |
-100.00 10 60 80 8.47 43.02 48.57
$ 0.06 ≈ $0 if IRRL = 18.1% is used as the discount rate. therefore, IRRL ≈ 18.1%.
A financial calculator is extremely helpful when calculating IRRs. The cash flows are entered sequentially, and then the IRR button is pressed. For franchise S, IRRS ≈ 23.6%. Note that with many calculators, you can enter the cash flows into the cash flow register, also enter r = i, and then calculate both NPV and IRR by pressing the appropriate buttons.
IRR
18.1%
Mini Case: 10 - 32
d. 2. How is the IRR on a project related to the YTM on a bond? Answer: The IRR is to a capital project what the YTM is to a bond. It is the expected rate of
return on the project, just as the YTM is the promised rate of return on a bond. d. 3. What is the logic behind the IRR method? According to IRR, which franchises
should be accepted if they are independent? Mutually exclusive? Answer: IRR measures a project's profitability in the rate of return sense: if a project's IRR
equals its cost of capital, then its cash flows are just sufficient to provide investors with their required rates of return. An IRR greater than r implies an economic profit, which accrues to the firm's shareholders, while an IRR less than r indicates an economic loss, or a project that will not earn enough to cover its cost of capital.
Projects' IRRs are compared to their costs of capital, or hurdle rates. Since franchises L and S both have a hurdle rate of 10 percent, and since both have IRRs greater than that hurdle rate, both should be accepted if they are independent. However, if they are mutually exclusive, franchise S would be selected, because it has the higher IRR.
d. 4. Would the franchises' IRRs change if the cost of capital changed? Answer: IRRs are independent of the cost of capital. Therefore, neither IRRS nor IRRL would
change if r changed. However, the acceptability of the franchises could change--L would be rejected if r were above 18.1%, and S would also be rejected if r were above 23.6%.
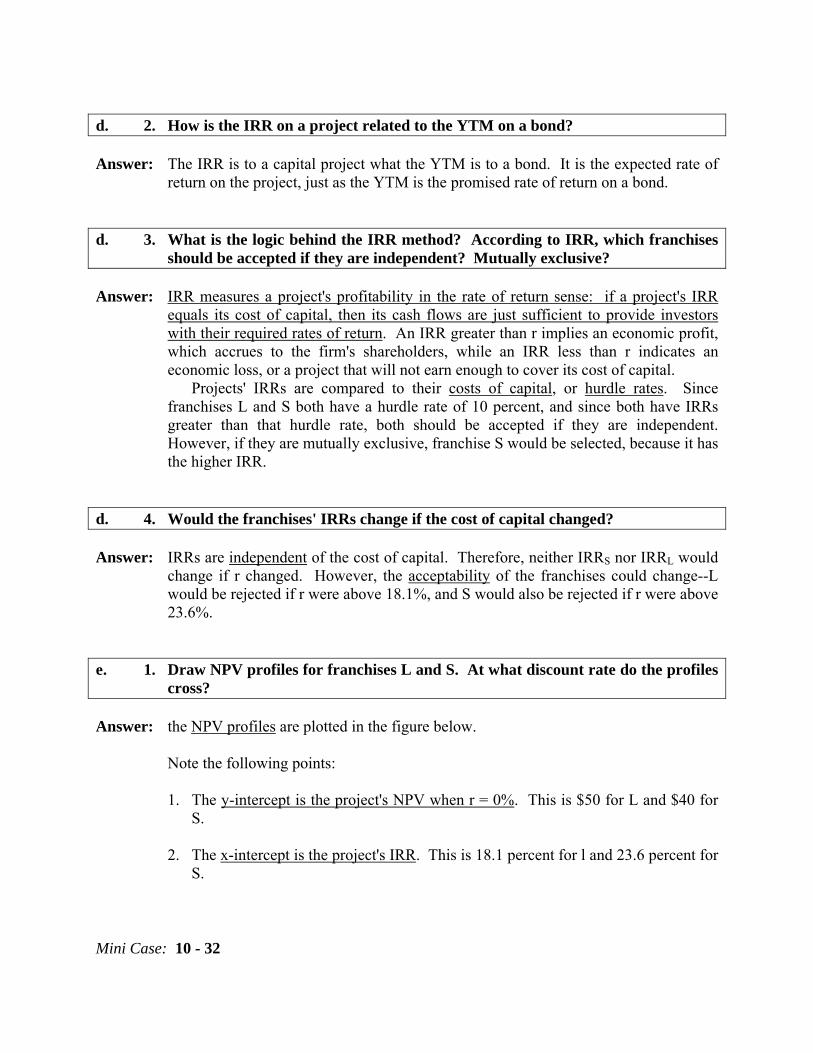
e. 1. Draw NPV profiles for franchises L and S. At what discount rate do the profiles
cross? Answer: the NPV profiles are plotted in the figure below.
Note the following points:
1. The y-intercept is the project's NPV when r = 0%. This is $50 for L and $40 for S.
2. The x-intercept is the project's IRR. This is 18.1 percent for l and 23.6 percent for
S.
Mini Case: 10 - 33
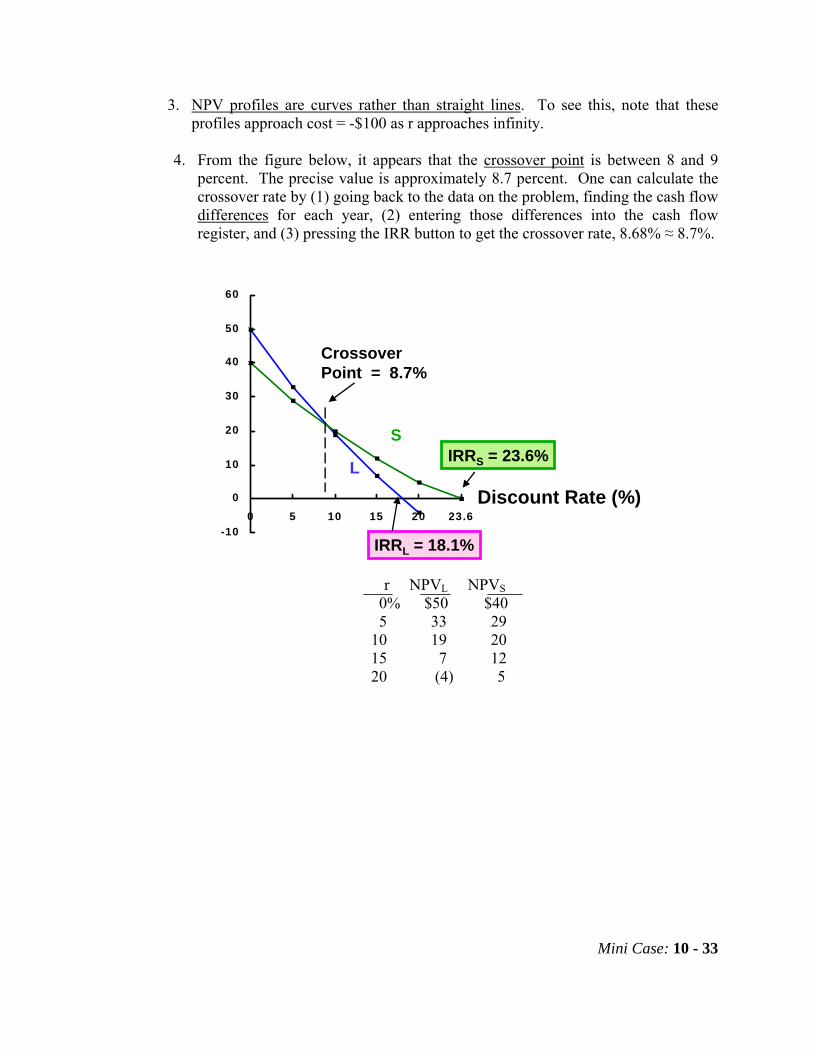
3. NPV profiles are curves rather than straight lines. To see this, note that these profiles approach cost = -$100 as r approaches infinity.
4. From the figure below, it appears that the crossover point is between 8 and 9
percent. The precise value is approximately 8.7 percent. One can calculate the crossover rate by (1) going back to the data on the problem, finding the cash flow differences for each year, (2) entering those differences into the cash flow register, and (3) pressing the IRR button to get the crossover rate, 8.68% ≈ 8.7%.
r NPVL NPVS
0% $50 $40 5 33 29 10 19 20 15 7 12 20 (4) 5
-10
0
10
20
30
40
50
60
0 5 10 15 20 23.6Discount Rate (%)
IRRL = 18.1%
IRRS = 23.6%
Crossover Point = 8.7%
S
L
Mini Case: 10 - 34
e. 2. Look at your NPV profile graph without referring to the actual NPVs and IRRs. Which franchise or franchises should be accepted if they are independent? Mutually exclusive? Explain. Are your answers correct at any cost of capital less than 23.6 percent?
Answer: The NPV profiles show that the IRR and NPV criteria lead to the same accept/reject
decision for any independent project. Consider franchise L. It intersects the x-axis at its IRR, 18.1 percent. According to the IRR rule, L is acceptable if r is less than 18.1 percent. Also, at any r less than 18.1 percent, L's NPV profile will be above the x axis, so its NPV will be greater than $0. Thus, for any independent project, NPV and IRR lead to the same accept/reject decision.
Now assume that L and S are mutually exclusive. In this case, a conflict might arise. First, note that IRRS = 23.6% > 18.1% = therefore, regardless of the size of r, project S would be ranked higher by the IRR criterion. However, the NPV profiles show that NPVL > NPVS if r is less than 8.7 percent. Therefore, for any r below the 8.7% crossover rate, say r = 7 percent, the NPV rule says choose L, but the IRR rule says choose S. Thus, if r is less than the crossover rate, a ranking conflict occurs.
f. 1. What is the underlying cause of ranking conflicts between NPV and IRR? Answer: For normal projects' NPV profiles to cross, one project must have both a higher
vertical axis intercept and a steeper slope than the other. A project's vertical axis intercept typically depends on (1) the size of the project and (2) the size and timing pattern of the cash flows--large projects, and ones with large distant cash flows, would generally be expected to have relatively high vertical axis intercepts. The slope of the NPV profile depends entirely on the timing pattern of the cash flows--long-term projects have steeper NPV profiles than short-term ones. Thus, we conclude that NPV profiles can cross in two situations: (1) when mutually exclusive projects differ in scale (or size) and (2) when the projects' cash flows differ in terms of the timing pattern of their cash flows (as for franchises L and S).
f. 2. What is the "reinvestment rate assumption”, and how does it affect the NPV
versus IRR conflict? Answer: The underlying cause of ranking conflicts is the reinvestment rate assumption. All
DCF methods implicitly assume that cash flows can be reinvested at some rate, regardless of what is actually done with the cash flows. Discounting is the reverse of compounding. Since compounding assumes reinvestment, so does discounting. NPV and IRR are both found by discounting, so they both implicitly assume some discount rate. Inherent in the NPV calculation is the assumption that cash flows can be reinvested at the project's cost of capital, while the IRR calculation assumes reinvestment at the IRR rate.
Mini Case: 10 - 35
f. 3. Which method is the best? Why? Answer: Whether NPV or IRR gives better rankings depends on which has the better
reinvestment rate assumption. Normally, the NPV's assumption is better. The reason is as follows: a project's cash inflows are generally used as substitutes for outside capital, that is, projects' cash flows replace outside capital and, hence, save the firm the cost of outside capital. Therefore, in an opportunity cost sense, a project's cash flows are reinvested at the cost of capital. To see this graphically, think of the following situation: assume the firm's cost of capital is a constant 10% within the relevant range of financing considered, and it has projects available as shown in the graph below:
P e r c e n t
D o l l a r s R a i s e d a n d I n v e s t e d
M C C
I R R A = 2 5 %
I R R B = 2 0 %
I R R C = 1 5 %
I R R D = 1 2 %
I R R E = 8 %
I R R F = 5 %5
20
25
15
10

Mini Case: 10 - 36
What projects will be accepted, by either NPV or IRR? Projects A, B, C, and D. If the same situation exists year after year, at what rate of return will cash flows
from earlier years' investments be reinvested? Capital budgeting decisions are made in this sequence: (1) the company would say, "we can take on A, B, C, and D and finance them with 10% money, so let's do it." (2) then, it would get cash flows from earlier years' projects. What would it do with those cash flows? It would use them in lieu of raising money that costs 10%, so it would save 10%. Therefore, 10% is the opportunity cost of the cash flows. In effect, cash flows are reinvested at the 10% cost of capital.
Note, however, that NPV and IRR always give the same accept/reject decisions for independent projects, so IRR can be used just as well as NPV when independent projects are being evaluated. The NPV versus IRR conflict arises only if mutually exclusive projects are involved.
g. 1. Define the term Modified IRR (MIRR). Find the MIRRs for franchises L and S. Answer: MIRR is that discount rate which equates the present value of the terminal value of
the inflows, compounded at the cost of capital, to the present value of the costs. Here is the setup for calculating franchise L's modified IRR:
0 1 2 3 | | | | PV Of Costs = (100.00) 10 60 80.00 66.00 12.10 TV OF INFLOWS = 158.10 PV Of TV = 100.00 = $100 =
3)MIRR1(10.158$
+.
PV costs = N)MIRR1(TV
+ = ∑
= +
N
0tt
t
)r1(COF
= N
N
1t
tNt
)MIRR1(
)r1(CIF
+
+∑=
−
.
After you calculate the TV, enter N = 3, PV = -100, PMT = 0, FV = 158.1, and then press I?YR to get the answer, MIRRL = 16.5%. We could calculate MIRRS similarly: = 16.9%. Thus, franchise S is ranked higher than L. This result is consistent with the NPV decision.
MIRR = ?
r = 10%

Mini Case: 10 - 37
g. 2. What are the MIRR's advantages and disadvantages vis-a-vis the regular IRR? What are the MIRR's advantages and disadvantages vis-a-vis the NPV?
Answer: MIRR is a better rate of return measure than IRR for two reasons: (1) it correctly
assumes reinvestment at the project's cost of capital rather than at its IRR. (2) MIRR avoids the problem of multiple IRRs--there can be only one MIRR for a given project.
MIRR does not always lead to the same decision as NPV when mutually exclusive projects are being considered. In particular, small projects often have a higher MIRR, but a lower NPV, than larger projects. Thus, MIRR is not a perfect substitute for NPV, and NPV remains the single best decision rule. However, MIRR is superior to the regular IRR, and if a rate of return measure is needed, MIRR should be used.
Business executives agree. As noted in the text, business executives prefer to compare projects' rates of return to comparing their NPVs. This is an empirical fact. As a result, financial managers are substituting MIRR for IRR in their discussions with other corporate executives. This fact was brought out in the October 1989 FMA meetings, where executives from Du Pont, Hershey, and Ameritech, among others, all reported a switch from IRR to MIRR.
h. As a separate project (project P), you are considering sponsoring a pavilion at
the upcoming world's fair. The pavilion would cost $800,000, and it is expected to result in $5 million of incremental cash inflows during its 1 year of operation. However, it would then take another year, and $5 million of costs, to demolish the site and return it to its original condition. Thus, project P's expected net cash flows look like this (in millions of dollars):
Year Net Cash Flows 0 ($0.8) 1 5.0 2 (5.0) The project is estimated to be of average risk, so its cost of capital is 10 percent. h. 1. What are normal and nonnormal cash flows? Answer: Normal cash flows begin with a negative cash flow (or a series of negative cash
flows), switch to positive cash flows, and then remain positive. They have only one change in sign. (Note: normal cash flows can also start with positive cash flows, switch to negative cash flows, and then remain negative.) Nonnormal cash flows have more than one sign change. For example, they may start with negative cash flows, switch to positive, and then switch back to negative.
Mini Case: 10 - 38
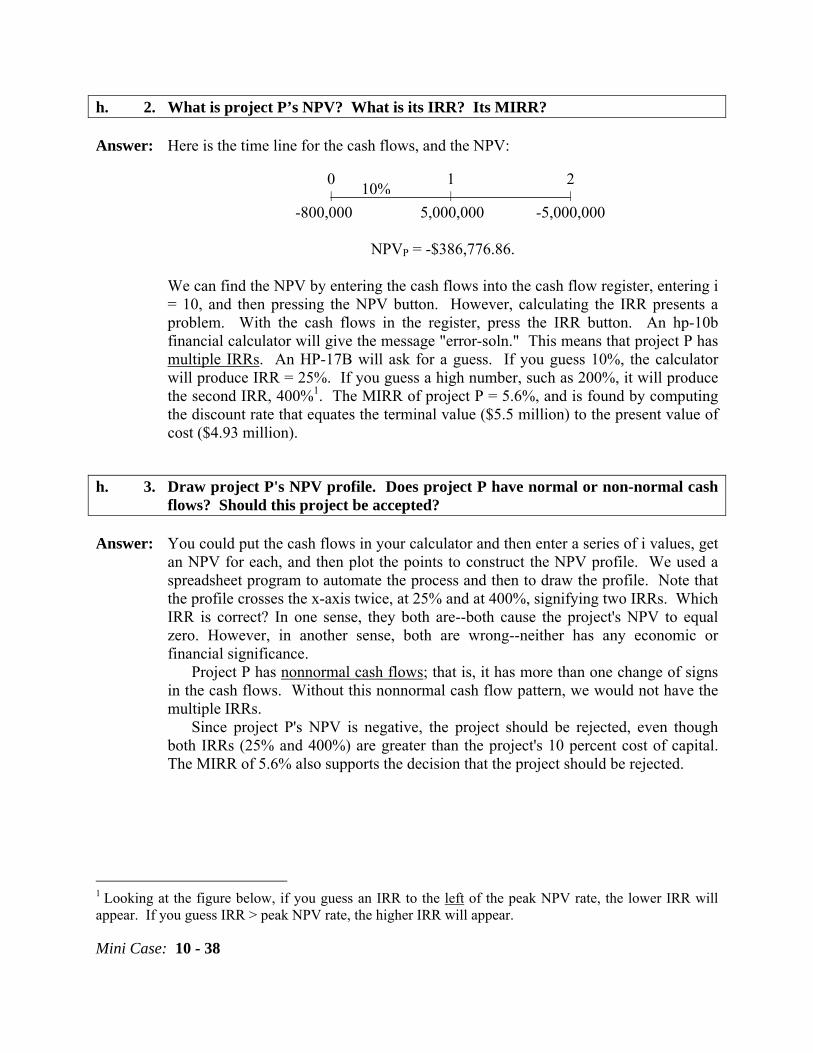
h. 2. What is project P’s NPV? What is its IRR? Its MIRR? Answer: Here is the time line for the cash flows, and the NPV: 0 1 2 | | |
-800,000 5,000,000 -5,000,000
NPVP = -$386,776.86.
We can find the NPV by entering the cash flows into the cash flow register, entering i = 10, and then pressing the NPV button. However, calculating the IRR presents a problem. With the cash flows in the register, press the IRR button. An hp-10b financial calculator will give the message "error-soln." This means that project P has multiple IRRs. An HP-17B will ask for a guess. If you guess 10%, the calculator will produce IRR = 25%. If you guess a high number, such as 200%, it will produce the second IRR, 400%1. The MIRR of project P = 5.6%, and is found by computing the discount rate that equates the terminal value ($5.5 million) to the present value of cost ($4.93 million).
h. 3. Draw project P's NPV profile. Does project P have normal or non-normal cash flows? Should this project be accepted?
Answer: You could put the cash flows in your calculator and then enter a series of i values, get
an NPV for each, and then plot the points to construct the NPV profile. We used a spreadsheet program to automate the process and then to draw the profile. Note that the profile crosses the x-axis twice, at 25% and at 400%, signifying two IRRs. Which IRR is correct? In one sense, they both are--both cause the project's NPV to equal zero. However, in another sense, both are wrong--neither has any economic or financial significance.
Project P has nonnormal cash flows; that is, it has more than one change of signs in the cash flows. Without this nonnormal cash flow pattern, we would not have the multiple IRRs.
Since project P's NPV is negative, the project should be rejected, even though both IRRs (25% and 400%) are greater than the project's 10 percent cost of capital. The MIRR of 5.6% also supports the decision that the project should be rejected.
1 Looking at the figure below, if you guess an IRR to the left of the peak NPV rate, the lower IRR will appear. If you guess IRR > peak NPV rate, the higher IRR will appear.
10%

Mini Case: 10 - 39
125
250
375
500
-125
-250
-375
100 200 300 400 500 600
Cost of Capital, r (%)
NPV
i. What does the profitability index (PI) measure? What are the PIs for Franchises S and L?
Answer: The PI is equal to the present value of all future cash flows divided by the initial cost.
It measures the “bang for the buck.”
PIS = $119.98 / $100 = 1.1998.
PIL = $118.78 / $100 = 1.1878.
Mini Case: 10 - 40
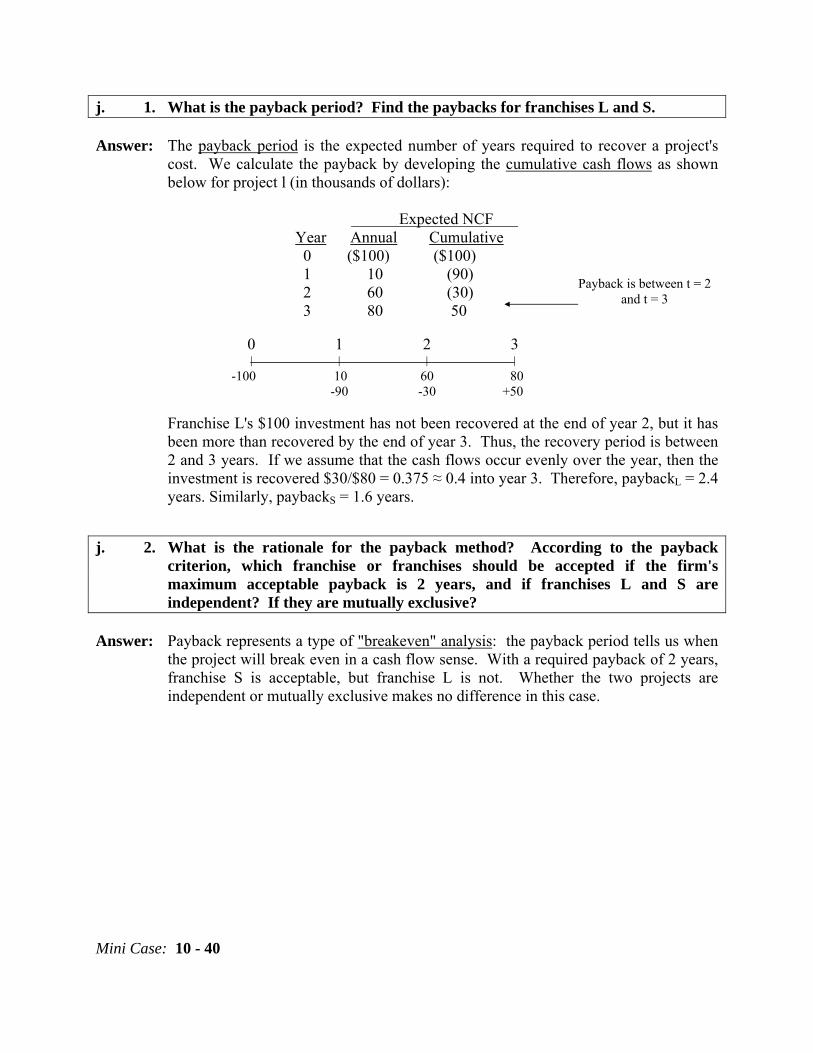
j. 1. What is the payback period? Find the paybacks for franchises L and S. Answer: The payback period is the expected number of years required to recover a project's
cost. We calculate the payback by developing the cumulative cash flows as shown below for project l (in thousands of dollars):
Expected NCF Year Annual Cumulative 0 ($100) ($100) 1 10 (90) 2 60 (30) 3 80 50 0 1 2 3 | | | | -100 10 60 80 -90 -30 +50
Franchise L's $100 investment has not been recovered at the end of year 2, but it has been more than recovered by the end of year 3. Thus, the recovery period is between 2 and 3 years. If we assume that the cash flows occur evenly over the year, then the investment is recovered $30/$80 = 0.375 ≈ 0.4 into year 3. Therefore, paybackL = 2.4 years. Similarly, paybackS = 1.6 years.
j. 2. What is the rationale for the payback method? According to the payback criterion, which franchise or franchises should be accepted if the firm's maximum acceptable payback is 2 years, and if franchises L and S are independent? If they are mutually exclusive?
Answer: Payback represents a type of "breakeven" analysis: the payback period tells us when
the project will break even in a cash flow sense. With a required payback of 2 years, franchise S is acceptable, but franchise L is not. Whether the two projects are independent or mutually exclusive makes no difference in this case.
Payback is between t = 2 and t = 3
Mini Case: 10 - 41
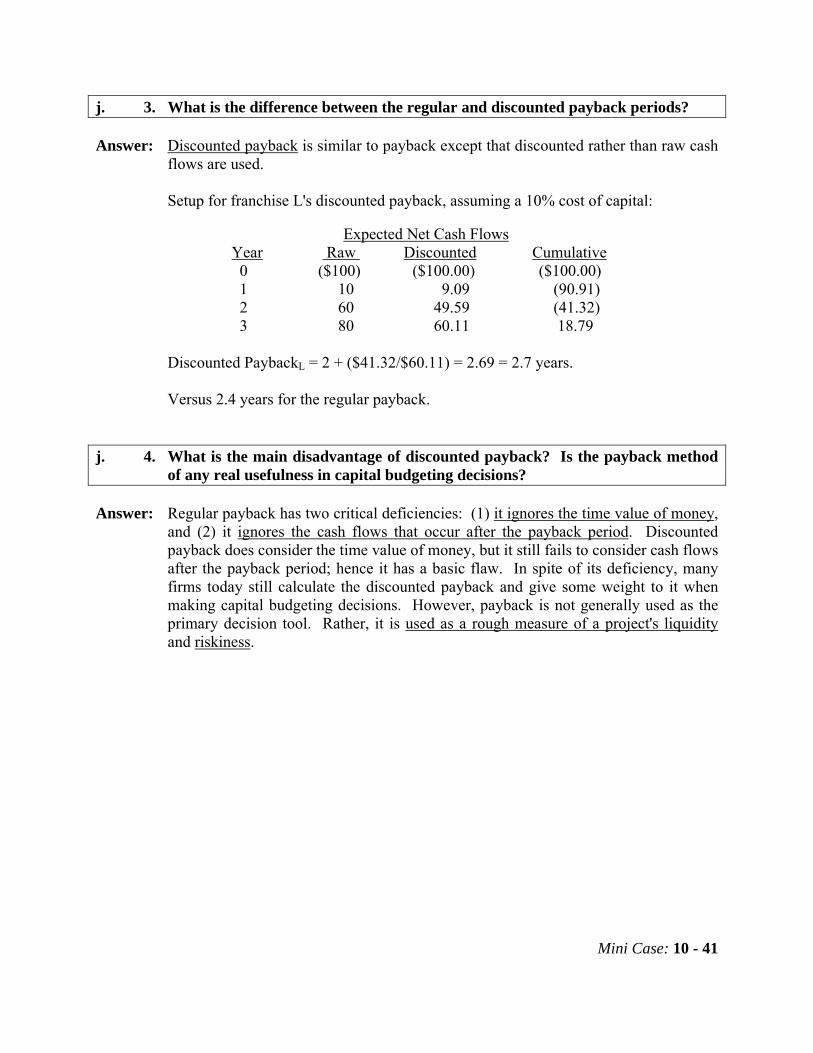
j. 3. What is the difference between the regular and discounted payback periods? Answer: Discounted payback is similar to payback except that discounted rather than raw cash
flows are used.
Setup for franchise L's discounted payback, assuming a 10% cost of capital:
Expected Net Cash Flows Year Raw Discounted Cumulative 0 ($100) ($100.00) ($100.00) 1 10 9.09 (90.91) 2 60 49.59 (41.32) 3 80 60.11 18.79
Discounted PaybackL = 2 + ($41.32/$60.11) = 2.69 = 2.7 years. Versus 2.4 years for the regular payback.
j. 4. What is the main disadvantage of discounted payback? Is the payback method
of any real usefulness in capital budgeting decisions? Answer: Regular payback has two critical deficiencies: (1) it ignores the time value of money,
and (2) it ignores the cash flows that occur after the payback period. Discounted payback does consider the time value of money, but it still fails to consider cash flows after the payback period; hence it has a basic flaw. In spite of its deficiency, many firms today still calculate the discounted payback and give some weight to it when making capital budgeting decisions. However, payback is not generally used as the primary decision tool. Rather, it is used as a rough measure of a project's liquidity and riskiness.
Mini Case: 10 - 42
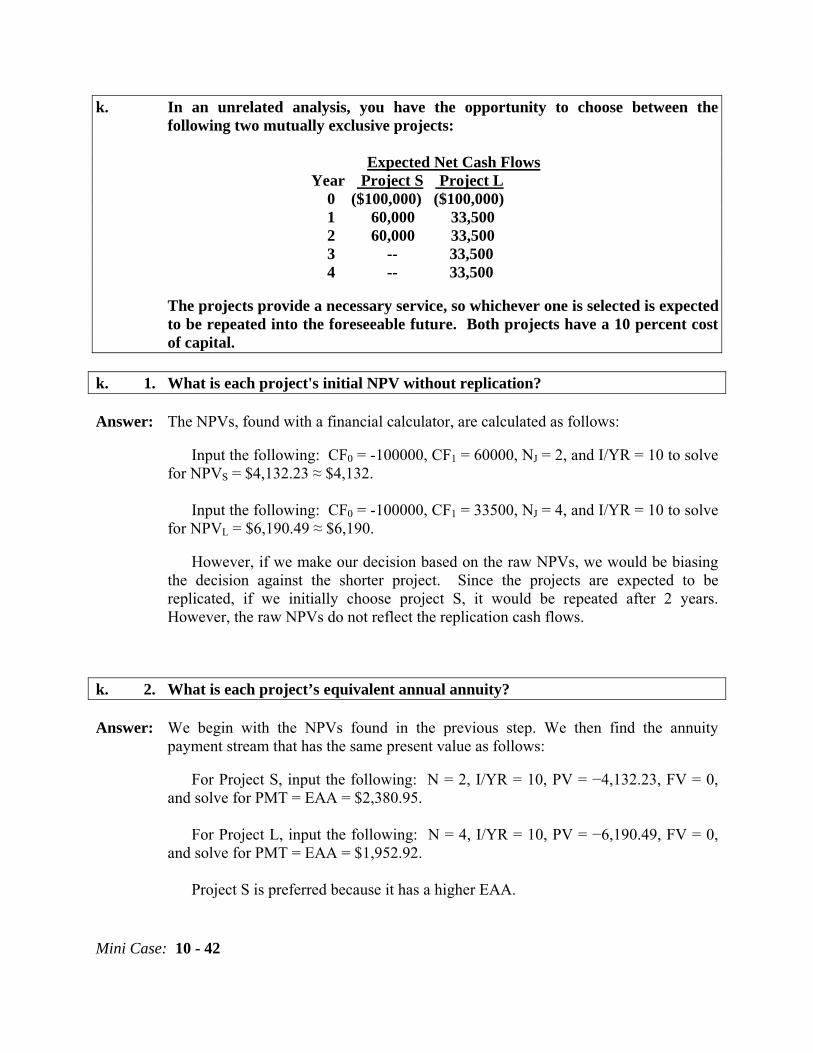
k. In an unrelated analysis, you have the opportunity to choose between the following two mutually exclusive projects:
Expected Net Cash Flows Year Project S Project L 0 ($100,000) ($100,000) 1 60,000 33,500 2 60,000 33,500 3 -- 33,500 4 -- 33,500 The projects provide a necessary service, so whichever one is selected is expected
to be repeated into the foreseeable future. Both projects have a 10 percent cost of capital.
k. 1. What is each project's initial NPV without replication? Answer: The NPVs, found with a financial calculator, are calculated as follows:
Input the following: CF0 = -100000, CF1 = 60000, NJ = 2, and I/YR = 10 to solve for NPVS = $4,132.23 ≈ $4,132.
Input the following: CF0 = -100000, CF1 = 33500, NJ = 4, and I/YR = 10 to solve
for NPVL = $6,190.49 ≈ $6,190. However, if we make our decision based on the raw NPVs, we would be biasing
the decision against the shorter project. Since the projects are expected to be replicated, if we initially choose project S, it would be repeated after 2 years. However, the raw NPVs do not reflect the replication cash flows.
k. 2. What is each project’s equivalent annual annuity? Answer: We begin with the NPVs found in the previous step. We then find the annuity
payment stream that has the same present value as follows:
For Project S, input the following: N = 2, I/YR = 10, PV = −4,132.23, FV = 0, and solve for PMT = EAA = $2,380.95.
For Project L, input the following: N = 4, I/YR = 10, PV = −6,190.49, FV = 0,
and solve for PMT = EAA = $1,952.92. Project S is preferred because it has a higher EAA.
Mini Case: 10 - 43
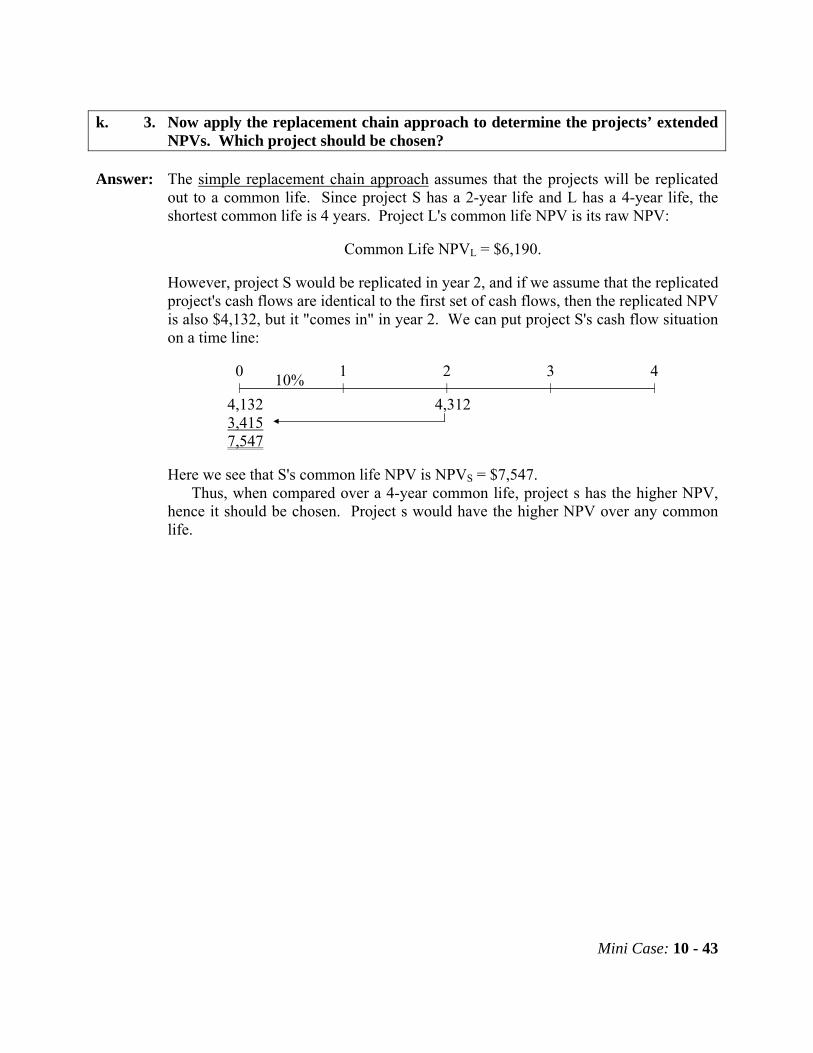
k. 3. Now apply the replacement chain approach to determine the projects’ extended NPVs. Which project should be chosen?
Answer: The simple replacement chain approach assumes that the projects will be replicated
out to a common life. Since project S has a 2-year life and L has a 4-year life, the shortest common life is 4 years. Project L's common life NPV is its raw NPV:
Common Life NPVL = $6,190.
However, project S would be replicated in year 2, and if we assume that the replicated project's cash flows are identical to the first set of cash flows, then the replicated NPV is also $4,132, but it "comes in" in year 2. We can put project S's cash flow situation on a time line:
0 1 2 3 4 | | | | | 4,132 4,312 3,415 7,547
Here we see that S's common life NPV is NPVS = $7,547.
Thus, when compared over a 4-year common life, project s has the higher NPV, hence it should be chosen. Project s would have the higher NPV over any common life.
10%
Mini Case: 10 - 44
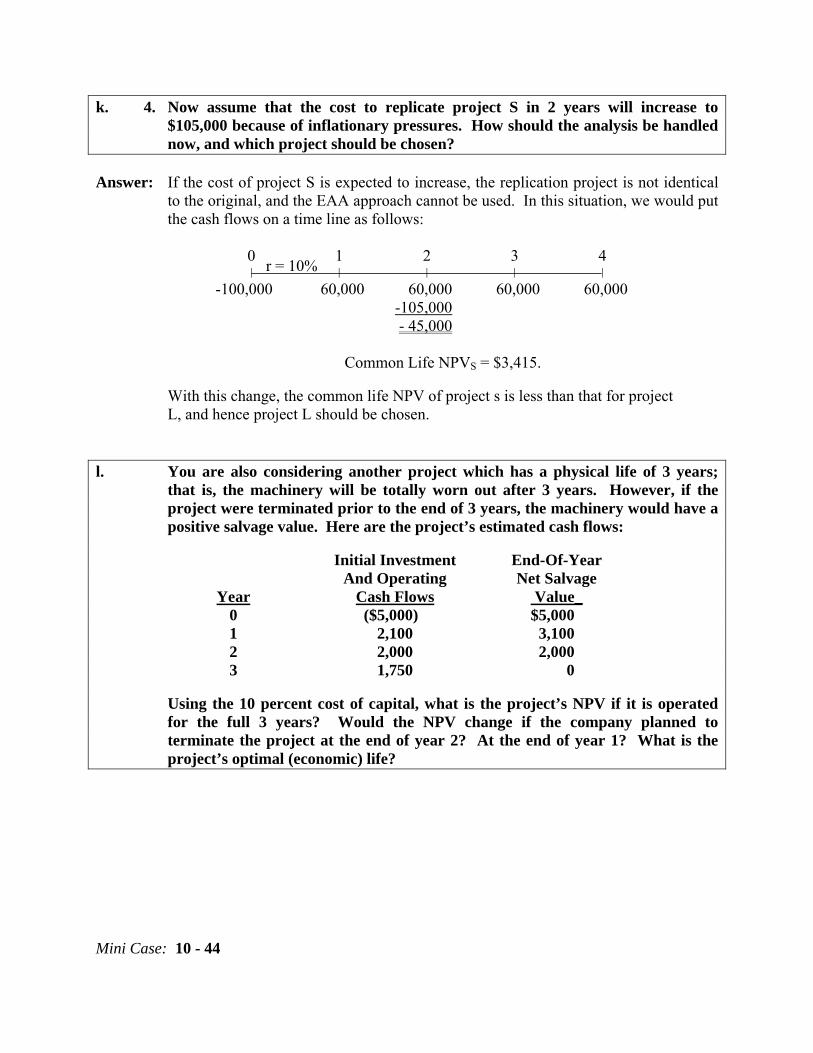
k. 4. Now assume that the cost to replicate project S in 2 years will increase to $105,000 because of inflationary pressures. How should the analysis be handled now, and which project should be chosen?
Answer: If the cost of project S is expected to increase, the replication project is not identical
to the original, and the EAA approach cannot be used. In this situation, we would put the cash flows on a time line as follows:
0 1 2 3 4 | | | | | -100,000 60,000 60,000 60,000 60,000 -105,000 - 45,000
Common Life NPVS = $3,415.
With this change, the common life NPV of project s is less than that for project L, and hence project L should be chosen.
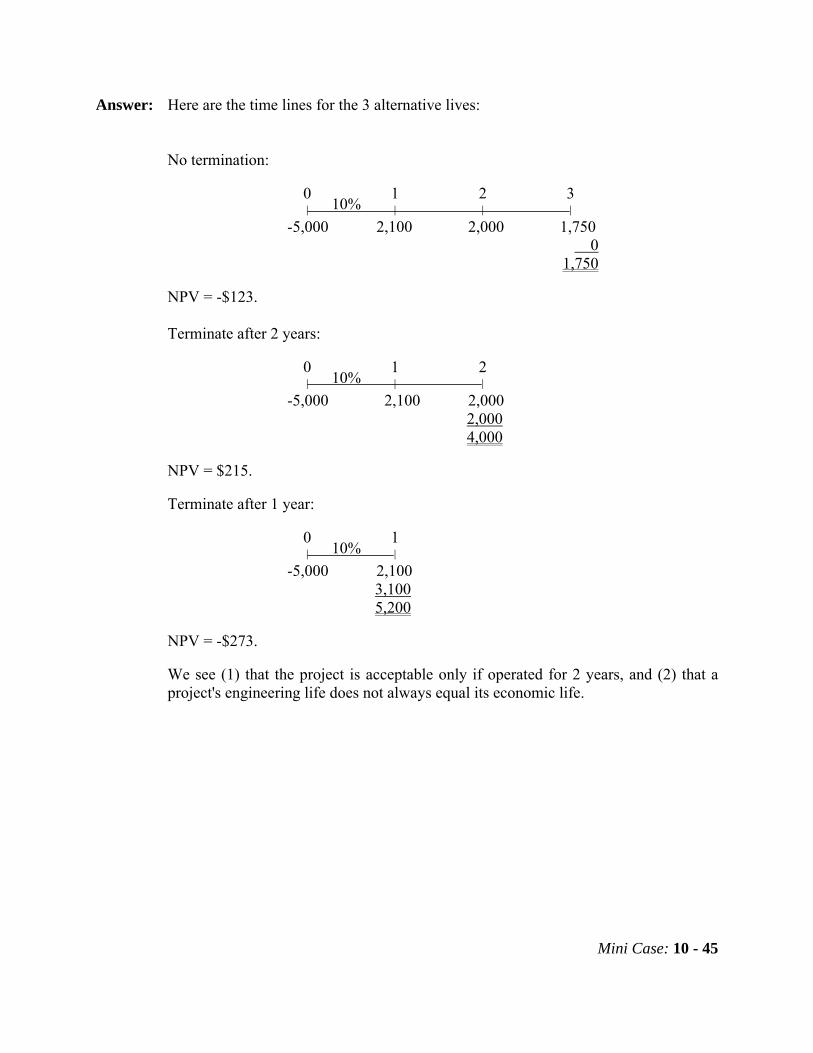
l. You are also considering another project which has a physical life of 3 years;
that is, the machinery will be totally worn out after 3 years. However, if the project were terminated prior to the end of 3 years, the machinery would have a positive salvage value. Here are the project’s estimated cash flows:
Initial Investment End-Of-Year And Operating Net Salvage Year Cash Flows Value_ 0 ($5,000) $5,000 1 2,100 3,100 2 2,000 2,000 3 1,750 0 Using the 10 percent cost of capital, what is the project’s NPV if it is operated
for the full 3 years? Would the NPV change if the company planned to terminate the project at the end of year 2? At the end of year 1? What is the project’s optimal (economic) life?
r = 10%
Mini Case: 10 - 45
Answer: Here are the time lines for the 3 alternative lives:
No termination: 0 1 2 3 | | | | -5,000 2,100 2,000 1,750 0 1,750
NPV = -$123.
Terminate after 2 years: 0 1 2 | | | -5,000 2,100 2,000 2,000 4,000
NPV = $215.
Terminate after 1 year: 0 1 | | -5,000 2,100 3,100 5,200
NPV = -$273.
We see (1) that the project is acceptable only if operated for 2 years, and (2) that a project's engineering life does not always equal its economic life.
10%
10%
10%
Mini Case: 10 - 46
m. After examining all the potential projects, you discover that there are many more projects this year with positive NPVs than in a normal year. What two problems might this extra large capital budget cause?
You only have a limited amount of capital to commit to projects. If you have to raise external capital to fund some of these other positive NPV projects, then you may be faced with an increasing cost of capital. This is called an increasing marginal cost of capital schedule, and it also happens to companies when they exhaust their internal sources of funds and have to go to external capital markets for their finding. This increased cost of capital may cause you to reject projects that you might otherwise accept because with your increased cost of capital, some projects may be negative NPV when they would otherwise be positive NPV in a normal year. Another effect of this large capital budget is that you may choose to ration capital—i.e. not fund all of the projects. This is called capital rationing, and companies and investors do this when for whatever reason they put a cap on the funds they are willing to invest in new projects.