cfa institute research challenge · india rak ceramics previously owned 51% equity stake in india...
TRANSCRIPT

CFA Institute Research Challenge Hosted in
Abu Dhabi
American University in Dubai
2
RESEARCH CHALLENGE 2018
AMERICAN UNIVERSITY IN DUBAI
This report is published for educational purposes only by students competing in The CFA Institute Research Challenge.
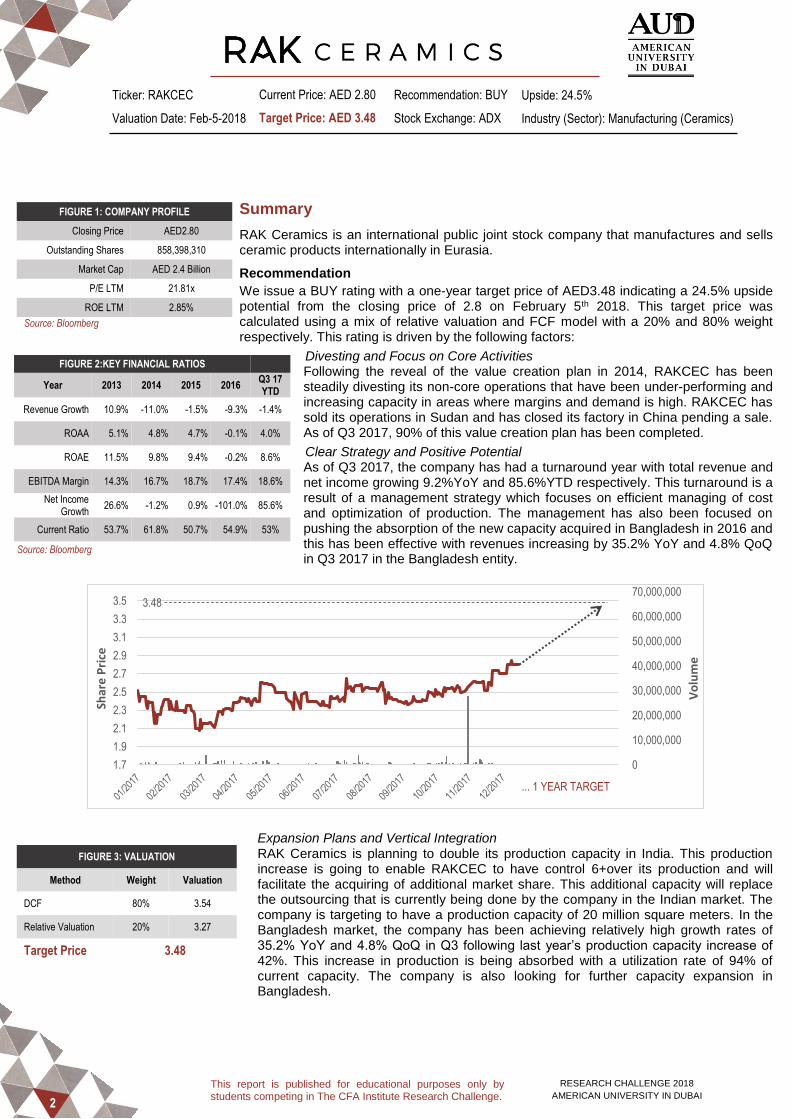
Summary
RAK Ceramics is an international public joint stock company that manufactures and sells ceramic products internationally in Eurasia.
Recommendation
We issue a BUY rating with a one-year target price of AED3.48 indicating a 24.5% upside potential from the closing price of 2.8 on February 5th 2018. This target price was calculated using a mix of relative valuation and FCF model with a 20% and 80% weight respectively. This rating is driven by the following factors:
Divesting and Focus on Core Activities Following the reveal of the value creation plan in 2014, RAKCEC has been steadily divesting its non-core operations that have been under-performing and increasing capacity in areas where margins and demand is high. RAKCEC has sold its operations in Sudan and has closed its factory in China pending a sale. As of Q3 2017, 90% of this value creation plan has been completed.
Clear Strategy and Positive Potential As of Q3 2017, the company has had a turnaround year with total revenue and net income growing 9.2%YoY and 85.6%YTD respectively. This turnaround is a result of a management strategy which focuses on efficient managing of cost and optimization of production. The management has also been focused on pushing the absorption of the new capacity acquired in Bangladesh in 2016 and this has been effective with revenues increasing by 35.2% YoY and 4.8% QoQ in Q3 2017 in the Bangladesh entity.
Expansion Plans and Vertical Integration RAK Ceramics is planning to double its production capacity in India. This production increase is going to enable RAKCEC to have control 6+over its production and will facilitate the acquiring of additional market share. This additional capacity will replace the outsourcing that is currently being done by the company in the Indian market. The company is targeting to have a production capacity of 20 million square meters. In the Bangladesh market, the company has been achieving relatively high growth rates of 35.2% YoY and 4.8% QoQ in Q3 following last year’s production capacity increase of 42%. This increase in production is being absorbed with a utilization rate of 94% of current capacity. The company is also looking for further capacity expansion in Bangladesh.
FIGURE 1: COMPANY PROFILE
Closing Price AED2.80
Outstanding Shares 858,398,310
Market Cap AED 2.4 Billion
P/E LTM 21.81x
ROE LTM 2.85%
Source: Bloomberg
FIGURE 2:KEY FINANCIAL RATIOS
Year 2013 2014 2015 2016 Q3 17 YTD
Revenue Growth 10.9% -11.0% -1.5% -9.3% -1.4%
ROAA 5.1% 4.8% 4.7% -0.1% 4.0%
ROAE 11.5% 9.8% 9.4% -0.2% 8.6%
EBITDA Margin 14.3% 16.7% 18.7% 17.4% 18.6%
Net Income Growth
26.6% -1.2% 0.9% -101.0% 85.6%
Current Ratio 53.7% 61.8% 50.7% 54.9% 53%
Source: Bloomberg
FIGURE 3: VALUATION
Method Weight Valuation
DCF 80% 3.54
Relative Valuation 20% 3.27
Target Price 3.48
Ticker: RAKCEC
Valuation Date: Feb-5-2018
Current Price: AED 2.80
Target Price: AED 3.48
Recommendation: BUY
Stock Exchange: ADX
Upside: 24.5%
Industry (Sector): Manufacturing (Ceramics)
0
10,000,000
20,000,000
30,000,000
40,000,000
50,000,000
60,000,000
70,000,000
1.7
1.9
2.1
2.3
2.5
2.7
2.9
3.1
3.3
3.5
Vo
lum
e
Shar
e P
rice
3.48
... 1 YEAR TARGET

3
RESEARCH CHALLENGE 2018
AMERICAN UNIVERSITY IN DUBAI
This report is published for educational purposes only by students competing in The CFA Institute Research Challenge.
77%
7%
14%2%
Ceramic Products Contracting
Other Industrial Others
3,1683,515
3,125 3,0792,793
337 502.4 584.1 594.1 485.7
2012 2013 2014 2015 2016
Revenue EBITDA
Source: Company Filings
Source: Company Filings
Business Description
RAK Ceramics is a public joint stock company that designs, produces, and sells ceramic tiles and sanitary ware that are used in the most iconic buildings in the Gulf region, such as Burj Al Arab, Ferrari World, and Atlantis Hotel in The Palm Jumeirah. It is the largest ceramic company in the GCC region. H.H. Sheikh Saud Bin Saqr Al Qasimi established RAK Ceramics in 1989 in Ras Al Khaimah, and it became a publicly listed company on the Abu Dhabi Securities Exchange (ADX) in the UAE in October 2003. Its second IPO was in Bangladesh and was issued on 22 June 2010, listed on the Dhaka Stock Exchange. RAK Ceramics specializes in ceramic tiles, porcelain tiles for walls and floors, sanitary ware, and faucets.
Main Operations
Tiles RAK Ceramics produces tiles, ranging from ceramic to porcelain. Tiles are the largest segment by revenues for RAK Ceramics (Figure 6); however, sales have been decreasing in the GCC region due to low oil prices and weak construction projects. The segment had a turnaround in Q3 2017, and tiles revenues increased 11% YoY to AED 466.5 million.
Sanitary Ware This is RAK Ceramics’ second most profitable segment, and sales have increased by 16.6% in Q3 2017 YoY. Total revenues for this segment were reported at AED 120.7 million in Q3 2017. Gross margin for this segment have remained relatively stable YoY at 41%.
Table ware Table ware revenues increased in Q3 2017 by 39% YoY while gross margin decreased to 50.3%. This decline in gross margin occurred due to the consolidation of Resto Fair, a firm with a large account, which distributes supplies and material to Hotels, Restaurants, and Cafés (HoReCa industry).
Non-core Revenues Non-core revenues declined in Q3 2017 by 24.2% YoY. RAK Ceramics is choosing to eliminate and exit non-core operations to avoid further losses and declines in their revenues. This is in line with their Value Creation Plan.
Subsidiaries
RAK Ceramics has adopted the strategy of selling non-core businesses and retaining full control over their operations in foreign countries, to sustain their growth and focus production on core operations only. RAK Ceramics has many plants spread worldwide, most of them located around the UAE, 17 plants in total. They also have one plant in each of Bangladesh, India, and Iran. RAK Ceramics has also been able to base offices and operations in Australia, China, Sudan and Europe. RAK Ceramics benefited greatly from its home offices as the UAE, and specifically Dubai, started excelling in the region, attracting tourists, and becoming one of the top destination countries worldwide.
Saudi Arabia RAK Ceramics acquired one Saudi joint venture (Arak in Jeddah) recently to become a wholly owned subsidiary, and are planning on acquiring the other JV. Saudi Arabia is the second largest market for RAK Ceramics after the UAE.
India RAK Ceramics previously owned 51% equity stake in India in the ceramic tile production in Morbi, in January 2016, it acquired full control over ceramic plants located there, and the plants became wholly owned subsidiaries.
Bangladesh RAK Ceramics started selling shares on the Dhaka Stock Exchange which increased non-controlling interests in the operations located in Bangladesh by 2.6 million AED.
Iran Managers of RAK Ceramics chose to acquire full control over their plants that are in Iran and become wholly owned subsidiaries of their operations.
Others RAK Ceramics has full ownership of any operations in other countries such as China, Sudan, and Australia.
64.38%
16.33%
6.27%
13.02%
Tiles Sanitaryware
Tableware Noncore Revenues
FIGURE 5: OPERATING SEGMENTS (REV)
FIGURE 4: REVENUE AND EBITDA
FIGURE 6: PRODUCT SEGMENT (REV)
Source: Company Filings

4
RESEARCH CHALLENGE 2018
AMERICAN UNIVERSITY IN DUBAI
This report is published for educational purposes only by students competing in The CFA Institute Research Challenge.
Asia72%
Africa3%
EU10%
Other Europe4%
NAFTA3%
Central-South America8%
0
20000
40000
60000
80000
100000
120000
'12 '13 '14 '15 '16 '17 '18 '19 '20 '21 '22
0
5000
10000
15000
20000
'16 '17 '18 '19 '20
Strategy
Vision
“To be the world’s leading ceramics lifestyle solutions provider”.
Value Creation Plan (VCP)
Samena Capital, RAK Ceramics major owner, introduced the Value Creation Plan in 2014 to invest in and focus on their core business growth; increase UAE market share, optimize production and sustain growth; streamline operations; increase sales in Bangladesh and India; and keep control over manufacturing and overhead costs. The main reason for forming this plan is for RAK Ceramics to focus on their main products: tiles, bath ware, porcelain tableware, and faucets. This plan has benefited RAK Ceramics largely with a 14.1% increase in core revenues in Q3 2017 YoY. RAK Ceramics further implemented their Value Creation Plan by investing in core business operations and selling their non-core business operations, such as Ceramin Group. In addition to that, the VCP helped RAK Ceramics customize products according to each customer’s desires due to the wide selection of tiles and the newest technology.
Industry Overview and Competitive Positioning
The Industry
The ceramics industry is a competitive industry that includes producers from developed markets like Europe and the US, and emerging markets, such as China, India, and Bangladesh. Ceramics industry is sensitive to the growth in infrastructure, government expenditure, population, and real estate. Being a major component of ceramics industry, tiles constitute significant portion of the industry growth. By 2020, the tile market is expected to be a 125.32 billion dollars industry13. In 2013, global demand for tiles was expected to grow significantly by 2020 raising from 11.96 billion of sq.m. to 21.8 billion sq.m. (annual CAGR 8.5%). Additionally, production of many key raw materials such as clay, graphite, or rare earths are declining26. This will slow down the growth in supply; thus, the demand will grow faster than the supply. The fact that the demand is higher than the supply means that the prices of tiles are expected to increase. Geographically, the largest area of production, consumption, export, and import is Asia, with the share of 71.5% of total production as of 2016, which also includes RAK Ceramics manufacturing facilities4 (Figure 9). Another main component of the ceramics industry is sanitary ware products. The market for sanitary ware is similar to the one of tiles and is expected to grow by annual CAGR of 7% during 2016 to 2020. However, the main difference from tiles is that in 2015, the biggest consumer is the Americas region, which is expected to sustain its leading position until 20201.
Macroeconomics
The ceramic industry is influenced by macroeconomic factors. GDP, income per capita, and purchasing power have positive relationship with demand for sanitary ware, tiles, and other ceramic products. The global GDP is expected to grow steadily by 2022 which means the income will also increase, which will constitute the raise in demand for ceramics19 (Figure 10). The demand is derived from investment component of a country’s GDP. Being parts of investment, increase in purchases and renovation of houses and commercial construction, which are also the functions of income, will naturally stimulate the increase in demand of ceramic products. Since ceramics demand depends on investment, interest rates play an important role in the industry. Interest rates decline throughout the world (Figure 11); especially after the Global Financial Crisis in 2008, interest rates are expected to be low for long period of time, according to many countries’ government commitments to keep the interest rates low to boost up the economy. Due to the rates being low, people’s future expectations towards borrowing tend to be positive, which stimulates willingness to invest (mortgages, commercial construction, renovation), and therefore, demands for ceramics products. In addition, government expenditure (G) on infrastructure and public needs, which is a component of GDP, also influences the demand for ceramic products. Infrastructure projects, such as public transportation, and government expenditure on public needs, such as schools, government buildings, and other public institutions drive the demand for ceramic products. Having a positive relationship, increase in global infrastructure transactions throughout the world imposes increase on the demand of the ceramic products11 (Figure 13).
FIGURE 10: GLOBAL GDP IN $ BILLIONS
FIGURE 8: PRODUCTION OF TILES SQM MN
FIGURE 7: RESIDENTIAL SUPPLY
0
2500
5000
7500
10000
12500
15000
'09 '10 '11 '12 '13 '14 '15 '16
FIGURE 9: TILE PRODUCTION ‘16
Source: World Property Journal
Source: ACIMAC
Source: ACIMAC
Source: Staista

5
RESEARCH CHALLENGE 2018
AMERICAN UNIVERSITY IN DUBAI
This report is published for educational purposes only by students competing in The CFA Institute Research Challenge.
0.00%
1.00%
2.00%
3.00%
4.00%
5.00%
-0.2
0.3
0.8
1.3
1.8
'15 '16 '17 '18 '19 '20
Ann
ual R
eal G
DP
Gro
wth
Nom
inal
GD
P (
AE
D tr
)
UAE Nominal GDP (AED tr)
Annual UAE Real GDP Growth
Annual Global Real GDP Growth
0
200
400
600
800
1000
1200
1400
'10 '11 '12 '13 '14 '15 '16
United Arab Emirates Economy
Being the largest market of RAK Ceramics, the United Arab Emirates’ economy plays a big role in the company’s development and success. Among all the GCC countries, the UAE has the most promising economy growth expectations. Due to the gradual oil prices recovery, UAE is expected to sustain its stable growth until 202018 (Figure 17). Such confident growth is also explained by the fact that UAE economy is well diversified.
One of the biggest and fastest growing sectors is tourism and real estate. Dubai is rated in the top 5 tourists’ destinations in 2016 and is expected to develop even further in tourism sector by 2020. In addition, real estate is forecasted to fluctuate with the rapid growth in 2020 due to EXPO202020 (Figure 7). Additionally, UAE economy is expected to grow faster than the global economy making it an attractive market for every industry in the country12 (Figure 12).
Among other things, it is important to consider the introduction of VAT as an influential force on the UAE economy. Even though, introduction of the tax generally is expected to lead to decrease of consumption and aggregate demand, UAE VAT is not going to have a large adverse effect on economic growth, which can be explained by the country’s living standards. High living standards of the UAE make consumption less sensitive to the small VAT (5%). Due to the large inflow of people to the UAE for the upcoming EXPO2020, consumption and government expenditure for the planned projects will increase. Therefore, given positive expectations of the UAE economy development, growth in consumption, government expenditure, and real estate and tourism sectors development, the demand for ceramic products in the UAE is predicted to increase accordingly.
Other Regions
Saudi Arabia In contrast to the UAE, KSA is highly dependent on oil, and the oil prices drop in the past few years has affected the government budget negatively. However, the recent oil price increase helps KSA move towards recovery, and the growth rate is expected to reach 2.5% by 202017. Negative government budget carried from last year influences government spending in the country negatively, including the construction projects. Therefore, this budget deficit can negatively influence the demand for the ceramic products; thus, the growth of demand is expected to be flat or very small8.
Middle East and North Africa
Economic growth and countries’ income is expected to improve by 2020 exceeding the growth of 3%. However, this expected growth is still extremely small, comparing it to the years before Arab Spring21 (2011). Nevertheless, other countries like Qatar, Kuwait, or Egypt are heavily investing in constructing, which will raise the demand for ceramics over the next decade5.
India Being a developing country, India has a high growth rate expectation that are predicted to reach around 8% by 2020. Moreover, they have a target to construct 20 million social housing units by 2020. This high construction potential directly affects the demand for ceramic products22.
Trends
Antibacterial tiles
Antibacterial properties of tiles are currently of high demand and are widely used by health
and pharmaceutical industries. Such antibacterial tiles reduce organic and inorganic
pollutants and improve hygiene, conserve appearance, and lead to purification6. Many
ceramic products manufacturers have started producing such tiles; however, this trend is
still new, and it gives the companies opportunities for development and competitive
advantage.
Design
Today, anti-slip, light in weight, and ultrathin tiles are highly demanded in the market6.
Another trend in design is large tiles in size that has very few and thin joints. As per the
colors that are individual to each customer, the companies offer big range of colors and
finish pallets of various surfaces for different budgets and tastes. General trends are
currently in busy tonalities, and the designs of different ornaments and patterns. As per
finishes, the trend is in polished finishes. European countries, in fact, prefer more of plain
colors and simple designs with matte surface.
FIGURE 11: LENDING RATES
FIGURE 13: INFASTRUCTURE TRANSACTIONS
Source: Deloitte
FIGURE 12: GDP GROWTH
FIGURE 14: NUMBER OF VISITORS 2016
0%
5%
10%
15%
20%
'92 '94 '96 '98 '00 '02 '04 '06 '08 '10 '12 '14 '16
India United States
United Kingdom China
Source: World Bank
Source: GIIA & PWC
Source: Deloitte

6
RESEARCH CHALLENGE 2018
AMERICAN UNIVERSITY IN DUBAI
This report is published for educational purposes only by students competing in The CFA Institute Research Challenge.
Sustainability Another trend in production of ceramic products is sustainability and environmental care. Construction companies, governments, and small retailers prefer eco-friendly materials, way of production, and end products from ceramic manufacturers. Ceramic companies try to use recyclable materials and process to reduce costs, avoid waste, and consume less energy and water7.
Low cost products Most customers prefer the low cost products, and currently, Chinese manufacturers are at high demand in ceramics. Cost efficiency in production, cheap substitute of expensive raw materials, innovative production technology, have allowed Chinese companies to overcome other producers in the industry.
Competitive Positioning
Being one of the largest ceramic brands in the world, RAK Ceramics stands out with its quality, design, variety of choices, innovations, and sustainability of production. During the years of operations, the company was granted different international quality certifications. In fact, ISO 14001 and ISO 9001, worldwide recognized quality standards certifications by Bureau Veritas Certifications, distinguishes RAKCEC’s Environmental Managements System and for design, development, production and supply of RAK Ceramics’ core products.
With the help of the latest technologies in production, RAKCEC’s customers are exposed to a variety of colors, designs, sizes of tiles, sanitary wares, and table wares. Digital printing technologies, big slabs, anti-microbial, slim, glow in the dark and other technologies facilitated winning of the silver award for “The Most Innovative Company” in 2015, and RAKCEC was recognized as the Most Innovative Company in the Middle East as of 2017. Additionally, RAKCEC actively practices sustainable production by saving energy, reducing pollution, recycling natural raw materials, and developing eco-friendly products.
Overall, the company has strong competitive position worldwide and is recognized as one of the largest ceramic products manufacturers2. Thus, RAKCEC has large audience which magnifies its competitive advantage. In 2015, RAKCEC was awarded “Brand of the Year” at the World Branding Awards, and “Brand Revitalization” at The Middle East Branding and Marketing Leadership Awards in 2017, which proves RAKCEC’s strong positive brand image.
Competitors
Based on the competitors’ analysis, Somany is the strongest competitor of RAK Ceramics due to having the most competitive mix of production and shared markets. Saudi Ceramics is the second most threatening competitor that shares all major markets and most core products. Prism Cement is another Indian competitor of RAK Ceramics that competes in all major product lines and in four major markets. As per the results of the analysis, it can be concluded that even though there are strong competitors in each operating market of RAK Ceramics, Indian and GCC leading ceramic manufacturers should be considered as main direct competitors of RAKCEC due to similarities in target markets, objectives, and products.
Competitor Tiles Sanitary
ware Table ware
Prism Cement
✓ ✓ ✓
Somany ✓ ✓ ✘
Saudi Ceramics
✓ ✓ ✘
Cleopatra Ceramics
✓ ✓ ✘
Al Maha Ceramics
✓ ✘ ✘
Geberit AG ✘ ✓ ✘
Marazzi Group SRL
✓ ✘ ✘
Al Anwar Ceramic
Tiles ✓ ✘ ✘
Glarun Technology
✘ ✘ ✓
Grupo Lamosa
✓ ✘ ✘
Competitor Market Cap (in billions) UAE KSA Middle East India Bangladesh Europe Africa Remarks
Somany 35.014 ✓ ✓ ✓ ✓ ✓ ✓ ✓ Only exports
Saudi Ceramics 1.325 ✓ ✓ ✓ ✓ ✓ ✓ ✓
Al Maha Ceramics 0.40 ✓ ✓ ✓ ✓ ✘ ✘ ✓
Prism Cement 67.727 ✓ ✘ ✘ ✘ ✓ ✘ ✓
Cleopatra Ceramics NA ✘ ✘ ✓ ✘ ✘ ✓ ✓ Private
Geberit AG 16.687 ✘ ✘ ✘ ✓ ✘ ✓ ✘
Marazzi Group SRL 20.866 ✘ ✘ ✘ ✓ ✘ ✓ ✘ Acquired by Mohawk Industries Inc.
Al Anwar Ceramic Tiles 0.98 ✓ ✓ ✘ ✘ ✘ ✘ ✘
Glarun Technology 10.168 ✘ ✘ ✘ ✘ ✘ ✘ ✘ Sells domestically (China)
Grupo Lamosa 16.880 ✘ ✘ ✘ ✘ ✘ ✘ ✘
Pris
m C
emen
t
Sau
di C
eram
ics
Som
aniy
FIGURE 15: TOP COMPETITORS

7
RESEARCH CHALLENGE 2018
AMERICAN UNIVERSITY IN DUBAI
This report is published for educational purposes only by students competing in The CFA Institute Research Challenge.
0
20
40
60
80
100
120
140
160
2008
2009
2010
2011
2012
2013
2014
2015
2016
2017
WTI BRENT
0
1
2
3
4
5
Threat of NewEntrants
Threat ofSubstitutes
BargainingPower ofSuppliers
BargainingPower of
Customers
CompetitiveRivalry
Porter’s 5 Forces summary
As per Porter’s 5 Forces analysis (see Appendix B4), we deduce that the threat of the new entrants for RAK Ceramics is low due to the pretty high barriers to enter the industry, high cost per unit (economies of scale), and high capital requirements for new comers. Threat of substitution is evaluated to be moderate due the existence of other alternative materials like plastic, aluminum, etc. Bargaining power of suppliers is high since the number of suppliers in ceramic industry is limited. However, bargaining power of customers is moderate, because in spite of having large scale buyers, the switching costs tend to be high. Lastly, regardless the large number of competitors, since the companies of the industry are not having open aggressive strategies and campaigns against each other, we consider the competitive rivalry moderate.
Investment Summary
Investment Thesis
We recommend a buy rating for RAK Ceramics stock price, as our target price is 3.48 AED per share, indicating a 24.5% upside from the closing price of 2.80 AED on February 5th 2018. We calculated our fair value price using relative valuation and Discounted Cash Flow Model with a 66% weightage going to equity and 34% weightage for debt. Our recommendation was based on the following drivers:
Key Potential Drivers
Divesting and Focus on Core Activities Following the reveal of the value creation plan in 2014, RAKCEC has been divesting its non-core operations that have been under-performing and increasing capacity in areas where margins and demand is high. RAKCEC has sold its operations in Sudan and has closed its factory in China pending a sale. As of Q3 2017, 90% of this value creation plan has been completed and core revenue has increased by 14.1% YoY.
Clear Strategy and Positive Potential As of Q3 2017, the company has head a turnaround year with revenue growing 17.7% YoY for Q3 and 11.8% YTD. This turnaround is a result of a management strategy which focuses on efficient managing of cost and optimization of production. The management has also been focused on pushing the absorption of the new capacity acquired in Bangladesh in 2016 and this has been effective with revenues increasing by 35.2% YoY and 4.8% QoQ in Q3 2017 in the Bangladesh entity
Expansion Plans and Vertical Integration RAK Ceramics is planning to double its production capacity in India. This production increase is going to enable RAKCEC to have control over its production and will facilitate the acquiring of additional market share. This additional capacity will replace the outsourcing that is currently being done by the company in the Indian market. The company is targeting to have a production capacity of 20 million square meters. In the Bangladesh market, the company has been achieving relatively high growth rates of 35.2% YoY and 4.8% QoQ in Q3 following last year’s production capacity increase of 42%. This increase in production is being absorbed with a utilization rate of 94% of current capacity. The company is also looking for further capacity expansion in Bangladesh.
Increase in oil prices
Expectations for the GCC region include an increase in oil prices after a long period of decline. This increase leads to more investment in construction and building, therefore requiring constructing companies to purchase ceramics and floor tiles to build new projects. According to the Khaleej Times, the oil GDP forecast in the GCC is expected to increase by 1.7% in 2018 and become stronger in 2019. Increases in oil extraction and exports further strengthens the GCC economy, and leads to new projects and building.
Expo 2020 Expo 2020 is the main event that is going to benefit the UAE economically, strengthen the market, attract investment, and induce growth. The forecast for the country’s GDP is expected to increase greatly in the next 2 years, with the expectation of Expo 2020’s success. The IMF states that UAE’s real GDP growth is expected to be 3.4% in 2018 and 2.2% in the GCC region. Rulers and local company owners feel that Expo 2020 will increase production and demand drastically, and will lead to very high returns and expansion in the following years. We found a strong correlation, 99.44%, to exist between population growth worldwide and change in revenue for ceramic products; RAK Ceramic’s biggest production line. This indicates that revenues should increase as population growth increases over the next 5 years.
FIGURE 16: PORTER’S FORCES
FIGURE 17: CRUDE OIL PRICES
Source: Bloomberg

8
RESEARCH CHALLENGE 2018
AMERICAN UNIVERSITY IN DUBAI
This report is published for educational purposes only by students competing in The CFA Institute Research Challenge.
8%
10%
13%
15%
18%
20%
23%
'12 '13 '14 '15 '16 '17e '18e '19e '20e '21e
-15%
-10%
-5%
0%
5%
10%
15%
'13 '14 '15 '16 '17e '18e '19e '20e '21e
-30%
-20%
-10%
0%
10%
20%
30%
40%
50%
60%
'13 '14 '15 '16 '17e '18e '19e '20e '21e
Adaptability to changes in market and technology innovation
RAK Ceramics strategy for its high-quality products and increased demand is to always adopt and implement new technology. RAK Ceramics seeks to innovate machinery and introduce new products periodically to fulfill all customers’ tastes and stimulate demand for new products. Furthermore, RAK Ceramics has been able to adapt to market changes, such as when the oil prices decreased and production declined in Saudi Arabia in 2016, they covered their losses by selling non-core businesses and increasing production in the UK.
Cost Management: RAK Ceramics increased production efficiency, which helped maintain manufacturing costs. They reduced raw materials costs and increased the production process, utilizing machinery and equipment fully. Furthermore, when RAK Ceramics acquired a controlling stake in the company in India, they became more flexible, efficient, and cost effective in production. RAK Ceramics further controlled their costs by selling non-core businesses that were causing reduction in the company’s profits. Lastly, RAK Ceramics operates plants in low wage countries, such as Bangladesh and Sudan, reducing their costs greatly and increasing their profits.
Valuation
Using a discounted free cash flow model, we arrived at a fair value of AED 3.48 per share representing a 24.5% upside potential over the closing price of 2.8 on Feb 5th. According to our fair value analysis, the stock price is undervalued and is trading at a discount.
Methodology
Discounted cash flow model and Relative Valuation were used to estimate the fair value price. However, the DCF model was assigned a greater weighting of 80% given the unique nature of the company and the lack of peers that have international operations and production in the MENA region.
Discounted Cash Flow
To value RAK Ceramics, a two stage DCF model utilizing free cash flow. Our expectations for RAK Ceramics include increasing growth after the completion of their value creation strategy which is now at 90%. This strategy has already resulted in 11.8% growth in revenues YTD. We forecasted the year to year financials up to 2021 and a second phase terminal value. Based on our analysis we created three scenarios: Bullish, Bearish and Base with 80%, 20%, and 20% weights respectively and arrived at a fair value of AED 3.54 per share.
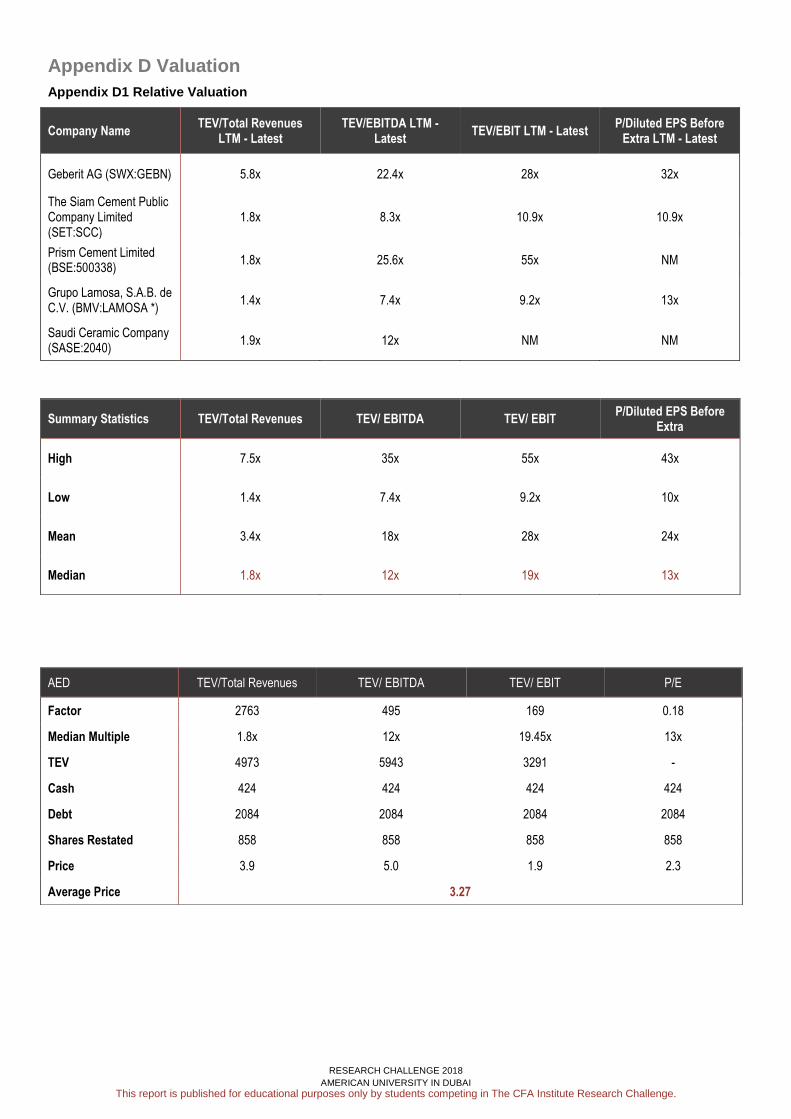
Relative Valuation
In order to value RAK Ceramics, several multiples were used and these include: (1) EV/ Revenue, (2) EV/ EBITDA, (3) EV/EBIT, (4) P/E. These multiples were used to calculate the fair value price for RAK ceramics and their prices were averaged to arrive at a fair value of AED 3.27 per share.
Financial Analysis
Growth and Margin
RAK Ceramics has been suffering from decline in sales since 2014 with revenue decreasing 11%, 1% and 9% in 2014, 2015, and 2016 respectively. Company filings allude that this decrease is due to the MENA region political instability as well as operational problems in India. Specifically, the company relied upon a governmental official to assist in setting up a gas pipeline for the new factory in the North of India. However, the respective official passed away and the company was forced to adopt costly methods of acquiring gas which increased their operating costs. Weak demand in the MENA region can be attributed to two factors: (1) the oil price crisis, which has reduced investment, government spending and decreased overall economic condition of the region with the greatest effect being on GCC oil producing countries. (2) The ongoing anti-terrorism efforts have further strained governmental budgets and reduced spending, with a majority of companies starting consolidation efforts. The translation from top line (revenue) into bottom line (EBITDA) varied throughout the last 5 years with a peak of 20% in 2015 and a slight decrease in 2016 to 17%. In the last twelve months, the company has been maintaining this ratio with 18% revenue to EBITDA LTM.
LTM EV/
Revenue EV/
EBITDA EV/
EBIT P/E
Multiple Used
2.5x 15.1x 25.7x 22.5x
Valuation 3.9 5.0 1.9 2.3
Average Relative
Value 3.27
AED mn 2017e 2018e 2019e 2020e 2021
EBITDA 453 473 505 522 540
CAPEX 125 194 192 166 172
WC USED 169 -57 -113 88 -57
TAX -20 -16 -17 -19 -20
FCFF
594 567 757 635
PV
561 505 636 476
TERMINAL PV
2522
WACC 12.3%
TERMINAL GROWTH
2.0%
NET DEBT 1660
FCF 3040
SHARES MN
858.4
FAIR VALUE
3.54
FIGURE 18: REVENUE GROWTH
FIGURE 20: EBITDA MARGIN
FIGURE 19: EBITDA GROWTH
Source: Company Filings
Source: Company Filings
Source: Company Filings

9
RESEARCH CHALLENGE 2018
AMERICAN UNIVERSITY IN DUBAI
This report is published for educational purposes only by students competing in The CFA Institute Research Challenge.
0
10000
20000
30000
40000
50000
60000
3.21
3.23
3.25
3.28
3.30
3.33
3.35
3.37
3.40
3.42
3.45
3.47
3.49
3.52
3.54
3.57
3.59
3.61
3.64
3.66
3.69
3.71
3.73
3.76
3.78
3.81
3.83
TARGET PRICE= 3.48
75
95
115
135
155
175
195
215
235
'13 '14 '15 '16 '17e '18e '19e '20e '21e
Days in Accounts Receivables -
Days in inventory -
Days in Accounts Payable -
50%
55%
60%
65%
70%
75%
80%
85%
90%
'12 '13 '14 '15 '16 '17e '18e '19e '20e '21e
0%
5%
10%
15%
20%
25%
30%
'12 '13 '14 '15 '16 '17e '18e '19e '20e '21e
Our expectation is that RAK Ceramics is poised for a recovery this year with no material losses or gains. In the following four years, the company is expected to experience solid and steady growth starting with relatively elevated levels of growth and then stable growth in the following years due to the demand drivers mentioned. Working Capital
DIO Days in inventory increased from 154 to 220 during the period between 2013 and 2016. This is because the company is facing difficulties with satisfying smaller orders since they can only produce a certain design at a minimum amount of production. This causes an excess of inventory that they need to dispose of. If the design in not in demand, then the stock will sit in inventory for extended periods of time.
DSO Number of days in accounts receivable has been stable in the past 5 years and has been ranging between 115 and 153. We expect the company to improve their collections and reduce the days in receivables as outlined in their current strategy.
DPO Number of days in accounts payable has also been stable in the past 5 years ranging from 128 to 147. This is due to the exporting nature of the company and thus the DPO will be higher than the industry average since they need to provide longer credit and they take longer to pay.
Capital Structure
Leverage Ratio RAK Ceramic’s leverage ratio has increased from 62% to 78% during the period between 2015 and 2016. This level of debt to equity is expected to remain relatively constant for the next year and decrease in the following years to 70%. This level is higher than the industry standard but is not unexpected given the size and the manufacturing nature of the company.
Capital Expenditure Capital expenditure increased fixed assets marginally by 25% from 2014 and 2015. This was primarily due to the expansions and acquisitions in India and Bangladesh. This year’s Capex is estimated to be slightly above the maintenance Capex which is 125 million AED.
Monte Carlo Simulation A Monte Carlo simulation was performed in order to study the impact of deviation in any of two of our key assumptions. The cost of equity was permitted a range between 14% and 20% and terminal growth was permitted to deviate between 1.5% to 2.5%. The probability of arriving at a sell decision was computed to be 0% while the probability of arriving at a buy decision was computed to be 99% with 1% of a hold rating. These probabilities were computed after a 1,000,000 iteration simulation
Investment Risks
Market Risk (High)
Declining Oil prices Due to a large part of its sales revenue coming from oil exporting countries, declining oil prices can very well lead to an even further decline of revenues. As a Multi-national company, RAK Ceramics is under constant threat of currency fluctuations. Unfavorable fluctuations in the currencies with which RAKCEC operates would lead to decline in the company’s general profitability.
Under-performance in Indian market RAK Ceramics needs it’s Indian endeavors to succeed as India is an oil importing country, which will allow RAKCEC to offset the decline of sales in oil exporting countries as the price of oil possibly decreases. Lack of capturing KSA recovery, as the KSA is poised to recover, it is also poised to nationalize and capture more of its none oil-based GDP, this may zone out RAKCEC’s ability to recapture lost revenue in the region.
Possibility of a market decline to be experienced after EXPO2020 in Dubai UAE being RAK Ceramics highest revenue provider, such a decline will have serious consequences on a company already facing declines.
FIGURE 23: CAPEX TO FIXED ASSETS
FIGURE 21: WORKING CAPITAL RATIOS
FIGURE 22: DEBT TO EQUITY
Source: Company Filings
Source: Company Filings
Source: Company Filings

10
RESEARCH CHALLENGE 2018
AMERICAN UNIVERSITY IN DUBAI
This report is published for educational purposes only by students competing in The CFA Institute Research Challenge.
Market
Operational
Financial
Pro
babi
lity
Severity
19.1%
6.4%
6.1%5.7% 62.7%
Samena Limestone Co
Limestone SAE
Fab Investments
General Pensions and Social Security Authority
Free Float
Shifting consumer preference, RAKCEC’s tiles are not all the same, as seen in previous years as certain tile designs become a fad of the past, this inventory must be disposed of and replaced with the new designs leading to serious waste of inventory and capital.
Concentration risk RAKCEC distribution is handled by only a few distributors, giving significant power to each distributor to cause problems in RAKCEC’s operations.
Liquidity Risk
RAKCEC stock is very illiquid with low volumes being traded. I.e. it is a thinly traded stock, which is volatile and has few buyers and sellers which means it may be hard to exit if an investor chooses to do so.
Operational Risk (Moderate)
Accounts Receivable Risk RAKCEC’s accounts receivables are relatively high compared to competition in the region, this shows that the company is not very efficient at collecting payments. Such credit Management problems can lead to serious cash flow implications. This can also be seen in the declining asset-to-liabilities ratio of the company.
Debt Risk RAKCEC has substantial Debts, which might be directly related to the accounts receivable issue, nevertheless this may become a growing issue as interest rates in its countries of operation begin to rise. The longer this issue persists the more painful the compounding effect of interest payable will drag company ratios down. The high leverage ratio of 77.8% means that the company may face difficulty obtaining additional financing for expansion if the company is unable to repay its debts on time.
Global Operating efficiency Although RAK Ceramics is fairly positioned in comparison to local competition, it is quiet below the average on a global level in terms of inventory turn-over (1.69).
Lack of Flexibility in production to demand RAK Ceramics has stated that a major risk they face is the inability to capture smaller orders, or even orders that are not of a certain number. Moreover, when smaller orders are accepted, the company is left with inventory that they need to dispose of if the design is not in demand, this leads to waste and additional cost. Regulations, as a manufacturing company RAK Ceramics is always under threat to require further investment in its factories if regulations in its countries of operations are updated unfavorably for them.
Legal Risk (Moderate)
Political Instability Risk
Political Instability, as seen with their factory in Iran; plays a major role in manufacturing countries that seek to expand in less costly countries. Iran is continuously facing sanctions on imports and exports and RAK Ceramics can be exposed to this if Iran does not comply with United Nations regulations on its nuclear program. Legal Risk In May 2014, legal cases were filed against the previous management.
Corporate Governance
Shareholder Structure
RAKCEC’s authorized capital stock consists of 858,398,310 Total shares outstanding, 161,835,650 of which are closely held shares. Major shareholders include Samena Limestone Co (19.06%), Limestone SAE (6.41%), Fab Investment LLC (6.12%), General Pensions and Social Security Authority (5.69%), Oman Investment Fund also holds a significant private percent of the company in terms of shares. RAKCEC has issued dividends every year for the past 5 years 0.17, 0.14, 0.43, 0.30, 0.15 from 2012 to 2016 (per share), respectively.
Corporate Management
RAKCEC’s key professionals include Abdallah Massaad (CEO) who has served since 2012. Before joining, RAKCEC Mr Abdallah served as GM of International Ceramics Company SARL. Pramod Kumar Chand (CFO & Interim Head of Investor Relations) has served since only June 2017. Bob Mulumudi is the CIO & Vibhuti Bhusha is the CCO & Head of The Internal Control Department. We note that for each segment of their business such as tiles, sanitary ware, and tableware there are separate Chief Operating Officers. Girija Sankar Patnaik (Tiles), Sateesh Sanjiva Kamath (Sanitary ware), Ranu Oomen (Tableware). Overall, the corporate management seems to have diversity in terms of background and experience and the company appears to be interested in having a diverse
FIGURE 24: INVESTMENT RISK MATRIX
FIGURE 25: SHAREHOLDER OWNERSHIP
Source: Company Filings
11
RESEARCH CHALLENGE 2018
AMERICAN UNIVERSITY IN DUBAI
This report is published for educational purposes only by students competing in The CFA Institute Research Challenge.
workforce. The management team has shown some energy in terms of reacting to underperforming none-core businesses and is attempting to divest the company’s business interests. It is also important to note that although revenues have been declining the past years, cost efficiency seems to be increasing, a strong sign of a company posed to recover given the right circumstances.
Corporate Governance
Board members include Sheikh Khalid bin Saud Al Qasimi (Chairman), Shirish Saraf (Vice Chairman) Vice President and Co-founder of Samena Capital, and big investors such as Wassim Moukahhal who is Senior Vice President of Samena Capital Investments (a large shareholder in RAKCEC). Fawaz bin Suliman Al Rajhi, Managing Director of Investment Committee at Al Rajhi United. Khalid Ali Saif Al Yahmadi, Investment Director of Oman Investment Capital. A significant percentage of the board consists of investors in the stock, rather than experts in the field of ceramics or such, such a measure may signal short-term stock-raising measures that may not always be healthy for the company’s long-term outlook.
Social Responsibility
RAKCEC is active in terms of hosting public events, sponsoring events (including PSA Dubai World Series Finals in squash), and various donations and contributions to a diverse range of organizations including but not limited to: -RAK Animal Welfare Centre. -Can Collection Day, collecting 154kg of waste cans surrounding the campus. -7th Annual RAK Terry Fox Run for Cancer Research. -Sanitary ware products donation to SEWA to renovate houses for underprivileged people. -Earth Hour to raise awareness of climate change and reduce energy consumption. -Tree planting in vicinity of plants to commemorate Earth Day 2016.

RESEARCH CHALLENGE 2018
AMERICAN UNIVERSITY IN DUBAI
This report is published for educational purposes only by students competing in The CFA Institute Research Challenge.
Section A Financials
Appendix A1 Income Statement & Balance Sheet
AED mn 2012 2013 2014 2015 2016 2017e 2018e 2019e 2020e 2021e
Revenue 3168 3515 3125 3079 2793 2769 2981 3204 3323 3450
Revenue Growth
11% -11% -1.5% -9% -0.9% 7.7% 7.5% 3.7% 3.8%
COGS (2311) (2552) (2315) (2211) (1921) (1936) (2096) (2242) (2318) (2400)
Gross Profit 857 963 809 868 783 833 885 962 1005 1050
Gross Margin 27% 27% 26% 28% 28% 30% 30% 30% 30% 30%
Operating Expense (719) (682) (570) (553) (629) (602) (649) (696) (720) (746)
Other income 59 68 69 60 52 60 50 50 50 50
EBIT 197 349 319 375 132 291 286 316 335 354
EBIT Margin 6.2% 10% 10% 12% 4.7% 10% 10% 10% 10% 10%
EBITDA 337 502 584 594 486 453 473 505 522 540
EBITDA Margin 11% 14% 19% 19% 17% 16% 16% 16% 16% 16%
Finance expense (155) (119) (87) (85) (84) (73) (76) (80) (74) (77)
Finance income 24 31 17 6 4 4 9 10 8 12
Net Income before Tax 246 292 350 334 47 295 233 261 284 304
Tax expense -22 -19 -23 -22 -16 -20 -16 -17 -19 -20
Net Income 223 282 279 281 (5) 242 192 214 233 250
Net Income Growth
27% -1% 1% -102% -5019% -21% 12% 9% 7%
AED mn 2012 2013 2014 2015 2016 2017e 2018e 2019e 2020e 2021e
Cash 495 500 448 363 424 865 994 813 1239 1432
Accounts Receivable 1099 1111 1170 1207 1133 1108 1192 1282 1246 1294
Inventory 1035 1116 1139 1141 1179 968 990 1066 1041 1080
Others 782 1069 653 539 320 379 407 436 352 364
Total Current Assets 3410 3795 3411 3251 3057 3320 3583 3596 3878 4170
PPE 1039 1169 1181 1066 1160 1130 1145 1157 1144 1139
Investment in equity accounted investees
346 214 151 128 112 50 50 50 50 50
Others 517 501 1257 1537 1427 1445 1446 1448 1445 1442
Total Non-current Assets 1902 1884 2589 2731 2699 2625 2641 2655 2639 2631
Total Assets 5312 5679 6000 5982 5756 5946 6224 6251 6517 6801
Accounts Payable 814 980 807 836 715 648 698 750 778 807
Short Term Loans 1531 909 1099 323 776 874 915 848 883 920
Others 196 150 201 489 187 193 198 202 204 207
Total Current Liabilities 2542 2040 2107 1648 1678 1715 1810 1799 1865 1934
Long Term Loans 437 915 770 1310 1308 1311 1372 1272 1324 1380
Others 75 85 88 87 90 109 130 153 176 200
Total Non-Current Liabilities 512 1000 858 1396 1398 1420 1502 1424 1500 1580
Total Liabilities 3054 3040 2965 3044 3076 3136 3312 3224 3365 3515
Total Equity 2258 2639 3035 2937 2680 2810 2913 3028 3153 3286
Total Equity & Liabilities 5312 5679 6000 5982 5756 5946 6224 6251 6517 6801

RESEARCH CHALLENGE 2018
AMERICAN UNIVERSITY IN DUBAI
This report is published for educational purposes only by students competing in The CFA Institute Research Challenge.
Appendix A2 Financial Ratios
AED mn 2012 2013 2014 2015 2016 2017e 2018e 2019e 2020e 2021e
Sales Growth 0% 11% -11% -1% -9% -1% 8% 7% 4% 4%
Gross Margin 27% 27% 26% 28% 28% 30% 30% 30% 30% 30%
Operating expenses Ratio 23% 19% 18% 18% 23% 22% 22% 22% 22% 22%
EBIT margin 6.2% 9.9% 10.2% 12.2% 4.7% 10.5% 9.6% 9.9% 10.1% 10.3%
EBITDA Margin 11% 14% 19% 19% 17% 16% 16% 16% 16% 16%
NI Growth 0% 27% -1% 1% -102% -5019% -21% 12% 9% 7%
Net Margin 7% 8% 9% 9% 0% 9% 6% 7% 7% 7%
ROAA - 5% 5% 5% 0% 4% 3% 3% 4% 4%
ROAE - 12% 10% 9% 0% 9% 7% 7% 8% 8%
Account Receivables Turnover - 3.2 2.7 2.6 2.4 2.5 2.6 2.6 2.6 2.7
Days in Accounts Receivables - 115 133 141 153 148 141 141 139 134
Inventory Turnover - 2.4 2.1 1.9 1.7 1.8 2.1 2.2 2.2 2.3
Days in inventory - 154 178 188 220 202 171 167 166 161
Accounts Payable Turnover - 2.8 2.6 2.7 2.5 2.8 3.1 3.1 3.0 3.0
Days in Accounts Payable - 128 141 136 147 128 117 118 120 121
Fixed Assets Turnover 3.0 3.0 2.6 2.9 2.4 2.5 2.6 2.8 2.9 3.0
Total Assets Turnover 0.6 0.6 0.5 0.5 0.5 0.5 0.5 0.5 0.5 0.5
Current Ratio 75% 54% 62% 51% 55% 52% 51% 50% 48% 46%
Quick Ratio 63% 79% 77% 95% 93% 115% 121% 116% 133% 141%
Debt to Equity 87% 69% 62% 67% 78% 78% 79% 70% 70% 70%
Net Debt to Equity 65% 50% 47% 55% 62% 47% 44% 43% 31% 26%
Interest Coverage 79% 34% 27% 23% 64% 25% 27% 25% 22% 22%
Debt to FA 1.9 1.6 1.6 1.9 1.8 1.9 2.0 1.8 1.9 2.0
Capex to FA 0.10 0.10 0.24 0.25 0.18 0.11 0.17 0.17 0.15 0.15
FCF to Revenue 8% 16% 13% 19% 24% 19% 19% 17% 25% 18%
FCF to EBITDA 78% 110% 70% 98% 140% 118% 120% 107% 162% 116%
RESEARCH CHALLENGE 2018
AMERICAN UNIVERSITY IN DUBAI
This report is published for educational purposes only by students competing in The CFA Institute Research Challenge.
Section B Competitive Positioning
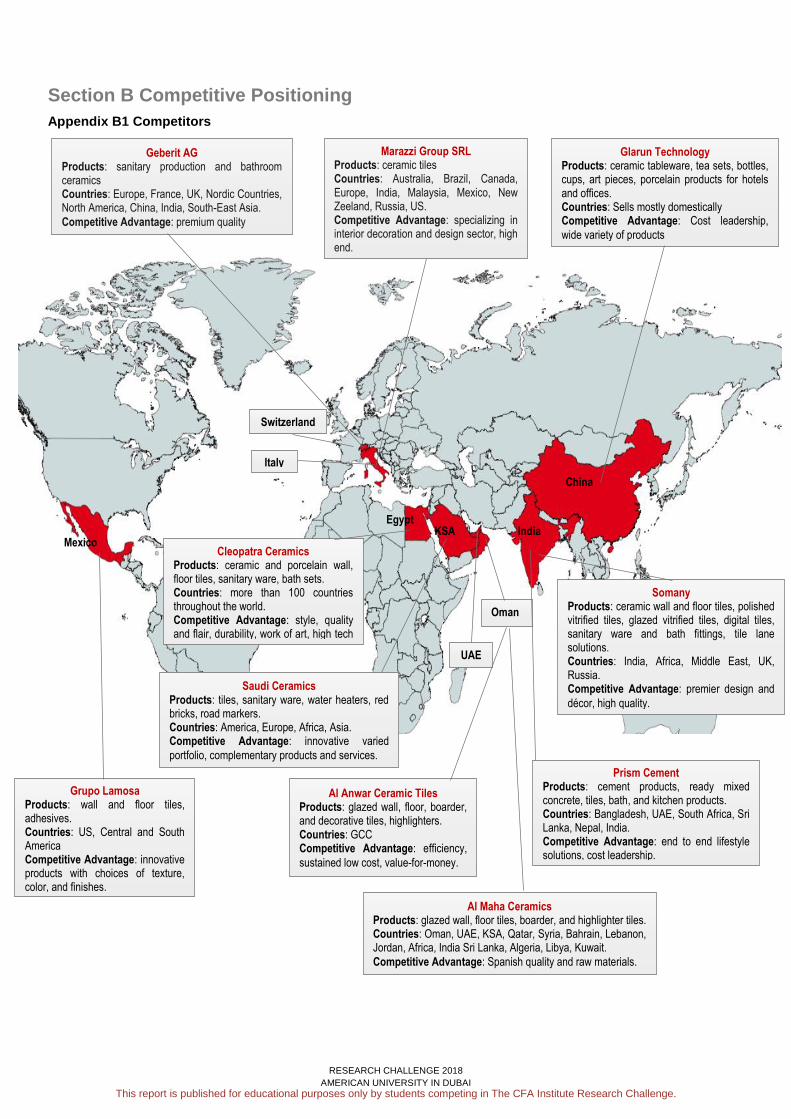
Appendix B1 Competitors
India
China
Mexico
UAE
KSA Egypt
Switzerland
Oman
Somany Products: ceramic wall and floor tiles, polished vitrified tiles, glazed vitrified tiles, digital tiles, sanitary ware and bath fittings, tile lane solutions. Countries: India, Africa, Middle East, UK, Russia. Competitive Advantage: premier design and
décor, high quality.
Glarun Technology Products: ceramic tableware, tea sets, bottles, cups, art pieces, porcelain products for hotels and offices. Countries: Sells mostly domestically Competitive Advantage: Cost leadership,
wide variety of products
Prism Cement Products: cement products, ready mixed concrete, tiles, bath, and kitchen products. Countries: Bangladesh, UAE, South Africa, Sri Lanka, Nepal, India. Competitive Advantage: end to end lifestyle solutions, cost leadership.
Al Maha Ceramics Products: glazed wall, floor tiles, boarder, and highlighter tiles. Countries: Oman, UAE, KSA, Qatar, Syria, Bahrain, Lebanon, Jordan, Africa, India Sri Lanka, Algeria, Libya, Kuwait.
Competitive Advantage: Spanish quality and raw materials.
Al Anwar Ceramic Tiles Products: glazed wall, floor, boarder, and decorative tiles, highlighters. Countries: GCC Competitive Advantage: efficiency,
sustained low cost, value-for-money.
Geberit AG Products: sanitary production and bathroom ceramics Countries: Europe, France, UK, Nordic Countries, North America, China, India, South-East Asia.
Competitive Advantage: premium quality
Marazzi Group SRL Products: ceramic tiles Countries: Australia, Brazil, Canada, Europe, India, Malaysia, Mexico, New Zeeland, Russia, US. Competitive Advantage: specializing in interior decoration and design sector, high end.
Saudi Ceramics Products: tiles, sanitary ware, water heaters, red bricks, road markers. Countries: America, Europe, Africa, Asia. Competitive Advantage: innovative varied
portfolio, complementary products and services.
Cleopatra Ceramics Products: ceramic and porcelain wall, floor tiles, sanitary ware, bath sets. Countries: more than 100 countries throughout the world. Competitive Advantage: style, quality and flair, durability, work of art, high tech laser technology.
Grupo Lamosa Products: wall and floor tiles, adhesives. Countries: US, Central and South America Competitive Advantage: innovative products with choices of texture, color, and finishes.
Italy

RESEARCH CHALLENGE 2018
AMERICAN UNIVERSITY IN DUBAI
This report is published for educational purposes only by students competing in The CFA Institute Research Challenge.
RAK Ceramics and Industry Comparison
ROE. Competitors Comparison
ROA. Competitors Comparison
Profit Margin. Competitors Comparison
11.56%
6.05%
7.81%
2.85%
-0.08% -0.18%
ROE ROA Profit Margin
Industry RAK Ceramics
2.85%
-0.61%
16.28%
20.40%
2.09%
36.41%
13.39%
-2.39%
16.60%
10.57%
-0.08% -0.12%
3.49%
8.58%
4.02%
15.52%
10.75%
0.77%
16.53%
1.03%-0.18% -0.12%
4.94%5.38%
8.43%
19.76%18.28%
1.88%
17.87%
1.88%
APPENDIX B2 Ratio Comparison

RESEARCH CHALLENGE 2018
AMERICAN UNIVERSITY IN DUBAI
This report is published for educational purposes only by students competing in The CFA Institute Research Challenge.
Brand. The company serves customers in more than 150
countries around the Globe which ensures recognition worldwide. The company is called the largest world ceramic brand, which constitutes high level of brand awareness19. Goodwill of the company has grown during the last two years which comes from the acquisition of businesses that just added up their brand equities to RAK Ceramics. Moreover, the standards of quality and awareness of the brand enhanced the strong positive impressiveness of customers regarding the products which constitute the positive brand image. CSR projects produces have produced positive company image.
Quality and Innovation. The quality of all the products is of
high standards proven by certifications recognized internationally such as ISO 9001 for quality, design, development, production, and supply of ceramics tiles and sanitary wares. In addition, the company is complying with ISO 14001:2015 - Environmental Management System. Moreover, the laboratory where the products are being tested has certification ISO/IEC 17025. Being a holder of major quality certifications, RAK Ceramics has established a strong competitive position in its core products: tiles, sanitary wares, and table wares. Also, RAK Ceramics won an award for the Most Innovative company recently which indicated the company’s innovative approach in production process and the way of doing business.
Adopting Trends and Changes. Being a large company
that exports to 150 countries and having four big manufacturing facilities, RAK Ceramics is slow to change. CFO of the company mentions that it takes time to adopt new trends, designs, or changes in the production (Conference Call). Adopting the changes in the production creates waste of inventory and raw materials. Since the company’s inventory days are high (217 days), the new changed products require a lot of time to reach the end user and create a waste of the products already produced and stored in the inventory.
Inefficiency in operations. In comparison to the industry,
RAK Ceramics has relatively low performance in terms of return on equity, assets, and profit margin. The ROA indication (RAKCEC: -0.08% vs. Industry: 6.05% as per 2016) shows that the company has many assets that it cannot turn into sufficient profit; thus, is not using its assets at the efficient level. As for the ROE, compared to the industry’s return 11.56%, RAKCEC’s performance was 2.85%. This indicates that the company is not effectively turning the shareholders’ equity into the company’s profit. As per the profit margin, which is extremely low compared to the competitors (-0.18% vs. 7.81%), which represents the large burden of costs to the company.
Global Network and Cost Efficiency. Strategic
production locations of plants in Bangladesh, India, Iran, and UAE creates opportunity for the cost efficiency and establishing effective logistics between the factories, distribution centers, and retailers. Due to India’s high economic growth and rapid construction development, RAKCEC acquired 51% equity in the ceramic tile manufacturing facility in Morbi, Gujarat, and the company has plans for further expansion in India. Efficiency of operations costs in those courtiers, friendly regulations, and convenient access to various markets will move the company towards the cost leadership advantage.
Construction Industry Growth. According to the
macroeconomic analysis (subsection: Macroeconomics), the infrastructure (construction) and real estate sectors’ growths will cause increase in demand for ceramic products in most regions the company operates.
Concentration of production plants. The production
of RAKCEC that has sales in over 150 countries, is concentrated to the four plants in India, Bangladesh, Iran, and UAE. Thus, the company’s supply depends on each of them largely. Therefore, the risk of losing any of them due to political, economic, or legal reasons, would have drastic negative impact on the whole production and sales.
Economic and political threats. Operating in the big
number of countries creates dependency on currency fluctuations, which can be a threat for the decreased revenue or high costs induced on the company. Additionally, international relations and political situations in the operating countries has direct effect on sales and logistics. The change in countries’ legal systems can be unfavorable for the company’s business.
OPPORTUNITIES THREATS
TS
WEAKNESSES
WEAKNESSES STRENGTHS
Appendix B3 SWOT ANALYSIS
OPPORTUNITIES THREATS THREATS OPPORTUNITIES

RESEARCH CHALLENGE 2018
AMERICAN UNIVERSITY IN DUBAI
This report is published for educational purposes only by students competing in The CFA Institute Research Challenge.
Appendix B4
Porter’s 5 Forces
Threat of New Entrants - Low. As per the ceramic industry, we do not consider the threat of new entry as significant because of the barrier to enter into this large industry. Since RAK Ceramics is one of the biggest ceramic products manufacturers, it competes with the other largest ceramic manufacturers in the world. The new entrants may face the barriers such as economies of scale because reaching the production level of the top players could take time; thus, the cost per unit of production will be expensive for the new entrant. At the entry phase, the new comer would expect relatively low demand, and would adjust the production to it. According to the law of economies of scale, the production cost per unit of the entrant will be higher; therefore, the new comer will not be able to set the price lower than competitors’, which will limit the chances to compete successfully. Ceramics industry deals with long term contracts with construction companies a lot, which means that the switching costs to the new comer would be high due to established conditions in already existing contract. To enter the ceramics industry, the new entrant would have to have a plant, raw materials, and distribution channels at least. All these facilities will require a large capital invested in the business. Therefore, the threat of new entrants is low.
Threat of Substitution – Moderate. Ceramic products are subject to substitution, where the customers are exposed to big variety of options. Plastic products have lower production costs, subsequently, the price of the plastic tiles, for example, would be much lower than the one of ceramics. Additionally, the world demand for plastic is expected to reach 34 billion metric tons by 2050 from 8.3 billion as of 201725. Other than the plastic, there are many alternatives that are suitable for tiles, table wares, or kitchen wares. Aluminum and steel kitchen wares have large variety of products that are substitutes to the ceramic ones. The alternative for the ceramic tiles may be wooden, marble, or plastic tiles that would satisfy the customer needs with the different texture or cheaper price. However, the threat of substitution to the sanitary wares are very low; thus, we consider the overall threat of substitution moderate.
Bargaining Power of Suppliers – High. Since the number of ceramic raw materials producers are decreasing, ceramic manufacturers become more dependent on the existing suppliers27. The suppliers of raw materials are mostly natural resources mining companies, and the number of such companies is limited. This gives the suppliers the power to set the prices that ceramic manufacturers will have to follow due to the limited number of options. Therefore, we consider the bargaining power of suppliers high.
Bargaining Power of Customers – Moderate. The products in ceramic industry are being sold to retail customers and to the big industry players (construction companies and governments). Since a big portion of the industry customers are large companies that order units in vast amounts, it brings the bargaining power of customers up. However, the switching cost in ceramic industry would be high for such large companies (customers) due to the long term contracts, which sets the overall bargaining power of customers as moderate.
Competitive Rivalry – Moderate. Each company in the ceramic industry has competitive advantage over its rivals. Some companies have cheaper price, some would offer luxurious design, and others would focus on the high quality and durability of the product. Additionally, some ceramic manufacturers have diversified portfolio of products and materials that may create customer loyalty on the bigger scale of variety of products. In spite of the unique competitive advantages of each ceramic business, the companies do not have aggressive rivalry wars through marketing or other channels within the industry. Such moderate industry competition puts the rivalry on the average level.

RESEARCH CHALLENGE 2018
AMERICAN UNIVERSITY IN DUBAI
This report is published for educational purposes only by students competing in The CFA Institute Research Challenge.
Appendix B5 Competitor Information
India Somany Ceramics. Somany is one of the largest ceramic products manufacturing and selling company that focuses on the high quality materials. The company’s products vary from tiles to sanitary wares including the laying solutions. Somany Ceramics is selling internationally, which puts it in the competition with the large companies on the worldwide ceramic market. The company has won awards as Asia’s Most Promising Brand in 2015, and has various quality certifications which proves the focus of manufacturing high quality products. Prism Cement Limited is a conglomerate that has three divisions, one of which is H&R Johnson that produces tiles, sanitary ware, bath fittings, kitchens, and engineered marble and quartz. The company’s target locations are Bangladesh, Nepal, Sri Lanka, South Africa, and UAE. Moreover, HRJ strategically built multiple locations all over India to meet customer needs at the shortest time. Thus, the company is saving costs on the transportation within India and is making its products affordable compared to its competitors. Somany is a large competitor of RAK Ceramics because both of the companies operate internationally, sharing most of the big regions. Prism Cement also shares markets with RAK Ceramics; however, its multiple locations in India gives it a competitive advantage due to ease of access to shops and products of Prism. Additionally, because RAK Ceramics has plants in India, and the country has big potential in terms of economy and demand of ceramics, these two competitors should be strongly considered.
Oman Al Maha Ceramics is one of the largest ceramic products, specifically tiles manufacturers in Oman. The company uses raw materials particularly from Europe and builds its products in a “fully automated Italian plant” with the use of Laser Guided Vehicles. The company is selling its products in the Middle East, Africa, and South Asia, which makes the competition in the industry international. Al Anwar Ceramic Tiles Company SAOG is Oman’s another leading ceramic tiles manufacturer, which operates mostly in the GCC countries. It makes the industry in the region more competitive by offering its customers the best value for money. While Al Maha focuses on the high-end customers, which overlaps with one of the target segments of RAK Ceramics, Al Anwar focuses on mass segment operating in GCC, which is one of the main markets of RAK Ceramics.
Saudi Arabia Saudi Ceramics is one of the largest competitors of RAK Ceramics located in Saudi Arabia. Not only it manufactures the ceramic products such as tiles and sanitary ware, but also water heaters, red bricks, and ceramic road markers. Such varied portfolio and company’s willingness to provide its customers with the complimentary products and services gives it a competitive advantage not only in the Middle East region, but also in the whole world due to Saudi Ceramics’ operations in America, Europe, Africa, and Asia. Saudi Ceramics is one of the major competitors that shares the most major markets and competes in producing tiles and sanitary wares with RAKCAEC.
Egypt Ceramica Cleopatra Group is one of the largest ceramics manufacturer in Egypt that export its products to over 100 countries in the world. The company is known for its durability, high quality and flair, where every product is treated as a work of art, and the latest laser technology is used in the factories. Due to the shared target markets with RAKCEC, Cleopatra is considered a competitor with the production of tiles, sanitary wares, and other products.
Mexico Grupo Lamosa is RAK Ceramics’ Mexican competitor that has multiple brands with diversified portfolio of ceramic products varying from the affordable units to the luxurious high-end products. The company’s distribution network is spread throughout the Central and South America, specifically in Chile, Colombia, and Argentina. Grupo Lamosa and RAK Ceramics both operate in Central America, and even though it is not the major market of RAK Ceramics, the objective of RAKCEC is to be the top ceramics brand all over the world.
Italy Marazzi Group is a leader in Italian ceramic tile production. The company is a part of Mohawk Industries, Inc., a multinational company that focuses on flooring manufacturing. Marazzi is presented in more than 140 countries and has sales all over the world. The company focuses on ceramic interior design decoration sector offering its customers high quality premium ceramic tiles. Being one of the top ceramic brands of Europe, Marazzi is a competitor for RAK Ceramics due to the shared markets such as India and Europe. Also, its focus on design and high-end customers puts it in competition with some of the RAK Ceramics’ targets.
Switzerland Geberit AG is a Swiss company with diversified portfolio of sanitary products and systems that includes sanitary ceramics, and also installation systems, faucets, waste fittings, pipe systems and others. Geberit is a global company operating in multiple locations all over the world offering its customers large variety premium quality products. It is one of the oldest company (since 1874) among its competitors that gives it an advantage of having a strong position in the market and established reputation of high quality products. RAK Ceramics competes with Geberit in Indian and European markets in sanitary ware products.

RESEARCH CHALLENGE 2018
AMERICAN UNIVERSITY IN DUBAI
This report is published for educational purposes only by students competing in The CFA Institute Research Challenge.
Appendix C Governance
Appendix C1 Management & Subsidiaries
Name Position
Abdallah Massaad Chief Executive Officer
Pramod Kumar Chand CFO & Interim Head of Investor Relations
Sarat Chandak Chief Executive Officer of India
Imtiaz Hussain Chief Executive Officer of Rak Ceramics Bangladesh
Stefan Schmied President of Tiles & Sanitaryware
Subsidiaries of RAK Ceramics PJSC Percent
Ownership Location Principle activities
RAK Ceramics (Bangladesh) Limited 71.57% Bangladesh Manufacturers of ceramic tiles and sanitary ware
RAK (Gao Yao) Ceramics Co. Limited 100% China Manufacturers of ceramic tiles
RAK Ceramics PJSC Limited 100% Iran Manufacturers of ceramic tiles
RAK Ceramics India Private Limited 100% India Manufacturers of ceramic tiles and sanitary ware
Elegance Ceramics LLC 100% UAE Manufacturers of ceramic tiles
Prestige Tiles Ply Limited 100% Australia Trading in ceramic tiles
RAK Bathware Pty Limited 100% Australia Trading in sanitary ware
Acacia Hotels LLC 100% UAE Lease of investment property
RAK Ceramics Holding LLC 100% UAE Investment company
Al Jazeerah Utility LLC 100% UAE Provision of utility services
RAK Ceramics (Al Ain) and RAK Ceramics (Abu Dhabi)
100% UAE Trading in ceramic tiles and sanitary ware
Ceramin FZ LLC 100% UAE Manufacturing, import & export of minerals
Al Hamra Construction Company LLC 100% UAE Construction company
RAK Porcelain LLC 50% UAE Manufacturing of porcelain tableware
RAK Ceramics Company LLC 100% Saudi Arabia Trading in ceramic tiles and sanitary ware
RAK Ceramics UK Limited 100% UK Trading in ceramic tiles and sanitary ware
RAK Ceramics Gmbh 100% Germany Trading in ceramic tiles and sanitary ware
RESEARCH CHALLENGE 2018
AMERICAN UNIVERSITY IN DUBAI
This report is published for educational purposes only by students competing in The CFA Institute Research Challenge.
Appendix D Valuation
Appendix D1 Relative Valuation
Company Name TEV/Total Revenues
LTM - Latest TEV/EBITDA LTM -
Latest TEV/EBIT LTM - Latest
P/Diluted EPS Before Extra LTM - Latest
Geberit AG (SWX:GEBN) 5.8x 22.4x 28x 32x
The Siam Cement Public Company Limited (SET:SCC)
1.8x 8.3x 10.9x 10.9x
Prism Cement Limited (BSE:500338)
1.8x 25.6x 55x NM
Grupo Lamosa, S.A.B. de C.V. (BMV:LAMOSA *)
1.4x 7.4x 9.2x 13x
Saudi Ceramic Company (SASE:2040)
1.9x 12x NM NM
AED TEV/Total Revenues TEV/ EBITDA TEV/ EBIT P/E
Factor 2763 495 169 0.18
Median Multiple 1.8x 12x 19.45x 13x
TEV 4973 5943 3291 -
Cash 424 424 424 424
Debt 2084 2084 2084 2084
Shares Restated 858 858 858 858
Price 3.9 5.0 1.9 2.3
Average Price 3.27
Summary Statistics TEV/Total Revenues TEV/ EBITDA TEV/ EBIT P/Diluted EPS Before
Extra
High 7.5x 35x 55x 43x
Low 1.4x 7.4x 9.2x 10x
Mean 3.4x 18x 28x 24x
Median 1.8x 12x 19x 13x

RESEARCH CHALLENGE 2018
AMERICAN UNIVERSITY IN DUBAI
This report is published for educational purposes only by students competing in The CFA Institute Research Challenge.
Appendix D2 DCF Assumptions
WEIGHTED AVERAGE COST OF CAPITAL (WACC)
Risk Free Rate 4.17%
Beta 0.75
Market Premium 6.26%
Country Premium 8.83%
Cost of Equity 17%
Cost of Debt 2.80%
Tax Rate 6.70%
WACC 12%
Risk Free Rate used is the 30 year Abu Dhabi Government Bond Yield. Market, country premiums, and beta used
were Bloomberg values. The cost of debt was acquired from company guidance. Tax rate is the sustainable average
percentage of taxes paid by the company.
Ceramic Products 2013 2014 2015 2016 2017e 2018e 2019e 2020e 2021e
Rev from UAE 522.8 575 620 628 641 667 707 714 728
Change in Revenue
10.0% 7.8% 1.4% 2.0% 4.0% 6.0% 1.0% 2.0%
Rev from Bangladesh 222 237 237 262 275 288 303 318 334
Change in Revenue
6.8% -0.4% 10.6% 5.0% 5.0% 5.0% 5.0% 5.0%
Rev from KSA 462 359 400 236 247 272 305 335 362
Change in Revenue
-22.4% 11.5% -41.0% 5.0% 10.0% 12.0% 10.0% 8.0%
Rev from India 467 466 391 291 320 368 412 425 438
Change in Revenue
-0.1% -16.0% -25.6% 10.0% 15.0% 12.0% 3.0% 3.0%
Rev from Europe 191 200 320 401 341 363 381 401 421
Change in Revenue
4.8% 59.8% 25.4% -15.0% 6.5% 5.0% 5.0% 5.0%
Other 995 935 474 437 439 443 450 456 463
Change in Revenue
-6.1% -49.3% -7.9% 0.5% 1.0% 1.5% 1.5% 1.5%
Total Revenue 2,860 2,628 2,441 2,254 2,263 2,402 2,558 2,649 2,745
Change in Revenue
-8.1% -7.1% -7.6% 0.4% 6.1% 6.5% 3.6% 3.6%
The largest operating segment of RAK Ceramics was forecasted using a geographically segmented method.

RESEARCH CHALLENGE 2018
AMERICAN UNIVERSITY IN DUBAI
This report is published for educational purposes only by students competing in The CFA Institute Research Challenge.
Appendix E Forecasting Schedules
Appendix E1
Fixed Asset Schedule
AED mn 2012 2013 2014 2015 2016 2017e 2018e 2019e 2020e 2021e
Net 1039 1169 1181 1066 1160 1130 1145 1157 1144 1139
Depreciation 133 146 195 191 182 154 179 181 179 178
Gross 1172 1315 1376 1256 1342 1284 1324 1337 1323 1317
Depreciation Rate
11% 11% 14% 15% 14% 12% 14% 14% 14% 14%
Capex 109 113 282 267 213 125 194 192 166 172
Capex/ Revenue
3% 3% 9% 9% 8% 5% 7% 6% 5% 5%
Debt Schedule
DEBT 2012 2013 2014 2015 2016 2017e 2018e 2019e 2020e 2021e
Short Term Borrowing
1531 909 1099 663 776 874 915 848 883 920
Long Term Borrowing
437 915 770 1310 1308 1311 1372 1272 1324 1380
Total Loans 1968 1824 1870 1973 2084 2185 2286 2119 2207 2300
Change in Debt 0% -7% 2% 6% 6% 5% 5% -7% 4% 4%
LT/ Total 22% 50% 41% 66% 63% 60% 60% 60% 60% 60%
ST/ Total 78% 50% 59% 34% 37% 40% 40% 40% 40% 40%
Debt/Equity 87% 69% 62% 67% 78% 78% 79% 70% 70% 70%
Investment Properties Schedules
Investment Properties 2012 2013 2014 2015 2016 2017e 2018e 2019e 2020e 2021e
Net 231 222 1114 1159 1169 1161 1152 1144 1135 1127
Depreciation 7 7 7 10 9 9 8 8 8 8
Gross 238 229 1121 1169 1178 1169 1161 1152 1144 1135
Depreciation Rate 3.0% 3.2% 0.6% 0.8% 0.8% 0.7% 0.7% 0.7% 0.7% 0.7%
Addition to Investment Properties
0.0 0.0 0.1 0.0 0.5 0.0 0.0 0.0 0.0 0.0

RESEARCH CHALLENGE 2018
AMERICAN UNIVERSITY IN DUBAI
This report is published for educational purposes only by students competing in The CFA Institute Research Challenge.
Appendix F Company Initiatives
Appendix F1
PRODUCT DIFFERENTIATION
Continue focus on new product launches in tiles and sanitary ware. Build on tableware success with new products
offering (e.g. cutlery).
BRANDING
Execute Saudi Arabia branding initiative. Continue investing in brand image in United Arab Emirates and India
SUPPLY CHAIN MANAGEMENT
Restructuring to improve operational efficiency and working capital.
COST EFFICIENCIES
Enhance energy efficiency measures (Co Generation project). Continue overhead cost control and productivity
initiatives.
Source: Company Filings
India Acquisition of one JV completed.
Evaluating the expansion of recently acquired ceramic plant.
Further acquisition of a vitrified tile plant in Morbi Gujarat.
Iran Second line of production has started and new range of products are being sampled
Develop domestic sales infrastructure.
Saudi Arabia Complete restructuring of Saudi JV’s.
Execute integration plan.
Focus on expanding client network.
UAE Continue to grow market share, focus on project channel penetration and enhance retail channels.
New Dubai showroom to be opened in Q4 2017

RESEARCH CHALLENGE 2018
AMERICAN UNIVERSITY IN DUBAI
This report is published for educational purposes only by students competing in The CFA Institute Research Challenge.
Endnotes
1. (2016, June). Global Ceramic Sanitary Ware Market 2016-2020. Retrieved 5 February 2018, from https://www.technavio.com/report/global-construction-ceramic-sanitary-ware-market
2.(2016, September 26). RAK Ceramics launches new global brand identity, Tradearabia.com. Retrieved 5 February 2018, from http://www.tradearabia.com/news/IND_314150.html
3.(2017). RAK Ceramics Announces Q3 2017 Financial Results. Wam, Retrieved 5 February 2018, from http://wam.ae/en/details/1395302644454.
4.(2017). World Production and Consumption of Ceramic Tiles. Retrieved 5 February 2018, from http://www.mec-studies.com/filealbum/655_0.pdf
5.(2018). $4.3trn to be spent on MENA construction sector to 2020, ArabianBusiness.com. Retrieved 5 February 2018
6.(2018). ACTIVE FOR A BETTER ENVIRONMENT, IrisCeramica.it. Retrieved 5 February 2018, from http://www.irisceramica.com/active
7.(2018). Big tile trends are here to stay say regional industry leaders, Design Middle East. Retrieved 5 February 2018, from http://www.designmena.com/specify/big-tile-trends-are-here-to-stay-say-regional-industry-leaders
8.(2018). Construction 2017: A positive market outlook? www2.deloitte.com. Retrieved 5 February 2018, from https://www2.deloitte.com/content/dam/Deloitte/xe/Documents/About-Deloitte/mepovdocuments/mepovissue22/construction_mepov22.pdf
9. (2018). Corporate.rakceramics.com. Retrieved 5 February 2018, from https://corporate.rakceramics.com/wp-content/uploads/2017/08/Transcript_RAK-Ceramics_27082017.pdf
10.(2018). Discover RAK Ceramic, one of the world's largest brand in the ceramic industry, RAK. Retrieved 5 February 2018, from https://www.rakceramics.com/uae/en/company/#section-room-for-imagination
11.(2018). Global Infrastructure Investment, Pwc.com. Retrieved 5 February 2018, from https://www.pwc.com/gx/en/industries/assets/pwc-giia-global-infrastructure-investment-2017-web.pdf
12.(2018). Middle East Real Estate Predictions: Dubai 2017, www2.deloitte.com. Retrieved 5 February 2018, from https://www2.deloitte.com/content/dam/Deloitte/xe/Documents/realestate/me_real-estate-predictions-2017.pdf
13.(2018). Multiple Factors Driving Demand for Worldwide Ceramic Tile Market. Retrieved 5 February 2018, from https://www.ceramicindustry.com/articles/95018-multiple-factors-driving-demand-for-worldwide-ceramic-tile-market
14.(2018). Ras Al Khaimah Ceramics Co. | RAKCEC | Company Overview, Gulfbase.com. Retrieved 5 February 2018, from https://www.gulfbase.com/profile-summary-ras-al-khaimah-ceramics-co-rakcec-398
15.(2018). Ras Al Khaimah Ceramics PSC company: Shareholders, managers and business summary | ABU DHABI SECURITIES MARKET: RAKCEC | 4-Traders, 4-traders.com. Retrieved 5 February 2018, from http://www.4-traders.com/RAS-AL-KHAIMAH-CERAMICS-P-7567591/company/
16.(2018). Reports – RAK Ceramics, Corporate.rakceramics.com. Retrieved 5 February 2018, from http://corporate.rakceramics.com/investors/reports/
17.(2018). Saudi Arabia - Economic Forecasts - 2018-2020 Outlook, Tradingeconomics.com. Retrieved 5 February 2018, from https://tradingeconomics.com/saudi-arabia/forecast
18.B. (2018). Brent Crude oil price 2014-2019 | Statistic. Statista. Retrieved 5 February 2018, from https://www.statista.com/statistics/409404/forecast-for-uk-brent-crude-oil-prices/
19.G. (2018). Global GDP 2010-2022 | Statista. Statista. Retrieved 5 February 2018, from https://www.statista.com/statistics/268750/global-gross-domestic-product-gdp/
20.Gerrity, Michael. (2015, November 30). Dubai Residential Market Continues to Soften, to Hit Bottom in Late 2016, World Property Journal. Retrieved 5 February 2018, from http://www.worldpropertyjournal.com/real-estate-news/dubai-uae/dubai-property-market-forecast-for-2016-cluttons-dubai-real-estate-bubble-house-prices-in-dubai-dubai-winter-residential-property-market-outlook-report-dubai-real-estate-news-9525.php
21.Hoel, Arne(2018). MENA Economic Monitor, World Bank. Retrieved 5 February 2018, from http://www.worldbank.org/en/region/mena/publication/mena-economic-monitor
22.I. (2018). GDP of India: growth rate until 2022 | Statista. Statista. Retrieved 5 February 2018, from https://www.statista.com/statistics/263617/gross-domestic-product-gdp-growth-rate-in-india/
23.John, I. (2017, November 23). UAE economic growth set to double. Khaleejtimes.com. Retrieved 5 February 2018, from https://www.khaleejtimes.com/business/economy/uae-economic-growth-set-to-double
24.Pallone, Tony (2017, July 21). Plastic World | Engineering360, Insights.globalspec.com. Retrieved 5 February 2018, from http://insights.globalspec.com/article/5939/plastic-world
25.Ranath, Ravind (2010, June 22). RAK Ceramics IPO, Khaleejtimes.com. Retrieved 5 February 2018, from
26.Susan Sutton (2018, January 2). Raw and Manufactured Materials: 2018 Overview. Retrieved 5 February 2018, from https://www.ceramicindustry.com/articles/96787-raw-manufactured-materials-2018-overview

RESEARCH CHALLENGE 2018
AMERICAN UNIVERSITY IN DUBAI
This report is published for educational purposes only by students competing in The CFA Institute Research Challenge.
Disclosures: Ownership and material conflicts of interest:
The author(s), or a member of their household, of this report does not hold a financial interest in the securities of this company.
The author(s), or a member of their household, of this report does not know of the existence of any conflicts of interest that might bias the content
or publication of this report.
Receipt of compensation:
Compensation of the author(s) of this report is not based on investment banking revenue.
Position as a officer or director:
The author(s), or a member of their household, does not serve as an officer, director or advisory board member of the subject company.
Market making:
The author(s) does not act as a market maker in the subject company’s securities.
Disclaimer:
The information set forth herein has been obtained or derived from sources generally available to the public and believed by the author(s) to be
reliable, but the author(s) does not make any representation or warranty, express or implied, as to its accuracy or completeness. The information is
not intended to be used as the basis of any investment decisions by any person or entity. This information does not constitute investment advice, nor
is it an offer or a solicitation of an offer to buy or sell any security. This report should not be considered to be a recommendation by any individual
affiliated with CFA Society Emirates, CFA Institute or the CFA Institute Research Challenge with regard to this company’s stock.
CFA Institute Research Challenge